Embed Size (px)
Citation preview
NASA-CR-175115
NASA Contractor Report 175115 19860016379
Fatigue Crack Layer Propagationin Silicon-Iron
Y. Birol, G. Welsch, and A. Chudnovsky
Case Western Reserve UniversityCleveland, Ohio
May 1986
JBR RV- ' .... '_ i;J'36Prepared for ,JoH t ,_
Lewis Research Center.t Under Grant NAG 3-223 ta_ca.zvRZ-S_RCHcznrzr
LIBRARY,NASA
Pu_TO r_tlL.V.IRGIN!_
I IASANationalAeronauticsandSpaceAdministration
https://ntrs.nasa.gov/search.jsp?R=19860016379 2020-04-08T02:07:40+00:00Z
P_'[CDt ..-%',+.t_--"+-/-7 "_t,l : . .-"".U _ -..-it L_-", I ,+j t ... r.. + ,_
?_, -I _-+ -i _. +_r,.tT*-_.-, +:Ii-_p-__.:v'3"_ :'" Oi: '_,h+T'H-.]L',!._ -i ? D/"..PEP- I i,.',.iP! .,"-,C'C T E TEP, F'Pf _' h,'IL[:'T.... t _+!._!.J , l.+jl =,, l';=..+'-i,.'_.+= +," +'._ :,' t'=U+" V-..."-" '; -=__ 7€ I n'._+ .i -+...-'r+;+l__M,_,i._.l!t IL.L.,' t+'_-J'+.l.-'l'igt+Jl
' +t7 :-.-i'-'_+....... " T c-o. --" _ +'--._.,+,--'tr(iTTL: _"_+_............. " i _.:o_,................... I0t7 i ;,._.,._,_! ,.,.,,. _..... PIri.._-+-:lD.......+";I iTU, ,,+ /O l Ei+-il ;; i-) "hiE! i_'Z'"' ' £" /.,+-'Ul IPJM'.'7+,ICL/".7 A.F_v,.:i, m++";+":eL, "+<; B/,...'...'LL._,t_-H.'-G., ; '.j '-...+:'-_-'u:,+:--."..".-'i',::...P'-,oo. .:,i_+._-+...... p.--.a._.,-.:+-.(inl'-' , C:+...... i_._..-+ <7,+._, <+",_,'+tl f:ITIS,. L]-,! = _'_='-'+""
./rT" . i !_,+ r!.tl+_=,+" Vii R'J l
C]fi: i. MTTEP, CTi'_TEC"t,.,'IA IL-_ • i-).'-::+t"O,_k+_i. -" BDP+B.--'" 1""_" " --i T ¢'_f:l ]-::--:-E',-%T_ PI IE" fM+"-,TED l AI F;_ ,-'-:.'-E'E+_PTI IDC" [<4EPi-I,_[:i l _'C" 1_--i._Pf:l,...jr., ;\i_ ' ,-t;C,.,:.,
!->:.-Ol i'-,CT Tt:: I-',.E'EP, DM.,'\T TiTf,.i ..'_:-$CT] TP,'hM _I I ,'-;+,..,'+2-+" I --r+t-J I Lt+ i '..*[,.l';.rTt + ,. .=r,+ --" -:- __!'_.'-JYL +" ..'+ L.'-J t----;
I,_TI,.I+Z.'. ,-" DDT_Ti EMEC+C/ E EP'TB+"_.P,.I P,.4T,.+_DP,'_-+_E+'--+i I ¢'t+"+r;C fF_L,_ _._.._ l,_l(ut_+_E+llO'TliB_/i-lJ.i'.-_i.i, .-- i_."-.+I t ILl llll . t- I1 /LL%--!t',L+_ i'i!1- i','.+'.tl-`+'l i ,_,.jr'lLS._, tl _'Ji"._-..-L_i. "+l: ! "i1='--!\tJ+lil\_'''!'Ji''L"
TEP,ISilF DD+-,D_-o,,<.,-, . . \ +21 LI t i ! L.-J
ABA: Authot: - - - _ ..+' i.-.- _ ..,--.p|- i i _ti .... L.I. J":.:,-"+D_- ff_Tt_:_-'.+ '.+1 ,---:--r,. . :+:+_++,_= , ,, ,,, t'+.+._L_.... _t[.'.+.;-_-'-_u_] ............................. p]__ST+i
.._+....... + +.<-,_.L,,r:lr_+-.c:...... -_ti..-,p+ _+<-.n....+" +........ "'it ++:,et"<+-'r+"<+_T._,,+,:,_" _,_ _.... L,--,, ..... _ .......... __._- L-'.Ji tl--l- _ i. ,._ ,.-'+L+ ! -Jt...... L-+. !-_, ........ . ........
...... , ...... l,-.., t,.+ tho: ,_,.-,++._-+_,-+++rtc.'..r+#L.,.=.::_,-,'_,;,-+<-" r,f 1i",_p_'_'*+ ......... i ........... "-'+ " _<+-"-'t"+_-3+.1t_ ! ;.._.. i ._.. i ="lri 1 I I++ -" L-"! !_ . ._l .. i+---_ '.It .!.-_--- i _l Li_tli..-I I -- "_ +
n+"0l+,_.-_'_-',_--"_ ! L+_! i !L-i '_;_: +_.,.1"_1-.--t I+_..'1 :lie t ,'-I t'-. +!i _..=i_._! il "-.. i _! .-'t. Ilil:-,,+, ,-,-,_+-'+..... h_+--....+-<--,.... it ............ +':....... ,-i....... ---, i,i,.-.+_n,- T_-._<_!_ _! !,=!.V ...................................
,--._................. +',<-'taken ' <-'+".-+"+17_ .+.-a-Pia,_+<-','_,"_............. +i0n in, a• ' _ t-- i,-, .--, -- :-i-.,-- r..4: -._'-,.4-'it-._l!. _ ." u, ---- i--- i."
,'-)i-_.. p, _,,+_+m,_!0i7 it7 a,. • +, ,-.+',_i_ J.-,.m,_:.'+-"_+,i .... _',-_+'+r.q +i--.+._+........ -.+,........ ' !'+ -'-.... I L!i: ........ Irf" J 78"P l..................... :J! !
--+......... +','ni' '++on,
I:'MT ED-!.-.l_ i LP.=
CHAPTER I
INTRODUCTION
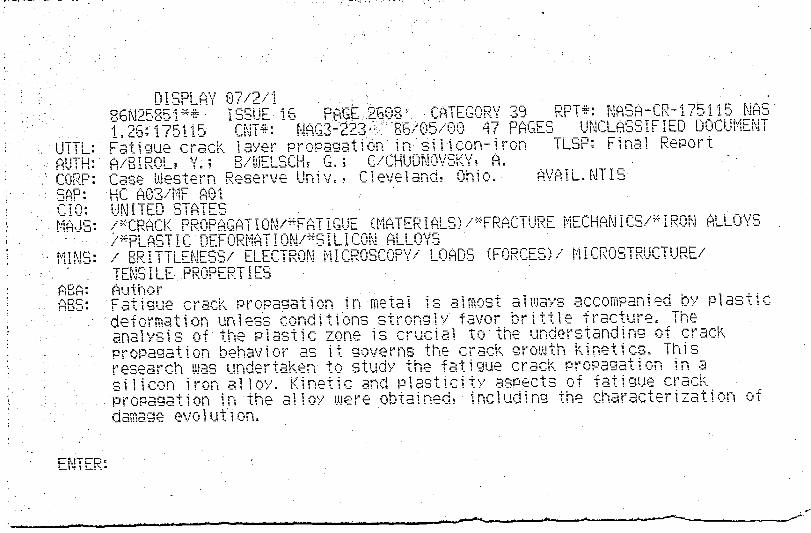
Fatigue crack propagation _n metals is almost always accompanied hy
plastic deformation unless the conditions strongly favor brittle fracture.
The extent of this plastic deformation depends on testing conditions,
specimen geometry and mlcrostructural characteristics of the metal studied.
The analysis of the plastic zone is crucial to the understanding of fatigue
crack propagation behavior as it governs the crack £rowth kinetics.
This research was undertaken to study the fatigue crack propagation in
a silicon-iron alloy. This alloy with varying Si contents (from 2.5% to 4%
Si) has been extensively used in fatigue studies (1-5) as it closely
represents the behavior of low and medium strength stels. An attempt was
made to characterize the damage evolution.
EXPERIMENTAL PROCESURE
The a]loy used in this investigation had 2.6 wt. % Si. The
as-recelved material was hot-rolled and pickled and exhibited a
heterogeneous grain structure, typical of hot rolled metals. Its tensile
properties were evaluated for both transverse and longitudinal directions.
Microstructural characteristics and tensile properties are given in Table
i.
(*)Alloy supplied by Republic Steel Corporation, now LTV Steel Corp.
I
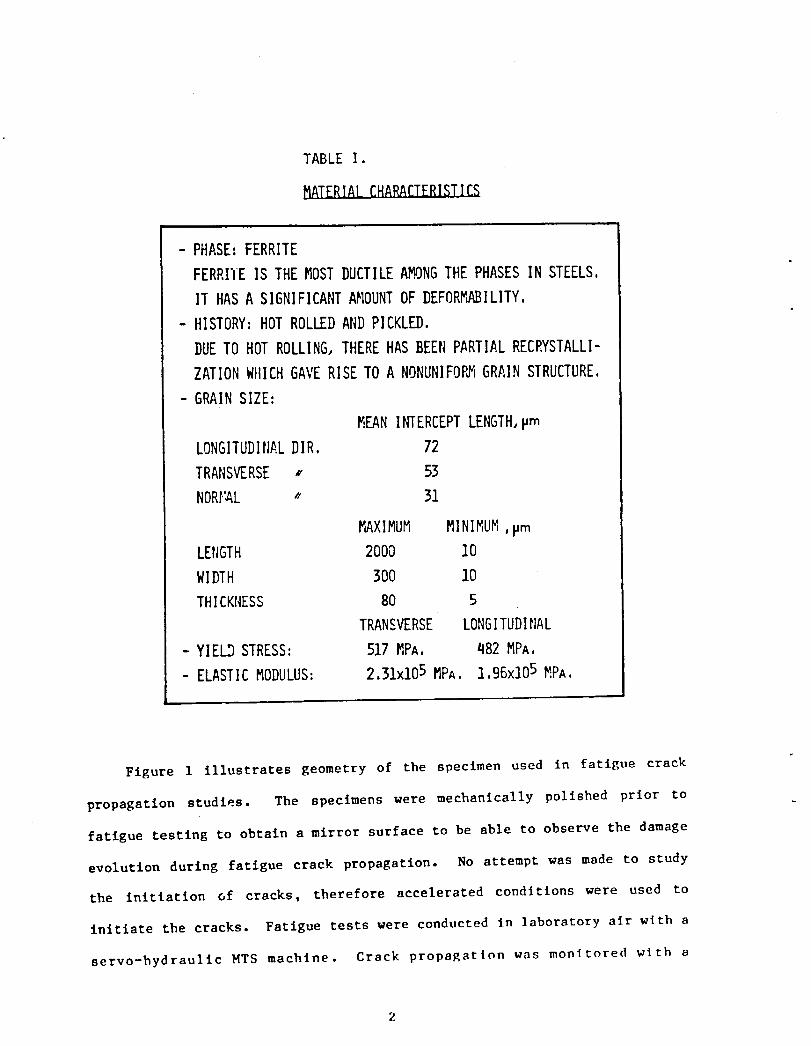
TABLEI.
I_ATERIALCHARACTERISTICS
- PHASE:FERRITE
FERRI'IEISTHEMOSTDUCTILEAMONGTHEPHASESINSTEELS.
ITHASA SIGNIFICANTA_IOUNTOFDEFORMABILITY.
- HISTORY:HOTROLLEDANDPICKLED.
DUETOHOTROLLING,THEREHASBEEr_PARTIALRECPXSTALLI-
ZATIONWIIICHGAVERISETOA NONUNIFOPJ_GRAINSTRUCTURE.
- GRAINSIZE:
MEANINTERCEPTLENGTH,pro
LONGITUDIIJALDIR. 72
TRANSVERSE_' 53
NORF'AL " 31
_XIMUM MINIMUM,pmLENGTH 2000 10
WIDTH 300 10
THICKNESS 80 5TRANSVERSELONGITUDINAL
- YIELDSTRESS: 517MPA. 482MPA.
- ELASTICMODULUS: 2.31x10⁵MPA.1.96XI05MPA.
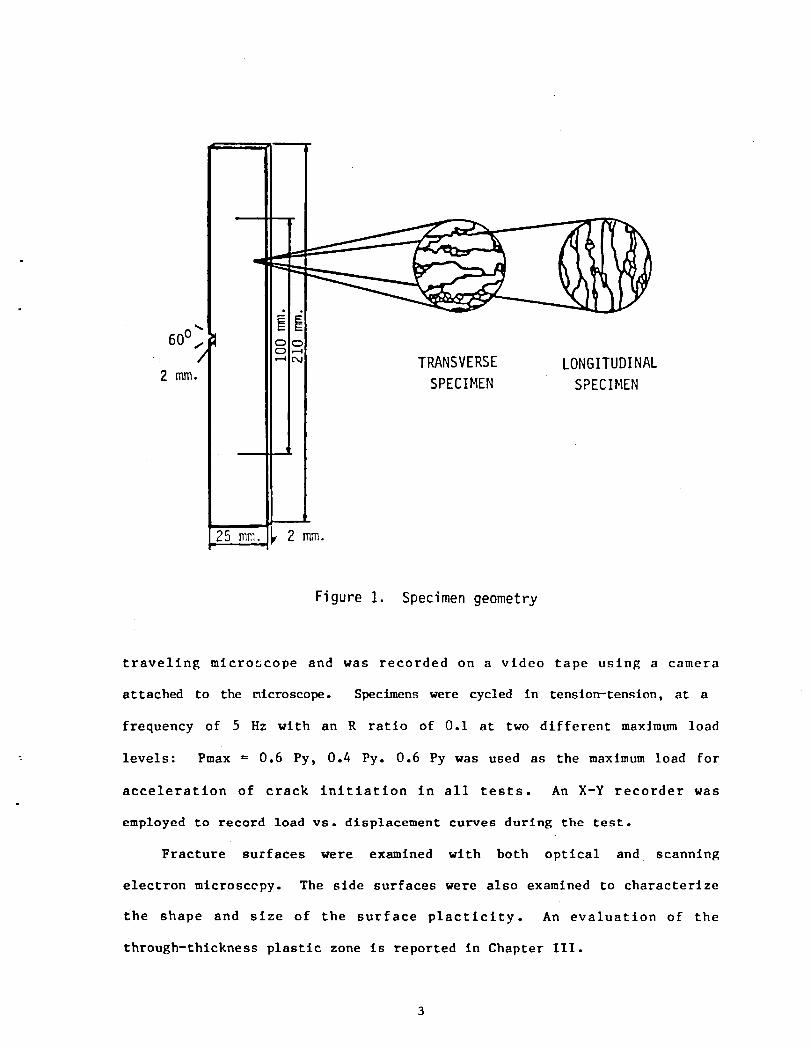
Figure 1 illustrates geometry of the specimen used in fatigue crack
propagation studies. The specimens were mechanically polished prior to
fatigue testing to obtain a mirror surface to be able to observe the damage
evolution during fatigue crack propagation. No attempt was made to study
the initiation of cracks, therefore accelerated cond_tlons were used to
initiate the cracks. Fatigue tests were conducted in laboratory air with a
servo-hydraullc MTS machine. Crack propa_atlon was monitored with a
• 91
SPECIMEN SPECIMEN
|25 mr,l. 2 ram.
Figure I. Specimen geometry
traveling mlcro_cope and was recorded on a video tape using a camera
attached to the microscope. Specimens were cycled in tenslon-tension, at a
frequency of 5 Hz with an R ratio of 0.I at two different maximum load
levels: Pmax = 0.6 Py, 0.4 Py. 0.6 Py was used as the maximum load for
acceleration of crack initiation in all tests. An X-Y recorder was
employed to record load vs. displacement curves during the test.
Fracture surfaces were examined with both optical and scanning
electron mlcrosccpy. The side surfaces were also examined to characterize
the shape and size of the surface plactlclty. An evaluation of the
through-thlckness plastic zone is reported in Chapter III.
CHAPTERII
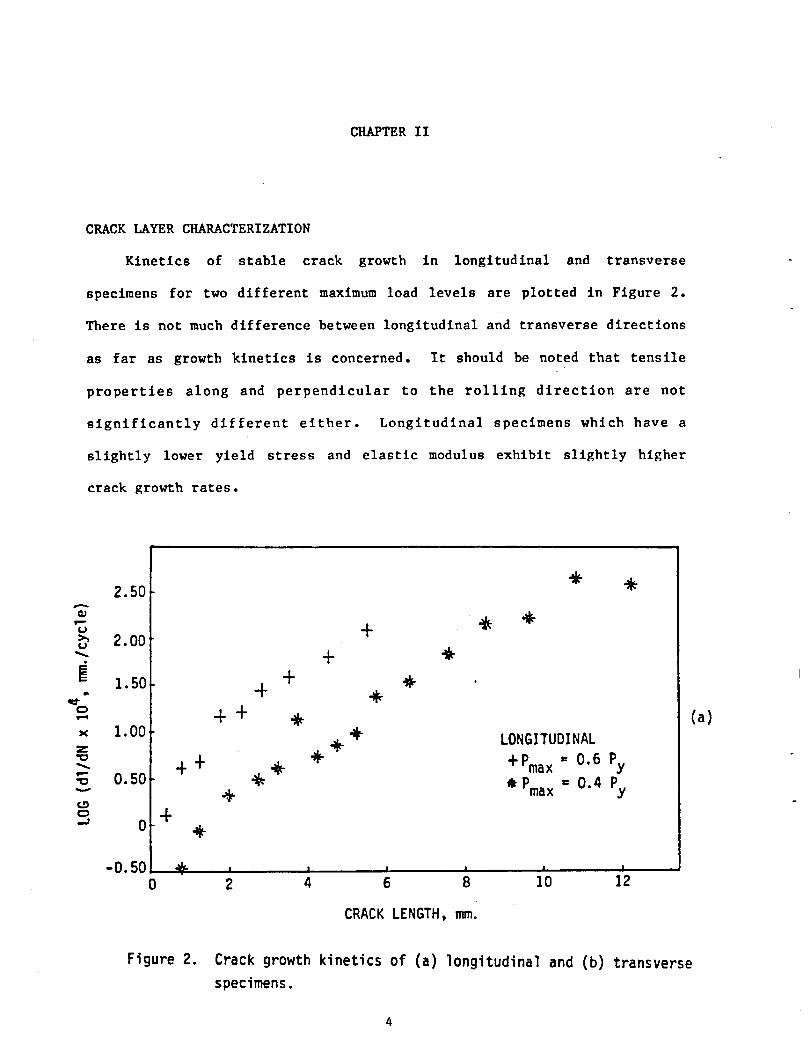
CRACK LAYER CHARACTERIZATION
Kinetics of stable crack growth in longitudinal and transverse
specimens for two different maximum load levels are plotted in Figure 2.
There is not much difference between longitudinal and transverse directions
as far as growth kinetics is concerned. It should be noted that tensile
properties along and perpendicular to the rolling direction are not
significantly different either. Longitudinal specimens which have a
slightly lower yield stress and elastic modulus exhibit slightly higher
crack growth rates.
2.50
+ _2.00
+
1.5o -F+i
CD-- + + ._ (a)x 1.00z _F 4F LONGITUDINAL
x=_ ++ _ _F +Pmax = 0.6 Py
_= 0.50 _ _ Pmax= 0.4 Py"-" ._f.D
o +-J 0 4F
-0.50 _ , , , , , ,0 2 4 6 8 10 12
CRACKLENGTH,mm.
Figure2. Crackgrowthkineticsof {a)longitudinaland (b)transversespecimens.

.
2.50 + _k
2.00
-F1.50
,," -F + . (b)
x 1.00 -l- 4k_-_k_k TRANSVERSE4 + .
-I- _ _k_k -FPmax= O.6 PyO.50 -F
_ _k _ Pmax= 0.4 Py.J 0
4-0.50 . , , , _ ,
0 2 4 6 8 10 12
CRACKLENGTH,ram.
Figure 2, cont°d.
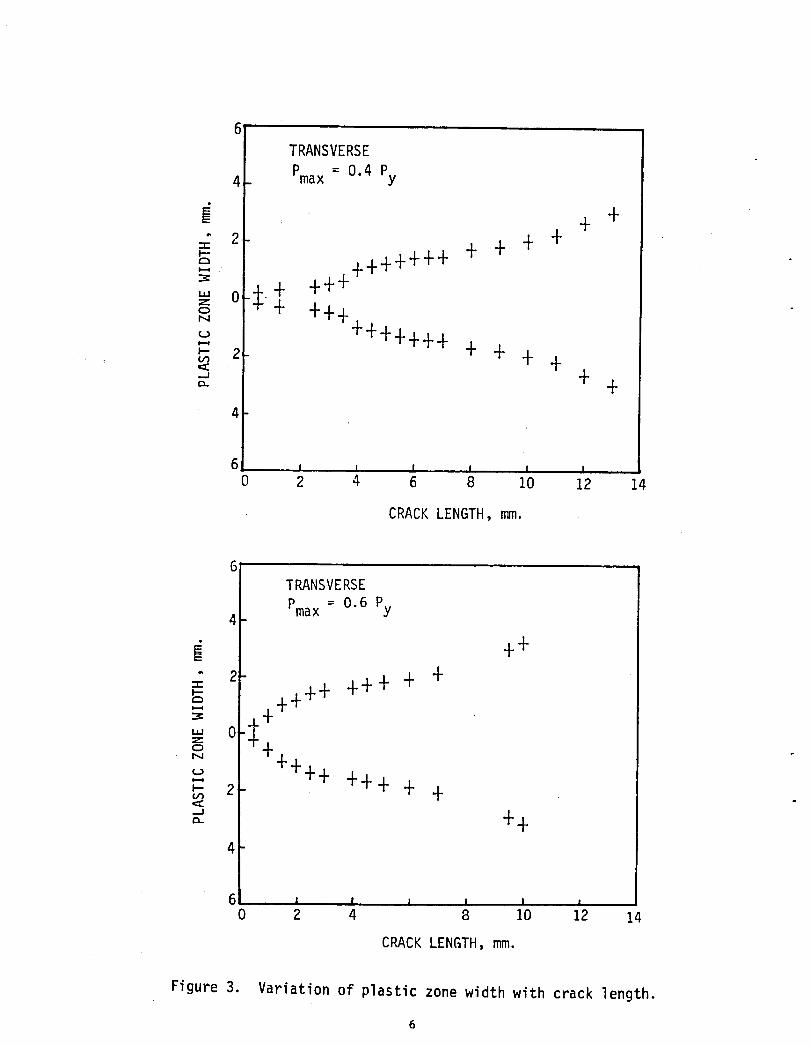
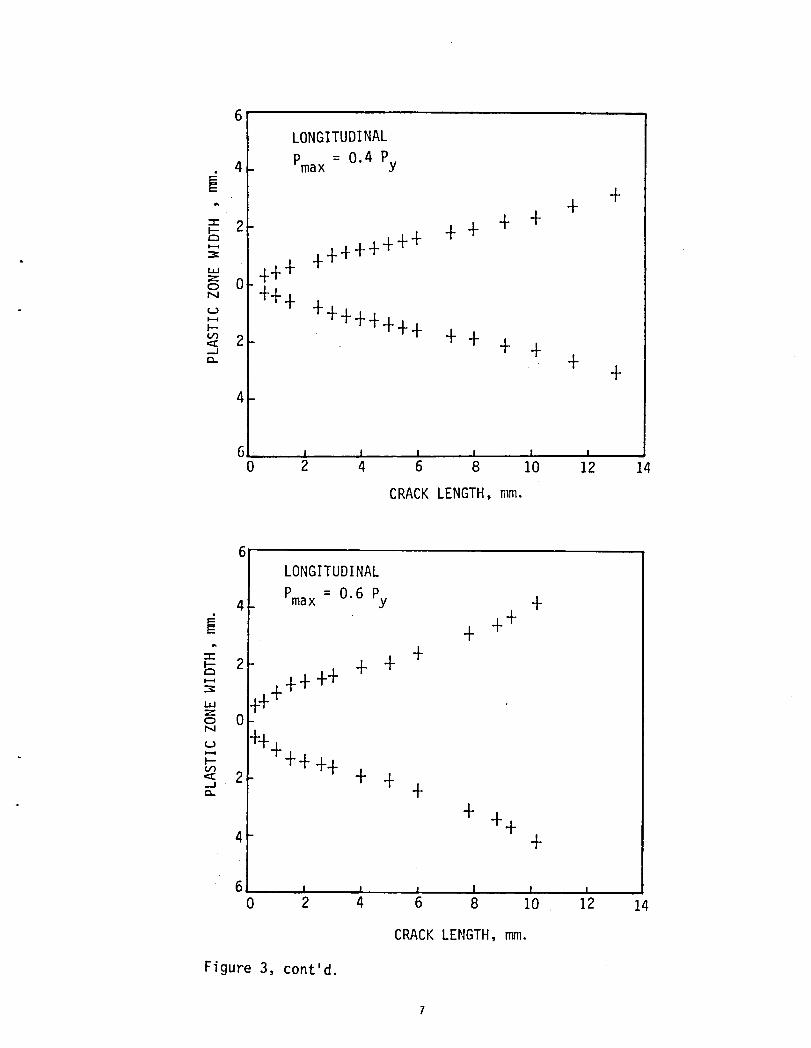
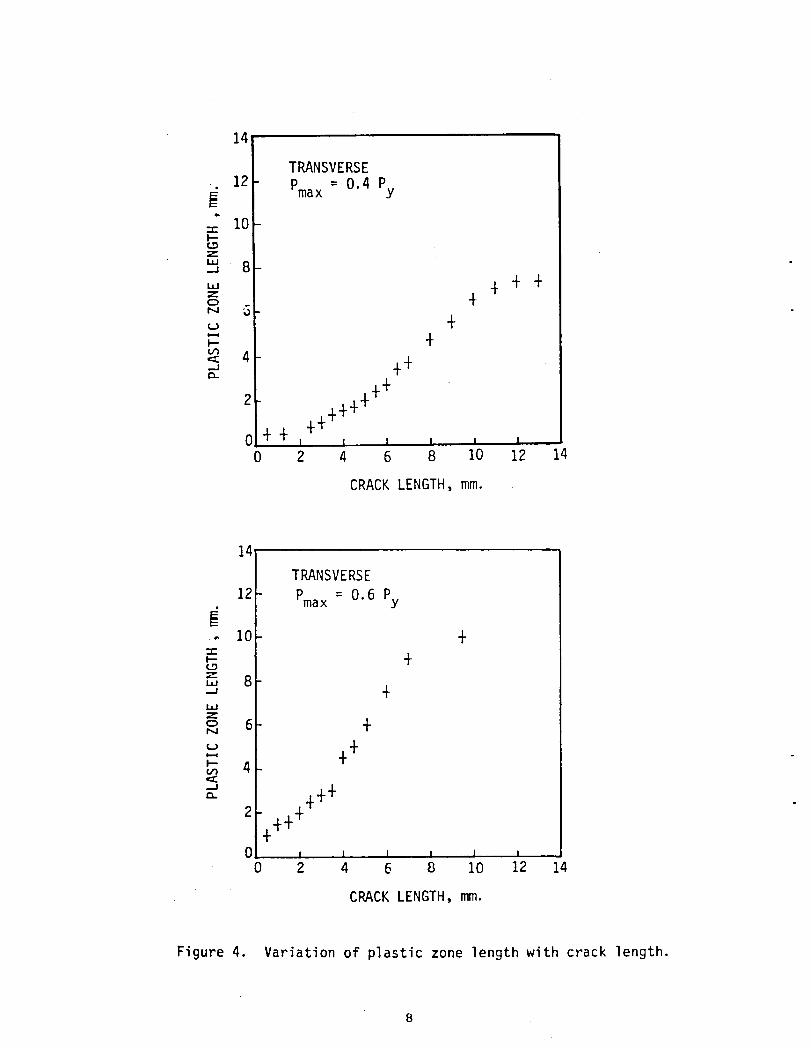
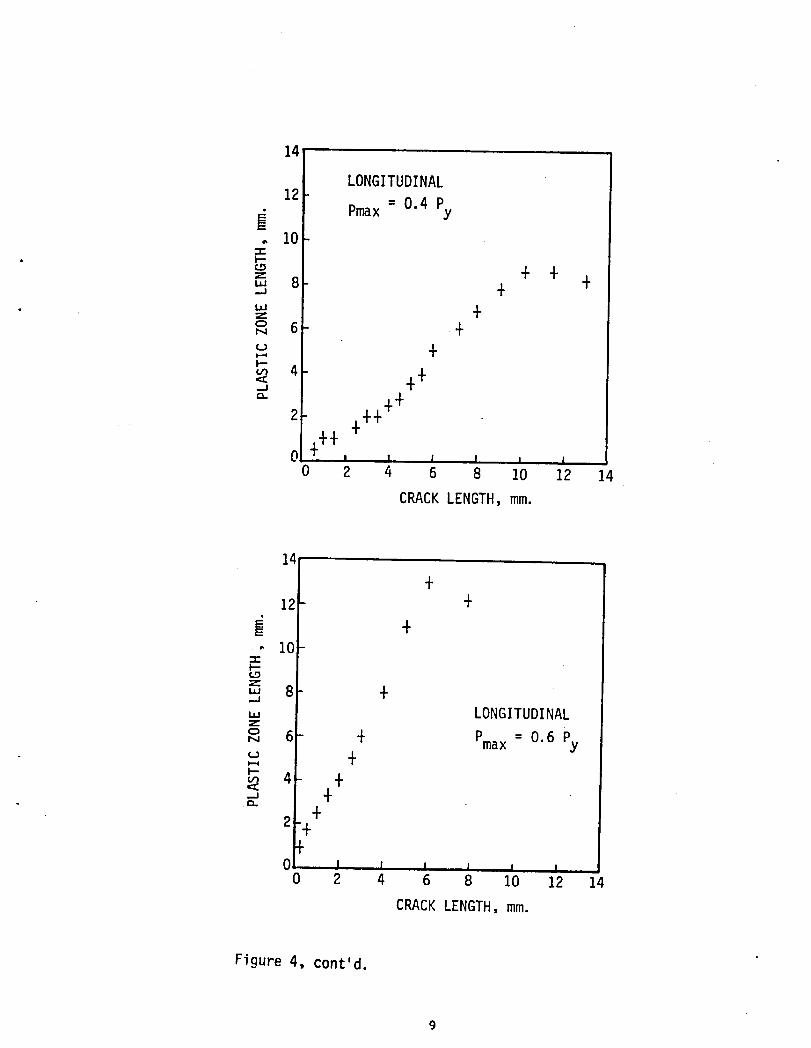
The variation of width and length of the plastic zone as a function of
crack length is illustrated in Figures 3-4. The plots clearly show the
extent of plastic deformation that accompanies crack growth. The width of
the plastic zone for longitudinal and transverse specimens is not
significantly different where as the length (this is not the length of the
zone along crack axis) shows a noticable difference.
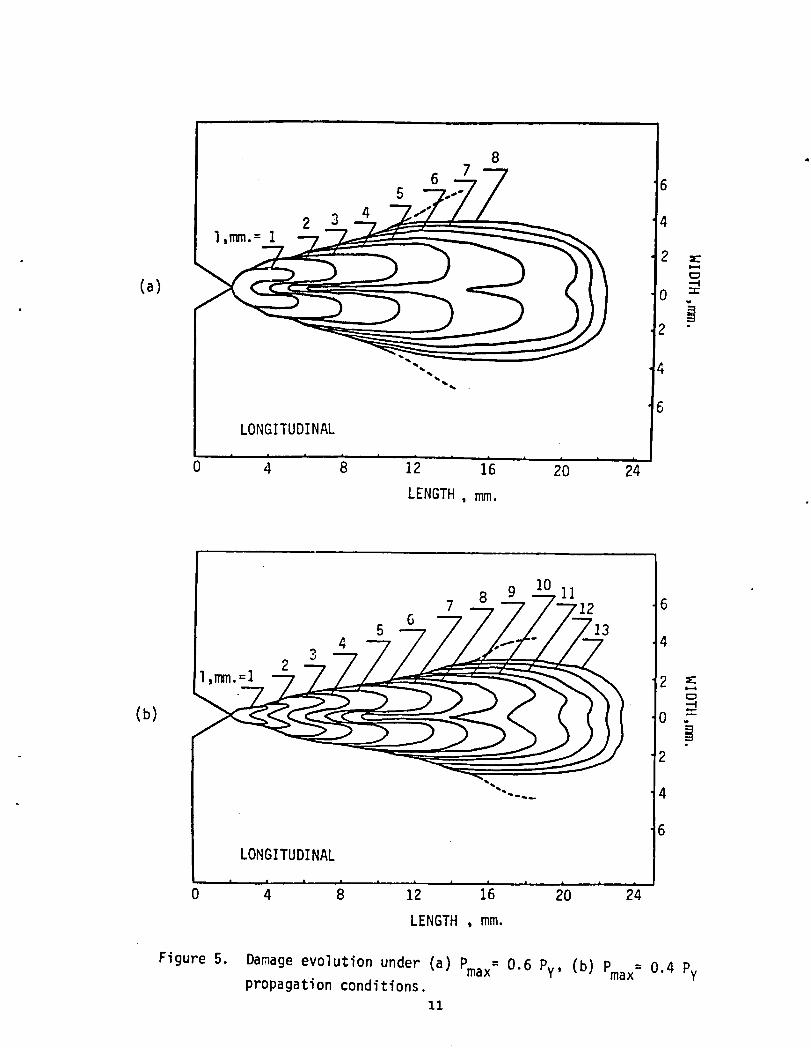
Examples of damage evolution during crack propagation are shown in
Figure 5 for two longitudinal specimens fatigued at different stress
amplitudes. As can be seen from these sketches the plastic zone expands
6
TRANSVERSE
4 Pmax = 0.4 Py
E + +.,_ 2 + 4 +4
444+++4
=" o _ + 444°N + +44
4+4++4 4_- 2 4 4 + 4: +,, +
4
6 I I I I I I
0 2 4 6 8 10 12 14
CRACKLENGTH,mm.
6TRANSVERSE
Pmax = 0.6 Py4
++= 2 ++ 4444= ++4
+
="' 0 _+o
__ 2 4+ 444 + +,_
: 4 44
6 i I i i i !
0 2 4 8 10 12 14
CRACKLENGTH,mm.
Figure 3. Variation of plastic zone width with crack length.
6
6
LONGITUDINAL
4 Pmax= 0.4 Py
"- 2 + + + +• _ +++++++
i,i= 4++ +o 0N +++_ ++++++++
+ + + +< 2...J
: + +4
6 i i i i I i
0 2 4 6 8 I0 12 14
CRACKLENGTH,mm.
6LONGITUDINAL
4 Pmax = 0.6 Py .
+++= +
2, + +_: ++++,,, .Jr+_ 0N
_ ++++_ +++<2 + +...I •: +
+ ++4 +
6 I i m I I I0 2 4 6 8 10 . 12 14
CRACKLENGTH,mm.
Figure 3, cont'd.
14
TRANSVERSE
12 Pmax: 0.4 Py
10
_ 8-
44.o 4
<_ 4 ++
2 44+44++4
0 + +l I z _ _ i0 2 4 6 8 10 12 14
CRACKLENGTH,mm.
14'
TRANSVERSE
121 Pmax= 0.6 Py#. lO +
-,1=_- +,., 8•-' +I.M
o 6 +N
,.-, +.-, +4I,,,O
,.,.--, 4++
2 ++++0 I I I I 1 I
0 2 4 6 8 10 12 14
CRACKLENGTH,r_.
Figure 4. Variationof plasticzone lengthwith crack length.
14
LONGITUDINAL12
: 0.4 PyPmax
:_ 10
= + .,,, 8 .-_ ."' +o 6 +N
,.n 4 ++--J
" 2 44++4
0 +++, I J I , ,0 2 4 6 8 10 12 14
CRACKLENGTH,mm.
14̧
+12 .
E
- 10-i-
',' 8 +,.,.I
',' LONGITUDINALz
° : 0.6 PN 6 . Pmax y
+4 +
- +
2:+++
0 I I I I I I0 2 4 6 8 10 12 14
CRACK LENGTH,mm.
Figure4, c0nt'd.
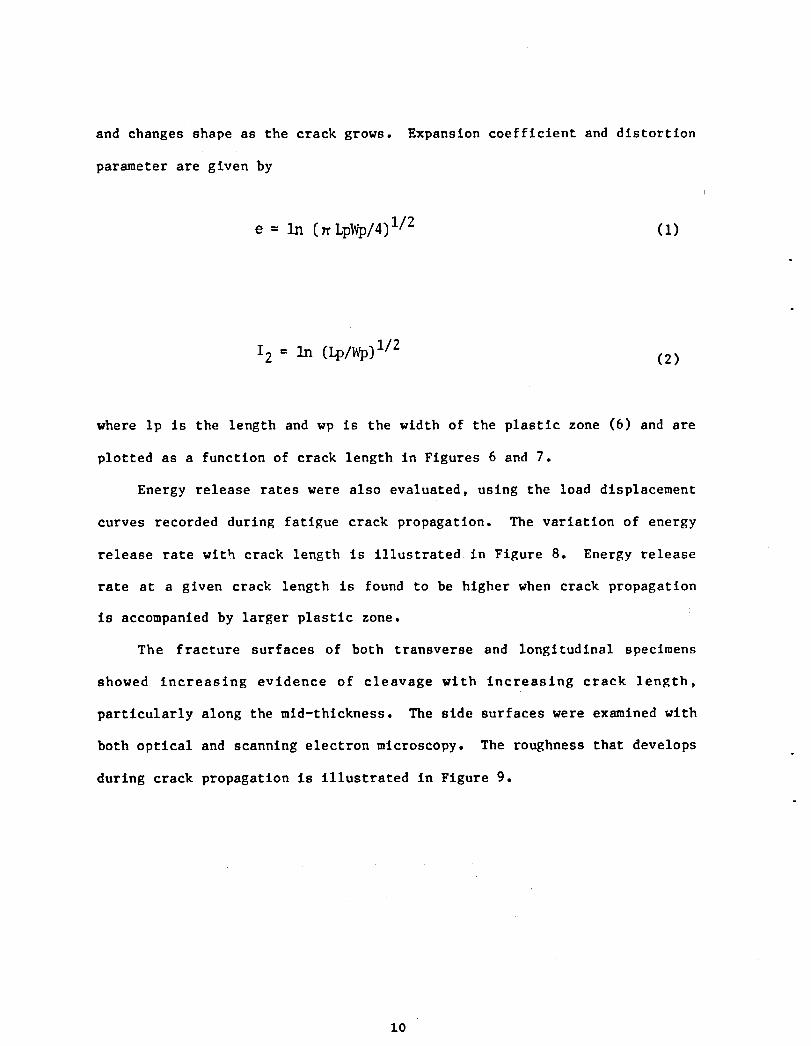
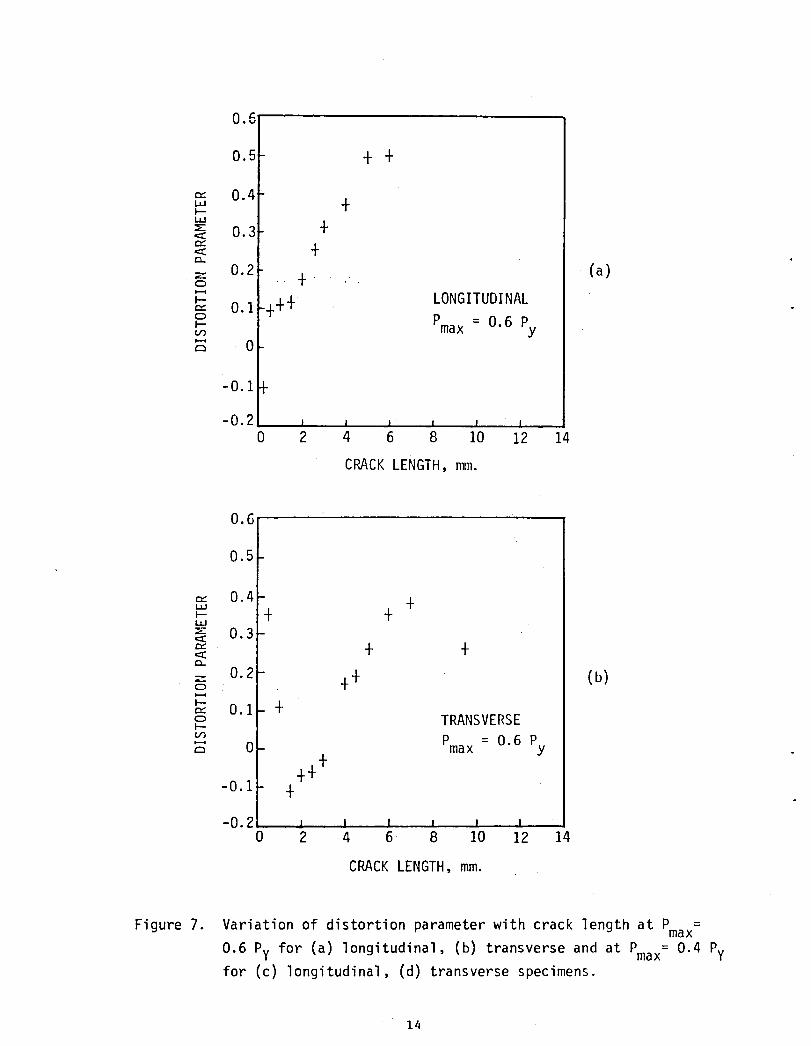
and changes shape as the crack grows. Expansion coefficient and distortion
parameter are given by
l
e = in (_LpWp/4)I/2 (I)
I2 = in CLP/_)l/z (2)
where Ip is the length and wp is the width of the plastic zone (6) and are
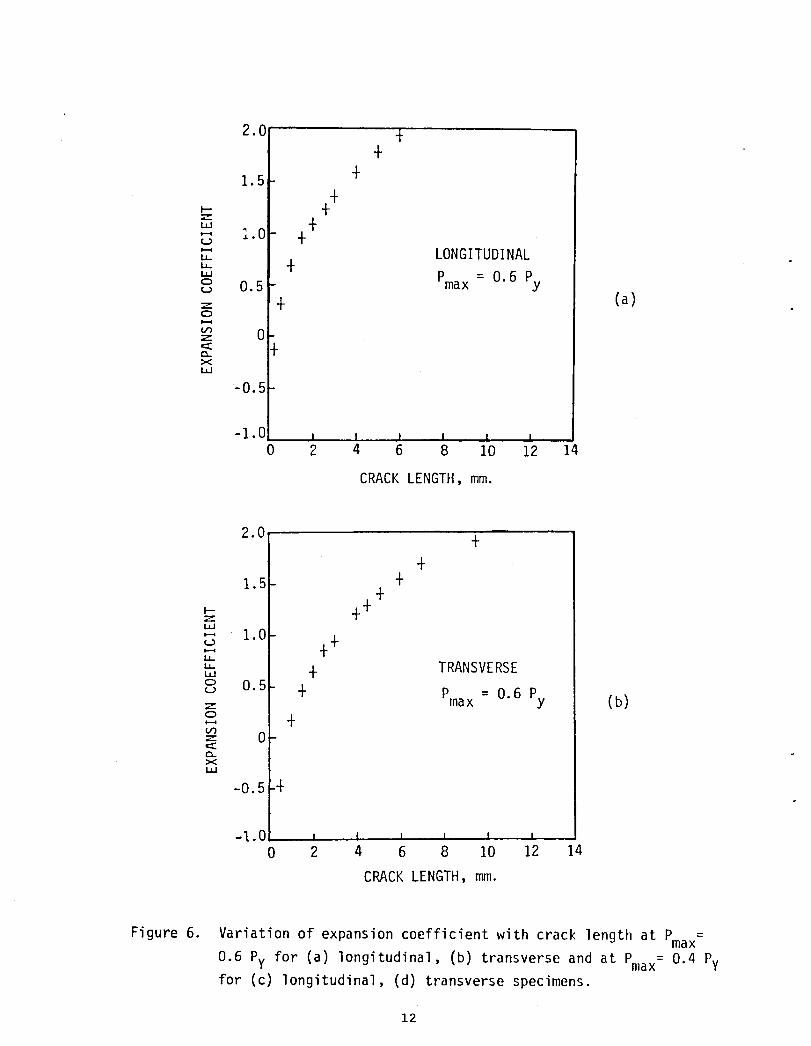
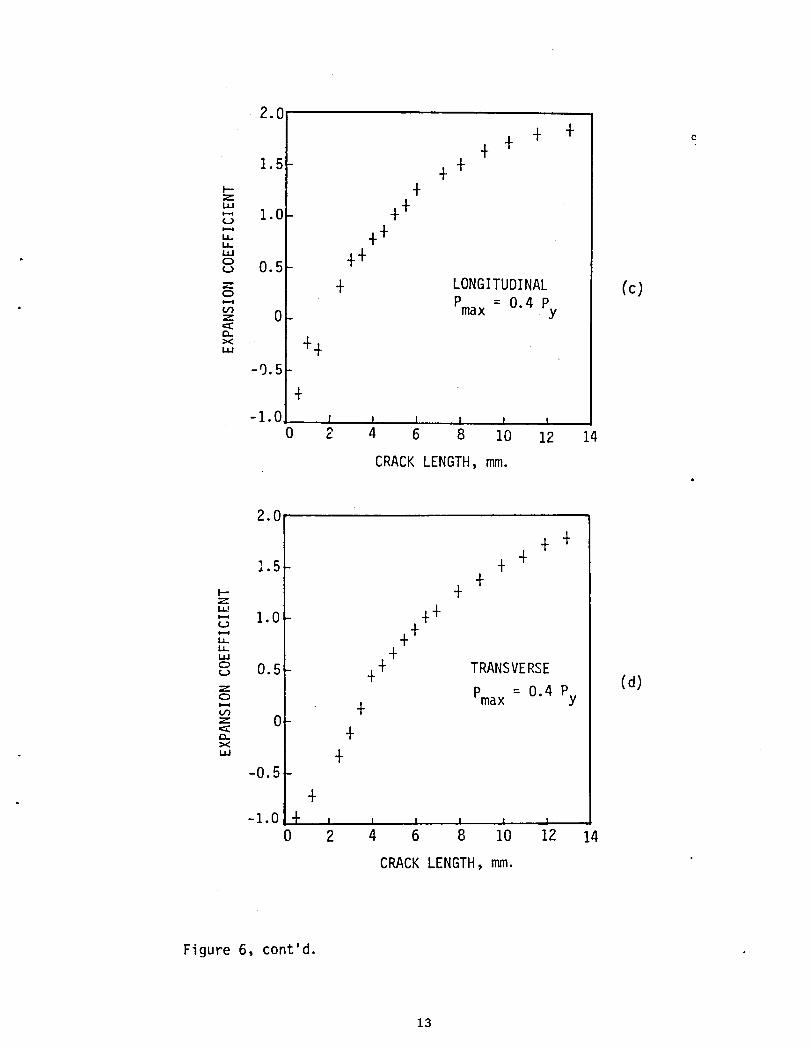
plotted as a function of crack length in Figures 6 and 7.
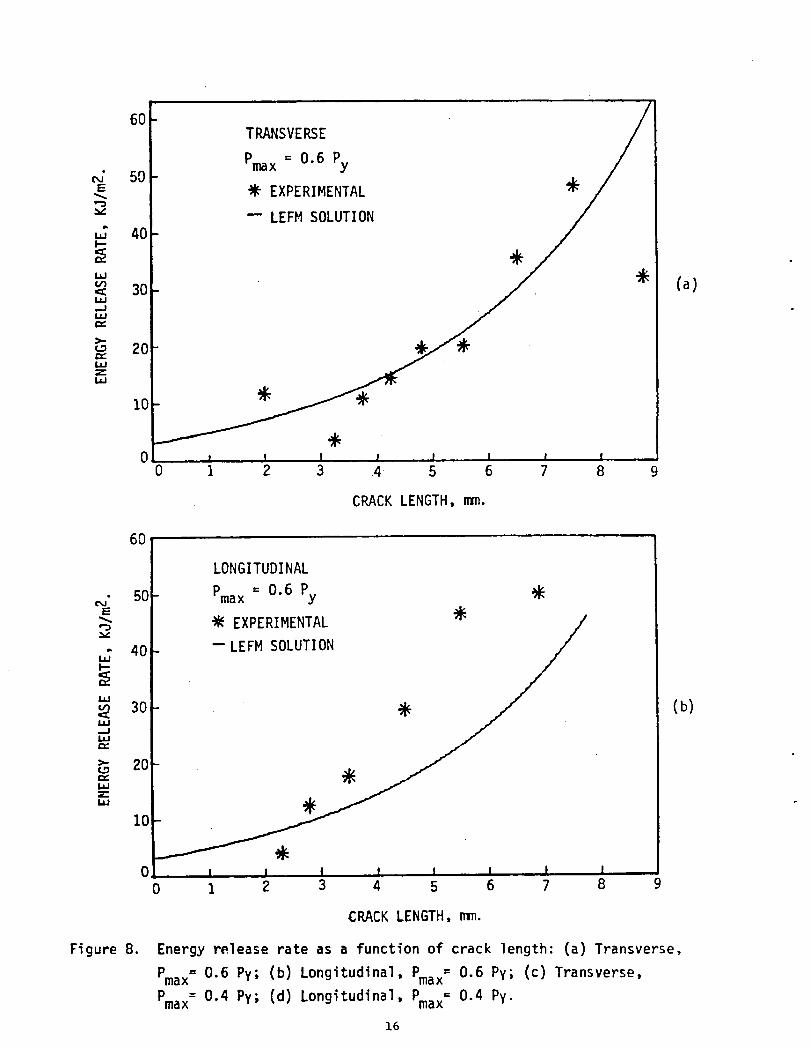
Energy release rates were also evaluated, using the load displacement
curves recorded during fatigue crack propagation. The variation of energy
release rate with crack length is illustrated in Figure 8. Energy release
rate at a given crack length is found to be higher when crack propagation
is accompanied by larger plastic zone.
The fracture surfaces of both transverse and longitudinal specimens
showed increasing evidence of cleavage with increasing crack length,
particularly along the mld-thlckness. The side surfaces were examined with
both optical and scanning electron microscopy. The roughness that develops
during crack propagation is illustrated in Figure 9.
I0
87
6 65
2 3 4 4l,ITCh.= I
2
(a) o
2
6
LONGITUDINAL
• . , . , , , . , . ,'40 4 8 12 16 20 2
LENGTH , mm.
Figure5. Damage evolutionunder (a) Pmax= 0.6 Py, (b) Pmax= 0.4 Pypropagation conditions.
11
2.0 +.
1.5 +
,,, ._ _.0 +-, LONGITUDINAL,, .'" P = 0.6 Pyou O. 5 - max== . (a)o
:= 0m
ILl
-0.5
-1.0 i I J l i i0 2 4 6 8 10 12 14
CRACKLENGTH,mm.
2.0 ++
1.5- ++
_ +-t-z
_ 1,0-_ jr+",,, + TRANSVERSE
o 0.5 = 0.6 Pyu Jr Pmax (b)zo.. Jr= 0
_<
-o.5 -Jr
-I.0 v t J _ , i0 2 4 6 8 I0 12 14
CRACKLENGTH,mm.
Figure 6. Variation of expansion coefficient with crack length at Pmax=
0.6 Py for (a) longitudinal, (b) transverse and at Pmax= 0.4 Pyfor (c) longitudinal, (d) transverse specimens.
12
2.0
. . + . 01.5i .+
.z
,,, .+'-- 1.0
'-' .-Ii,i,
,,, .." C) 0.5zo . LONGITUDINAL {c)
'-" P = 0.4 Pyu_ maxz 0
× 44-9.5
.-I.0 I _ t I t t
0 2 4 6 8 I0 12 14
CRACKLENGTH,mm.a,
2.0
. .1.5 + .
.
"' ..4'- 1.0
,, +
",,, ...o O.5 TRANSVERSE(d)
= 0.4 Pyo Pmax
z 0< .x
,, .-0.5
.-1.0 Jr j , , , , l
0 2 4 6 8 I0 12 14
CRACKLENGTH,mm.
Figure 6, cont'd.
13
0.6 ¸
0.5 + +
"," 0.4,,, Jr',' ! +0.3tY< JrCL.
0.2 (a)• 31" "
_.F- 0. i ++Jr LONGITUDINAL0
F- Pmax = 0.6 Pyif)
0
-0.1
-0.2 J l I J I0 2 4 6 8 10 12 14
CRACKLENGTH,mm.
0.6
0.5
,',- 0.4,,, -I,-- + JrI,.I.l
_- 0.3,-,- + Jr
-,- 0.2o "-,Jr (b)I--"" 0.1 Jro TRANSVERSE
u_ P =0.6P0 max yJr
JrJr-0.1 Jr
-0.2 j I I I I I0 2 4 6 8 10 12 14
CRACKLENGTH,mm.
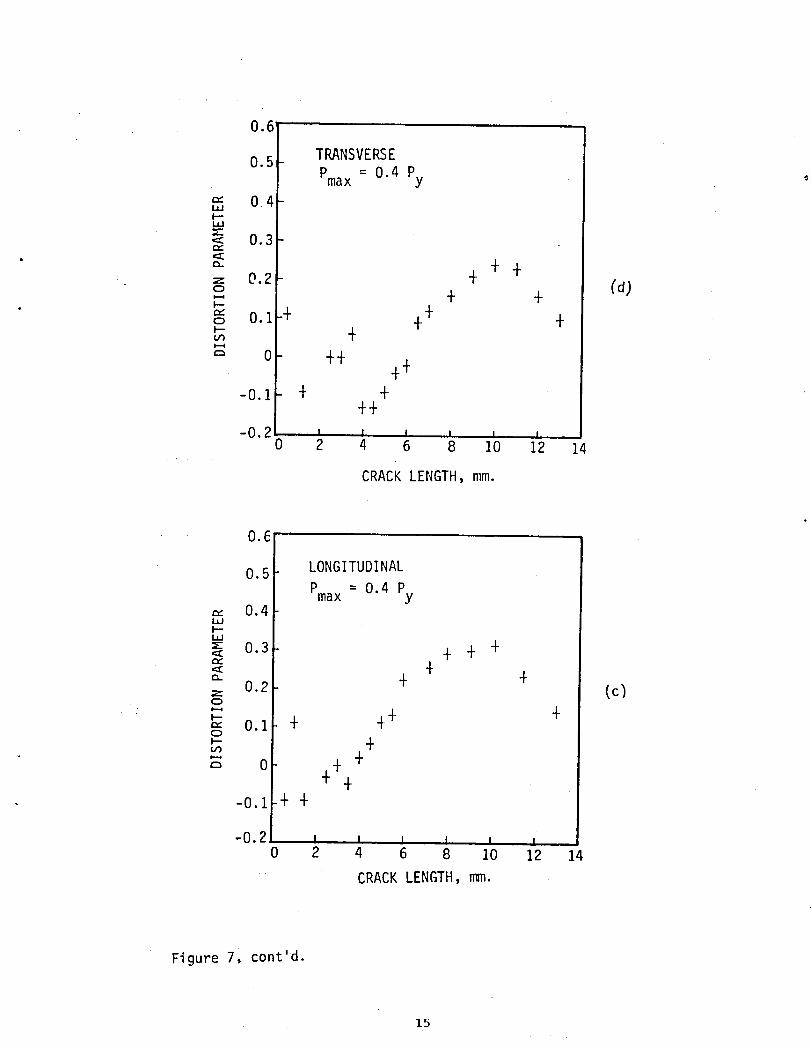
Figure 7. Variation of distortion parameter with crack length at Pmax=
0.6 Py for (a) longitudinal, (b) transverse and at Pmax= 0.4 Pyfor (c) longitudinal, (d) transverse specimens.
14
0.6
0.5 TRANSVERSEPmax= 0.4 Py _
04LI.II--
,_ 0.3¢Y
• z 0.2 + ++• _ + + (d)I--
= Jr ++o 0. I "I-
o ++ ++-o.I . -I-
+.-0.2 _ I i , i l
0 2 4 6 8 10 12 14
CRACKLENGTH,mm.
0.6
0.5 LONGITUDINAL
Pmax = 0.4 Py_- 0.4IJJI-.-
_- 0.3,:: . . .l,..Y..::: ._- . ._. 0.2 (c)0
'_" 0.1 . -I-. -I-"- 4
+
'-' 0 +-I-.i"-0.I ,1.4-
-0.2i l J j s i l0 2 4 6 8 10 12 14
CRACKLENGTH,mm.
Figure 7, c0nt'd.
15
60 /TRANSVERSE
Pmax= 0.6 Py /
_ 50 • EXPERIMENTAL _ /"_ - LEF.SOLUTIO.4O
(a)3o-
2o __
,.=,
10
0 J I I J I I _ I0 I 2 3 .4 5 6 7 8 9
CRACKLENGTH,mm.
60
LONGITUDINAL
_. 50 Pmax: 0.6 PyE ___ _ EXPERIMENTAL /
3o (b)._1
20
10
0 I I I I I I I I
0 I 2 3 4 5 6 7 8 9
CRACKLENGTH,nTn.
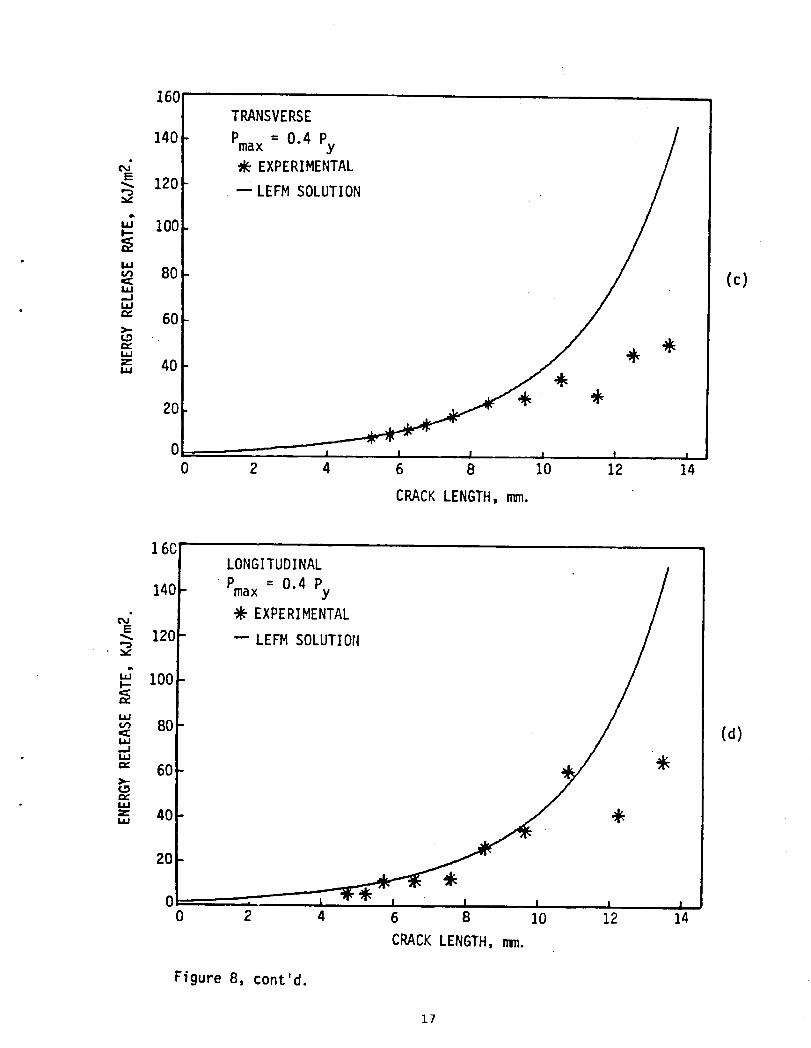
Figure 8. Energy release rate as a function of crack length: (a) Transverse,
Pmax= 0.6 Py; (b) Longitudinal, Pmax= 0.6 Py; (c)Transverse,
Pmax= 0.4 Py; (d)Longitudinal,Pmax= 0.4 Py.
16
160TRANSVERSE
140 Pmax= 0.4 Py_ EXPERIMENTAL
12ov. --LEFMSOLUTION
lOO
m 80 (c)l.lJ,...I
" "" 60
40
2o _k
0 I I ! ! I I
0 2 4 6 8 10 12 14
CRACKLENGTH,mm.
160LONGITUDINAL
140 Pmax= 0.4 Py
_' _EXPERIMENTALE
120 m LEFMSOLUTION
I00
80< (d)IJJ..J
60 -
401.1.1
,o0 _ l _ l0 2 4 6 8 10 12 14
CRACKLENGTH,n_n.
Figure8, cont'd.
17
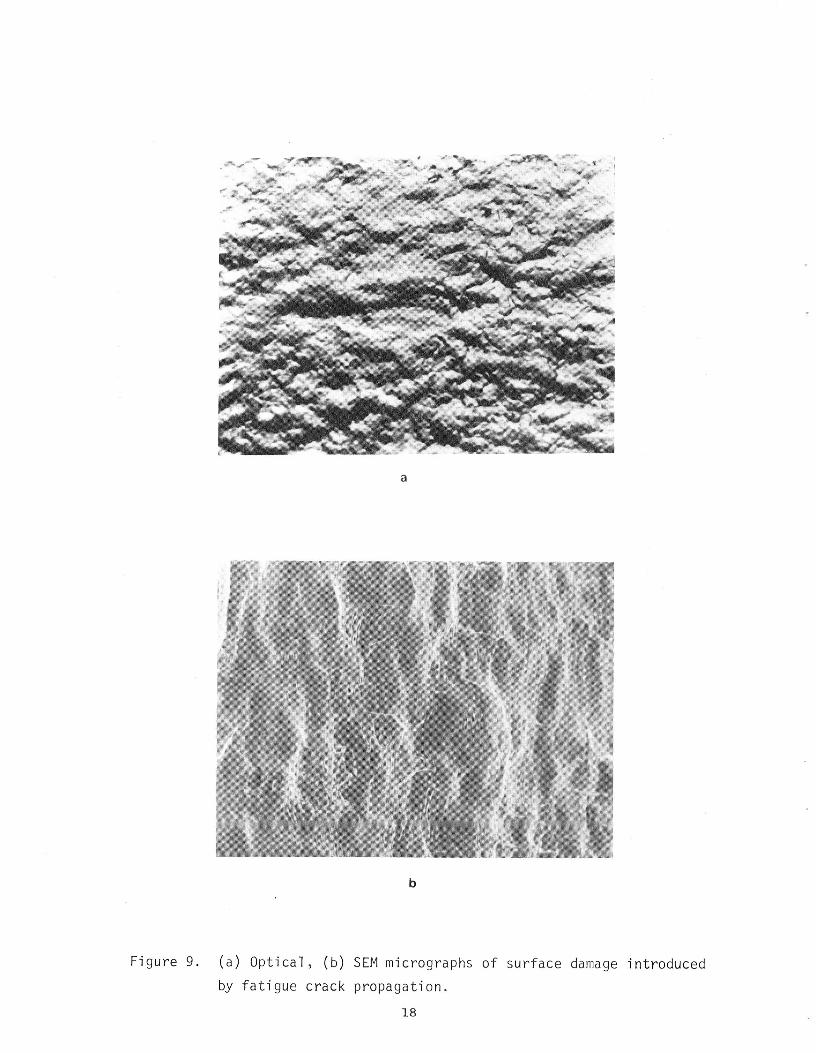
Figure 9, (a) Optical, (b) SEM micrographs of surface damage introduced
by fatigue crack propagation.
18
CHAPTER III
PLASTIC ZONE CHARACTERIZATION
The geometrical characterization of the plastic zone is easy to
perform on the surface, but it represents only the plane stress condition.
Stress state gradually changes through the thickness, from plane stress to
plane strain, and theory predicts that the zone size decreases gradually
until it reaches that of plane strain condition at mld-thlckness. It is
therefore necessary to use other techniques to examine experimentally the
plastic zone through the thickness. Most of these techniques can be
applied directly to cross sections perpendicular to the fracture surface
and crack growth directions.
There are several techniques which can be applied to the study of
plastic zones, and those which were employed in this project are discussed
below.
MICROHARDNESS MEASUREMENTS
Change in the hardness can be an indicator of the plastic deformation
experienced by the material. Consequently, microhardness has been used as
a tool to measure plastic zone size by some investigators (7-11). There is
one condition wP.ich has to be satisfied for this method to be effective:
Material to be studied must either work-harden or work-soften, if any
change in hardness is to be detected after fatigue. Austenitlc and
maraging steels are examples of work-hardening and softening materials,
respectively.
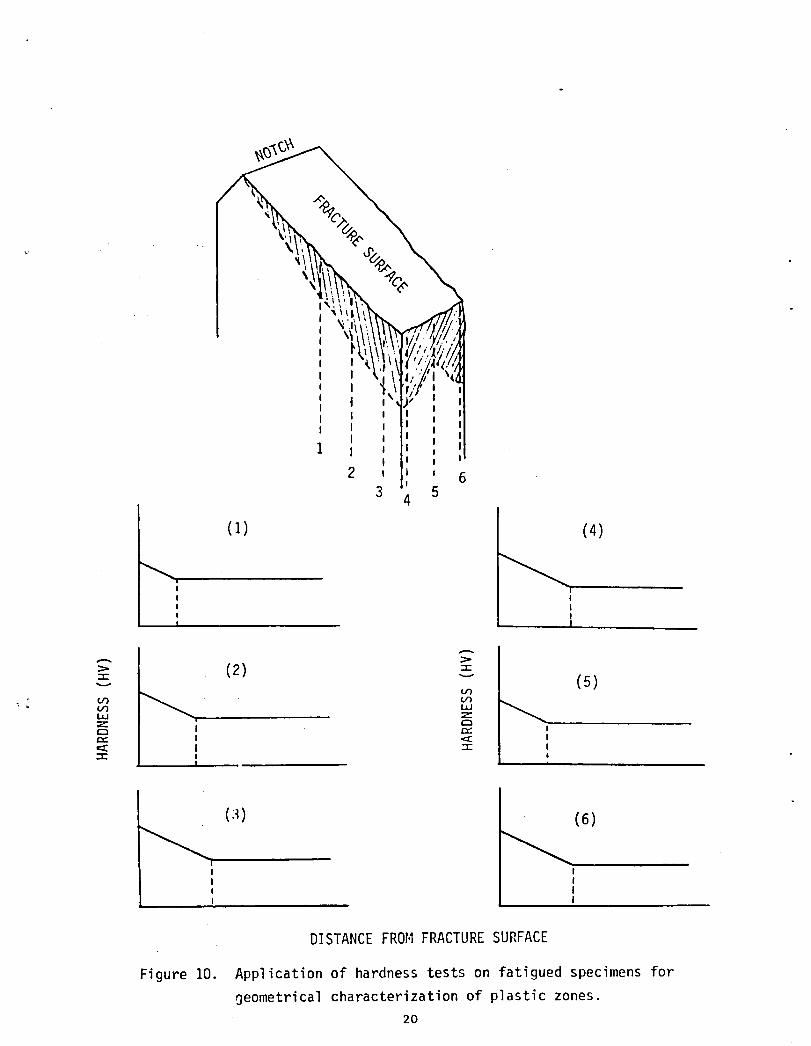
Geometrical characterization of the plastic zone can be readily
carried out by hardness measurements on fatigued specimens as illustrated
19
IIII iI !I II i
I I JI i
2 , ' 63 5
4
(11 (4)
(:_) (6)
I II !i Ii I
DISTANCEFROMFRACTURESURFACE
Figure 10. Applicationof hardnesstests on fatigued specimensfor
geometricalcharacterizationof plasticzones.2O
in Figure I0. Unfortunately, hardness is not very sensitive to small
changes of plastic strain. Therefore, careful standardization is required
if damage density is to be obtained.
For this method to be properly applied, the fol]ow|ng should be
considered: Indentations must be sufficiently large to mln_mize the error
in measurements of indentation size. However, they should also be spaced
• closely together for an accurate determination of plastic zone boundary.
Because the plastic field of an indentation itself strain-hardens the
material around it, there is a limit to how close indentations can be
placed. Two indentations must be apart by about four to five times the
diagonal or diameter. Hence, small loads should be used to produce small
indentations. As a result, one should find an optimum indentation size,
i.e. optimum load.
Hardness measurements were carried out on cross sections of fatigue
specimens, perpendicular to fracture surface and crack propagation
direction. A load of 50 g. was used. The same tests were performed on
side surfaces.
Hardness, as mentioned earlier, can be an indicator and even a measure
of plastic deformation. It is a material property for given conditions.
However, it should be kept in mind that a hardness reading is represen-
tative only of a small area from which it is taken. Therefore the
homogenity of the material plays an important role and the size of the
indentation is sJgnificant in hardness testing.
In order to determine plastic zone boundary very precisely and to
minimize error in measurements without violating hardness testing rules, 50
g Was used as the testing load. This load produced indentations of about
18 + 3 m (diagonal). This is comparable to and in most cases even
21
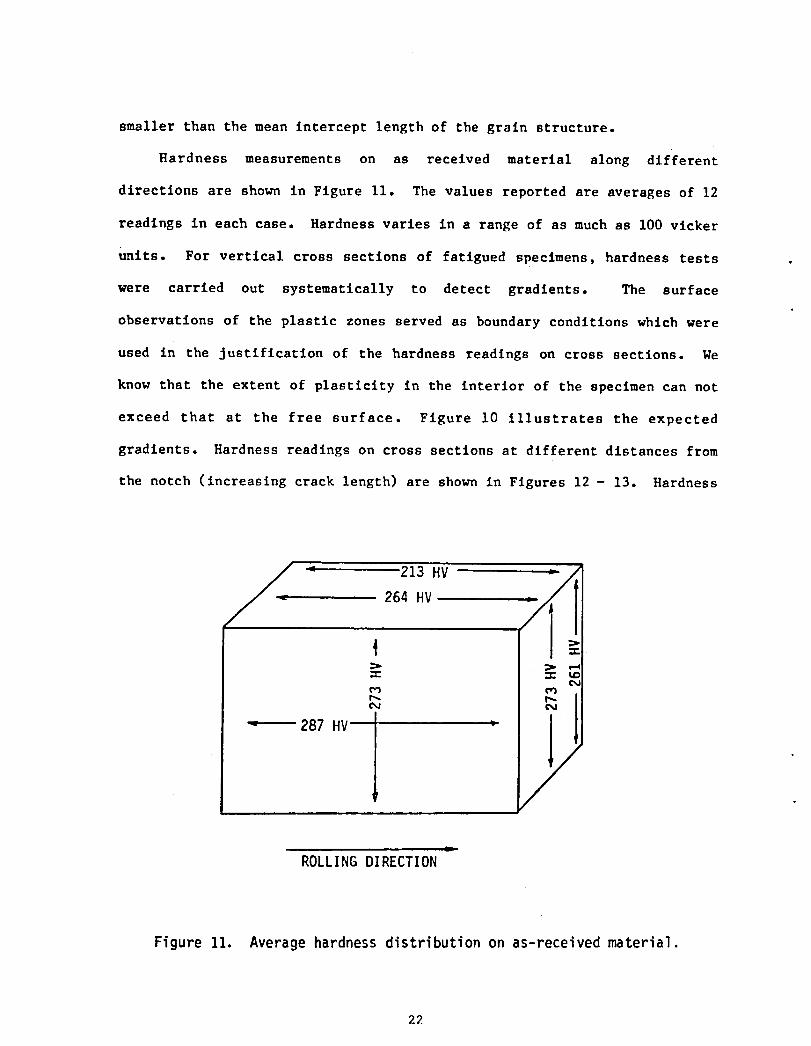
smaller than the mean intercept length of the grain structure.
Hardness measurements on as received material along different
directions are shown in Figure Ii. The values reported are averages of 12
readings in each case. Hardness varies in a range of as much as I00 vlcker
units. For vertical cross sections of fatigued specimens, hardness tests
were carried out systematically to detect gradients. The surface
observations of the plastic zones served as boundary conditions which were
used in the Justification of the hardness readings on cross sections. We
know that the extent of plasticity in the interior of the specimen can not
exceed that at the free surface. Figure i0 illustrates the expected
gradients. Hardness readings on cross sections at different distances from
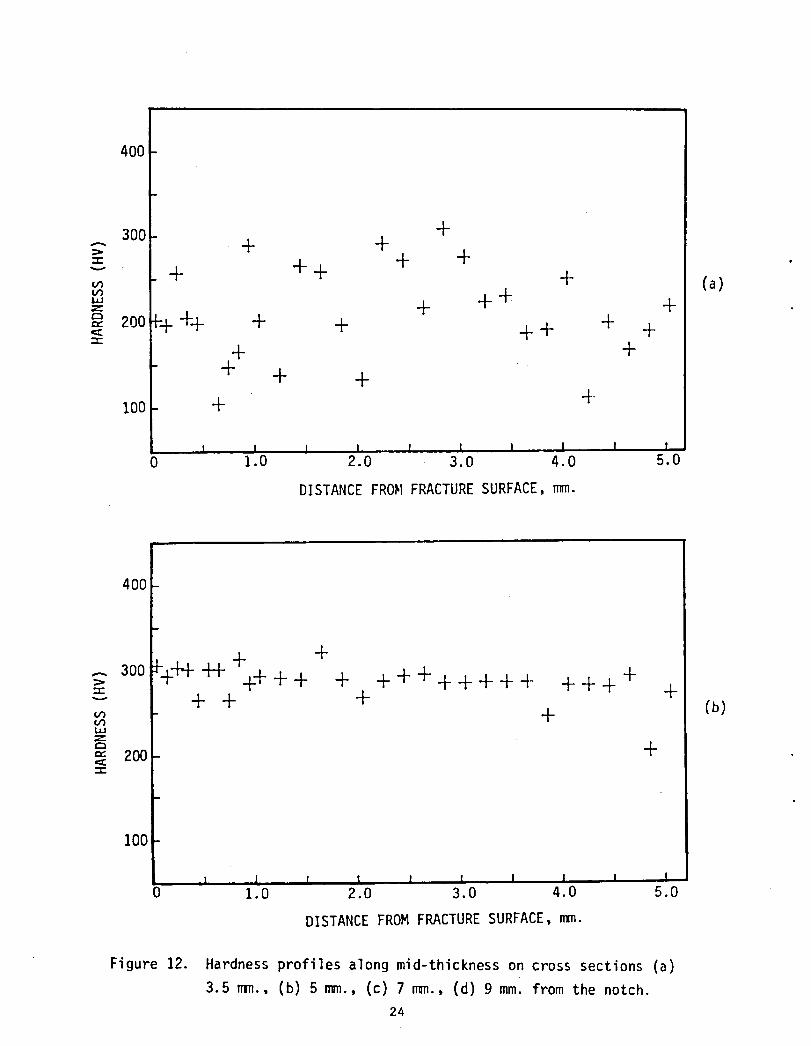
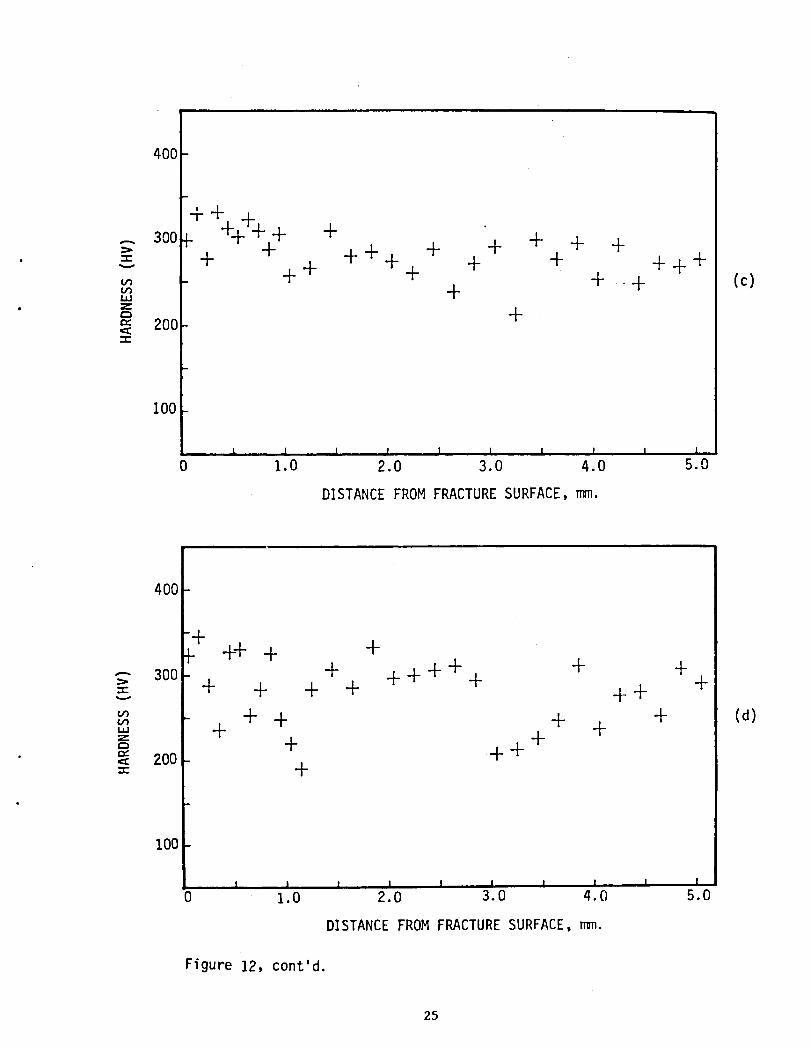
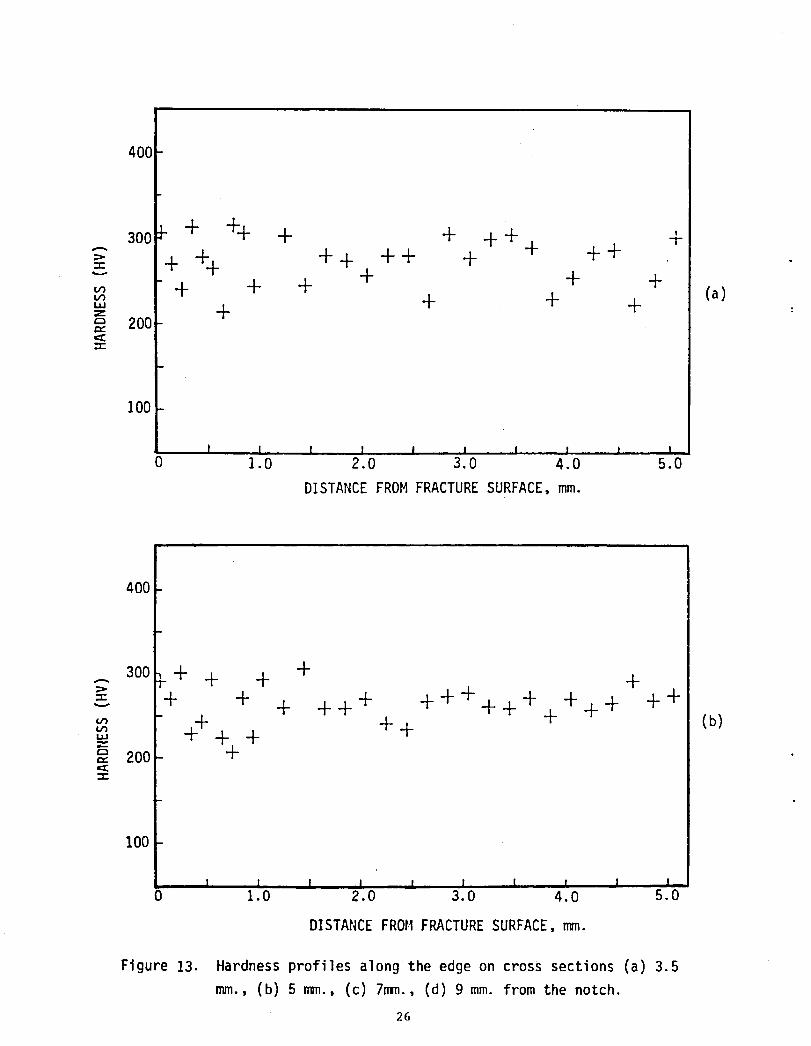
the notch (increasing crack length) are shown in Figures 12 - 13. Hardness
< 213 HV
264 HV
€
287 HV '
ROLLINGDIRECTION
Figure 11. Averagehardnessdistributionon as-receivedmaterial.
22
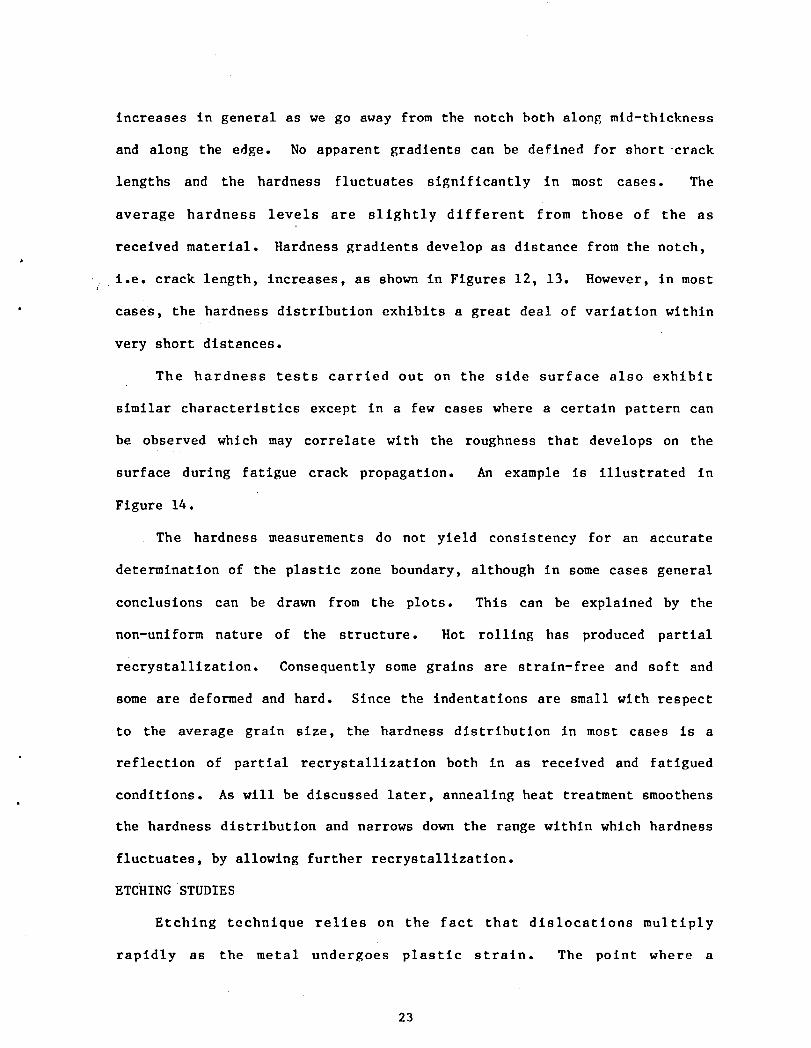
increases in general as we go away from the notch both along mld-thlckness
and along the edge. No apparent gradients can be defined for short crack
lengths and the hardness fluctuates significantly in most cases. The
average hardness levels are slightly different from those of the as
received material. Hardness gradients develop as distance from the notch,J
i,e. crack length, increases, as shown in Figures 12, 13. However, in mostt :
• cases, the hardness distribution exhibits a great deal of variation within
very short dlst_nces.
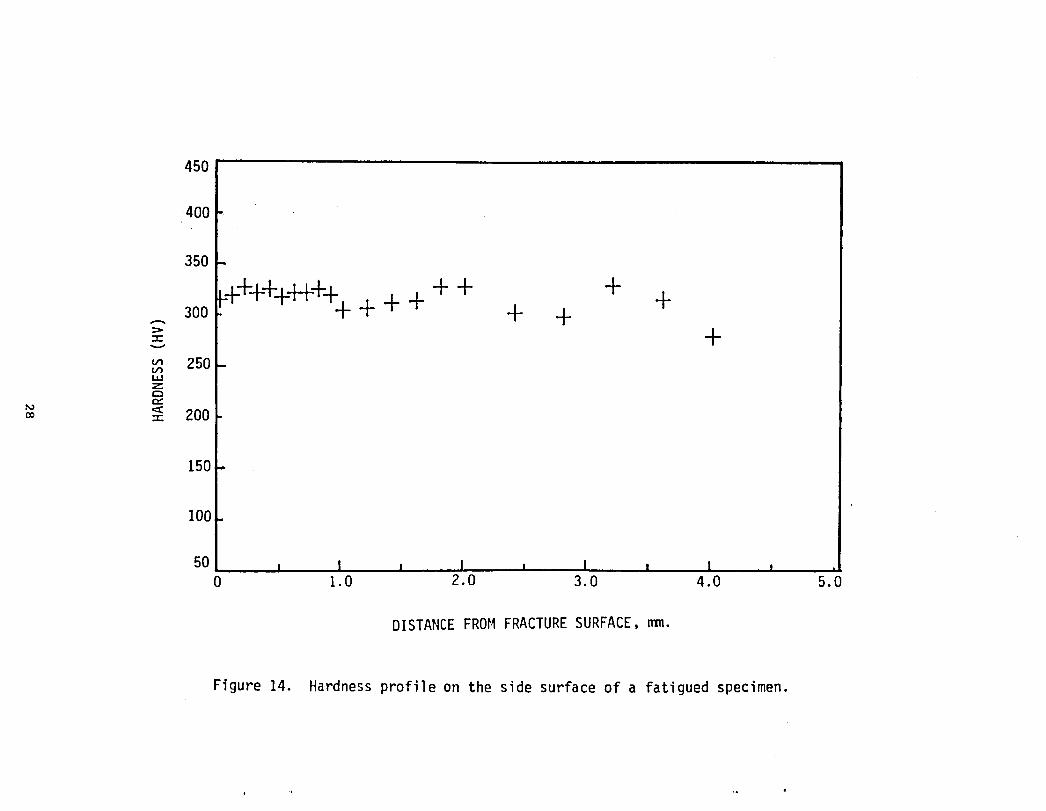
The hardness tests carried out on the side surface also exhibit
similar characteristics except in a few cases where a certain pattern can
be observed which may correlate with the roughness that develops on the
surface during fatigue crack propagation. An example is illustrated in
Figure 14.
The hardness measurements do not yield consistency for an accurate
determination of the plastic zone boundary, although in some cases general
conclusions can be drawn from the plots. This can be explained by the
non-unlform nature of the structure. Hot rolling has produced partial
recrystallization. Consequently some grains are straln-free and soft and
some are deformed and hard. Since the indentations are small with respect
to the average grain size, the hardness distribution in most cases is a
reflection of partial recrystalllzatlon both in as received and fatigued
conditions. As will be discussed later, annealing heat treatment smoothens
the hardness distribution and narrows down the range within which hardness
fluctuates, by allowing further recrystalllzation.
ETCHING STUDIES
Etching technique relies on the fact that dislocations multiply
rapidly as the metal undergoes plastic strain. The point where a
23
400
300 q-+ += + +
"_ + + + + (a),,, ++= + +r_= 2o0.++ + + +< ++ +=
+ ++ + +
loo + 4-
I I I I I I I I I I ,0 1.0 2.0 3.0 4.0 5.0
DISTANCEFROMFRACTURESURFACE,mm.
400
100
I I I I I I I I i I0 1.0 2.0 3.0 4.0 5.0
DISTANCEFROMFRACTURESURFACE,,In.
Figure 12. Hardnessprofilesalong mid-thicknesson cross sections (a)
3.5 ram.,(b) 5 n=n.,(c) 7 mm., (d) 9 mm. from the notch.24
4OO
300 4- 4-+ + + + + + +
• = + + + + + ++++ + + + .+ (c)+
" 200
I00
I | I I I, I I I I I
0 1.0 2.0 3.0 4.0 5.0
DISTANCEFROMFRACTURESURFACE,mm.
400
+ ++ + +_- 300 + + + + + + +
+ + + + + ++ +,_ + + + + (d)U9,., + += +,-, +,.,. ++,,=: 200= +
I00
I I I I I I I I I I
0 1.0 2.0 3.0 4.0 5.0
DISTANCEFROMFRACTURESURFACE,mm.
Figure 12, cont'd.
25
4OO
300 Jr Jr+ Jr Jr -t- Jr -{-
;'= + Jr+ ++ ++ + + ++,_ + + + + + ++ + (a),,, +_ Jr :"_ 200
100-
I I I I I I I I I I0 1.0 2.0 3.0 4.0 5.0
DISTANCEFROM FRACTURESURFACE,mm.
4OO
; 3oo+ + + + +=_. + + + +++ ++++++ + + ++_ _}_-}- Jr jr Jr Jr (b),,, + +,-, +:: 200
100
____.d. 10 1.0 2.0 3.0 4.0 5.0
DISTANCEFROM FRACTURESURFACE,,In.
Figure 13. Hardnessprofilesalong the edge on cross sections (a) 3.5
mm., (b) 5 mm., (c) 7mm., (d) 9 mm. from the notch.
26

400
+
++++++4+++ +=_,300 "Jr nt--Jr nL Jr "JrJr• ._ + + ++ +
++ + +,,, (c)= +++"_ 200-r
I00
I I I I I I I I I I0 1.0 2.0 3.0 4.0 5.0
DISTANCEFROMFRACTURESURFACE,mm.
400
++ +
=;. 3oo_-+++++ + + +._ +++ + + + + ++_ ++ ++ ++ ++ ('d)
,-, +'_" 200-
I00
I I I I I I I I I I0 1.0 2.0 3.0 4.0 5.0
DISTANCEFROMFRACTURESURFACE,nTn.
Figure13, cont'd.
27
45O
4O0
350
_+++++H-F++ + + + +aoo + + + + + +
> +m 250i,l
:: _ 200
150
lOO
50 t I I I i I I I , I
0 1.0 2.0 3.0 4.0 5.0
DISTANCEFROM FRACTURESURFACE,mm.
Figure 14. Hardnessprofileon the side surfaceof a fatiguedspecimen.
dislocation intersects the free surface may be relatively anodlc or
cathodic to certain etchants, particularly when impurity atoms are
segregated to the dislocation. This results in the formation of etch pits,
whose density on the surface is a sensitive indicator of the prior strain
at or close to that surface (3,5,12). At low strains, one can observe etch
pits from individual dislocations and a one to one correlation can be
" obtained. If the material is deformed to a large extent, pits are so dense
that they can no longer be resolved; Etching in such a case, merely darkens
the surface. Also, a one to one correlation is no longer given.
A vertical cross section similar to that used in hardness analysis was
used in etching studies. The piece was aged at 160 ° C for 1 hour to allow
the segregation of interstltials to dislocations for decoration purpose.
Then it was etched electrolytically in Morris solution (25 g chromium
trioxide, 133 cc acetic acid, 7 cc H20). Etching occurs at approximately 5
v in 3-15 minutes without agitation. It is important to keep the solution
temperature at about 20@c or below it. This method reveals the dislocation
slip bands by prential etching.
The etching pattern of a vertical cross section is illustrated in
Figure 15. The selectively attacked region is along mld-thickness in
addition to the region underneath the fracture surface llne and periodic
bands down the cross section. These bands may correlate with the surface
. rumpling and may be associated with surface hardness patterns. However,
etching effect suggests that the deformation caused by hot rolling is
relatively large with respect to the damage induced by fatigue crack
propagation.
RECRYSTALLIZATION TECHNIQUE
The deforme_ state is a condition of higher internal energy than the
29
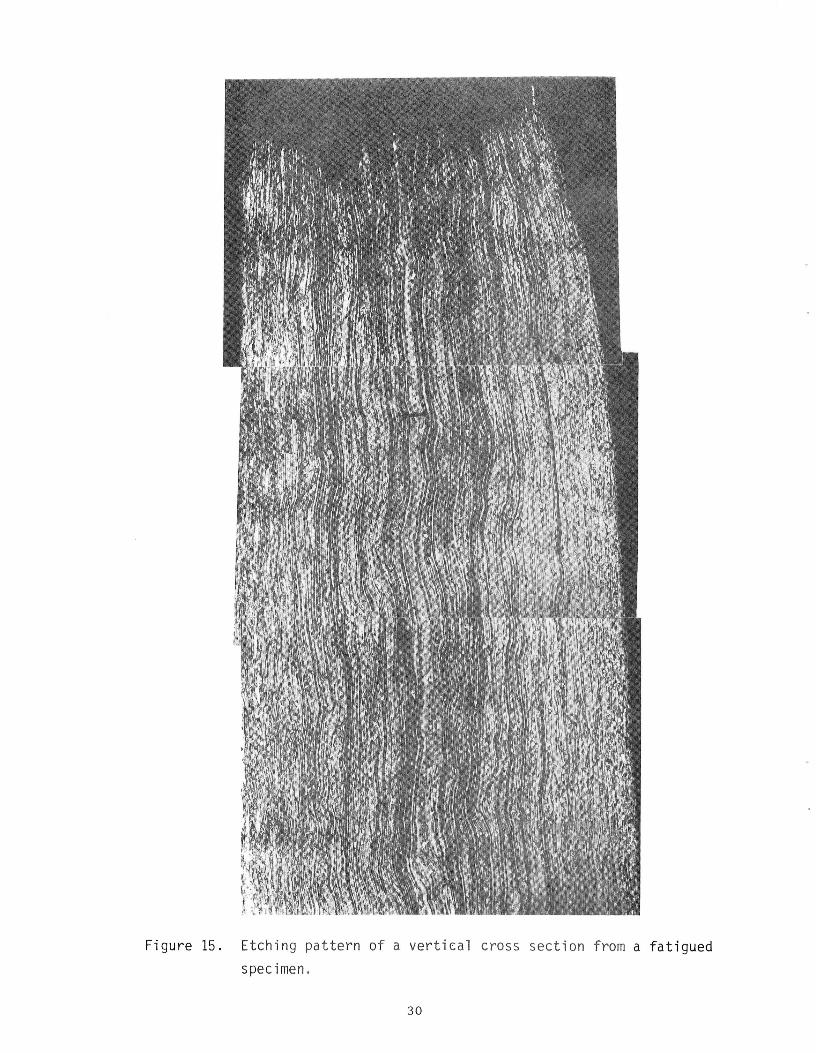
Figure 15. Etching pattern of a vertical cross section from a fatigued
specimen.
3O
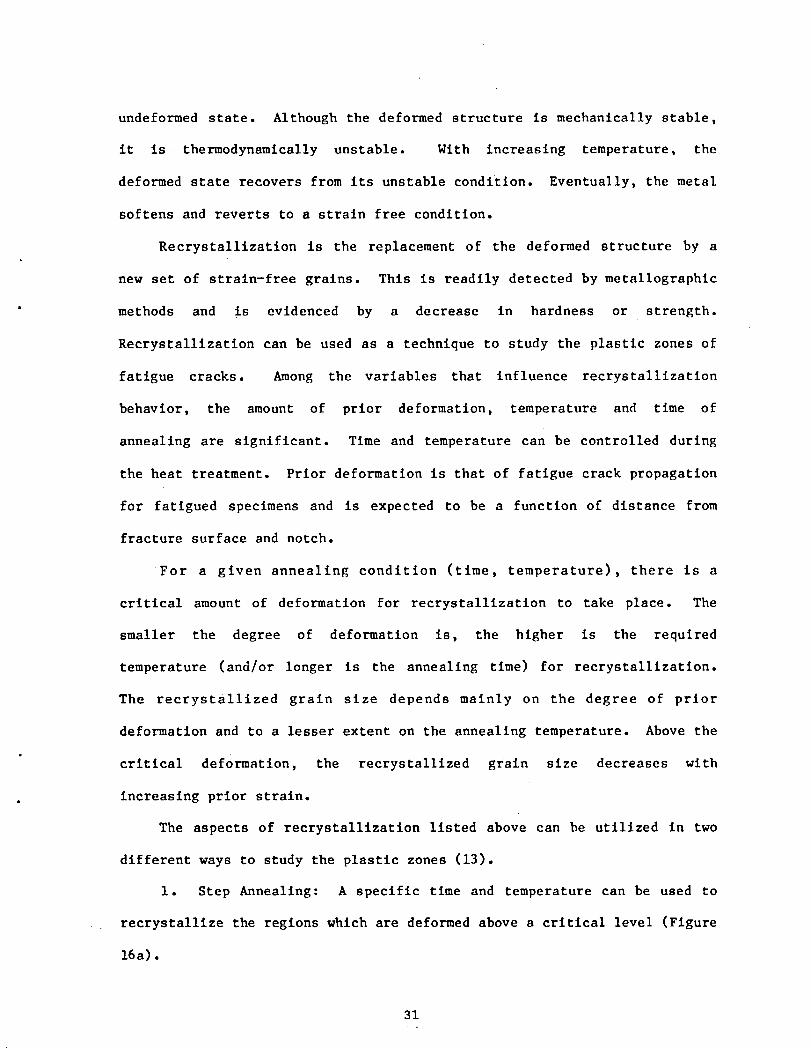
undeformed state. Although the deformed structure is mechanically stable,
it is thermodynamically unstable. With increasing temperature, the
deformed state recovers from its unstable condition. Eventually, the metal
softens and reverts to a strain free condition.
Recrystalllzation is the replacement of the deformed structure by a
new set of straln-free grains. This is readily detected by metallographic
• methods and is evidenced by a decrease in hardness or strength.
Recrystallization can be used as a technique to study the plastic zones of
fatigue cracks. Among the variables that influence recrystalllzation
behavior, the amount of prior deformation, temperature and time of
annealing are significant. Time and temperature can be controlled during
the heat treatment. Prior deformation is that of fatigue crack propagation
for fatigued specimens and is expected to be a function of distance from
fracture surface and notch.
For a given annealing condition (time, temperature), there is a
critical amount of deformation for recrystalllzatlon to take place. The
smaller the degree of deformation is, the higher is the required
temperature (and/or longer is the annealing time) for recrystallization.
The recrystalllzed grain size depends mainly on the degree of prior
deformation and to a lesser extent on the annealing temperature. Above the
critical deformation, the recrystallized grain size decreases with
• increasing prior strain.
The aspects of recrystallization listed above can be utilized in two
different ways to study the plastic zones (13).
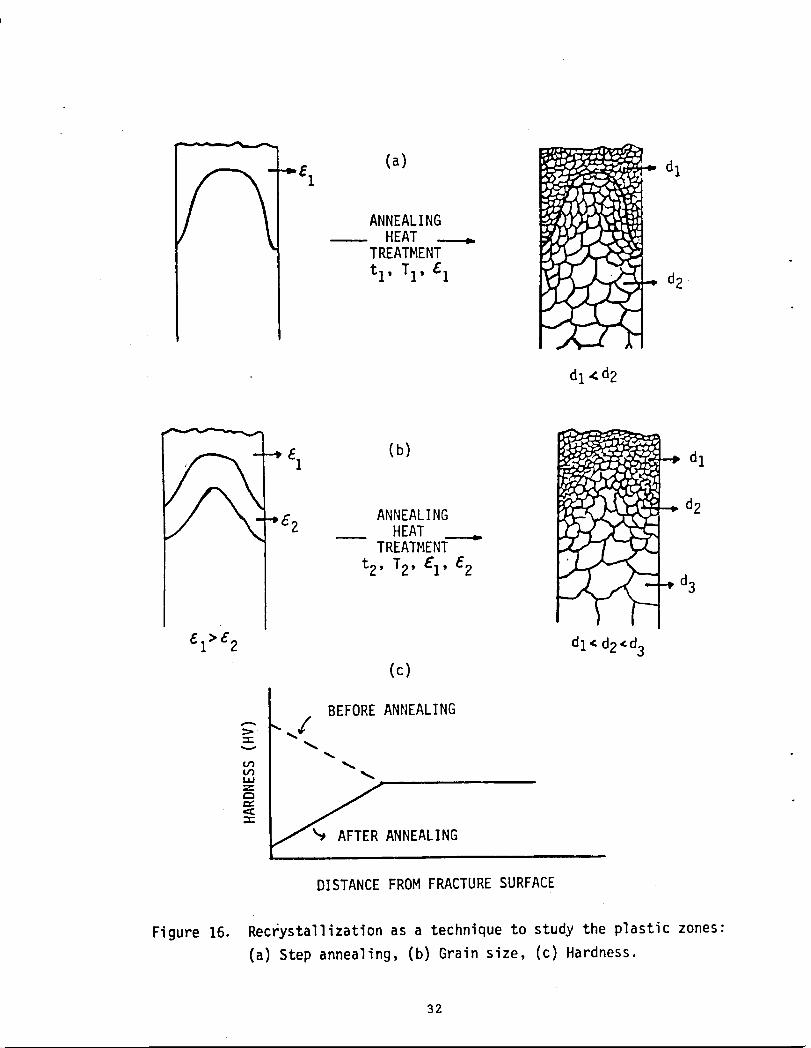
i. Step Annealing: A specific time and temperature can be used to
recrystalllze the regions which are deformed above a critical level (Figure
16a).
31°
(a) dl
_ "_gl ANNEALING-- HEAT ___.TREATMENT
tl' TI' £id2
dI _d2
-_EI (b) dlANNEALING d2
-*E2 _ HEATTREATMENT
t2, T2, EI, 62
d3
El>E2 d] < d2<d3(c)
BEFOREANNEALING.-. /v _
__m_= _ANNEALING
DISTANCEFROM FRACTURESURFACE
Figure 16. Recrystallizationas a techniqueto study the plasticzones:
(a) Step annealing,(b) Grain size, (c) Hardness.
32
2. Grain Size: Annealing heat treatment can be carried out under
such conditions (t,T) that the whole structure recrystallizes. In this
case depending on the prior deformation the resulting grain size of
different regions will be different (Figure 16b).
Hardness can also be used as an indication of recrystalllzatlon and
can be coupled with step annealing technique for geometrical characterl-
• zation of the plastic zone. In samples annealed after fatigue, the
hardness gradiellts would be opposite to those obtained from fatigued
specimens (Figure 16c).
As received material was found to recrystallize completely at
temperatures above 1500°F. Vertical cross sections therefore, were
annealed at temperatures ranging from 1200°F to 1450°F for I to 3 hours to
allow selective recrystallization. In other words, the prior strain
history of the material was accounted for, and regions with additional
fatigue deformation were allowed to recrystalllze during annealing heat
treatment. Cross sections were then etched to examine the grain structure.
Hardness measurements were also carried out on these cross sections to
determine potential hardness gradients.
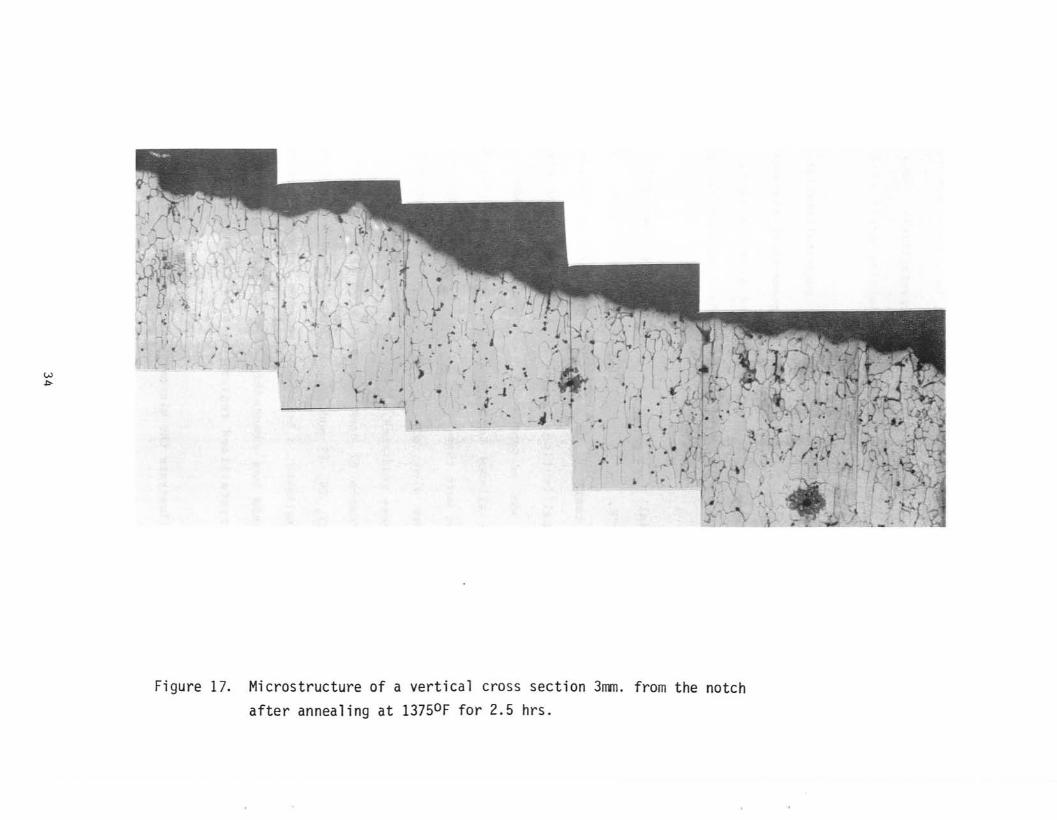
The optical mlcrographs of specimens annealed after fatigue are
illustrated in Figures 17, 18, 19 and 20. Regions with relatively small
• and equiaxed grains are believed to have experienced a larger deformation.
The fact that grain shape was elongated prior to annealing makes it
possible to detect recrystallized regions because they have equiaxed
grains.
Figures 17 and 18 illustrate the microstructures of two vertical cross
sections 3 and g mm away from the notch respectively. The specimen was
fatigued at Pmax = 0.6 Py and annealed at 1375'F for 2.5 hrs. The extent
33
> ..; '"
. \ \
Figure 17. Microstructure of a vertical cross section 3mm. from the notchafter annealing at 13750 F for 2.5 hrs.
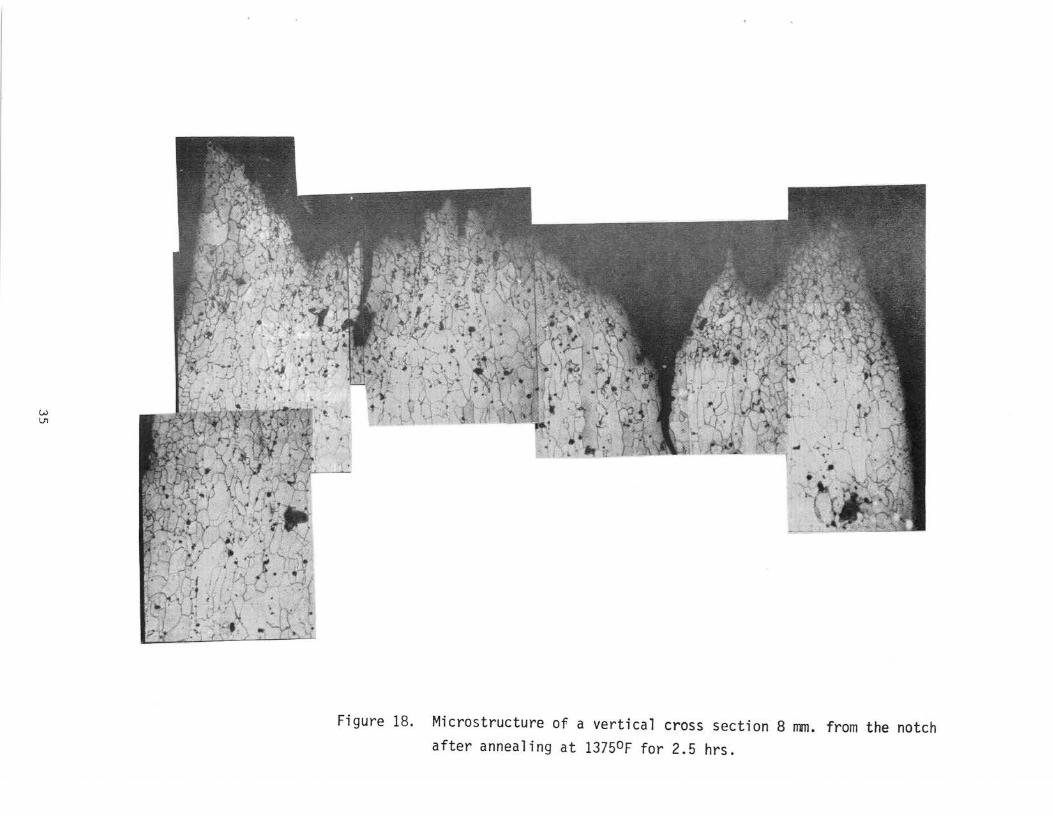
Figure 18. Microstructure of a vertical cross section 8 rom. from the notchafter annealing at 13750 F for 2.5 hrs.
of recrystallization is larger on the cross section 8 mm away from the
notch and this indicates that this section represents a higher deformation
region.
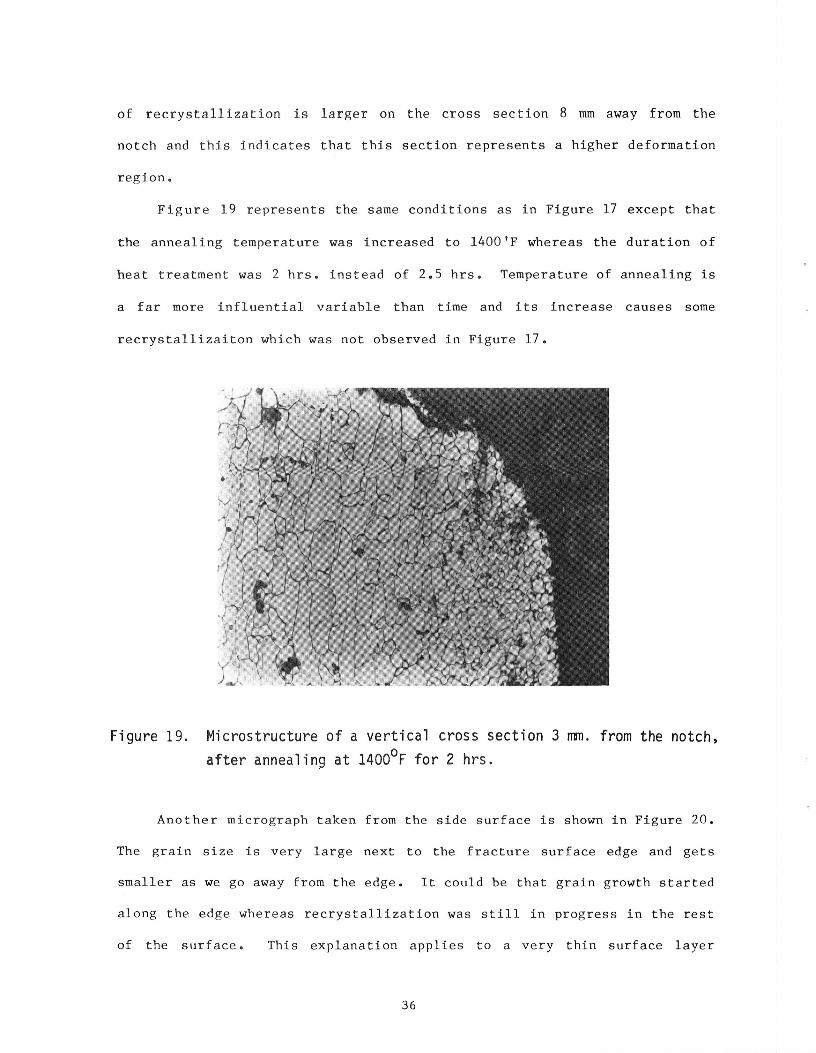
Figure 19 represents the same conditions as in Figure 17 except that
the annealing temperature was increased to 1400'F whereas the duration of
heat treatment was 2 hrs. instead of 2.5 hrs. Temperature of annealing is
a far more influential variable than time and its increase causes some
recrystallizaiton which was not observed in Figure 17.
Figure 19. Microstructureof a verticalcross section 3 mm. from the notch,
after annealingat 1400°F for 2 hrs.
Another micrograph taken from the side surface is shown in Figure 20.
The grain size is very large next to the fracture surface edge and gets
smaller as we go away from the edge. It could be that grain growth started
along the edge whereas recrystallization was still in progress in the rest
of the surface. This explanation applies to a very thin surface layer
36
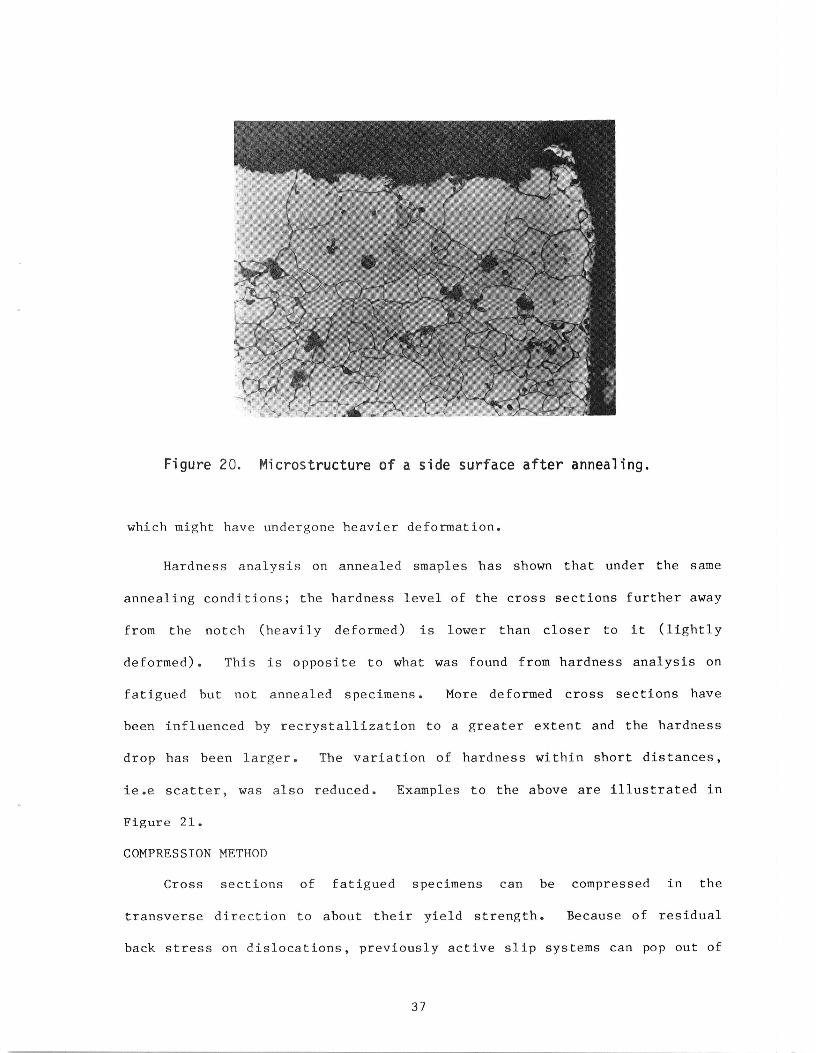
Figure 20. Microstructureof a side surfaceafter annealing.
which might have undergone heavier deformation.
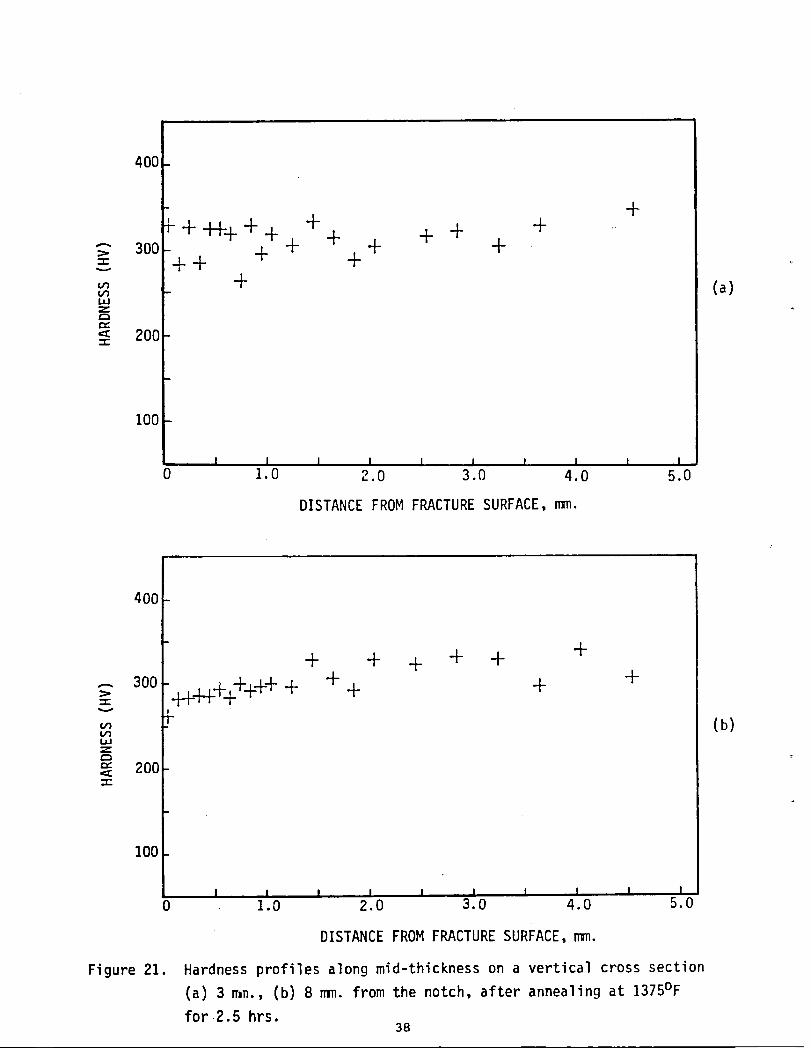
Hardness analysis on annealed smaples has shown that under the same
annealing conditions; the hardness level of the cross sections further away
from the notch (heavily deformed) is lower than closer to it (lightly
deformed). This is opposite to what was found from hardness analysis on
fatigued but not annealed specimens. More deformed cross sections have
been influenced by recrystallization to a greater extent and the hardness
drop has been larger. The variation of hardness within short distances,
ie.e scatter, was also reduced. Examples to the above are illustrated in
Figure 21.
COMPRESSION METHOD
Cross sections of fatigued specimens can be compressed in the
transverse direction to about their yield strength. Because of residual
back stress on dislocations, previously active slip systems can pop out of
37
400
,1,.+F.. ,1, -F ,1,•1, ,1,H-
_" 300 ,1,-F -F -F-. -F -F
. (a){,/'}ILl
r,,
':: 200-1--
100
I I I I I I I I I I0 1.0 2.0 3.0 4.0 5.0
DISTANCEFROMFRACTURESURFACE,n:n.
400
. + . + -t- +
.-.=>3oo _t_I__1_t_+++++++ + + + +'I- (b)
i,i
:: 200-r-
100
I I I I I I I I I !0 1.0 2.0 3.0 4.0 5.0
DISTANCEFROMFRACTURESURFACE,mm.
Figure 21. Hardness profiles along mid-thickness on a vertical cross section
(a) 3 mn., (b) 8 mm. from the notch, after annealing at 1375°F
for 2.5 hrs.38
the polished cross-sectional surface, and it permits to observe the
evolution of sllp lines (14). The method relies on the fact that the
microstructure contains residual stresses in fatigued specimens, whereas it
is strain-free before fatlgue. For non-deformed metals, it takes a stress
above the yield point to activate slip to produce permanent deformation.
However a lower stress can accomplish this in the plastic zone of a
" fatigued specimen.
Fatigued specimens were sectioned to produce cross sections at 90
degrees as well as cross sections at some angle with respect to the
fracture surface. These cross sections were polished to mirror quality,
and the specimens were compressed in the transverse direction to different
stress levels to initiate sllp. For comparison, these tests were repeated
on as received material.
The compression load was applied in two fashions: (1) Fatigued and as
received specimens were loaded to the same level and then examined
carefully with optical microscope. The load was high enough to produce
sufficient sllp activity on the polished surface• The density of sllp
lines was to be compared in this test. (ll) Fatigued and as recleved
specimens were loaded until roughness initiated on the free surface of the
cross section. During the compression test, the surfaces were observed
with a magnifier. The load at which roughness initiated on the polished
surface was to be compared for the two kinds of specimens.
For an evaluation of compression tests results, it was assumed that
the yield strength of Fe-2.6 Si alloy in compression is equal to that in
tension. Fatigued specimens have undergone permanent shape changes at
lower stress levels than the as received specimens. At low stresses ,
entenslve roughness in the form of surface rumpling which correlated with
39
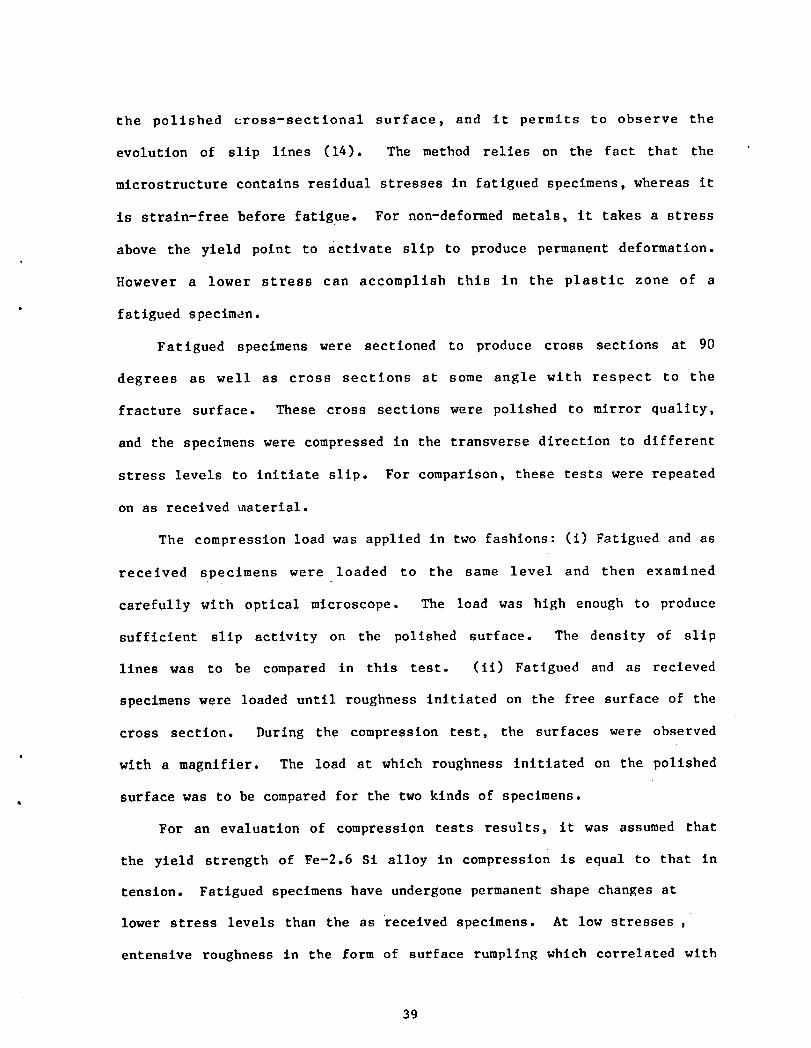
grain structure was observed. However individual slip lines were difficult
to find unless the stress was increased to about the yield point. An
example of slip lines that evolve on a polished surface upon compression is
illustrated in Figure 22. The stress level at which any surface activity
Figure 22. Slip lines that evolvedon a verticalcross sectionof a
fatigued specimenwhen compressedto about its yield point.
starts is believed to be a function of prior strain history of the
specimen. These tests have confirmed that it takes less stress to activate
slip systems in a previously deformed specimen.
TRANSMISSION ELECTRON MICROSCOPY
TEM techniques can be employed to quantity the damage through the
thickness as a function of location with respect to fracture surface and
notch. Thin foils at different depths from the fracture surface and at
different distances from the notch can be examined to evaluate the amount
of damage in terms of dislocation density and cell wall thickness.
40
Dislocations are often distributed rather homogenously in the very early
stages of fatigue and tend to form hetergeneous configurations, clusters
before a cell structure develops (15, 16). However the application of TEM
techniques for geometrical characterization of the plastic zone is not
practical.
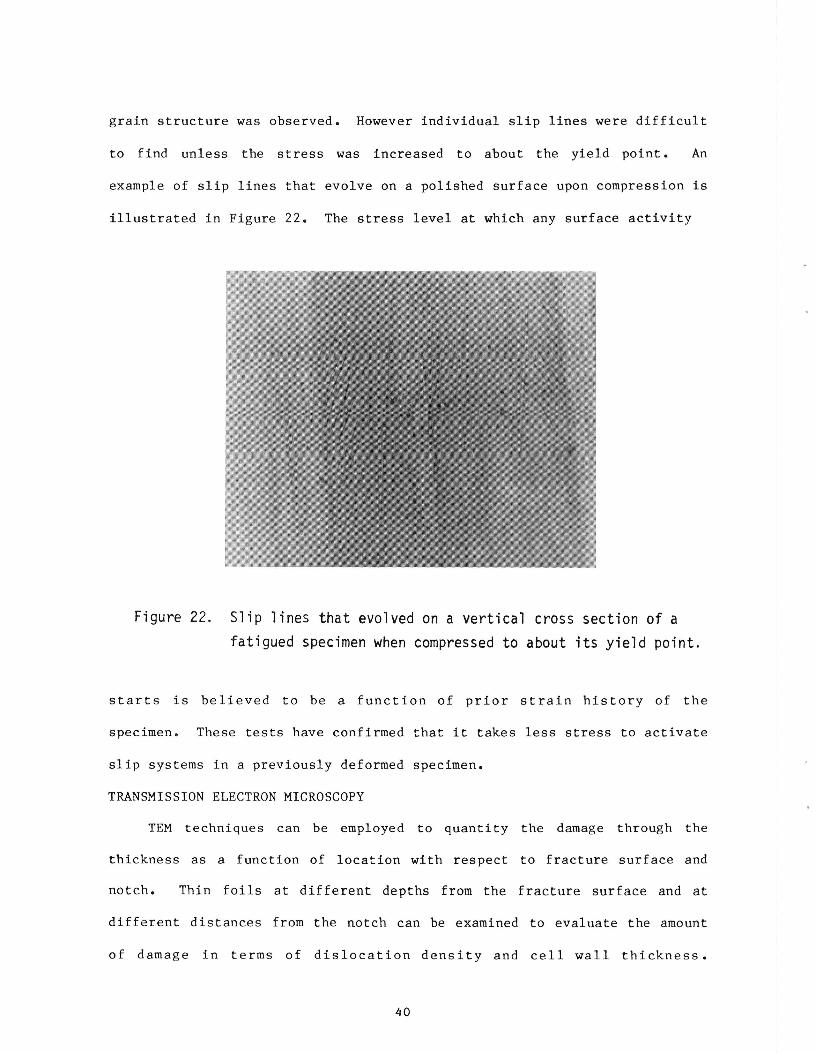
Thin foils were prepared from right underneath the fracture surface
next to the notch, as shown in Figure 23. A thin loll was obtained from
the as received material with the same relative position for comparison
purposes. These foils were examined with a Phillps 400T microscope at 120
KV.
FRACTURESURFACE
[i __1.5 ram.
Figure23. Illustrationof samplingof thinfoilsexaminedin this
investigation.
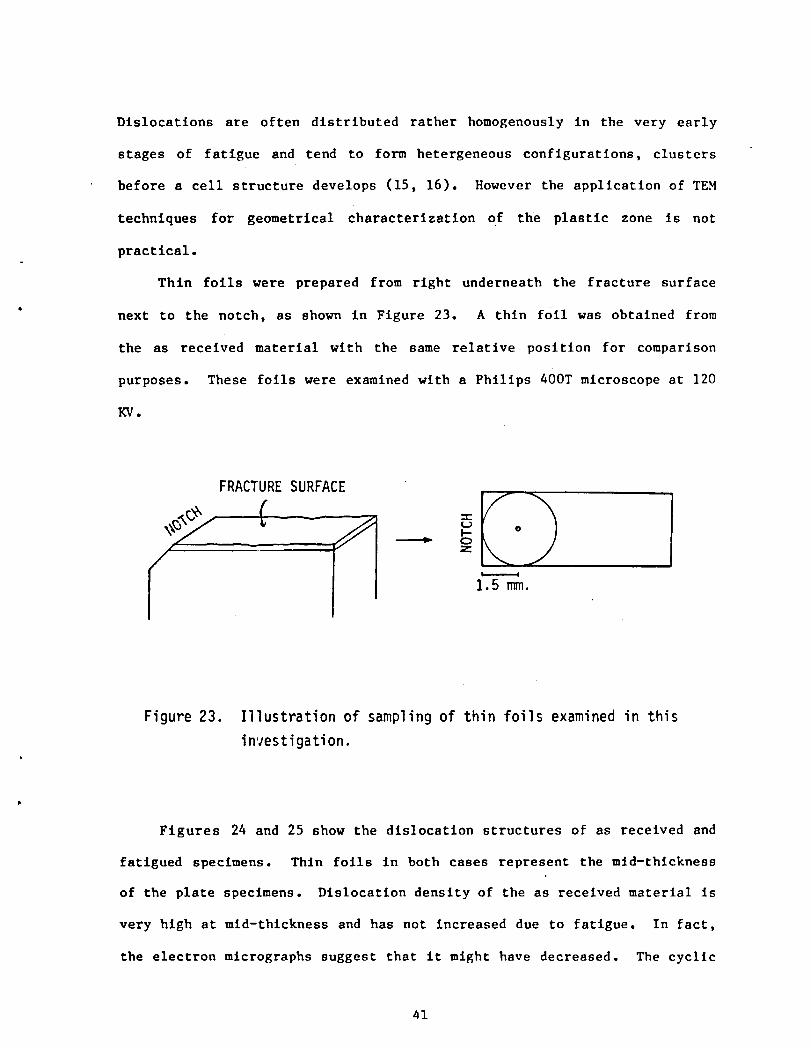
Figures 24 and 25 show the dislocation structures of as received and
fatigued specimens. Thin foils in both cases represent the mld-thlckness
of the plate specimens. Dislocation density of the as received material is
very high at mid-thickness and has not increased due to fatigue. In fact,
the electron micrographs suggest that it might have decreased. The cyclic
41
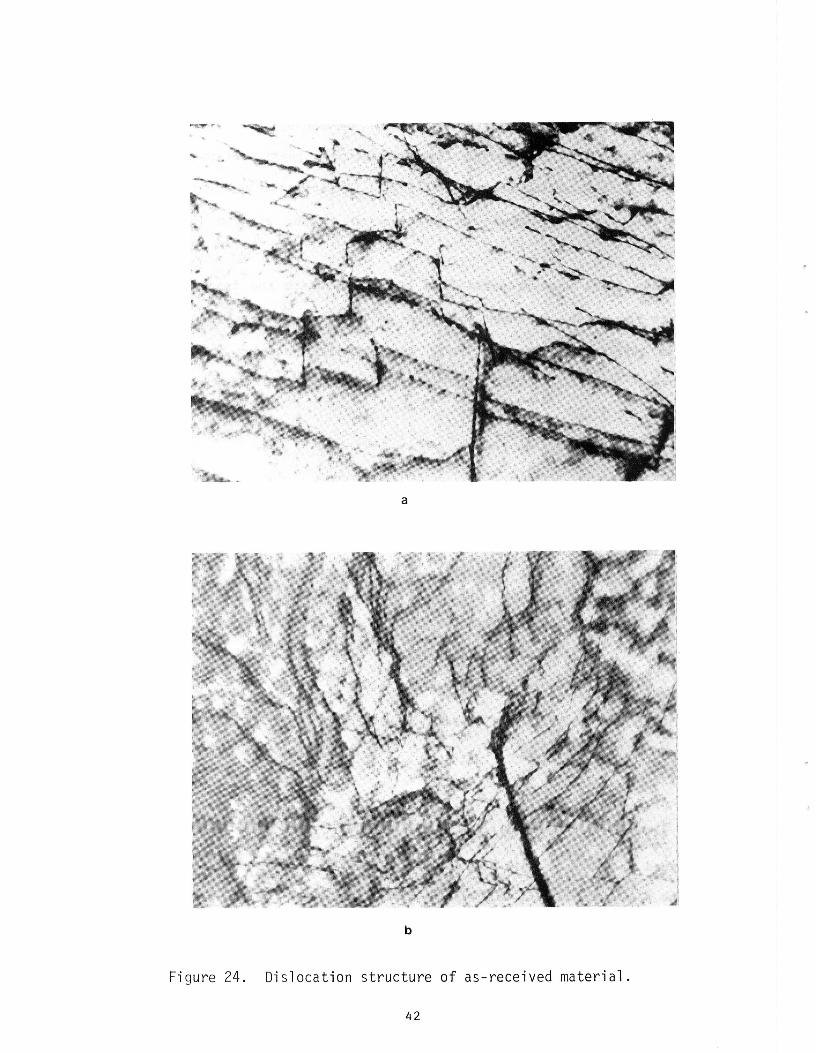
Figure 24. Dislocation structure of as-received material.
42
a
b
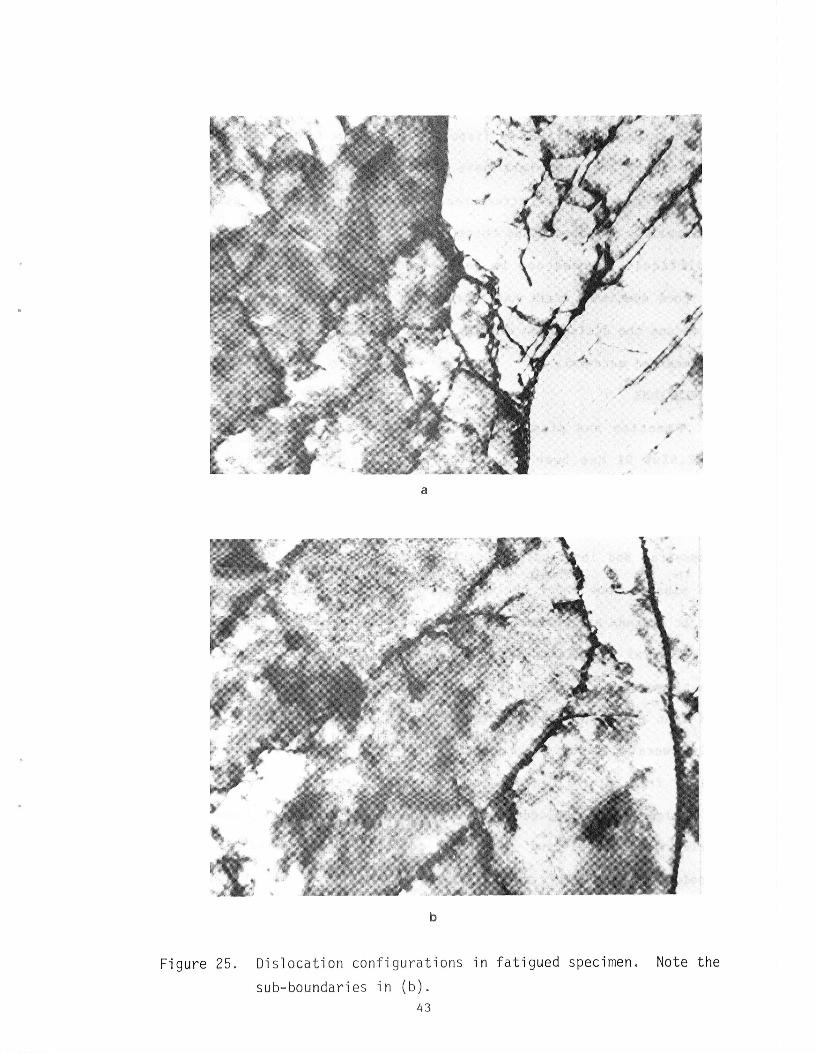
Figure 25. Dislocation configurations in fatigued specimen. Note the
sub-boundaries in (b).43
strain rates, as dictated by frequency of fatigue tests, together with room
temperature testing might have favored the low temperature regima of
deformation for b.c.c, structures. In this regime, the glide of screw
dislocations is impeded and therefore the multipllcatlon of dislocations is
a difficult process and is unlikely. Some subboundaries observed in
fatigued specimens might have served as a sink for dislocations and helped4
to reduce the dislocation density. Such subboundaries were not observed in
as received materlal.
CONCLUSIONS
Kinetics and plasticity aspects of fatigue crack propagation in
Fe-2.6%wt Si has been obtained. Crack growth rates were found to be
slightly higher in longitudinal direction as would be expected from the
inferior tensile properties in this direction. Plastic zone evolution in
transverse and longitudinal specimens has shown many similarities. Crack
tip plastic zone under cyclic loading conditions does not only translate
but it expands and changes shape with crack propagation.
Several techniques were employed in the through-thlckness study of
plastic zones. Due to the fact that specimens were in hot-rolled condition
and that they exhibited laminar grain structure the interpretation of re-
suits were difficult. The degree of mid-thickness deformation in parti-
cular, from hot-rolling process was comparable to the deformation induced
by fatigue crack propagation. It is believed that these techniques would
yield very useful and meaninful results when applied to completely
strain-free, uniform-structure materials. A study on through-thickness
characterization of plastic zones in annealed (strain-free) silicon-iron is
underway.
44
References
i. R.N. Wright and A.S. Argon, MetallurgicalTransactions,(Vol. I) 1970p.3065.
2. C.E. Richards,Acta Metallurgiea,(Vol. 19) 1971, p. 583.
3. G.T. Hahn, R.G. Hoagland and A.R. Rosenfield,MetallurgicalTransactions, Vol. 3. 1972, p. 1189.
4. D.L. Davldson and J. Lankford, Journal of Engineering Materials and
Technology, 98, 1976, p. 24.
5. K. Tanaka, M. HoJo and Y. Nakai, Materials Science and Engineering,
55, 1982, p. 85.
6. A. Chudnovsky, NASA Report, December 1983.
7. C. Bathias and R.M. Pelloux, Metallurgical Transactions, 4, 1973, p.
1265.
8. A. Pineau and R.M. Pelloux, Metallurgical Transactions, 5, 1976, p.
1103.
9. A Saxena and S.D. Antolovich, Metallurgical Transactions, 6A, 1975, p.1809.
I0. A.H. Purcell and J. Weertman, Metallurgical Transactions, 5, 1976, p.
1805.
ii. C. Loye, C. Bathias, D. Retali and J.C. Devaoux, ASTM STP 811, 1983,
p. 427.
12. K. Tanaka, M. Hojo, and Y. Nakai, ASTM STP 811, 1983, p. 207.
13. E. Hornbogen, E. Minuth and St. Stanzl, Materials Science and
Engineering, 43, 1980, p. 145.
14. Metals Handbook.
15. H. Mughrabl, Dislocations and Properties of Real Materials, The
. Institute of Metals, London, 1985.
16. M. Klesnil and P. Lukas, Proc. 2nd. Int. Conf. Fracture, (1969), p.
725.
1. Report No. 2. Government Accession No. 3. Recipient's Catalog No.
NASACR-1751154. Title and Subtitle 5. Report Date
FatigueCrack Layer PropagationIn Slllcon-Iron May 19866. Performing Organization Code
7. Author(s) 8. Performing Organization Report No.
Y. Birol, G. Welsch, and A. Chudnovsky None10. Work Unit No.
9. Performing Organization Name and Address11. Contract or Grant No.
Case Western Reserve University NAG3-223Cleveland, 0hie 44106
13. Type of Report and Period Covered
12. Sponsoring Agency Name and Address Contractor Report
Natl anal Aeronauti cs and Space Admlnl stratl on 14Sponsoring Agency CodeWashington, D.C. 20546
505-63-81
15. Supplementary Notes
Final report. Project Managers, Bernard Gross and Anthony R. Calamine,Structures Division, NASALewis Research Center, Cleveland, 0hie 44135.
_16.Abstract
Fatigue crack propagation in metal is almost always accompanied by plasticdeformation unless conditions strongly favor brittle fracture. The analysis ofthe plastic zone Is crucial to the understanding of crack propagation behavioras it governs the crack growth kinetics. This research was undertaken to studythe fatigue crack propagation in a silicon iron alloy. Kinetic and plasticityaspects of fatigue crack propagation in the alloy were obtained, including thecharacterization of damageevolution.
17. Key Words (Suggested by Author(s)) 18. Distribution Statement
Cracks Unclassified- unlimitedFatiguecrack propagation STAR Category39
19. Security Classlf. (of this report) 20. Security Classlf. (of this page) 21. No. of pages 22. Price °
Unclassified Unclassified 46 A03
*For sale by the National Technical Information Service, Springfield, Virginia 22161

, a,,ona,Ae onau,,csan,,CON0CL.,,M.,.IllltlSpaceAdministralion ___
Lewis ResearchCenter ADDRESSCORRECTIONREQUESTEDCleveland. Ohio 44135
Official Business
Penaltyfor Private Use $300 Postage and Fees Pa!dNationalAeronauticsandSpace Admin=strat=onNASA-451
NASA Langley Research CtrAttn: LibraryMS-185Hampton, VA 23665
NASA