Embed Size (px)
Citation preview
Mechanics and Mechanical Engineering
Vol. 22, No. 4 (2018) 1453–1462
© Lodz University of Technology
Fatigue Crack Growth Rate, Microstructure and MechanicalProperties of Diverse Range of Aluminum Alloy:
A Comparison
Abdessamad BrahamiBenattou Bouchouicha
Mokhtar Zemri
Laboratoire de Materiau et des Systemes ReactifsDjilali Liabes University of Sidi Bel Abbes
Jamal Fajoui
Institut de recherche en genie civil et mecaniqueIUT de Saint-Nazaire GeM
France
Received (29 June 2018)
Revised (12 July 2018)
Accepted (25 August 2018)
In practice for all metallic materials, damage by fatigue usually takes in two steps, theappearance of an initial crack which then grows as a function of the present microstruc-ture. The objective of this study is to identify the elements influencing the fatigue crackgrowth rate on aluminum alloys of different microstructures. Characterization tests andmicrostructural analysis on 2024-T3, 5083-H22, 6082-T6 and 7075-T6 shades have beencarried out. Based on the experimental results obtained, AA7075-T6 has the best fa-tigue crack rate resistance which is explained by its behavior as well as the nature anddispersive distribution of the secondary element.
Keywords: aluminum alloy, fatigue crack growth, mechanical properties, microstructure,precipitation.
1. Introduction
The mechanical strength of pure aluminum is relatively weak which prevents its usefor some applications. The mechanical strength of aluminum can be remarkablyincreased by the addition other elements, thus forming alloys [1-3].
To optimize the static properties and damage tolerance of aluminum, elementssuch as copper, zirconium, magnesium, lithium, manganese or even silver are added.During thermo-mechanical treatments, these added elements can form insoluble
1454 Brahami, A., Bouchouicha, B., Zemri, M. and Fajoui, J.
dispersants which play a key role in the control of recrystallization, or fine pre-cipitates inducing structural hardening which increases the static properties of themetal [4–7].
One of the most important axes for optimizing the performance of these mate-rials is mechanical fatigue characterization, which is the main cause for the occur-rence of defects [8-9]. It is therefore necessary to take this fatigue phenomenoninto account in order to guarantee the reliability and safety of a component rightfrom the design stage. From the experimental point of view, the principle is to putthe test specimens under specific and known conditions in order to determine thelifetime of the material. However, fatigue tests are time consuming and costly.
Several research studies have been conducted on the influence of the microstruc-ture [10-11], the stress ratio [12] and the mean stress [13] on the fatigue crack growthrate of aluminum alloys.
In the present work, the various factors, the microstructure, the nature of preci-pitates and the mechanical properties influencing the fatigue behavior of the variousaluminum alloys (2024-T6, 5083-H22, 6082-T6 et 7075-T6) are studied through me-chanical characterization tests and microstructural analysis. A particular study onthe influence of the nature and distribution of different precipitates of each shade onthe crack growth rate has been be carried out. These precipitates and their chemi-cal compositions will be subsequently determined using firstly a Scanning ElectronMicroscope (SEM) and secondly the Energy Dispersive Spectroscopy (EDS).
2. Experimental procedure
This study is divided into two main parts: 1) a mechanical characterization basedon tensile tests, microhardness and fatigue crack growth to correctly identify thelaws of behavior governing the lifetime of the materials used, and 2) a microstruc-tural analysis to locate and identify the precipitates of the different phases by EDSdispersive energy spectroscopy.
2.1. Materials
The materials used in this study are 2024-T3, 5083-H22, 6082-T6 and 7075-T6 alu-minum alloys with a sheet thickness of 4 mm. Table 1 gives the chemical compositionof these alloys as determined by EDS method.
Table 1 Typical chemical composition of the aluminum alloys (% weight)
Element (%)Aluminum Si Mg Fe Cu Mn Cr Zn Ti Al6082-T6 1,59 1,29 1.04 0,41 0.68 0,14 0,31 0,21 BAL.7075-T6 0.51 2.71 0.23 1.65 0.29 0.31 4.48 0.22 BAL.2024-T3 0.06 1.57 0.17 4.45 0.56 0.1 0.16 0.15 BAL.5083-H22 0.57 1.38 0.64 0.42 1.19 0.05 0.01 0.04 BAL.
Fatigue Crack Growth Rate, Microstructure and Mechanical ... 1455
2.2. Testing procedure
2.2.1. Tensile test
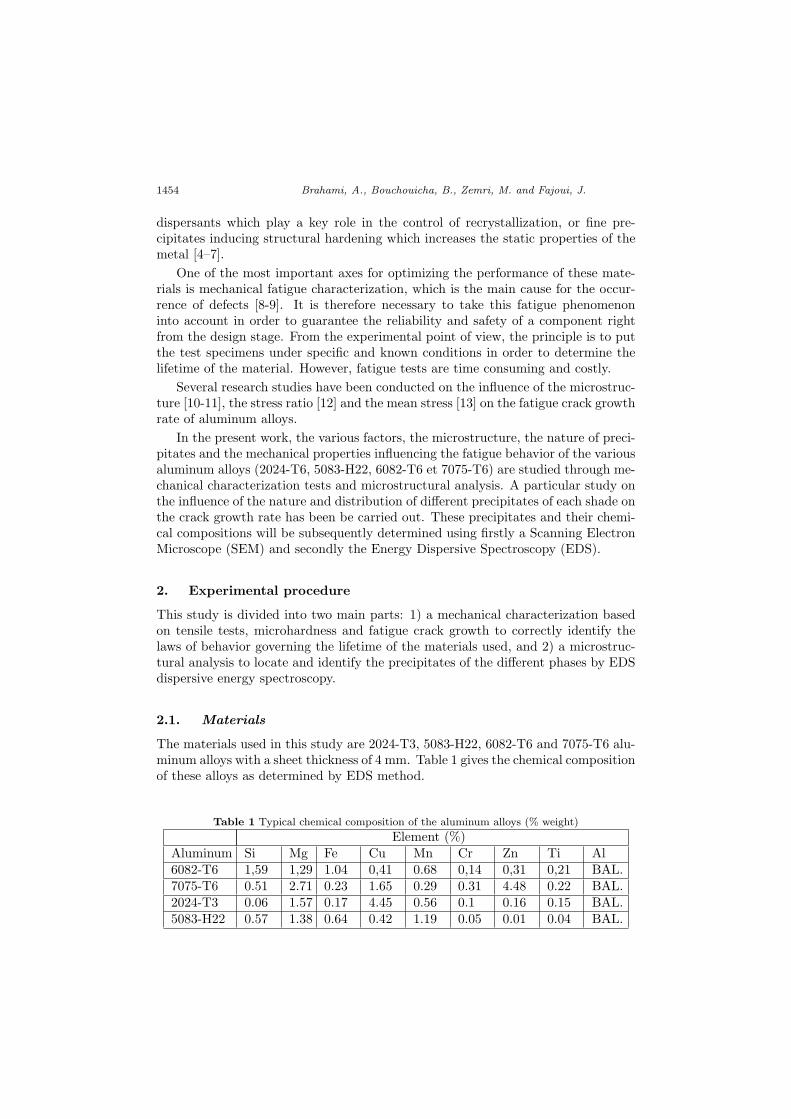
Monotonic tensile tests were performed on an INSTRON 8516 testing machine to de-termine the mechanical properties of the materials. The tests were performed usingstandard rectangular tension specimens according to ASTM E8 [14] with a movingcrosshead speed set at 1 mm/min, at room temperature and in air-laboratory. Thedimensions of the specimen are given in Figure 1.
Figure 1 Tensile test specimen
Microhardness test The microhardness was measured using standard Vickerson a SHIMADZU HMV-2000 microhardness tester, using 1000 g load for 10 s. Anaverage of five readings was recorded. The microhardness tests were performed ona 20 mm by 20 mm coupons.
Microstructure observation All samples for microstructure observation werecut from different materials with a dimension of 10 mm by 10 mm. For microstruc-ture observation, the samples were polished by 1400abrasive paper. Qunata 250field emission scanning electron microscopy (FE-SEM) with an EDS was used toobserve the evolution of the microstructure and to perform analysis in order to de-termine chemical composition for the materials and then identify the precipitatesof each grade as well as its chemical composition.
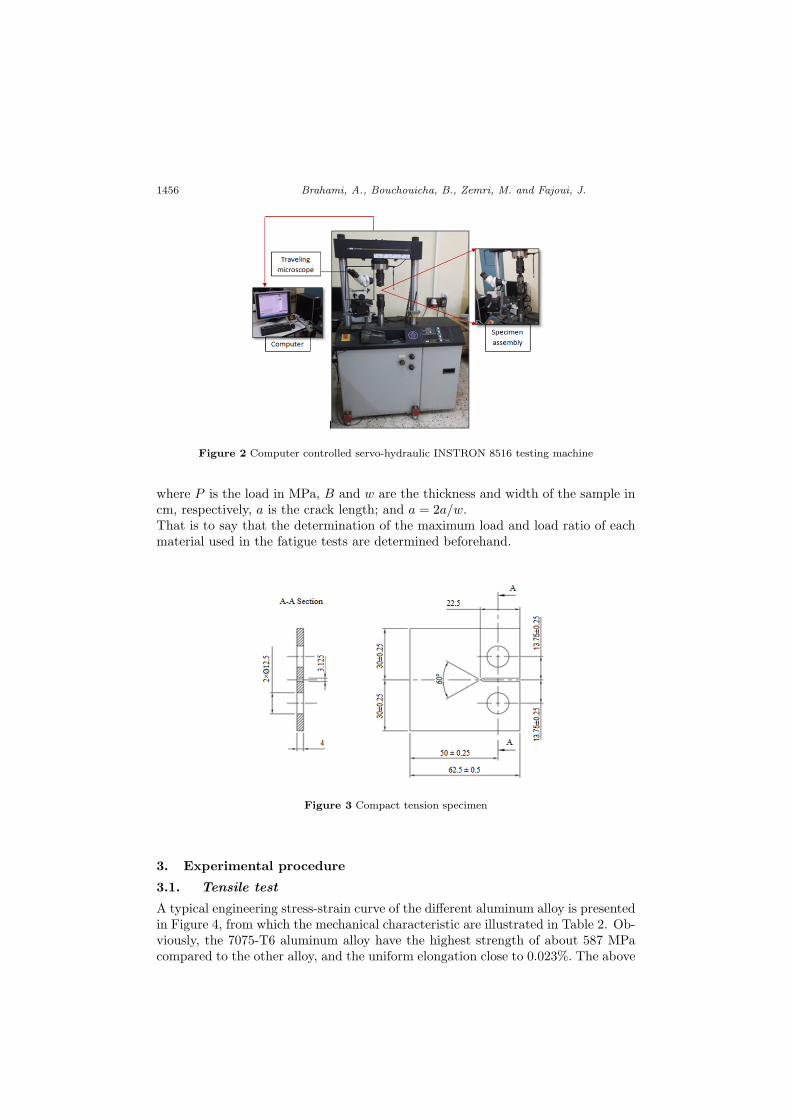
Fatigue test All fatigue experiments were carried out under constant loadamplitude, at room temperature and on a computer controlled servo-hydraulic IN-STRON 8516 testing machine presented in Figure 2, following the ASTM E647-00standard [15].
Crack propagation was monitored through visual measurements using a travellingmicroscope. The 50mm wide compact tension (CT) specimens were tested for a20Hz load frequency. Figure 5 illustrates the geometry and dimensions of the testedspecimens. The following equation was used to determine the stress intensity factor:
∆k =∆P
B
√πa
2wsec
πa
2(1)
1456 Brahami, A., Bouchouicha, B., Zemri, M. and Fajoui, J.
Figure 2 Computer controlled servo-hydraulic INSTRON 8516 testing machine
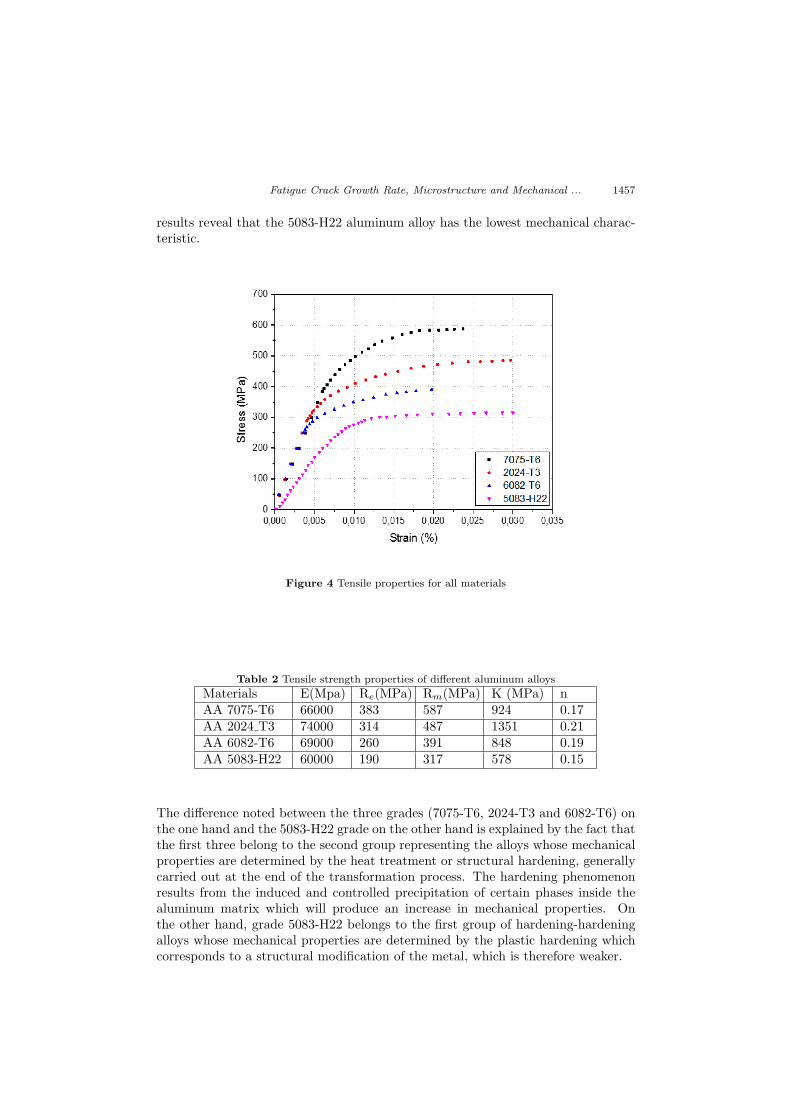
where P is the load in MPa, B and w are the thickness and width of the sample incm, respectively, a is the crack length; and a = 2a/w.That is to say that the determination of the maximum load and load ratio of eachmaterial used in the fatigue tests are determined beforehand.
Figure 3 Compact tension specimen
3. Experimental procedure
3.1. Tensile test
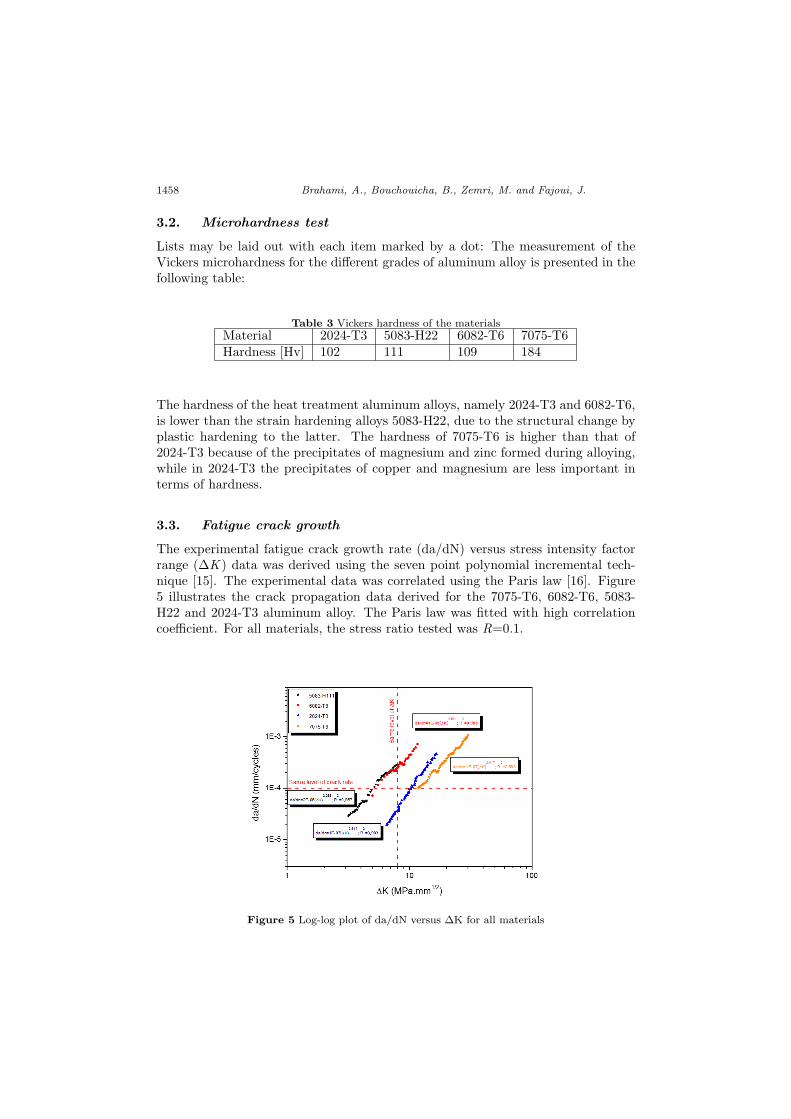
A typical engineering stress-strain curve of the different aluminum alloy is presentedin Figure 4, from which the mechanical characteristic are illustrated in Table 2. Ob-viously, the 7075-T6 aluminum alloy have the highest strength of about 587 MPacompared to the other alloy, and the uniform elongation close to 0.023%. The above
Fatigue Crack Growth Rate, Microstructure and Mechanical ... 1457
results reveal that the 5083-H22 aluminum alloy has the lowest mechanical charac-teristic.
Figure 4 Tensile properties for all materials
Table 2 Tensile strength properties of different aluminum alloys
Materials E(Mpa) Re(MPa) Rm(MPa) K (MPa) nAA 7075-T6 66000 383 587 924 0.17AA 2024 T3 74000 314 487 1351 0.21AA 6082-T6 69000 260 391 848 0.19AA 5083-H22 60000 190 317 578 0.15
The difference noted between the three grades (7075-T6, 2024-T3 and 6082-T6) onthe one hand and the 5083-H22 grade on the other hand is explained by the fact thatthe first three belong to the second group representing the alloys whose mechanicalproperties are determined by the heat treatment or structural hardening, generallycarried out at the end of the transformation process. The hardening phenomenonresults from the induced and controlled precipitation of certain phases inside thealuminum matrix which will produce an increase in mechanical properties. Onthe other hand, grade 5083-H22 belongs to the first group of hardening-hardeningalloys whose mechanical properties are determined by the plastic hardening whichcorresponds to a structural modification of the metal, which is therefore weaker.
1458 Brahami, A., Bouchouicha, B., Zemri, M. and Fajoui, J.
3.2. Microhardness test
Lists may be laid out with each item marked by a dot: The measurement of theVickers microhardness for the different grades of aluminum alloy is presented in thefollowing table:
Table 3 Vickers hardness of the materialsMaterial 2024-T3 5083-H22 6082-T6 7075-T6Hardness [Hv] 102 111 109 184
The hardness of the heat treatment aluminum alloys, namely 2024-T3 and 6082-T6,is lower than the strain hardening alloys 5083-H22, due to the structural change byplastic hardening to the latter. The hardness of 7075-T6 is higher than that of2024-T3 because of the precipitates of magnesium and zinc formed during alloying,while in 2024-T3 the precipitates of copper and magnesium are less important interms of hardness.
3.3. Fatigue crack growth
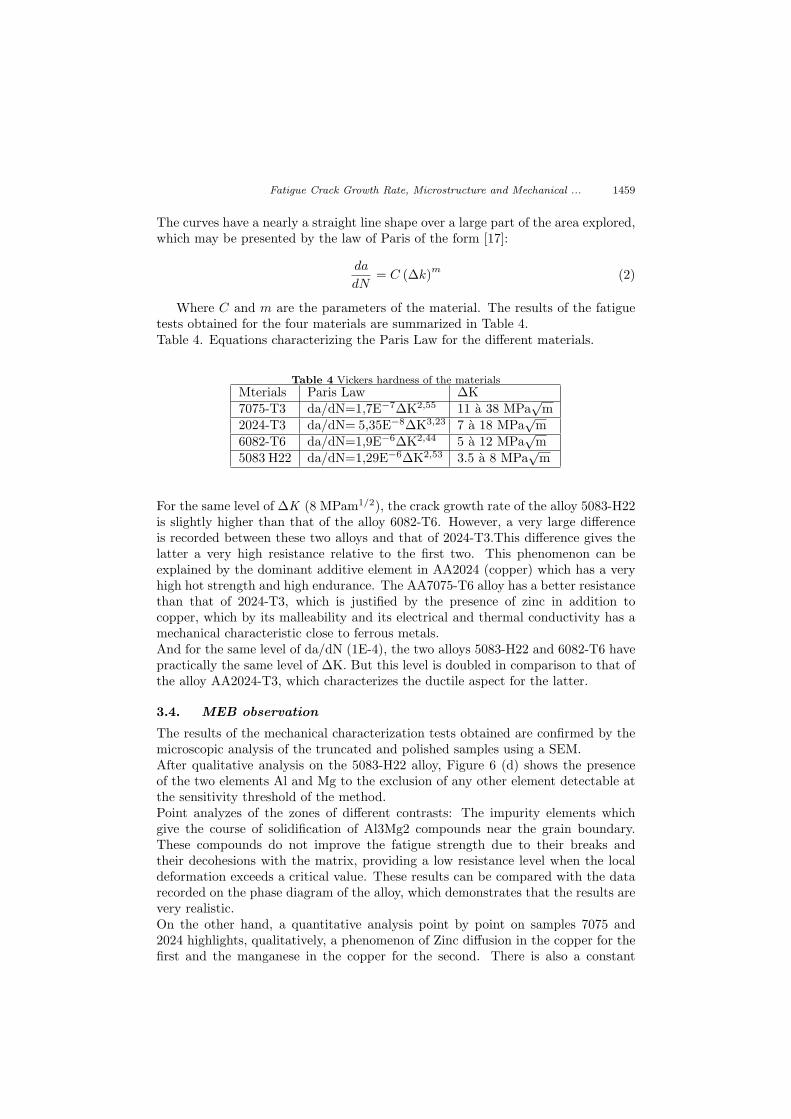
The experimental fatigue crack growth rate (da/dN) versus stress intensity factorrange (∆K ) data was derived using the seven point polynomial incremental tech-nique [15]. The experimental data was correlated using the Paris law [16]. Figure5 illustrates the crack propagation data derived for the 7075-T6, 6082-T6, 5083-H22 and 2024-T3 aluminum alloy. The Paris law was fitted with high correlationcoefficient. For all materials, the stress ratio tested was R=0.1.
Figure 5 Log-log plot of da/dN versus ∆K for all materials
Fatigue Crack Growth Rate, Microstructure and Mechanical ... 1459
The curves have a nearly a straight line shape over a large part of the area explored,which may be presented by the law of Paris of the form [17]:
da
dN= C (∆k)
m(2)
Where C and m are the parameters of the material. The results of the fatiguetests obtained for the four materials are summarized in Table 4.Table 4. Equations characterizing the Paris Law for the different materials.
Table 4 Vickers hardness of the materialsMterials Paris Law ∆K7075-T3 da/dN=1,7E−7∆K2,55 11 a 38 MPa
√m
2024-T3 da/dN= 5,35E−8∆K3,23 7 a 18 MPa√m
6082-T6 da/dN=1,9E−6∆K2,44 5 a 12 MPa√m
5083 H22 da/dN=1,29E−6∆K2,53 3.5 a 8 MPa√m
For the same level of ∆K (8 MPam1/2), the crack growth rate of the alloy 5083-H22is slightly higher than that of the alloy 6082-T6. However, a very large differenceis recorded between these two alloys and that of 2024-T3.This difference gives thelatter a very high resistance relative to the first two. This phenomenon can beexplained by the dominant additive element in AA2024 (copper) which has a veryhigh hot strength and high endurance. The AA7075-T6 alloy has a better resistancethan that of 2024-T3, which is justified by the presence of zinc in addition tocopper, which by its malleability and its electrical and thermal conductivity has amechanical characteristic close to ferrous metals.And for the same level of da/dN (1E-4), the two alloys 5083-H22 and 6082-T6 havepractically the same level of ∆K. But this level is doubled in comparison to that ofthe alloy AA2024-T3, which characterizes the ductile aspect for the latter.
3.4. MEB observation
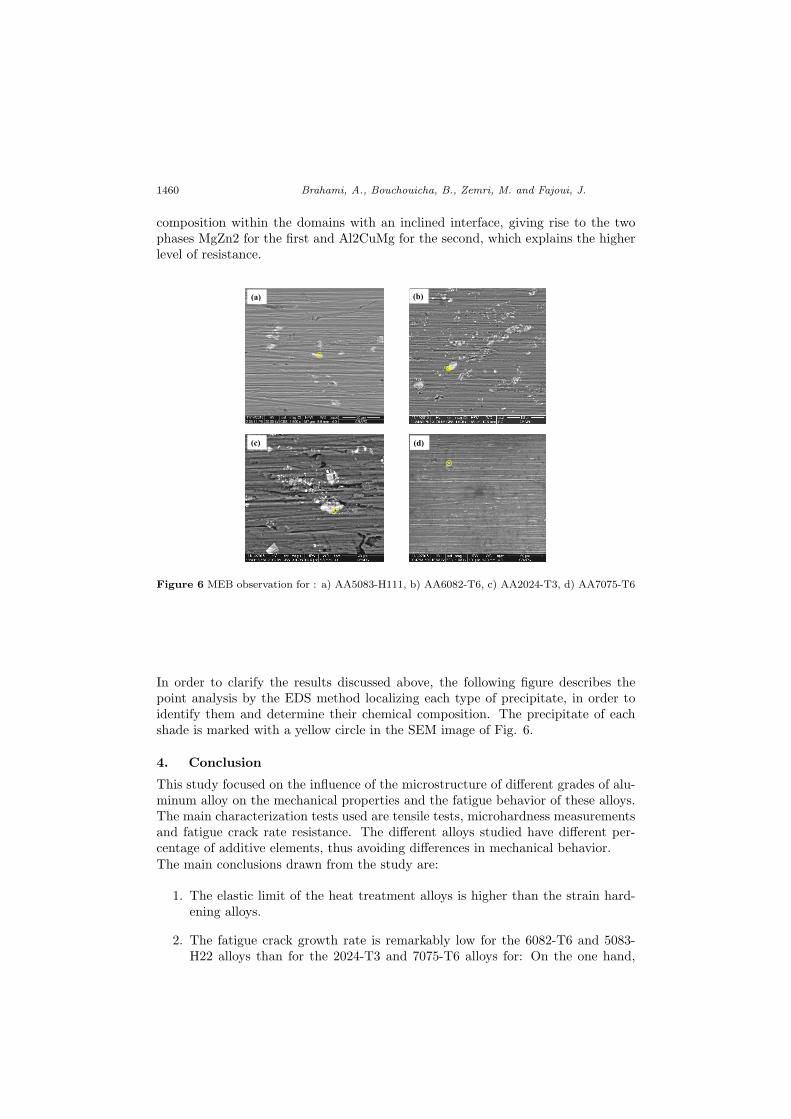
The results of the mechanical characterization tests obtained are confirmed by themicroscopic analysis of the truncated and polished samples using a SEM.After qualitative analysis on the 5083-H22 alloy, Figure 6 (d) shows the presenceof the two elements Al and Mg to the exclusion of any other element detectable atthe sensitivity threshold of the method.Point analyzes of the zones of different contrasts: The impurity elements whichgive the course of solidification of Al3Mg2 compounds near the grain boundary.These compounds do not improve the fatigue strength due to their breaks andtheir decohesions with the matrix, providing a low resistance level when the localdeformation exceeds a critical value. These results can be compared with the datarecorded on the phase diagram of the alloy, which demonstrates that the results arevery realistic.On the other hand, a quantitative analysis point by point on samples 7075 and2024 highlights, qualitatively, a phenomenon of Zinc diffusion in the copper for thefirst and the manganese in the copper for the second. There is also a constant
1460 Brahami, A., Bouchouicha, B., Zemri, M. and Fajoui, J.
composition within the domains with an inclined interface, giving rise to the twophases MgZn2 for the first and Al2CuMg for the second, which explains the higherlevel of resistance.
(a) (b)
(c) (d)
Figure 6 MEB observation for : a) AA5083-H111, b) AA6082-T6, c) AA2024-T3, d) AA7075-T6
In order to clarify the results discussed above, the following figure describes thepoint analysis by the EDS method localizing each type of precipitate, in order toidentify them and determine their chemical composition. The precipitate of eachshade is marked with a yellow circle in the SEM image of Fig. 6.
4. Conclusion
This study focused on the influence of the microstructure of different grades of alu-minum alloy on the mechanical properties and the fatigue behavior of these alloys.The main characterization tests used are tensile tests, microhardness measurementsand fatigue crack rate resistance. The different alloys studied have different per-centage of additive elements, thus avoiding differences in mechanical behavior.The main conclusions drawn from the study are:
1. The elastic limit of the heat treatment alloys is higher than the strain hard-ening alloys.
2. The fatigue crack growth rate is remarkably low for the 6082-T6 and 5083-H22 alloys than for the 2024-T3 and 7075-T6 alloys for: On the one hand,
Fatigue Crack Growth Rate, Microstructure and Mechanical ... 1461
(a) (b)
(d)(c)
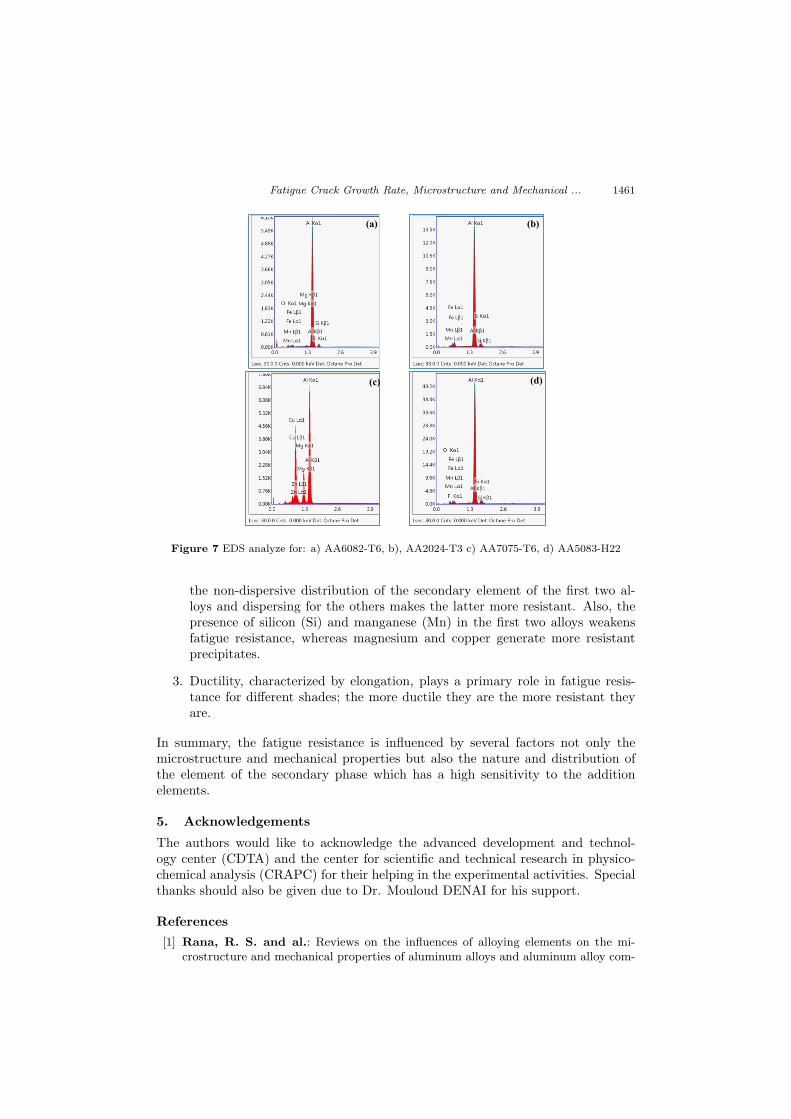
Figure 7 EDS analyze for: a) AA6082-T6, b), AA2024-T3 c) AA7075-T6, d) AA5083-H22
the non-dispersive distribution of the secondary element of the first two al-loys and dispersing for the others makes the latter more resistant. Also, thepresence of silicon (Si) and manganese (Mn) in the first two alloys weakensfatigue resistance, whereas magnesium and copper generate more resistantprecipitates.
3. Ductility, characterized by elongation, plays a primary role in fatigue resis-tance for different shades; the more ductile they are the more resistant theyare.
In summary, the fatigue resistance is influenced by several factors not only themicrostructure and mechanical properties but also the nature and distribution ofthe element of the secondary phase which has a high sensitivity to the additionelements.
5. Acknowledgements
The authors would like to acknowledge the advanced development and technol-ogy center (CDTA) and the center for scientific and technical research in physico-chemical analysis (CRAPC) for their helping in the experimental activities. Specialthanks should also be given due to Dr. Mouloud DENAI for his support.
References
[1] Rana, R. S. and al.: Reviews on the influences of alloying elements on the mi-crostructure and mechanical properties of aluminum alloys and aluminum alloy com-
1462 Brahami, A., Bouchouicha, B., Zemri, M. and Fajoui, J.
posites. International Journal of Scientific and Research Publications, Volume 2, Issue6, June 2012 .
[2] Medrano-Prietoa, H. M.: Evolution of Microstructure in Al-Si-Cu System Modi-fied with a Transition Element Addition and its Effect on Hardness, Mat. Res., 19, 1,2016.
[3] Xing Zhang, and al.: Influence of Alloying Element Addition on Cu–Al–Ni High-Temperature Shape Memory Alloy without Second Phase Formation, Acta Metallur-gica Sinica, 29, 3, 2016.
[4] Samuel, A. M.: Role of Zr and Sc addition in controlling the microstructure andtensile properties of aluminum–copper based alloys, Materials and Design, 88, 1134–1144, 2015.
[5] Fanghua Shen and Al.: Effects of secondary particle-induced recrystallization onfatigue crack growth in AA2524/AlCuMg T3 alloy sheets, Journal of Alloys and Com-pounds, 685, 571–580, 2016.
[6] Pawlowski, A., Zieba, P.: Diffusional penetration during diffusion-induced grain-boundary migration process in an Al-Zn couple, 1993.
[7] Hillert, M.: Met. Trans., 3, 2729, 1972.
[8] Anderson, T. L.: Fracture Mechanics: Fundamentals and Applications, 3rd ed. CRCPress, Boca Raton, 2004.
[9] Sih, G. C., Wei, R. P., Erdogan, F.: Linear Fracture Mechanics: Historical De-velopments and Applications of Linear Fracture Mechanics, Lehigh University EnvoPublisher, Pennsylvania, 1975.
[10] Li, M.: Microstructure dependent fatigue crack growth in Al–Mg–Sc alloy, MaterialsScience & Engineering, 142–151, 2014.
[11] Sun, Y. P., Yan, H. H. Chen, G. Z.: Microstructure and mechanical propertiesof Al–Zn–Mg–Cu/SiC composite after heat treatment. Met Sci Heat Treat, 51, 394,2009.
[12] Tang, K. K.: Fatigue crack growth in the micro to large scale of 7075-T6 Al sheetsat different R ratios. Theoretical and Applied Fracture Mechanics 83 (2016 ) 93–104.
[13] Maddox, S. J.: The effect of mean stress on fatigue crack propagation a literaturereview, international Journal of Fracture, 11, 3, 389–408, 1975.
[14] ASTM Standard E8-04: Standard Test Methods for Tension Testing of Metallic Ma-terials, Part 03.01, Metals Mechanical Testing Elevated and Low-Temperature TestsMetallographic.
[15] ASTM Standard E647-00: Standard Test Method for Measurement of Fatigue CrackGrowth, Part 03.01, Metals Mechanical Testing Elevated and Low-Temperature TestsMetallographic.
[16] Paris, P.C. and Erdogan, F.: A critical analysis of crack propagation laws, Trans-actions of The ASME, Series E: Journal of Basic Engineering, 85, 528–534, 1963.