Embed Size (px)
Citation preview
Fatigue Crack Growth Mechanisms for Nickel-based Superalloy Haynes 282 at 550-750° C
Rozman, K. A., Kruzic, J. J., Sears, J. S., & Hawk, J. A. (2015). Fatigue Crack Growth Mechanisms for Nickel-based Superalloy Haynes 282 at 550-750° C. Journal of Materials Engineering and Performance, 24(10), 3699-3707. doi:10.1007/s11665-015-1678-8
10.1007/s11665-015-1678-8
Springer
Version of Record
http://cdss.library.oregonstate.edu/sa-termsofuse
Fatigue Crack Growth Mechanisms for Nickel-basedSuperalloy Haynes 282 at 550-750 �C
Kyle A. Rozman, Jamie J. Kruzic, John S. Sears, and Jeffrey A. Hawk
(Submitted August 6, 2015; published online August 29, 2015)
The fatigue crack growth rates for nickel-based superalloyHaynes 282weremeasured at 550, 650, and 750 �Cusing compact tension specimens with a load ratio of 0.1 and cyclic loading frequencies of 25 and 0.25 Hz. Thecrack path was observed to be primarily transgranular for all temperatures, and the observed effect ofincreasing temperature was to increase the fatigue crack growth rates. The activation energy associated withthe increasing crack growth rates over these three temperatures was calculated less than 60 kJ/mol, which issignificantly lower than typical creep or oxidationmechanisms; therefore, creep and oxidation cannot explainthe increase in fatigue crack growth rates. Transmission electron microscopy was done on selected samplesremoved from the cyclic plastic zone, and a trend of decreasing dislocation density was observed withincreasing temperature. Accordingly, the trend of increasing crack growth rates with increasing temperaturewas attributed to softening associated with thermally assisted cross slip and dislocation annihilation.
Keywords electron microscopy, fatigue, mechanical characteri-zation, nickel-based superalloys
1. Introduction
With service conditions of the next generation advanced ultra-supercritical (A-USC) steam turbines calling for 100,000 hlifetimes in steam environments where temperatures and pressuresare in excess of 760 �C and 35 MPa (Ref 1), it is imperative toinvestigate fatigue failure mechanisms for potential rotor alloys.Especially important is the effect of creep on fatigue crack growth.At high temperatures (T> 0.3 Tmelt), thermally activated, time-dependent, mechanisms may influence mechanical properties.With amelting range around 1300 �C for nickel-based superalloystargeted for A-USC turbine rotors, service conditions call forhomologous temperatures up to T/Tmelt� 0.66. In A-USC turbineapplications, time-dependent visco-plastic creep damage andoxidation damage are both significant concerns. Creep may affectthe fatigue crack growth mechanism in three ways: (i) microstruc-tural changes (i.e., precipitate coarsening, chemical diffusion), (ii)stress relaxation (i.e., diffusion enhanced dislocation motion), and(iii) creep crack growth (i.e., nucleation and coalescence ofvacancies ahead of a growing crack). Similarly, oxidation mayaffect the fatigue crack growth via mechanisms such as stress-assisted grain boundary oxidation or embrittlement (Ref 2). Eithersituationmay lead to the localmicrostructure ahead of the crack tip
changing during exposure at A-USC temperatures and pressures,potentially changing the fatigue crack propagation behavior.
Previously, Rozman et al. (Ref 3) reported on the fatigue crackgrowth rate (da/dN) behavior of nickel-based superalloy Haynes282, which is a candidate alloy for use in A-USC steam turbines. Itwas found that when temperature was increased from 550 to 750 �Cda/dN increased by �20 to 60% dependent on applied stressintensity level. While the fracture surfaces showed transgranularcrack growth, at 750 �C, therewere occasional local excursions ontoan intergranular crack path, especially at 0.25 Hz. The purpose of thepresent paper is to combine new TEM results with an analysis of theactivation energy to better understand the possible thermallyactivated mechanisms that may be responsible for the enhancedfatigue growth rates seen inHaynes 282with increasing temperature.
2. Materials and Method
2.1 Material
Table 1 shows the nominal chemical composition forHaynes 282 (Ref 4, 5). A rolled plate of Haynes 282 was
Kyle A. Rozman, ORISE, National Energy Technology Laboratory,1450 Queen Avenue S.W., Albany, OR 97321; Jamie J. Kruzic,Materials Science, School of Mechanical, Industrial, andManufacturing Engineering, Oregon State University, Corvallis, OR97331; John S. Sears, AECOM, National Energy TechnologyLaboratory, 1450 Queen Avenue SW, Albany, OR 97321 andNational Energy Technology Laboratory, 1450 Queen Avenue S.W.,Albany, OR 97321; and Jeffrey A. Hawk, National EnergyTechnology Laboratory, 1450 Queen Avenue S.W., Albany, OR97321. Contact e-mail: [email protected].
Symbols
DK Stress intensity range
R Load ratio
da/dN Fatigue crack growth rate
kFCP f (a) A term containing all non-temperature-dependent terms
related to fracture mechanics (i.e., stress intensity range,
load ratio, yield strength, crack length, etc.)
Q Apparent activation energy
Rg Universal gas constant
T Temperature
N Normalization factor
W Compact tension specimen width
B Compact tension specimen thickness
F Frequency
JMEPEG (2015) 24:3699–3707 �ASM InternationalDOI: 10.1007/s11665-015-1678-8 1059-9495/$19.00
Journal of Materials Engineering and Performance Volume 24(10) October 2015—3699
obtained from Haynes International in the solution annealedcondition with dimensions 333 mm9 254 mm9 35 mm, andthe actual composition is also shown in Table 1 (Ref 6). Theplate was heat treated in the following manner: (1) solution-izing at> 1175 �C for 1 h, followed by (2) cooling to nearroom temperature, at which point the plate was returned to thefurnace for the precipitation aging sequence. The plate was then(3) aged at 1010 �C for 2 h (commensurate with platethickness) before being air cooled to below 788 �C. It wasthen (4) returned to the furnace at 788 �C for an additional 8 hexposure to fully develop the c¢ precipitates. The plate wasremoved from the furnace and (5) air cooled to roomtemperature. This is the standard heat treatment suggested bythe manufacturer for Haynes 282 in order to develop peaktensile strength.
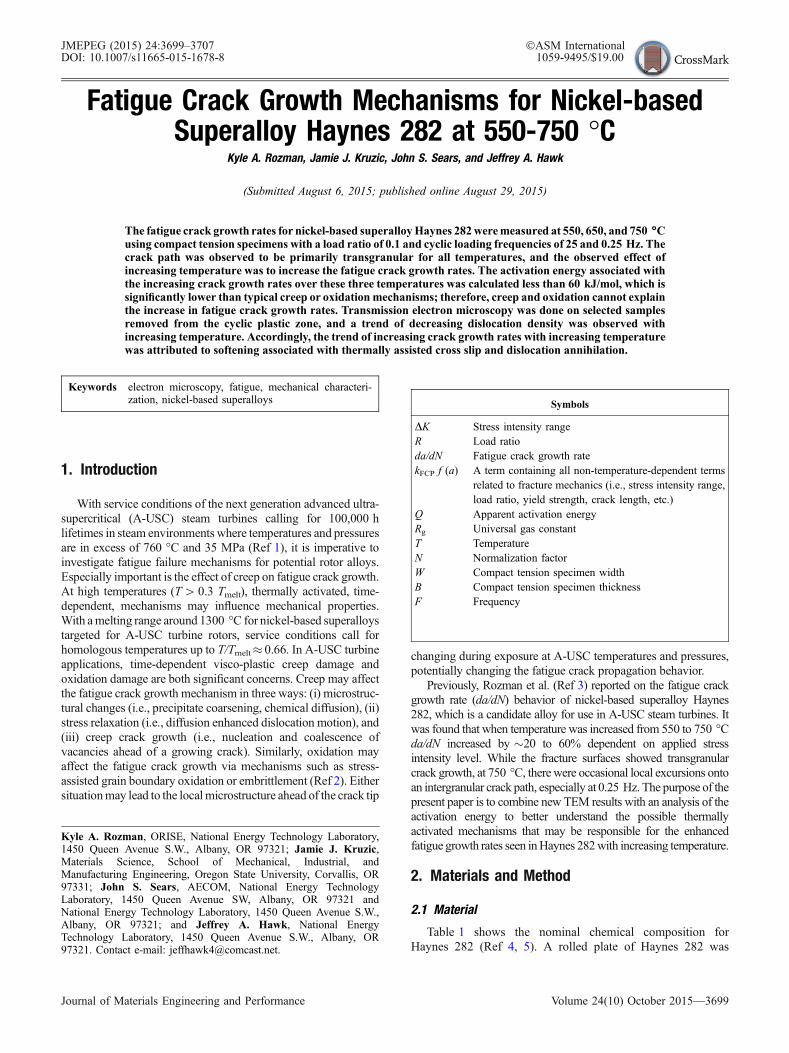
Figure 1 shows the general microstructure of peak-agedHaynes 282 that was tested in this research study. In this figure,diffraction pattern A shows matrix Æ100æ orientation with c¢superlattice reflections as well as reflections from the carbide.In diffraction pattern B, also Æ100æ orientation, the latticematrix reflections and those associated with c¢ are seen. Thepeak-aged microstructure of the plate had an American ASTMgrain size of 4 (�90 lm grain size) (Ref 3). The c¢ precipitateswere observed by TEM to be between �20 and 50 nm indiameter (Ref 3). No secondary or tertiary c¢ precipitates wereseen in the samples tested in this research. Abundant twins areobserved in the peak-aged microstructure with Cr-Mo carbidesof the M23C6-type decorating the twin boundaries and termi-nation points.
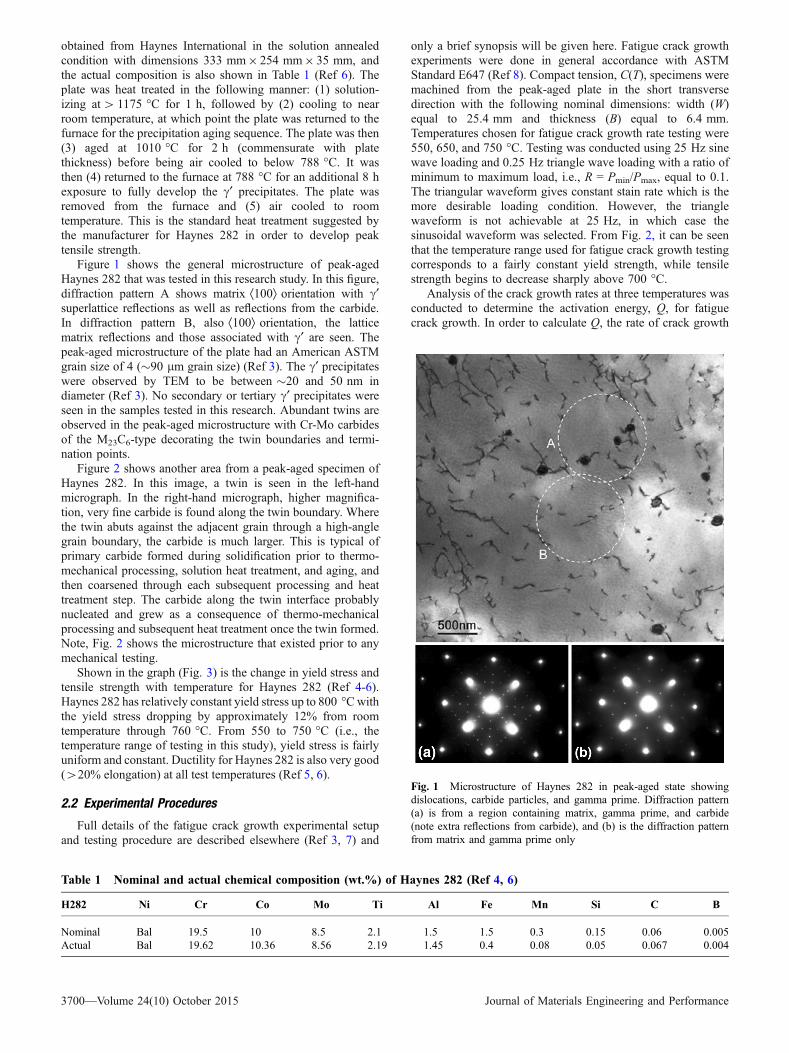
Figure 2 shows another area from a peak-aged specimen ofHaynes 282. In this image, a twin is seen in the left-handmicrograph. In the right-hand micrograph, higher magnifica-tion, very fine carbide is found along the twin boundary. Wherethe twin abuts against the adjacent grain through a high-anglegrain boundary, the carbide is much larger. This is typical ofprimary carbide formed during solidification prior to thermo-mechanical processing, solution heat treatment, and aging, andthen coarsened through each subsequent processing and heattreatment step. The carbide along the twin interface probablynucleated and grew as a consequence of thermo-mechanicalprocessing and subsequent heat treatment once the twin formed.Note, Fig. 2 shows the microstructure that existed prior to anymechanical testing.
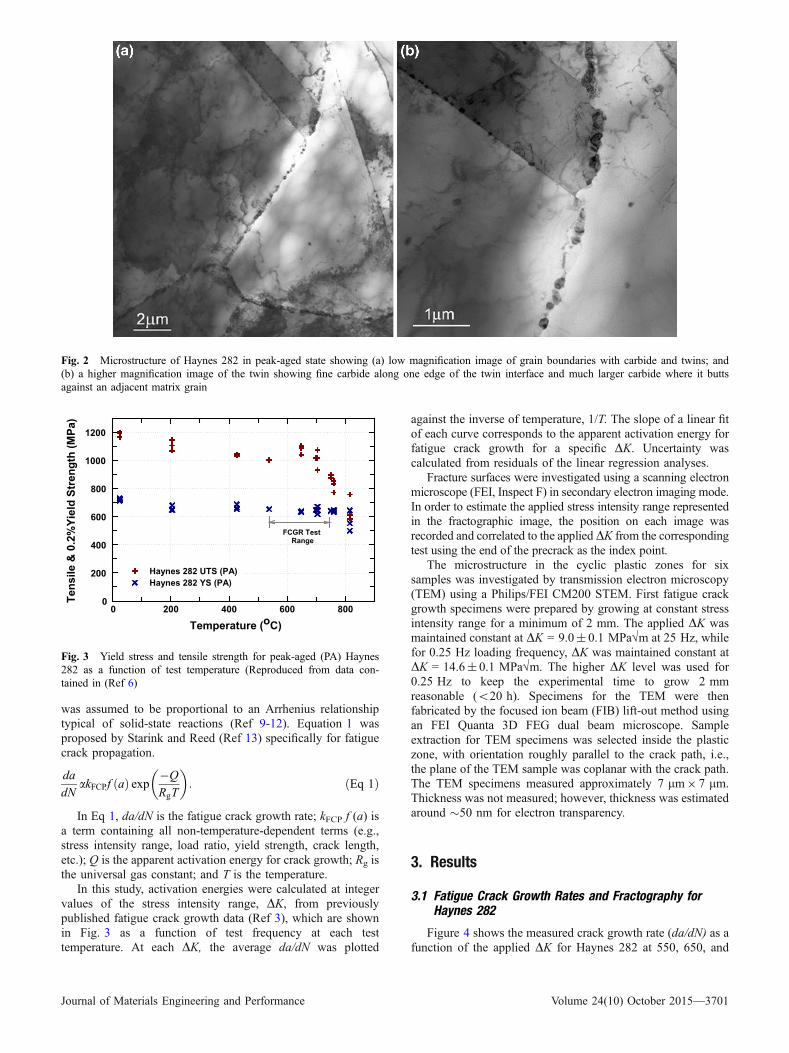
Shown in the graph (Fig. 3) is the change in yield stress andtensile strength with temperature for Haynes 282 (Ref 4-6).Haynes 282 has relatively constant yield stress up to 800 �Cwiththe yield stress dropping by approximately 12% from roomtemperature through 760 �C. From 550 to 750 �C (i.e., thetemperature range of testing in this study), yield stress is fairlyuniform and constant. Ductility for Haynes 282 is also very good(>20% elongation) at all test temperatures (Ref 5, 6).
2.2 Experimental Procedures
Full details of the fatigue crack growth experimental setupand testing procedure are described elsewhere (Ref 3, 7) and
only a brief synopsis will be given here. Fatigue crack growthexperiments were done in general accordance with ASTMStandard E647 (Ref 8). Compact tension, C(T), specimens weremachined from the peak-aged plate in the short transversedirection with the following nominal dimensions: width (W)equal to 25.4 mm and thickness (B) equal to 6.4 mm.Temperatures chosen for fatigue crack growth rate testing were550, 650, and 750 �C. Testing was conducted using 25 Hz sinewave loading and 0.25 Hz triangle wave loading with a ratio ofminimum to maximum load, i.e., R = Pmin/Pmax, equal to 0.1.The triangular waveform gives constant stain rate which is themore desirable loading condition. However, the trianglewaveform is not achievable at 25 Hz, in which case thesinusoidal waveform was selected. From Fig. 2, it can be seenthat the temperature range used for fatigue crack growth testingcorresponds to a fairly constant yield strength, while tensilestrength begins to decrease sharply above 700 �C.
Analysis of the crack growth rates at three temperatures wasconducted to determine the activation energy, Q, for fatiguecrack growth. In order to calculate Q, the rate of crack growth
Table 1 Nominal and actual chemical composition (wt.%) of Haynes 282 (Ref 4, 6)
H282 Ni Cr Co Mo Ti Al Fe Mn Si C B
Nominal Bal 19.5 10 8.5 2.1 1.5 1.5 0.3 0.15 0.06 0.005Actual Bal 19.62 10.36 8.56 2.19 1.45 0.4 0.08 0.05 0.067 0.004
Fig. 1 Microstructure of Haynes 282 in peak-aged state showingdislocations, carbide particles, and gamma prime. Diffraction pattern(a) is from a region containing matrix, gamma prime, and carbide(note extra reflections from carbide), and (b) is the diffraction patternfrom matrix and gamma prime only
3700—Volume 24(10) October 2015 Journal of Materials Engineering and Performance
was assumed to be proportional to an Arrhenius relationshiptypical of solid-state reactions (Ref 9-12). Equation 1 wasproposed by Starink and Reed (Ref 13) specifically for fatiguecrack propagation.
da
dNakFCPf að Þ exp �Q
RgT
� �: ðEq 1Þ
In Eq 1, da/dN is the fatigue crack growth rate; kFCP f (a) isa term containing all non-temperature-dependent terms (e.g.,stress intensity range, load ratio, yield strength, crack length,etc.); Q is the apparent activation energy for crack growth; Rg isthe universal gas constant; and T is the temperature.
In this study, activation energies were calculated at integervalues of the stress intensity range, DK, from previouslypublished fatigue crack growth data (Ref 3), which are shownin Fig. 3 as a function of test frequency at each testtemperature. At each DK, the average da/dN was plotted
against the inverse of temperature, 1/T. The slope of a linear fitof each curve corresponds to the apparent activation energy forfatigue crack growth for a specific DK. Uncertainty wascalculated from residuals of the linear regression analyses.
Fracture surfaces were investigated using a scanning electronmicroscope (FEI, Inspect F) in secondary electron imaging mode.In order to estimate the applied stress intensity range representedin the fractographic image, the position on each image wasrecorded and correlated to the appliedDK from the correspondingtest using the end of the precrack as the index point.
The microstructure in the cyclic plastic zones for sixsamples was investigated by transmission electron microscopy(TEM) using a Philips/FEI CM200 STEM. First fatigue crackgrowth specimens were prepared by growing at constant stressintensity range for a minimum of 2 mm. The applied DK wasmaintained constant at DK = 9.0± 0.1 MPa�m at 25 Hz, whilefor 0.25 Hz loading frequency, DK was maintained constant atDK = 14.6± 0.1 MPa�m. The higher DK level was used for0.25 Hz to keep the experimental time to grow 2 mmreasonable (<20 h). Specimens for the TEM were thenfabricated by the focused ion beam (FIB) lift-out method usingan FEI Quanta 3D FEG dual beam microscope. Sampleextraction for TEM specimens was selected inside the plasticzone, with orientation roughly parallel to the crack path, i.e.,the plane of the TEM sample was coplanar with the crack path.The TEM specimens measured approximately 7 lm9 7 lm.Thickness was not measured; however, thickness was estimatedaround �50 nm for electron transparency.
3. Results
3.1 Fatigue Crack Growth Rates and Fractography forHaynes 282
Figure 4 shows the measured crack growth rate (da/dN) as afunction of the applied DK for Haynes 282 at 550, 650, and
Fig. 2 Microstructure of Haynes 282 in peak-aged state showing (a) low magnification image of grain boundaries with carbide and twins; and(b) a higher magnification image of the twin showing fine carbide along one edge of the twin interface and much larger carbide where it buttsagainst an adjacent matrix grain
Temperature (oC)0 200 400 600 800
Tens
ile &
0.2
%Yi
eld
Stre
ngth
(MPa
)
0
200
400
600
800
1000
1200
Haynes 282 UTS (PA)Haynes 282 YS (PA)
FCGR Test Range
Fig. 3 Yield stress and tensile strength for peak-aged (PA) Haynes282 as a function of test temperature (Reproduced from data con-tained in (Ref 6)
Journal of Materials Engineering and Performance Volume 24(10) October 2015—3701
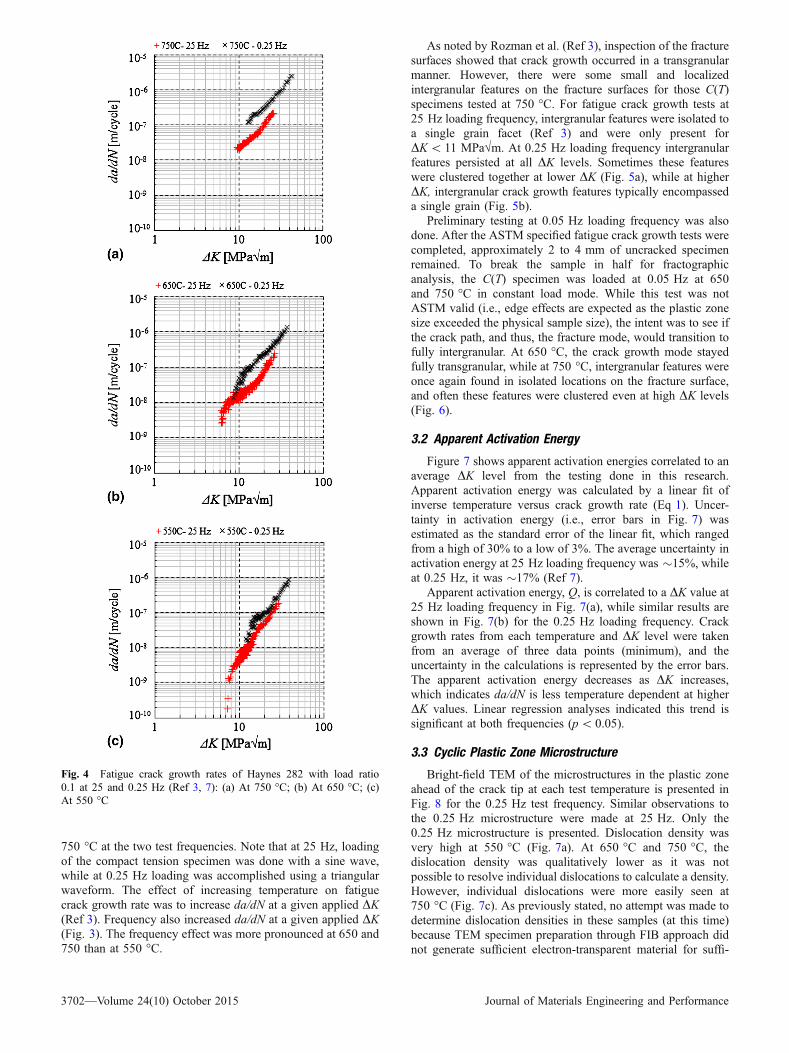
750 �C at the two test frequencies. Note that at 25 Hz, loadingof the compact tension specimen was done with a sine wave,while at 0.25 Hz loading was accomplished using a triangularwaveform. The effect of increasing temperature on fatiguecrack growth rate was to increase da/dN at a given applied DK(Ref 3). Frequency also increased da/dN at a given applied DK(Fig. 3). The frequency effect was more pronounced at 650 and750 than at 550 �C.
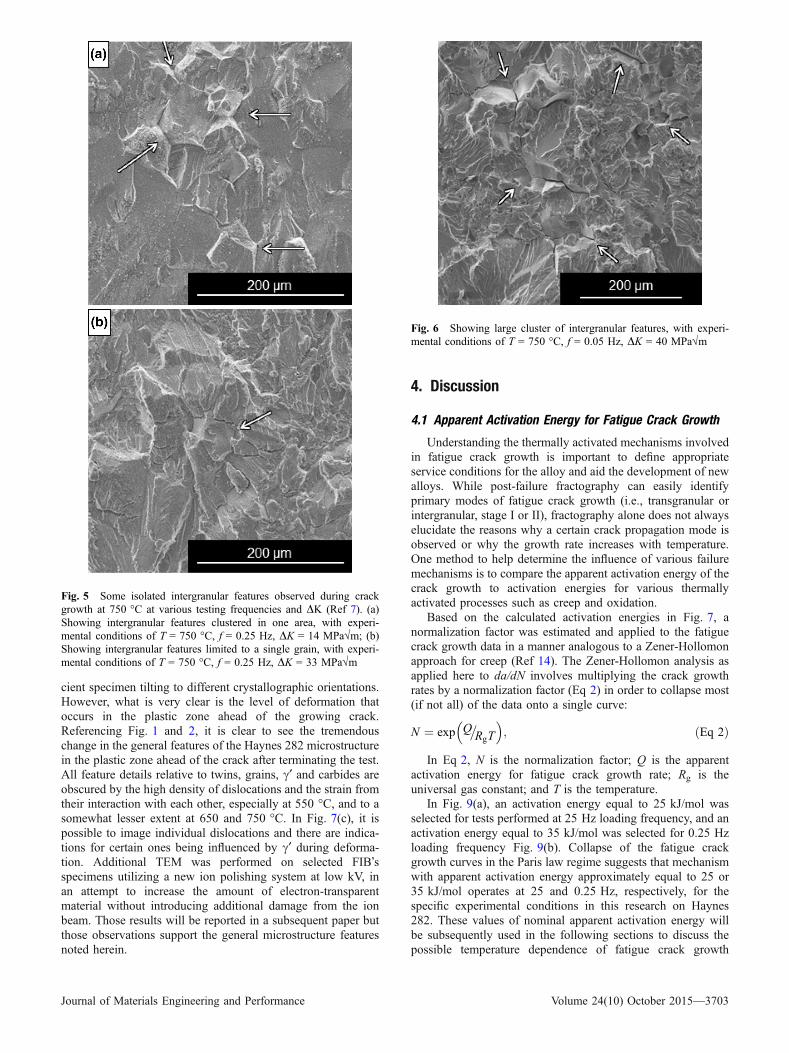
As noted by Rozman et al. (Ref 3), inspection of the fracturesurfaces showed that crack growth occurred in a transgranularmanner. However, there were some small and localizedintergranular features on the fracture surfaces for those C(T)specimens tested at 750 �C. For fatigue crack growth tests at25 Hz loading frequency, intergranular features were isolated toa single grain facet (Ref 3) and were only present forDK< 11 MPa�m. At 0.25 Hz loading frequency intergranularfeatures persisted at all DK levels. Sometimes these featureswere clustered together at lower DK (Fig. 5a), while at higherDK, intergranular crack growth features typically encompasseda single grain (Fig. 5b).
Preliminary testing at 0.05 Hz loading frequency was alsodone. After the ASTM specified fatigue crack growth tests werecompleted, approximately 2 to 4 mm of uncracked specimenremained. To break the sample in half for fractographicanalysis, the C(T) specimen was loaded at 0.05 Hz at 650and 750 �C in constant load mode. While this test was notASTM valid (i.e., edge effects are expected as the plastic zonesize exceeded the physical sample size), the intent was to see ifthe crack path, and thus, the fracture mode, would transition tofully intergranular. At 650 �C, the crack growth mode stayedfully transgranular, while at 750 �C, intergranular features wereonce again found in isolated locations on the fracture surface,and often these features were clustered even at high DK levels(Fig. 6).
3.2 Apparent Activation Energy
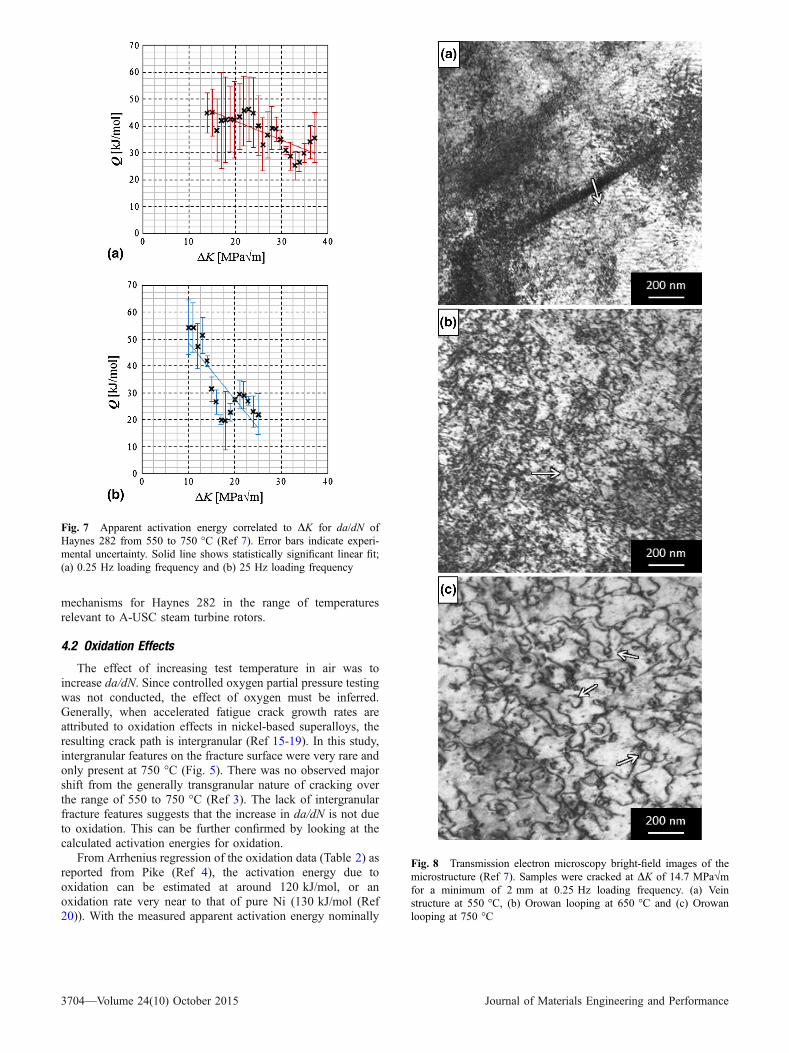
Figure 7 shows apparent activation energies correlated to anaverage DK level from the testing done in this research.Apparent activation energy was calculated by a linear fit ofinverse temperature versus crack growth rate (Eq 1). Uncer-tainty in activation energy (i.e., error bars in Fig. 7) wasestimated as the standard error of the linear fit, which rangedfrom a high of 30% to a low of 3%. The average uncertainty inactivation energy at 25 Hz loading frequency was �15%, whileat 0.25 Hz, it was �17% (Ref 7).
Apparent activation energy, Q, is correlated to a DK value at25 Hz loading frequency in Fig. 7(a), while similar results areshown in Fig. 7(b) for the 0.25 Hz loading frequency. Crackgrowth rates from each temperature and DK level were takenfrom an average of three data points (minimum), and theuncertainty in the calculations is represented by the error bars.The apparent activation energy decreases as DK increases,which indicates da/dN is less temperature dependent at higherDK values. Linear regression analyses indicated this trend issignificant at both frequencies (p< 0.05).
3.3 Cyclic Plastic Zone Microstructure
Bright-field TEM of the microstructures in the plastic zoneahead of the crack tip at each test temperature is presented inFig. 8 for the 0.25 Hz test frequency. Similar observations tothe 0.25 Hz microstructure were made at 25 Hz. Only the0.25 Hz microstructure is presented. Dislocation density wasvery high at 550 �C (Fig. 7a). At 650 �C and 750 �C, thedislocation density was qualitatively lower as it was notpossible to resolve individual dislocations to calculate a density.However, individual dislocations were more easily seen at750 �C (Fig. 7c). As previously stated, no attempt was made todetermine dislocation densities in these samples (at this time)because TEM specimen preparation through FIB approach didnot generate sufficient electron-transparent material for suffi-
Fig. 4 Fatigue crack growth rates of Haynes 282 with load ratio0.1 at 25 and 0.25 Hz (Ref 3, 7): (a) At 750 �C; (b) At 650 �C; (c)At 550 �C
3702—Volume 24(10) October 2015 Journal of Materials Engineering and Performance
cient specimen tilting to different crystallographic orientations.However, what is very clear is the level of deformation thatoccurs in the plastic zone ahead of the growing crack.Referencing Fig. 1 and 2, it is clear to see the tremendouschange in the general features of the Haynes 282 microstructurein the plastic zone ahead of the crack after terminating the test.All feature details relative to twins, grains, c¢ and carbides areobscured by the high density of dislocations and the strain fromtheir interaction with each other, especially at 550 �C, and to asomewhat lesser extent at 650 and 750 �C. In Fig. 7(c), it ispossible to image individual dislocations and there are indica-tions for certain ones being influenced by c¢ during deforma-tion. Additional TEM was performed on selected FIB�sspecimens utilizing a new ion polishing system at low kV, inan attempt to increase the amount of electron-transparentmaterial without introducing additional damage from the ionbeam. Those results will be reported in a subsequent paper butthose observations support the general microstructure featuresnoted herein.
4. Discussion
4.1 Apparent Activation Energy for Fatigue Crack Growth
Understanding the thermally activated mechanisms involvedin fatigue crack growth is important to define appropriateservice conditions for the alloy and aid the development of newalloys. While post-failure fractography can easily identifyprimary modes of fatigue crack growth (i.e., transgranular orintergranular, stage I or II), fractography alone does not alwayselucidate the reasons why a certain crack propagation mode isobserved or why the growth rate increases with temperature.One method to help determine the influence of various failuremechanisms is to compare the apparent activation energy of thecrack growth to activation energies for various thermallyactivated processes such as creep and oxidation.
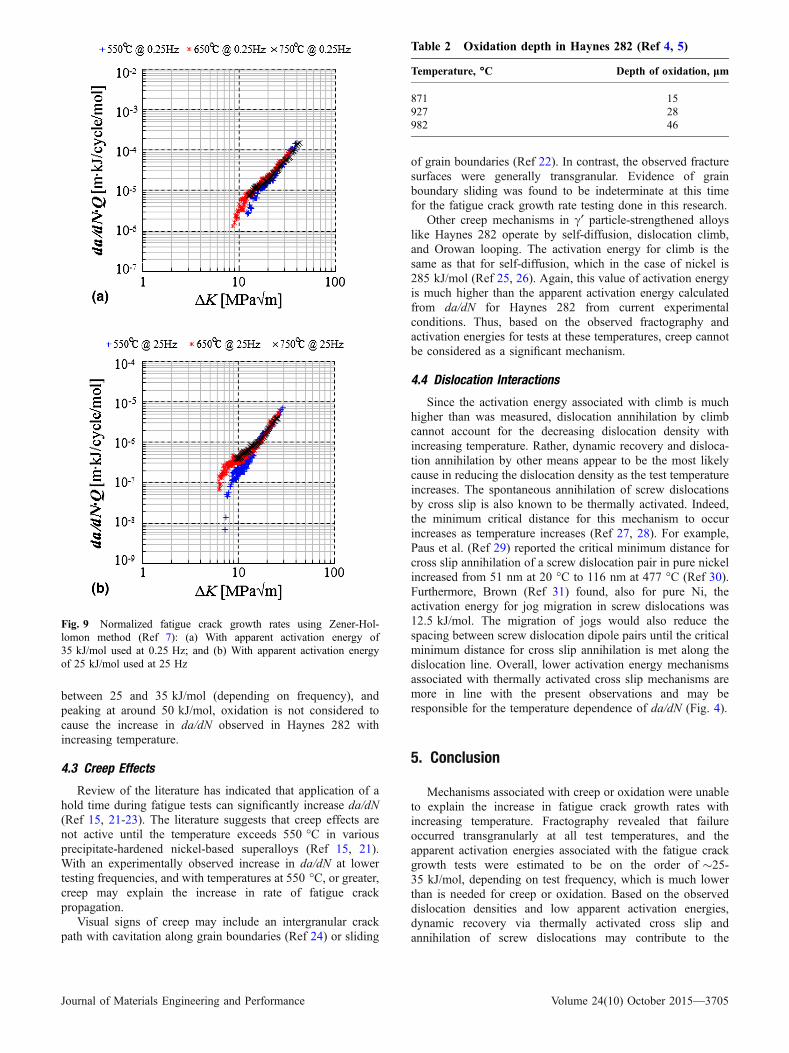
Based on the calculated activation energies in Fig. 7, anormalization factor was estimated and applied to the fatiguecrack growth data in a manner analogous to a Zener-Hollomonapproach for creep (Ref 14). The Zener-Hollomon analysis asapplied here to da/dN involves multiplying the crack growthrates by a normalization factor (Eq 2) in order to collapse most(if not all) of the data onto a single curve:
N ¼ exp Q�RgT
� �; ðEq 2Þ
In Eq 2, N is the normalization factor; Q is the apparentactivation energy for fatigue crack growth rate; Rg is theuniversal gas constant; and T is the temperature.
In Fig. 9(a), an activation energy equal to 25 kJ/mol wasselected for tests performed at 25 Hz loading frequency, and anactivation energy equal to 35 kJ/mol was selected for 0.25 Hzloading frequency Fig. 9(b). Collapse of the fatigue crackgrowth curves in the Paris law regime suggests that mechanismwith apparent activation energy approximately equal to 25 or35 kJ/mol operates at 25 and 0.25 Hz, respectively, for thespecific experimental conditions in this research on Haynes282. These values of nominal apparent activation energy willbe subsequently used in the following sections to discuss thepossible temperature dependence of fatigue crack growth
Fig. 5 Some isolated intergranular features observed during crackgrowth at 750 �C at various testing frequencies and DK (Ref 7). (a)Showing intergranular features clustered in one area, with experi-mental conditions of T = 750 �C, f = 0.25 Hz, DK = 14 MPa�m; (b)Showing intergranular features limited to a single grain, with experi-mental conditions of T = 750 �C, f = 0.25 Hz, DK = 33 MPa�m
Fig. 6 Showing large cluster of intergranular features, with experi-mental conditions of T = 750 �C, f = 0.05 Hz, DK = 40 MPa�m
Journal of Materials Engineering and Performance Volume 24(10) October 2015—3703
mechanisms for Haynes 282 in the range of temperaturesrelevant to A-USC steam turbine rotors.
4.2 Oxidation Effects
The effect of increasing test temperature in air was toincrease da/dN. Since controlled oxygen partial pressure testingwas not conducted, the effect of oxygen must be inferred.Generally, when accelerated fatigue crack growth rates areattributed to oxidation effects in nickel-based superalloys, theresulting crack path is intergranular (Ref 15-19). In this study,intergranular features on the fracture surface were very rare andonly present at 750 �C (Fig. 5). There was no observed majorshift from the generally transgranular nature of cracking overthe range of 550 to 750 �C (Ref 3). The lack of intergranularfracture features suggests that the increase in da/dN is not dueto oxidation. This can be further confirmed by looking at thecalculated activation energies for oxidation.
From Arrhenius regression of the oxidation data (Table 2) asreported from Pike (Ref 4), the activation energy due tooxidation can be estimated at around 120 kJ/mol, or anoxidation rate very near to that of pure Ni (130 kJ/mol (Ref20)). With the measured apparent activation energy nominally
Fig. 7 Apparent activation energy correlated to DK for da/dN ofHaynes 282 from 550 to 750 �C (Ref 7). Error bars indicate experi-mental uncertainty. Solid line shows statistically significant linear fit;(a) 0.25 Hz loading frequency and (b) 25 Hz loading frequency
Fig. 8 Transmission electron microscopy bright-field images of themicrostructure (Ref 7). Samples were cracked at DK of 14.7 MPa�mfor a minimum of 2 mm at 0.25 Hz loading frequency. (a) Veinstructure at 550 �C, (b) Orowan looping at 650 �C and (c) Orowanlooping at 750 �C
3704—Volume 24(10) October 2015 Journal of Materials Engineering and Performance
between 25 and 35 kJ/mol (depending on frequency), andpeaking at around 50 kJ/mol, oxidation is not considered tocause the increase in da/dN observed in Haynes 282 withincreasing temperature.
4.3 Creep Effects
Review of the literature has indicated that application of ahold time during fatigue tests can significantly increase da/dN(Ref 15, 21-23). The literature suggests that creep effects arenot active until the temperature exceeds 550 �C in variousprecipitate-hardened nickel-based superalloys (Ref 15, 21).With an experimentally observed increase in da/dN at lowertesting frequencies, and with temperatures at 550 �C, or greater,creep may explain the increase in rate of fatigue crackpropagation.
Visual signs of creep may include an intergranular crackpath with cavitation along grain boundaries (Ref 24) or sliding
of grain boundaries (Ref 22). In contrast, the observed fracturesurfaces were generally transgranular. Evidence of grainboundary sliding was found to be indeterminate at this timefor the fatigue crack growth rate testing done in this research.
Other creep mechanisms in c¢ particle-strengthened alloyslike Haynes 282 operate by self-diffusion, dislocation climb,and Orowan looping. The activation energy for climb is thesame as that for self-diffusion, which in the case of nickel is285 kJ/mol (Ref 25, 26). Again, this value of activation energyis much higher than the apparent activation energy calculatedfrom da/dN for Haynes 282 from current experimentalconditions. Thus, based on the observed fractography andactivation energies for tests at these temperatures, creep cannotbe considered as a significant mechanism.
4.4 Dislocation Interactions
Since the activation energy associated with climb is muchhigher than was measured, dislocation annihilation by climbcannot account for the decreasing dislocation density withincreasing temperature. Rather, dynamic recovery and disloca-tion annihilation by other means appear to be the most likelycause in reducing the dislocation density as the test temperatureincreases. The spontaneous annihilation of screw dislocationsby cross slip is also known to be thermally activated. Indeed,the minimum critical distance for this mechanism to occurincreases as temperature increases (Ref 27, 28). For example,Paus et al. (Ref 29) reported the critical minimum distance forcross slip annihilation of a screw dislocation pair in pure nickelincreased from 51 nm at 20 �C to 116 nm at 477 �C (Ref 30).Furthermore, Brown (Ref 31) found, also for pure Ni, theactivation energy for jog migration in screw dislocations was12.5 kJ/mol. The migration of jogs would also reduce thespacing between screw dislocation dipole pairs until the criticalminimum distance for cross slip annihilation is met along thedislocation line. Overall, lower activation energy mechanismsassociated with thermally activated cross slip mechanisms aremore in line with the present observations and may beresponsible for the temperature dependence of da/dN (Fig. 4).
5. Conclusion
Mechanisms associated with creep or oxidation were unableto explain the increase in fatigue crack growth rates withincreasing temperature. Fractography revealed that failureoccurred transgranularly at all test temperatures, and theapparent activation energies associated with the fatigue crackgrowth tests were estimated to be on the order of �25-35 kJ/mol, depending on test frequency, which is much lowerthan is needed for creep or oxidation. Based on the observeddislocation densities and low apparent activation energies,dynamic recovery via thermally activated cross slip andannihilation of screw dislocations may contribute to the
Fig. 9 Normalized fatigue crack growth rates using Zener-Hol-lomon method (Ref 7): (a) With apparent activation energy of35 kJ/mol used at 0.25 Hz; and (b) With apparent activation energyof 25 kJ/mol used at 25 Hz
Table 2 Oxidation depth in Haynes 282 (Ref 4, 5)
Temperature, �C Depth of oxidation, lm
871 15927 28982 46
Journal of Materials Engineering and Performance Volume 24(10) October 2015—3705
increase in crack growth rates as testing temperature increases.It is recommended that more detailed TEM studies beconducted in the future to fully investigate this possiblemechanism.
With the desired operating temperatures of A-USC powersystems possibly reaching 760 �C for the high pressure andintermediate pressure turbines (i.e., �0.66 Tmelt of Haynes282), it is essential that all relevant mechanical properties anddeformation mechanisms, including fatigue, are well under-stood in the range of temperatures near this level since theentire disk will not be at 760 �C. This study has shown Haynes282 is a relatively robust alloy, not subject to detrimentalintergranular failure mechanisms in air environments up to750 �C with loading frequencies as slow as 0.25 Hz as havebeen seen in other nickel superalloys. Utilization of Haynes 282at 760 �C in rotating structural components based on the fatiguecrack propagation rate, while promising, is cautioned untilfurther information on other failure modes (e.g., creep-fatigue)is acquired.
Acknowledgments
This work was funded by the Cross-Cutting TechnologiesProgram at the National Energy Technology Laboratory (NETL) -Strategic Center for Coal, managed by Robert Romanosky(Technology Manager) and Charles Miller (Technology Monitor).The Research was executed through NETL�s Office of Researchand Development�s Innovative Process Technologies (IPT) FieldWork Proposal with David Alman serving as the Materials FocusArea Lead.
Disclaimer
This report was prepared as an account of work sponsored by anagency of the United States Government. Neither the United StatesGovernment nor any agency thereof, nor any of their employees,makes any warranty, express or implied, or assumes any legalliability or responsibility for the accuracy, completeness, orusefulness of any information, apparatus, product, or processdisclosed, or represents that its use would not infringe privatelyowned rights. Reference herein to any specific commercial product,process, or service by trade name, trademark, manufacturer, orotherwise does not necessarily constitute or imply its endorsement,recommendation, or favoring by the United States Government orany agency thereof. The views and opinions of authors expressedherein do not necessarily state or reflect those of the United StatesGovernment or any agency thereof.
References
1. P.D. Jablonski, J.A. Hawk, C.J. Cowen, and P.J. Maziasz, Processing ofAdvanced Cast Alloys for A-USC Steam Turbine Applications,J. Mater., 2012, 64(2), p 271–279. doi:10.1007/s11837-012-0241-4
2. D.A. Woodford, Gas phase Embrittlement and Time DependentCracking of Nickel Based Superalloys, Energy Mater. Mater. Sci.Eng. Energy Syst., 2006, 1(1), p 59–70. doi:10.1179/174892306X99679
3. K.A. Rozman, J.J. Kruzic, and J.A. Hawk, Fatigue Crack GrowthBehavior of Nickel-Base Superalloy Haynes 282 at 550-750 �C,J. Mater. Eng. Perform., 2015, 24(8), p 2841–2846
4. Pike, L.M. (2006). Haynes 282 alloy—A New Wrought SuperalloyDesigned for Improved Creep Strength and Fabricability (#GT2006-
91204), ASME Turbo Expo 2006: Power for Land, Sea and Air. (pp. 1–9). Barcelona, Spain
5. Haynes� International, (2006). Haynes� 282� Alloy. Retrieved fromhttp://www.haynesintl.com/pdf/h3173.pdf. Accessed January 1st 2015
6. Viswanathan, R., Hawk, J.A., Schwant, R.D., Totemeier, T., Goodstine,S., McNally, M., and Allen, D. B. (2009). Steam Turbine Materials forUltrasupercritical Coal Power Plants. pp. 1–535. Independence, OH
7. Rozman, K.A. (2014) Characterization of High Temperature FatigueMechanisms in Haynes 282 Nickel Based Superalloy. Doctoraldissertation, Oregon State University
8. ASTM Standard E647—11: Standard Test Method for Measurement ofFatigue Crack Growth Rates. ASTM International, West Con-shohocken, PA. 2011, doi: 10.1520/E0647-13AE01, www.astm.org
9. S. Vyazovkin, Computational Aspects of Kinetic Analysis. Part C. TheICTAC Kinetics Project—The Light at the End of the Tunnel?,Thermochim. Acta, 2000, 355(1–2), p 155–163. doi:10.1016/S0040-6031(00)00445-7
10. M.J. Starink, The Determination of Activation Energy From LinearHeating Rate Experiments: A Comparison of the Accuracy ofConversion Methods, Thermochim. Acta, 2003, 404(1–2), p 163–176. doi:10.1016/S0040-6031(03)00144-8
11. E.J. Mittemeijer, Analysis of the Kinetics of Phase Transformations,J. Mater. Sci., 1992, 27(15), p 3977–3987. doi:10.1007/BF01105093
12. T.G. Langdon, A Method of Distinguishing Between Diffusion Creepand Harper-Dorn Creep at Low Stress Levels, Scr. Mater., 1996, 35(6),p 733–737. doi:10.1016/1359-6462(96)00219-9
13. M.J. Starink and P.A.S. Reed, Thermal Activation of Fatigue CrackGrowth: Analyzing the Mechanisms of Fatigue Crack Propagation inSuperalloys, Mater. Sci. Eng. A, 2008, 491(1–2), p 279–289. doi:10.1016/j.msea.2008.02.016
14. C. Zener and J.H. Hollomon, Effect of Strain Rate Upon Plastic Flowof Steel, J. Appl. Phys., 1944, 15(1), p 22–32. doi:10.1063/1.1707363
15. D. Gustafsson, J. Moverare, S. Johansson, M. Hornqvist, K. Simon-sson, S. Sjostrom, and B. Sharifimajda, Fatigue Crack GrowthBehavior of Inconel 718 with High Temperature Hold Times, Proc.Eng., 2010, 2, p 1095–1104. doi:10.1016/j.proeng.2010.03.118
16. J.E. King, Fatigue Crack Propagation in Nickel-Base Superalloys—Ef-fects of Microstructure, Load Ratio, and Temperature, Mater. Sci.Technol., 1987, 3(9), p 750–764. doi:10.1179/026708387790329766
17. E. Andrieu, R. Molins, H. Ghonem, and A. Pineau, Intergranular CrackTip Oxidation Mechanism in a Nickel-Based Superalloy, Mater. Sci.Eng. A, 1992, 154(1), p 21–28. doi:10.1016/0921-5093(92)90358-8
18. R. Jiang, S. Everitt, M. Lewandowski, N. Gao, and P.A.S. Reed, GrainSize Effects in a Ni-Based Turbine Disc Alloy in the Time and CycleDependent Crack Growth Regimes, Int. J. Fatigue, 2014, 62, p 217–227. doi:10.1016/j.ijfatigue.2013.07.014
19. S. Everitt, R. Jiang, N. Gao, M.J. Starink, J.W. Brooks, and P.A.S.Reed, Comparison of Fatigue Crack Propagation Behaviour in TwoGas Turbine Disc Alloys Under Creep-Fatigue Conditions: EvaluatingMicrostructure, Environment And Temperature Effects, Mater. Sci.Technol., 2013, 29(7), p 781–787. doi:10.1179/1743284713Y.0000000229
20. R. Peraldi, D. Monceau, and B. Pieraggi, The Nickel, Model Materialfor the High Temperature Oxidation Studies: First Steps TowardsPredictive Modelling, Revue de Metallurgie, 2005, 102(2), p 135–145.doi:10.1051/metal:2005115
21. J. Byrne, Elevated Temperature Fatigue Crack Growth Under DwellConditions in Waspaloy, Int. J. Fatigue, 1997, 19(5), p 359–367. doi:10.1016/S0142-1123(97)00056-X
22. J. Dahal, K. MacIejewski, and H. Ghonem, Loading Frequency andMicrostructure Interactions in Intergranular Fatigue Crack Growth in aDisk Ni-Based Superalloy, Int. J. Fatigue, 2013, 57, p 93–102
23. X. Liu, B. Kang, and K.M. Chang, The Effect of Hold-Time on FatigueCrack Growth Behaviors of WASPALOY Alloy at Elevated Temper-ature, Mater. Sci. Eng. A, 2003, 340(1–2), p 8–14. doi:10.1016/S0921-5093(02)00074-6
24. A. Saxena, Nonlinear Fracture Mechanics for Engineers, CRC PressLLC, Boca Raton, 1998
25. R. Weast, Handbook of Chemistry and Physics, 66th ed., CRC Press,Boca Raton, 1985
26. S.K. Sondhi, B.F. Dyson, and M. McLean, Tension-CompressionCreep Asymmetry in a Turbine Disc Superalloy: Roles of InternalStress and Thermal Ageing, Acta Mater., 2004, 52(7), p 1761–1772.doi:10.1016/j.actamat.2003.12.017
3706—Volume 24(10) October 2015 Journal of Materials Engineering and Performance
27. T. Rasmussen, T. Vegge, and T. Leffers, Simulation of Structure andAnnihilation of Screw Dislocation Dipoles, Philos. Mag. A, 2000,80(5), p 1273–1290. doi:10.1080/01418610050024585
28. T. Leffers and O.B. Pedersen, The Activation Energy for the fccRolling-Texture Transition as Related to the Activation Energy forCross Slip, Scr. Mater., 2002, 46(10), p 741–746. doi:10.1016/S1359-6462(02)00065-9
29. P. Paus, J. Kratochvıl, and M. Benes, A Dislocation Dynamics Analysisof the Critical Cross-Slip Annihilation Distance and the Cyclic
Saturation Stress in fcc Single Crystals at Different Temperatures,Acta Mater., 2013, 61(20), p 7917–7923. doi:10.1016/j.actamat.2013.09.032
30. B. Tippelt, J. Breitschneider, and P. Hahner, The DislocationMicrostructure of Cyclically Deformed Nickel Single Crystals atDifferent Temperatures, Phys. Status Solidi (a), 1997, 163(1), p 11–26
31. L.M. Brown, A Dipole Model for the Cross-Slip of Screw Dislocationsin fcc Metals, Philos. Mag. A, 2002, 82(9), p 1691–1711. doi:10.1080/01418610210130976
Journal of Materials Engineering and Performance Volume 24(10) October 2015—3707