Embed Size (px)
Citation preview

1
Fatigue and Fracture Behavior of affordable Ti-B Alloys
Final Report Submitted to the Asian Office of the Aerospace Research & Development
by
Dr. U. Ramamurty Assistant Professor
Department of Metallurgy Indian Institute of Science
Bangalore – 560 012, INDIA
in collaboration with
Indrani Sen, PhD Student, IISc and
D. Miracle and S. Tamirisa AFRL, Wright Patterson Air Force Base, Dayton, OH, USA
April 2006

Report Documentation Page Form ApprovedOMB No. 0704-0188
Public reporting burden for the collection of information is estimated to average 1 hour per response, including the time for reviewing instructions, searching existing data sources, gathering andmaintaining the data needed, and completing and reviewing the collection of information. Send comments regarding this burden estimate or any other aspect of this collection of information,including suggestions for reducing this burden, to Washington Headquarters Services, Directorate for Information Operations and Reports, 1215 Jefferson Davis Highway, Suite 1204, ArlingtonVA 22202-4302. Respondents should be aware that notwithstanding any other provision of law, no person shall be subject to a penalty for failing to comply with a collection of information if itdoes not display a currently valid OMB control number.
1. REPORT DATE 02 AUG 2006
2. REPORT TYPE Final Report (Technical)
3. DATES COVERED 23-05-2006 to 02-08-2006
4. TITLE AND SUBTITLE Fatigue and fracture behavior of affordable Ti-B alloys
5a. CONTRACT NUMBER FA520905P0467
5b. GRANT NUMBER
5c. PROGRAM ELEMENT NUMBER
6. AUTHOR(S) Upadrasta Ramamurty
5d. PROJECT NUMBER
5e. TASK NUMBER
5f. WORK UNIT NUMBER
7. PERFORMING ORGANIZATION NAME(S) AND ADDRESS(ES) Indian Institute of Science,Department of Metallurgy,Bangalore 560 012,India,ZZ,560012
8. PERFORMING ORGANIZATIONREPORT NUMBER
9. SPONSORING/MONITORING AGENCY NAME(S) AND ADDRESS(ES) The US Resarch Labolatory, AOARD/AFOSR, Unit 45002, APO, AP, 96337-5002
10. SPONSOR/MONITOR’S ACRONYM(S) AOARD/AFOSR
11. SPONSOR/MONITOR’S REPORT NUMBER(S) AOARD-054034
12. DISTRIBUTION/AVAILABILITY STATEMENT Approved for public release; distribution unlimited
13. SUPPLEMENTARY NOTES
14. ABSTRACT In this project, we have examined the mechanical properties of the Ti-6Al-4V alloy with varying amountsof B content. The cast and HIPed alloys with 0.05, 0.10 and 0.4 wt.% B additions were supplied byTamirisa and Miracle of AFRL, WPAFB. Microstructural observations indicate that the B additionreduces the as-cast grain size dramatically. Concomitantly, an increase in the yield and ultimate tensilestrengths was observed. Fracture toughness measurements indicate a reduction in KIc values withincreasing B content, owing primarily to the reduced grain size. Fatigue crack growth measurements showa gradual reduction in threshold for fatigue crack initiation. Fractographic analyses were conducted toexamine the micromechanical reasons for the observed trends.
15. SUBJECT TERMS Titanium Alloy, Fatigue and Fracture
16. SECURITY CLASSIFICATION OF: 17. LIMITATION OF ABSTRACT
18. NUMBEROF PAGES
20
19a. NAME OFRESPONSIBLE PERSON
a. REPORT unclassified
b. ABSTRACT unclassified
c. THIS PAGE unclassified
Standard Form 298 (Rev. 8-98) Prescribed by ANSI Std Z39-18

2
Abstract
In this project, we have examined the mechanical properties of the Ti-6Al-4V alloy with
varying amounts of B content. The cast and HIPed alloys with 0.05, 0.10 and 0.4 wt.% B
additions were supplied by Tamirisa and Miracle of AFRL, WPAFB. Microstructural
observations indicate that the B addition reduces the as-cast grain size dramatically.
Concomitantly, an increase in the yield and ultimate tensile strengths was observed.
Fracture toughness measurements indicate a reduction in KIc values with increasing B
content, owing primarily to the reduced grain size. Fatigue crack growth measurements
show a gradual reduction in threshold for fatigue crack initiation. Fractographic analyses
were conducted to examine the micromechanical reasons for the observed trends.
1. Introduction
Titanium alloys, particularly Ti-6Al-4V (referred here afterwards as Ti64), are
extensively used in the aerospace propulsion systems and there is a continuous drive to
enhance their structural efficiency through enhanced alloy design that gives improved
mechanical properties. The addition of a small amount of B (less than 2 wt.%) to Ti
alloys was shown to improve the specific stiffness and strength significantly. However, a
major drawback of these alloys is the ductility, which is only about 2%. It was recently
discovered that the addition of ~0.4 wt.% B to the Ti64 reduces the as-cast grain size
considerably. For example, the grain size in the as-cast Ti64-0.4B is ~100 microns
whereas it is ~1700 microns in Ti64 that is processed in exactly the same manner. This
reduced grain size has a strong economic advantage, as it obviates the need for several
thermomechanical processing steps that are necessary to breakdown the as-cast coarse
grain structure. Microstructural studies show that the TiB needles, about a micron in size,
restrict the grain growth.
In addition to the promise of a marked reduction in the cost of processing Ti-alloy
components, trace addition of B were also shown to improve the uniaxial tensile
properties considerably. About 10% enhancement in elastic modulus, yield and ultimate
tensile strengths, as compared to those alloys without B, were observed. However,
detailed mechanical property characterization and understanding the connections between
the microstructure and properties is yet to be carried out. In particular, the fatigue crack

3
growth and fracture properties, which are highly sensitive to the microstructure near the
threshold regime, need to be evaluated, which is the objective of this project. These are
important since the Ti alloy components are subject to fatigue loading conditions in
service. Specific objectives of this project (as listed in the proposal) are as following:
a) Study the variation of the fracture toughness with the grain size and understand the
micromechanisms responsible for the observed variation, if any.
b) Examine the effect of grain size on the room temperature fatigue crack growth
behavior, with specific focus on the near-threshold fatigue crack growth regime,
which is highly sensitive to the microstructure.
2. Materials and Experiments 75 mm diameter ingots, cast and hot isostatically pressed (HIPed) with nominal
compositions of Ti-6Al-4V-xB (with x values of 0.05, 0.1 and 0.4 wt.%) were supplied
by Dr. Sesh Tamirisa of AFRL, WPAFB. For the tensile testing, 35 mm gage length dog-
bone shaped specimens with 6 mm width and 2 mm thickness were electro-discharge
machined (EDM) from the as-received billets. Tensile tests were conducted in an Instron
machine with a strain rate of 0.001/s. Fracture toughness, KIc and fatigue crack growth
experiments were carried out at a temperature of 21oC on chevron-notched half C(T)
specimens of 24mm width and 12 mm thickness as per the ASTM standard E 399-90.
The samples were pre-cracked with an applied load amplitude, ∆P, of 4500 N. The load
ratio, R (ratio of the minimum to maximum loads of the fatigue cycle), and the frequency,
ν, were maintained 0.1 and 10 Hz, respectively. For the KIc measurements, the pre-crack
length was such that the a/W (a is the total crack length) ratio is ~0.5. Subsequently,
samples were pulled until fracture at a rate of 0.1 mm/s. The fatigue crack growth
experiments were conducted on the pre-cracked samples as per the ASTM standard E
647-05. Here also the R and ν were kept at 0.1 and 10 Hz, respectively. Crack growth
was monitored using a traveling microscope. For practical purposes, the threshold for the
fatigue crack initiation, ∆K0, was defined as the ∆K at which no crack growth was
observed after 10,000 cycles.
Hardness was measured using an instrumented microhardness tester (CSM) with
Vickers indenter at room temperature. For this, specimens of size 12mm*12mm*10mm

4
were cut, metallographically polished and etched with Kroll’s reagent. The load used for
the indentation is 5 N with a loading/unloading rate of 0.083 N/s with pause time at peak
load of 10 s. 10 indentations for each sample were performed and the mean values are
reported. Metallographic examinations of the alloys were conducted after polishing and
etching with Kroll’s reagent. Fractography was conducted using a scanning electron
microscope (SEM).
3. Results and Discussion 3.1. Microscopy Figures 1 a-c show the optical micrographs of the 0.05, 0.1 and 0.4 wt.% B containing
Ti64 alloy. Higher magnification Scanning electron micrographs (Fig. 2) show that
needle shaped TiB particles with aspect ratio of 2.8 (approximately) are at the grain
boundaries forming a necklace like arrangement. This network is more prominent for
Ti64-0.4B. The presence of TiB needle is confirmed by EDAX. The grain size was
plotted in Fig. 3 as a function of the B content. Here, the base Ti64 without any B data
was obtained from literature [4]. It is seen that the addition of B reduces the grain size, d,
quite dramatically, by an order of magnitude, even with a relatively small addition of
0.05 wt.% B. Although higher amounts of B additions further reduce the grain size, the
reduction is only marginal. Fig. 3 also shows that the α lath size, λ, also decreases,
concomitant with the grain size, due to the addition B. α lath size value in Ti64 with no B
in it, is considered from literature [2]. The average values of d and λ are listed in the
table.
3.2. Tensile properties
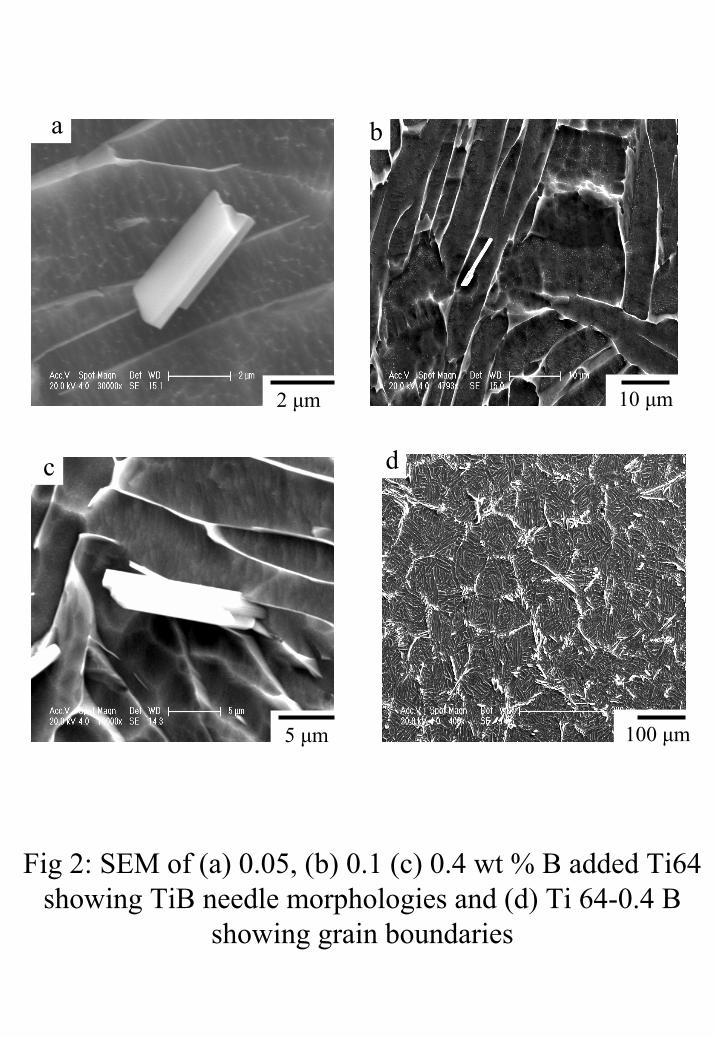
Fig. 4 shows the tensile stress-strain graphs of Ti64 containing 0.05, 0.1 and 0.4 wt.% B.
The variation of yield strength, σy, and ultimate tensile strength, σU, with the B addition
is shown in Fig. 5. The literature [4] values of Ti64 without B are also plotted. It is seen
that there is a continuous increase in both σy by about 16% and σU by about 13% from
Ti64 with no B addition to Ti64-0.4B. This enhancement in tensile properties can solely
be attributed to the reduction in grain size, as the Ti64 is essentially elastic-perfectly
plastic (i.e. very low work hardening rate, n). The latter can be seen from Fig. 6, wherein

5
n is plotted a function of wt.% B. Although a continuous reduction is seen, the absolute
values are very small, and hence it can be concluded that the strain hardening behavior of
Ti64 essentially remains unchanged with the addition of B. The strain at failure, εf,
appears to decrease with the B addition. However, this reduction is as not precipitous as
in the hypereutectic Ti64-B alloys wherein the ductility reduces below the critical
minimum (for applications in aerospace structures) of 5%.
Concomitant with the increase in σU, the Vickers hardness, HV, was also found to
increase by about 26%, with increasing amount of B (Fig. 7) due to the presence of hard
TiB phase at the grain boundaries. Here the hardness of Ti64 with no B addition is found
from literature [1].
3.3. Fracture toughness
Fracture toughness is found to decrease with the increase in amount of B added. This
variation is plotted in Fig. 8. It has been found that the fracture toughness values
decreases by 75% from the value of 152 MPa m0.5 in Ti64 with no B addition [2], to 38
MPa m0.5 in Ti64-0.4B. Moreover, although a continuous decrease in the fracture
toughness values are seen for increase in amount of B addition in Ti64, the maximum
reduction of about 52% is observed for Ti64-0.05 B having the value of 72.9 MPa m0.5.
This vast reduction is mainly associated with the reduction in grain size from 1700 µm to
233.4 µm with only 0.05 wt% of B addition. This behavior of reduction in fracture
toughness values with the reduction in grain size can be explained with the help of RKR
(Ritchie, Knott and Rice) model. According to [6], failure at low temperature has been
modeled as slip-initiated cleavage fracture. This cleavage cracks propagate in an unstable
manner when the maximum principal tensile stress (σmax), ahead of the stress
concentrator exceeds a critical value (σf). The RKR model proposes that at low
temperature when this local tensile stress (σmax) exceeds a critical fracture stress (σf) over
a microstructurally significant characteristic size-scale (l0*), which lies between 2d to 4d
(d is the grain size), σmax leads to KIC. Since KIC is directly proportional to l0, so the
fracture toughness values get reduced, as the grain size is refined with the addition of B
in Ti64. Thus a large reduction in grain size for only 0.05 wt% B addition leads to a

6
dramatic decrease in the fracture toughness and hence an overall decrease in fracture
toughness is also associated with increasing B content.
Fractographs at high magnification of 2000x (Fig. 10 a-c) shows the presence of
some dimples in the fracture surface of Ti64-0.05 TiB whereas water marks in Ti64-0.1B
and Ti64-0.4B indicating that the alloy is getting more and more brittle with increasing
wt % of B addition. This brittleness may be due to the presence of more and more hard
and brittle TiB phase with increasing B addition in Ti64.
3.5. Fatigue crack growth
Fatigue crack growth of Ti64-0.1B and Ti64-0.4B are measured with an Instron machine
following the stress intensity factor range (∆K) shedding method, by 10% reduction in
∆K value for every 0.5 mm of crack growth to reach the threshold stress intensity factor
range, ∆K0, (corresponds to dn > 100000 cycles for 0.1 mm of crack growth). After
reaching the threshold, the tests were continued at constant load range. The values of ∆K0
along with the Paris exponent, m are listed in the table. SEM of the crack propagation
path, shown in Fig. 12, suggests that the crack has a to deviate along the α laths at the
near threshold region, and the widmanstatten structure leads to slow crack growth.
Moreover as it has been found from literature [2,7], the crack growth rate actually
decreases as the grain, colony and lath size increases due to increased crack branching,
crack deflection along the laths and secondary cracks formation, all of which lead to
fracture surface roughness. The crack growth rate vs. the stress intensity factor range for
the composition, plotted in Fig. 11, also shows a slightly decreased fatigue crack growth
rate for Ti64-0.1 B compared to Ti64-0.4B, but since the refinement is not too large with
0.4 wt% B addition in Ti64 compared to 0.1 wt% B addition in it, the reduction in the
crack growth rate is small. It is also evident from the table that as the grain size is refined
with increased B addition to Ti64, the threshold stress intensity factor range actually
decreases. The fractured surface of the specimens also shows much roughness in Ti64-
0.1B compared to Ti64-0.4B. This surface roughness is associated with more crack
deflection in coarser grain sized specimen. It has also been found from literature [8] that
as R increases in fatigue crack growth curves, the crack growth rate increases as well as
the threshold ∆K0 decreases but since we have done all the experiment at same R of 0.1,

7
the increment in the fatigue crack growth rate and the reduction in threshold stress
intensity range is solely due to the grain refinement of Ti64 with increased addition of B
in it.
4. Conclusions
B addition in Ti64 reduces the as-cast grain size dramatically by about an order of
magnitude, as a result of which an increase in the yield and ultimate tensile strengths and
hardness were observed. There is a reduction in fracture toughness, KIc with increasing B
content, also due to the reduced grain size. Fatigue crack growth measurements show a
gradual reduction in threshold for fatigue crack initiation as well as slight increase in the
fatigue crack growth rate with B addition in Ti64 again due to the grain refinement.
Acknowledgements
We acknowledge the assistant rendered by S. Sasidhara, N. Eswara Prasad, and K.
Mahesh in various experiments reported in this work.
References
1. K. Euh et al., Scripta Materialia 45 (2001), 1
2. V. Sinha et.al., Materials Science and Engineering A, 319-321 (2001) 607.
3. J. Zhu et.al., Materials Science and Engineering A, 339 (2003) 53.
4. S. Tamirisakandala et.al., Scripta Materialia, 53 (2005) 1421.
5. S.Tamirisakandala et.al., Scripta Materialia, 53 (2005), 217.
6. R.O. Ritchie et.al., Metallurgical Transactions A, 10A (1979) 1557.
7. P.E. Irving et.al., Materials Science and Engineering, 14 (1974) 229.
8. K. Sadananda, A.K. Vasudevan, International Journal of Fatigue, 27 (2005) 1255.

8
Table 1: Summary of the experimental results on Ti64-xB alloys
* Values taken from literature.
Alloy
(λ) (µm)
d (µm)
σy (MPa)
σU (MPa)
εf (%)
KIc (MPa√m)
n HV E (GPa)
∆K0 (MPa√m)
m
Ti64 14.1*
±0.9 1700* 833.9* 900.2* 6* 152* 325* 112*
Ti64- 0.05B
8.04 ± 0.5
233.4 ± 12.2
925.9 972.2 8.9 72.9 ± 4.4
0.056 373.6±37.7
99.1± 3.5
Ti64- 0.10B
5.5 ± 0.5
152.5 ± 12.7
928.7 974.8 7.2 62.6 ± 6.4
0.036 386.1±25
136.7±12.7
8.43 3.76
Ti64- 0.40B
4.2 ± 0.2
139.5 ± 11.2
966.4 1012.2 6.0 38.0 ± 2.6
0.028 410.5±47.8
117.8±6.9
6.64 3.78

Fig 1: Optical micrographs of (a) 0.05, (b) 0.1 and (c) 0.4 wt % B added Ti64 at 100x showing TiB at grain
boundaries
a
100µm
b
100µm
100µm
c
2 µm
a
10 µm
b
5 µm
c
Fig 2: SEM of (a) 0.05, (b) 0.1 (c) 0.4 wt % B added Ti64 showing TiB needle morphologies and (d) Ti 64-0.4 B
showing grain boundaries
100 µm
d

Fig 3: Grain size (d) and lath size (λ) variation of Ti64 with wt % B addition
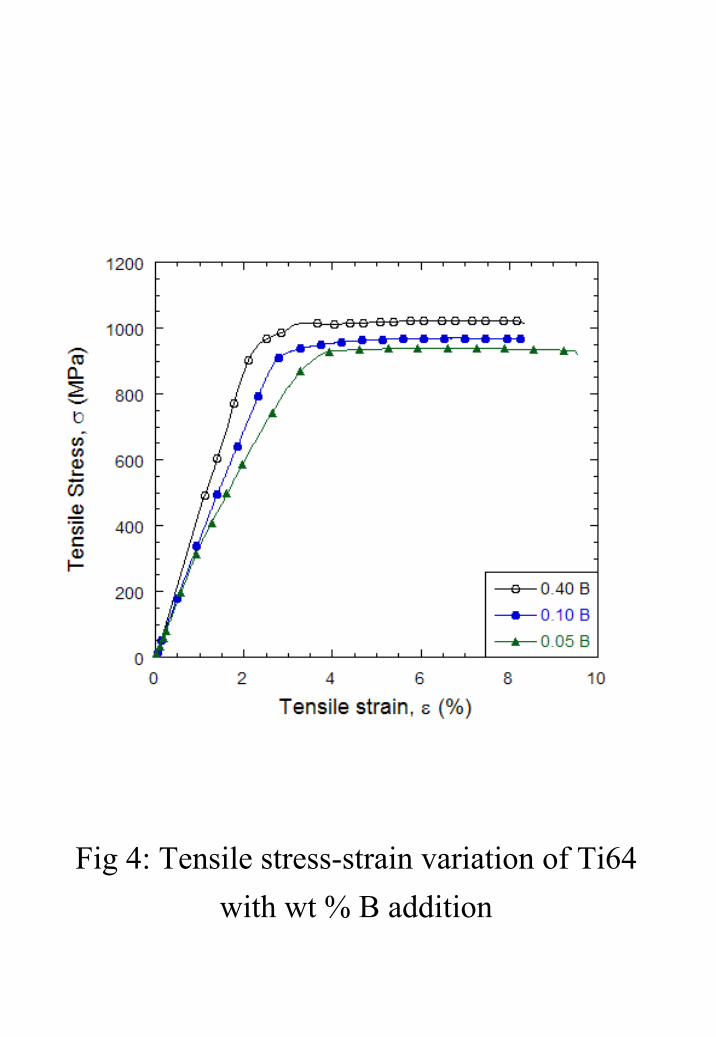
Fig 4: Tensile stress-strain variation of Ti64 with wt % B addition

Fig 5: Variation of Yield strength and Ultimate tensile strength in Ti64 with wt % B addition

Fig 6: Variation of work hardening exponent, n, in Ti64 with wt % B addition

Fig 7: Variation of Instrumented Vickers microhardness, HV in Ti64 with wt % B addition

Fig 8: Variation of Fracture toughness and threshold stress intensity factor range values in Ti64 with wt % B
addition

Fig 9: Fractographs of fracture toughness specimens of (a) 0.05, (b) 0.1 and (c) 0.4 wt % B added Ti64, at 250 x
a
200µm
b
200µm
200µm
c
Fig 10: Fractographs of fracture toughness specimens of (a) 0.05, (b) 0.1 and (c) 0.4 wt % B added Ti64, at 2000 x
20µm
20 µm
a b
20 µm
20 µm
c

Fatigue5.tif
Fig 11: variation of fatigue crack growth rate with stress intensity factor range for 0.1 and 0.4 wt % B
added Ti64

Fig 12: Fatigue crack propagation in Ti64-0.1 B at (a) Paris regime and (b) at near threshold region.
50µm
50µm
a
b
![Materials Science & Engineering A - École Polytechnique...constituents on the ductile fracture of aluminum alloys has aroused extensive attention [5]. The mechanical properties of](https://img.pdfslide.us/doc/110x75/5e77a08c8891723d094ea235/materials-science-engineering-a-cole-polytechnique-constituents-on.jpg)