Embed Size (px)
Citation preview

Fate of Vitamin C in Commercial Fruit Juices
Surinder Nagra
Thesis submitted in fulfilment
of the
Postgraduate Diploma in Applied Science (Research)
Auckland University of Technology Auckland
September 2006

ii
Attestation of Authorship
I hereby declare that this submission is my own work and that, to the best of my
knowledge and belief, it contains no material previously published or written by another
person (except where explicitly defined in the acknowledgements), nor material which to a
substantial extent has been submitted for the award of any other degree or diploma of a
university or other institute of higher learning,

iii
Acknowledgements
I am most grateful to my supervisor Dr Owen Young, Associate Professor at Auckland
University of Technology, for his cool ability to support and improve my skills with
unflagging good nature.
I would like to thank Mr Christopher Whyburd and Mrs Yen Wang for their ever ready
guidance in laboratory and Dr Robyn Ramage at the AUT Library and Dr David Parker at Te
Tari Awhina for providing help from time to time.
I would also like to acknowledge the many special blessings in my life. Chief among
them are my husband, Manpreet, and my loving kids Rabia and Amrit to encourage me to go
ahead.

iv
Abstract
Vitamin C occurs in relatively high concentrations in fresh and processed fruits and
vegetables but is found to a lesser extent in animal tissues and animal-derived products.
Nearly 90 % of vitamin C in the human diet is obtained from fruits and vegetables but this can
be indirect by way of commercially prepared fruit juices. These juices are often enriched with
vitamin C which has been synthetically prepared. There is a wide range of such juices on the
New Zealand market, and they are a significant source of dietary vitamin C for many in the
population. The focus of this research is on the Keri range of juice products.
The present study monitors the fate of vitamin C during storage of Keri juices up to the
best-before date, and under a range of other storage and consumption situations.
Two methods were adopted for determining ascorbic acid (AA, the chemical identity of
vitamin C). These were the titrimetric method, which is based upon the reduction of the dye
2,6-dichlorophenolindophenol by AA in acidic solution, and liquid chromatography, which is
used to separate AA from its immediate oxidation product dehydroascorbic acid. In the latter
method these two analytes can be measured independently. The liquid chromatography was
less successful than the simpler titrimetric method, so most of the work was done by titration.
However, the concentration of dehydroascorbic acid, which has vitamin C activity in vivo,
remained uncertain.
Moreover, the titrimetric method could not be applied to juices with high purple
anthocyanin concentrations, like blackcurrant, because the colour change at the titration end
point could not be detected. pH adjustment to change colour was ineffective, and
decolourisation with charcoal led to the rapid and complete destruction of AA.
The concentration of AA in Keri juices at the time of manufacture were always much
higher than claimed on the labels. Storage for up to nine months at room temperature resulted
in a loss in AA of between 37 and 68 %, depending on the juice and exposure to fluorescent
light. However, the time of storage was a much more dominant factor than light exposure.
The kinetics of loss, straight lines, were most easily explained by an aerobic model of AA
degradation from oxygen diffusing across the polyethylene tetraphthalate bottle wall. Overall,
the label claims made were defensible in terms of the best-before date, because it took at least
100 days of storage before the AA concentration in the most susceptible juices fell below the
claimed value. This is because these drinks are fast moving consumer goods and storage

v
beyond 100 days is unlikely. (Nonetheless, the supplier (Keri Juice Company) has
since adopted its new unitised method of formulating juice. This has resulted in an initially
higher concentration of vitamin C as compared to the juices under investigation.)
In the nine months storage experiment there was some evidence for the presence of
dehydroascorbic acid in blackcurrant drinks, but not in another three juices.
Pasteurisation during preparation of these drinks resulted in up to 7 % loss of AA,
probably due to oxygen dissolved in water, and accelerated by heat of pasteurisation. Higher
temperatures in later storage also accelerated losses. Progressive exposure of juice to air
during simulated consumption of 3 L bottles over a week also accelerated losses. Finally,
exposure to sunlight in a diurnal temperature environment accelerated losses five-fold higher
than in total darkness. Filtration of ultraviolet light approximately halved the loss due to
sunlight.
Overall however, it can be concluded that AA in the Keri range of juices is very resistant
to degradation of AA.

vi
Table of contents
Attestation of Authorship........................................................................................................................... ii Acknowledgements ...................................................................................................................................iii Abstract .................................................................................................................................................... iv List of tables ........................................................................................................................................... viii List of figures ........................................................................................................................................... ix
CHAPTER 1 .......................................................................................................................................................... 1
INTRODUCTION ................................................................................................................................................. 1 History of vitamin C in human health ....................................................................................................... 1 Biological effects of vitamin C .................................................................................................................. 3 Absorbance and metabolism of ascorbic acid........................................................................................... 4 Structure and properties of vitamin C....................................................................................................... 5 Sources of vitamin C in foods.................................................................................................................... 9 Recommended daily allowances and sources in the Western diet........................................................... 10 Industrial production of vitamin C.......................................................................................................... 12 Ascorbic acid in non-alcoholic drinks..................................................................................................... 13 The issue.................................................................................................................................................. 15
CHAPTER 2 ........................................................................................................................................................ 16
BASIC METHODOLOGIES ................................................................................................................................. 16 Introduction............................................................................................................................................. 16 Titrimetric Method .................................................................................................................................. 16
Principle..........................................................................................................................................................16 Reagents .........................................................................................................................................................17 Procedure........................................................................................................................................................18 Sample preparation .........................................................................................................................................18 Reproducibility and recovery test for AA in selected juices...........................................................................19
Chromatographic method ....................................................................................................................... 19 HPLC apparatus..............................................................................................................................................20 Reagents and standards...................................................................................................................................21 Sample preparation and chromatography........................................................................................................21 Precision of the chromatographic method.......................................................................................................22
CHAPTER 3 ........................................................................................................................................................ 23
METHODS REFINEMENT .................................................................................................................................. 23 Introduction............................................................................................................................................. 23 Comparison of the titrimetric and chromatographic methods ................................................................ 23 Effect of cysteine and DTT on AA concentration in Keri Original Apple ............................................... 24
Methods ..........................................................................................................................................................24 Results ............................................................................................................................................................24
Effect of dithiothreitol on DHAA prepared from AA solution ................................................................. 24
vii
Methods ..........................................................................................................................................................24 Results ............................................................................................................................................................25
Experiments with commercially-sourced DHAA..................................................................................... 25 Methods ..........................................................................................................................................................25 Results ............................................................................................................................................................26
Attempts to determine AA in red-blue juices by the titrimetric method................................................... 26 Methods ..........................................................................................................................................................27 Results ............................................................................................................................................................27
Discussion ............................................................................................................................................... 28
CHAPTER 4 ........................................................................................................................................................ 31
LONG-TERM STORAGE EFFECT OF TOTAL DARKNESS AND FLUORESCENT LIGHTS ............................................ 31 Introduction............................................................................................................................................. 31 Methods................................................................................................................................................... 31
Juice formulations...........................................................................................................................................31 Storage conditions ..........................................................................................................................................31
Results ..................................................................................................................................................... 33 Discussion ............................................................................................................................................... 39
CHAPTER 5 ........................................................................................................................................................ 41
THE EFFECTS OF SHORTER TERM TREATMENTS ON THE FATE OF ASCORBIC ACID IN FRUIT JUICES............... 41 Introduction............................................................................................................................................. 41 Effect of pasteurisation on AA in fruit juices .......................................................................................... 42
Method............................................................................................................................................................42 Results and discussion ....................................................................................................................................42
Effect of temperature during short term storage..................................................................................... 43 Method............................................................................................................................................................43 Results and discussion ....................................................................................................................................43
Effect of deliberate exposure to air at two temperatures ........................................................................ 45 Methods ..........................................................................................................................................................45 Results and discussion ....................................................................................................................................45
Effect of two daylight conditions on AA concentration in juices............................................................. 46 Methods ..........................................................................................................................................................46 Results and discussion ....................................................................................................................................48
CHAPTER 6 ........................................................................................................................................................ 50
CONCLUSION.................................................................................................................................................... 50
REFERENCES .................................................................................................................................................... 54

viii
List of tables
Table 1. Concentration ranges of vitamin C in several human tissues.....................................3
Table 2. Concentration of vitamin C in common fruits and vegetables ...................................9
Table 3. Claimed concentration of AA in the Keri family of brands in New Zealand...........14
Table 4. Claimed concentration of AA in some other popular juices in New Zealand..........15
Table 5. Reproducibility and recovery of AA spiked into selected Keri juices, using the titration method ........................................................................................................19
Table 6. Precision of the chromatographic method................................................................22
Table 7. Direct comparison of the titrimetric and chromatographic methods........................23
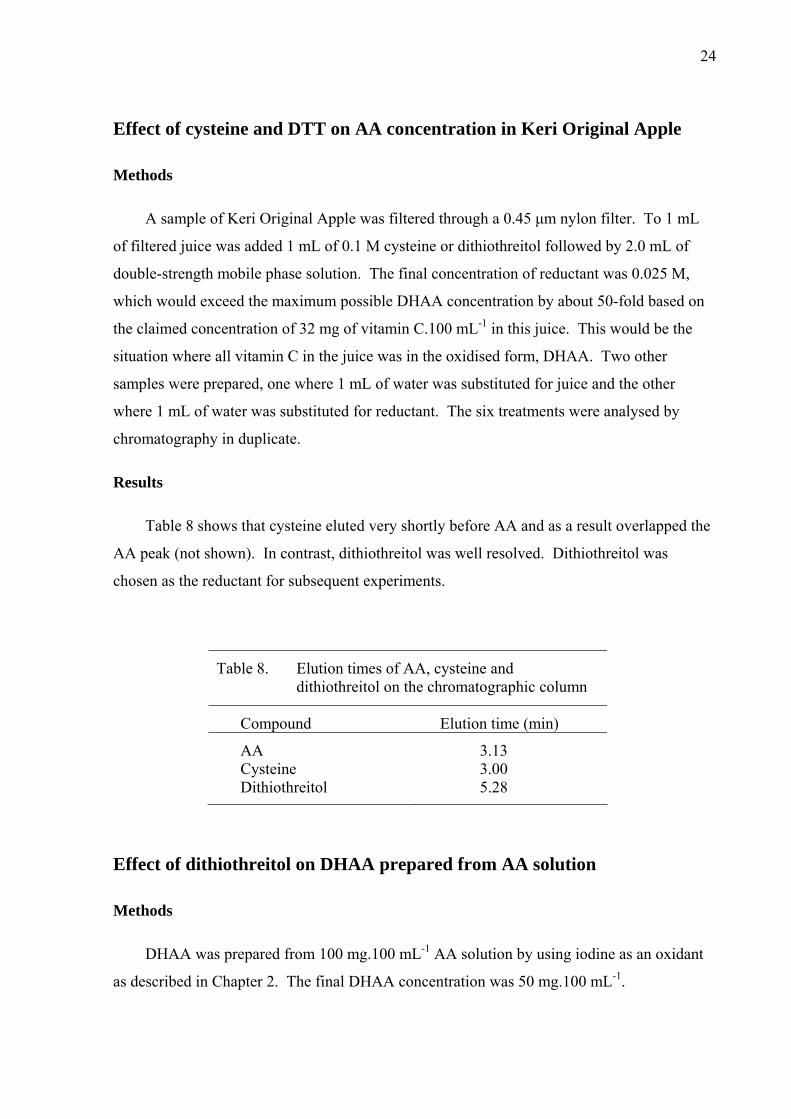
Table 8. Elution times of AA, cysteine and dithiothreitol on the chromatographic column..24
Table 9. Effect of dithiothreitol on prepared DHAA..............................................................25
Table 10. Effect of dithiothreitol on commercially-sourced DHAA........................................26
Table 11. Titration results for Thexton’s Blackcurrant and AA treated with activated charcoal and filtered through Celite........................................................................................27
Table 12. Overall effect of fluorescent light and storage to 270 days on the retention of AA in fruit juices.................................................................................................................34
Table 13. Effect of DTT on the concentration of AA in fruit juices stored under fluorescent light for 70 days........................................................................................................38
Table 14. Effect of DTT on the concentration of AA in fruit juices stored under fluorescent light for 101 days......................................................................................................38
Table 15. Effect of DTT on the concentration of AA in fruit juices stored under fluorescent light for 241days.......................................................................................................38
Table 16. Loss of AA during pasteurisation of fruit juices (mg.100 mL-1).............................42
Table 17. Overall effect of storage temperature to 64 days on the retention of AA in fruit juices.........................................................................................................................43
Table 18. Rates of AA loss in Keri Original Orange under the treatments: darkness, fluorescent light, ultraviolet-filtered daylight/darkness, daylight/darkness. ............49

ix
List of figures
Figure 1. Structures of L-ascorbic acid and related compounds. The two compounds marked with an asterisk have vitamin C activity. From (Gregory, 1996)..............................5
Figure 2. Structure of ascorbic acid. From Deutsch (1998)......................................................6
Figure 3. Mechanism for the oxidative and anaerobic degradation of ascorbic acid. Structures with bold line are primary sources of vitamin C activity. Abbreviation: AH2, fully protonated ascorbic acid; AH-, ascorbate monoanion; AH*; semidehydroascorbate radical; A, dehydroascorbic acid; FA, 2-furoic acid; F, 2-furaldehyde; DKG, 2,3-diketo-1-gulonic acid; DP,3-deoxypentosone; X, xylosone; Mn+, metal ion catalyst; HO2*, perhydroxylradical. From (Gregory, 1996) ...................................................7
Figure 4. The structure of 2,3-diketo-1-gulonic acid (DKG). From (Gregory, 1996)..............8
Figure 5. Schematic of industrial production of vitamin C. DAKS is diacetoneketo-1-gulonic acid and KGA is 2-keto-1-gulonic acid. (Competition Commission, 2001)...........12
Figure 6. Mechanism of prevention of colour formation by ascorbic acid. From (Marshall, Kim, & Wer, 2000)...................................................................................................13
Figure 7. Redox reaction between AA and 2, 6-dichlorophenolindophenol (DCPIP) in acid solution. From (Marshall, Kim, & Wei, 2000)........................................................17
Figure 8. Typical calibration curve for the titrimetric method of AA determination ..............18
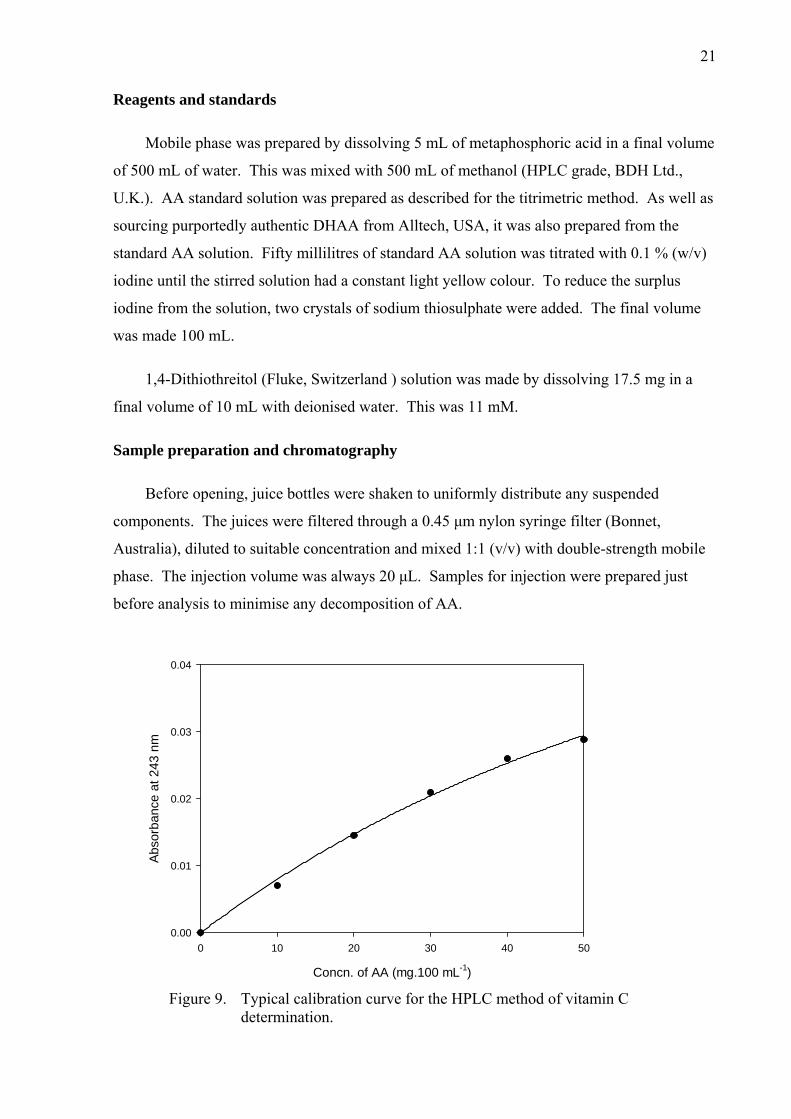
Figure 9. Typical calibration curve for the HPLC method of vitamin C determination..........21
Figure 10.Visible spectra of Thexton’s Blackcurrant juice at a range of pH values................28
Figure 11.Display of juices under fluorescent light .................................................................32
Figure 12.Room air temperature plotted over 270 days. Data points are means on a given day, and the line is a quadratic line of best fit for which R2 was 0.61 ............................33
Figure 13.Effect of storage time under light and dark conditions on AA concentration in Keri Original Apple and Keri Original Orange. The horizontal line indicates the claimed concentration of vitamin C .......................................................................................34
Figure 14. Effect of storage time under light and dark conditions on AA concentration in Keri Crush Tropical and Keri Crush Apple Orange Mango (AOM). The horizontal line indicates the claimed concentration of vitamin C ....................................................35
Figure 15. Least squares lines of best fit for Keri Original Apple and Keri Original Orange under light and dark storage conditions....................................................................36
Figure 16. Least squares lines of best fit for Keri Crush Apple Orange Mango for both storage conditions and Keri Crush Tropical for storage in the light.....................................37
Figure 17. Effect of different temperatures on AA concentration in Keri Original Orange and Keri Original Apple. For clarity, Keri Crush Tropical is not plotted but shows the same kinetics as Apple .............................................................................................44
Figure 18. Effect of headspace air on AA concentration in Keri Original Orange stored in refrigeration and ambient room temperature............................................................46
Figure 19. Display of juices exposed to sunlight 47
Figure 20. Effect of two daylight conditions on AA concentration in Keri Original Orange and Keri Original Apple..................................................................................................48

1
Chapter 1
Introduction
History of vitamin C in human health
Vitamins are organic compounds required in small amounts for metabolism in the body.
They are not source of energy to the body. Their function is to promote a wide variety of
biochemical and physiological processes necessary for life. Thirteen vitamins are recognised
in human nutrition and these are divided into two groups on the basis of their solubility – fat
soluble and water soluble. Vitamin C is a water soluble vitamin.
Vitamin C is chemically the simplest of the vitamins and, perhaps for these reasons, was
first to be isolated, characterised and to have its structure determined.
Although the name and identity of vitamin C was not recognised until 1919, its effects
have been felt in history through the disease called scurvy, or scurfy (Old English). The name
was perhaps derived from the Scandinavian terms, skjoerberg and skorbjugg, meaning rough
skin, among other names. Scurvy is a disease characterised by abnormal bone growth, joint
pains, bleeding gums, and tiny blue scars on skin. If untreated it is eventually fatal. Scurvy
can be called a disease of imperialism because countries like Britain, Portugal and Spain had
to develop strong navies to extend their empires and to defend their far-away colonies.
Scurvy was a major problem for these navies, and, as is well established now, is caused by
vitamin C deficiency. Indirectly this was caused by the unbalanced diets aboard ships.
Vegetables and fruits are the principal sources of vitamin C but these did not keep well nor
were popular, and sailors were nourished instead on a diet of cured meat, cheese, biscuits, and
rum.
The impact of scurvy was severe. For example, Vasco da Gama lost 100 of 150
companions on his way to India, when he first rounded the Cape of Good Hope between 1497
-1499. One half of the original 60 colonists of Plymouth died of scurvy in 1628 and scurvy
continued to be a scourge even to the start of the 20th century (Rucker, Suttie, Donald, &
Machlin, 2001). It has been estimated that over a million seamen have died of scurvy during
the 17th and 18th centuries alone (Sauberlich, 2000). It was described in the Ebers Papyrus of

2
around 3500BP and by Hippocrates. It is said that Crusaders lost more men
through scurvy then killed in battle. In 1772 Captain James Cook, proved that long voyage
could be successful without scurvy development if the sailors were provided with fruits and
vegetables including fermented cabbage (Groff, Gropper, & Hunt, 1995). In the mid 18th
century, James Lind, a British navy surgeon, conducted controlled experiments with sailors’
diets and published his findings in A Treatise of the Scurvy (Lind, 1753). He found that foods
like lemons and oranges helped in recovery from scurvy and recommended they be carried on
ships. These findings were not widely accepted by the rest of the world and scurvy continued
to lead to widespread death throughout the 19th century (Groff et al., 1995). Starting from
1795, one Sir Gilbert Blane, a physician to the British navy, made lemon juice a regular issue
to seafarers. This is the origin of the term ‘limies’, a colloquial term applied to British
seamen of the time. In short, scurvy at sea was conquered because of the activities of Cook,
Lind and Blane and probably others and by the end of 1800; the connection between scurvy
and diet was established.
In 1912, Casimir Funk of the Lister Institute in London proposed that diseases like beri-
beri, dropsy, scurvy and pellagra could be cured by nitrogen-containing compounds,
specifically amines. He referred to them as ‘vital amines’ abbreviated to vitamines. The ‘e’
was later dropped and the compound class is now universally called vitamins (Davies, Austin,
& Partridge, 1991). Sir William Drummond (1919), also at the Lister Institute, described
antiscorbutic factor as ‘water soluble C’. As the term ‘vitamin’ was adopted for essential
factors, so antiscorbutic factor was designated vitamin C (Bucci, 1998). Albert Szent-
Gyorgyi, the famous biochemist, who was interested in oxidation-reduction reactions
occurring at the molecular level in living systems, isolated an off-white crystalline substance
from the adrenal cortex of cattle. He first named it ‘ignose’ then ‘Godnose’ and finally
‘hexuronic acid’, which gave colour tests characteristic of sugars (Coultate, 2002). Later he
isolated this compound in much greater quantities from paprika and renamed it ‘ascorbic acid’
because it prevented scurvy. Later work by Hayworth, a leading structural organic chemist,
finally led to synthesis of vitamin C in the laboratory in 1933 (Bucci, 1998). This work paved
the way to large scale commercial production of vitamin C that continues to this day. Current
world production is estimated at approximately 80,000 tonnes per year with a worldwide
market in excess of U.S. $600 million (Competition Commission, 2001).

3
Biological effects of vitamin C
According to Stone (1972), an ancient genetic mutation left the primate virtually alone
among animals in not producing ascorbic acid. The mutation was the loss of the ability to
synthesise L-gluconolactone oxidase, which if active would catalyze the conversion of L-
glucono-γ-lactone to L-ascorbic acid (Rucker et al., 2001). Humans, other primates, guinea
pigs and fruit bats are unable to synthesise L-ascorbic acid. Therefore, they require it in their
diet (Navarra & Lipkowitz, 1996). (In Stone’s opinion, by treating consumption of vitamin C
as a minimum daily requirement instead of the crucial enzyme deficiency it really is, humans
are living in a state of sub-clinical scurvy whose symptoms have been attributed to other
ailments.)
Vitamin C is present in all living tissues (Sardesai, 1997). No particular organ acts as
storage reservoir for vitamin C but its concentration is higher in certain tissues as the pituitary
and adrenal glands, eye lens and leucocytes (Basu & Dickerson, 1996). Table 1 shows
concentration ranges in some human tissues.
Table 1. Concentration ranges of vitamin C in several human tissues
Tissue Vitamin C (mg.100 g -1)
Tissue Vitamin C (mg.100 g -1)
Pituitary gland 40-50 Brain 13-15 Adrenal gland 30-40 Liver 10-16 Leucocytes 35 Lungs 7 Eye lens 25-31 Plasma 0.4-1.0
From Basu and Dickerson (1996) p.130
The symptoms of scurvy develop after prolonged deficiency of vitamin C intake that
results in defective collagen synthesis, tissue repair, and synthesis of lipids and proteins. If
vitamin C is completely withdrawn from the diet it takes between 100 and 160 days for
scurvy symptoms to develop. Mild scurvy symptoms appear when the body’s vitamin C
content is less than 300 mg (Basu & Dickerson, 1996). Vitamin C functions both as a
reducing agent and as an antioxidant, and is required for many physiologic functions,
including metabolism of iron and folic acid, resistance to infection, and integrity of blood
vessels (Laumann & Wong, 2005).

4
Vitamin C is a cofactor required for the function of several hydroxylases. In
scurvy, the absence of vitamin C reduces prolyl hydroxylase activity. This enzyme is
required to form hydroxyproline, an amino acid found in collagen. Hydroxyproline in
collagen stabilises the collagen triple-helix structure by forming interstrand hydrogen bonds.
Collagen lacking hydroxyproline is fragile and contributes to the clinical manifestations of
scurvy, including haemorrhage beneath the skin due to fragility of blood vessel walls.
Collagen contributes about one fourth of total protein mass and is the most abundant
protein in human body (Wildman & Medeiros, 2000). It is a fibrous protein which accounts
for the toughness and tensile strength of connective tissue and any changes in connective
tissue leads to great affect on health and integrity of the rest of the body (Elliott, 2002). The
structure of blood vessels, bones, skin, teeth, cartilage, tendons and ligaments are based on
collagen. Given the ubiquity of collagen in the body it is not surprising that the effects of
vitamin C deficiency are manifest in many tissues, at many stages of life, and is implicated in
a range of degenerative diseases and conditions (Warner, 1987). For example, whereas
ageing is inevitable, adequate vitamin C intake is purportedly useful at slowing ageing
through its effects of skin and bone, two collagen-rich tissues. One current theory of ageing
(random damage theories) implicates oxidative damage caused by free radicals as the key
driver of degeneration (Warner, 1987). Given the antioxidative role of vitamin C, it is again
not surprising that it is implicated in ageing phenomena. For example, vitamin C helps in
delaying age-related macular degeneration (Murray, 1996).
Cancers become more common as the human body ages. Vitamin C’s role in reducing
the risk of carcinogenesis includes acting as an antioxidant, blocking formation of
nitrosamines and feacal mutagens, enhancing immune system response and aiding
detoxification by liver enzymes (Gaby, Bendich, Singh, & Machlin, 1991).
Thus whereas the symptoms of scurvy are the most obvious effects of vitamin C
deficiency, the vitamin has a broad range of effects throughout the body.
Absorbance and metabolism of ascorbic acid
Absorption occurs readily in the buccal mucosa, stomach and small intestine by means of
a sodium and energy-dependent transport system (Sardesai, 1997). After absorption, it is
distributed throughout the water phase of the body by diffusion. The kidney participates with
the intestine in maximizing vitamin C conservation in the body. Vitamin C circulates in the

5
bloodstream mainly in the free (nonprotein bound) and reduced form. Only 5 % of
the circulating vitamin C is represented by dehydroascorbic acid (Ball, 1998), an oxidation
product to be discussed later. The efficiency of absorption decreases as intake increases.
When absorbed in quantities that exceed the body’s requirements it is excreted in the urine
(Basu & Dickerson, 1996).
Though iron is abundant in many foods only about 10 % is absorbed from a typical
Western diet (Coultate, 2002). In New Zealand for example it is estimated that 3 % of young
people and 6 % of adults are subclinically or clinically iron deficient (Ministry of Health,
2003). This is considered a significant health issue. In its reduced ascorbic acid form,
vitamin C aids iron absorption from the gut. The reduced form of iron, Fe(H2O)62+, is more
soluble in the alkaline environment of the small intestine than Fe(H2O) 6 3+. Acting as a
reductant, ascorbic acid thus improves iron absorption (Wardlaw, 1999).
Structure and properties of vitamin C
Figure 1. Structures of L-ascorbic acid and related compounds. The two compounds marked with an asterisk have vitamin C activity. From (Gregory, 1996)

6
Vitamin C comprises the compounds which show the biological activity of
authentic L-ascorbic acid (Figure 1). These include salts and esters of ascorbic acid, and its
oxidised derivative L-dehydroascorbic acid.
The oxidation of L-ascorbic acid to L-dehydroascorbic acid is freely reversible, so both
forms are the primary biological dietary sources of vitamin C. However, in the reductive
environment of the body (the partial pressure of oxygen is typically 2 mm Hg) vitamin C is in
its reduced form. Its stereoisomer about carbon 5, L-isoascorbic acid, commonly called
erythorbic acid, has little vitamin C activity but still behaves as an effective reductant and is
used in this role in many foods (Eittenmiller & Landen, 1999).
Figure 2. Structure of L- ascorbic acid. From Deutsch (1998)
Ascorbic acid (C6H8O6), now abbreviated to AA, is a common name for vitamin C.
Depending on the nomenclature used it has a number of formal systematic names, for
example L-3-ketothreohexuronic acid γ-lactone (Belitz & Grosch, 1999). AA is a white,
crystalline, highly polar compound, which is highly soluble in water at ambient temperature
(330 g.L-1) (Eittenmiller & Landen, 1999), but insoluble in non-polar solvents. AA is a
hexose derivative and is nominally a carbohydrate. Acidic carbohydrates are generally
thought of as containing a carboxylic acid group, but no free carboxylic group is present in
AA (Figure 2). A carboxyl group has been lost to the lactone structure. Rather, the hydroxyl
groups on carbons 2 and 3 are ionisable. In particular, the hydroxyl group on carbon 3 has a
pKa of 4.04 which is in the pH range of food products. The pKa for the hydrogen linked to
the oxygen atom on carbon 2 is 11.4.
AA is added to food as the free acid or the neutralised sodium salt, or as an ester of AA
such as ascorbyl palmitate, which is understandably useful in food systems containing fat. In

7
that ester, the hydroxyl group on carbon 6 forms the ester. AA is very stable in the
dry crystalline form. It is also relatively stable in acid solution, but very prone to oxidation in
alkaline solution (Eittenmiller & Landen, 1999). The most susceptible form of AA is the
ascorbate dianion (on carbons 2 and 3), which forms under strongly alkaline solution, and the
least susceptible is the fully protonated form. In most foods susceptibility is governed by the
ratio of the monoanion to the fully protonated form (Buettner, 1993). AA is sensitive to
oxidation on exposure to heat and particularly in the presence of Cu2+ and Fe3+, so food
cooked in copper and non-stainless iron utensils loses ascorbic acid quickly.
Figure 3. Mechanism for the oxidative and anaerobic degradation of ascorbic acid. Structures with bold line are primary sources of vitamin C activity. Abbreviation: AH2, fully protonated ascorbic acid; AH-, ascorbate monoanion; AH*; semidehydroascorbate radical; A, dehydroascorbic acid; FA, 2-furoic acid; F, 2-furaldehyde; DKG, 2,3-diketo-1-gulonic acid; DP,3-deoxypentosone; X, xylosone; Mn+, metal ion catalyst; HO2*, perhydroxylradical. From (Gregory, 1996)

8
According to a number of authorities (Eittenmiller & Landen, 1999; Jackson,
Knize, & Morgan, 1999), the oxidation of AA can be catalysed by metal ions, using
molecular oxygen as the substrate, or by superoxide radical generating an intermediate
semidehydroascorbate radical (Figure 3). The metal catalysed path is by far the fastest, by
several orders of magnitude (Gregory, 1996). Cu2+ is roughly 80 times more active as a
catalyst than Fe3+. A second superoxide radical completes the oxidation process yielding the
triple ketone cyclic product dehydroascorbic acid (DHAA), which as noted before still has
vitamin C activity because mild reducing agents are capable of reforming AA.
However, further reaction of DHAA involves irreversible hydrolysis of its lactone
yielding 2,3-diketo-1-gulonic acid (DGK) (Figure 4). This is a conventional carboxylic acid.
Neither DGK nor its subsequent degradation products – which include Maillard reaction
products – have any vitamin C activity. The hydrolysis of DHAA to DGK is favoured by
alkaline conditions.
Figure 4. The structure of 2,3-diketo-1-gulonic acid (DKG). From (Gregory, 1996)
Another pathway of AA degradation proceeds anaerobically (Gregory, 1996), but
understanding of this pathway is more limited. According to Gregory, cleavage of the 1, 4-
lactone bridge to DKG occurs without an intermediate DHAA step. The details are
unimportant here except that anaerobic degradation occurs maximally around pH 3 to 4,
which clearly contrasts with the aerobic pathway. This pH range may reflect the effects of pH
on the opening of the lactone ring and on the relatively high concentration of an intermediate
anion in this pH range. Gregory notes that the rate constant for the anaerobic pathway is
between 100 and 1000 times slower than that for the oxidative pathway.

9
Once the ring structure is opened on DKG formation (Figure 3), the way is
clear to generate a number of subsequent breakdown products. The degradation of sugars and
ascorbic acid are similar (Gregory, 1996) which is perhaps not surprising considering that
DKG is a sugar acid that by decarboxylation yields aldehydes that can take part in the
Maillard reaction, ultimately leading to the formation of brown pigments and other
compounds in, for example, orange juice (Zerdin, Rooney, & Vermue, 2003). As is well
known for the Maillard reaction, the exact pattern of breakdown depends on pH, composition,
water activity and temperature (Lopez-Nicolas, Nunez-Delicado, Sanchez-Ferrer, & Garcia-
Carmona, In press).
Sources of vitamin C in foods
Vitamin C is widely distributed in nature, particularly in the plant kingdom. It occurs in
relatively high concentrations in fruits and vegetables but to a much lesser extent in animal
tissues and animal-derived products. Nearly 90% of vitamin C in the human diet is obtained
from fruits and vegetables (Zee, Carmichael, Codere, Poirier, & Fournier, 1991).
Table 2. Concentration of vitamin C in common fruits and vegetables
Fruit Typical vitamin C concentration (mg.100 g-1)
Vegetable Typical vitamin C concentration (mg.100 g-1)
Blackcurrants 200 Parsley 150 Orange 50 Broccoli 110 Strawberries 60 Cauliflower 60 Pineapple 25 Cabbage 40 Bananas 11 Peas 25 Peaches 6 Carrot 6 Plums 3
From Coultate (2002) p. 282
As discussed earlier, humans cannot synthesise vitamin C so the requirement must all
come from diet. Vegetables and fruits are the primary sources (Table 2). As might be
expected from basic biological experience, the concentration of vitamin C in plant foods
depends upon various positional, developmental, environmental, post harvest factors and even
chlorination of water. For example a broccoli head contains about 160 mg.100 g-1 whereas its
stem contains a lower 110 mg.100 g-1, but on cooking for 10 minutes stem losses are 20 %

10
whereas head losses are more than 40 % (Basu & Dickerson, 1996).
Concentration of vitamin C in freshly picked potatoes in summer is about 30 mg.100 g-1
whereas in potatoes stored for nine months contain about 8 mg.100 g-1. Sliced cucumber
loses 50 % of vitamin C in first three hours (Murray, 1996).
Cereal grains are a poor source of vitamin C (Indian Gyan, 2000). Animal foods are also
relatively poor sources except for some organ meats, liver and brain being good examples
(Table 1). In freshly secreted cow’s milk vitamin C is predominantly in the form of ascorbic
acid but human milk has a similarly low concentration, around 5 mg.100 g -1 (Clark, 2005).
Whenever plant foods are eaten raw rather than cooked, the availability of vitamin C is
generally higher because losses are accelerated on cooking. Because vitamin C is water
soluble it is easily extracted and lost during washing and cooking of vegetables in water.
Cooking losses of vitamin C depend upon degree of heating, surface area exposed to water,
oxygen, pH and presence of transition metals (Moser & Bendich, 1990).
Synthetic ascorbic acid is available in a wide variety of diet supplements, for example
tablets, capsules, chewable forms, crystalline powders, effervesescent tablets, and liquid
forms. Buffered ascorbic acid and esterified forms of ascorbic acid as ascorbyl palmitate are
also available commercially. Naturally occurring and synthetic ascorbic acid are chemically
identical and there is no known differences in their biological activities or bioavailabilty.
Many breakfast cereals and other foods are fortified with vitamin C. For example, in the
New Zealand retail market Kellog’s Corn Flakes claims 20 mg.100g-1 and Kellog’s Frosties,
Coco Pops and Fruit Loops each claim 33.3 mg.100 g-1. The cocoa-based drink powder Milo
(Nestlé) contains 90 mg.100 g-1. The motive for adding vitamin C to foods in general is
probably two-fold. First it is a reductant useful in maintaining food quality on storage but is
also useful for making implicit or explicit health claims.
Recommended daily allowances and sources in the Western diet
The recommended daily allowance (RDA) varies internationally. Thus for an adult male
in the U.K., the RDA is 30 mg.day-1 whereas in the U.S.A. it is 60 mg.day-1 (Basu &
Dickerson, 1996). In New Zealand it is 45 mg.day-1 for adults. Within-country RDA varies
according to age and physical condition of the body. Adults have a higher requirement than
children (Whitney & Rolfes, 1992). During pregnancy, the RDA is 60 mg.day-1 and increases

11
to 85 mg.day-1 during lactation (Ministry of Health, 2003). Smoking is a stressor
that dictates a higher vitamin C intake.
The vitamin C all comes from diet. The concentration in human milk is 3 to 6 mg.100 g-
1, so a New Zealand neonate feeding on mother milk requires less than 1 L per day to achieve
its RDA. On the other hand cow milk contains only 0.5 to 2 mg.100 g-1 (Rucker et al., 2001).
It cannot fulfil the infant’s ascorbic acid requirement and thus needs to be supplied form other
sources. The powder formulas used in New Zealand contain added vitamin C. For example,
Nutritica Karicare Gold and Nutritica Karicare Goat contain 112 mg and 75 mg.100 g-1,
respectively.
In older humans the sources of vitamin C are very much more complex. Many children,
(and adults) are averse to eating vegetables and fruit, but potatoes, milk and meats do provide
a base level. Certainly scurvy is extremely rare, so any deficiency must be subclinical at
worst. However, as proposed by Stone (1972) and discussed earlier, humans may be living in
a state of subclinical scurvy where other ailments may be scurvy-related.
The major food contributors of vitamin C in the Western (principally American) diet are
oranges, orange juice, grapefruit and grapefruit juice, tomatoes and tomato juice, fortified
fruit drinks, tangerines and potatoes (Wardlaw, 1999). Supplement consumption is common.
More than 40 % of older people in the U.S.A. take vitamin C supplements, as do almost 25 %
of all adults take vitamin C. In spite of the widespread consumption of vitamin C
supplements, one third of all adults in the U.S.A. get less vitamin C from their diet than is
recommended by the National Academy of Sciences, and 1 out of every 6 adults gets less than
half the amount recommended.
According to the Life in New Zealand Research Unit’s 1999 National Nutrition Survey
(as cited in Ministry of Health, 2003), the principal sources of vitamin C in New Zealand diet
are vegetables and non-alcoholic beverages (both 26 %), fruits (23 %) and potatoes and
kumara (13 %). The non-alcoholic beverages are fruit juices and fruit drinks that contain
either naturally occurring vitamin C and or added vitamin C. Apart from receiving useful
amount of vitamin C, fruit juices are of great value to people on low sodium diets as they
have relatively low sodium and high potassium content.

12
Industrial production of vitamin C
Current world production is estimated at approximately 80,000 tonne per year. Vitamin
C production is much higher than for any other vitamin.
It is synthesised both biologically and chemically from D-glucose. The Reichstein
chemical process developed in 1930s uses a single fermentation step followed by a purely
chemical route. The more recent two-stage fermentation process, developed in China in early
1960s (Competition Commission, 2001), uses additional fermentation to replace a later part of
the Reichstein process.
In both processes the first step involves oxidation of sorbitol (sorbitol itself is made by
reducing glucose at high temperature) to sorbose by fermentation with the bacterium
Acetobactor xylinium.
Figure 5. Schematic of industrial production of vitamin C. DAKS is diacetoneketo-1-gulonic acid and KGA is 2-keto-1-gulonic acid. (Competition Commission, 2001)

13
In the Reichstein process, still used by the chemical giants Roche, BASF and
Takeda, sorbitose is transformed into diacetoneketogulonic acid (DAKS) in a two stage
chemical process. It is first converted to diacetone sorbose by addition of acetone, and then
oxidised with chlorine and sodium hydroxide to produce DAKS. Subsequently, DAKS is
rearranged with an acid catalyst to form vitamin C. Figure 5 summarises the steps.
In the two-stage fermentation process, sorbose is fermented to 2-ketogulonic acid
(KGA). Finally KGA is processed chemically (Thomas, Powell, & Grant, 2001) to produce
vitamin C. Process development continues with a focus on biotechnological processes.
Industrial vitamin C is used in a very wide range of food products among them non-
alcoholic drinks. Subsequent text in this thesis will usually refer to vitamin C as ascorbic acid
(AA).
Ascorbic acid in non-alcoholic drinks
Ascorbic acid (AA) is used commonly in the beverage industry, especially those made
from fruit juices. The technical reasons are to restore the AA lost value during processing,
and to contribute to the product’s appearance and shelf life. (The addition is also exploited to
make implicit health claims in promotion of these drinks, as is obvious from advertising
literature.) In the manufacture of fruit juices from fruit such as apple and peach, AA may be
added during crushing, straining and processing to prevent enzymatic browning and flavour
deterioration (Kacem, Marshall, Shiremean, Cornell, & Matthews, 1987). In these roles it is
acting as a reductant, reversing the primary reaction of polyphenol oxidase, semiquinone
formation.
Figure 6. Mechanism of prevention of colour formation by ascorbic acid. From (Marshall, Kim, & Wer, 2000)

14
AA also reduces oxygen concentration in the headspace of drink containers
to minimise future oxidation of the product. About 3.3 mg of AA will remove the oxygen in
1 mL of headspace (Takeda USA Inc., n.d.).
Vitamins and minerals are no longer classified as additives under the food standard code
(Food Standards Australia New Zealand), but AA has a declaration code number (E1) because
it also acts as an antioxidant. AA can be added in a number of forms: as the free acid E 300;
as sodium ascorbate E 301, calcium ascorbate E 302; and fatty acid esters of ascorbic acid E
304, e.g. ascorbyl palmitate and ascorbyl stearate.
There is a wide range of commercial fruit juices on the New Zealand market. These are
usually made from frozen concentrated juice and puree bases. One family of brands is the
Keri, Thexton and E2 range of juices. These juices generally have a higher AA concentration
than freshly squeezed or not-from-concentrate (NFC) juice.
The claimed concentrations of AA in some common New Zealand juices are listed in
Table 3 and 4.
Table 3. Claimed concentration of AA in the Keri family of brands in New Zealand
Product name AA concentration mg.100 mL-1
Product name AA concentration mg.100 mL-1
Thexton’s Blackcurrant 45 Keri Original Apple 32 Thexton’s Cranberry 7.5 Keri Original Orange 32 Thexton’s Red Grape 7.5 Keri Original Orange Extra 32 Thexton’s Apple Raspberry 6 Keri Tomato 32 Keri Original Grapefruit 32 Keri Spiced Tomato 32 Keri Original Pineapple 32 Keri Traditional Apple 32
1 E numbers are code numbers for different food additives on the label to avoid the confusion caused by some additives having more than one name, or additives having similar names. ‘E’ refers to the fact that the food ingredient list is suitable for the European Union market and potentially other markets.

15
Table 4. Claimed concentration of AA in some other popular juices in New Zealand
Product name AA concentration (mg.100 mL-1)
Product name AA concentration (mg.100 mL-1)
Freshup Apple Nectar 35 Simply Squeezed Berry fruit 40 Freshup Apple Orange 35 Simply Squeezed Orange 35 Freshup Orange 35 Simply Squeezed Tropical 30 Just Juice Cranberry 35 Simply Squeezed Grapefruit 25 Just Juice Passionfruit 35
The issue
As discussed in the Section Structure and properties of vitamin C, AA is stable under
acidic conditions so in theory AA should be stable in fruit juices. These are always acidic.
However, a substantial literature shows that AA does degrade in stored drinks. Johnston and
Bowling (2002) claimed a decline in AA on storage of a range of orange juices. Loss of AA
on storage for four months was studied by Kabasakalis, Siopidou and Moshatou (2000), who
found a loss of 29 to 40 % of AA in four months. As temperature rises the rate of loss of AA
in citrus juice concentrates increases (Burdurlu, Koca, & Karadeniz, 2005). Residual oxygen
in the headspace has shown to be the primary cause for AA reduction in fruit juices (Kirk,
Dennison, Kokoczka, & Helman, 1977; Riemer & Karel, 1978). Thus, there is no shortage of
literature on the stability of vitamin C in fruit juices.
Both water soluble and fat soluble vitamins are variously included in Keri products. The
company has no product specific information on the fate of vitamins during storage or shelf
life as predicted by the best-before dates.
For technical and legal reasons, the company wanted to know the fate of vitamin C in its
formulated fruit juices. It is aware that literature on the stability of vitamin C in fruit juices
exists, but clearly there is no substitute for direct determination of bioavailable AA in its
products at all stages between production and consumption. In particular, it wanted to be sure
that the stated concentration of vitamin C is maintained up to the acceptable level through its
supply chain (manufacture-customer-consumption). Also there is no information for a range
of other storage and consumption situations, for example, seasonal effects and slow
consumption of large 3L bottles of juices. This research sets out to fill those gaps in
knowledge.

16
Chapter 2
Basic Methodologies
Introduction
In this chapter the basic methods used to measure the concentration of AA and
bioavailable vitamin C (AA plus DHAA) in juices are described, along with a summary
description of the experiments performed on the selected juices. Details specific to each
experiment are presented in the relevant chapter.
Titrimetric Method
Principle
Vitamin C is chemically both a reductant and a weak acid. The titrimetric method for
determining ascorbic acid is based upon the reduction of the dye 2,6-
dichlorophenolindophenol (DCPIP) with AA in acidic solution. As DHAA is not estimated
by this method, it does not determine the bioavailable vitamin C activity of a food. According
to Nisperos-Carriedo, Busling and Shaw (1992) the concentration of DHAA with respect to
AA in commercial orange juice ranges from 0 to 0.2 % which is negligible. If these authors
are correct, the error in assessing bioavailable vitamin C activity by DCPIP will also be
negligible.
In its oxidised form, DCPIP is purple-blue in neutral or alkaline solution, and pink in
acidic solution. The reduced form is colourless at all pHs, so the end point is detected by loss
of colour (Figure 7). A persistent light pink signals the presence of excess unreacted dye and
therefore the end point. The titration is performed rapidly in the pH range 3 to 4. In the
absence of interfering substances, the capacity of the sample to reduce the dye is directly
proportional to the ascorbic acid content. The most common substances to interfere in the
vitamin C contents in the sample are the reductants sulphydryl compounds (e.g. glutathione
and cysteine), phenols, sulphites and certain metal ions (Eittenmiller & Landen, 1999).
Titration is performed in the presence of a phosphoric acid/acetic acid solution to
maintain acidity and to avoid direct oxidation of ascorbic acid at higher pH.

17
In this procedure detection of an end point will obviously be hard to detect
when the drink sample is blue, red or purple. Thus, Thexton’s Blackcurrant juice was to be a
problem to analyse. (This issue is addressed in Chapter 3.)
Figure 7. Redox reaction between AA and 2, 6-dichlorophenolindophenol (DCPIP)
in acid solution. From (Marshall, Kim, & Wei, 2000)
Reagents
All reagents were analytical grade and were obtained from common suppliers of
chemistry laboratory materials. Metaphosphoric/acetic acid solution (acid buffer) was
prepared by dissolving 15 g of (solid) metaphosphoric acid in 40 mL of acetic acid, the
mixture is gently stirred with a magnetic bar and finally diluted to 500 mL with distilled
water. Ascorbic acid standard solution was prepared by dissolving 100 mg of ascorbic acid
(BDH Ltd., U.K.) in 100 mL of water. Aqueous 2,6-dichlorophenolindophenol solution was
prepared by dissolving 50 mg of desiccated 2,6-dichlorophenolindophenol, sodium salt
dihydrate (Merck, Darmstadt, Germany), in 50 ml of water to which 42 mg of sodium
bicarbonate had been added. The solution was diluted to 200 mL, filtered through Whatman
No. 1 paper and stored protected from light.

18
Procedure
Aliquots (2.0 mL) of a standard ascorbic acid dilution series were placed in 50 mL
Erlenmeyer flasks containing 5.0 mL of acid buffer solution. For each flask, the mixture was
gently stirred with a magnetic bar. Titration was done rapidly with DCPIP solution from a
burette until the light pink colour of the reduced dye persists at least for five minutes. A
standard curve was constructed by titrating different concentrations of AA with DCPIP as
shown in Figure 8.
Con
cn. o
f AA
(mg.
100
mL-1
)
0 5 10 15 20
Volume of DCPIP solution (mL)
0
20
40
60
80
100
Figure 8. Typical calibration curve for the titrimetric method of AA determination
Sample preparation
Before opening a juice bottle for determination of AA, it was shaken to uniformly
distribute any suspended components. Titration was replicated with quadruplet 2.0 mL
aliquots of juice as done above with standard ascorbic acid solution. Concentrations were
calculated by reference to the standard curve.

19
Reproducibility and recovery test for AA in selected juices
A known amount of AA was added to several juices, and recovery was tested using the
titration method with eight replicates of each fruit juice. The results showed excellent
reproducibility and recovery (Table 5).
Table 5. Reproducibility and recovery of AA spiked into selected Keri juices, using the titration method
Fruit juice Determined mean value (mg.100 mL-1) (and CV %)
of unspiked juice*
Determined mean value (mg.100 mL-1) (and CV %)
of juice spiked with 100 mg of AA per 100 mL
Recovery (%)
Keri Original Apple 34.7 (1.00) 135.1 (0.27) 100.4 Keri Original Orange 84.5 (0.37) 185.0 (0.26) 100.4 Keri Crush Tropical 27.1 (1.28) 127.9 (0.24) 100.8
*Of eight replicates for all determinations. CV = coefficient of variation
Chromatographic method
As explained in the Introduction, both AA and DHAA are bioavailable. Thus
measurement of AA alone is theoretically insufficient in terms of claims. The titrimetric
method measures only AA so a method to measure AA and DHA had to be employed. Liquid
chromatography can be used to separate AA from DHAA and these analytes can be measured
independently.
In its analytical applications, liquid chromatography is usually called high pressure liquid
chromatography (HPLC). Whether in the gaseous (gas chromatography) or liquid state
(HPLC), the capacity of chromatography to separate one analyte from others depends on the
relative affinity of each analyte for a stationary phase (the packing in a column) and a mobile
gaseous or liquid phase or phases. There are a number of well-described HPLC methods that
can simultaneously measure AA and DHAA.
The two analytes have been separated on a number of phase including reversed phase
C18 (Gennaro & Abrigo, 1981), bonded-phase amine (Arakawa, Otsuka, Kurata, & Inaka,
1981), ion-pair reversed phase C18 (Madigan, McMurrough, & Smyth, 1996), and anion
exchange (Williams, Baker, & Schmit, 1973). Vanderslice and Higgs (1984) separated AA

20
and DHAA with an anion-exchange resin column, while fluorescence detection
was achieved through post-column in-line derivatisation involving oxidation of AA to DHAA
followed by reaction of the latter with o-phenylenediamine to form a fluorescent product.
Kall and Andersen (1999) described a related post-column derivatisation method, with direct
absorbance detection of AA at 247 nm, and indirect fluorescent detection of DHAA after a
post-column derivatisation. Ziegler, Meier, & Sticher (1987) estimated DHAA directly in
addition to AA, by separating the two compounds using reversed-phase HPLC with ion
suppression, and reducing DHAA to AA with dithiothreitol in a post-column in-line system.
With the facilities available at AUT the method of (Furusawa, 2001) was the most attractive.
Furusawa’s method claims to provide a simple and fast isocratic (unchanging mobile
phase) method for qualitative and quantitative estimation of AA and DHAA in commercial
fruit juices. This method requires minimum sample preparation with no derivatization
procedures. Two chromatographic runs are required. The first measures AA as present in the
juice and the second measures AA after any DHAA is reduced to AA with the powerful
reductant dithiothreitol. Thus AA and bioavailable AA can be measured.
As explained in Titrimetric Method above, blackcurrant and other similar anthocyanin
pigments render the titrimetric method nearly useless for such juices. The chromatographic
method avoids this problem. However, any pigment that coelutes with AA or DHAA would
cause problems if it absorbed at the detection wavelengths of AA and DHAA.
HPLC apparatus
The HPLC pump (LC-10AD, Shimadzu, Japan) has a dynamic range of 0.1mL. min-1 to
9.9 mL. min-1. The stainless steel column was a Synergi Polar-RP80A (Phenomenex,
California), measuring 250 mm x 4.6 mm and packed with a 4 μm particles of stationary
phase. This column is designed to resolve, among other analytes, polar acidic and basic
compounds in the rage pH 2 to pH 7. A guard column (Nova-Pak 4 μm 60A C18, Waters,
Ireland) was placed immediately upstream of the Synergi column to protect it from foreign
particles.
The detector was a SPD-M10AV (Shimadzu) diode array detector. Two wavelengths are
used, 220 nm for DHAA and 243 nm for AA. Samples were introduced automatically with a
SIL-10A injector (Shimadzu) maintained at 20°C.
21
Reagents and standards
Mobile phase was prepared by dissolving 5 mL of metaphosphoric acid in a final volume
of 500 mL of water. This was mixed with 500 mL of methanol (HPLC grade, BDH Ltd.,
U.K.). AA standard solution was prepared as described for the titrimetric method. As well as
sourcing purportedly authentic DHAA from Alltech, USA, it was also prepared from the
standard AA solution. Fifty millilitres of standard AA solution was titrated with 0.1 % (w/v)
iodine until the stirred solution had a constant light yellow colour. To reduce the surplus
iodine from the solution, two crystals of sodium thiosulphate were added. The final volume
was made 100 mL.
1,4-Dithiothreitol (Fluke, Switzerland ) solution was made by dissolving 17.5 mg in a
final volume of 10 mL with deionised water. This was 11 mM.
Sample preparation and chromatography
Before opening, juice bottles were shaken to uniformly distribute any suspended
components. The juices were filtered through a 0.45 μm nylon syringe filter (Bonnet,
Australia), diluted to suitable concentration and mixed 1:1 (v/v) with double-strength mobile
phase. The injection volume was always 20 μL. Samples for injection were prepared just
before analysis to minimise any decomposition of AA.
Concn. of AA (mg.100 mL-1)
0 10 20 30 40 5
0
Abso
rban
ce a
t 243
nm
0.00
0.01
0.02
0.03
0.04
Figure 9. Typical calibration curve for the HPLC method of vitamin C determination.

22
Helium gas was continually bubbled through all solutions to remove
dissolved air. Before analysis, the column was cleaned with acetonitrile followed by
methanol. The flow rate of mobile phase was increased slowly starting from 0.25 to 1.0 mL.
min-1, the chosen flow rate for chromatography.
The injection needle was automatically cleaned with methanol between samples. After
passing from the column, the separated solutes were sensed by the in-line diode array
detector. Runs typically took 20 minutes. A standard curve was constructed by eluting
different concentrations of AA under standard conditions (Figure 9).
Precision of the chromatographic method
Precision was tested on replicate samples prepared from Keri Original Apple in two
ways. In the first, 1 mL samples of filtered juice were placed in beakers to which was added 1
mL of double-strength mobile phase. This tested precision of replicate subsamples. These
were directly injection (20 μL as always) and the AA content determined (Table 6). In the
second, a single 1 mL sample with 1 mL of double-strength mobile phase was repeatedly
injected. This tested precision of injection (Table 6).
Table 6. Precision of the chromatographic method
Fruit juice Determined mean value (mg.100 mL-1) (and CV %) for replicate subsamples*
Determined mean value (mg.100 mL-1) (and CV %)
for replicate injections*
Keri Original Apple 56.6 (3.2) 57.9 (0.5)
*Of 10 replicates. CV = coefficient of variation .
The precision of automated replicate injections was much better than the precision
attained in replicated subsamples, presumably arising from pipetting errors. However, the
latter precision was considered adequate for the work in hand.

23
Chapter 3
Methods Refinement
Introduction
This chapter reports a comparison of the two analytical methods testing the juices,
developmental work on the chromatographic method, and experiments to overcome the colour
problem that prevents detection of the dichloroindophenol endpoint in the titrimetric method.
As discussed in Chapter 1, bioavailable vitamin C includes AA and DHAA. The simpler
titrimetric method detects only AA, so reducing agents can be used to regenerate AA from
DHAA for accurate determination of vitamin C. Possible reducing agents of value include L-
cysteine and dithiothreitol (DTT) that are added directly to juices before chromatography.
Comparison of the titrimetric and chromatographic methods
Table 7 compares the values obtained with four juices as determined by the two
methods. Due to an oversight, replicate determinations were obtained for the titrimetric
method but not the chromatographic method.
Table 7. Direct comparison of the titrimetric and chromatographic methods.
Fruit juice Claimed concentration of
vitamin C (mg.100 mL-1)
Determined mean value of AA
(mg.100 mL-1) (and CV %) by
titration*
Determined mean value of AA by chromatography (mg.100 mL-1)
Keri Original Apple 32 55.2 (2.4) 56.0 Keri Original Orange 32 70.1 (0.0) 79.0 Keri Crush Tropical 24 41.6 (0.0) 47.9 Keri Crush Apple Orange 24 43.8 (1.5) 49.1
*Of four replicates. CV = coefficient of variation
Recognising that no replication was applied in the chromatographic method, the results
appear similar with a hint that the latter may yield higher values. In future work the two
methods were never mixed so comparison within experiments will be valid.
24
Effect of cysteine and DTT on AA concentration in Keri Original Apple
Methods
A sample of Keri Original Apple was filtered through a 0.45 μm nylon filter. To 1 mL
of filtered juice was added 1 mL of 0.1 M cysteine or dithiothreitol followed by 2.0 mL of
double-strength mobile phase solution. The final concentration of reductant was 0.025 M,
which would exceed the maximum possible DHAA concentration by about 50-fold based on
the claimed concentration of 32 mg of vitamin C.100 mL-1 in this juice. This would be the
situation where all vitamin C in the juice was in the oxidised form, DHAA. Two other
samples were prepared, one where 1 mL of water was substituted for juice and the other
where 1 mL of water was substituted for reductant. The six treatments were analysed by
chromatography in duplicate.
Results
Table 8 shows that cysteine eluted very shortly before AA and as a result overlapped the
AA peak (not shown). In contrast, dithiothreitol was well resolved. Dithiothreitol was
chosen as the reductant for subsequent experiments.
Table 8. Elution times of AA, cysteine and dithiothreitol on the chromatographic column
Compound Elution time (min)
AA 3.13 Cysteine 3.00 Dithiothreitol 5.28
Effect of dithiothreitol on DHAA prepared from AA solution
Methods
DHAA was prepared from 100 mg.100 mL-1 AA solution by using iodine as an oxidant
as described in Chapter 2. The final DHAA concentration was 50 mg.100 mL-1.

25
Subsequently, the effect of a 10-fold molar excess of dithiothreitol on DHAA
was tested under standard dilution conditions (1 volume of DHAA, 1 volume of dithiothreitol
or water, 2 volumes of double-strength mobile phase). This procedure was duplicated and
retested in later work, reported in Chapter 5.
Results
Table 9 shows area data for 243 nm (optimum for AA) and 220 nm (DHAA) at the
elution times of interest. There was no significant decrease in the concentration of DHAA nor
an increase in the concentration of AA. Under these conditions it appeared that the 10-fold
excess of dithiothreitol was incapable of reducing DHAA back to AA.
Table 9. Effect of dithiothreitol on prepared DHAA
Treatment Area x 10-6 (and CV%)* under curve at 243 nm, 3.20 min
(best for AA)
Area x 10-6 (and CV%) under curve at 220 nm, 3.25 min
(best for DHAA)
DHAA (50 mg.100 mL-1) 12.6 (1.4) 34.4 (1.0) DHAA (50 mg.100 mL-1) + dithiothreitol 12.9 (2.1) 34.7 (0.6)
*CV % of three replicate preparations, single injection
Experiments with commercially-sourced DHAA
With the failure of DTT to reduce laboratory-prepared DHAA to AA, it was decided to
repeat the experiment with purportedly authentic DHAA (Sigma catalogue DB132).
Methods
Solutions of 50, 100 and 500 mg of DHAA per 100 mL were prepared. After dilution (1
volume of DHAA, 1 volume of excess dithiothreitol or water, 2 volumes of double-strength
mobile phase) aliquots were analysed by liquid chromatography.

26
Results
At all concentrations, absorbance by the purportedly pure DHAA was insignificant
(Table 10) as compared to pure AA and DHAA prepared in the laboratory by the iodine
oxidation method (Table 9).
Table 10. Effect of dithiothreitol on commercially-sourced DHAA
Treatment Area* x 10-6 under curve at 243 nm,
2.94 min (best for AA)
Area x 10-6 under curve at 200 nm,
2.98 min (best for DHAA)
Purported DHAA (100 mg.100 mL-1) 0.02 0.04 Purported DHAA (500 mg.100 mL-1 0.03 0.10 Purported DHAA (100 mg.100 mL-1)
+ 10 fold excess of dithiothreitol No peak except for
dithiothreitol No peak except for
dithiothreitol Purported DHAA (500 mg.100 mL-1)
+ 10 fold excess of dithiothreitol No peak except for
dithiothreitol No peak except for
dithiothreitol Expected area for authentic DHAA
(100 mg.100 mL-1)At least 12.6 (see
Table 9) At least 34.4 (see
Table 9)
*Mean of duplicates
It is clear from Table 10 that the commercial preparation of DHAA was completely
impure, probably through oxidation, and of no value to this project. The powerful reductant
dithiothreitol was incapable of restoring whatever was in the bottle to DHAA.
Attempts to determine AA in red-blue juices by the titrimetric method
A wide range of Keri juice products are made. For some, the titration method is suitable
because it is easy to detect the persistent light pink colour indicating the titration end point.
Such juices include Apple, Orange and Tropical. In contrast, Thexton’s Red Grape,
Thexton’s Blackcurrant and Thexton’s Cranberry etc. the titration method does not work
because the pink colour cannot be seen against the red/blue background. Two methods were
tried to solve the problem of detecting end point. These were by decolourisation with
activated charcoal and changing the juice pH to alter the colour due to the fruit anthocyanins.

27
Methods
For decolourisation, 0.5 g of activated charcoal (heated in oven at 80°C overnight to
increase its adsorbing capacity) was stirred into 50 mL of Thexton’s Blackcurrant and the
mixture left for 20 minutes. A slurry of diatomaceous earth was prepared by adding 2 g of
Celite powder (545) to 10 mL of distilled water. A Buchner funnel was fitted with a sheet of
Whatman No. 1 filter paper and a layer of Celite was developed with a water pump vacuum.
The mixture of juice and charcoal was then poured over the Celite layer and finally rinsed
with 20 mL of water. The total volume was made to 100 mL. AA in this solution was
determined by the standard titrimetric procedure using DCPIP. As one control, 40 mL of AA
solution (100 mg.100 mL-1) was mixed with 0.5 g of activated charcoal, filtered through
Celite filter in same the way as for Thexton’s Blackcurrant, and the AA concentration
determined. As another control, an AA solution without charcoal was passed through Celite.
For pH adjustment, aliquots of Thexton’s Blackcurrant (40 mL) were titrated with 0.1 M
NaOH to increase the pH in steps from 3.25 to 8. The final volumes were made to 100 mL.
Each sample of Thexton’s Black currant was then scanned in the visible wavelength range
with an Ultrospec 2100 spectrophotometer (Amersham Bioscience, U.K.)
Results
Charcoal was extremely effective as a decolourant, because the juice emerged clear and
totally colourless. However, the treatment had the unfortunate side effect of catalysing the
rapid and complete oxidation of AA to DHAA. This was not due to Celite, because the trial
with Celite showed zero loss (Table 11).
Table 11. Titration results for Thexton’s Blackcurrant and AA treated with activated charcoal and filtered through Celite
Treatment Mean volume (mL)* (and CV %) of DCPIP solution to titrate to end point
AA, 100 mg.100 mL-1 16.2 (0.3) AA, 100 mg.100 mL-1 treated with charcoal 0 Thexton’s Blackcurrant treated with charcoal 0 AA, 100 mg.100 mL-1 treated with Celite alone¶ 15.1 (0.3)
*Of four replicates for all determinations. ¶ Measured in later experiment

28
Wavelength (nm)
350 400 450 500 550 600 650 700 750
Abs
orba
nce
0.0
0.5
1.0
1.5
2.0
2.5
pH 3.24
pH
pH 7.5
pH 7.0
pH 4.0
6.0
Figure 10. Visible spectra of Thexton’s Blackcurrant juice at a range of pH values
The pH of Thexton’s Blackcurrant juice was 3.24, and in its native state was
characteristically purple. At all tested pH values to 8, some colour was lost (e.g. at pH 6) but
generally changing the pH only increased colour (Figure 10). Even if colour had been lost
and titration had become possible, there was always the risk that AA would become unstable
prior to titration and values would lower than actual.
Discussion
The choice of potential reductant was clear. DTT was well resolved from AA and
DHAA under the chromatographic conditions used. However, it failed to perform as
described by (Furusawa, 2001). This matter was not pursued because the chromatographic
procedure was found to be unsuited to monitoring AA over many months. It was expensive
on chemicals, time consuming within the context of part-time enrolment, and above all, the
equipment was being used by several operators each with different objectives and analysis

29
parameters. Therefore it was decided to choose the titrimetric method for regular
use though it is not suitable for dark drinks. However, the chromatographic method was used
spasmodically to monitor DHAA formation (if any).
In the supply chain from production to consumption, fruit juices are stored and
consumed under a variety of conditions, including different exposures to temperatures and
light (sunlight and fluorescent), and exposure to air when large containers are opened and
consumed after refrigeration over several days. The following experiments were performed.
Effect of long term storage under fluorescent light and in darkness. Juices are
displayed in supermarkets under bright fluorescent lights as a merchandising aid, but
fluorescent light may affect the stability of AA. Thus a long term storage experiment
compared the fate of vitamin C concentration in selected juices stored under
fluorescent lights with storage in total darkness. Because the titration method
measures only AA, at several time points in this exposure-to-fluorescent-light trial
samples were also analysed by chromatography in attempt to determine AA and
DHAA concentration. These experiments are reported in Chapter 4.
Effect of different temperatures of dark storage. After bottling, products are stored
first in company‘s warehouses, later in the supermarkets, and finally in customers’
homes. The temperature may vary markedly in this supply chain. An experiment was
conducted to determine the effect of different temperatures on AA for two months of
storage in the dark (Chapter 5).
Effect of repeated exposure to air. Keri juices are available in different size of
bottles. The largest size is 3 L Keri bottle, which is economical for families.
Generally, 3L bottles are not consumed in one day. After every pour the lost volume
is replaced by air, which through its oxygen content, is likely to oxidise AA. An
experiment was conducted to determine the effect of repeated opening and pouring in
refrigerated 3 L bottles (Chapter 5).
Effect of pasteurization. After industrial batching (mixing ingredients in the correct
proportions) juices are pasteurised at temperature between 92 to 100°C and then
cooled to 63 to 70°C before bottling. In this experiment, the fate of AA concentration
was determined at the time of batching before pasteurisation and after bottling
(Chapter 5).
30
Effect of exposure to sunlight. When juices are exposed to sunlight,
ultraviolet (UV) light may affect AA. The impact of direct sunlight and UV-filtered
sunlight was therefore examined (Chapter 5).
In the next chapter, the stability of AA was monitored in selected juices under total
darkness and fluorescence light.

31
Chapter 4
Long-term storage effect of total darkness and fluorescent lights
Introduction
In this chapter the fate of AA was examined during the long-term storage of four fruit
juices. The storage period was nine months. There were two storage conditions at the same
temperature: under fluorescent light such as might be found in a supermarket, and in total
darkness. AA was mainly determined by the titration method.
Methods
Comparison was done for juices stored under fluorescent lights to simulate display
conditions with storage at the same temperature in darkness (in cartons). The best-before date
printed on the bottles is nine months from the date of manufacturing. Vitamin C was
determined over 9 months routinely by titration and, occasionally, by chromatography.
Routine monitoring by chromatography was discontinued early in the trial due to various
factors e.g. long periods to stabilise the column, complexity of sample preparation of, high
cost, and most important, the time required to analyse all the samples. However, the
chromatographic method was periodically employed in attempt to determine the concentration
of bioavailable vitamin C (AA plus DHAA).
Juice formulations
The juices, which were all prepared in February 2005, were Keri Original Apple, Keri
Crush Tropical, Keri Crush Apple Orange Mango, and Thexton’s Blackcurrant. They are
various mixtures of juice concentrates, purées and flavours, citric acid, ascorbic acid ,food-
approved ingredients, and water. The exact formulations are confidential proprietary
information. The labels on all of these juices declare an AA concentration, which can derive
from an addition of AA and/or from the juice concentrate or purée.
Storage conditions
The smallest bottle size, 375 mL, was selected to maximise light exposure and surface-
to-volume ratio. A high ratio will maximise oxygen transmission across the plastic
(polyethylene terephthalate) containers into the juice. The bottles were stored in a room

32
which was closed on three sides with a louvred window on the fourth side that
opened into a large warehouse. It was open at all times. Any exposure to daylight was
insignificant. Half the bottles were kept in closed cartons to effect total darkness. The other
half were displayed on a table measuring 1.2 m by 2.4 m. The surface was covered with matt
white paper.
Figure 11. Display of juices under fluorescent light
Bottles were displayed in column and rows, with a minimum gap of 20 cm between each
bottle. The positions of the bottles were changed every week to maintain an equal gap
between each. They were also rotated at this time. Three sets of fluorescent tubes were fixed
on to the ceiling. The sets were parallel and 1.1 m apart. The average intensity of light at
table top was 1443 lux, as measured by a light meter (Model Tes-1330A, ShangHai
ZhongXuan Electronic, Shanghai). Four thermometers were placed in four corners of the
room so temperature could be monitored several times a week.

33
Analysis was done weekly when bottles were chosen at random off the light
table and sequentially out of cartons. Bottles were shaken to mix any suspended ingredients
before opening. AA was estimated immediately after opening, and was always accompanied
by titration of a reference AA solution (100 mg.100 mL-1).
Storage time (days)
0 50 100 150 200 250 3005
10
15
20
25
30
35
Mea
n ro
om te
mpe
ratu
re (o C
)
Figure 12. Room air temperature plotted over 270 days. Data points are means on a given day, and the line is a quadratic line of best fit for which R2 was 0.61
Results
The temperature difference between the four thermometers was never more than 0.5°C.
The mean temperature fluctuated between 28°C during summer and 17°C in winter (Figure
12). The highest recorded temperature was 30°C in summer and minimum of 10°C in
winter.It is expected that the thermal inertia of the bottles would results in less between-day
variation than shown in Figure 12.

34
Table 12. Overall effect of fluorescent light and storage to 270 days on the retention of AA in fruit juices
Fruit juice Claimed concentration of
vitamin C (mg.100 mL-1)
Measured concentration*
of AA ± SD (mg.100 mL-1)
at start of storage trial
Approximate percent
remaining AA after storage
under fluorescent lights
Approximate percent
remaining AA after storage in total darkness
Keri Original Apple 32 45.7 ± 0.1 32 53 Keri Original Orange 32 65.7 ± 0.3 53 63 Keri Crush Tropical 24 42.6 ± 0.1 34 46 Keri Crush AOM 24 40.0 ± 0.1 38 47
*Mean of four replicate titrations
Storage time (days)
0 50 100 150 200 250 300
AA
con
cn. (
mg.
100
mL-1
)
0
20
40
60
80
Orange dark
Orange light
Apple dark Apple light
32 mg.100mL-1
Figure 13. Effect of storage time under light and dark conditions on AA concentration in Keri Original Apple and Keri Original Orange. The horizontal line indicates the claimed concentration of vitamin C

35
Concentrations of AA remaining after 270 days are shown in Table 12. For Original
Apple, the percent remaining was 53 % (dark) and 32 % (light), while the respective figures
for Original Orange were 63 % and 53 %. Similar results were obtained for Keri Crush
Tropical and Keri Crush AOM. The percent remaining was 34 % (dark) and 46 % (light) for
pure Tropical, while the respective figures for mixed Apple Orange Mango were 38 % and 47
%.
Storage time (days)
0 50 100 150 200 250 300
AA
con
cn. (
mg.
100
mL-1
)
0
20
40
60
80
AOM light AOM dark
Tropical dark
Tropical light
24 mg.100mL-1
Figure 14. Effect of storage time under light and dark conditions on AA concentration in Keri Crush Tropical and Keri Crush Apple Orange Mango (AOM). The horizontal line indicates the claimed concentration of vitamin C
The claimed AA concentration in juices under investigation was either 24 or 32
mg.100mL-1 of juice. (This is stated as vitamin C on the labels.) The starting concentrations
were very much higher, particularly in the case of Keri Original Orange (Table 12) where the
initial concentration was about double that claimed.

36
There was an essentially linear decrease in AA concentration in both
conditions (total darkness and fluorescence light) (Figure 13) in all juices. (Linearity is
examined in more detail below).
Losses were clearly greater with light exposure but the differences were not important
except toward the end of storage. Keri Crush Tropical and Keri Crush Apple Orange Mango
were least affected by fluorescence light. This may be due to partially opaque sleeves
covering most of the bottle.
In the case of Keri Original Orange, the concentration was above the claimed vitamin C
concentration for the entire period, but for Keri Original Apple the concentration fell below
32 mg.100 mL-1 after about 120 days in the light and 180 days (dark), well before the best-
before date.
Storage time (days)
0 50 100 150 200 250 300
AA
con
cn. (
mg.
100
mL-1
)
0
20
40
60
80
Orange dark, r2 = 0.96
Orange light, r2 = 0.97
Apple dark, r2 = 0.93Apple light, r2 = 0.94
Figure 15 Least squares lines of best fit for Keri Original Apple and Keri Original
Orange under light and dark storage conditions
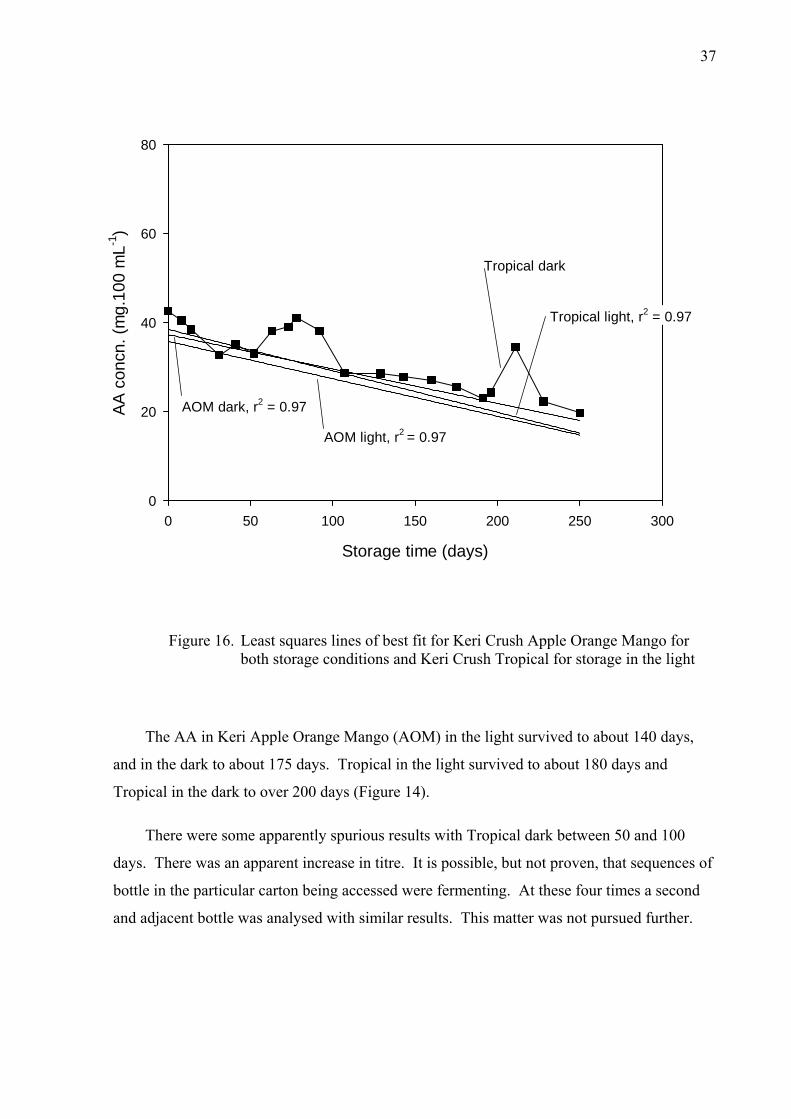
37
Storage time (days)
0 50 100 150 200 250 300
AA c
oncn
. (m
g.10
0 m
L-1)
0
20
40
60
80
AOM light, r2 = 0.97
AOM dark, r2 = 0.97
Tropical light, r2 = 0.97
Tropical dark
Figure 16. Least squares lines of best fit for Keri Crush Apple Orange Mango for both storage conditions and Keri Crush Tropical for storage in the light
The AA in Keri Apple Orange Mango (AOM) in the light survived to about 140 days,
and in the dark to about 175 days. Tropical in the light survived to about 180 days and
Tropical in the dark to over 200 days (Figure 14).
There were some apparently spurious results with Tropical dark between 50 and 100
days. There was an apparent increase in titre. It is possible, but not proven, that sequences of
bottle in the particular carton being accessed were fermenting. At these four times a second
and adjacent bottle was analysed with similar results. This matter was not pursued further.

38
Table 13. Effect of DTT on the concentration of AA in fruit juices stored under fluorescent light for 70 days
Fruit juice Claimed concentration of
vitamin C (mg.100 mL-1)
Mean* of AA ± SD without DTT (mg.100 mL-1)
Mean* of AA ± SD with DTT (mg.100 mL-1)
Keri Original Apple 32 46.4 ± 0.5 45.7 ± 1.1 Keri Original Orange 32 62.4 ± 0.8 61.6 ± 0.5 Keri Crush Tropical 24 33.7 ± 0.5 34.0 ± 0.3 Keri Crush AOM 24 32.1 ± 1.9 31.6 ± 0.3 Thexton’s Blackcurrant 45 99.3 ± 0.8 106.8 ± 2.4
*Of six replicate chromatographic runs. SD = Standard deviation
Table 14. Effect of DTT on the concentration of AA in fruit juices stored under fluorescent light for 101 days
Fruit juice Claimed concentration of
vitamin C (mg.100 mL-1)
Mean* of AA ± SD without DTT (mg.100 mL-1)
Mean* of AA ± SD with DTT (mg.100 mL-1)
Keri Original Apple 32 33.0 ± 1.4 32.4 ± 4.3 Keri Original Orange 32 58.7 ± 0.6 59.2 ± 3.9 Keri Crush Tropical 24 35.3 ± 2.4 35.1 ± 3.9 Keri Crush AOM 24 29.4 ± 6.9 31.6 ± 6.7 Thexton’s Blackcurrant 45 89.3 ± 0.9 99.6 ± 0.8
*Of three replicate chromatographic runs. SD = Standard deviation
Table 15. Effect of DTT on the concentration of AA in fruit juices stored under fluorescent light for 241days
Fruit juice Claimed concentration of
vitamin C (mg.100 mL-1)
Mean* of AA ± SD without DTT (mg.100 mL-1)
Mean* of AA ± SD with DTT (mg.100 mL-1)
Keri Original Apple 32 30.7 ± 0.7 31.6 ± 0.2 Keri Original Orange 32 54.1 ± 2.4 52.9 ± 1.2 Keri Crush Tropical 24 23.5 ± 2.0 21.2 ± 0.8 Keri Crush AOM 24 20.2 ± 0.9 18.8 ± 0.2 Thexton’s Blackcurrant 45 77.1 ± 1.4 75.8 ± 1.3
*Of six replicate chromatographic runs. SD = Standard deviation

39
While monitoring the fate of AA by the titration method over 285 days, the
chromatographic method of measurement with and without DTT was repeated three times (at
70, 101 and 241 days) in an atempt to determine DHAA – if any. The following results were
obtained (Table 13, 14 and 15). It seems likely that DTT had no effect on AA values,
although in two situations – both with Thexton’s Blackcurrant, there was an indication that
some DHAA was present at 70 and 101 days, but not at 241 days. Thus, the AA value was
clearly significantly higher in the presence of DTT than in its absence, e.g. 99.6 vs 89.3
mg.100 mL-1 at 101 days.
Discussion
Exposure to fluorescent light significantly affects the stability of AA in these bottles, but
the effect is unlikely to be commercially important.
Based on titration and chromatography, which measures only AA, the initial
concentration of AA greatly exceeded the claimed value, especially in the case of Keri
Original Orange and Thexton’s Blackcurrant. For Orange, the concentration based on AA
addition was 40 mg.100 mL-1, but the starting value was 66 mg.100 mL-1 for this particular
batch. Thus 26 mg.100 mL-1must have been derived from the concentrate (neglecting any
losses from pasteurisation as discussed in Chapter 5). For Blackcurrant, where the claimed
value is 45 mg.100 mL-1 and where no AA is added at mixing, the initial concentration must
have exceeded about 100 mg.100 mL-1. This is clear from Table 13. For both juices in these
particular batches, the concentration of AA after long term storage will exceed the claimed
value. Thus the claims on the labels are modest. However, variation in the concentration of
AA in the Blackcurrant and Orange concentrates may be variable, so the compamy would be
unwise to increase the claimed value.
The situation is rather different for the other three juices, where juices can and do fall
below the claimed concentration before the best-before date. These juices are fast moving
consumer goods, and it is unlikely that more than 120 days would be exceeded before
consumption. Based on this assumption the claimed values are defensible.
According to my supervisor, Dr Young (personal communication), the loss of AA
followed zero-order kinetics after about 25 days, because the rate of reduction in
concentration preceded independent of AA concentration. The loss followed a straight line.
Thus, at all times AA concentration was not limiting the loss. Again according to Dr Young,

40
the initially slightly steeper loss at early times may reflect loss of AA by an
oxidative and probably first-order reaction (Figure 3) mechanism due to oxygen remaining
trapped in the bottle at the time of bottling. Once trapped oxygen is exhausted, what then?
According to Gregory (1996), anaerobic AA degradation exhibits a maximum rate between
pH 3 and 4, which is the pH range of fruit juices. Thus it is possible that the main pathway of
AA degradation in these fruit juices is anaerobic if the rate of oxygen diffusion across the wall
of the bottle is very low.
However, a simpler aerobic model that appears to fit the facts is as follows: The
concentration of oxygen outside a bottle is a constant because air circulates freely around the
bottles. If it assumed that the rate of oxygen diffusion across the bottle wall is low, then the
rate of aerobic degradation of AA will be limited by oxygen concentration and thus the
constant slow rate at which it diffuses. The AA concentration is considered infinite in this
model. Therefore, the reaction will follow zero-order (straight line) kinetics until such time as
the AA concentration falls to very low levels when the reaction type should revert to first-
order. Thus, the kinetics can be said to follow pseudo zero-order as a special case of the more
intuitive first-order. Restated, given sufficient storage time the curves would flatten out as
AA became limiting.
In contrast, an anaerobic model would be consistent with most of the results in Table 13,
15 and 16 where the reductant DTT was ineffective in increasing AA concentration in four of
the five juices tested. However, the results with Thexton’s Blackcurrant at 70 and 101 days –
where DTT clearly increased the HPLC peak due to AA – suggest the situation may be
complex in some juices.
Whereas the above arguments fit the data obtained in this storage trial, it must not be
forgotten that DTT failed to reduce prepared DHAA back to AA (Table 9). The reason for
this is not known and has not been pursued.

41
Chapter 5
The Effects of Shorter Term Treatments on the Fate of Ascorbic
Acid in Fruit Juices
Introduction
The previous chapter explored the fate of AA under fluorescent light or total darkness
over a period of many months and established that the claims for concentration made by the
company were generally robust and defensible. In this chapter the effect shorter term
treatments are explored.
The first short term treatment is the effect of pasteurisation. Although it has long been
known that high temperatures decrease AA stability (Eittenmiller & Landen, 1999), it would
be useful to know the exact losses that occur in the production process for the company’s
particular formulations. Knowing how much is added from the juice concentrates and how
much is added as AA is useful but more useful if the losses during pasteurization are also
known. Thus, the concentration of AA in a newly produced batch would be predictable.
The second is storage temperature, the importance of which is obvious. A variation on
this is exposure to air at different temperatures, the third treatment examined in this Chapter.
The final treatment is exposure to sunlight. In Chapter 4 it was established that
fluorescent light had a small adverse effect on AA stability during long term storage, but one
that was commercially unimportant. An experiment with exposure to sunlight was performed
out of curiosity. The ultraviolet light component in sunlight is very much higher than in
domestic fluorescent light, and this component is implicated in free radical-mediated reactions
leading to deterioration of things as diverse as paint, cooking oil and skin (Flexner, 1999).
The juices used in these trials were chosen from Keri Original Orange, Keri Original
Apple and Keri Crush Tropical. In all cases AA was estimated by the titration method.

42
Effect of pasteurisation on AA in fruit juices
Method
In commercial production, fruit juices are prepared by first mixing all the ingredients in a
so-called batching tank, which eventually flows through pasteurisation pipes before bottling.
Six commercial batches of each of Keri Original Apple, Keri Original Orange and Keri Crush
Tropical were mixed according to the company’s proprietary recipes. Each was passed
through a pasteurisation process achieved with flow through concentric pipes. The inner pipe
contains the product flowing at defined rate. The outer contains hot water flowing counter
current. The water temperature and flow conditions are such that during the residence time in
the pasteuriser, typically 40 seconds, and the juices reach between 90 and 96°C.
Subsequently, the juices are rapidly cooled by water spray to between 63 and 70°C prior to
labelling. The total time spent by juice in the pasteurisation process to the point of filling is
typically four to five minutes. However this increases if there is, for example, a delay in
filling due to a mechanical problem downstream.
For this experiment, the before-pasteurisation samples were taken from the batch mixing
tanks and the after-pasteurisation samples were taken at the time of carton packing.
Results and discussion
Table 16. Loss of AA during pasteurisation of fruit juices (mg.100 mL-1)
Keri Original Apple Keri Original Orange Keri Crush Tropical
Initial Pasteurised Initial Pasteurised Initial Pasteurised
63.7 58.3 101.1 99.8 51.3 47.4 62.3 58.9 98.5 94.5 52.1 48.7 62.5 59.2 97.3 95.3 51.5 48.4 66.4 62.3 97.6 97.1 54.7 49.5 61.8 56.1 97.7 96.9 52.3 48.5
Six replicate pasteuris-
ations
61.5 55.8 115.3 110.4 53.1 49.1
Mean 63.0 58.4 101.2 99.0 52.5 48.6 SD* 1.8 2.4 7.0 5.9 1.3 0.7
Mean percent loss
7.3 2.2 7.4
* SD = Standard deviation.

43
Six batches of each three juices were prepared on different days, so the data
give an indication of day-to-day variation in AA concentration. Losses in the very short
pasteurisation period were high. In case of Keri Original Apple and Keri Crush Tropical, the
losses were about 7.4 %, whereas for Keri Original Orange the loss was only 2.2 % (Table
16). Whether Keri Original Orange is truly more stable than the other two cannot be proven
from these data because no record was kept of individual pasteurisation times. However the
data do suggest greater stability to pasteurisation.
Effect of temperature during short term storage
Method
To observe the influence of different temperatures of storage, the three selected juices in
375 mL bottles were kept at three different temperatures, 6°C in a chiller, ambient room
temperature (~24°C) in the room used for the long term storage experiment (Chapter 4), and
30°C. All bottles were stored in cardboard cartons away from light. Temperatures were
monitored regularly. Each time a bottle was removed for analysis it was mixed by inversion.
AA was estimated at regular intervals over 64 days by the standard titration method.
Table 17. Overall effect of storage temperature to 64 days on the retention of AA in fruit juices
Approximate percent remaining AA after storage at three
different temperatures
Juice Claimed concentration of vitamin C
(mg.100 mL-1)
Measured concentration* of
AA (mg.100 mL-1) at start of
temperature trial 6°C (~24°C) 30°C
Keri Original Apple 32 57.4 83 74 68 Keri Original Orange 32 99.5 88 82 77 Keri Crush Tropical 24 47.2 83 73 68
*Means of four replicate titraions
Results and discussion
As is clear from Table 17 and Figure 17, the loss of AA between 6 and 30°C is not great.
This is a 24°C difference. Many chemical reactions show a doubling in rate for every 10°C

44
Storage time (days)
0 10 20 30 40 50 60 70
AA c
oncn
. (m
g.10
0 m
L-1)
0
20
40
60
80
100
120Orange chiller
Orange room temp.
Orange warm room
Apple warm room
Apple room temp.
Apple chiller
Storage time (days)
0 10 20 30 40 50 60 70
AA c
oncn
. (m
g.10
0 m
L-1)
0
20
40
60
80
100
120
Orange chiller
Orange room temp.
Orange warm room
Apple warm room
Apple room temp.
Apple chiller
rise in temperature. This is clearly not happening in this case. If this common
relationship were followed, the percent remaining should be less than 50 percent, which it is
not.
Figure 17. Effect of different temperatures on AA concentration in Keri Original Orange and Keri Original Apple. For clarity, Keri Crush Tropical is not plotted but shows the same kinetics as Apple
Again according to my supervisor, these data suggest that the loss of AA is limited by
the rate of oxygen diffusion across the wall of the juice bottle. A 25 μm polyethelene
tetraphthalate (PET) film transmits 95 cm3 of oxygen per m2 per day per atmosphere
(Davidson & Partridge, 2002). Although the surface area of a 375 mL bottle is known (about
0.035 m2), the juice bottles are much thicker than 25 μm, and there is not a one atmosphere
difference in pressure across the bottle wall. Thus the diffusion rate for these particular juices
as packaged is not known, nor is the effect of temperature on diffusion.

45
Effect of deliberate exposure to air at two temperatures
The previous experiments were conducted with 375 mL bottles. These are normally
opened and drunk within say 20 minutes. In contrast, larger bottles, 3 L for instance, are often
opened and periodically drunk over a period of days, with a headspace of air that increases
progressively. This may accelerate loss of AA. In this situation bottles are normally stored in
a domestic refrigerator at nominally 6°C, but the increased availability of oxygen in the
headspace may lead to excessive losses of AA. This hypothesis was tested at 6°C and
ambient room temperature.
Methods
The effect of repeated exposure to air was conducted under two conditions, 6°C and
ambient temperature ranging from 17 to 23°C. Three juices were tested, Keri Original Apple,
Keri Original Orange, and Keri Crush Tropical. Juice (500 mL) was poured every second day
from 3 L Keri bottles thus providing an increasing headspace and some exchange of air
between the headspace and the external atmosphere. AA concentration was tracked over 10
days. At each time point a fresh sealed bottle was opened from both conditions (refrigeration
and ambient) and AA was determined. These bottles were the controls.
Results and discussion
Exposure to air affected the juices slightly differently. In refrigerated storage,
progressive exposure to air caused a decrease in the concentration of AA in Apple by 8 %,
whereas it was 11 and 13 % for both Tropical and Orange. In the controls, the respective
losses were 4 % for Apple and Orange and negligible (0.2%) for Tropical. At ambient
temperature the losses were higher, as expected, but the overall pattern was unchanged.
Because the pattern of loss was similar for all three juices only representative data are shown
Figure 18.

46
Headspace volume in exposed bottles (L) and days of storage
0.0 0.5 1.0 1.5 2.0 2.5 3.0
AA
con
cn. (
mg.
100
mL-1
)
80
82
84
86
88
90
92
94
96
98
100
Orange, unexposed to air (ambient)
Orange, exposed to air (ambient)
Orange, unexposed to air (6oC)
Orange, exposed to air (6oC)
0 4 6 8 102
Figure 18. Effect of headspace air on AA concentration in Keri Original Orange stored in refrigeration and ambient room temperature
Effect of two daylight conditions on AA concentration in juices
Methods
The effect of exposure to sunlight (ultraviolet-filtered and unfiltered) was studied with
two juices, Keri Original Orange and Keri Original Apple. Bottles (375 mL) of both products
were used without labels to maximise the exposure to radiation.
The juice bottles were placed horizontally in the gaps on two pallets. Polycarbonate
clear sheet (Palsun UV2, 1.5 mm, from PSP Limited, Auckland) was fixed 40 cm above one
pallet, and Acrylic clear from Bunnings Warehouse, Auckalnd) of same thickness was fixed at
the same height above another. The Palsun UV2 is claimed to filter ultraviolet light from
both sides of the sheet, but data have been hard to find about performance. No light filtration
data was available from the supplier of the acrylic sheet. (Ultraviolet light absorption data
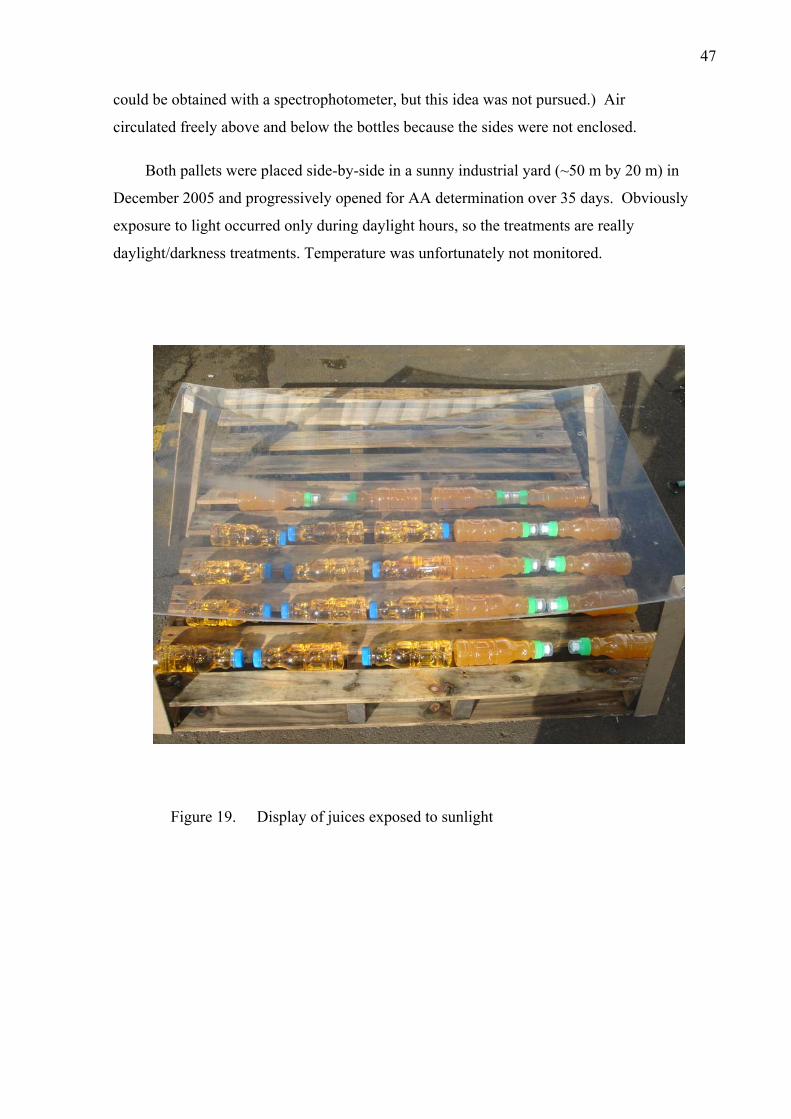
47
could be obtained with a spectrophotometer, but this idea was not pursued.) Air
circulated freely above and below the bottles because the sides were not enclosed.
Both pallets were placed side-by-side in a sunny industrial yard (~50 m by 20 m) in
December 2005 and progressively opened for AA determination over 35 days. Obviously
exposure to light occurred only during daylight hours, so the treatments are really
daylight/darkness treatments. Temperature was unfortunately not monitored.
Figure 19. Display of juices exposed to sunlight

48
Storage time (days)
0 10 20 30
40
AA
con
cn. (
mg.
100
mL-1
)
0
20
40
60
80
100
120
Orange, daylight/darkness
Orange, UV-filtered daylight/darkness
Apple, daylight/darkness
Apple, UV-filtered daylight/darkness
Figure 20. Effect of two daylight conditions on AA concentration in Keri Original Orange and Keri Original Apple
Results and discussion
Figure 20 shows the effect of the two exposure conditions over 35 days. The losses of
AA under these strong light conditions are clearly not dramatic and the effect of filtering out
an undetermined fraction of the ultraviolet light was relatively minor. (Temperature was
unfortunately not monitored in this trial but in December temperatures in daytime would be
higher than in the long-term storage trial reported in Chapter 4. Equally they would be lower
at night.)
It was instructive to compare the rate of loss of AA in this experiment with the rate in the
fluorescent light trial (Table 18). This has been done for Keri Original Orange as an example.

49
Table 18. Rates of AA loss in Keri Original Orange under the treatments: darkness, fluorescent light, ultraviolet-filtered daylight/darkness, daylight/darkness.
Treatment Temperature range (°C)
Rate of AA loss¶ (mg.100 mL-1.day-1)
Darkness 11-30 -0.089 Fluorescent light 11-30 -0.104 Ultraviolet-filtered daylight/darkness Not recorded -0.266 Daylight/darkness Not recorded -0.459
¶ Linear least squares regression curves yielded the rates
Exposure to ultraviolet-rich light (daylight/darkness treatment) caused a roughly five-
fold increase in loss compared to storage in total darkness. However, juices are never stored
under these conditions in a commercial setting.

50
Chapter 6
Conclusion
The principal sources of vitamin C in New Zealand diet are vegetables and non-alcoholic
beverages both 26 %, fruit at 23 %, and potatoes and kumara at 13 % (Ministry of Health,
2003). Thus the contribution from non-alcoholic beverages like the juices in Keri range is
thus highly significant in the New Zealand diet given that consumers of these juices may have
otherwise unbalanced diets.
There is a wide range of literature on the stability of AA in fruit juices in general, but
this research was aimed at AA in a specific range of juices under a variety of storage
conditions.
In the beginning, two methods, liquid chromatography and a titrimetric method, were
adopted to determine vitamin C. Liquid chromatography with an ultraviolet absorbance
detector is intrinsically the more accurate method because it can identify then quantify
individual chemical species, specifically AA plus DHAA, which together represent
bioavailable vitamin C. In contrast, the titrimetric method employed here depends on the
(non-specific) reduction of 2,6-dichlorophenolindophenol. Any chemical species in a juice
that can do this will contributed to the determination of AA, although there are no obvious
other ingredients that will perform this way.
The coefficient of variation of automated replicate injections in the liquid
chromatography procedure was a low 0.5 % and the ability to measure AA plus DHAA would
nominally make it the method of choice. However, the outcome of experiments aimed at
determination of AA’s immediate oxidation product, DHAA, was poor, and its role in AA
loss remains unresolved. Perhaps significantly, the purportedly authentic AA bought from
Sigma Chemical Company had deteriorated to the point that there was no absorbance at its
characteristic wavelength maximum, 220 nm, in HPLC analyses. This suggests an intrinsic
instability. Moreover, Nisperos-Carriedo, Busling and Shaw (1992) reported that the
concentration of DHAA with respect to AA in commercial orange juice ranges from 0 to 0.2

51
% which is negligible. If these authors are correct, the error in assessing
bioavailable vitamin C activity by DCPIP will also be negligible.
The matter of DHAA was not pursued, but it is important to note that all subsequent
experiments aimed at determining vitamin C can only report AA concentration rather than AA
plus DHAA, which together represent bioavailable vitamin C.
The titrimetric method for determining ascorbic acid is based upon the reduction of the
dye 2,6-dichlorophenolindophenol (DCPIP) with AA in acidic solution. In its oxidised form,
DCPIP is pink in acidic solution. A persistent light pink colour signals the presence of excess
unreacted dye and therefore the end point. Excellent reproducibility and recovery was
observed (100 %) for titrimetric method which was calculated after adding a known amount
of AA to the selected juices with eight replicate of each fruit juice Table 5.
The titration method is particularly suitable for light coloured juices because it is easy to
detect the persistent light pink colour indicating the titration end point, but for dark-coloured
juices such as Thexton’s Red Grape, Thexton’s Blackcurrant and Thexton’s Cranberry etc. the
titration method does not work because the pink colour cannot be seen against the red/blue
background. Two methods – decolourisation with activated charcoal and changing the juice
pH to alter the colour due to the anthocyanins – were tried to solve the problem of detecting
end point. Although charcoal was extremely effective as a decolourant, the treatment had the
unfortunate side effect of catalysing the rapid and complete oxidation of AA, presumably to
DHAA. The pH of dark-coloured juices was from 3.24 to 3.60, but an increase in pH did not
render them colourless to the point that titration could be performed. Moreover AA is
unstable at higher pH. Subsequent work focused on juices for which the titration method
would work.
A long term storage experiment compared the fate AA concentration in selected fruit
juices stored under fluorescent lights with storage in total darkness. Based on the titration
method, the initial concentration of AA greatly exceeded the claimed value, especially in the
case of Keri Original Orange and Thexton’s Blackcurrant. For both juices in these particular
batches, the concentration of AA after long term storage exceeded the claimed value. The
situation was rather different for the other three juices (Keri Original Apple, Keri Crush Apple
Orange Mango and Keri Crush Tropical), where juices do fall below the claimed
concentration before the best-before date. In all cases the losses followed zero-order kinetics

52
(a straight line over time), strongly suggesting that losses were limited by the
availability of one reactant. This was presumably oxygen, which has to diffuse across the
juice bottle wall.
Several short term experiments were also conducted. Losses in the very short
pasteurisation period (minutes) were high. In case of Keri Original Apple and Keri Crush
Tropical the losses were about 7.4 % whereas for Keri Original Orange the loss was only 2.2
%. The temperature at the point of ingredients mixing the (batching, Chapter 4) is around
20°C. Based on the reported concentration of oxygen in water at 25°C by Weast (1968), the
concentration of oxygen in Keri juices at batching will be around 1.5 mmole.L-1. The
analyses showed that AA concentration could be as high as 100 mg.100-1 mL in Keri Original
Orange. This equivalent to 5.7 mmole.L-1. Thus there is adequate oxygen to cause high early
losses.
The stability of AA in Keri Original Orange, Keri Original Apple and Keri Crush
Tropical was also observed for nearly three months at three different temperatures (6°C,
ambient and 30 °C). The percentage losses at 30°C were double the losses at 6°C. This is a
24°C difference. Many chemical reactions show a doubling in rate for every 10°C rise in
temperature. If this were the case here, the losses should be a minimum of four-fold. The
explanation advanced was that the rate of loss of AA was limited by the rate of oxygen
diffusion across the wall of the juice bottle, which is unknown information.
The effect of repeated exposure to air was conducted under two conditions, 6°C and
ambient temperature. This experiment was intended to replicate the domestic consumption of
larger bottles of fruit juice where juice is progressively consumed over a period of days. In
refrigerated storage, progressive exposure to air caused a decrease in the concentration of AA
in Apple by 8 %, whereas it was 11 and 13 % for both Tropical and Orange. In the controls,
the respective losses were 4 % for Apple and Orange and negligible (0.2 %) for Tropical.
These data show that nutritionally important concentrations remain even under these
nominally poor storage conditions.
Finally the effect of exposure to sunlight (ultraviolet-filtered and essentially unfiltered)
was studied with two juices, Keri Original Orange and Keri Original Apple. The losses of
AA under these strong light conditions were not dramatic and the effect of filtering out an
undetermined fraction of the ultraviolet light was relatively minor.

53
From a commercial perspective it can first be concluded that the claims for
vitamin C concentration on the labels of the Keri range of juices tested here are modest and
defensible. Second, it can be concluded that ascorbic acid in these juices is extremely
resilient to loss.

54
References
Arakawa, N., Otsuka, M., Kurata, T., & Inaka, C. (1981). Separative determination of ascorbic acid and erythorbic acid by high-performance liquid chromatography. Journal of Nutritional Science and Vitaminology, 27, 1-7.
Ball, G. F. M. (1998). Bioavailability and Analysis of Vitamins in Food. London: Chapman and Hall.
Basu, T. K., & Dickerson, J. W. T. (1996). Vitamins in human health and disease. Guildford, UK: Cab International.
Belitz, H.-D., & Grosch, W. (1999). Food Chemistry. New York: Berlin.
Bucci, L. R. (1998). Dietary Supplements As Ergogenic Aids. New York: CRC Press.
Buettner, G. R. (1993). The pecking order of free radicals and antioxidants: lipid peroxidation, alpha-tocopherol, and ascorbate. Archives of Biochemistry and Biophysics 300(2), 535-543.
Burdurlu, H. S., Koca, N., & Karadeniz, F. (2005). Degradation of vitamin C in citrus juice concentrates during storage. Journal of Food Engineering, 74(2), 211-216.
Clark, S. (2005). Comparing milk : human, cow, goat and commercial infant formula. Retrieved July 4, 2006, from http://www.saanendoah.com/compare.html
Competition Commission. (2001). The production of vitamin C Retrieved July 4, 2006, from http://www.competition-commission.org.uk/rep_pub/reports/2001/fulltext/456a4.2.pdf
Coultate, T. P. (2002). Food the chemistry of its components. Cambridge: The Royal Society of Chemistry.
Davidson, M., & Partridge, M. (2002). A pet subject. Retrieved May 13, 2006, from http://www.chemsoc.org/chembytes/ezine/2002/birkett_jul02.htm
Davies, M. B., Austin, J., & Partridge, D. A. (1991). Vitamin C: Its chemistry and biochemistry. Bath: The Royal Society of Chemistry.
Deutsch, J. C. (1998). Ascorbic acid possesses labile oxygen atoms in aqueous solution. Journal of Chromatography A, 802(2), 385-390.
Eittenmiller, R. R., & Landen, W. O. (1999). Vitamin analysis for the health and food science. Boca Raton CRC Press.
Elliott, W. L. (2002). Role of vitamin C in collagen biosynthesis and connective tissue health. Journal of Bodywork and Movement Therapies, 6(4), 221-224.
Flexner, B. (1999). Protecting exterior wood Retrieved March 11, 2006, from http://www.prostaffpainting.com/protecting.htm
Furusawa, N. (2001). Rapid high-performance liquid chromatographic identification/quantification of total vitamin C in fruit drinks. Food Control, 12(1), 27-29.
Gaby, S. K., Bendich, A., Singh, V. N., & Machlin, L. J. (1991). Vitamin intake and health. New York: Marcel Dekker, Inc.
Gennaro, & Abrigo. (1981). Ion-interaction reversed-phase high-performance liquid chromatoghraphy in the analysis of food. Analysis, 19, 151-154.

55
Gregory, T. F. (1996). Vitamins. In Food Chemistry (3rd edition, Fennema, O.R. ed.) (3rd ed.). New York: Marcel Dekker, Inc.
Groff, J. L., Gropper, S., & Hunt, S. M. S. (1995). The water soluble vitamins. Minneapolis: West Pubishing Company.
Indian Gyan. (2000). Importance of grain cereals. Retrieved July 31, 2006, from http://www.indiangyan.com/books/healthbooks/food_that_heal/home3.shtml
Jackson, L. S., Knize, M. G., & Morgan, J. N. (1999). Impact of pocessing on food safety (Vol. 459). New York: Kluwer Acedemic /Plenum Publishers.
Johnston, C. S., & Bowling, D. L. (2002). Stability of ascorbic acid in commercially available orange juices. Journal of the American Dietetic Association, 102(4), 525-529.
Kabasakalis, V., Siopidou, D., & Moshatou, E. (2000). Ascorbic acid content of commercial fruit juices and its rate of loss upon storage. Food Chemistry, 70, 325-328.
Kacem, B., Marshall, J. A., Shiremean, M. R., Cornell, J. A., & Matthews, R. F. (1987). Nonenzymatic browning in aseptically packed orande drinks: effect of ascorbic acid ,amino acids and oxygen. Journal of Food Science, 52(6), 1668-1672.
Kall, M. A., & Andersen, C. (1999). Improved method for simultaneous determination of ascorbic acid and dehydroascorbic acid, isoascorbic acid and dehydroisoascorbic acid in food and biological samples. Journal of Chromatography B: Biomedical Sciences and Applications, 730(1), 101-111.
Kirk, T., Dennison, D., Kokoczka, & Helman, D. (1977). Degradation of ascorbic acid in dehydrated food system. Journal of Food Science, 5, 1274.
Laumann, A., & Wong, J. J. (2005). Scurvy. Retrieved July 28, 2006, from http://www.emedicine.com/derm/topic521.htm
Lind, J. (1753). Treatise of the scurvy. Edinburgh: Kincaid and Donaldso.
Lopez-Nicolas, J. M., Nunez-Delicado, E., Sanchez-Ferrer, A., & Garcia-Carmona, F. (In press). Kinetic model of apple juice enzymatic browning in the presence of cyclodextrins: The use of maltosyl-[beta]-cyclodextrin as secondary antioxidant. Food Chemistry, In Press, Corrected Proof.
Madigan, D., McMurrough, I., & Smyth, M. R. (1996). Improved method for the determination of ascorbic acid in beer by using high-performance liquid chromatography with electrochemical detection. Analytical Communication, 33, 9-10.
Marshall, M. R., Kim, J., & Wer, C.-I. (2000). Enzymatic browning in fruits, vegetables and seafood. Florida.
Ministry of Health. (2003). Vitamin C, Food and nutrition guidelines for healthy adults: A background paper [electronic version] (pp. 35-36). Wellington, New Zealand: Author.
Moser, U., & Bendich, A. (1990). Handbook of Vitamins. New York: Marcel Dekker.
Murray, M. T. (1996). Encyclopedia of nutritional supplements. U.S.A.: Prima Health, a division of Prima publishing.
Navarra, T., & Lipkowitz, M. A. (1996). Encyclopedia of vitamins, minerals and suppliments. New York: Facts On File, Inc.
Nisperos-Carriedo, O. M., Busling, S. B., & E.P.Shaw. (1992). Simultaneous detection of dehydroascorbic acid, ascorbic and some organic acid in fruits and vegetables by HPLC. Journal Of Agricultural And Food Chemistry, 40, 1127-1130.

56
Riemer, J., & Karel, M. (1978). Shelf life studies of vitamin C during food storage., 89.
Rucker, B. R., Suttie, W. J., Donald, B. M., & Machlin, J. L. (2001). Handbook of vitamins. New York: Marcel Dekker, Inc.
Sardesai, V. (1997). Introduction to clinicalnutrition. New York: Marcel Dekker, Inc.
Sauberlich, H. E. (2000). Laboratory tests for the assessment of nutritional status. New York: CRC Press.
Stone, I. (1972). The natural history of ascorbic acid in the evolution of the mammals and primates and its significance for present day man Retrieved May 12, 2006, from http://www.seanet.com/~alexs/ascorbate/197x/stone-i-orthomol_psych-1972-v1-n2-3-p82.htm
Takeda USA Inc. (n.d.). Vitamin C in food processing. Retrieved July 31, 2006, from http://www.mratcliffe.com/images/vcb.pdf
Thomas, P. S., Powell, C. M. R., & Grant, J. E. (2001). Process for producing ascorbic acid. Retrieved July 11, 2006, from http://www.uspatentserver.com/686/6864376.html
Vanderslice, J., & Higgs, D. (1984). HPLC analysis with fluorometric detection of vitamin C in food sampl. Journal of Chromatogrphic Science, 11, 485-489.
Wardlaw, G. M. (1999). Perspective in nutrition (4th ed.). United States of America: McGraw-Hill.
Warner, H. R. (1987). Theories of aging. New York: Raven Press.
Weast, R. C. (1968). Handbook of chemistry and physics (48th ed.). Ohio: The Chemical Rubber Co.
Whitney, E. N., & Rolfes, S. R. (1992). Understanding nutrition. New York: West Publishing Company.
Wildman, R. E. C., & Medeiros, D. M. (2000). Advanced human nutrition. Boca Raton Landon: CRC Press LLC.
Williams, R. C., Baker, D. R., & Schmit, J. A. (1973). Analysis of water-soluble vitamins by high-speed ion-exchange chromatography. Journal of Chromatographic Science, 11, 618-624.
Zee, J. A., Carmichael, L., Codere, D., Poirier, D., & Fournier, M. (1991). Effect of storage conditions on the stability of vitamin C in various fruits and vegetables produced and consumed in Quebec. Journal of Food Composition and Analysis, 4(1), 77-86.
Zerdin, K., Rooney, M. L., & Vermue, J. (2003). The vitamin C content of orange juice packed in an oxygen scavenger material. Food Chemistry, 82(3), 387-395.
Ziegler, S. J., Meier, B., & Sticher, O. (1987). Rapid and sensitive determination of dehydroascorbic acid in addition ascorbic acid by reversed-phase high performance liquid chromatography using post-column reduction system. Journal of Chromatography, 391, 419-426.