Embed Size (px)
Citation preview
FATE OF NUTRIENTS AND CARBON IN
SLUDGE MINIMIZING CANNIBALTM
TYPE OF LABORATORY SCALE
REACTORS
by
Pei Huang
A thesis submitted to the faculty of The University of Utah
in partial fulfillment of the requirements for the degree of
Master of Science
Department of Civil and Environmental Engineering
The University of Utah
December 2012

Copyright © Pei Huang 2012
All Rights Reserved
T h e U n i ve r s i ty o f U ta h Gr ad u a t e S c h oo l
STATEMENT OF THESIS APPROVAL
The thesis of Pei Huang
has been approved by the following supervisory committee members:
Ramesh K. Goel , Chair 7/13/2012
Date Approved
Paul Krauth , Member 7/13/2012
Date Approved
Otakuye Conroy-Ben , Member 7/13/2012
Date Approved
and by Chris Pantelides , Chair of
the Department of Civil and Environmental Engineering
and by Charles A. Wight, Dean of The Graduate School.
ABSTRACT
Excess biomass generated during municipal wastewater treatment using biological
activated sludge processes is one of the main drawbacks of treatment processes. In this
study, two sequencing batch reactors (SBRs) were operated and monitored to evaluate, (1)
the long-term sustainability of sludge reduction and nutrient removal and (2) fate of
carbon in the lab scale reactors as well as in full scale plants run under similar sludge
reduction modes. One of the lab scale reactors (called control SBR) was run in standard
operational mode at 10-day solids retention time (SRT) while the other reactor (called
modified SBR) was run in sludge minimizing mode at nearly 100-day SRT to induce the
anaerobiosis of the returned biomass in a sidestream reactor. Furthermore, to compare the
overall biomass yields in both reactors, the wasted biomass from the conventional reactor
was taken to a conventional anaerobic digester. Overall, both reactors achieved an
average PO43--P removal of 85%, NH3-N removal of 99%, and 100% chemical oxygen
demand (COD) removal. The modified SBR consistently showed a biomass yield of
0.136gVSS/gCOD as compared to the control SBR which maintained a biomass yield of
0.34gVSS/gCOD. Overall, the modified SBR generated 60% less biomass than the
control SBR. Carbon mass balance and partitioning experiments based on C13 substrate
showed that both modified SBR and the associated sidestream reactor showed better
mineralization in terms of CO2 production. Furthermore, for the modified SBR, less C13
partitioned into biomass and more C13 went into head space in the form of CO2, thus

iv
suggesting why modified SBR enabled low biomass yield. A similar trend was observed
for full scale missed liquor samples.
TABLE OF CONTENTS
ABSTRACT ....................................................................................................................... iii
LIST OF FIGURES ........................................................................................................... vi
LIST OF TABLES ............................................................................................................ viii ACKNOWLEDGMENTS................................................................................................. ix Chapters
1 INTRODUCTION AND RATIONALE ............................................................................ 1
2 RESEARCH OBJECTIVES ............................................................................................ 7
3 MATERIALS AND METHODS ..................................................................................... 9
Reactor Operation ................................................................................................. 9
Oxygen Uptake Rate (OUR) ............................................................................... 10
Carbon Mass Balance in Mixed Liquor from Full Scale Plants ......................... 12
Head Space Gas Analysis ................................................................................... 12
C13 Analysis in the Biomass .............................................................................. 12
Calculation for Carbon Mass Balance ................................................................ 13
Calculation of CO2 Production inside the Serum Bottle .................................... 14
Gas Chromatographic Conditions ....................................................................... 14
Analytical Methods ............................................................................................. 15
4 RESULTS AND DISCUSSION .................................................................................... 23
Twin Reactor Performance ................................................................................. 23
Solids and Biomass Yield ................................................................................... 25
Specific Oxygen Uptake Rates (SOUR) Tests.................................................... 27
Sludge Volume Index (SVI) ............................................................................... 27
Carbon Mass Balance ......................................................................................... 28
5 CONCLUSIONS ............................................................................................................. 47
REFERENCES .................................................................................................................. 48
LIST OF FIGURES
1: Typical configuration of activated sludge bioreactor ..................................................... 5 2: A general flow scheme most commonly used for processing the excess biomass/sludge .................................................................................................................... 5 3: The schematic shows a conventional activated sludge process configuration. .............. 6 4: A schematic of a typical sludge minimizing activated sludge process through returned biomass fasting (in the sidestream tank) and feasting (in the bioreactor). .......................... 6 5: Schematics of the control (left side) and the modified (right side) SBRs .................... 16 6. Time sequence in each cycle of the control SBR and the modified SBR. ................... 17 7: Serum bottle carbon mass balance scheme for the control SBR system ...................... 18 8: Serum bottle carbon mass balance scheme for the modified SBR system ................... 19 9: Map showing the 10 wastewater treatment plants locations (www.hist-geo.com)..........................................................................................................21 10: General Schematic for C13 analysis and calculation.. ................................................ 22 11: Dissolved phosphorus for the control SBR and the modified SBR ............................ 33 12: Ammonia nitrogen concentrations profiles for (a) control and (b) modified SBR ................................................................................................................................... 34 13: Nitrite nitrogen concentrations profiles in (a) control and (b) modified SBR ........... .35 14: Nitrate nitrogen concentrations profiles in (a) control and (b) modified SBR ........... 36 15: Total and volatile solids in (a) control and (b) modified SBR.................................... 37 16: Total and volatile solids in the solids holding tank attached to the control (a) and modified SBR (b) .............................................................................................................. 38 17: The overall yield in the control system, modified system and control SBR .............. 39

vii
18: Results of oxygen uptake tests .................................................................................... 40 19: The settling velocity test in both reactors ................................................................... 41
LIST OF TABLES
1: Treatment plants investigated ....................................................................................... 20
2: Results of specific oxygen uptake rate (SOUR) ........................................................... 39
3: CO2 formation in serum bottle with C12 substrate with mixed liquors from SBRs ................................................................................................................................. 42 4: CO2 formation in serum bottle with C12 substrate with mixed liquors from SBRs ................................................................................................................................. 43
5: Data for C13 based carbon mass balance: partitioning between gas phase and biomass ............................................................................................................................. 44
6: The result of C13 carbon mass balance in the solids holding tank attached to the control and modified reactors ........................................................................................... 45
7: C13 partitioning into biomass for aerated bioreactor samples ..................................... 45
8: Head space CO2 concentrations for aerated bioreactor ................................................ 46
9: Head space CO2 concentrations for sidestream samples .............................................. 46
10: C13 partitioning into biomass for sidestream samples ............................................... 46
ACKNOWLEDGMENTS
I wish to express my gratitude and deep appreciation to my supervisor, Dr. Ramesh
Goel, whose patience, inspiring guidance and support in courses and research. Also I
would like to thank the other members of committee, Dr. Otakuye Conroy-Ben, Dr. Andy
Hong and Mr. Palu Krauth for their assistance at all levels of my research. I also
acknowledge Dr. Shireen M. Kotay for teaching me the principle and methods of
phylogenetic analysis, giving me insight of my research, also helping me for the thesis
writing. Appreciation goes to my lab mate Mitch Hogsett, for his valuable suggestions,
tutoring me the methods to analysis and numerous hours for helping me to build reactors.
A very special thanks goes to my family for their support, without their love,
encouragement and suggestion, I would not be able to finish her research and thesis.
CHAPTER 1
INTRODUCTION AND RATIONALE
Activated sludge process is the most widely used treatment method for municipal
wastewater (Grady et al., 1999; Metcalf and Eddy, 1994). The process can be optimized
for biological removal of nitrogen and phosphorus using different reactor configurations,
in addition to the effective removal of organic matter and suspended solids (Grady et al.,
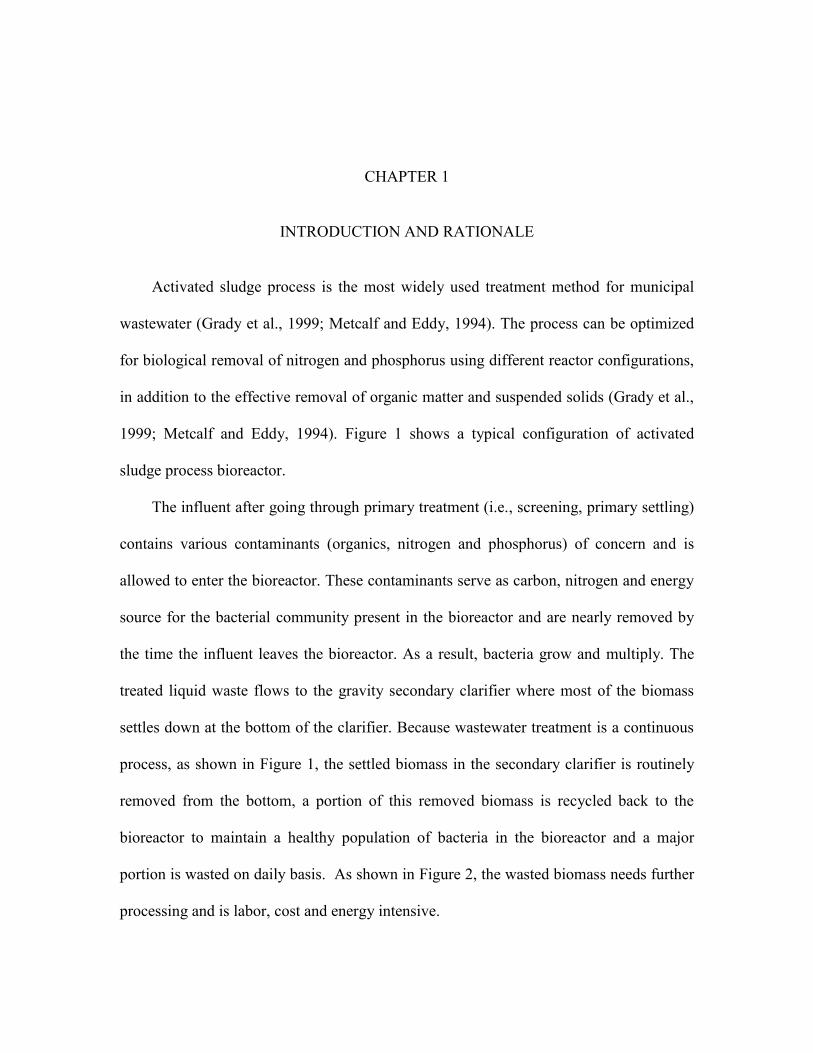
1999; Metcalf and Eddy, 1994). Figure 1 shows a typical configuration of activated
sludge process bioreactor.
The influent after going through primary treatment (i.e., screening, primary settling)
contains various contaminants (organics, nitrogen and phosphorus) of concern and is
allowed to enter the bioreactor. These contaminants serve as carbon, nitrogen and energy
source for the bacterial community present in the bioreactor and are nearly removed by
the time the influent leaves the bioreactor. As a result, bacteria grow and multiply. The
treated liquid waste flows to the gravity secondary clarifier where most of the biomass
settles down at the bottom of the clarifier. Because wastewater treatment is a continuous
process, as shown in Figure 1, the settled biomass in the secondary clarifier is routinely
removed from the bottom, a portion of this removed biomass is recycled back to the
bioreactor to maintain a healthy population of bacteria in the bioreactor and a major
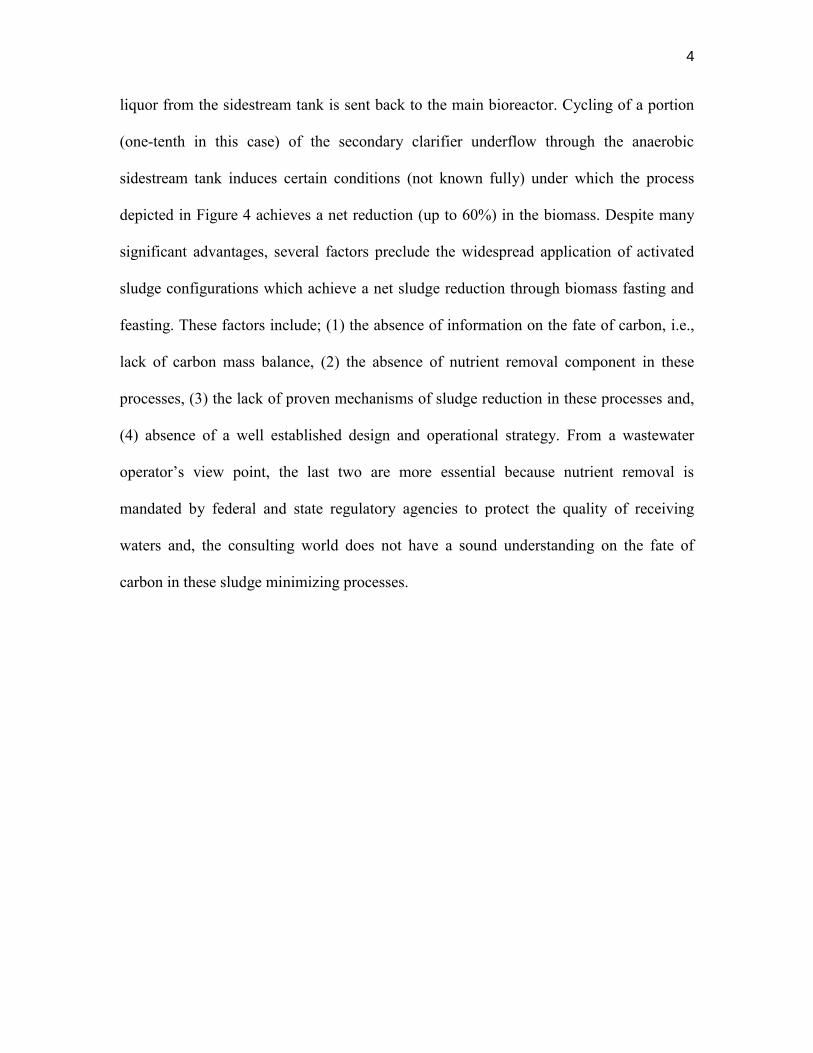
portion is wasted on daily basis. As shown in Figure 2, the wasted biomass needs further
processing and is labor, cost and energy intensive.

2
The treatment of excess sludge is expensive and may account for 25 to 65% of the
plant’s operation cost (Saby et. al., 2003; Chen et al., 2001 & 2003; Camacho et al.,
2002; Cui and Jahng, 2004; Barjenbruch and Kopplow, 2003). Hence, the excess sludge
is the one of the main drawbacks of the activated sludge process. Treatment of this excess
sludge requires much energy and labor and, excess sludge is a big environmental concern
in our present environmental sustainability driven society. Hence, sludge reduction at
wastewater treatment plants is increasingly attractive due to rising costs and constraints
associated with sludge treatment and disposal.
Approximately 8.2 million tons of sludge were generated in 2010 in the United
States, and the amount has been predicted to reach over 10 million tons by the year 2012
(USEPA, 1999). Anaerobic digestion reduces the excess biomass by 40~50 % with
methane gas being a useful byproduct, albeit a green house gas. Several research efforts
have also shown that electricity (Liu et al., 2004, Min and Logan, 2004) and hydrogen
gas (Angenent et al., 2004; Hallenbeck, 2005 and Gong et al., 2005) can be generated
biologically. However, challenges still exist regarding the improved yields of electricity
and hydrogen gas using microbial fuel cell and biomass fermentation techniques,
respectively. Another option for the use of biomass includes its composting followed by
land application. However, land application of biosolids is restricted in many states due
to health risks to people and livestock because of potentially toxic elements in the sewage
sludge, i.e., heavy metals, pathogens, and persistent organic pollutants and nutrients (Wei
et al., 2003). Handling and disposal of excess sludge is more challenging in coastal areas
such as Florida and California and, in coastal countries like Malaysia, Singapore and
Indonesia due to depleting landfill resources and other environmental concerns. Hence, it

3
is highly debatable that excess biomass is a useful commodity (Ødegaard et al., 2002). As
a result, excess biomass from activated sludge processes is regarded as an
environmental concern which threatens the sustainability of activated sludge
treatment processes. The reduction in sludge could dramatically impact the difficulties
municipalities are facing today in disposing of or reusing their excess sludge.
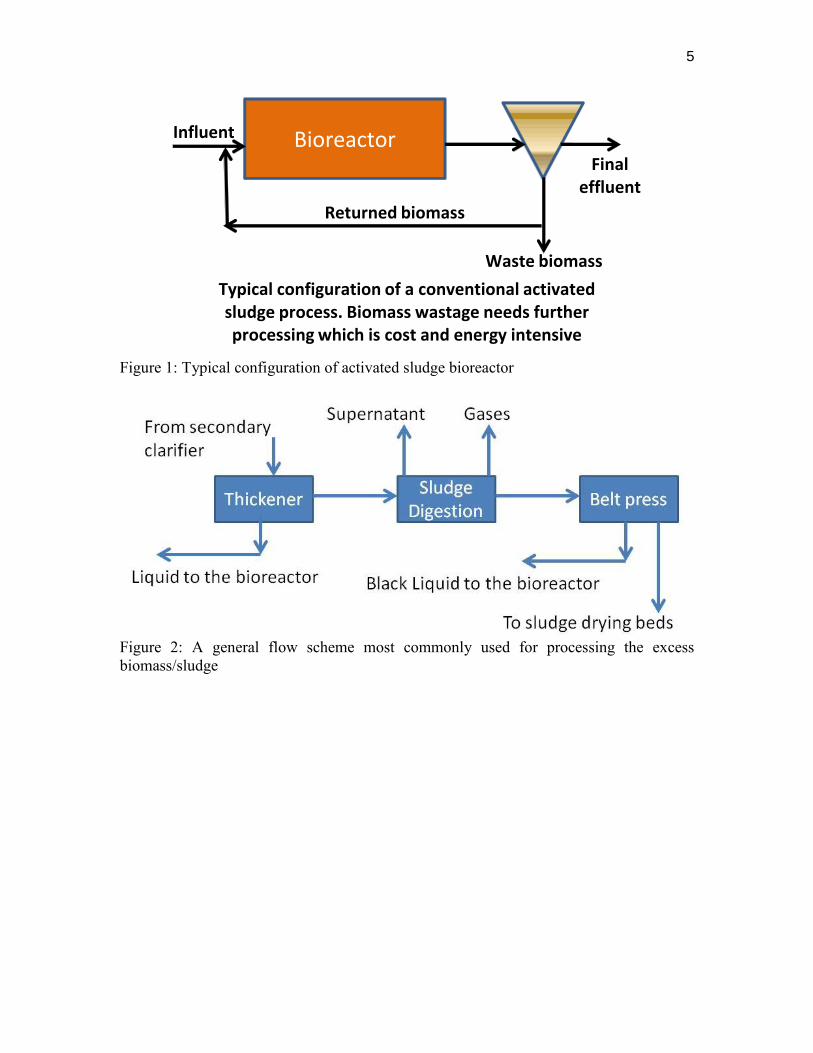
For sludge reduction at the source, a number of technologies have been developed
that are single or a combination of physical, chemical, biological and thermal processes
(reviewed by Ødegaard, 2004) (Figure 3). However, cost savings from sludge
minimization using one or a combination of physical, chemical, biological and thermal
processes must be compared to costs involved in implementing these processes. All these
alternatives are expensive and could increase the overall energy consumption of the plant
(Böhler and Siegrist, 2006).
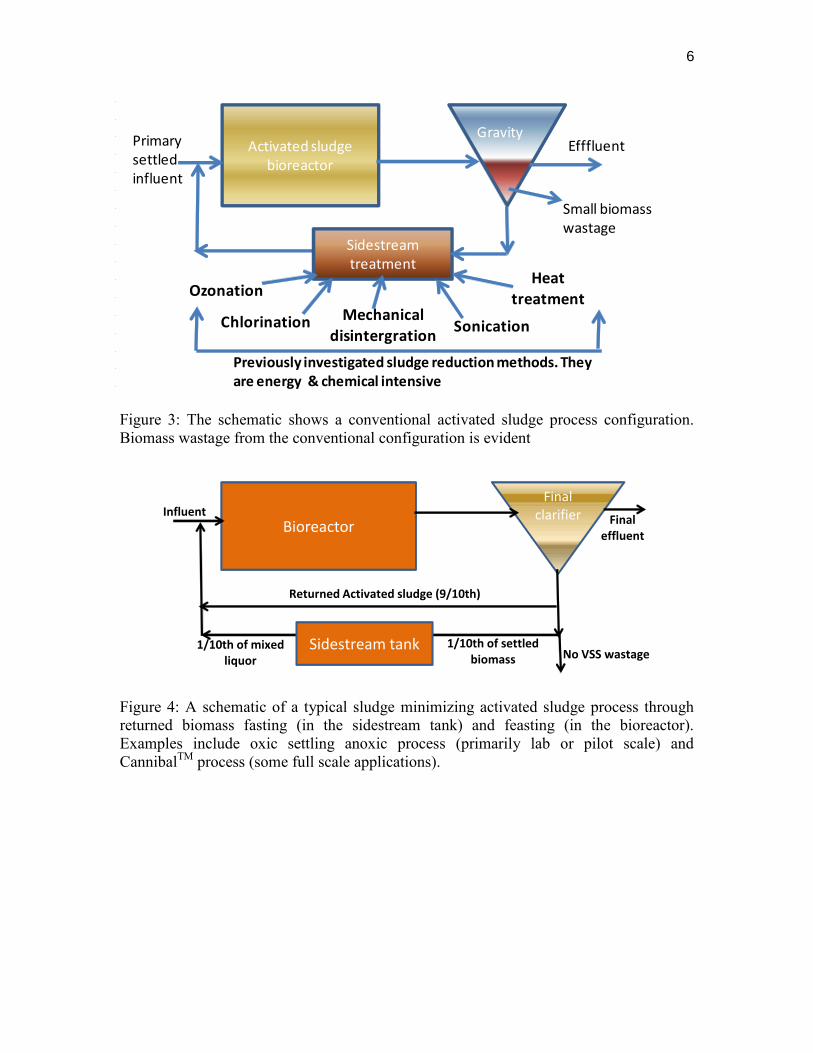
Sludge minimization through anaerobiosis (Westgarth, 1963; also called the fasting
of biomass) of returned activated sludge using a sidestream anaerobic reactor (Figure 4)
is a relatively new sludge minimization approach which has been primarily investigated
in laboratory scale set ups with few full scale installations in the U.S. with the trade name
of CannibalTM. As shown in Figure 4, a portion of the returned biomass is taken to an
anaerobic sidestream reactor (fasting or anaerobiosis of sludge) and an equal volume of
the mixed liquor from this sidestream reactor is sent back to the main bioreactor (feasting
conditions). The circulation of biomass through the anaerobic sidestream to the main
bioreactor causes a net reduction in the overall observed biomass yield. Figure 4 depicts
that one-tenth of the underflow is going through the sidestream and the rest is by passing
this sidestream in the form of returned activated sludge. Likewise, one-tenth of the mixed
4
liquor from the sidestream tank is sent back to the main bioreactor. Cycling of a portion
(one-tenth in this case) of the secondary clarifier underflow through the anaerobic
sidestream tank induces certain conditions (not known fully) under which the process
depicted in Figure 4 achieves a net reduction (up to 60%) in the biomass. Despite many
significant advantages, several factors preclude the widespread application of activated
sludge configurations which achieve a net sludge reduction through biomass fasting and
feasting. These factors include; (1) the absence of information on the fate of carbon, i.e.,
lack of carbon mass balance, (2) the absence of nutrient removal component in these
processes, (3) the lack of proven mechanisms of sludge reduction in these processes and,
(4) absence of a well established design and operational strategy. From a wastewater
operator’s view point, the last two are more essential because nutrient removal is
mandated by federal and state regulatory agencies to protect the quality of receiving
waters and, the consulting world does not have a sound understanding on the fate of
carbon in these sludge minimizing processes.
5
Figure 1: Typical configuration of activated sludge bioreactor
Figure 2: A general flow scheme most commonly used for processing the excess biomass/sludge
Bioreactor
Returned biomass
Waste biomass
Final effluent
Influent
Typical configuration of a conventional activated sludge process. Biomass wastage needs further processing which is cost and energy intensive
6
Figure 3: The schematic shows a conventional activated sludge process configuration. Biomass wastage from the conventional configuration is evident
Figure 4: A schematic of a typical sludge minimizing activated sludge process through returned biomass fasting (in the sidestream tank) and feasting (in the bioreactor). Examples include oxic settling anoxic process (primarily lab or pilot scale) and CannibalTM process (some full scale applications).
Activated sludge bioreactor
Gravity
Previously investigated sludge reduction methods. They are energy & chemical intensive
Primary settled influent
Efffluent
Sidestream treatment
Ozonation
Chlorination
Heat treatment
SonicationMechanical
disintergration
Small biomass wastage
Bioreactor
Finalclarifier
Returned Activated sludge (9/10th)
No VSS wastage
Final effluent
Influent
Sidestream tank 1/10th of settled biomass
1/10th of mixed liquor
CHAPTER 2
RESEARCH OBJECTIVES
As stated before, nutrient removal and understanding the fate of carbon in sludge
minimizing bioreactors have been investigated but remain an issue for the successful
acceptance of these processes in wastewater industry. Although, issues like mechanisms
of sludge reduction, design practices and microbial ecology related to these innovative
processes are equally important, I choose to address the research questions related to the
fate of carbon and nutrient removal in sludge minimizing processes because of the time
frame of my master’s thesis.
Main nutrients of concern are nitrogen and phosphorus. Biological nitrogen removal
requires nitrification and denitrification processes to be incorporated in the treatment
train through the operation of oxic and anoxic zones. It is feasible for an operation to
significantly minimize sludge production via feasting and fasting without significantly
impacting nitrogen removal if the adequate key microorganisms remain viable. Coupling
sludge minimization with biological phosphorus removal through enhanced biological
phosphorus removal (EBPR) could be challenging and more complex. Activated sludge
processes achieving sludge minimization using anaerobiosis (fasting and feasting) have
been operated at nearly infinite or very high solid retention time (SRT). This becomes a
challenge, especially for EBPR, because the successful operation of EBPR requires the
process to be operated at a finite SRT, typically at 5-15 days (Rodrigo et al., 1996; Shao
et al., 1992; Fukase et al., 1985)
8
Hence, I posed the following two questions.
1. Can biological nitrogen (N) and phosphorus (P) removal be sustained in
sludge minimizing reactor and if yes, at what biomass yield?
2. What is the fate of carbon in a sludge minimizing reactor?
To answer these questions, I ran two laboratory scale sequencing batch reactors, one
in the standard operational mode and the other in sludge minimization mode. Both
reactors were operated to achieve nitrogen and phosphorus removals. I used stable
isotope of carbon to accomplish carbon mass balance in these reactors. Furthermore,
there are several full scale sludge minimizing plants in the U.S. and around the world
which are running the scheme (sludge minimization mode) shown in Figure 4 under the
trade name of CannibalTM marketed by SIEMENS Water Co. Hence, my carbon mass
analysis also included sampling several full scale Cannibal plants. The specific objectives
of this research were:
1. Monitor the performance of two laboratory scale SBRs in terms of nutrient
removal and biomass yield.
2. Calculate oxygen uptake rates (OURs) in both SBRs.
3. Conduct carbon mass balance in these two SBRs using C13 carbon substrate.
4. Conduct carbon mass balance in mixed liquor received from several full scale
Cannibal plants.
CHAPTER 3
MATERIALS AND METHODS
Reactor Operation
Two, 2 L bench-scale SBRs were operated to achieve simultaneous ammonia and
phosphorous removal along with sludge reduction. The overall schematics of these two
systems are depicted in Figure 5. One reactor (called the control SBR) was run in
standard operation at 10-day solid retention time (SRT) and the second reactor (called the
modified SBR) was run in sludge minimization. Briefly, to induce fasting and feasting of
the returned biomass, one-tenth of the settled biomass from the modified SBR at the end
of each cycle was brought to a sidestream reactor. Following this, one-tenth of the mixed
liquor from this sidestream was recycled back to the modified SBR at the beginning of
each cycle.
Recycling of one-tenth of biomass back and forth enabled an overall internal SRT of
10-day in the modified SBR. Furthermore, the modified reactor was run at “small
biomass wastage” rate rather than at infinite SRT to sustain efficient EBPR and to avoid
any biomass build up in the reactor system. On the other hand, one tenth of the settled
biomass from the control SBR was taken to a conventional anaerobic digester operated at
10-day hydraulic retention time (HRT)/solid retention time (SRT) and the observed
biomass yield in the control SBR was calculated after the biomass was digested in the
conventional digester.
10
The cycle of each SBR consisted of 5.5 h of reaction period, the distribution of
which is shown in Figure 6. At the end of each cycle, 670 mL of supernatant was at the
beginning of the next cycle. With a 2 L capacity in each SBR, this corresponded to a
hydraulic retention time (HRT) of 18 h. Anaerobic conditions were maintained by
constantly bubbling the mixed liquor with nitrogen gas at a rate of 1 L min-1 during the
specified anaerobic and anoxic time periods of each cycle. Anaerobic conditions were
verified by measuring dissolved oxygen in the mixed liquor periodically. I used an
automated pH controller to maintain the pH around 7.5.
Reactor performance was monitored in terms of dissolved COD, phosphorus (P) and
ammonia removals and the biomass yield was calculated based on total suspended solids
(TSS)/volatile suspended solids (VSS) concentrations measured in SBRs, digester and
sidestream and effluents. Observed yield was determined by Metcalf and Eddy (2004),
which was the ratio of the amount of biomass produced to the amount of substrate
consumed. In this study, the observed yield was determined over a given range of
operation as the VSS increase/COD used, using all the data over the range of operation
for which the yield was calculated. The cumulative wastage was calculated from
sampling wastage, effluent wastage and average biomass growth.
Oxygen Uptake Rate (OUR)
Specific oxygen uptake rate (SOUR) describes the amount of oxygen used by the
microorganisms to consume 1g of food and is reported as mg/l of oxygen used per g of
organic material per hour, and is used to monitor performance of process in biological
wastewater treatment facilities. After reactors became steady state, 6 SOUR tests, which
included spiked and unspiked SOUR tests, were performed in this study to estimate
11
organism response/physiology in both reactors. The unspiked SOUR was measured at the
end of the cycle due to the endogenous respiration of the activated sludge. The spiked
SOUR tests were added a known substrate to the unspiked samples to predict how the
organisms in the mixed liquor respond to that substrate. In this study, first spiking with
feed A, which can estimate heterotrophic activity; second spiking with feed B, the OUR
response will estimate only nitrification activity in a mixed liquor sample. The SOUR
was measured using method 2710B from the “Standard Method for Examination of
Water and Wastewater.” The oxygen uptake rate was measured using a dissolved oxygen
meter.
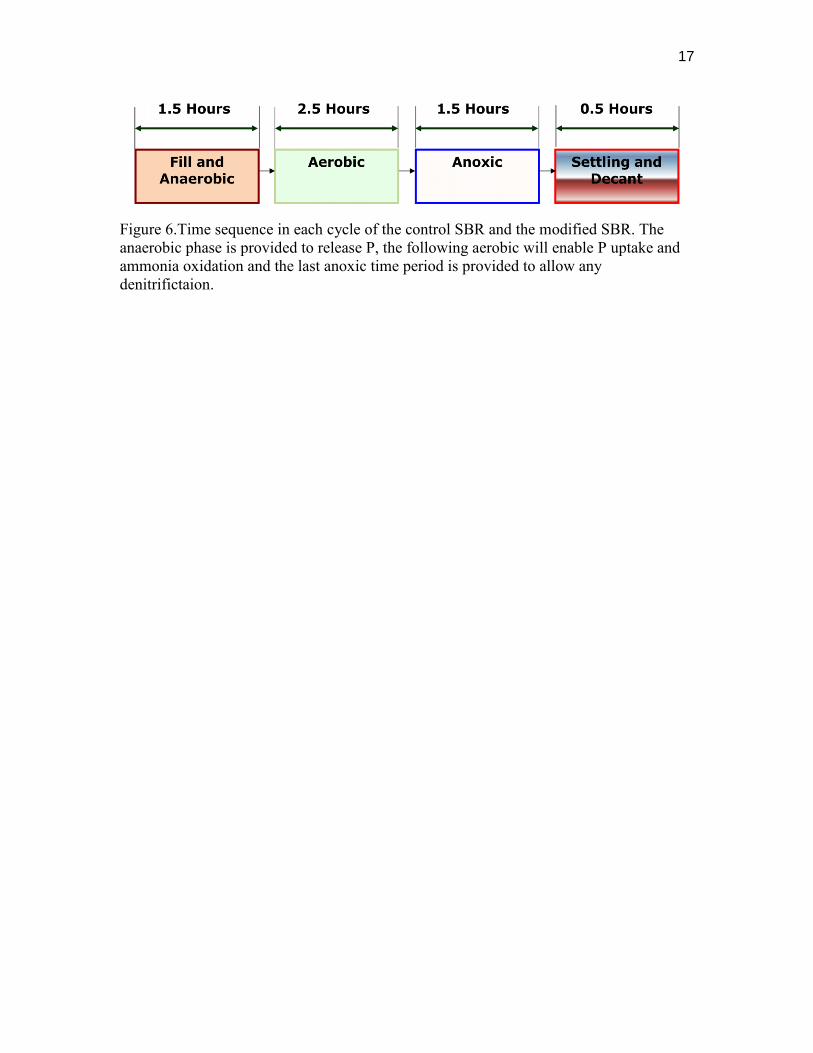
Carbon Mass Balance in Twin Reactors. For carbon mass balance experiments using
C13 labeled acetate as carbon substrate, 70-mL glass serum bottles were used. For
experiments with mixed liquor from the main SBRs, biomass was collected at the end of
a specific cycle and then diluted with distilled water (DI). For the digester associated with
the control SBR, and sidestream reactor associated with the modified SBR samples,
biomass samples were collected and mixed with biomass samples in a 1:10 ratio to
simulate the interchange rate. For both sets of experiments, biomass samples were
transferred to a 70-mL serum vial, which was immediately capped with an air tight
Teflon cap and an aluminum crimp. The contents in the vial were spiked with a stock
solution of nutrients and C13 labeled carbon substrate for main SBR samples, and with
preacclimatized C13 labeled biomass (in 1:10 ratio) for digester and biomass samples.
For samples from the main reactors experiments were conducted under aerobic
conditions, and for sidestream and digester samples experiments were conducted under
anaerobic conditions. Figures 7 and 8 show the overall scheme for the aforementioned
12
serum bottle tests for the control SBR system and the modified SBR system, respectively.
Carbon Mass Balance in Mixed Liquor from Full Scale Plants
A total of 10 full scale CannibalTM plants were analyzed for carbon partitioning
between the biomass and the head space gases. The strategy which was used for biomass
from the lab scale reactors was used for full scale experiments except that the
acclimatized C13 biomass was not used for serum bottle tests on mixed liquor from
sidestream reactors. Instead, C13 glucose was used to spike the mixed liquor. This
strategy was employed because it was not possible to acclimatize the biomass with
C13given the short duration of the shipment of mixed liquor samples from different
plants. The details of the plants are provided in Table 1. For all plants, glucose with only
one C-atom C13 labeled was used. Figure 9 provides the locations of all 10 full scale
plants in the U.S.
Head Space Gas Analysis
All analysis related to C13-CO2 in the head space was done at the isotope core
facility. A known volume of head space from the serum bottle was injected into the
injector port. The final outcome from the gas chromatograph was C12/C13 ratio which
was used to calculate the mass of C13 in the head space. Ideal gas laws were used to
calculate the moles of gas in the head space. With the total moles of gases and C13/C12
ratio, it was easy to calculate the mass of C13 in the head space.
C13 Analysis in the Biomass
A known volume of biomass was oven dried overnight at 103oC. The dried biomass
was crushed to homogenize and then a known weight was ignited in a controlled confined
13
space connected to the Gas Chromatography (GC) port. The rest of the analysis protocol
was similar to what was used for the head space gases. Figure 10 shows the general
schematic about how head space and biomass samples were analyzed and how the
resulting information was used to calculate molar concentrations of C13.
Calculation for Carbon Mass Balance
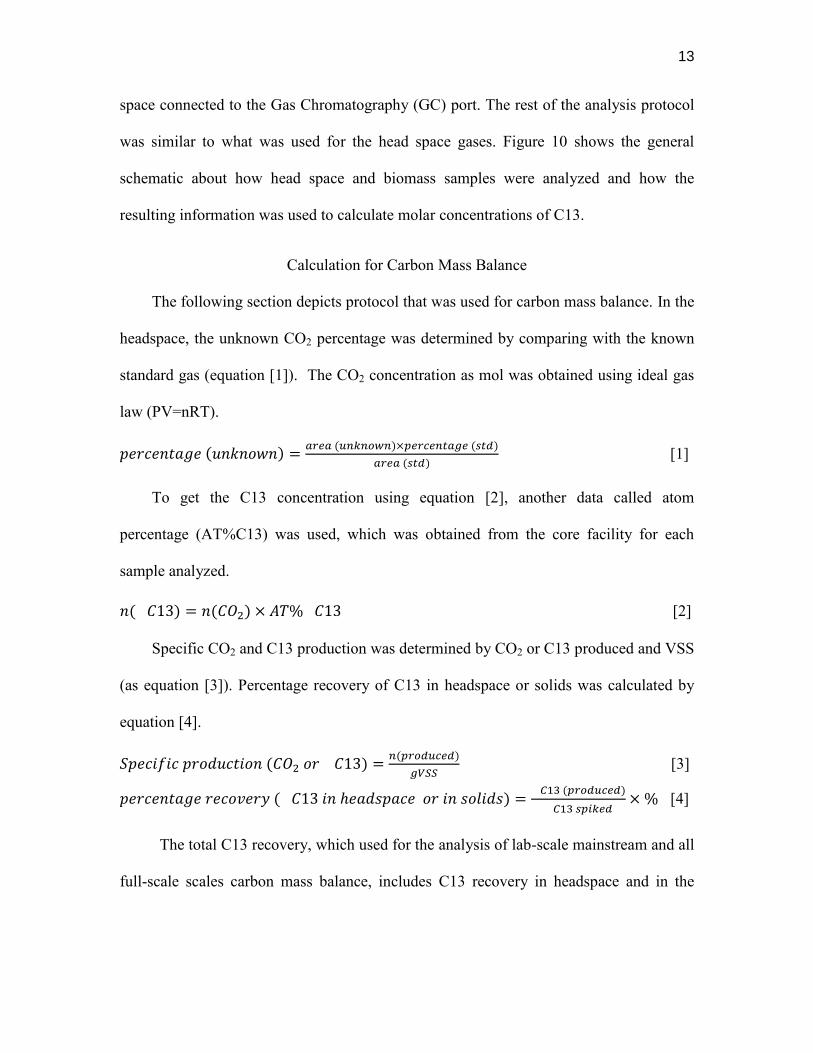
The following section depicts protocol that was used for carbon mass balance. In the
headspace, the unknown CO2 percentage was determined by comparing with the known
standard gas (equation [1]). The CO2 concentration as mol was obtained using ideal gas
law (PV=nRT).
[1]
To get the C13 concentration using equation [2], another data called atom
percentage (AT%C13) was used, which was obtained from the core facility for each
sample analyzed.
[2]
Specific CO2 and C13 production was determined by CO2 or C13 produced and VSS
(as equation [3]). Percentage recovery of C13 in headspace or solids was calculated by
equation [4].
[3]
[4]
The total C13 recovery, which used for the analysis of lab-scale mainstream and all
full-scale scales carbon mass balance, includes C13 recovery in headspace and in the
14
solids (equation [5]). Equation [6] used to calculate the C13 recovery in sidestream
biomass of the lab scale reactors.
[5]
* [6]
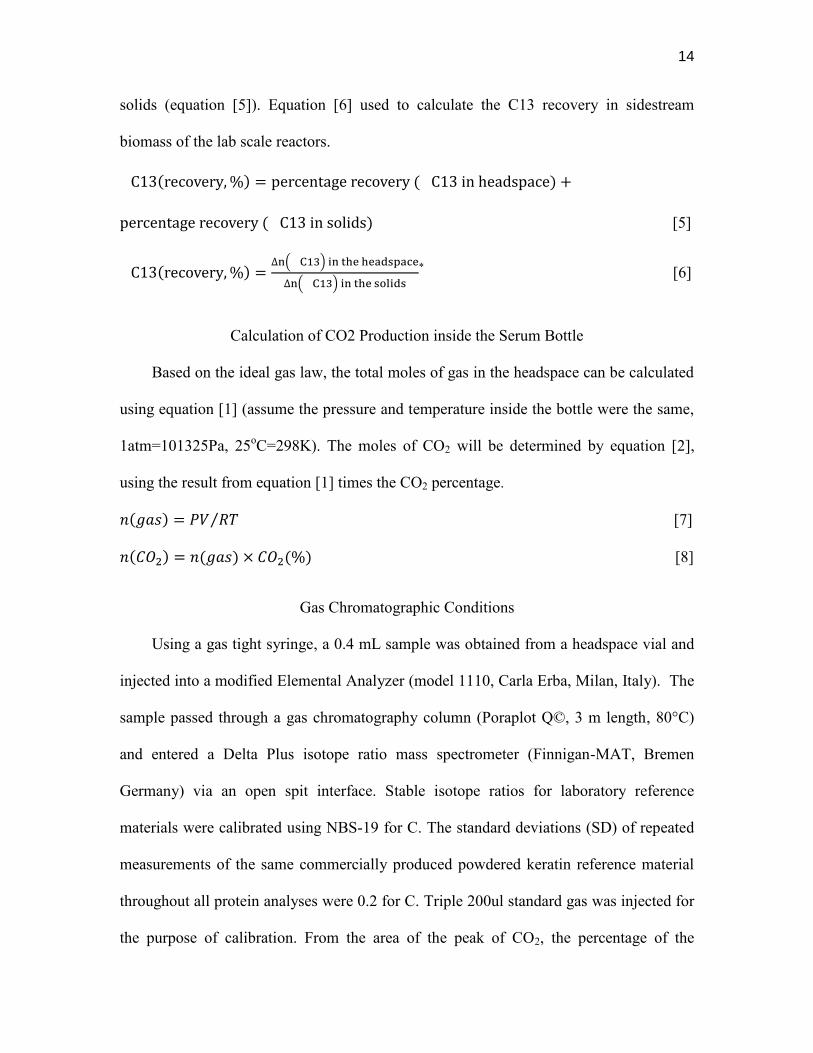
Calculation of CO2 Production inside the Serum Bottle
Based on the ideal gas law, the total moles of gas in the headspace can be calculated
using equation [1] (assume the pressure and temperature inside the bottle were the same,
1atm=101325Pa, 25oC=298K). The moles of CO2 will be determined by equation [2],
using the result from equation [1] times the CO2 percentage.
[7]
[8]
Gas Chromatographic Conditions
Using a gas tight syringe, a 0.4 mL sample was obtained from a headspace vial and
injected into a modified Elemental Analyzer (model 1110, Carla Erba, Milan, Italy). The
sample passed through a gas chromatography column (Poraplot Q©, 3 m length, 80°C)
and entered a Delta Plus isotope ratio mass spectrometer (Finnigan-MAT, Bremen
Germany) via an open spit interface. Stable isotope ratios for laboratory reference
materials were calibrated using NBS-19 for C. The standard deviations (SD) of repeated
measurements of the same commercially produced powdered keratin reference material
throughout all protein analyses were 0.2 for C. Triple 200ul standard gas was injected for
the purpose of calibration. From the area of the peak of CO2, the percentage of the
15
unknown sample can be calculated based on the standard calibration sample, and thus the
concentration of the sample could be calculated.
Analytical Methods
Samples were routinely collected at the end of each period, filtered and
analyzed. Chemical oxygen demand (COD), ammonia (NH3-N), nitrate (NO3-N), nitrite
(NO2-N), and dissolved phosphorus (PO43-P), were quantified using HACH methods
8000, 10031 (Salicylate method), 10020 (Chromotropic acid method), and 8153 (Ferrous
sulfate method), and 8048 (Ascorbic acid method), respectively. Mixed liquor samples
were collected using plastic pipette, which was put into midheight on the bioreactors,
effluent cowboy or holding tank. The mixed liquor solids concentration was determined
as total suspended solids (TSS) and as volatile suspended solids (VSS), both were
measured in accordance with standard methods (APHA, 1985). Sludge volume index
(SVI) was determined by using method 2710D from “standard method for examination of
water and wastewater.” (APHA, 1985)

Figure 5: Schematics of the control (left side) and the modified (right side) SBRs
16
17
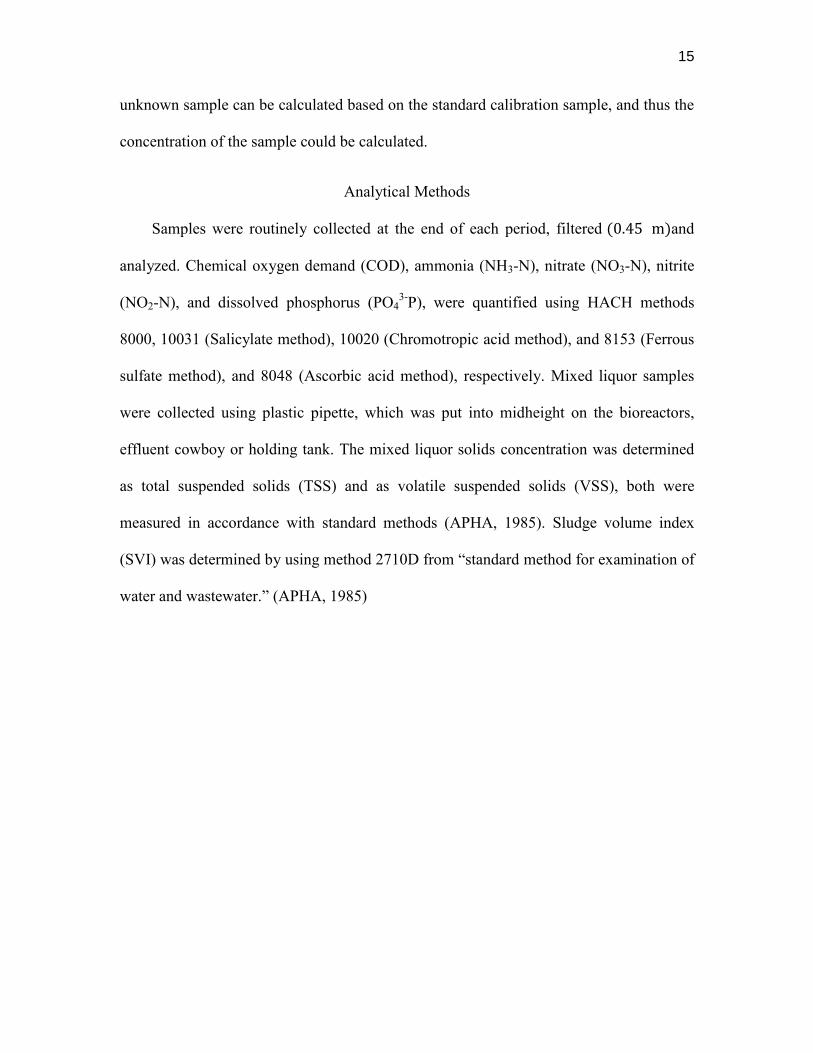
Figure 6.Time sequence in each cycle of the control SBR and the modified SBR. The anaerobic phase is provided to release P, the following aerobic will enable P uptake and ammonia oxidation and the last anoxic time period is provided to allow any denitrifictaion.
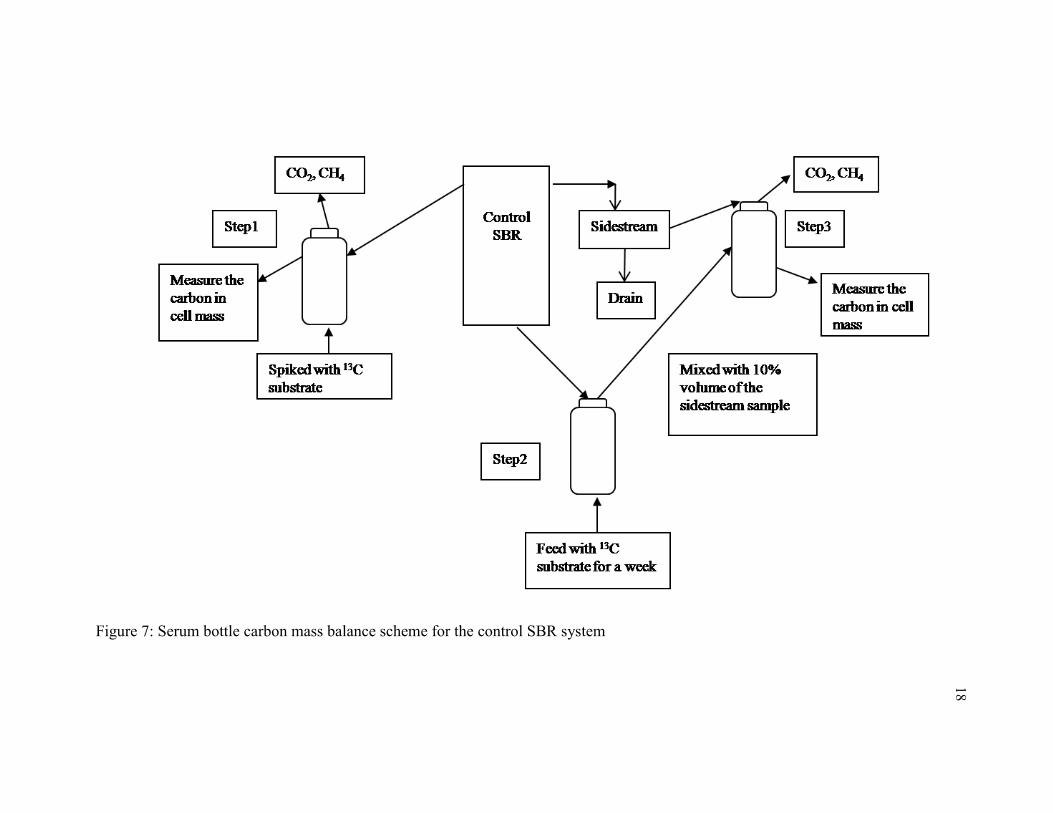
Figure 7: Serum bottle carbon mass balance scheme for the control SBR system
18
Figure 8: Serum bottle carbon mass balance scheme for the modified SBR system
19
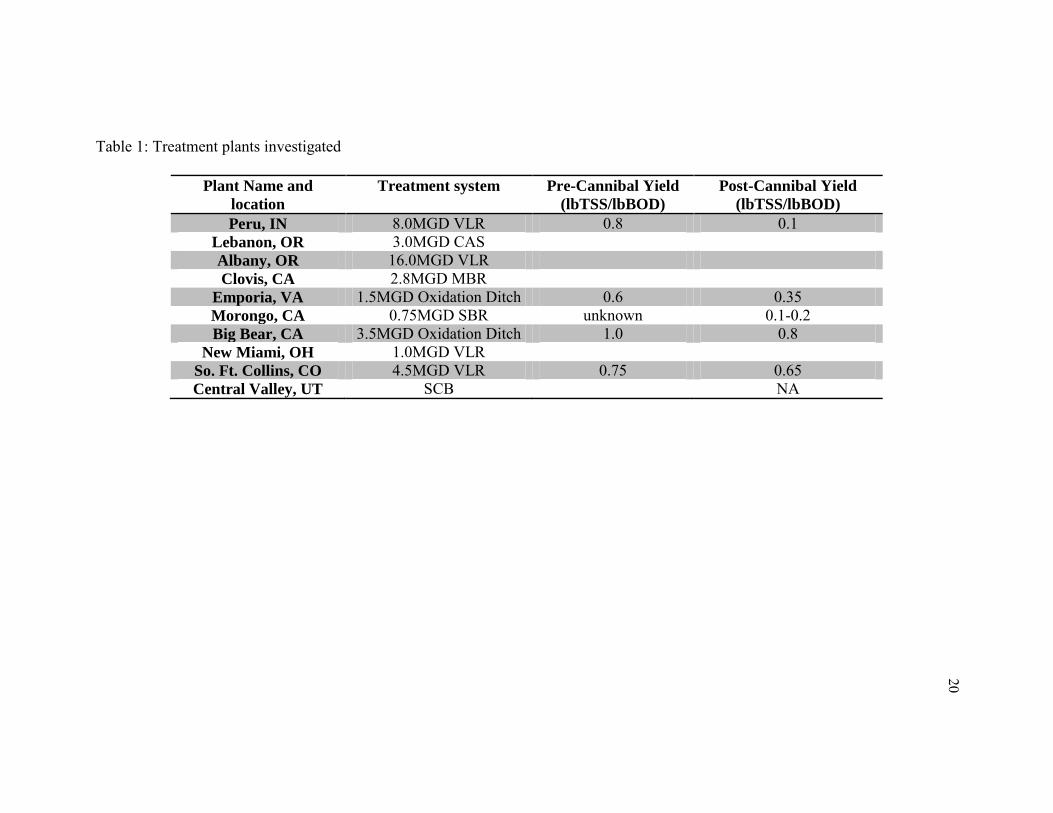
Table 1: Treatment plants investigated
Plant Name and
location
Treatment system Pre-Cannibal Yield
(lbTSS/lbBOD)
Post-Cannibal Yield
(lbTSS/lbBOD)
Peru, IN 8.0MGD VLR 0.8 0.1 Lebanon, OR 3.0MGD CAS Albany, OR 16.0MGD VLR Clovis, CA 2.8MGD MBR
Emporia, VA 1.5MGD Oxidation Ditch 0.6 0.35 Morongo, CA 0.75MGD SBR unknown 0.1-0.2 Big Bear, CA 3.5MGD Oxidation Ditch 1.0 0.8
New Miami, OH 1.0MGD VLR So. Ft. Collins, CO 4.5MGD VLR 0.75 0.65 Central Valley, UT SCB NA
20
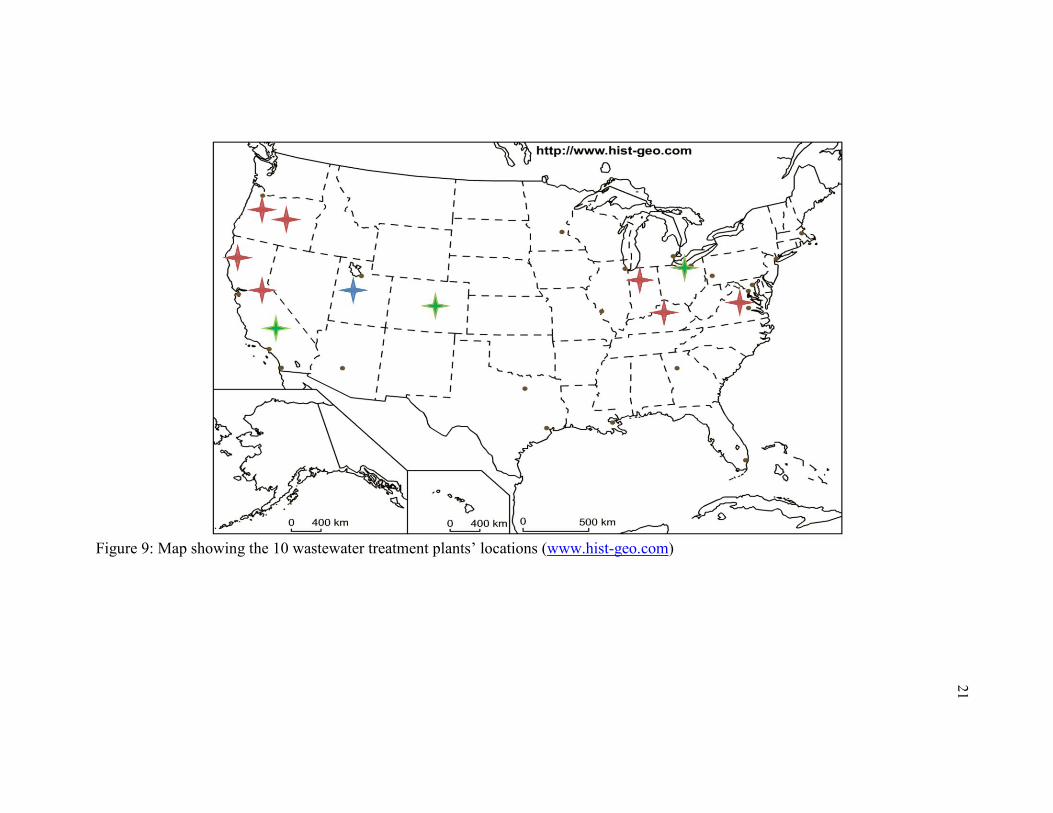
Figure 9: Map showing the 10 wastewater treatment plants’ locations (www.hist-geo.com)
21
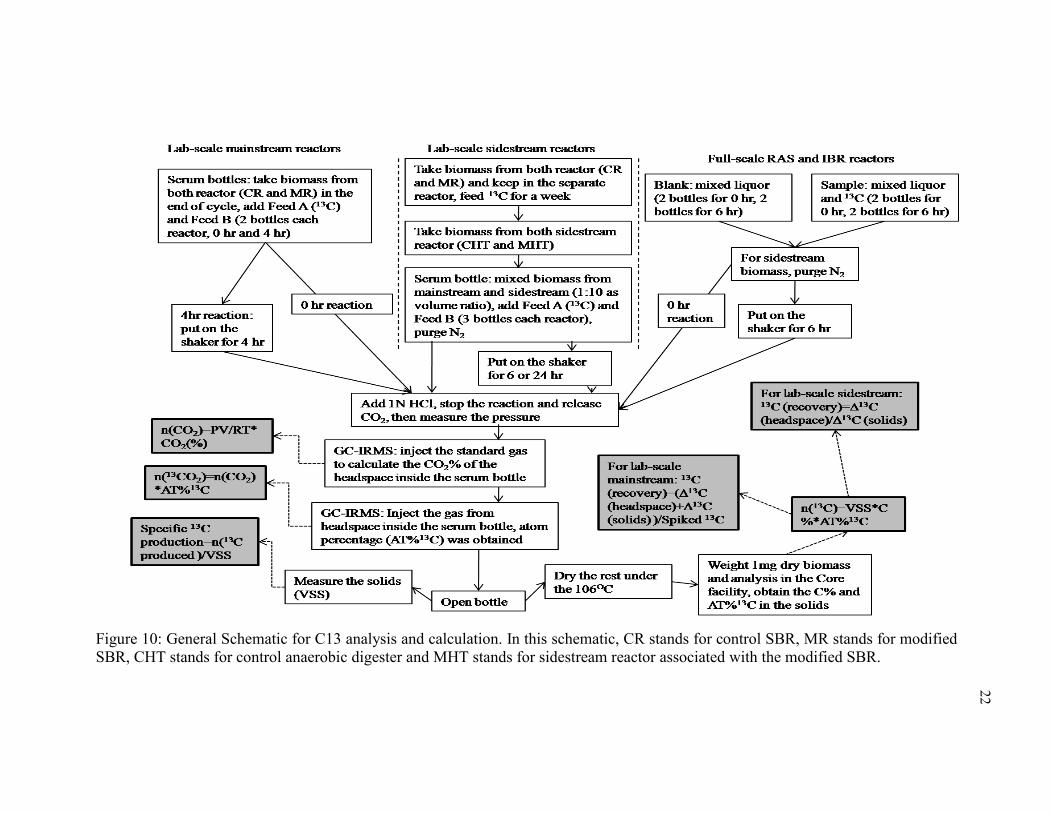
Figure 10: General Schematic for C13 analysis and calculation. In this schematic, CR stands for control SBR, MR stands for modified SBR, CHT stands for control anaerobic digester and MHT stands for sidestream reactor associated with the modified SBR.
22

CHAPTER 4
RESULTS AND DISCUSSION
Twin Reactor Performance
Nutrient Removal. The twin reactors were started almost three years ago but the
reactors were restarted in August 2011 because these twin reactors were not operated
properly in summer 2011. All tubing, a few pumps, pH controller and SBRs were
changed in August 2011 and that marked the beginning of my master’s thesis research.
At that time, I also prepared a fresh stock solution of micro nutrients and tried to revamp
the reactors, which provided me with the experience of reactor start-up and operation.
Both reactors were showing poor removal efficiencies. It took almost 2 weeks for me to
recover the performance of the reactors.
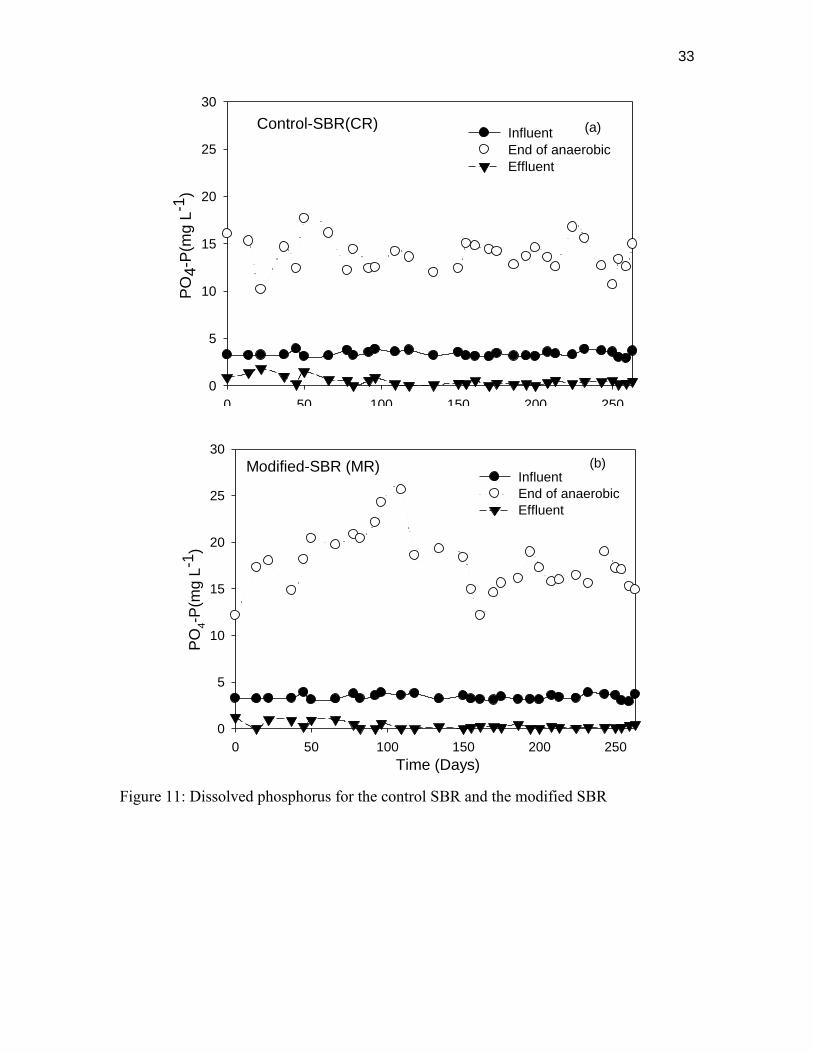
Figure 11 shows reactor performance in terms of phosphorus removal. This figure
shows dissolved P profiles for the influent, effluent and total P release during the
anaerobic phase for the control SBR and the modified SBR. The average dissolved P
released at the end of the anaerobic phase was about 13.82 mg/Lin the control SBR and
17.65mg/L in the modified SBR, respectively. The dissolved P in the final effluent was
always below 1 mg/L in both SBRs. Overall, both SBRs consistently showed 85% or
more P removal efficiency. Most of the COD was consumed by the end of anaerobic
phase in both SBRs and nearly 100% COD removal was consistently recorded in both
SBRs.
24
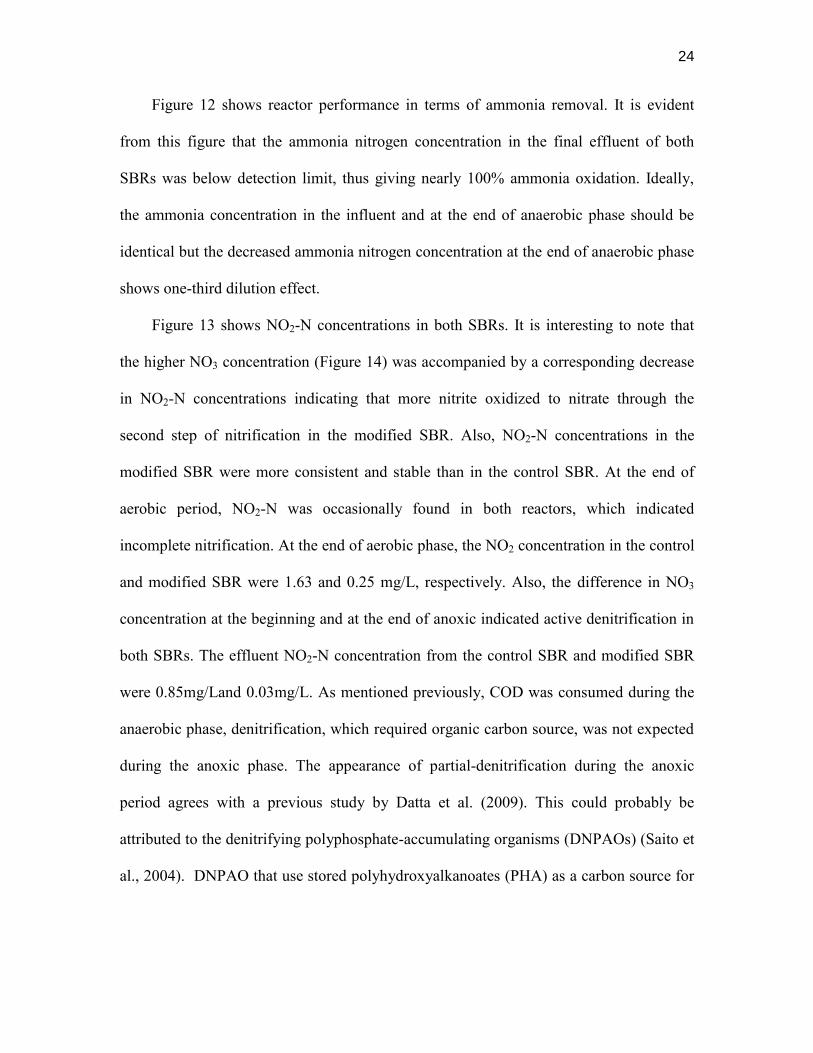
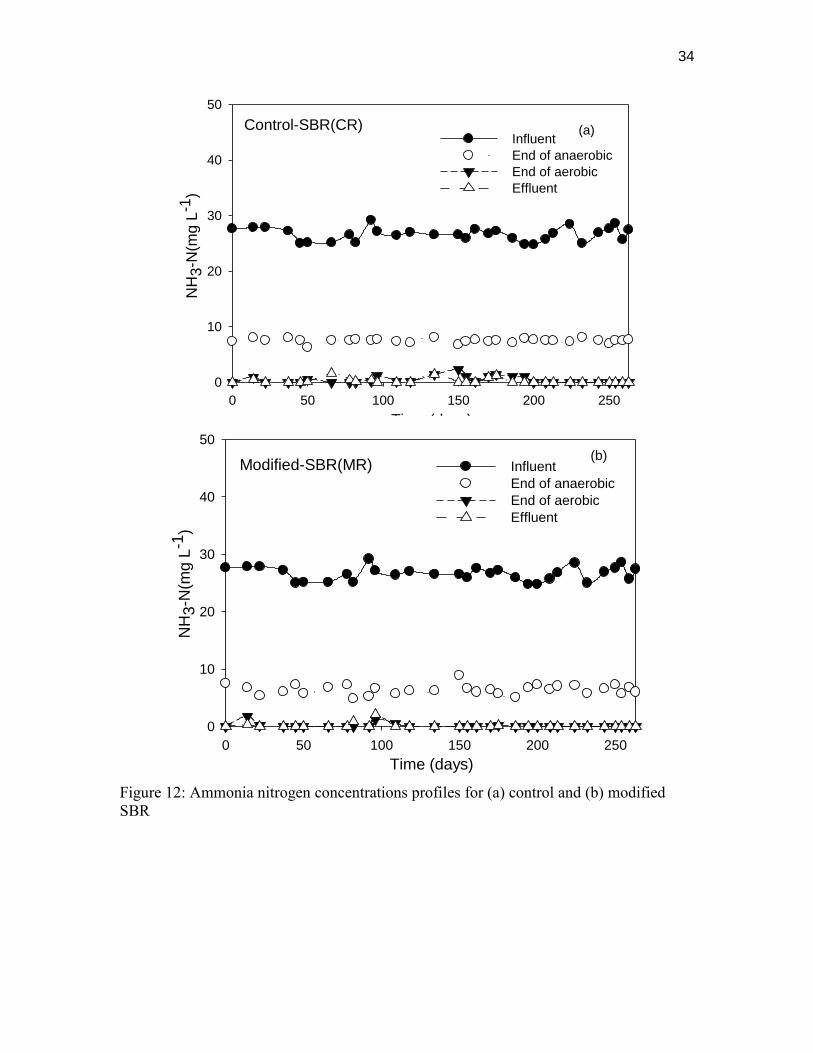
Figure 12 shows reactor performance in terms of ammonia removal. It is evident
from this figure that the ammonia nitrogen concentration in the final effluent of both
SBRs was below detection limit, thus giving nearly 100% ammonia oxidation. Ideally,
the ammonia concentration in the influent and at the end of anaerobic phase should be
identical but the decreased ammonia nitrogen concentration at the end of anaerobic phase
shows one-third dilution effect.
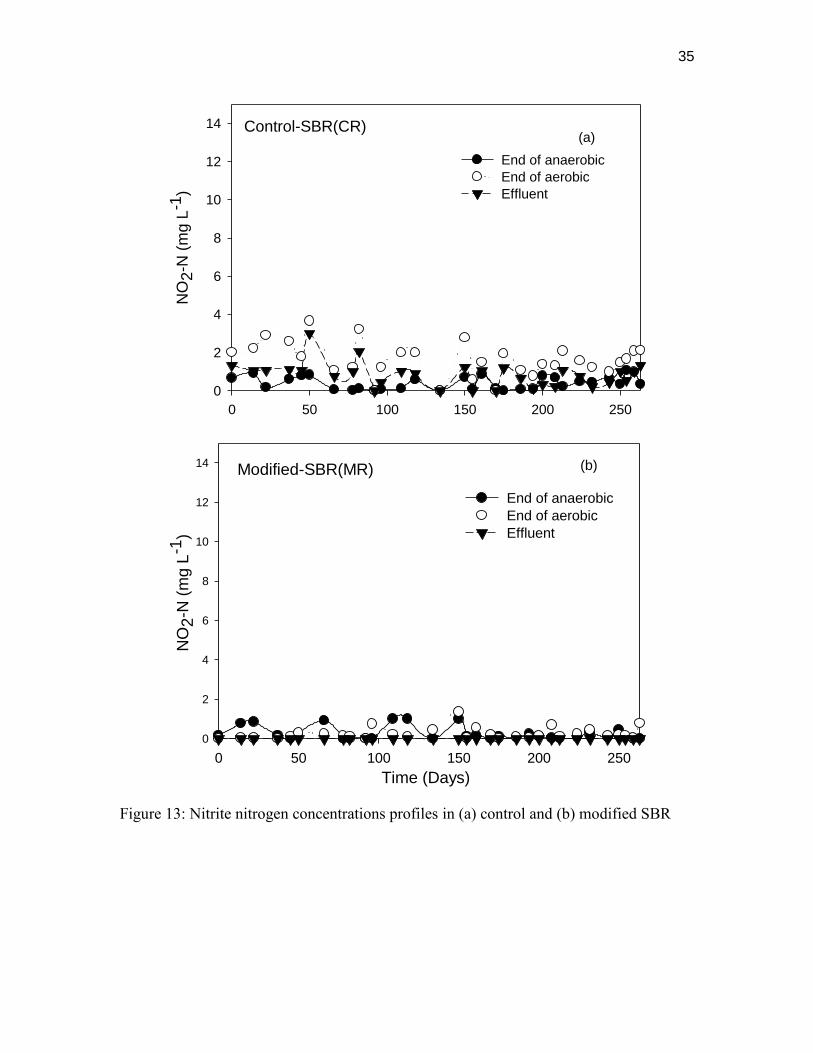
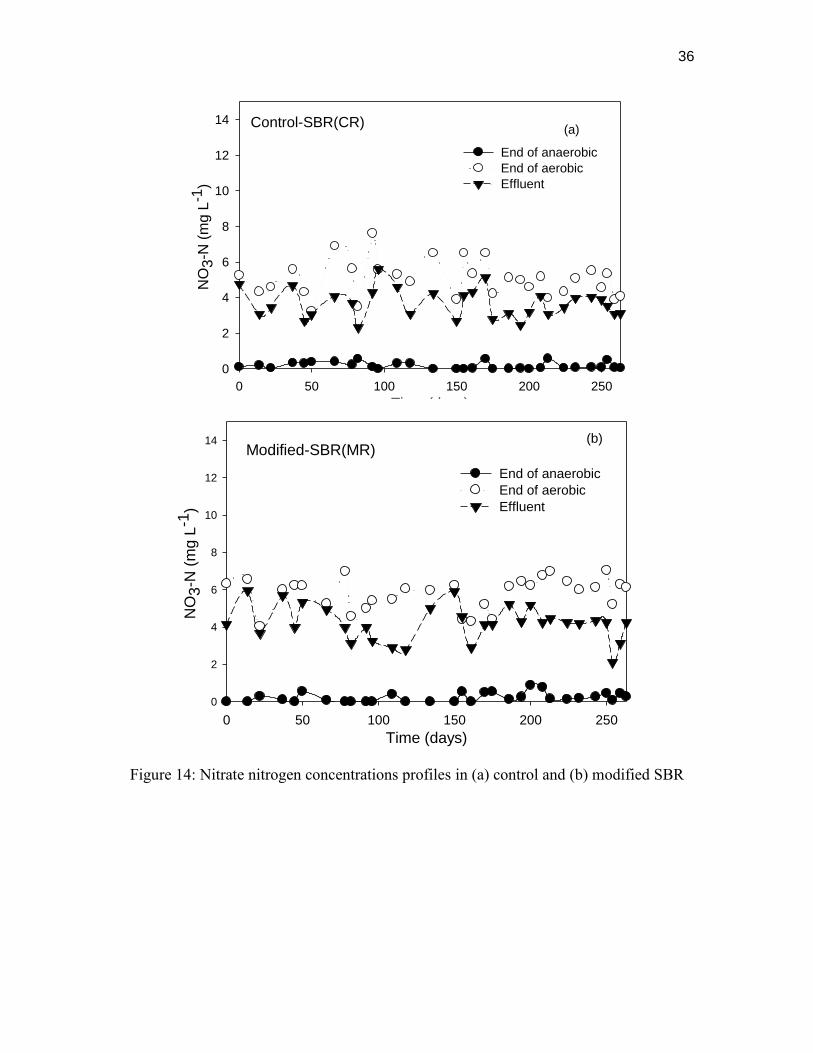
Figure 13 shows NO2-N concentrations in both SBRs. It is interesting to note that
the higher NO3 concentration (Figure 14) was accompanied by a corresponding decrease
in NO2-N concentrations indicating that more nitrite oxidized to nitrate through the
second step of nitrification in the modified SBR. Also, NO2-N concentrations in the
modified SBR were more consistent and stable than in the control SBR. At the end of
aerobic period, NO2-N was occasionally found in both reactors, which indicated
incomplete nitrification. At the end of aerobic phase, the NO2 concentration in the control
and modified SBR were 1.63 and 0.25 mg/L, respectively. Also, the difference in NO3
concentration at the beginning and at the end of anoxic indicated active denitrification in
both SBRs. The effluent NO2-N concentration from the control SBR and modified SBR
were 0.85mg/Land 0.03mg/L. As mentioned previously, COD was consumed during the
anaerobic phase, denitrification, which required organic carbon source, was not expected
during the anoxic phase. The appearance of partial-denitrification during the anoxic
period agrees with a previous study by Datta et al. (2009). This could probably be
attributed to the denitrifying polyphosphate-accumulating organisms (DNPAOs) (Saito et
al., 2004). DNPAO that use stored polyhydroxyalkanoates (PHA) as a carbon source for
25
denitrification, recorded and also exhibited uses cyclic phosphate release and uptake
when exposed to a sequence of anaerobic and aerobic conditions.
Solids and Biomass Yield
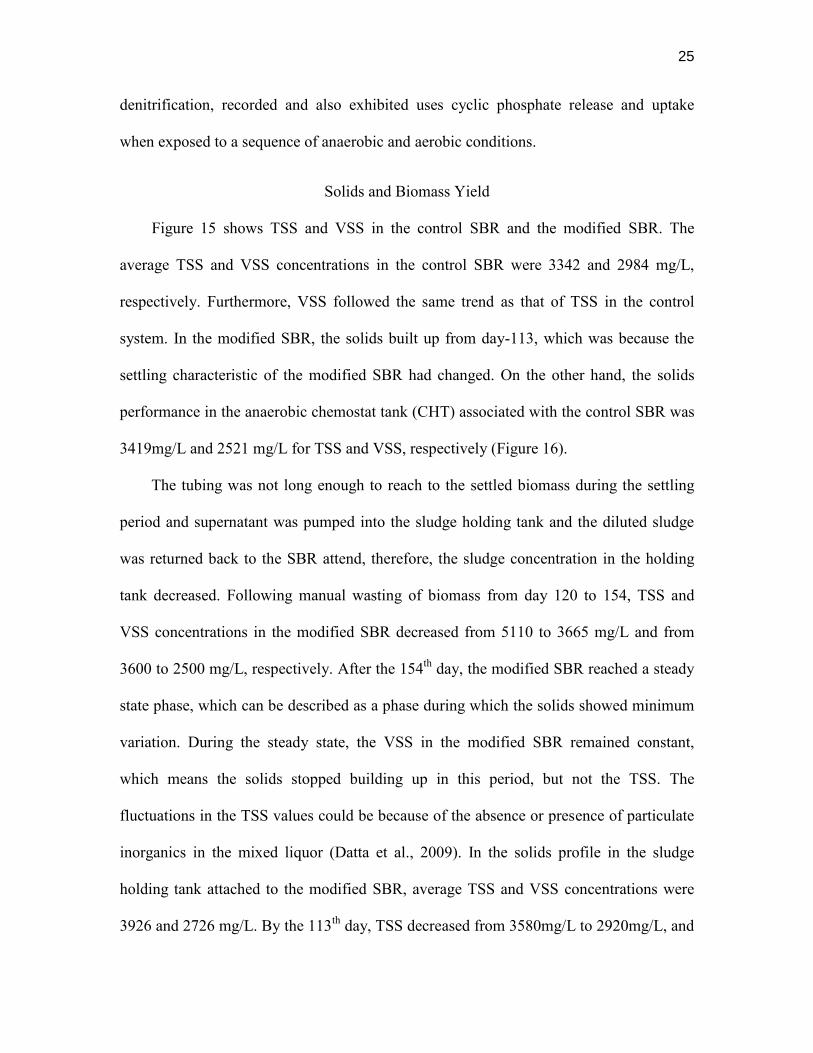
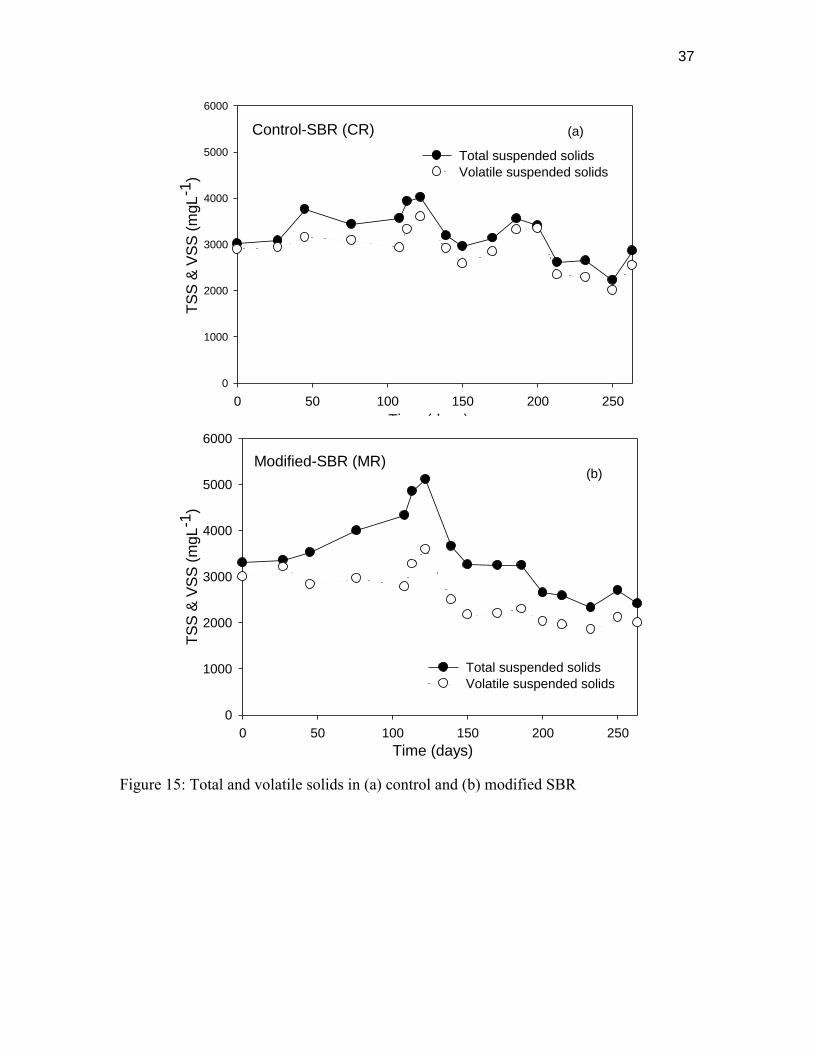
Figure 15 shows TSS and VSS in the control SBR and the modified SBR. The
average TSS and VSS concentrations in the control SBR were 3342 and 2984 mg/L,
respectively. Furthermore, VSS followed the same trend as that of TSS in the control
system. In the modified SBR, the solids built up from day-113, which was because the
settling characteristic of the modified SBR had changed. On the other hand, the solids
performance in the anaerobic chemostat tank (CHT) associated with the control SBR was
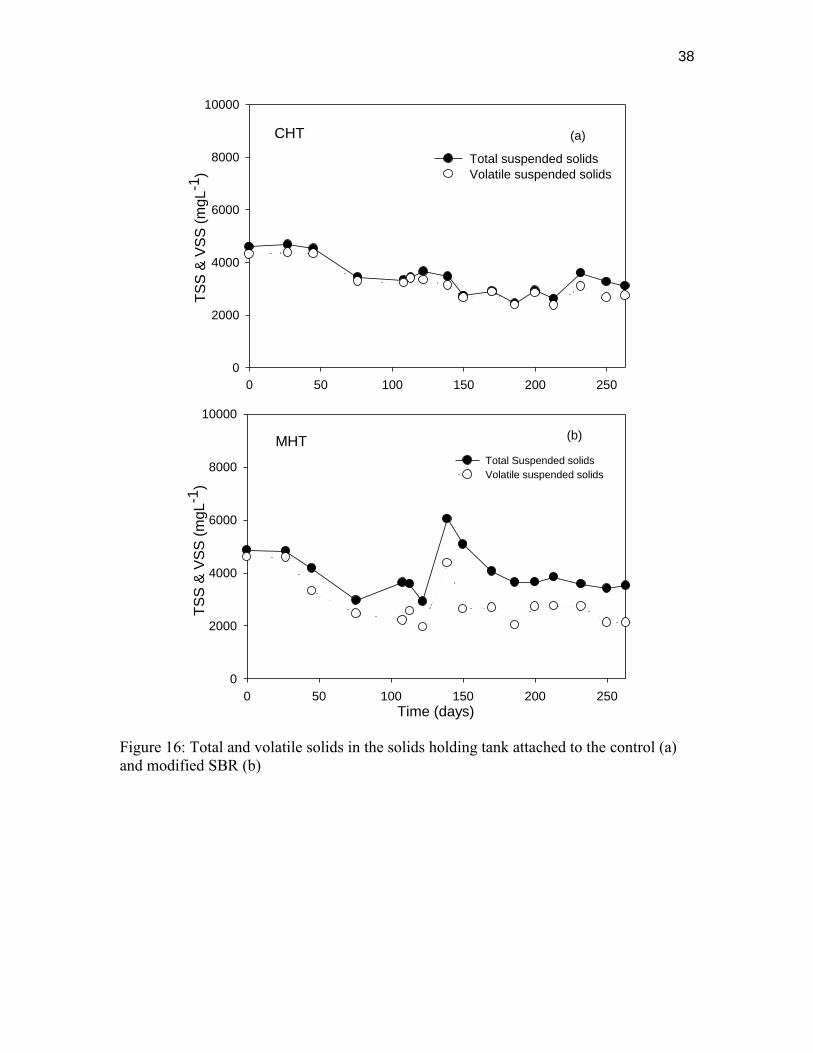
3419mg/L and 2521 mg/L for TSS and VSS, respectively (Figure 16).
The tubing was not long enough to reach to the settled biomass during the settling
period and supernatant was pumped into the sludge holding tank and the diluted sludge
was returned back to the SBR attend, therefore, the sludge concentration in the holding
tank decreased. Following manual wasting of biomass from day 120 to 154, TSS and
VSS concentrations in the modified SBR decreased from 5110 to 3665 mg/L and from
3600 to 2500 mg/L, respectively. After the 154th day, the modified SBR reached a steady
state phase, which can be described as a phase during which the solids showed minimum
variation. During the steady state, the VSS in the modified SBR remained constant,
which means the solids stopped building up in this period, but not the TSS. The
fluctuations in the TSS values could be because of the absence or presence of particulate
inorganics in the mixed liquor (Datta et al., 2009). In the solids profile in the sludge
holding tank attached to the modified SBR, average TSS and VSS concentrations were
3926 and 2726 mg/L. By the 113th day, TSS decreased from 3580mg/L to 2920mg/L, and
26
started to increase after the 122nd day. This fluctuation was because of manual wasting
which avoided solids going back in the main reactor. After the steady state, the solids
concentration in the anaerobic chemostat tank (MHT) associated with the modified SBR
remained constant.
Based on the solids data and the mass of COD that was fed to each SBR, the
biomass yield was calculated to be 0.333 and 0.114 mg VSS/mg COD for the control
SBR and modified systems, respectively. The yield in the modified SBR was 60% less
than the control SBR. According to an earlier study by Novak et al. (2006) on the
Cannibal process, the yield in the control system was around 0.26mg VSS/mg COD,
which was slightly different from this study (0.333mg VSS/mg COD). The reason for the
difference could be attributed to the SRT of both systems. The SBR was operated with an
SRT around 20 days, as compared to 10 days in this study.
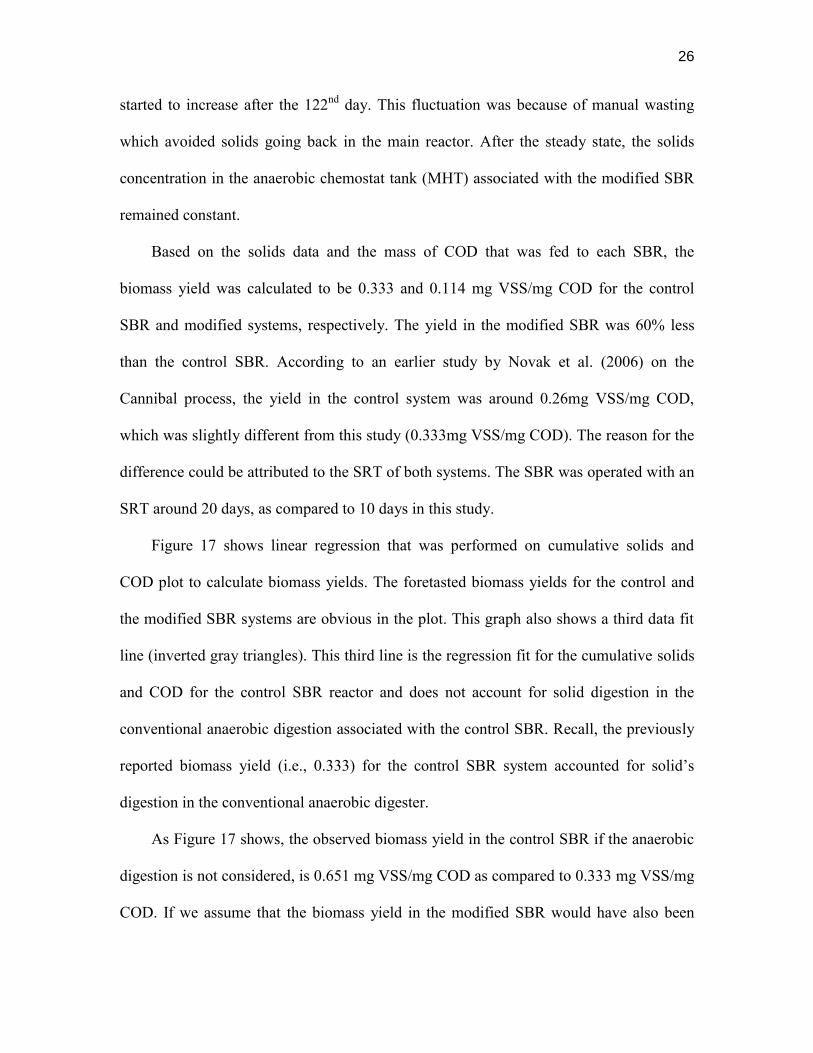
Figure 17 shows linear regression that was performed on cumulative solids and
COD plot to calculate biomass yields. The foretasted biomass yields for the control and
the modified SBR systems are obvious in the plot. This graph also shows a third data fit
line (inverted gray triangles). This third line is the regression fit for the cumulative solids
and COD for the control SBR reactor and does not account for solid digestion in the
conventional anaerobic digestion associated with the control SBR. Recall, the previously
reported biomass yield (i.e., 0.333) for the control SBR system accounted for solid’s
digestion in the conventional anaerobic digester.
As Figure 17 shows, the observed biomass yield in the control SBR if the anaerobic
digestion is not considered, is 0.651 mg VSS/mg COD as compared to 0.333 mg VSS/mg
COD. If we assume that the biomass yield in the modified SBR would have also been

27
0.651 if the associated sidestream is not considered, the difference (from 0.651 to 0.136)
in the observed yield is almost 79% when the sidestream is not considered versus when it
is accounted for. On the other hand, the corresponding difference in the control SBR is
only 49%, which indicated that there are other mechanisms other than just conventional
anaerobiosis in the modified SBR system going on to give lower overall yield.
Specific Oxygen Uptake Rates (SOUR) Tests
The SOUR tests aimed to investigate the difference in bacterial activities between
both reactors. When both reactors were at steady state, the oxygen uptake rate (OUR)
tests were performed by spiking a known volume of mixed liquor from each SBR with
feed A (carbon source) and feed B (ammonia) to estimate organism response/physiology.
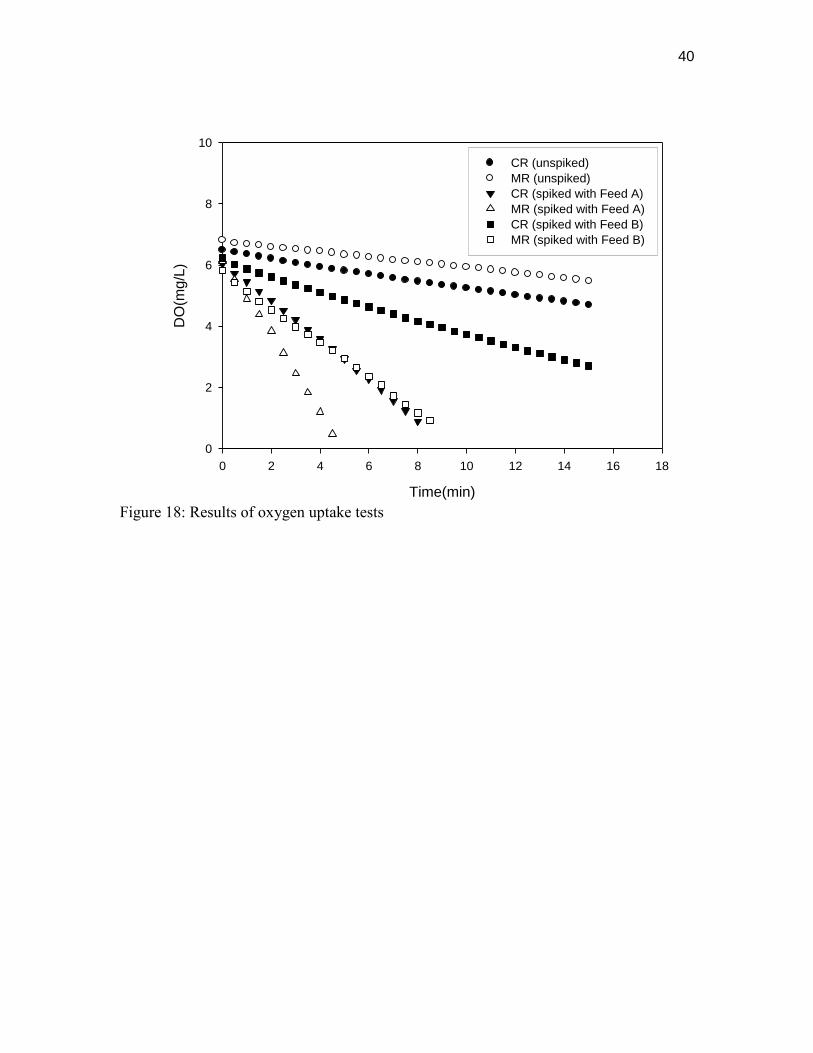
The results of SOUR tests performed under different conditions are shown in Figure 18.
Table 2 summarizes the results in form of mathematical values.
When the SOUR tests were done on starving biomass (no spiking with either feed
solution), the SOUR values for the MR and CR mixed liquor were nearly the same (top
two lines in Figure 18). When biomasses were spiked with either feed A or feed B, mixed
liquor from the modified SBR showed higher SOUR rates (Table 2) suggesting the
tendency of this mixed liquor to consume dissolved oxygen at a faster rate.
Sludge Volume Index (SVI)
The SVI is considered an important parameter in wastewater treatment to quantify
the settling characteristics of activated sludge (Metcalf and Eddy, 2004). The modified
system showed good settling properties during the steady state period (SVI: 72 ml/g)
compared to the control system (SVI: 136 ml/g). This finding agreed with SVI in lab
scale set ups for similar studies (Novak et al., 2007). Lower SVI in modified SBR
28
indicated much better settling characteristics than in control SBR. The settling result of
modified SBR suggested that extracellular polymeric substance (EPS) was regenerated in
the SBR, because the flocculation was not negatively affected. Furthermore, the biomass
from the modified SBR showed faster settling velocity than the mixed liquor from the
control SBR (Figure 19). The effluent characteristic is another parameter to describe the
settling properties. The average TSS in the control and the modified SBRs were 64 and
63 mg/L.
Carbon Mass Balance
Fate of Carbon in Control SBR and Modified SBR Using C12. Table 3 summarizes
CO2 formation rate results with mixed liquor taken from the control and the modified
SBRs. Based on the ideal gas laws and biomass concentrations in serum bottles, the
specific molar concentrations of CO2 were calculated. It is clear from Table 3 that the
mixed liquor from the modified SBR enabled almost 44% more CO2 than the mixed
liquor from the control SBR.
Table 4 shows CO2 formation results in mixed liquors taken from the control and the
modified SBRs. This experiment was repeated with C12 to confirm results shown in
Table 3. It is convincingly clear that the results are reproducible and that the modified
SBR produced 45% more CO2 gas than the mixed liquor from the control SBR. Based on
these experiments, it can be concluded that the modified SBR mixed liquor poses greater
metabolic activity and that this SBR has the capability of mineralizing the organics to
CO2 at a faster rate than the control SBR thus producing less biomass.
Fate of Carbon in Control and Modified SBR Using C13 Isotope and Carbon Mass
Balance in The SBRs Based on Spiked C13 Concentrations. An attempt was made to
29
achieve carbon mass balance in serum bottles in which case, C13 partitioning as a result
of spiking in the biomass was also measured. Table 5 shows three subtables. The top of
Table 5 represents C13-CO2 in the head space of serum bottles at 0 time (beginning of the
experiments) for both SBRs. The middle portion of Table 5 shows molar C13-CO2
concentrations in the head spaces after 6 h from the beginning in duplicates. Finally, the
bottom portion shows an increase in C13 content in biomasses as a result of C13 spiking.
All three measurements were performed simultaneously in same serum bottles.
The first observation from Table 5 is that almost 41% of the spiked C13 mass went
to form biomass in case of mixed liquor from the control SBR where as it was about 29.5 %
for the modified SBR mixed liquor. This further supports the notion that less biomass in
the modified SBR was generated as discussed previously in this thesis leading to low
biomass yield. Also, nearly 100 % C13 recovery was achieved in both SBRs.
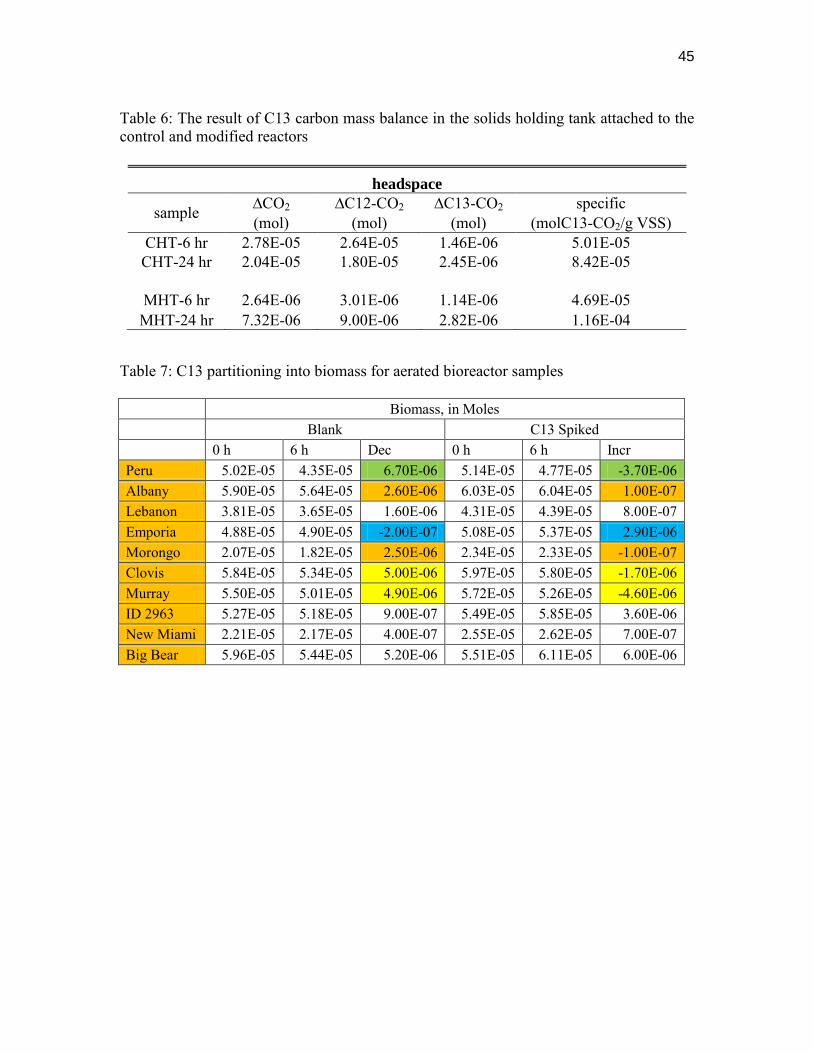
Carbon Mass Balance in The Digester and The Sidestream. Table 6 shows total CO2
generated in the head space at 6 h and 24 h when the biomasses from the conventional
digester and the sidestream were spiked with C13 labeled biomass (one-tenth). It is clear
from the table that both CHT and MHT mixed liquors enabled almost identical amounts
of CO2 after 6 h. Because fresh C13 labeled biomass was used for these experiments, it
could be possible that the bacteria present in CHT and MHT mixed liquors were
acclimatizing to this new biomass. Nevertheless, both mixed liquors carried out the
digestion of the added biomass. Surprisingly, the mixed liquor from the MHT (sidestream)
enabled almost 27% more CO2 gas in the head space after 24 h than the mixed liquor
from the control digester. This adds to the notion that not only are the conditions in the
modified SBR well suited for faster metabolism, the conditions in the sidestream reactor
30
also add to better biomass disappearance. Samples were not spiked with C13 glucose. It
is interesting to note that C13 carbon was present in the original mixed liquor samples.
The presence of C13 carbon in mixed liquor samples is not surprising because these
samples came from full scale treatment plants. Based on nonspiked samples (blank) and
C13-CO2 measurements, it appears that the Peru treatment plant yielded the maximum
CO2. On the other hand, based on C13spiked carbon, the Albany and Lebanon treatment
plants mixed liquors produced more CO2 than other plants. Among all plants, it appears
that the New Miami treatment plant yielded the least amount of CO2, both in the blank
and in the spiked serum bottles. However, these results need to be verified further using
a modified protocol. For example, washing the biomass samples first before conducting
the actual samples.
C13 Partitioning into Biomass for Aerated Bioreactor Samples. Table 7 shows C13
partitioning into biomass. These biomass samples were collected from the same serum
bottles/mixed liquor that were used to generate information in Table 1.
In Table 7, "Dec" means decrease in C13 concentration in the biomass from the
blank serum bottles over 6 h because these tests were not spiked with C13 carbon. On the
other hand, "Incr" implies an increase in C13 content in biomass taken from C13 spiked
serum bottles. Based on blank tests, the Peru biomass had the maximum decrease in C13
showing a greater tendency to undergo endogenous decay. This observation is in
agreement with more CO2 formation data in the blank test (Table 8) for the Peruvian
mixed liquor. Likewise, the C13 content in biomasses for Morongo, Clovis and Murray
decreased in the blank experiments. New Miami enabled the least decrease in C13, which
is also in agreement with almost no CO2 formation (Table 8) in New Miami's blank test.
31
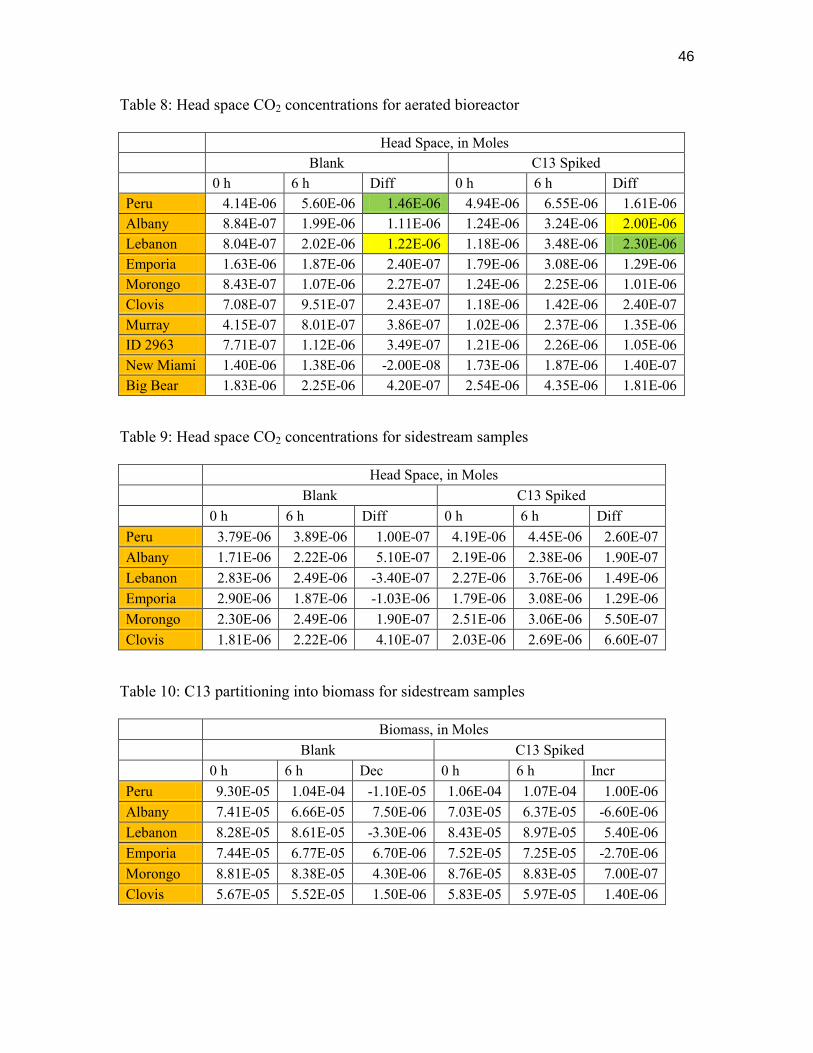
For the biomass which came from spiked samples, the change in C13 was calculated
assuming that cells will grow and hence, the final concentration of C13 in the biomass in
spiked samples will be more than the concentration at the beginning of each experiment.
Negative value in the last column means that the C13 in the biomass decreased over 6 h
to start with Peru, the change in C13 in the spiked mixed liquor biomass was negative,
suggesting that the C13 content in the biomass decreased over 6 h. However, it should be
noted that the net decrease in the spiked samples accounts for the decrease in blank tests
as well. Hence, it is absolutely difficult to conclude that none of the available C13-
glucose in the bulk liquid partitioned into the biomass. It is also true for Peru that not
much CO2 formed in the spiked serum bottle and as a result, it is highly possible that not
much C13 partitioned into the biomass. The maximum increase in C13 in spiked biomass
samples was noticed for Emporia, Big Bear and the plant with ID 2963. The CO2
formation rates for these three plants in spiked tests (Table 8) were also in the same
range.
C13 Partitioning into Gas for Sidestream Reactor Samples. For mixed liquor
samples from sidestream reactors, we could not analyze samples from Murray, Big Bear,
New Miami and ID 2963 because the refrigerator in which these were stored got over
cooled to negative temperature due to compressor problems and apparently all bacteria
were dead. It is also to be noted that all sidestream samples were stored at least for 1
night at 4oC before they were processed, whereas aerated bioreactor samples were
processed immediately upon their receipt.
According to the Table 9, it looks like there was not much CO2 formed in the head
space of the unspiked blank experiments. Likewise, there was not much CO2 formation in
32
the head space in spiked experiments except for the Lebanon and Emporia plants. It is
worth mentioning that these experiments were performed by spiking the sidestream
mixed liquors with a known concentration of C13 glucose. However, this does not reflect
reality because, sidestream reactors receive settled biomass from the aerated bioreactors
not any soluble substrate. If we did similar experiments for mixed liquor from the
ongoing Cannibal reactor, we will need to use C13 labeled biomass rather than soluble
substrate to obtain a true picture. Furthermore, these samples should also be processed
immediately without letting them sit overnight.
Table 10 shows partitioning of C13 into biomass for mixed liquor samples from
sidestream reactors. A negative "Dec" means C13 initially present in the biomass
increased over 6 h, which was the case for Peru and Lebanon. This implies that bacteria
grew by consuming C13, which was originally present, from the bulk liquid. Likewise,
for the spiked samples, "Incr" is obtained by subtracting 6 h C13 concentrations from
those initially (0 h) present. Hence, a positive "Incr" means bacteria consumed C13 from
the soluble substrate and grew, which is true for all plants but Albany and Emporia.
In summary, a definite trend could not be established for sidestream samples
because: (1) they were spiked with soluble substrate rather than C13 biomass and, (2)
samples were not processed immediately because of issues related to the number of
samples that can processed at any given point in time.
33
Figure 11: Dissolved phosphorus for the control SBR and the modified SBR
Control-SBR(CR)
Time (Days)
0 50 100 150 200 250
PO
4-P
(mg
L-1
)
0
5
10
15
20
25
30
Influent
End of anaerobic
Effluent
(a)
Time (Days)
0 50 100 150 200 250
PO
4-P
(mg
L-1
)
0
5
10
15
20
25
30
Influent
End of anaerobic
Effluent
Modified-SBR (MR) (b)
34
Figure 12: Ammonia nitrogen concentrations profiles for (a) control and (b) modified SBR
Control-SBR(CR)
Time (days)
0 50 100 150 200 250
NH
3-N
(mg
L-1
)
0
10
20
30
40
50
Influent
End of anaerobic
End of aerobic
Effluent
(a)
Modified-SBR(MR)
Time (days)
0 50 100 150 200 250
NH
3-N
(mg
L-1
)
0
10
20
30
40
50
Influent
End of anaerobic
End of aerobic
Effluent
(b)
35
Figure 13: Nitrite nitrogen concentrations profiles in (a) control and (b) modified SBR
Control-SBR(CR)
Time (Days)
0 50 100 150 200 250
NO
2-N
(m
g L
-1)
0
2
4
6
8
10
12
14
End of anaerobic
End of aerobic
Effluent
(a)
Modified-SBR(MR)
Time (Days)
0 50 100 150 200 250
NO
2-N
(m
g L
-1)
0
2
4
6
8
10
12
14
End of anaerobic
End of aerobic
Effluent
(b)
36
Figure 14: Nitrate nitrogen concentrations profiles in (a) control and (b) modified SBR
Control-SBR(CR)
Time (days)
0 50 100 150 200 250
NO
3-N
(m
g L
-1)
0
2
4
6
8
10
12
14
End of anaerobic
End of aerobic
Effluent
(a)
Modified-SBR(MR)
Time (days)
0 50 100 150 200 250
NO
3-N
(m
g L
-1)
0
2
4
6
8
10
12
14
End of anaerobic
End of aerobic
Effluent
(b)
37
Figure 15: Total and volatile solids in (a) control and (b) modified SBR
Control-SBR (CR)
Time (days)
0 50 100 150 200 250
TS
S &
VS
S (
mgL
-1)
0
1000
2000
3000
4000
5000
6000
Total suspended solids
Volatile suspended solids
(a)
Modified-SBR (MR)
Time (days)
0 50 100 150 200 250
TS
S &
VS
S (
mgL
-1)
0
1000
2000
3000
4000
5000
6000
Total suspended solids
Volatile suspended solids
(b)
38
Figure 16: Total and volatile solids in the solids holding tank attached to the control (a) and modified SBR (b)
CHT
Time (days)
0 50 100 150 200 250
TS
S &
VS
S (
mgL
-1)
0
2000
4000
6000
8000
10000
Total suspended solids
Volatile suspended solids
(a)
MHT
Time (days)0 50 100 150 200 250
TS
S &
VS
S (
mgL
-1)
0
2000
4000
6000
8000
10000
Total Suspended solids
Volatile suspended solids
(b)

39
Figure 17: The overall yield in the control system, modified system and control SBR
Table 2: Results of specific oxygen uptake rate (SOUR)
SOUR (spiked with Feed A) SOUR (spiked with Feed B)
CR 9.71 mg O2/(gVSS h) 28.68 mg O2/(gVSS h) MR 16.51 mgO2/(gVSS h) 39.80 mg O2/(gVSS h)
Cumulative consumed sCOD (g COD)0 50 100 150 200 250 300
To
tal M
ass (
g V
SS
)
0
20
40
60
80
100
120
140
160
180
Control-SBR+CHT: Y=0.333x-0.48
Modified-SBR+MHT: Y=0.114x-0.316
controld-SBR: Y=0.651x-0.301
40
Figure 18: Results of oxygen uptake tests
Time(min)
0 2 4 6 8 10 12 14 16 18
DO
(mg
/L)
0
2
4
6
8
10
CR (unspiked)
MR (unspiked)
CR (spiked with Feed A)
MR (spiked with Feed A)
CR (spiked with Feed B)
MR (spiked with Feed B)

41
Time (min)
0 5 10 15 20 25 30 35
Settle
d s
ludge h
eig
ht (m
m)
50
100
150
200
250
300
350
400
450
CR
MR
Figure 19: The settling velocity test in both reactors
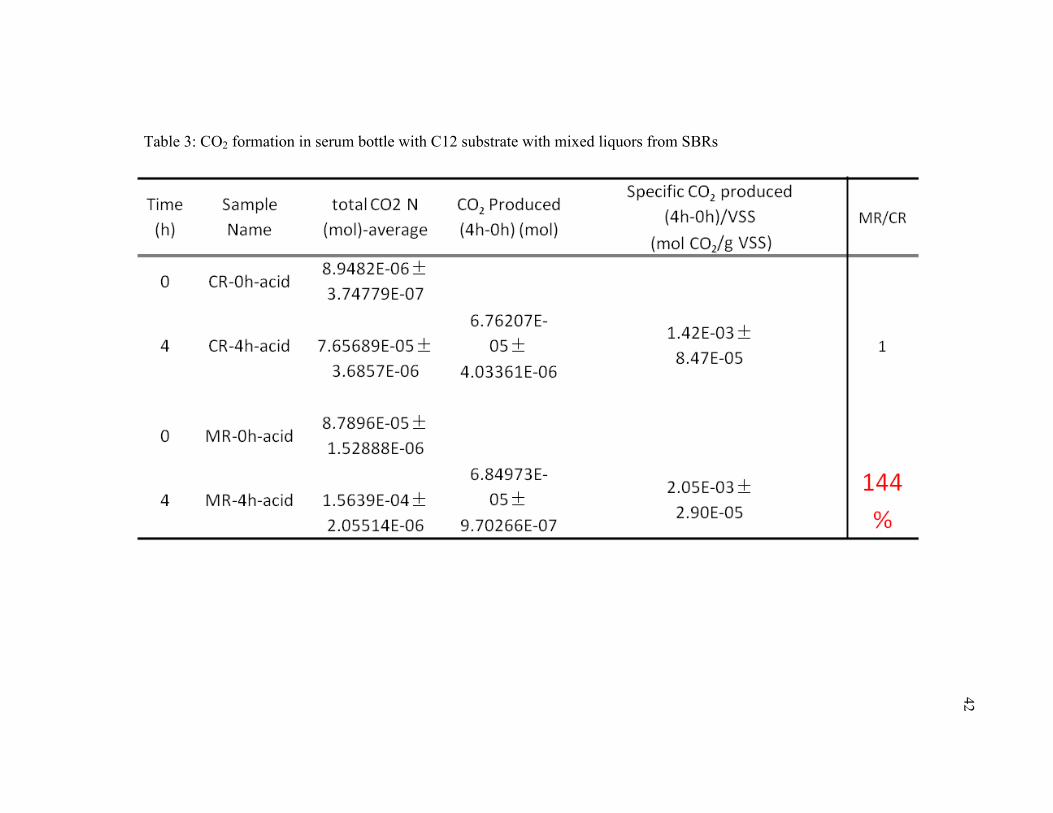
Table 3: CO2 formation in serum bottle with C12 substrate with mixed liquors from SBRs
42
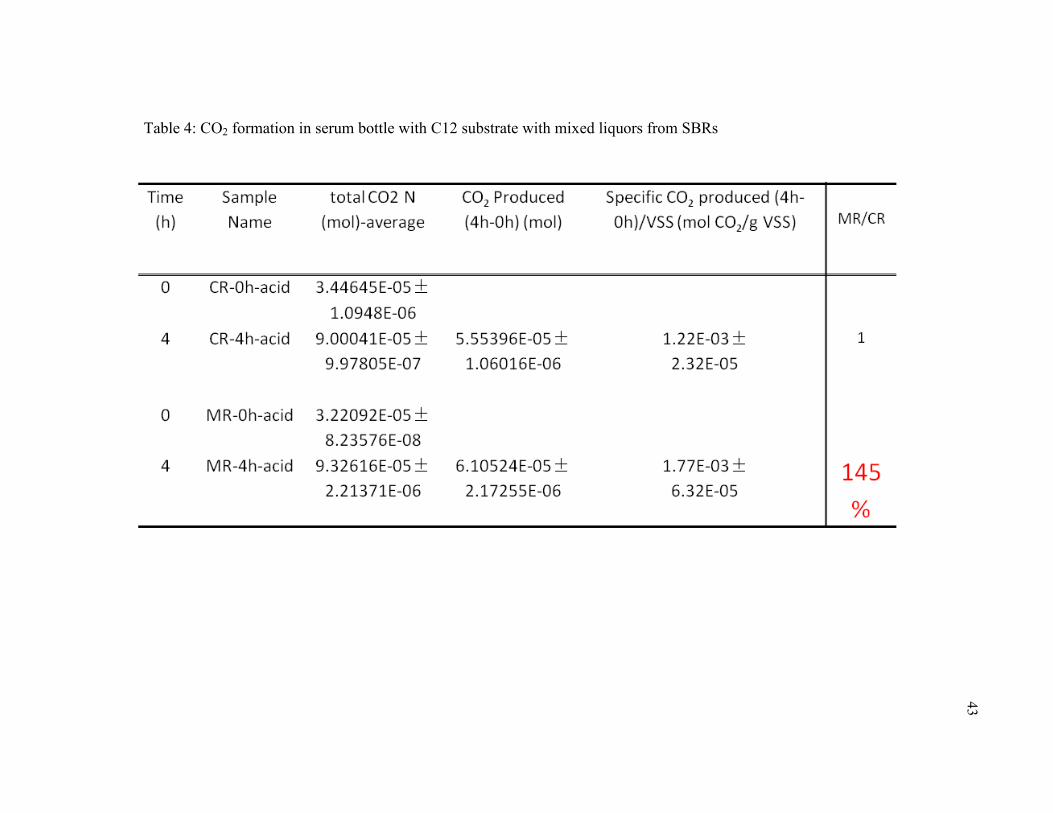
Table 4: CO2 formation in serum bottle with C12 substrate with mixed liquors from SBRs
43
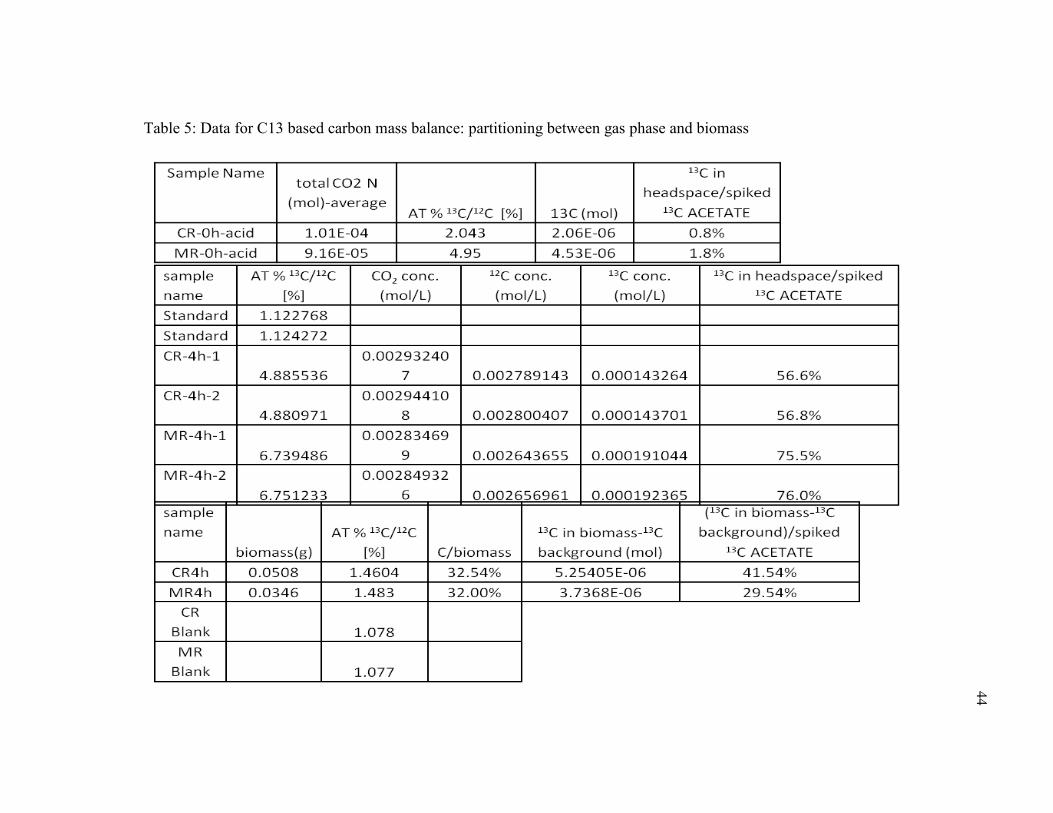
Table 5: Data for C13 based carbon mass balance: partitioning between gas phase and biomass
44
45
Table 6: The result of C13 carbon mass balance in the solids holding tank attached to the control and modified reactors
headspace
sample ∆CO2 ∆C12-CO2 ∆C13-CO2 specific (mol) (mol) (mol) (molC13-CO2/g VSS)
CHT-6 hr 2.78E-05 2.64E-05 1.46E-06 5.01E-05 CHT-24 hr 2.04E-05 1.80E-05 2.45E-06 8.42E-05
MHT-6 hr 2.64E-06 3.01E-06 1.14E-06 4.69E-05 MHT-24 hr 7.32E-06 9.00E-06 2.82E-06 1.16E-04
Table 7: C13 partitioning into biomass for aerated bioreactor samples
Biomass, in Moles Blank C13 Spiked 0 h 6 h Dec 0 h 6 h Incr Peru 5.02E-05 4.35E-05 6.70E-06 5.14E-05 4.77E-05 -3.70E-06 Albany 5.90E-05 5.64E-05 2.60E-06 6.03E-05 6.04E-05 1.00E-07 Lebanon 3.81E-05 3.65E-05 1.60E-06 4.31E-05 4.39E-05 8.00E-07 Emporia 4.88E-05 4.90E-05 -2.00E-07 5.08E-05 5.37E-05 2.90E-06 Morongo 2.07E-05 1.82E-05 2.50E-06 2.34E-05 2.33E-05 -1.00E-07 Clovis 5.84E-05 5.34E-05 5.00E-06 5.97E-05 5.80E-05 -1.70E-06 Murray 5.50E-05 5.01E-05 4.90E-06 5.72E-05 5.26E-05 -4.60E-06 ID 2963 5.27E-05 5.18E-05 9.00E-07 5.49E-05 5.85E-05 3.60E-06 New Miami 2.21E-05 2.17E-05 4.00E-07 2.55E-05 2.62E-05 7.00E-07 Big Bear 5.96E-05 5.44E-05 5.20E-06 5.51E-05 6.11E-05 6.00E-06
46
Table 8: Head space CO2 concentrations for aerated bioreactor
Head Space, in Moles Blank C13 Spiked 0 h 6 h Diff 0 h 6 h Diff Peru 4.14E-06 5.60E-06 1.46E-06 4.94E-06 6.55E-06 1.61E-06 Albany 8.84E-07 1.99E-06 1.11E-06 1.24E-06 3.24E-06 2.00E-06 Lebanon 8.04E-07 2.02E-06 1.22E-06 1.18E-06 3.48E-06 2.30E-06 Emporia 1.63E-06 1.87E-06 2.40E-07 1.79E-06 3.08E-06 1.29E-06 Morongo 8.43E-07 1.07E-06 2.27E-07 1.24E-06 2.25E-06 1.01E-06 Clovis 7.08E-07 9.51E-07 2.43E-07 1.18E-06 1.42E-06 2.40E-07 Murray 4.15E-07 8.01E-07 3.86E-07 1.02E-06 2.37E-06 1.35E-06 ID 2963 7.71E-07 1.12E-06 3.49E-07 1.21E-06 2.26E-06 1.05E-06 New Miami 1.40E-06 1.38E-06 -2.00E-08 1.73E-06 1.87E-06 1.40E-07 Big Bear 1.83E-06 2.25E-06 4.20E-07 2.54E-06 4.35E-06 1.81E-06
Table 9: Head space CO2 concentrations for sidestream samples
Head Space, in Moles Blank C13 Spiked 0 h 6 h Diff 0 h 6 h Diff Peru 3.79E-06 3.89E-06 1.00E-07 4.19E-06 4.45E-06 2.60E-07 Albany 1.71E-06 2.22E-06 5.10E-07 2.19E-06 2.38E-06 1.90E-07 Lebanon 2.83E-06 2.49E-06 -3.40E-07 2.27E-06 3.76E-06 1.49E-06 Emporia 2.90E-06 1.87E-06 -1.03E-06 1.79E-06 3.08E-06 1.29E-06 Morongo 2.30E-06 2.49E-06 1.90E-07 2.51E-06 3.06E-06 5.50E-07 Clovis 1.81E-06 2.22E-06 4.10E-07 2.03E-06 2.69E-06 6.60E-07
Table 10: C13 partitioning into biomass for sidestream samples
Biomass, in Moles Blank C13 Spiked 0 h 6 h Dec 0 h 6 h Incr Peru 9.30E-05 1.04E-04 -1.10E-05 1.06E-04 1.07E-04 1.00E-06 Albany 7.41E-05 6.66E-05 7.50E-06 7.03E-05 6.37E-05 -6.60E-06 Lebanon 8.28E-05 8.61E-05 -3.30E-06 8.43E-05 8.97E-05 5.40E-06 Emporia 7.44E-05 6.77E-05 6.70E-06 7.52E-05 7.25E-05 -2.70E-06 Morongo 8.81E-05 8.38E-05 4.30E-06 8.76E-05 8.83E-05 7.00E-07 Clovis 5.67E-05 5.52E-05 1.50E-06 5.83E-05 5.97E-05 1.40E-06
CHAPTER 5
CONCLUSIONS
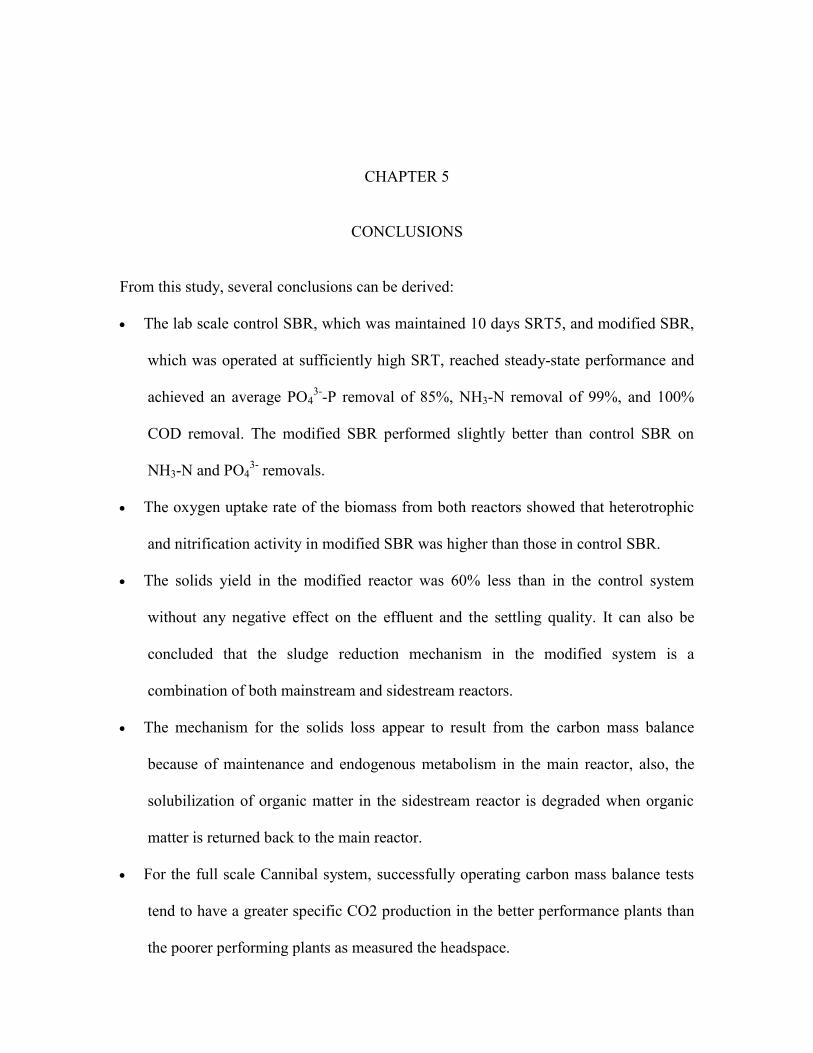
From this study, several conclusions can be derived:
The lab scale control SBR, which was maintained 10 days SRT5, and modified SBR,
which was operated at sufficiently high SRT, reached steady-state performance and
achieved an average PO43--P removal of 85%, NH3-N removal of 99%, and 100%
COD removal. The modified SBR performed slightly better than control SBR on
NH3-N and PO43- removals.
The oxygen uptake rate of the biomass from both reactors showed that heterotrophic
and nitrification activity in modified SBR was higher than those in control SBR.
The solids yield in the modified reactor was 60% less than in the control system
without any negative effect on the effluent and the settling quality. It can also be
concluded that the sludge reduction mechanism in the modified system is a
combination of both mainstream and sidestream reactors.
The mechanism for the solids loss appear to result from the carbon mass balance
because of maintenance and endogenous metabolism in the main reactor, also, the
solubilization of organic matter in the sidestream reactor is degraded when organic
matter is returned back to the main reactor.
For the full scale Cannibal system, successfully operating carbon mass balance tests
tend to have a greater specific CO2 production in the better performance plants than
the poorer performing plants as measured the headspace.
REFERENCES
Angenent, L. T., Karim, K., Al-Dahhan, M. H., Wrenn, B. A. and Guez-Espinosa, R. D., 2004. Production of bioenergy and biochemicals from industrial and agricultural wastewater. Trends in Biotechnology 22(9), 477-485.
APHA, 1985. Standard Methods for the Examination of Water and Wastewater, 16th ed. American Public Health Association, Washington, D. C.
Avcioglu, E., Orhon, D., and Sozen, S., 1998. A new method for the assessment of heterotrophic endogenous respiration rate under aerobic and anoxic conditions. Water Science and Technology 38(8), 95-103.
Barjenbruch, M., and Kopplow, O., 2003. Enzymatic, mechanical and thermal pre-treatment of surplus sludge. Advan. Env. Res. 7(3), 715-720.
Barker, D. J, and Stuckey, D. C., 1999. A review of soluble microbial products (SMP) in wastewater treatment systems. Water Research 33(14), 306-382.
Beacham, A. M., Seviour, R. J., Lindrea, K. C., and Livingston, I., 1990. Genospecies diversity of Acinetobacter isolates obtained from a biological nutrient removal pilot plant of a modified UCT configuration. Water Research 24, 23-29.
Ben Aim, R. M., and Semmens, M. J., 2002. Membrane bioreactors for wastewater treatment and reuse- a success story. Water Science Technology 47(1), 1-5.
Böhler, M., and Siegrist, H., 2004. Partial ozonation of activated sludge to reduce excess sludge, improve denitrification and control scumming and bulking. Water Science
Technology 49(10), 41-49.
Böhler, M., and Siegrist, H., 2006. Potential of activated sludge disintegration. Water
Science Technology 53(12), 207-216.
Bond, D. R., and Russell, J. B., 1996. A role for fructose 1,6-diphosphate in the ATPase- mediated energy spilling reaction of Streptococcus bovis. Applied Environ.
Microbiol. 62, 2095-2099.
Bond, P. L., 1997. Investigations of the microbial ecology of enhanced biological phosphorus removal in the activated sludge process. Ph.D thesis. The University of Queensland, Brisbane, Queensland, Australia.
49
Bonting, C. F. C., Willemsen, B. M. F., Akkermans-van Vliet, W., Bouvet, P. J. M., Kortstee, G. J. J., and Zehnder, A. J. B., 1992. Additional characteristics of the polyphosphate-accumulating Acinetobacter strain 210A and its identification as Acinetobacter johnsonii. FEMS Microbiol. Ecol. 102, 57-64.
Camacho, P., Geaugey, V., Ginestet, P., and Paul, E., 2002. Feasibility study of mechanically disintegrated sludge and recycle in the activated-sludge process. Water Science Technology 46(10), 97-104.
Capdeville, B., and Nguyen, K. M., 1990. Kinetics and modeling of aerobic and anaerobic film growth. Water Science Technology 22(1/2), 149-70.
Chen, G. H., and Liu Y., 1999. Modeling of energy spilling in substrate-sufficient cultures. J. Environ. Eng. ASCE. 125(6), 508-513.
Chen, G. H., and Leung, D. H. W., 2000. Utilization of oxygen in a sanitary gravity sewer. Water Research 34, 3813-3821.
Chen, G. H., Yip, W. K., Mo, H. K., and Liu, Y., 2001. Effect of sludge fasting/feasting on growth of activated sludge cultures. Water Research 35(4), 1029-1037.
Chen, G. H., An, K. J., Saby, S., Brois, E., and Djafer, M., 2003. Possible cause of excess sludge reduction in an oxic-settling-anaerobic activated sludge process (OSA process). Water Research 37(16), 385-566.
Chen G., Xi, P., Xu, D., and Yu, H., 2007. Comparison between inhibitor and uncoupler for minimizing excess sludge production of an activated sludge process. Frontiers
of Environmental Science & Engineering in China 1(1), 63-66.
Chiu, Y. C., Chang, C. N., Lim, J. G. and Huang, S. J., 1997. Alkaline and ultrasonic pre-treatment of sludge before anaerobic digestion. Water Science Technology 36(11), 155-162
Chu, C. P., Feng, W. H., Chang, B. V., Chou, C. H., and Lee, D. J., 1999. Reduction in microbial density level through freezing and thawing. Water Research 33, 3532-3535.
Chudoba, P., Chudoba, J., and Capdeville, B., 1992a. The aspect of energetic uncoupling of microbial growth in the activated sludge process: OSA system. Water Science
Technology 26(9-11), 2477-2480.
Chudoba, P., Morel, A., and Capdeville, B., 1992b. The case of both energetic uncoupling and metabolic selection of microorganisms in the OSA activated sludge system. Environ. Tech. 13, 761-770.
50
Cook, M., and Russell, B., 1994. Energy spilling reactions of Streptococcus bovis and resistance of its membrane to proton conductance. Appl. Environ. Microbiol. 60, 1942-1948.
Colmenarejo, M. F., Bustos, A., García, M. G., Borja, R., and Banks, C. J., 1998. An analysis of the factors that influence biological phosphorous removal (BPR) in a sequencing batch anaerobic/aerobic reactor. Bioprocess and Biosystems
Engineering 19(3), 171-174
Crocetti, G. R., Hugenholtz, P., Bond, P. L., Schuler, A., Keller, J., Jenkins, D., Blackall, L.L., 2000. Identification of polyphosphate accumulating organisms and design of 16S rRNA directed probes for their detection and quantification. Appl. Environ.
Microbiol. 66, 1175-1182.
Crocetti, G. R., Banfield, J. F., Keller, J., Bond, P. L. and Blackall, L. L., 2002. Glycogen-accumulating organisms in laboratory-scale and full-scale wastewater treatment processes. Microbiology (UK) 148, 3353-3364.
Cui, R. and Jahng, D., 2004. Nitrogen control in AO process with recirculation of solubilized excess sludge. Water Research 38(5), 1159-72.
Datta, T., Liu, Y., and Goel, R., 2008. Evaluation of simultaneous nutrient removal and sludge reduction usinglaboratory scale sequencing batch reactors. Chemosphere
76, 697-705.
Deinema, M. H., van Loosdrecht, M. C. M., and Scholten, A., 1985. Some physiological characteristics of Acinetobacter spp. accumulating large amounts of phosphate. Water Science Technology 17(12), 119-125.
Devereux, R., Kane, M. D., Winfrey, J., and Stahl, D. A., 1992. Genus- and group-specific hybridization probes for determinative and environmental studies of sulfate-reducing bacteria. Syst. Appl. Microbiol. 15, 601-609.
Dubois, M., Giles, K. A., Hamilton, J. K., Rebers, P. A., and Smith, F., 1956. Colorimetric method of determination of sugars and related substances. Anal.
Chem. 28, 350-356.
Duncan, A., Vasiliadis, G. E., Bayly, R. C., May, J. W., and Raper, W. G. C., 1988. Genospecies of Acinetobacter isolated from activated sludge showing enhanced removal of phosphate during pilot-scale treatment of sewage. Biotechnology
Letters 10(11), 831-836.
51
Eikelboom, D. H., 2000. Sulfur storing bacteria and bulking of activated sludge. In: Lens, P. N. L., and Hulshoff Pol, L., (Eds.), Environmental Technologies to Treat Sulfur Pollution-Principles and Engineering. IWA Publishing, London, pp. 449-466.
Eshawaran, S. P., 2006. Developing a mechanistic understanding and optimization of the Cannibal process. MS Thesis, Virginia Polytechnic Inst & State Univ., Blacksburg, VA.
Fisher, M. M., and Triplett, E. W., 1999. Automated approach for ribosomal intergenic spacer analysis of microbial diversity and its application to freshwater bacterial communities. Applied and Environmental Microbiology 65, 4630-4636.
Fuhs, G. W., and Chen, M., 1975. Microbiological basis of phosphate removal in the activated sludge process for the treatment of wastewater. Microb Ecol. 2, 119-138.
Fukase, T., Shibata, M., and Miyaji, Y., 1985. The role of an anaerobic stage in biological phosphorus removal. Water Science Technology 17(2-3), 69-80.
Gersberg, R. M., Allen, D. W., 1985. Phosphorus uptake by Klebsiella pneumoniae and Acinetobacter calcoaceticus. Water Science and Technology 17(11/12), 113-118.
Ginige, M. P., Keller, J., and Blackall, L., 2005. Investigation of an acetate-fed denitrifying microbial community by stable isotope probing, full-cycle rRNA analysis, and fluorescent in situ hybridization-microautoradiography applied and environmental microbiology. Applied and Environmental Microbiology 71(12), 8683-8691.
Goel, R. K., and Noguera, D. R., 2005. Enhanced biological phosphorus removal in a Cannibal™-type activated sludge process. 78
th Annual Conference of the Water
Environment Federation, Washington, D.C.
Goel, R. K., and Noguera, D. R., 2006. Evaluation of sludge yield and phosphorus removal in Cannibal™ solids reduction processes. ASCE- J. Env. Eng. 132(10), 1331-1337.
Gong, M. L., Ren, N. Q., and Xing, D. F., 2005. Start-up of bio hydrogen production reactor seeded with sewage sludge and its microbial community analysis. Water
Science & Technology 52(1-2), 115-121.
Glindemann, D., Edwards, M., and Kuschk, P., 2003. Phosphine gas in the upper troposphere. Atmospheric Environment 37, 2429-2433.
Grady, C. P. L. Jr., Daigger, G. T., and Lim, H. C., 1999. Biological Wastewater
Treatment 2nd edition. Marcel Dekker , Inc. New York.
52
Graham, L. E., Graham, J. M., Lauster, G. H., Kent, A. D., Yannarell, A. C., and Armstrong, D. E., 2001. Community dynamics of phytoplankton, protoplankton and bacterioplankton in selected Wisconsin lakes. J. Phycol. 37, 20.
Hallenbeck, P. C., 2005. Fundamentals of fermentative production of hydrogen. Water
Science & Technology 52(1-2), 21-29.
Hartree, E. F., 1972. Determination of protein: a modification of the Lowry method that gives a linear photometric response. Analyt. Biochem. 48, 22-25.
Henze, M., Gujer, W., Mino, T., Matsuo, T., Wentzel, M. C., Marais, G. V. R., and Van Loosdrecht, M. C. M., 1999. Activated sludge model no. 2d, ASM2d. Water
Science and Technology 39(1), 165-182.
Hesselmann, R. P. X., Werlen, C., Hahn, D., Van der Meer, J. R., and Zehnder, A. J. B., 1999. Enrichment, phylogenetic analysis and detection of a bacterium that performs enhanced biological phosphate removal in activated sludge. Syst. Appl.
Microbiol. 22, 454-465.
Hu, J. Y., Ong, S. L., Ng, W. J., Lu, F., and Fan, X. J., 2003. A new method for characterizing denitrifying phosphorus removal bacteria by using three different types of electron acceptors. Water Research 37, 3463-3471.
Kane, M. D., Poulsen, L. K., and Stahl, D. A. 1993. Monitoring the enrichment and isolation of sulfate-reducing bacteria by using oligonucleotide hybridization probes designed from environmentally derived 16 S rRNA sequences. Appl.
Environ. Microbiol. 59, 682-686.
Kent, A. D., and Triplett, E. W., 2002. Microbial communities and their interactions in soil and rhizosphere ecosystem. Annual Review of Microbiology 56, 211-236.
Kepp, U., Machenbach, I., Weisz, N., and Solheim, O. E., 2000. Enhanced stabilization of sewage sludge through thermal hydrolysis – three years experience with full scale plant. Water Science and Technology 42(9), 89-96.
Kong, Y. H., Ong, S. L., Ng, W. J., & Liu, W. T., 2002. Diversity and distribution of a novel group found in anaerobic, aerobic activated sludge processes. Environ
Microbiol. 4, 826-835.
Kong, Y., Nielsen, J. L., and Nielsen, P. H., 2004. Microautoradiography study of Rhodocyclus-related polyphosphate accumulating bacteria in full-scale enhanced biological phosphorous removal plants. Appl. Environ. Microbiol. 70, 5383-5390.
Lee, N. M., and Welander, T., 1996. Use of protozoa and metazoa for decreasing sludge production in aerobic wastewater treatment. Biotechnology Letters 18(4), 429-34.
53
Liu, Y., and Chen, G. H., 1997. Model of energy uncoupling for substrate-sufficient culture. Biotechnology and Bioengineering 55(3), 571-576.
Liu, Y., 1998. Energy uncoupling in microbial growth under substrate-sufficient conditions. Applied Microbiology and Biotechnology 49(5), 500-505.
Liu, Y., Chen, Guang-H., and Etienne, P., 1998. Effect of the S0/X0 ratio on energy uncoupling in substrate-sufficient batch culture of activated sludge. Water
Research 32(10), 2883-2888.
Liu, Y., Chen, G. H., and Paul, E., 1998. Effect of the S0/X0 ratio on energy uncoupling in substrate-sufficient batch culture of activated sludge. Water Research 32(10), 2883-2888.
Liu, Y., and Tay, J. H., 2001. Strategy for minimization of excess sludge production from the activated sludge process. Biotechnology Advances 19, 97-107.
Liu, Y., 2003. Chemically reduced excess sludge production in the activated sludge process. Chemosphere 50(1), 1-7.
Liu, H., Ramnarayanan, R., and Logan, B. E., 2004. Production of electricity during wastewater treatment using a single chamber microbial fuel cell. Environmental
Science & Technology 38, 2281-2285.
Lopez, C., Pons, M. N., and Morgenroth, E., 2006. Endogenous processes during long-term starvation in activated sludge performing enhanced biological phosphorus removal. Water Research 40, 1519-1530.
Low, E. W., and Chase, H. A., 1999. Reducing production of excess biomass during wastewater treatment. Water Research 33(5), 1119-1132.
Martín, H. G., Ivanova, N., Kunin, V., Warnecke, F., Barry, K. W., McHardy, A. C., Yeates, C., He, S., Salamov, A. A., Szeto, E., Dalin, E., Putnam, N. H, Shapiro, H. J., Pangilinan, J. L, Rigoutsos, I., Kyrpides, N. C., Blackall, L. L., McMahon, K. D., and Hugenholtz, P., 2006. Metagenomic analysis of two enhanced biological phosphorus removal (EBPR) sludge communities. Nature
Biotechnology 24, 1263-1269.
Mayhew, M., and Stephenson, T., 1998. Biomass yield reduction: is biochemical manipulation possible without affecting activated sludge process efficiency? Water Science and Technology 38(8-9), 137-144.
Mels, A. R., Zeeman, G., and van Lier, J. B., 2003. Potential of (anaerobic) pre-treatment to reduce the excess sludge production of wastewater treatment plants. Proc. IWA
Leading Edge Conference Series, Noordwijk, May 2003.
54
Metcalf, Leonard, Eddy, Harrison P., and George Tchobanoglous, 2002, 4th Ed. Wastewater Engineering Treatment Disposal Reuse. New York, NY: McGraw-Hill Companies.
Min, B., and Logan, B. E., 2004. Continuous electricity generation from domestic wastewater and organic substrates in a flat plate microbial fuel cell. Environmental Science & Technology 38, 5809-5814.
Mino, T., Van Loosdrecht, M. C. M., and Heijnen, J. J., 1998. Microbiology and biochemistry of the enhanced biological phosphate removal process. Water
Research 32, 3193-3207.
Mobarry, B. K., Wagner, M., Urbain, V., Rittmann, B., and Stahl D., 1996. Phylogenetic probes for analyzing abundance and spatial organization of nitrifying bacteria. Applied and Environmental Microbiology 62(6), 2156-2162.
Muller, J., 2000. Disintegration as a key-step in sewage sludge treatment. Water Science
and Technology 41(8), 123-130.
Neef, A., Witzenberger, R., and Kampfer, P., 1999. Detection of Sphingomonads and in situ identification in activated sludge using 16S rRNA-targeted oligonucleotide probes. J. Ind. Microbiol. Biotechnol. 23, 261-267.
Nielsen, J. L., Juretschko, S., Wagner, M., and Nielsen, P. H., 2002. Abundance and phylogenetic affiliation of iron reducers in activated sludge as assessed by fluorescence in situ hybridization and microautoradiography. Applied and
Environmental Microbiology 68(9), 4629-4636.
Novak, J. T., Chon, D. H., Curtis, B. A., and Doyle, M., 2006. Reduction of Sludge Generation Using the CannibalTM Process: Mechanisms and Performance. WEF
Residuals and Biosolids Management Conference 2006, Cincinnati, OH., March 12-14, 2006.
Ødegaard, H., 1998. Optimized particle separation in the primary step of wastewater treatment. Water Science and Technology 37(10), 43-53.
Ødegaard, H., Paulsrud, B., and Karlsson, I., 2002. Wastewater sludge as a resource – sludge disposal strategies and corresponding treatment technologies aimed at sustainable handling of wastewater sludge. Water Science and Technology 46(10), 295-303.
Ødeggard, H., 2004. Sludge minimization technologies – an overview. Water Science and
Technology 49(10), 31-40.
55
Oehmen, A., Teresa, M., Vivesa, B., Lua, H., Yuana, Z., and Kellera, J., 2005a. The effect of pH on the competition between polyphosphate-accumulating organisms and glycogen-accumulating organisms. Water Research 39(15), 3727-3737.
Oehmen, A., Yuan, Z., Blackall, L. L., Keller, J., 2005b. Comparison of acetate and propionate uptake by polyphosphate accumulating organisms and glycogen accumulating organisms. Biotechnol. Bioeng. 91(2), 162-168.
Park, C., Abu-Orf, M. M., and Novak, J. T., 2006. The digestibility of waste activatedsludges, Water Env. Res. 78, 59-68.
Park, C., Muller, C. D., Abu-Orf, M. M., and Novak, J. T., 2006. The effect of wastewater cations on activated sludge characteristics, effects of aluminum and ironin floc, Water Env. Res. 78, 31-40.
Pitter, P., and Chudoba J., 1990. Biodegradability of organic substances in the aquatic environment. Boca Raton, FL: CRC Press.
Ramakrishna, D. M., and Viraraghavan, T., 2005. Strategies for sludge minimization in activated sludge process – a review. Fresenius Environmental Bulletin 14(1), 2-12.
Randall, C. W., Barnard, J. L., and Stensel, H. David, 1992. Design and retrofit of wastewater treatment plants for biological nutrient removal. Pennsylvania, PA: Technomic Publishing Company, Inc.
Ratsak, C. H, Kooi, B. W., and van Verseveld, H. W., 1994. Biomass reduction and mineralization increase due to ciliate Tetrahymena pyriformis grazing on the bacterium Pseudomonas fluorescens. Water Science and Technology 29(7), 119-28.
Rodrigo, M, A., Seco, A., Penya-Roja, J.M., and Ferrer, J., 1996. Influence of sludge age on enhanced biological phosphorus removal in biological systems. Water Science
and Technology 34(1-2), 41-48.
Russell, J. B., and Cook, G. M., 1995. Energetics of bacterial growth: balance of anabolic and catabolic reactions. Microbiol. Reviews 59, 48-62.
Saby, S., Djafer, M., and Chen, G. H., 2003. Effect of low ORP in anoxic sludge zone on excess sludge production in oxic-settling-anoxic activated sludge process. Water
Research 37, 11-20.
Saito, T., Brdjanovic, D., and van Loosdrecht, M. C. M., 2004. Effect of nitrite on phosphate uptake by phosphate accumulating organisms. Water Research 38, 3760-3768.
56
Shao, Y. T., Wada, F., Abkian V., Crosse, J., Horenstein, B. and Jenkins, D., 1992. Effects of MSRT on enhanced biological phosphorus removal. Water Science and
Technology 26(5-6), 967-976.
Shiota, N., Akashi A., and Hasegawa, S., 2002. A strategy in wastewater treatment process for significant reduction of excess sludge production. Water Science and
Technology 45(12), 127-134.
Streichan, M., Golecki, R., and Schon, G., 1990. Polyphosphate accumulating bacteria from sewage plants with different processes for biological phosphorus removal. FEMS Microbiol. Ecol. 73, 113-124
Stypka, T., Plaza E., Stypka, J., Trela, J., and Hultman, B., 2001 and 2002 Regional planning and recovery as tools for sustainable sludge management. Water Science
and Technology 46(4-5), 389-396.
Tandoi, V., Majone, M., May, J. and Ramadori, R., 1998. The behavior of polyphosphate accumulating Acinetobacter isolates in an anaerobic-aerobic chemostat. Water
Research 32, 2903-2912.
Thiem, A., Nickel, K., Zellhorn, M., and Neis, U., 2001. Ultrasonic waste activated sludge disintegration for improving anaerobic stabilization. Water Research 35, 2003-2009.
Ubukata, Y., 1998. Kinetics and fundamental mechanisms of protein removal by activated sludge: hydrolysis of peptone to amino acids is the rate-determining step. Water Science & Technology 38(8-9), 121-128.
USEPA report on Biosolids Generation, Use, Disposal in the United States. September 1999. EPA 530-R-99-09.
Van Loosdrecht, M. C. M., and Henze, M., 1999. Maintenance, endogeneous respiration, lysis, decay and predation. Water Science and Technology 39(1), 107-117.
Wei, Y., Van Houten, R. T., Borger, A. R., Eikelboom, D. H., and Fan, Y., 2003. Minimization of excess sludge production for biological wastewater treatment. Water Research 37, 4453-4467.
Westgarth, W. C., 1963. Anaerobiosis in the activated-sludge process. Ph.D. Dissertation, University of North Carolina at Chapel Hill, NC.
Wong, M. T., Tan, F. M., Ng, W. J., Liu, W. T., 2004. Identification and occurrence of tetrad-forming Alphaproteobacteria in anaerobic–aerobic activated sludge processes. Microbiol.-SGM. 150, 3741-3748.
57
Yannarell, A. C., and Triplett, E. W., 2004. Within- and between lake variability in the composition of bacterioplankton communities: investigations using multiple spatial Scales. Appl. Environ. Microbiol. 70(1), 214-223.
Yannarell, A. C., and Triplett, E. W., 2005. Geographic and environmental sources of variation in lake bacterial community composition. Appl. Environ. Microbiol. 71, 227-239.
Yilmaz, L. S., and Noguera, D. R., 2004. Mechanistic approach to the problem of hybridization efficiency in fluorescent in situ hybridization. Applied and
Environmental Microbiology 70(12), 7126-7139.
Yilmaz, L. S., Okten, H. E., and Noguera, D. R., 2006. Making all parts of the 16S rRNA of Escherichia coli accessible in situ to single DNA oligonucleotides. Applied
and Environmental Microbiology 72(1), 733-744.
Yong, M., Peng, Y-zhen., Wang, X-Lian., and Wang, S-Ying., 2005. Nutrient removal performance of an anaerobic-anoxic-aerobic process as a function of influent C/P ratio. Journal of Chemical Technology & Biotechnology 80(10), 1118-1124
Zeng, R. J., Lemaire, R., Yuan, Z. G., and Keller, J., 2003a. Simultaneous nitrification, denitrification, and phosphorus removal in a lab-scale sequencing batch reactor. Biotechnol. Bioeng. 84(2), 170-178.
Zeng, R. J., Yuan, Z., and Keller, J., 2003b. Model-based analysis of anaerobic acetate uptake by a mixed culture of polyphosphate-accumulating and glycogen-accumulating organisms. Biotechnology and Bioengineering 83(3), 293-302.
Zilles, J. L., Peccia, J., and Noguera, D. R., 2002. Microbiology of enhanced biological phosphorus removal in aerated-anoxic orbal processes. Water Environment
Research 74(5), 428-436.