Embed Size (px)
Citation preview

LIBERTY UNIVERSITY & AOPA AIR SAFETY INSTITUTEFatal Flight Training Accidents 2000-2015
Fatal Flight Training ACCIDENT REPORT 2000–2015
LIBERTY UNIVERSITY & AOPA AIR SAFETY INSTITUTEFatal Flight Training Accidents 2000-2015
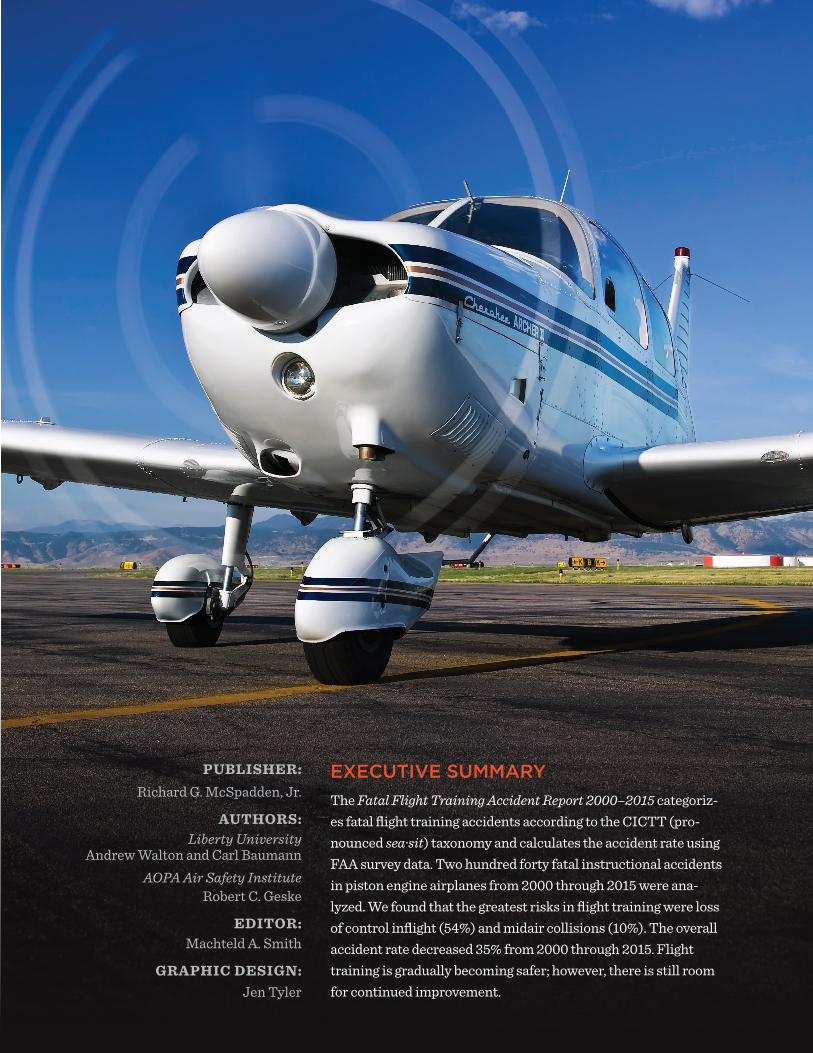
PUBLISHER: Richard G. McSpadden, Jr.
AUTHORS: Liberty University
Andrew Walton and Carl Baumann AOPA Air Safety Institute
Robert C. Geske
EDITOR: Machteld A. Smith
GRAPHIC DESIGN: Jen Tyler
EXECUTIVE SUMMARYThe Fatal Flight Training Accident Report 2000–2015 categoriz-es fatal flight training accidents according to the CICTT (pro-nounced sea∙sit) taxonomy and calculates the accident rate using FAA survey data. Two hundred forty fatal instructional accidents in piston engine airplanes from 2000 through 2015 were ana-lyzed. We found that the greatest risks in flight training were loss of control inflight (54%) and midair collisions (10%). The overall accident rate decreased 35% from 2000 through 2015. Flight training is gradually becoming safer; however, there is still room for continued improvement.
LIBERTY UNIVERSITY & AOPA AIR SAFETY INSTITUTEFatal Flight Training Accidents 2000-2015
METHODOLOGYThe National Transportation Safety Board’s (NTSB) accident database was reviewed and analyzed for relevant accidents that occurred from January 1, 2000 through December 31, 2015. Specifically, the initial search criteria included fatal instructional accidents in N-registered airplanes with one or two reciprocating engines. The data excludes foreign accidents and accidents in airplanes that were amateur built, light sport, twin engine with more than six seats, or single engine with more than 500 horsepower. The remaining aircraft represent the majority of fixed-wing training fleets in the U.S.
Each accident was assigned a primary cause using the CAST/ICAO† Common Taxonomy Team (CICTT) guidance.1 Two researchers independently reviewed NTSB reports to determine the primary cause of each accident (LOC-I, MAC, CFIT, etc.). 2
The data were then compared to the FAA’s annual General Aviation and Part 135 Activity Survey in order to calculate accident rates.3 Since 2011 data was not available for accident rate analysis, the FAA’s estimate for 2011 was used per the recommended substitution guidelines listed on the FAA’s website.
INTRODUCTIONIn 2014, the AOPA Air Safety Institute (ASI) published a comprehensive ten-year study on accidents during flight training, providing valuable information about safety risks during instructional flying. A new study, conducted in partnership with researchers from Liberty University, provides a detailed analysis of fatal accidents over a longer, 16-year dataset (2000–2015, inclusive). The purpose of this study is to determine:
• The primary risks involved in flight training
• The primary cause of each relevant accident
• The accident rate for flight training in the United States
LIBERTY UNIVERSITY & AOPA AIR SAFETY INSTITUTEFatal Flight Training Accidents 2000-2015
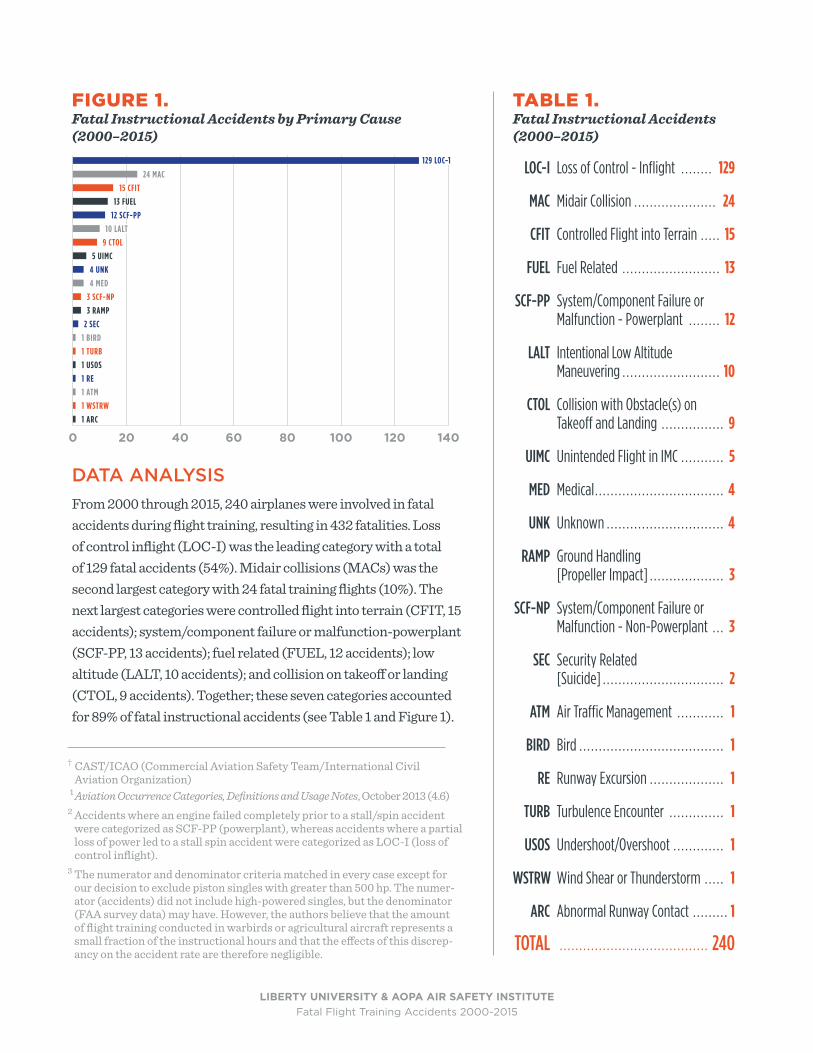
DATA ANALYSISFrom 2000 through 2015, 240 airplanes were involved in fatal accidents during flight training, resulting in 432 fatalities. Loss of control inflight (LOC-I) was the leading category with a total of 129 fatal accidents (54%). Midair collisions (MACs) was the second largest category with 24 fatal training flights (10%). The next largest categories were controlled flight into terrain (CFIT, 15 accidents); system/component failure or malfunction-powerplant (SCF-PP, 13 accidents); fuel related (FUEL, 12 accidents); low altitude (LALT, 10 accidents); and collision on takeoff or landing (CTOL, 9 accidents). Together; these seven categories accounted for 89% of fatal instructional accidents (see Table 1 and Figure 1).
† CAST/ICAO (Commercial Aviation Safety Team/International Civil Aviation Organization)
1 Aviation Occurrence Categories, Definitions and Usage Notes, October 2013 (4.6)2 Accidents where an engine failed completely prior to a stall/spin accident
were categorized as SCF-PP (powerplant), whereas accidents where a partial loss of power led to a stall spin accident were categorized as LOC-I (loss of control inflight).
3 The numerator and denominator criteria matched in every case except for our decision to exclude piston singles with greater than 500 hp. The numer-ator (accidents) did not include high-powered singles, but the denominator (FAA survey data) may have. However, the authors believe that the amount of flight training conducted in warbirds or agricultural aircraft represents a small fraction of the instructional hours and that the effects of this discrep-ancy on the accident rate are therefore negligible.
LOC-I Loss of Control - Inflight . . . . . . . . 129
MAC Midair Collision . . . . . . . . . . . . . . . . . . . . . 24
CFIT Controlled Flight into Terrain . . . . . 15
FUEL Fuel Related . . . . . . . . . . . . . . . . . . . . . . . . . 13
SCF-PP System/Component Failure or Malfunction - Powerplant . . . . . . . . 12
LALT Intentional Low Altitude Maneuvering . . . . . . . . . . . . . . . . . . . . . . . . . 10
CTOL Collision with Obstacle(s) on Takeoff and Landing . . . . . . . . . . . . . . . . 9
UIMC Unintended Flight in IMC . . . . . . . . . . . 5
MED Medical . . . . . . . . . . . . . . . . . . . . . . . . . . . . . . . . . 4
UNK Unknown . . . . . . . . . . . . . . . . . . . . . . . . . . . . . . 4
RAMP Ground Handling [Propeller Impact] . . . . . . . . . . . . . . . . . . . 3
SCF-NP System/Component Failure or Malfunction - Non-Powerplant . . . 3
SEC Security Related [Suicide] . . . . . . . . . . . . . . . . . . . . . . . . . . . . . . . 2
ATM Air Traffic Management . . . . . . . . . . . . 1
BIRD Bird . . . . . . . . . . . . . . . . . . . . . . . . . . . . . . . . . . . . . 1
RE Runway Excursion . . . . . . . . . . . . . . . . . . . 1
TURB Turbulence Encounter . . . . . . . . . . . . . . 1
USOS Undershoot/Overshoot . . . . . . . . . . . . . 1
WSTRW Wind Shear or Thunderstorm . . . . . 1
ARC Abnormal Runway Contact . . . . . . . . . 1
TOTAL . . . . . . . . . . . . . . . . . . . . . . . . . . . . . . . . . . . . . . 240
TABLE 1. Fatal Instructional Accidents (2000–2015)
FIGURE 1. Fatal Instructional Accidents by Primary Cause (2000–2015)
129 LOC-1
24 MAC
15 CFIT
13 FUEL
5 UIMC
3 RAMP
12 SCF-PP
4 UNK
2 SEC
1 BIRD
1 TURB
1 USOS
1 RE
1 ATM
1 WSTRW
1 ARC
4 MED
10 LALT
9 CTOL
3 SCF-NP
Fatal Flight Training Accidents 2000-2015LIBERTY UNIVERSITY & AOPA AIR SAFETY INSTITUTE
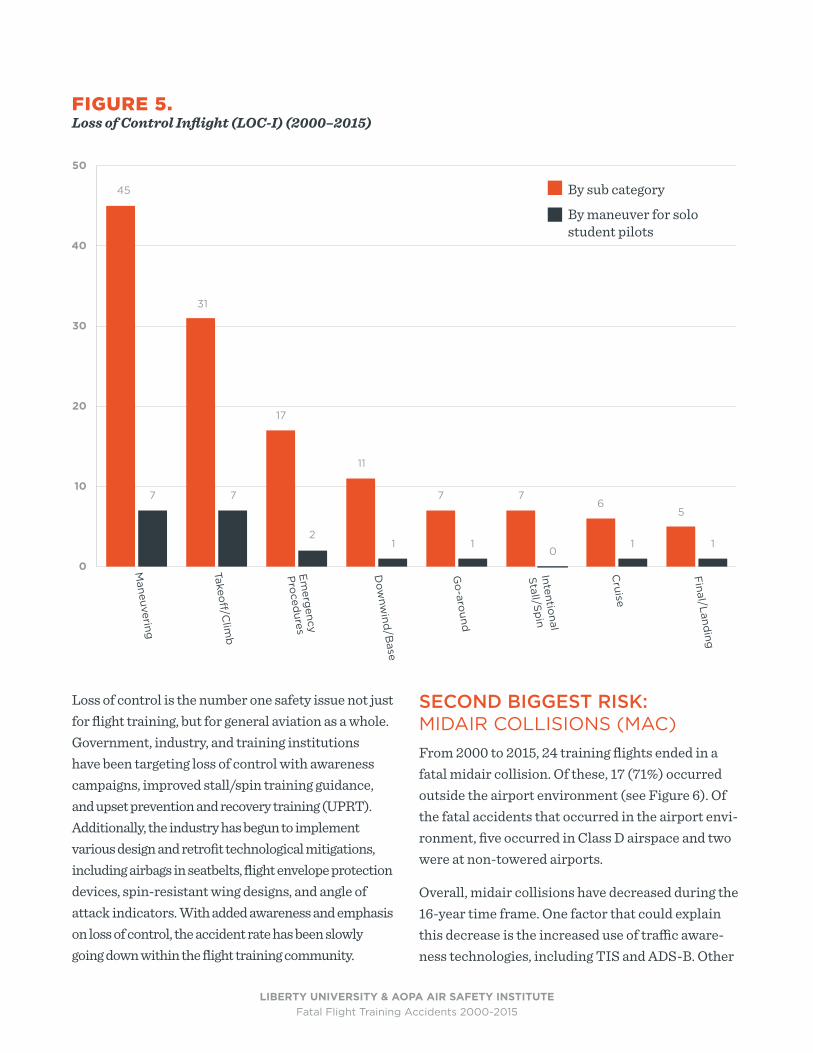
pattern (takeoff/climb, downwind/base, go-around, and final/landing) combined for 54 accidents (42%), making this the most common area for a fatal loss of control accident to occur. The FAA has placed strong emphasis on raising awareness about the “base-to-final” stall, and 11 accidents (9%) fit in the downwind/base phase of flight. However, 38 accidents (29%) occurred during takeoff/climb and go-around, suggesting opportunity for increased emphasis on these high-power, high angle of attack phases of flight.
Maneuvering flight included both high and low altitude maneuvers, many of which resulted in stall/spin scenarios. The third subcategory of loss of control accidents was emergency procedures. Many of these were simulated engine failures at low altitude in single and multi-engine aircraft. Intentional stall/spin maneuvers contributed to only a small percentage (5%) of the loss of control accidents.
For solo student pilots, the maneuvers where loss of control occurred have a similar distribution, although the sample size is smaller (see Figure 5).
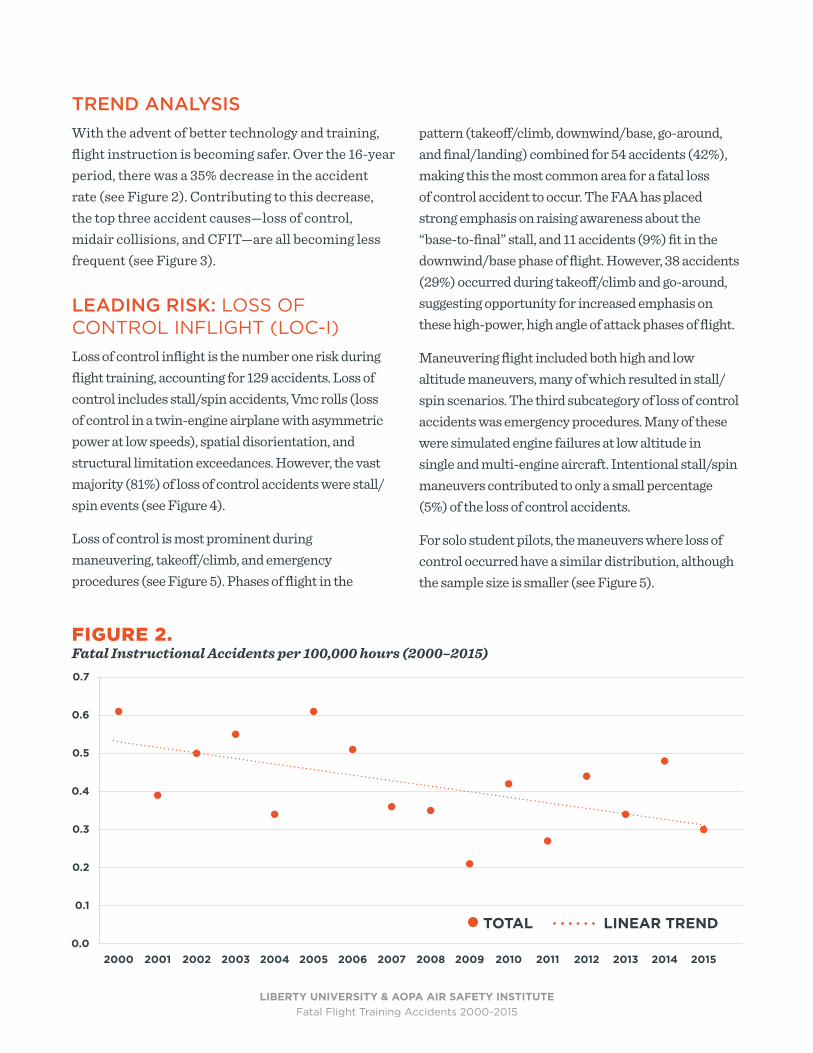
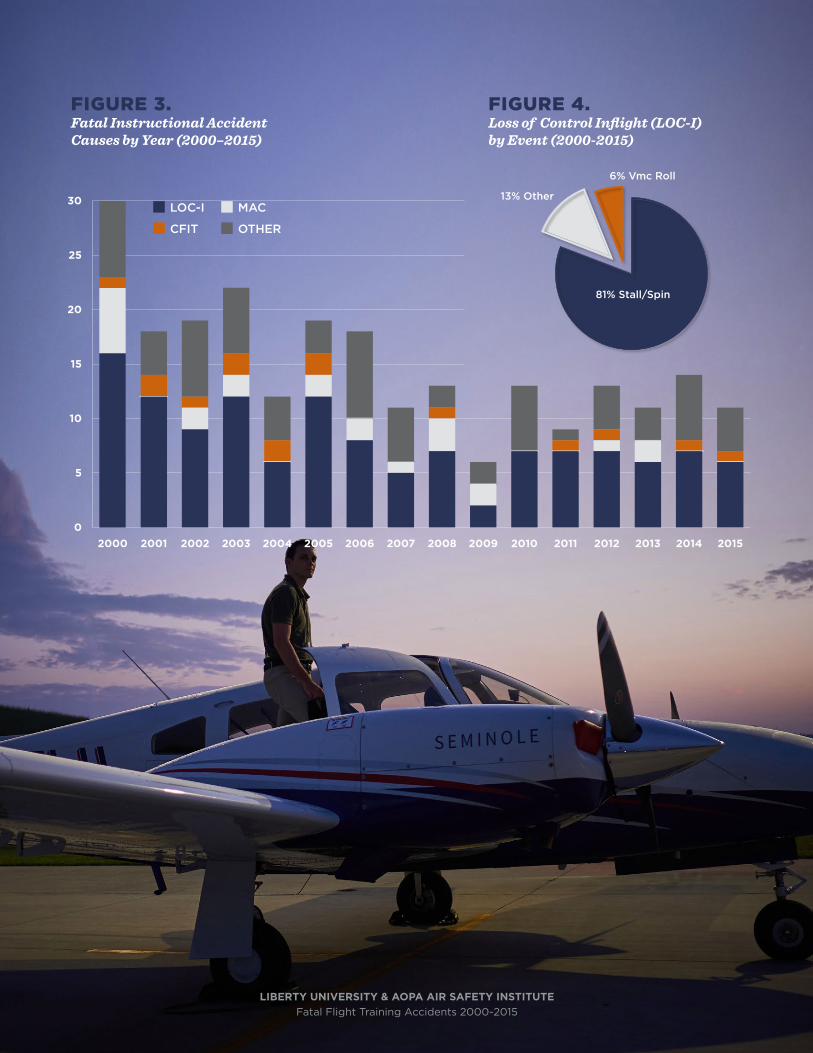
TREND ANALYSISWith the advent of better technology and training, flight instruction is becoming safer. Over the 16-year period, there was a 35% decrease in the accident rate (see Figure 2). Contributing to this decrease, the top three accident causes—loss of control, midair collisions, and CFIT—are all becoming less frequent (see Figure 3).
LEADING RISK: LOSS OF CONTROL INFLIGHT (LOC-I)Loss of control inflight is the number one risk during flight training, accounting for 129 accidents. Loss of control includes stall/spin accidents, Vmc rolls (loss of control in a twin-engine airplane with asymmetric power at low speeds), spatial disorientation, and structural limitation exceedances. However, the vast majority (81%) of loss of control accidents were stall/spin events (see Figure 4).
Loss of control is most prominent during maneuvering, takeoff/climb, and emergency procedures (see Figure 5). Phases of flight in the
FIGURE 2. Fatal Instructional Accidents per 100,000 hours (2000–2015)
LINEAR TRENDTOTAL
LIBERTY UNIVERSITY & AOPA AIR SAFETY INSTITUTEFatal Flight Training Accidents 2000-2015
FIGURE 3. Fatal Instructional Accident Causes by Year (2000–2015)
LIBERTY UNIVERSITY & AOPA AIR SAFETY INSTITUTEFatal Flight Training Accidents 2000-2015
LOC-I MAC
CFIT OTHER
FIGURE 4. Loss of Control Inflight (LOC-I) by Event (2000-2015)
6% Vmc Roll
13% Other
81% Stall/Spin
Fatal Flight Training Accidents 2000-2015LIBERTY UNIVERSITY & AOPA AIR SAFETY INSTITUTE
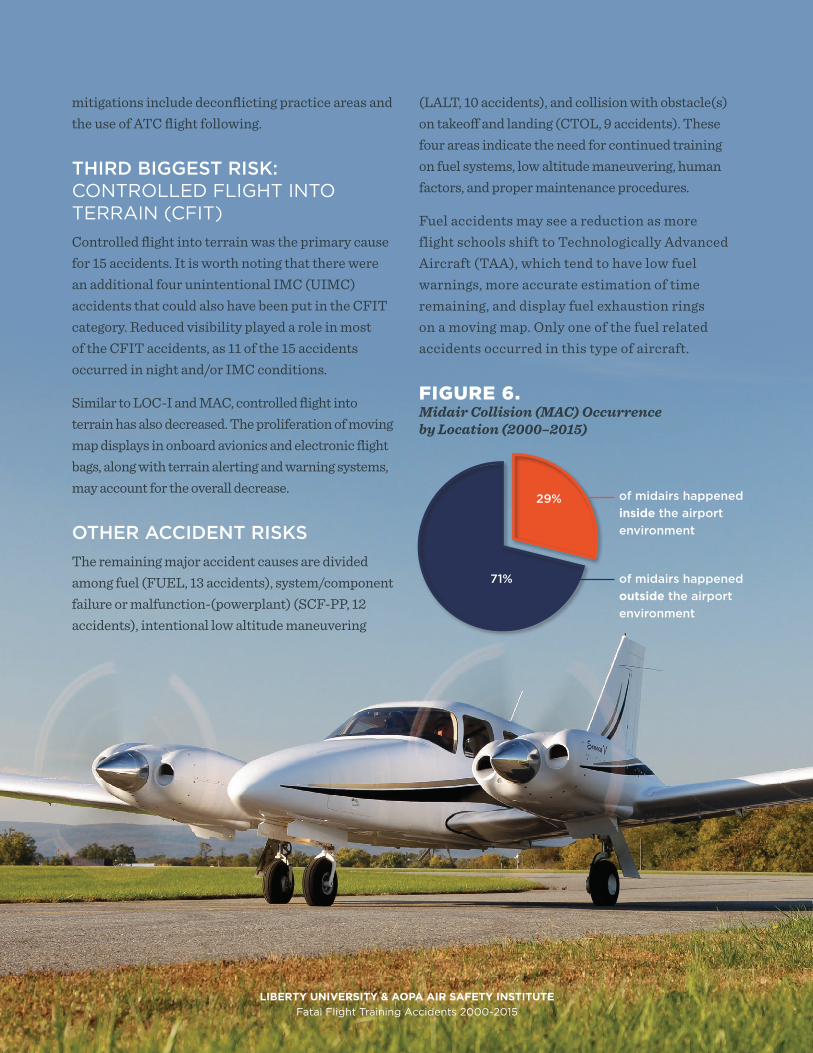
SECOND BIGGEST RISK: MIDAIR COLLISIONS (MAC)From 2000 to 2015, 24 training flights ended in a fatal midair collision. Of these, 17 (71%) occurred outside the airport environment (see Figure 6). Of the fatal accidents that occurred in the airport envi-ronment, five occurred in Class D airspace and two were at non-towered airports.
Overall, midair collisions have decreased during the 16-year time frame. One factor that could explain this decrease is the increased use of traffic aware-ness technologies, including TIS and ADS-B. Other
Loss of control is the number one safety issue not just for flight training, but for general aviation as a whole. Government, industry, and training institutions have been targeting loss of control with awareness campaigns, improved stall/spin training guidance, and upset prevention and recovery training (UPRT). Additionally, the industry has begun to implement various design and retrofit technological mitigations, including airbags in seatbelts, flight envelope protection devices, spin-resistant wing designs, and angle of attack indicators. With added awareness and emphasis on loss of control, the accident rate has been slowly going down within the flight training community.
FIGURE 5. Loss of Control Inflight (LOC-I) (2000–2015)
Maneuvering
Takeoff
/Clim
b
Em
ergency
Pro
cedures
Dow
nwind
/Base
Go
-around
Intentional
Stall/S
pin
Cruise
Final/Land
ing
45
7 7 7 76
5
21 1
01 1
31
17
11
By sub category
By maneuver for solo student pilots
LIBERTY UNIVERSITY & AOPA AIR SAFETY INSTITUTEFatal Flight Training Accidents 2000-2015
mitigations include deconflicting practice areas and the use of ATC flight following.
THIRD BIGGEST RISK: CONTROLLED FLIGHT INTO TERRAIN (CFIT)Controlled flight into terrain was the primary cause for 15 accidents. It is worth noting that there were an additional four unintentional IMC (UIMC) accidents that could also have been put in the CFIT category. Reduced visibility played a role in most of the CFIT accidents, as 11 of the 15 accidents occurred in night and/or IMC conditions.
Similar to LOC-I and MAC, controlled flight into terrain has also decreased. The proliferation of moving map displays in onboard avionics and electronic flight bags, along with terrain alerting and warning systems, may account for the overall decrease.
OTHER ACCIDENT RISKSThe remaining major accident causes are divided among fuel (FUEL, 13 accidents), system/component failure or malfunction-(powerplant) (SCF-PP, 12 accidents), intentional low altitude maneuvering
FIGURE 6. Midair Collision (MAC) Occurrence by Location (2000–2015)
(LALT, 10 accidents), and collision with obstacle(s) on takeoff and landing (CTOL, 9 accidents). These four areas indicate the need for continued training on fuel systems, low altitude maneuvering, human factors, and proper maintenance procedures.
Fuel accidents may see a reduction as more flight schools shift to Technologically Advanced Aircraft (TAA), which tend to have low fuel warnings, more accurate estimation of time remaining, and display fuel exhaustion rings on a moving map. Only one of the fuel related accidents occurred in this type of aircraft.
LIBERTY UNIVERSITY & AOPA AIR SAFETY INSTITUTEFatal Flight Training Accidents 2000-2015
71%
29%
of midairs happened outside the airport environment
of midairs happened inside the airport environment
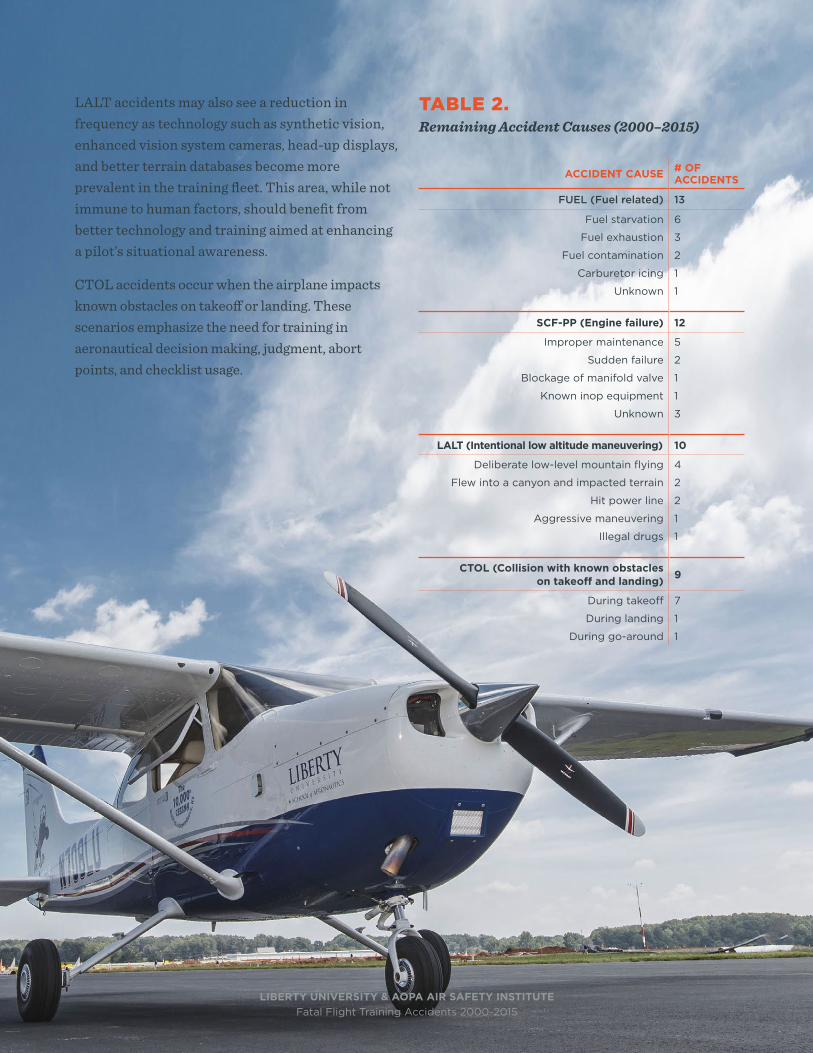
LALT accidents may also see a reduction in frequency as technology such as synthetic vision, enhanced vision system cameras, head-up displays, and better terrain databases become more prevalent in the training fleet. This area, while not immune to human factors, should benefit from better technology and training aimed at enhancing a pilot’s situational awareness.
CTOL accidents occur when the airplane impacts known obstacles on takeoff or landing. These scenarios emphasize the need for training in aeronautical decision making, judgment, abort points, and checklist usage.
ACCIDENT CAUSE # OF ACCIDENTS
FUEL (Fuel related) 13
Fuel starvation 6
Fuel exhaustion 3
Fuel contamination 2
Carburetor icing 1
Unknown 1
SCF-PP (Engine failure) 12
Improper maintenance 5
Sudden failure 2
Blockage of manifold valve 1
Known inop equipment 1
Unknown 3
LALT (Intentional low altitude maneuvering) 10
Deliberate low-level mountain flying 4
Flew into a canyon and impacted terrain 2
Hit power line 2
Aggressive maneuvering 1
Illegal drugs 1
CTOL (Collision with known obstacles on takeoff and landing) 9
During takeoff 7
During landing 1
During go-around 1
TABLE 2. Remaining Accident Causes (2000–2015)
LIBERTY UNIVERSITY & AOPA AIR SAFETY INSTITUTEFatal Flight Training Accidents 2000-2015
LIBERTY UNIVERSITY & AOPA AIR SAFETY INSTITUTEFatal Flight Training Accidents 2000-2015
LIBERTY UNIVERSITY & AOPA AIR SAFETY INSTITUTEFatal Flight Training Accidents 2000-2015
APPENDIX
KEY TERMSINSTRUCTIONAL FLYING Instructional flying includes training flights, either solo or with an instructor onboard.4
CICTT TAXONOMY The CAST/ICAO Common Taxonomy Team (CICTT) publishes detailed guidelines for the classification of all aircraft accidents. It provides an international standard by which researchers can classify accident occurrences within a dataset. Here is a brief description of the main occurrence categories in the context of instructional flying:
LOSS OF CONTROL INFLIGHT (LOC-I) The pilot loses control of the airplane.
MIDAIR COLLISION (MAC) Two or more aircraft collide inflight.5
CONTROLLED FLIGHT INTO TERRAIN (CFIT) The aircraft collides with terrain while still under control.
SYSTEM/COMPONENT FAILURE OR MALFUNCTION-(POWERPLANT) (SCF-PP) Engine failure results in an accident.
FUEL RELATED (FUEL) Fuel starvation, fuel contamination, or fuel mismanagement results in an accident.
LOW ALTITUDE MANEUVERING (LALT) The aircraft impacts terrain or wires as a direct result of intentional low altitude operations.
COLLISION WITH OBSTACLE(S) ON TAKEOFF OR LANDING (CTOL) The aircraft collides with known obstacles on takeoff, landing, or go-around.
CONCLUSION
Loss of control inflight and midair collisions pose the two greatest risks in flight training.
Although the accident rate is showing gradual improvement, the training industry must
continue to focus time, energy, and resources on improving safety with targeted risk
mitigations. Since the majority of aviation accidents are pilot related, the aviation community
can benefit from recurrent and continuous training. Technology alone is not the answer. The
use of new and emergent technology may have helped decrease the number of accidents in
certain categories, but the pilot and the decisions he or she makes ultimately determines the
outcome. By learning from the mistakes of those who have gone before us, we can continue
to improve safety in the future.
4 For the purposes of this study, we only included accidents that the NTSB categorized as instructional.5 When counting airplanes involved in a midair collision, we included each training flight that had at least one onboard fatality.

1971 University Blvd., Lynchburg, VA 24515 LIBERTY.EDU/AERONAUTICS
421 Aviation Way, Frederick, MD 21701 AIRSAFETYINSTITUTE.ORG
COPYRIGHT ©2019 AOPA AIR SAFETY INSTITUTE