Embed Size (px)
Citation preview
Faster simulations using the SLURM cluster at CERNAnd how we have used SLURM to study in-situ cavity bake-out.
Supervisors: Alick Macpherson & Nicholas Shipman
Technical: Jeremy Bastard
Software: Marcel Coly
Ali A. Hamdoun, Aarhus university 1
OutlinePart I – In-situ bake-out
• Benefits of an in situ bake-out
• Temperature Restrictions/system Protection
• Proposed and elected setup
Part II – Simulations and SLURM (Simple Linux Utility for Resource Management)• Initial Simulations/necessity for SLURM
• What is SLURM? Which applications can run on SLURM?
• Setting up SLURM
• Final simulation results and SLURM performance comparison
Part III – In situ bake-out validation test
• Temperature and flow distribution
• Test setup
2
Part I: Cavity In-Situ cryostat bake-out in Cryostat
3
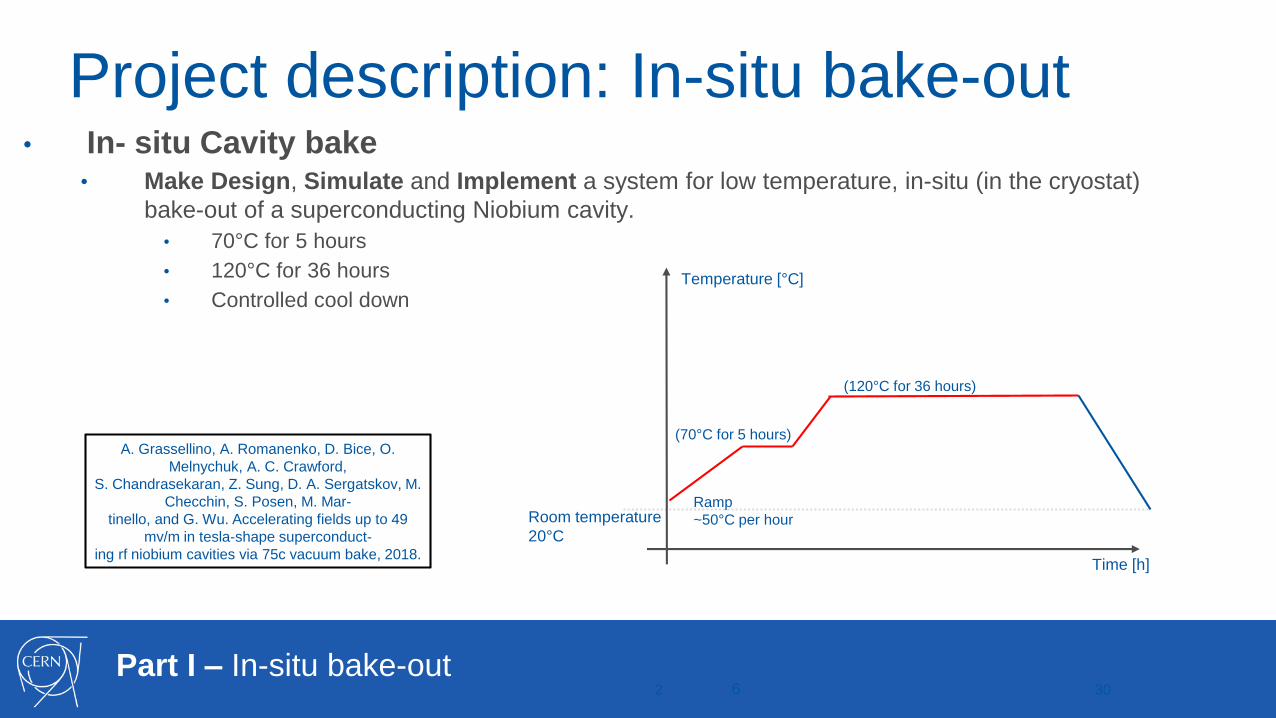
Project description: In-situ bake-out• In- situ Cavity bake
• Make Design, Simulate and Implement a system for low temperature, in-situ (in the cryostat)
bake-out of a superconducting Niobium cavity.
• 70°C for 5 hours
• 120°C for 36 hours
• Controlled cool down
6 302
(120°C for 36 hours)
Temperature [°C]
Time [h]
Ramp
~50°C per hour
(70°C for 5 hours)
Room temperature
20°C
Part I – In-situ bake-out
A. Grassellino, A. Romanenko, D. Bice, O.
Melnychuk, A. C. Crawford,
S. Chandrasekaran, Z. Sung, D. A. Sergatskov, M.
Checchin, S. Posen, M. Mar-
tinello, and G. Wu. Accelerating fields up to 49
mv/m in tesla-shape superconduct-
ing rf niobium cavities via 75c vacuum bake, 2018.
Benefits of an in-situ bake-out:
• Objectives of a low temperature bake-out?• Modification of surface layers to get rid of non superconducting niobium oxides.
• Reduction of Moisture content inside the cavity.
• Why do an in situ bake-out?• Enables direct before/after testing => systematic study of heat treatment benefits
• To be used to optimise cavity preparation sequence.
• Does not break the cavity vacuum line connection => minimise pollution risks.
• Increased cleanliness and control.
• Reduced set up time and increased testing throughput
5Part I – In-situ bake-out
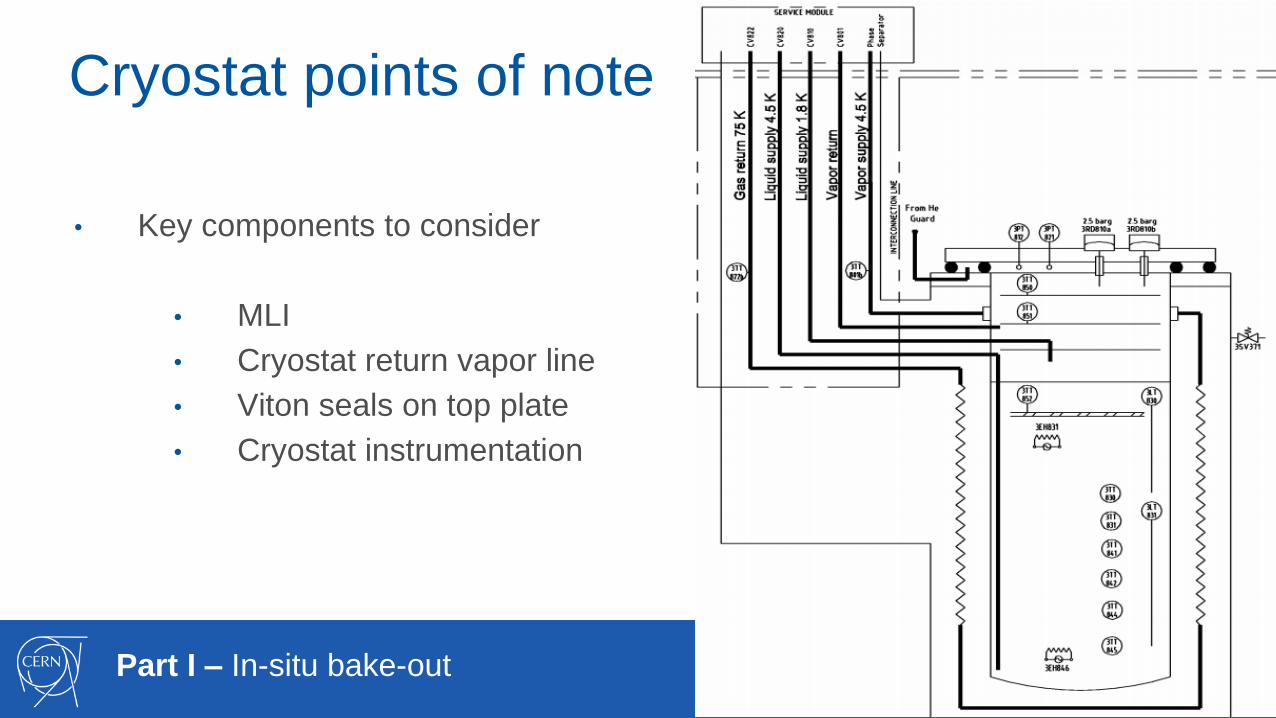
Cryostat points of note
• Key components to consider
• MLI
• Cryostat return vapor line
• Viton seals on top plate
• Cryostat instrumentation
6Part I – In-situ bake-out
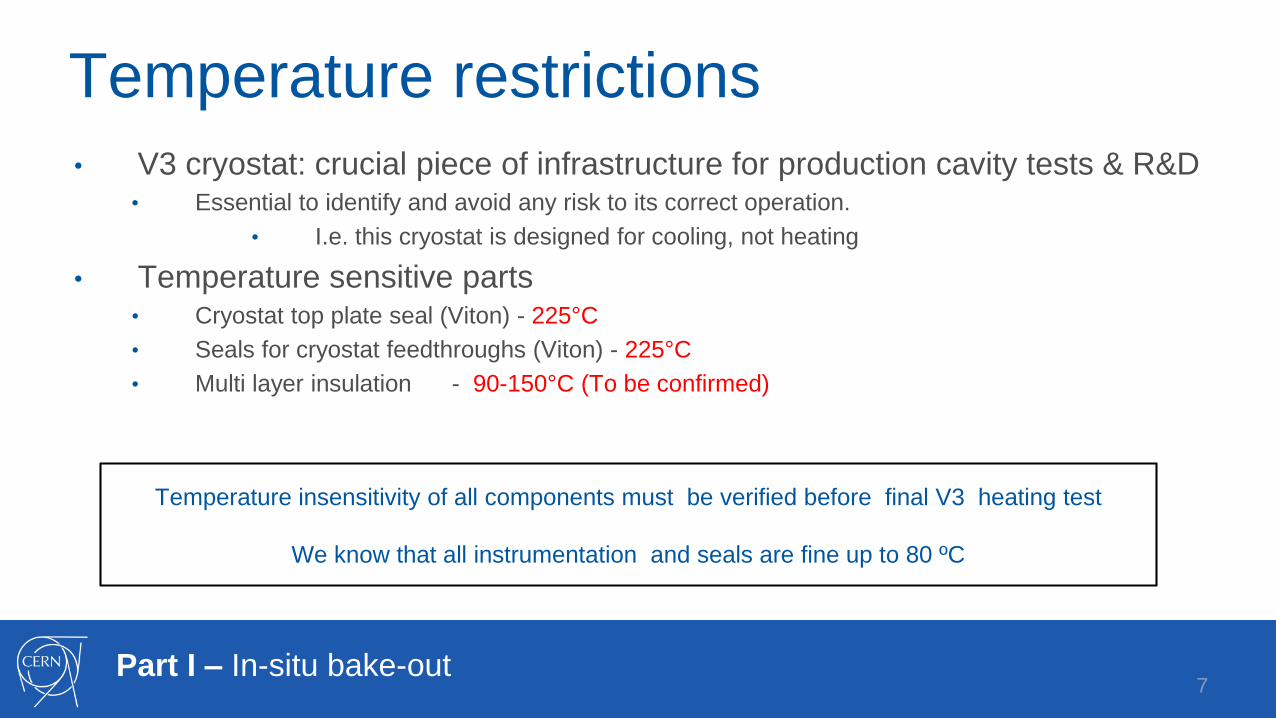
Temperature restrictions
• V3 cryostat: crucial piece of infrastructure for production cavity tests & R&D• Essential to identify and avoid any risk to its correct operation.
• I.e. this cryostat is designed for cooling, not heating
• Temperature sensitive parts• Cryostat top plate seal (Viton) - 225°C
• Seals for cryostat feedthroughs (Viton) - 225°C
• Multi layer insulation - 90-150°C (To be confirmed)
7Part I – In-situ bake-out
Temperature insensitivity of all components must be verified before final V3 heating test
We know that all instrumentation and seals are fine up to 80 ºC
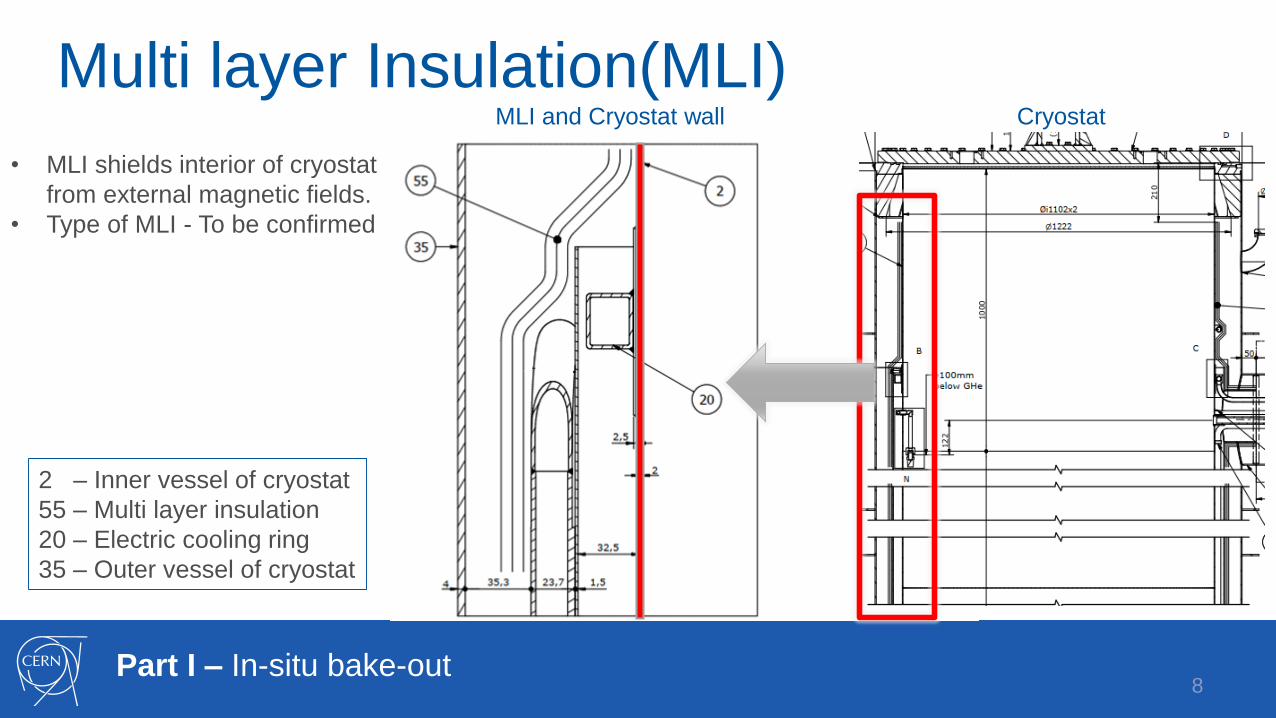
2 – Inner vessel of cryostat
55 – Multi layer insulation
20 – Electric cooling ring
35 – Outer vessel of cryostat
8Part I – In-situ bake-out
• MLI shields interior of cryostat
from external magnetic fields.
• Type of MLI - To be confirmed
CryostatMLI and Cryostat wall
Multi layer Insulation(MLI)
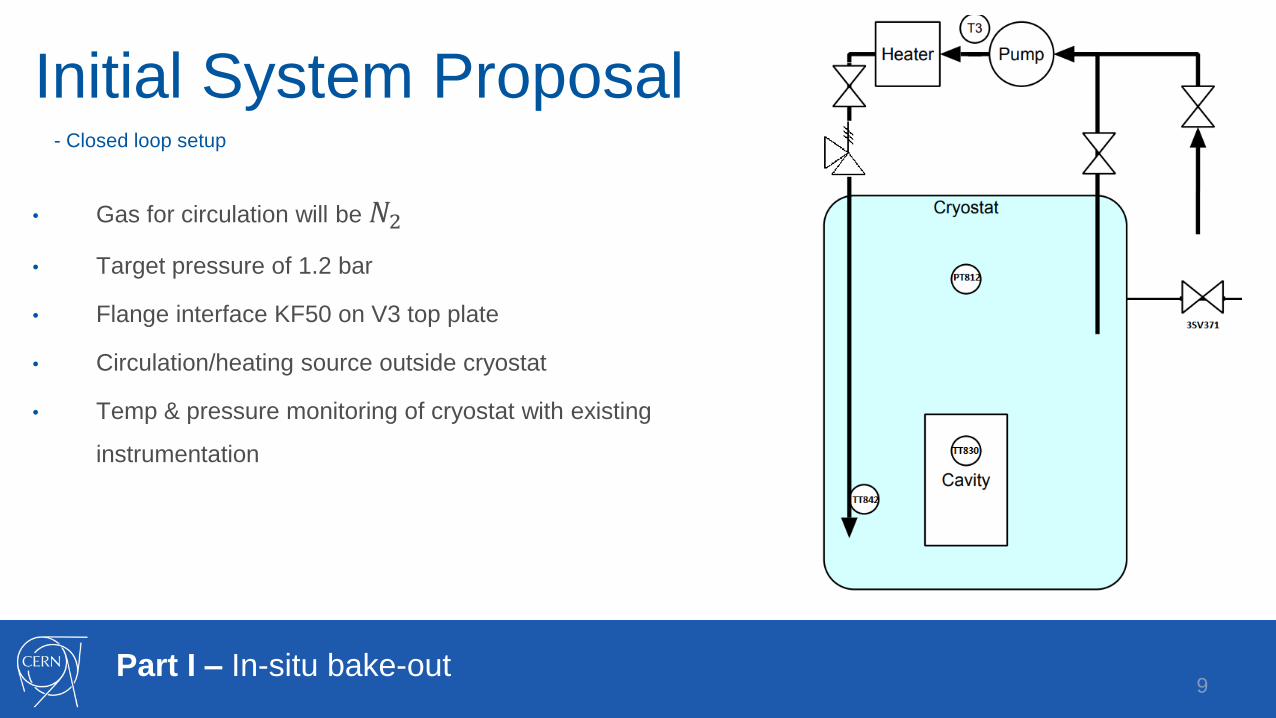
Initial System Proposal- Closed loop setup
• Gas for circulation will be 𝑁2
• Target pressure of 1.2 bar
• Flange interface KF50 on V3 top plate
• Circulation/heating source outside cryostat
• Temp & pressure monitoring of cryostat with existing
instrumentation
9Part I – In-situ bake-out
Part I In-situ bake-out
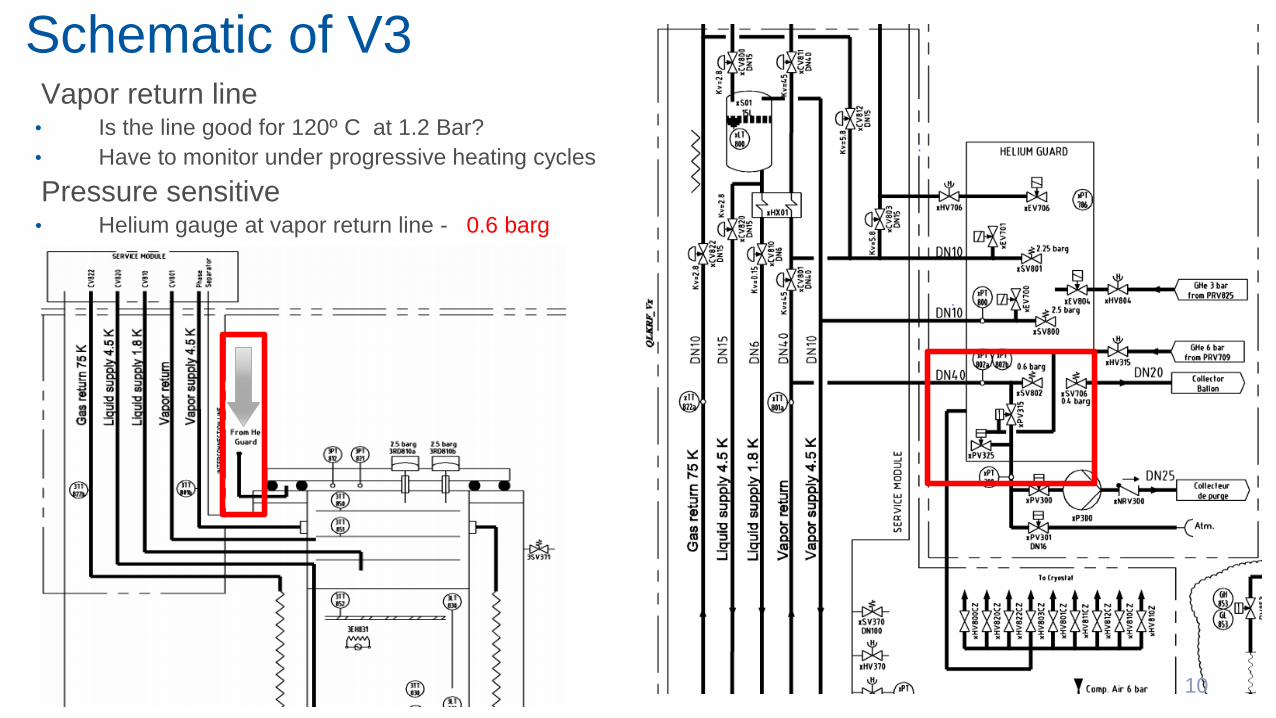
Schematic of V3Vapor return line
• Is the line good for 120º C at 1.2 Bar?
• Have to monitor under progressive heating cycles
Pressure sensitive• Helium gauge at vapor return line - 0.6 barg
10
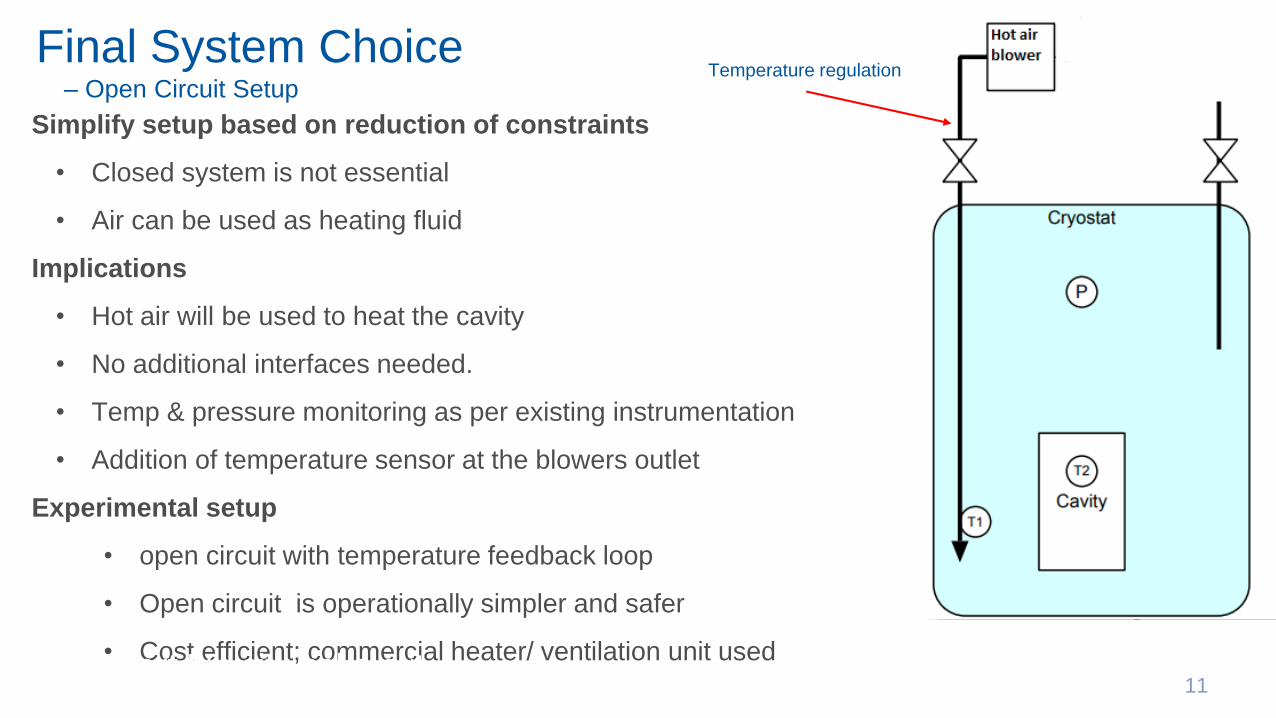
Final System Choice– Open Circuit Setup
11
Simplify setup based on reduction of constraints
• Closed system is not essential
• Air can be used as heating fluid
Implications
• Hot air will be used to heat the cavity
• No additional interfaces needed.
• Temp & pressure monitoring as per existing instrumentation
• Addition of temperature sensor at the blowers outlet
Experimental setup
• open circuit with temperature feedback loop
• Open circuit is operationally simpler and safer
• Cost efficient; commercial heater/ ventilation unit used
Temperature regulation
Part I In-situ bake-out
Part II: Simulations and SLURM
12
Simulations and Slurm
• High performance computing
• What is Slurm?
• Which applications are available for the Slurm at CERN
• Setting up your simulation via Slurm
• How to extract you simulation and data from the cluster
• Slurm performance test
• Slurm In collaboration with Fluent
13Part II – Simulations and SLURM
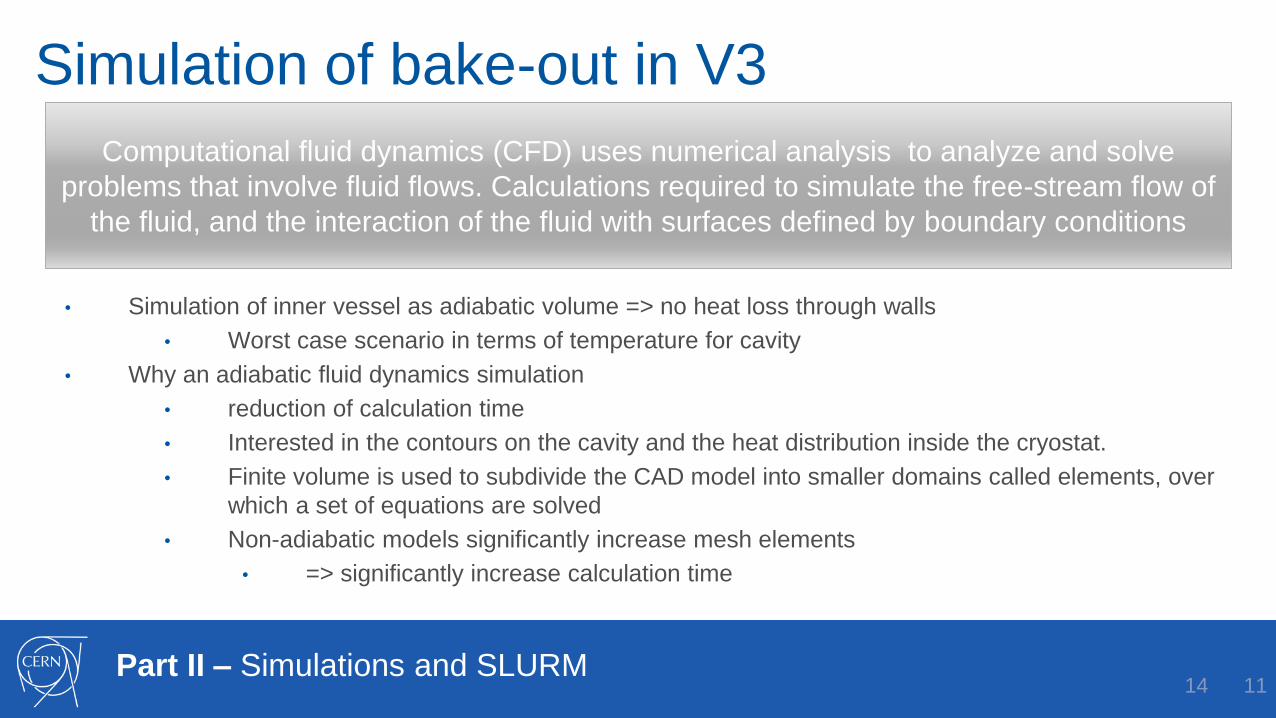
Computational fluid dynamics (CFD) uses numerical analysis to analyze and solve
problems that involve fluid flows. Calculations required to simulate the free-stream flow of
the fluid, and the interaction of the fluid with surfaces defined by boundary conditions
Simulation of bake-out in V3
• Simulation of inner vessel as adiabatic volume => no heat loss through walls
• Worst case scenario in terms of temperature for cavity
• Why an adiabatic fluid dynamics simulation
• reduction of calculation time
• Interested in the contours on the cavity and the heat distribution inside the cryostat.
• Finite volume is used to subdivide the CAD model into smaller domains called elements, over
which a set of equations are solved
• Non-adiabatic models significantly increase mesh elements
• => significantly increase calculation time
14 11Part II – Simulations and SLURM
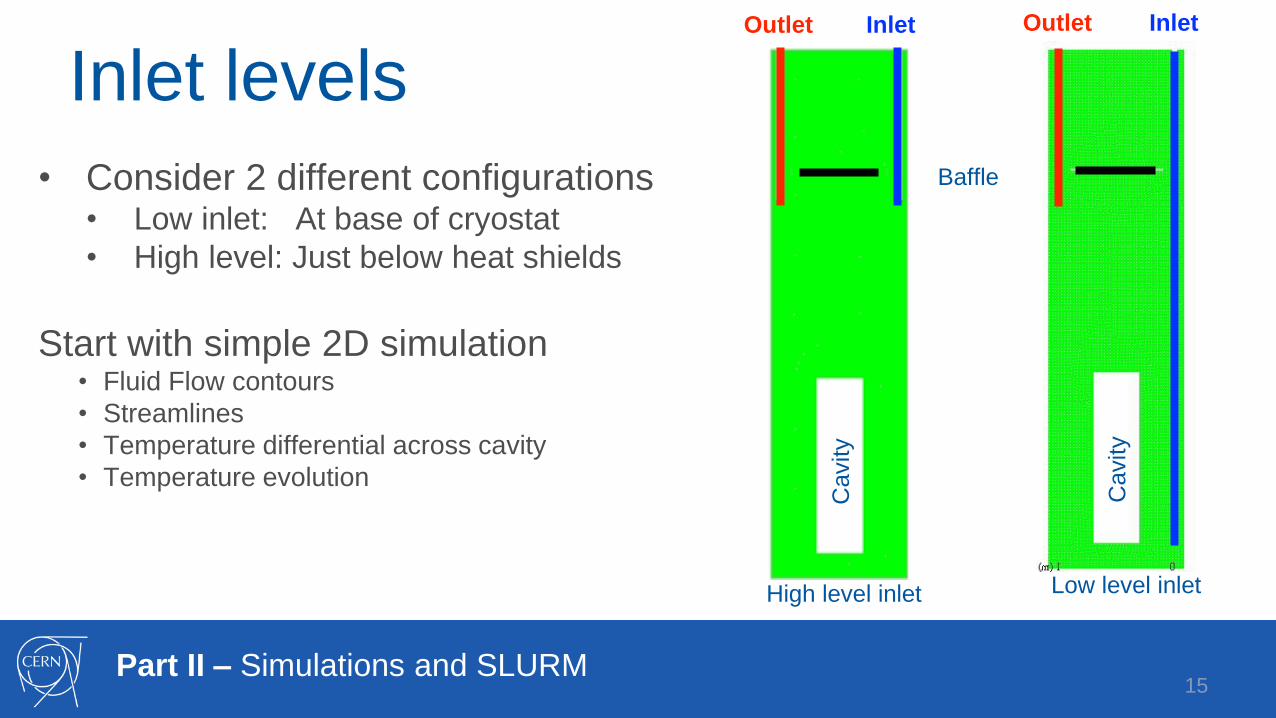
Inlet levels
• Consider 2 different configurations• Low inlet: At base of cryostat
• High level: Just below heat shields
Start with simple 2D simulation• Fluid Flow contours
• Streamlines
• Temperature differential across cavity
• Temperature evolution
15
Baffle
Part II – Simulations and SLURM
Outlet
Cavity
Inlet
Cavity
Outlet Inlet
High level inlet Low level inlet
Part I In-situ bake-out
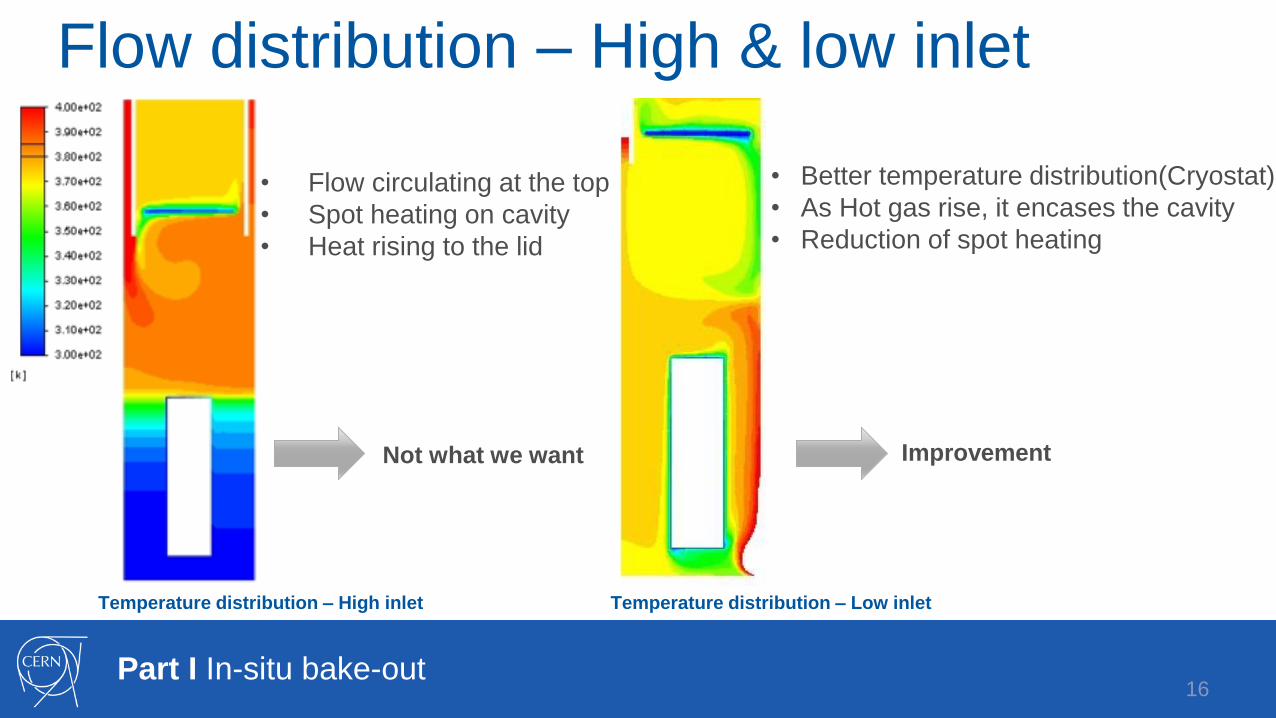
Flow distribution – High & low inlet
• Flow circulating at the top
• Spot heating on cavity
• Heat rising to the lid
16
Temperature distribution – High inlet
Not what we want
Temperature distribution – Low inlet
• Better temperature distribution(Cryostat)
• As Hot gas rise, it encases the cavity
• Reduction of spot heating
Improvement
Part I In-situ bake-out
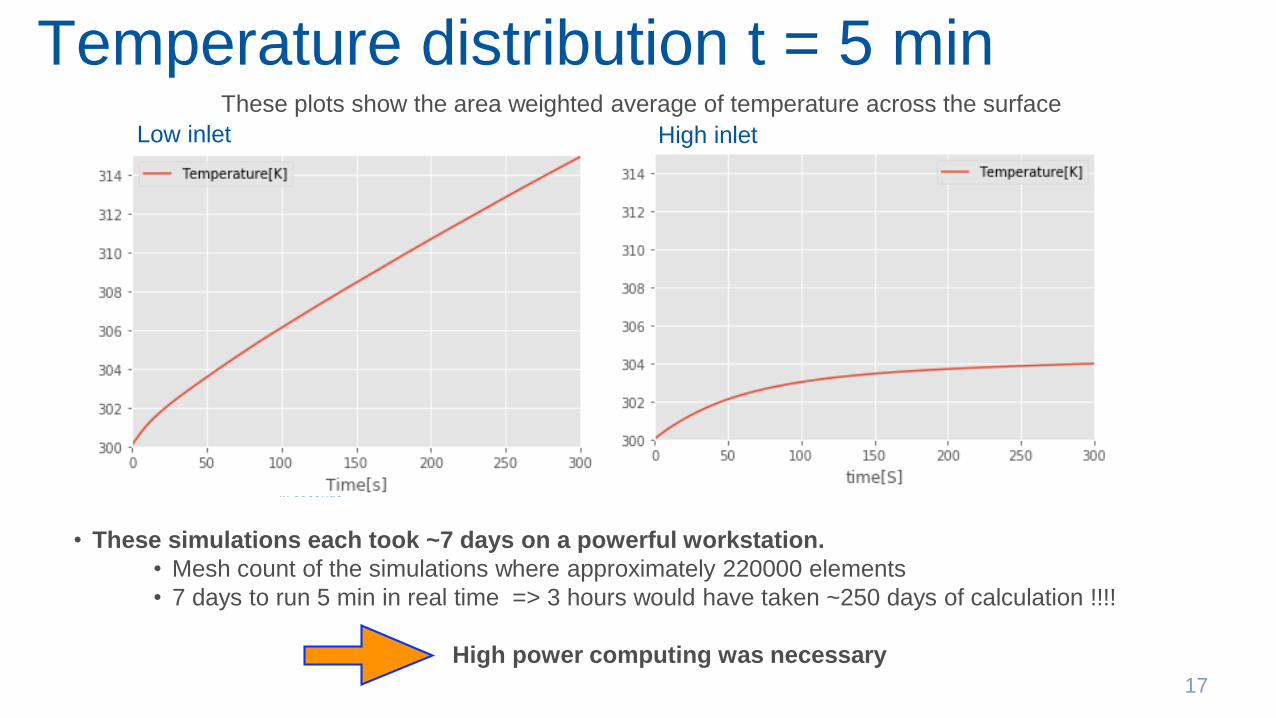
Temperature distribution t = 5 min
in seconds
In kelvin
Low inlet High inlet
17
• These simulations each took ~7 days on a powerful workstation.
• Mesh count of the simulations where approximately 220000 elements
• 7 days to run 5 min in real time => 3 hours would have taken ~250 days of calculation !!!!
High power computing was necessary
These plots show the area weighted average of temperature across the surface
Moving to high performance Computing: Available resources
High Performance Computing: SLURM: Simple Linux Utility for Resource Management)
• Applications and use cases that do not fit the standard batch High Throughput Computing (HTC)
model. − E.g. parallel MPI applications requiring 32-2000 cores for a single job
From the SLURM Web site:
• CERN Linux Cluster: open to all CERN users
• 65 000 physical nodes - A Cluster in a collection of multiple nodes which communicates with each
other to perform a set of operations at high availability rates. Each node is single entity machine or
server .
• Extensible via plug-ins
• https://cern.service-now.com/service-portal/article.do?n=KB0004192
18Part II – Simulations and SLURM
Any system or device connected to a
network is also called a node. For
example, if a network connects a file
server, five computers, and two
printers, there are eight nodes on the
network
Which applications are supported on the linux cluster
Available Applications
Recommended to run the supported engineering applications in
• ANSYS Classic/Mechanical: HTCondor
• ANSYS CFX: HTCondor or SLURM, depending on the use
case
• ANSYS Fluent: SLURM
• COMSOL: HTCondor
• CST: HTCondor for most solvers, SLURM for wakefield solver.
• LS-DYNA: SLURM
19
The Linux Clusters:
HTCondor: single node execution with big memory machines
SLURM: multi node execution and fast interconnects
Part II – Simulations and SLURM
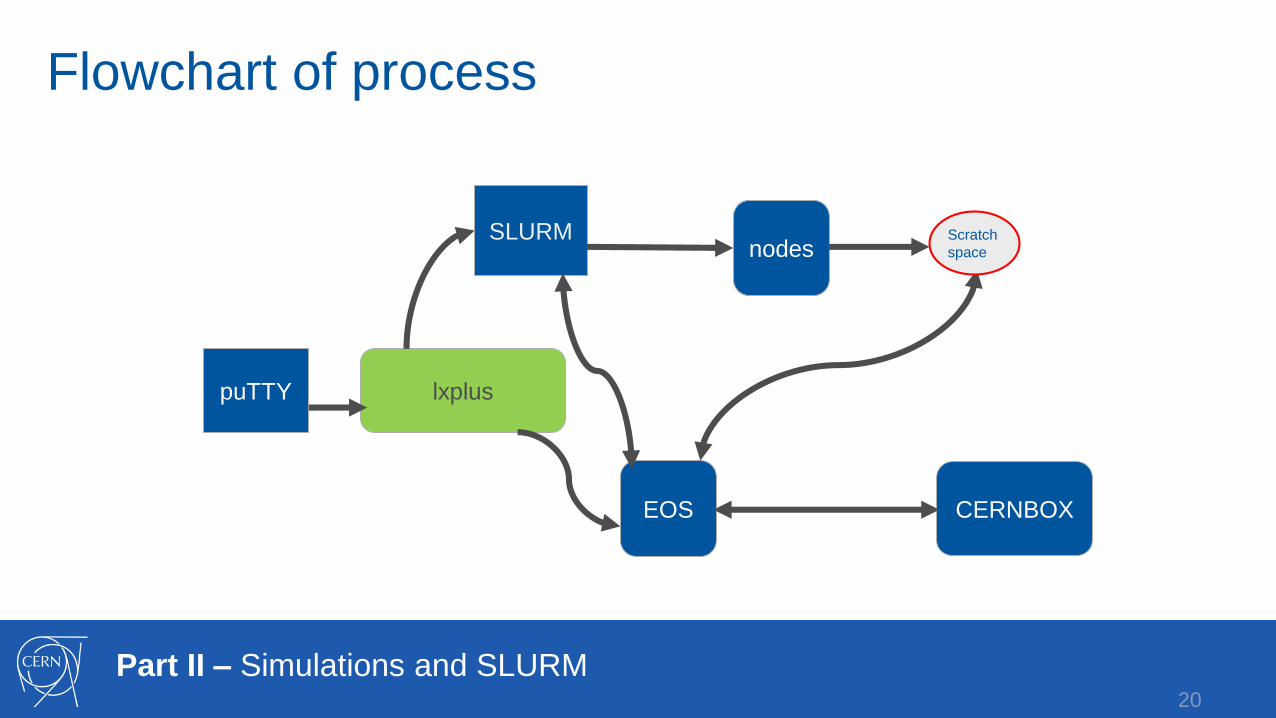
Flowchart of process
20
puTTY lxplus
SLURM
EOS CERNBOX
nodes
Part II – Simulations and SLURM
Scratch
space
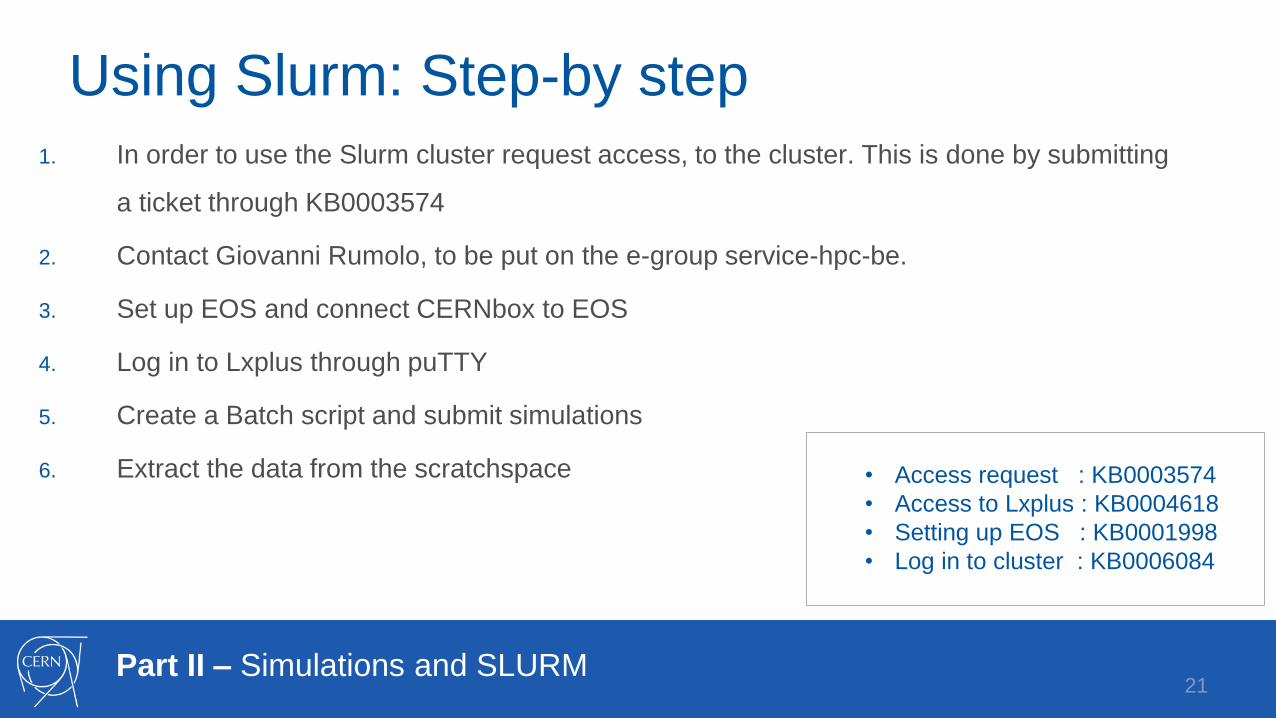
Using Slurm: Step-by step 1. In order to use the Slurm cluster request access, to the cluster. This is done by submitting
a ticket through KB0003574
2. Contact Giovanni Rumolo, to be put on the e-group service-hpc-be.
3. Set up EOS and connect CERNbox to EOS
4. Log in to Lxplus through puTTY
5. Create a Batch script and submit simulations
6. Extract the data from the scratchspace
21
• Access request : KB0003574
• Access to Lxplus : KB0004618
• Setting up EOS : KB0001998
• Log in to cluster : KB0006084
Part II – Simulations and SLURM
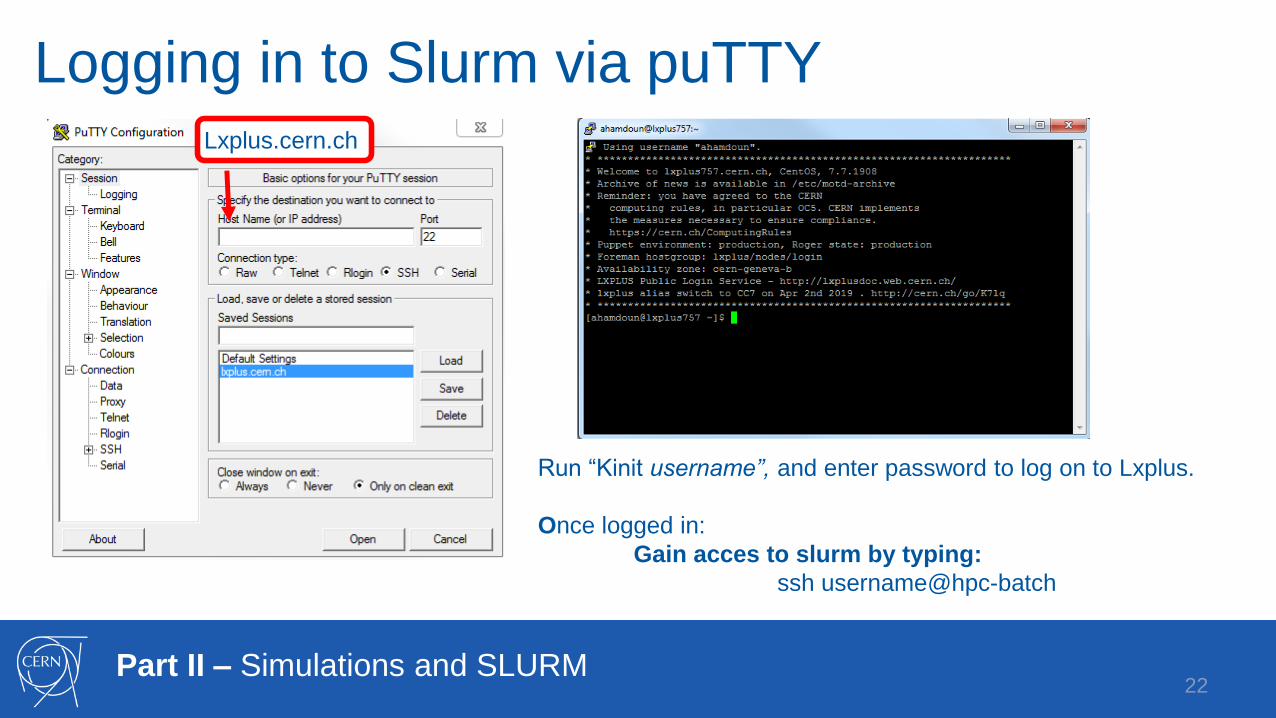
Logging in to Slurm via puTTY
22
Run “Kinit username”, and enter password to log on to Lxplus.
Once logged in:
Gain acces to slurm by typing:
ssh username@hpc-batch
Part II – Simulations and SLURM
Lxplus.cern.ch
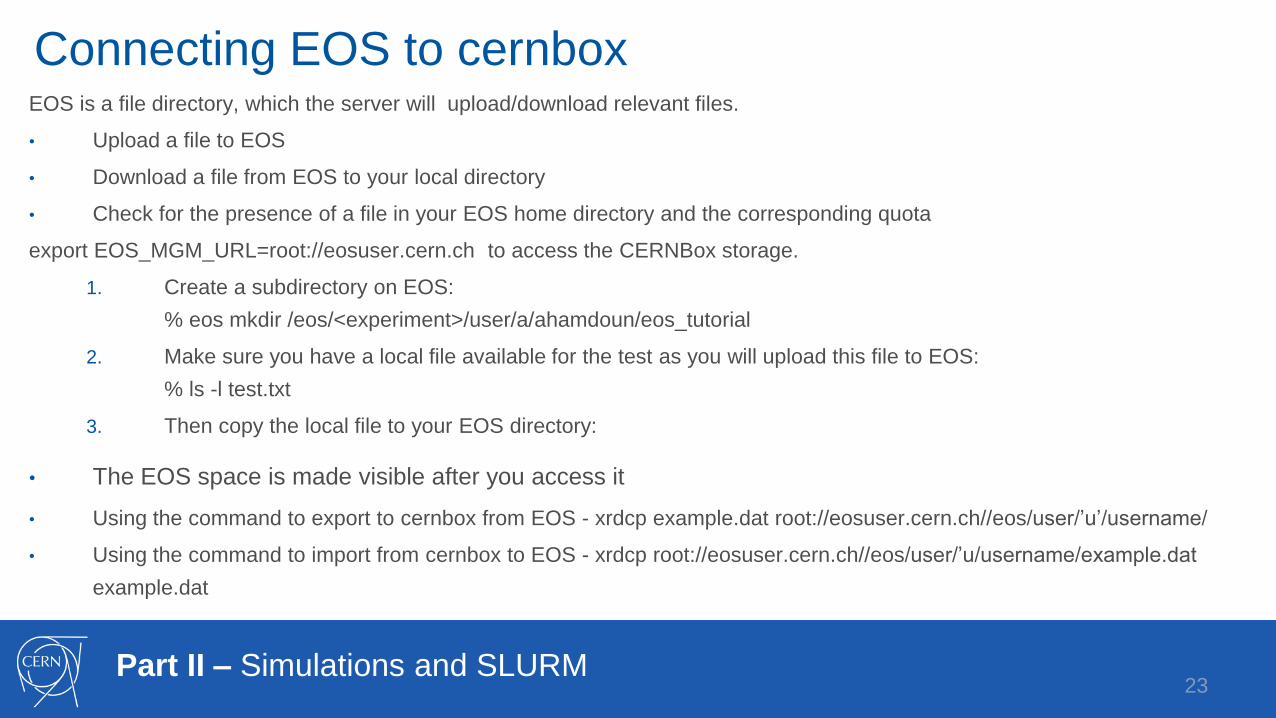
Connecting EOS to cernboxEOS is a file directory, which the server will upload/download relevant files.
• Upload a file to EOS
• Download a file from EOS to your local directory
• Check for the presence of a file in your EOS home directory and the corresponding quota
export EOS_MGM_URL=root://eosuser.cern.ch to access the CERNBox storage.
1. Create a subdirectory on EOS:
% eos mkdir /eos/<experiment>/user/a/ahamdoun/eos_tutorial
2. Make sure you have a local file available for the test as you will upload this file to EOS:
% ls -l test.txt
3. Then copy the local file to your EOS directory:
• The EOS space is made visible after you access it
• Using the command to export to cernbox from EOS - xrdcp example.dat root://eosuser.cern.ch//eos/user/’u’/username/
• Using the command to import from cernbox to EOS - xrdcp root://eosuser.cern.ch//eos/user/’u/username/example.dat
example.dat
23Part II – Simulations and SLURM
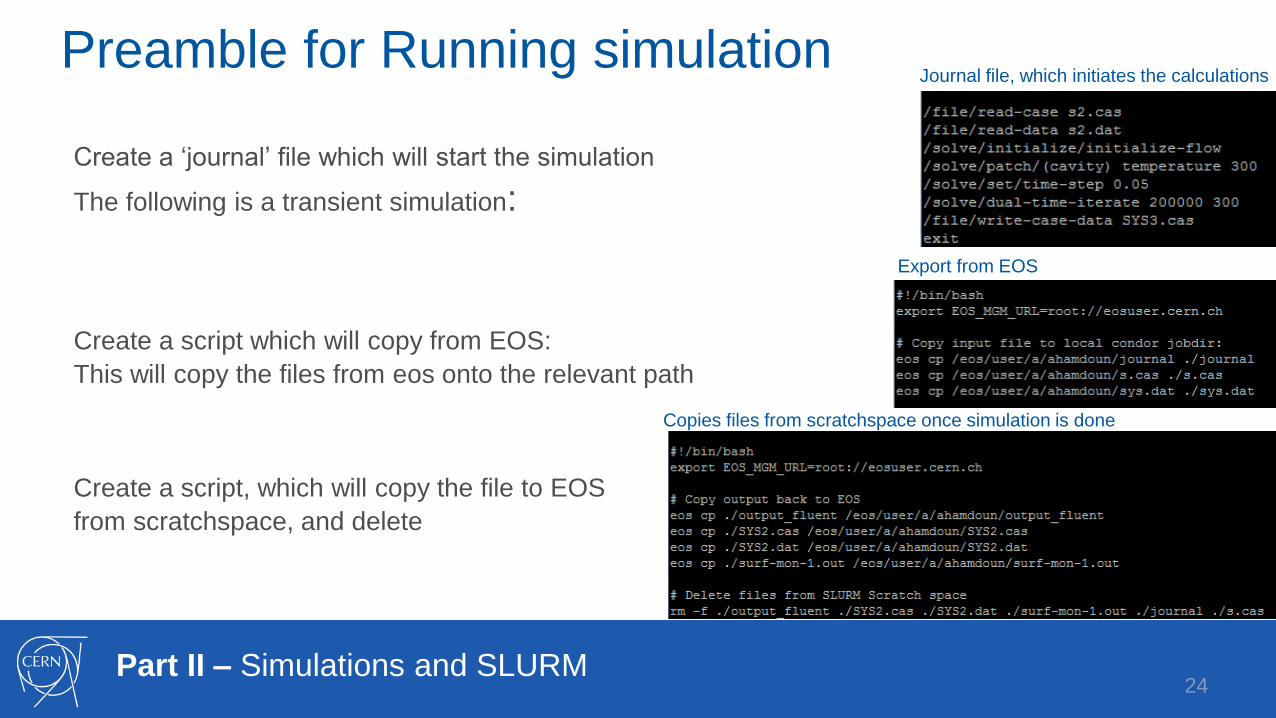
Preamble for Running simulation
Create a ‘journal’ file which will start the simulation
The following is a transient simulation:
Create a script which will copy from EOS:
This will copy the files from eos onto the relevant path
Create a script, which will copy the file to EOS
from scratchspace, and delete
24Part II – Simulations and SLURM
Journal file, which initiates the calculations
Export from EOS
Copies files from scratchspace once simulation is done
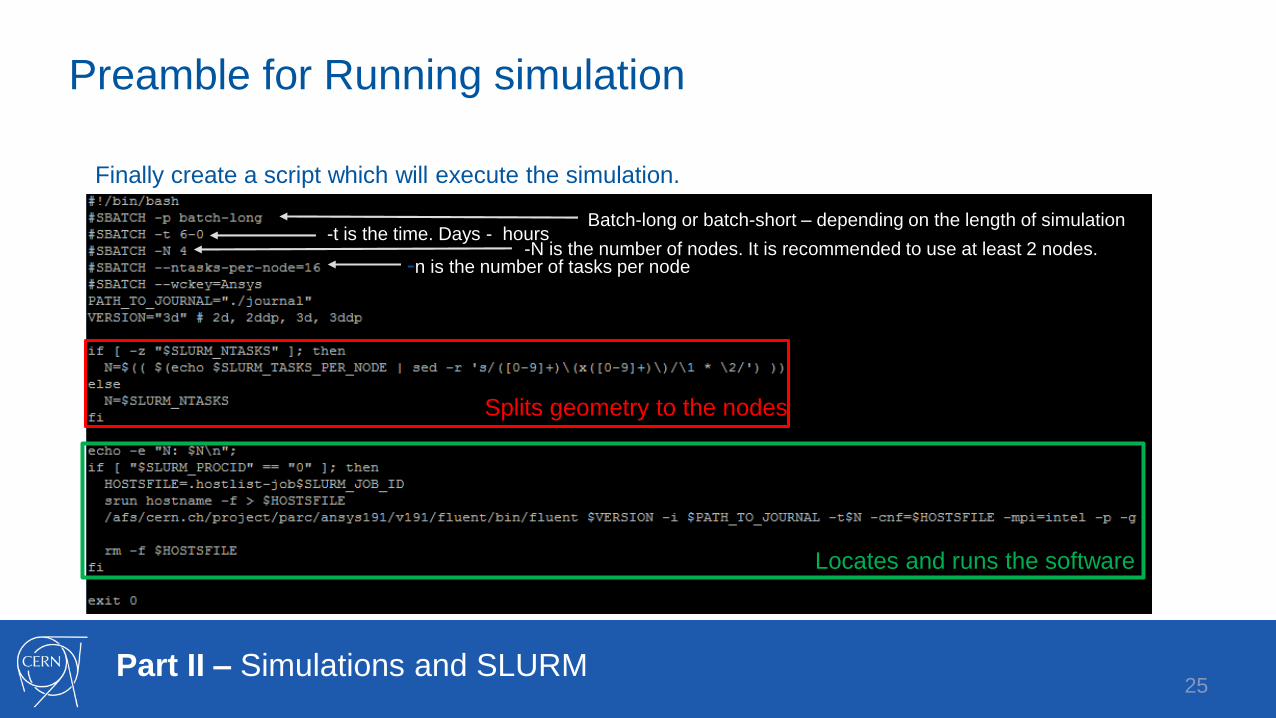
Preamble for Running simulation
25
Finally create a script which will execute the simulation.
Batch-long or batch-short – depending on the length of simulation-t is the time. Days - hours
-N is the number of nodes. It is recommended to use at least 2 nodes. -n is the number of tasks per node
Part II – Simulations and SLURM
Splits geometry to the nodes
Locates and runs the software
Part II SLURM
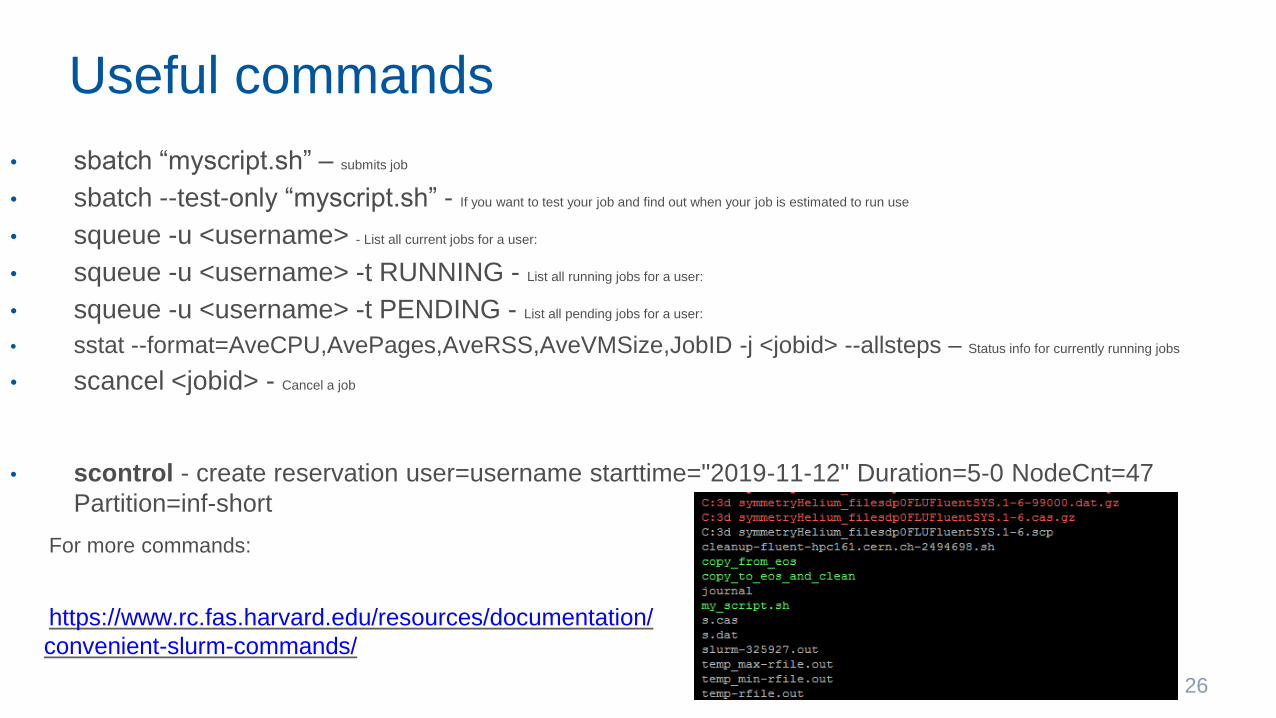
Useful commands
• sbatch “myscript.sh” – submits job
• sbatch --test-only “myscript.sh” - If you want to test your job and find out when your job is estimated to run use
• squeue -u <username> - List all current jobs for a user:
• squeue -u <username> -t RUNNING - List all running jobs for a user:
• squeue -u <username> -t PENDING - List all pending jobs for a user:
• sstat --format=AveCPU,AvePages,AveRSS,AveVMSize,JobID -j <jobid> --allsteps – Status info for currently running jobs
• scancel <jobid> - Cancel a job
• scontrol - create reservation user=username starttime="2019-11-12" Duration=5-0 NodeCnt=47
Partition=inf-short
26
For more commands:
https://www.rc.fas.harvard.edu/resources/documentation/
convenient-slurm-commands/
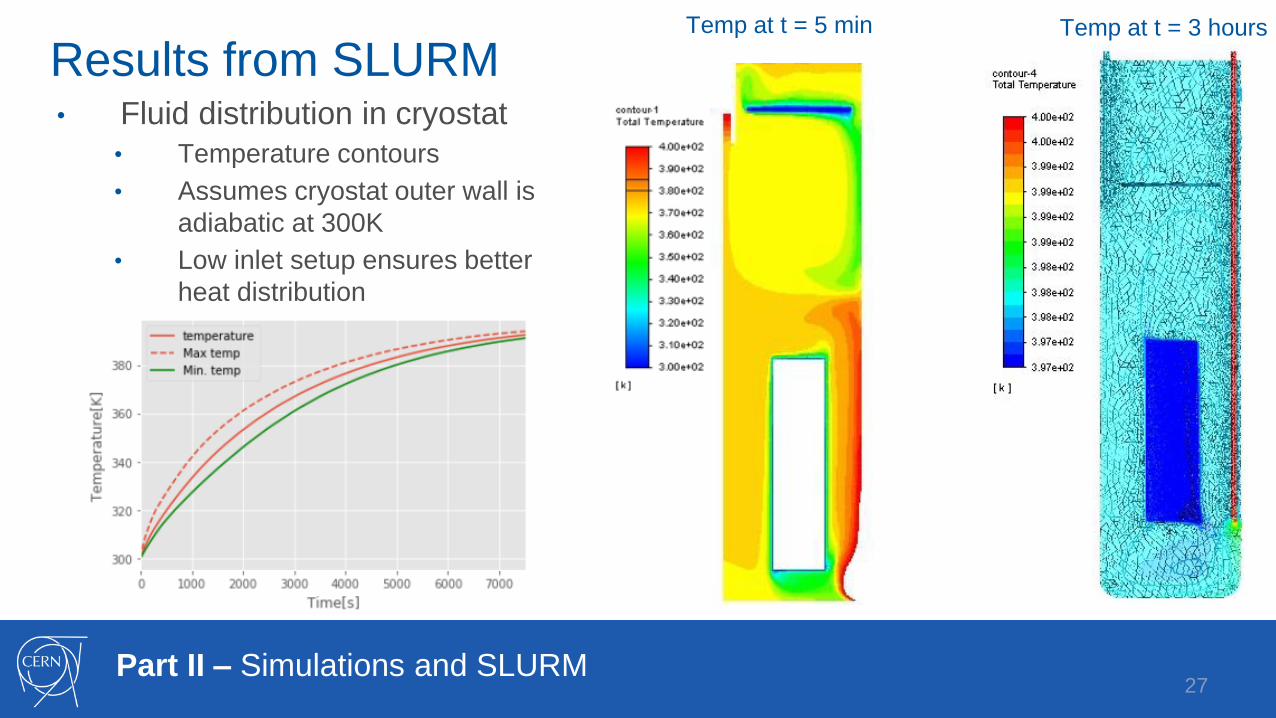
Results from SLURM• Fluid distribution in cryostat
• Temperature contours
• Assumes cryostat outer wall is
adiabatic at 300K
• Low inlet setup ensures better
heat distribution
27
Temp at t = 5 min Temp at t = 3 hours
Part II – Simulations and SLURM
Part II SLURM
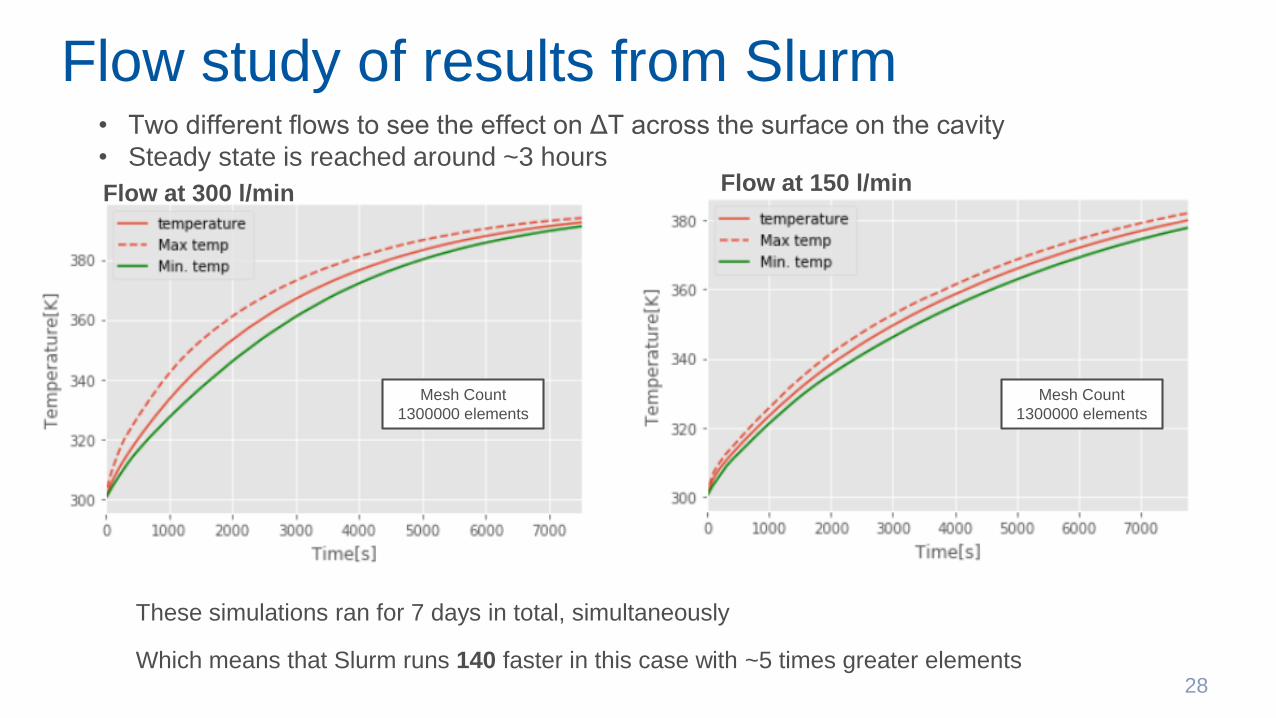
Flow study of results from Slurm
Flow at 300 l/min
Mesh Count
1300000 elements
28
• Two different flows to see the effect on ΔT across the surface on the cavity
• Steady state is reached around ~3 hours
These simulations ran for 7 days in total, simultaneously
Which means that Slurm runs 140 faster in this case with ~5 times greater elements
Flow at 150 l/min
Mesh Count
1300000 elements
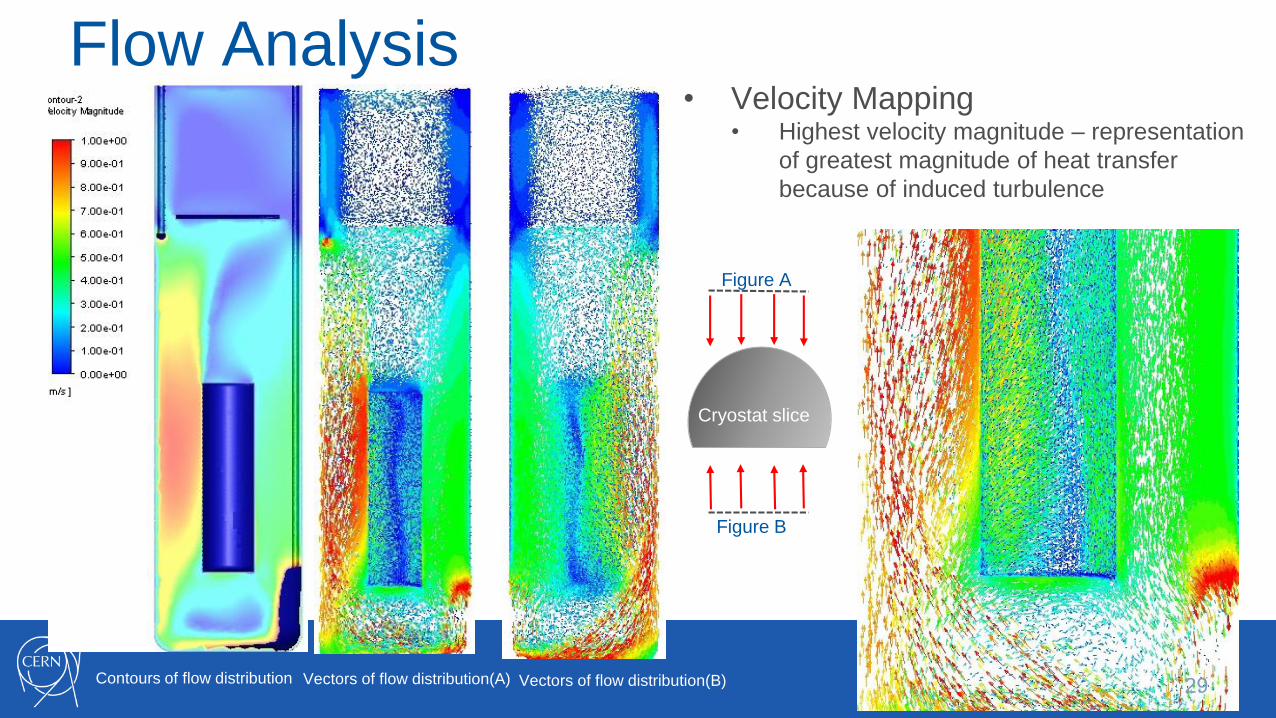
Flow Analysis• Velocity Mapping
• Highest velocity magnitude – representation
of greatest magnitude of heat transfer
because of induced turbulence
29Contours of flow distribution Vectors of flow distribution(A) Vectors of flow distribution(B)
Figure A
Figure B
Cryostat slice
Part II - Simulations and SLURM
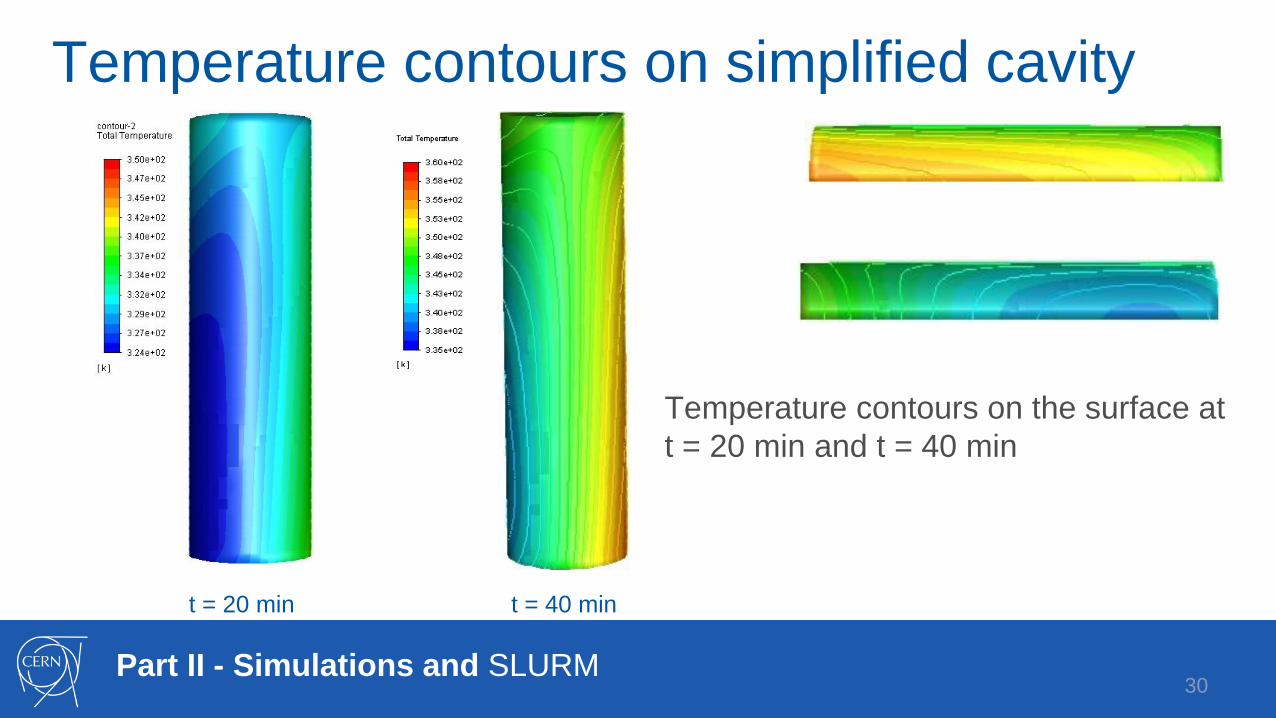
Temperature contours on simplified cavity
Temperature contours on the surface at
t = 20 min and t = 40 min
30
t = 20 min t = 40 min
Part III: In-situ bake-out preparation tests
31
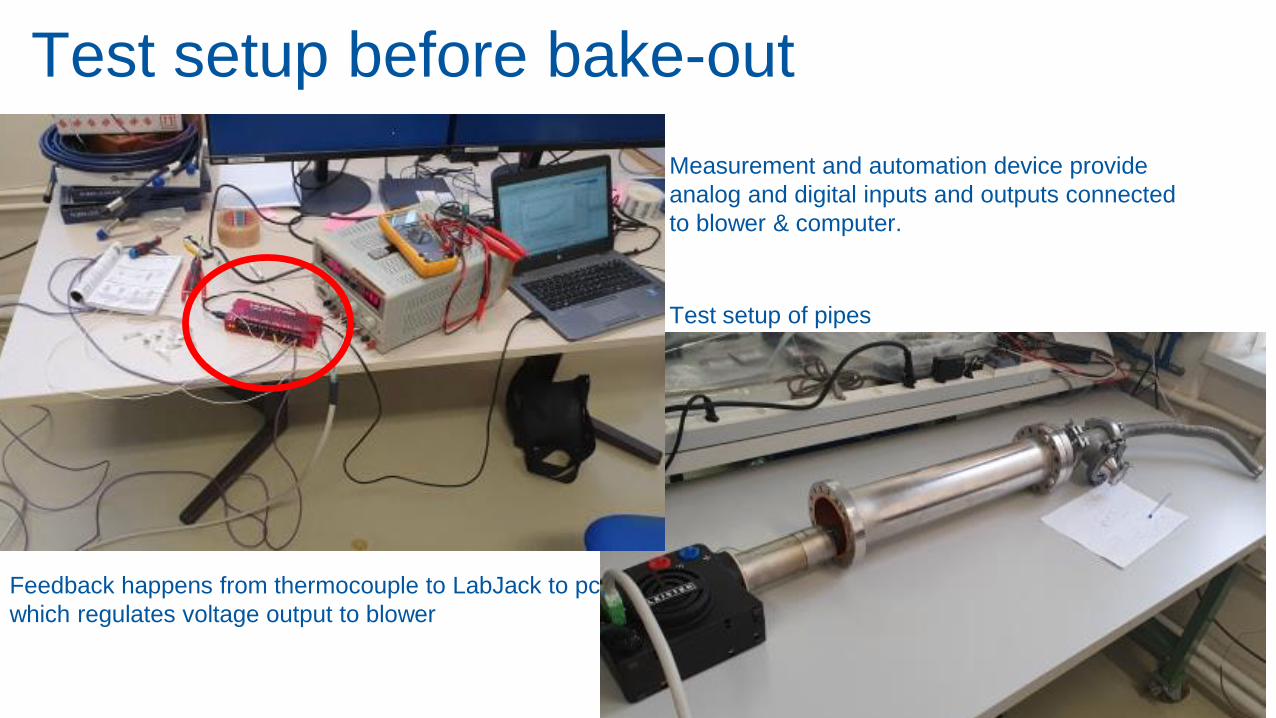
Test setup before bake-out
32
Test setup of pipes
Measurement and automation device provide
analog and digital inputs and outputs connected
to blower & computer.
Feedback happens from thermocouple to LabJack to pc,
which regulates voltage output to blower
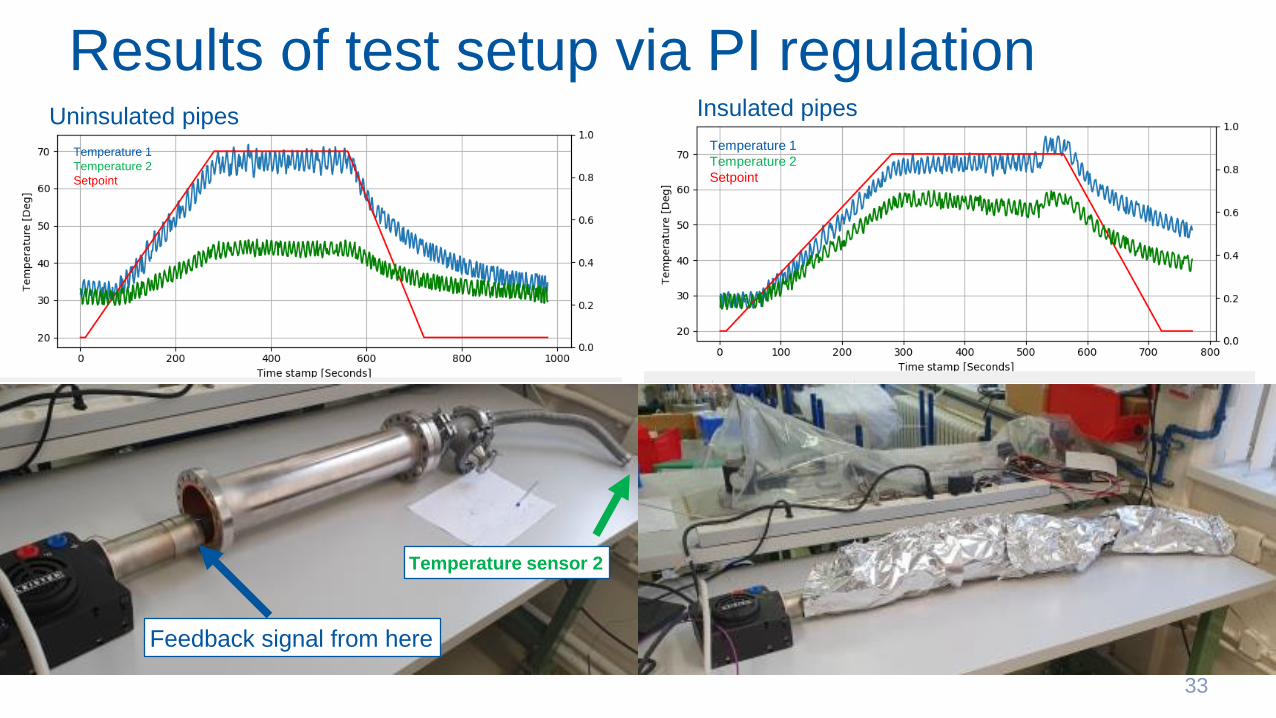
Results of test setup via PI regulation
33
Feedback signal from here
Temperature sensor 2
Uninsulated pipes Insulated pipes
Temperature 1
Temperature 2
Setpoint
Temperature 1
Temperature 2
Setpoint
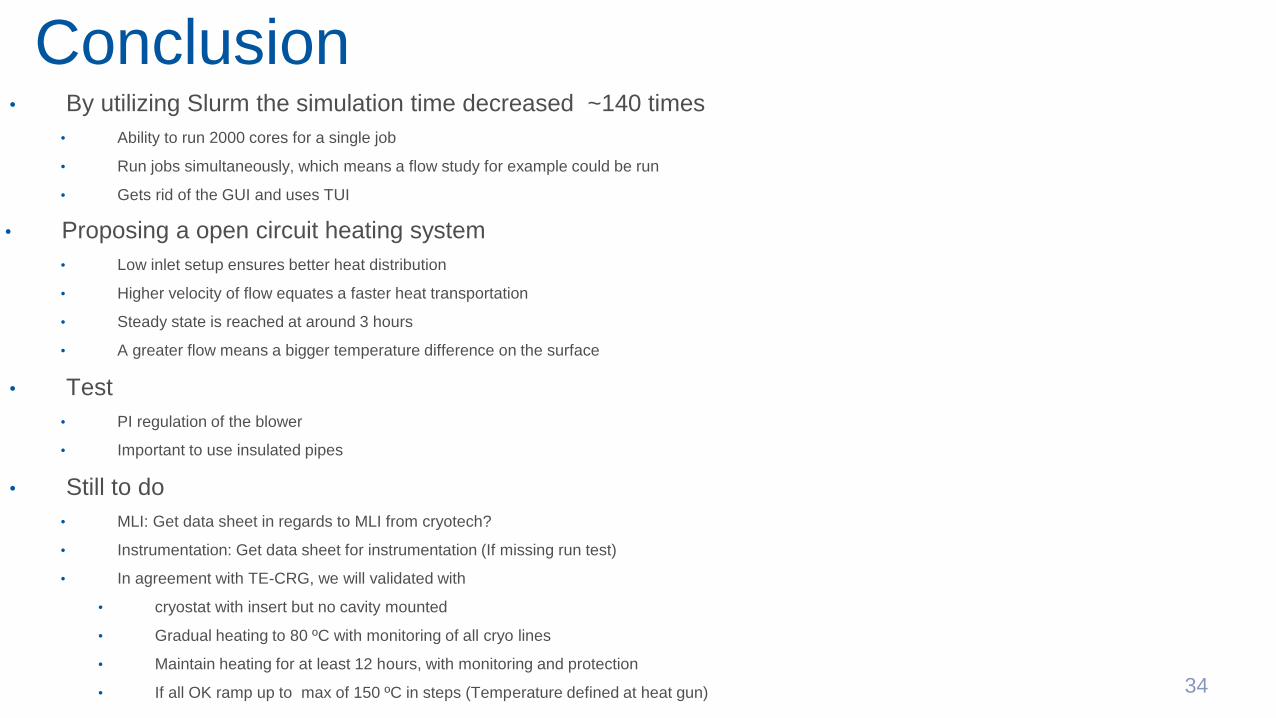
Conclusion• By utilizing Slurm the simulation time decreased ~140 times
• Ability to run 2000 cores for a single job
• Run jobs simultaneously, which means a flow study for example could be run
• Gets rid of the GUI and uses TUI
• Proposing a open circuit heating system
• Low inlet setup ensures better heat distribution
• Higher velocity of flow equates a faster heat transportation
• Steady state is reached at around 3 hours
• A greater flow means a bigger temperature difference on the surface
• Test
• PI regulation of the blower
• Important to use insulated pipes
• Still to do
• MLI: Get data sheet in regards to MLI from cryotech?
• Instrumentation: Get data sheet for instrumentation (If missing run test)
• In agreement with TE-CRG, we will validated with
• cryostat with insert but no cavity mounted
• Gradual heating to 80 ºC with monitoring of all cryo lines
• Maintain heating for at least 12 hours, with monitoring and protection
• If all OK ramp up to max of 150 ºC in steps (Temperature defined at heat gun) 34

Extra
35
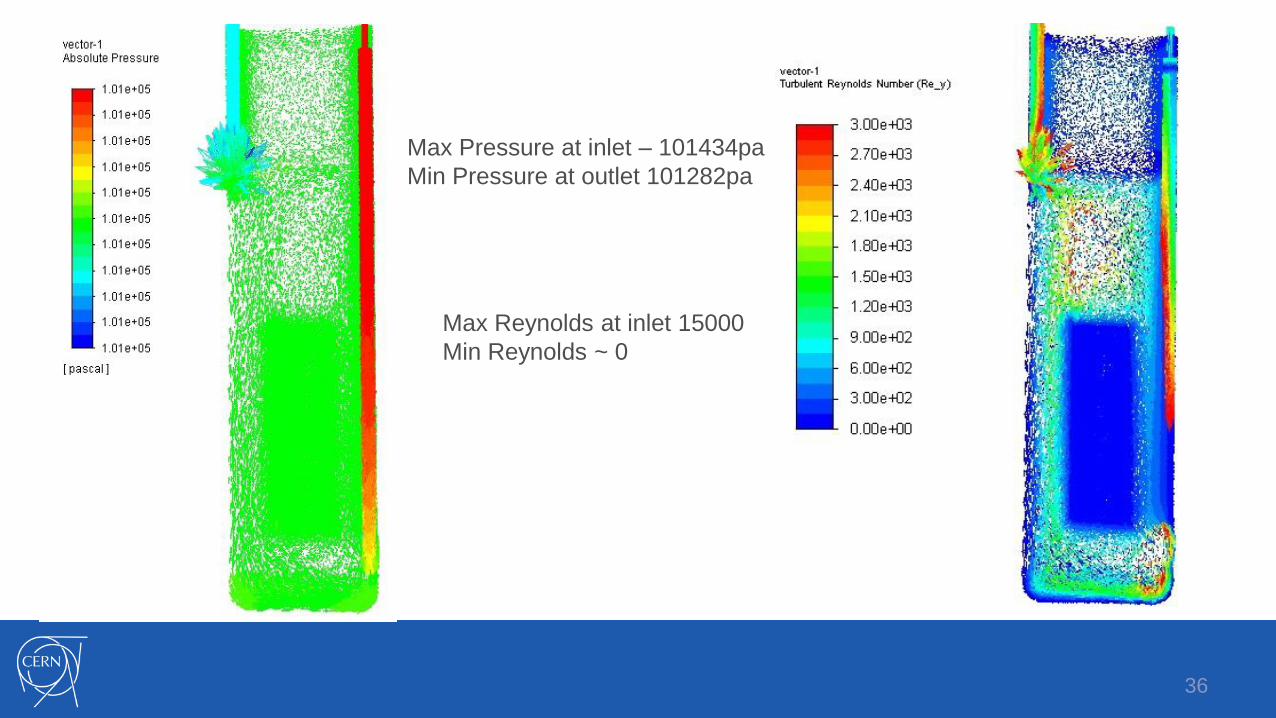
Max Pressure at inlet – 101434pa
Min Pressure at outlet 101282pa
Max Reynolds at inlet 15000
Min Reynolds ~ 0
36
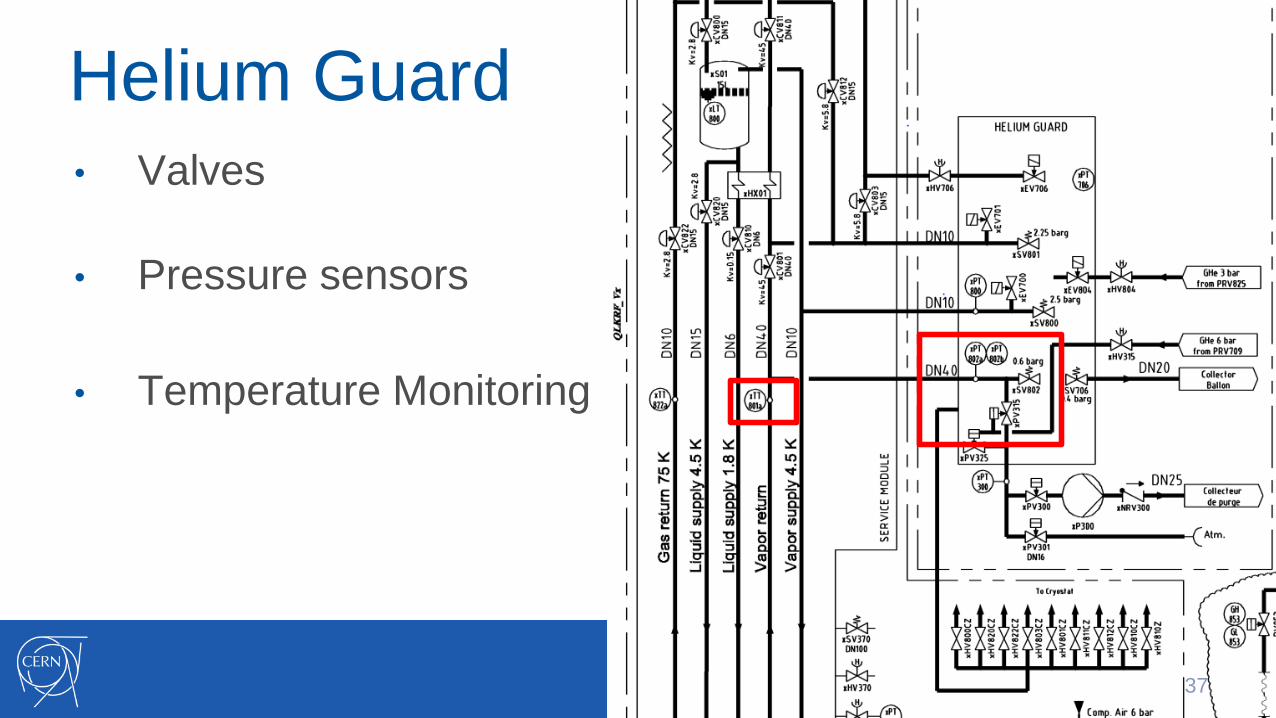
Helium Guard
• Valves
• Pressure sensors
• Temperature Monitoring
37
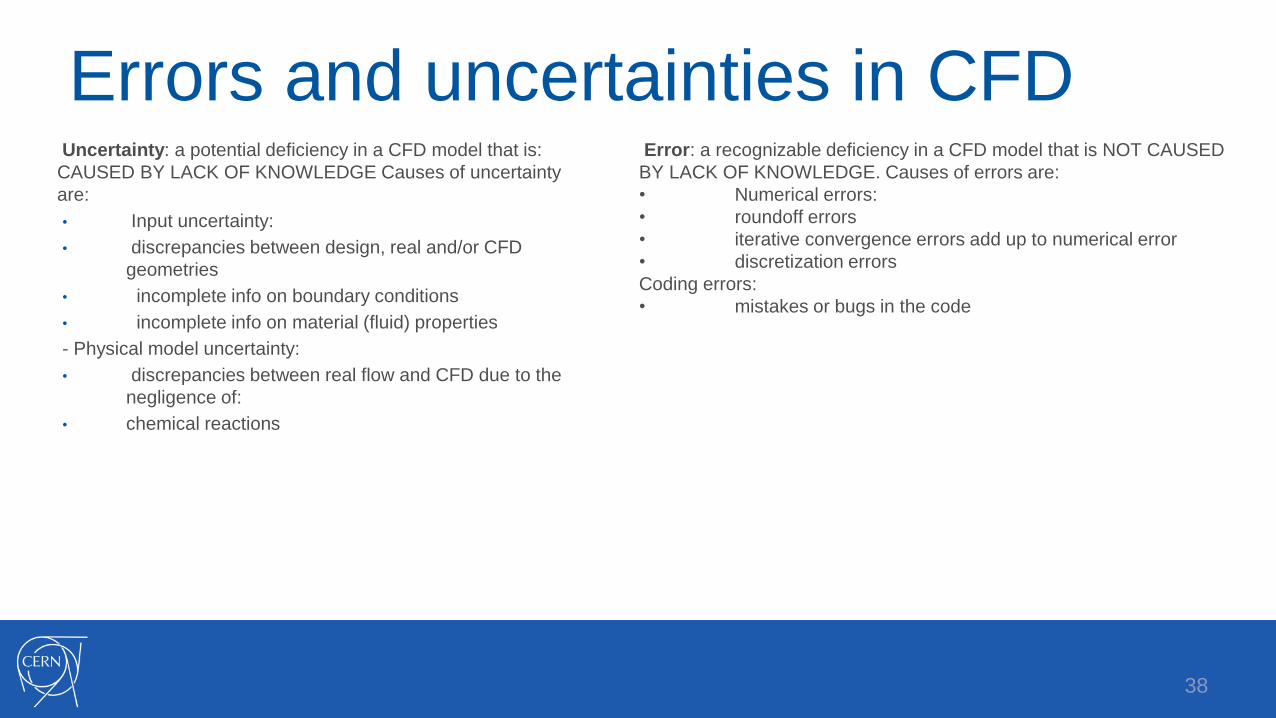
Errors and uncertainties in CFDUncertainty: a potential deficiency in a CFD model that is:
CAUSED BY LACK OF KNOWLEDGE Causes of uncertainty
are:
• Input uncertainty:
• discrepancies between design, real and/or CFD
geometries
• incomplete info on boundary conditions
• incomplete info on material (fluid) properties
- Physical model uncertainty:
• discrepancies between real flow and CFD due to the
negligence of:
• chemical reactions
38
Error: a recognizable deficiency in a CFD model that is NOT CAUSED
BY LACK OF KNOWLEDGE. Causes of errors are:
• Numerical errors:
• roundoff errors
• iterative convergence errors add up to numerical error
• discretization errors
Coding errors:
• mistakes or bugs in the code
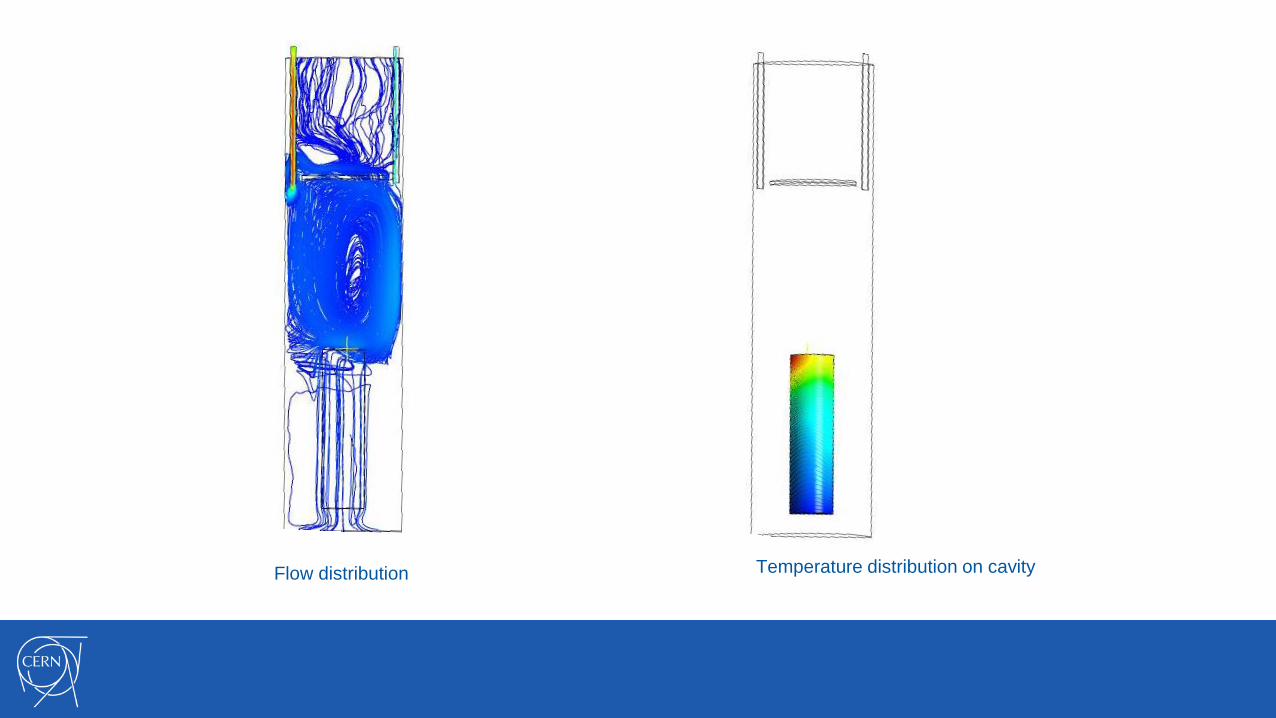
Flow distribution Temperature distribution on cavity