Embed Size (px)
Citation preview
Abstract
The application of the cryogenically cooled resonator
enables rapid DTI acquisitions as basis for cohort
studies in mice.
Introduction: in vivo high resolution diffusion tensor
imaging (DTI) of the mouse brain has proven promising
application for a variety of pathologies. Its application
to large cohort studies, however, is often limited by the
intrinsic low signal to noise ratio (SNR) causing long
acquisition times. Cryogenically cooled resonators (CCR)
have demonstrated the potential for significantly increasing
SNR and appear attractive for reducing scan times in DTI
imaging thus enabling cohort studies. This contribution
describes the DTI acquisition optimization using CCRs and
presents the outcome of an initial cohort study at the group
level to β-amyloid precursor protein (APP) transgenic mice.
Methods: A DTI sequence providing 156² x 250 µm³ spatial
resolution with 30 diffusion encoding directions was
optimized for using CCR at ultrahigh field (11.7 T), resulting in
a total acquisition time of 35 minutes. The quality was directly
compared with a standardized 110 minutes acquisition protocol
published earlier. Fractional anisotropy (FA) and fiber tracking
(FT) results including quantitative tractwise fractional
anisotropy statistics (TFAS) were qualitatively and quantitatively
compared. The optimized sequence was then applied to 5
wild type and 7 APP transgenic (tg2576) mice for investiga-
tion of its potential for cohort studies. Fractional anisotropy
(FA) maps were statistically compared by whole brain-based
spatial statistics (WBSS) at the group level vs. wild type controls.
Results: With the optimized protocol no remarkable differ-
ences were observed for the qualitative and quantitative
assessment of the calculated fractional anisotropy maps
and fibre tracking results. Coefficients of variation for
ROI-based FA-comparison as well as for TFAS revealed
comparable results for the investigated scanning protocols.
At the group level, differences were observed between
the WT and the transgenic animals at locations associated
with Alzheimer’s disease in humans, such as the hip-
pocampus, the entorhinal cortex, and the caudoputamen.
Conclusion: DTI of the mouse brain at 11.7 T can be performed
within approximately 30 minutes, which renders cohort stud-
ies feasible. With the fast protocol reliable and reproducible
FA-values and FT reconstructions could be achieved. The
application of the fast protocol to cohort studies revealed
changes identified by WBSS of the FA maps in regions asso-
ciated with amyloid-β deposition for the transgenic mice,
thus proving the potential of rapid DTI for cohort studies.
Fast DTI @ 11.7 T: Ready for Cohort StudiesHans-Peter Müller1, Ina Vernikouskaya2,3, Albert C. Ludolph1, Jan Kassubek1, Detlef Stiller4, Volker Rasche2,3
1 Department of Neurology, University Hospital Ulm, Ulm, Germany2 Department of Internal Medicine II, University Hospital of Ulm, Ulm, Germany3 Small Animal MRI, Medical Faculty, University of Ulm, Ulm, Germany4 Target Discovery Research, Boehringer Ingelheim Pharma GmbH&Co. KG, Biberach, Germany
Introduction
in vivo as well as in-vitro diffusion tensor imaging (DTI) [1,2]
has evolved as an increasingly important tool for studying the
anatomy of the mouse brain [1-13]. With DTI mapping of the
brain fiber directions and reconstruction of its 3D architecture,
rendering axonal tracts and tracking white matter pathways
of the human brain is feasible [3]. In DTI for each voxel the
diffusion tensor of the water protons is assessed [1]. Trac-
tography algorithms use this information to track the neural
pathways [3] enabling to study the anatomical connectivity.
DTI studies of the rodent brain have been reported for dif-
ferent field strength [7-13] but still demand long scan times
to provide sufficient signal-to-noise ratio (SNR) and spatial
resolution. Published acquisition protocols utilize in-plane
resolutions between 117 µm and 160 µm with slice thickness
between 375 µm and 1 mm with acquisition times ranging up
to 1-2 hours [11,13]. Even though the spatial resolution revealed
acceptable quality to conduct fiber tracking (FT) and conse-
quent tract based spatial statistics (TBSS) [6], the related long
scanning times limit the application to large cohort studies.
For routine pre-clinical application of DTI, further optimization
especially regarding reducing acquisition times is mandatory.
The application of cryogenically cooled resonators (CCR)
has been proven to enable significant improvement of
SNR [14,15], The at least two-fold increase of SNR can be applied
for substantial reduction of scan time without sacrificing spa-
tial resolution and should enable high-fidelity DTI information
with even decreased slice thickness for improved 3D fiber
reconstruction within scan times as short as 30 minutes.
The reduced scan time and well defined DTI information
likely enables cohort studies for the analysis of structural
changes at the group level. E.g. DTI has been promisingly
applied as an imaging correlate to the assessment of human
ALZD [16,17]. Two major pathologic disorders have been identi-
fied: a) accumulation of extracellular amyloid plaques, caused
by amyloid-b protein aggregation, and b) the presence of
intracellular neurofibrillary tangles, formed by aggregates of
the hyperphosphorylated tau protein [18]. Changes originate in
the medial temporal lobe (entorhinal cortex and hippocam-
pus), spreading across the limbic cortex and neocortex [18,19].
Establishing similar biomarkers in preclinical research is cur-
rently ongoing [20,21]. Here DTI plays an increasingly important
role for studying the mouse anatomy [22,23]. Previous studies [18,24,25] compared different animal groups at subject coordi-
nate space level level (e.g. by individual ROI analyses).
The objective of this study was to enable group comparison
after stereotaxic normalization on a study-specific template.
The feasibility of rapid DTI measurements in cohort studies is
shown in APP transgenic mice (APP mice) vs. wild type mice
(wt mice). Diffusion related brain differences are identified.
The presented work provides the basis for future studies
aiming at examining experimental model of ALZD and other
neurodegenerative diseases.
Methods and Materials
Animal setup
All experiments were performed in accordance with German
animal protection laws and had been approved by the national
animal board. The optimized DTI protocol was evaluated in
three adult wild type mice (C57/B6, 12 months old). For group
comparison seven transgenic mice (tg2576, C57BL6/SJL [26],
23 months old) and five adult wild type mice (C57BL/6, 23
months old) were investigated with the optimized protocol.
All data acquisition was perforemd under isoflurane anesthe-
sia (3% for induction and 1.5% for maintenance). The animals
were placed in a stereotactic head support (Bruker Biospin,
Ettlingen, Germany). Body temperature was controlled by a
water based heating system and monitored by a rectal tem-
perature probe. The breathing frequency was maintained at
75–80 cycles per minute. The mice rapidly recovered (< 5
min) after the termination of anesthesia at the end of the MRI
procedure.
Data acquisition
All data was acquired applying a two-element transmit/
receive 1H mouse cryogenic surface coil (CryoProbe,
Bruker BioSpin) at 11.7 T (Biospec 117/16, Bruker, Ettlingen,
Germany). The rapid DTI protocol [29] comprised a diffusion
prepared spin echo EPI imaging protocol with acquisition
parametes as: TE/TR 50.5 ms / 15000 ms, matrix 128 x 96,
in-plane resolution 156 µm x 156 µm, 60 axial slices with
a slice thickness of 250 µm. DTI encodings include thirty
diffusion directions with b=1000 s/mm2 and 5 unweighted
b=0 volumes (standard gradient scheme as provided by
the Bruker software). With one signal average and four EPI
segments, the total acquisition time resulted as 35 minutes
(SP A). For the evaluation of the rapid technique additional
measurements were obtained with the protocol as sug-
gested by Harsan et al. [11], with acquisition parameter as:
TE/TR 20.5 ms / 7750 ms, matrix 128 x 96, in-plane
resolution 156 µm x 156 µm, 30 axial slices with a slice
thickness of 500 µm, diffusion scheme identical as before.
Six signal averages resulted in a total acquisition time of 110
minutes (SP B). For further assessment of the potential of the
CCR, a third protocol identical to SP B with only a single signal
average was acquired, resulting in 18 minutes scan time
(SP C). No respiratory or cardiac synchronization was used.
Data analysis
Data preprocessing was performed with the Tensor Imaging
and Fiber Tracking (TIFT) software package [27]. Fractional
anisotropy (FA) maps were calculated and displayed by direc-
tional color encoded maps of FA overlaid onto (b=0) anatomi-
cal images (Figure 2). FA values were compared between the
different techniques in three spherical volumes located the
septohippocampal nucleus, the coprus callosum, and in the
medial septal nucleus. Major pathways were identified by FT
with seed points located at the genu and along the corpus
callosum, near the lateral septal nucleus, and in the olfactory
tract (Figure 3). Quality of the tractography was assessed by
tractwise fractional anisotropy statistics (TFAS) [28].
For group analysis, iterative spatial normalization to a stereo-
taxic standard space was performed using a study-specific
b0-template and an FA-template [30]. Scanner- and sequence
specific b0- and FA-templates were created averaging data
sets of all mice after linear transformation according to manu-
ally identified landmarks according to a stereotaxic mouse
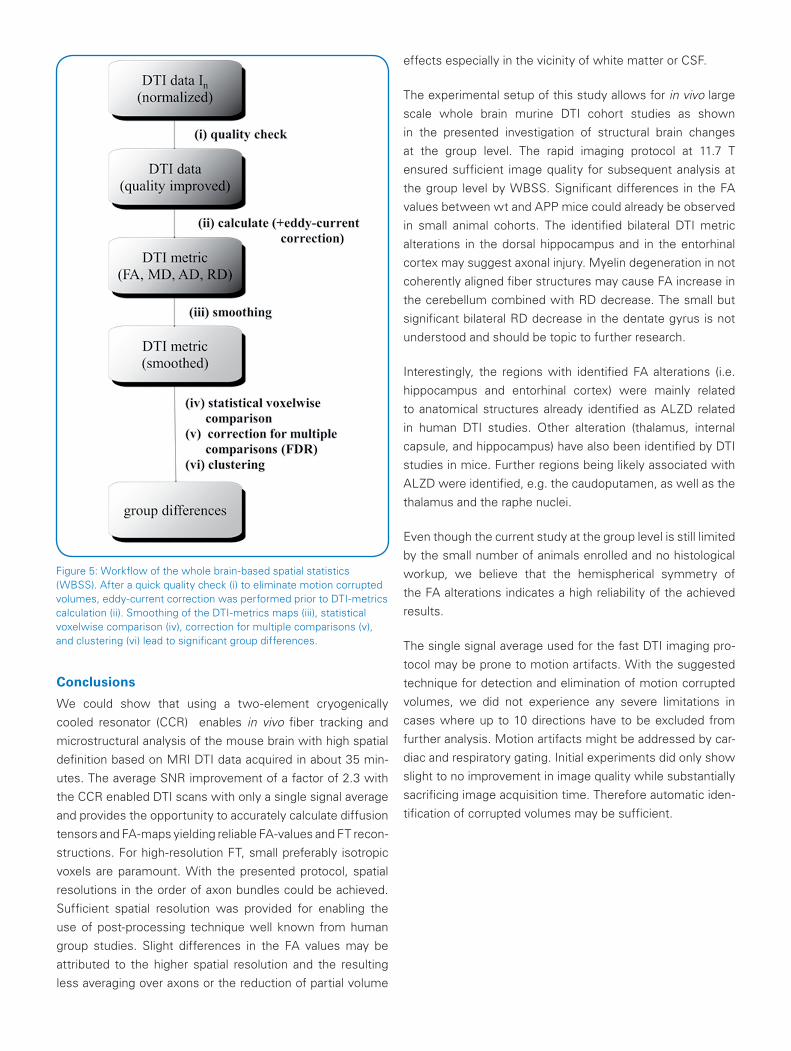
atlas [31]. The flow chart of the whole brain-based spatial
statistics is provided in Figure 5. A recently published quality
procedure [32] was applied for reduction of motion artifacts.
DTI metrics were calculated according to current standard
methods [33]. For a more detailed description, please refer to
Mueller et al [30].
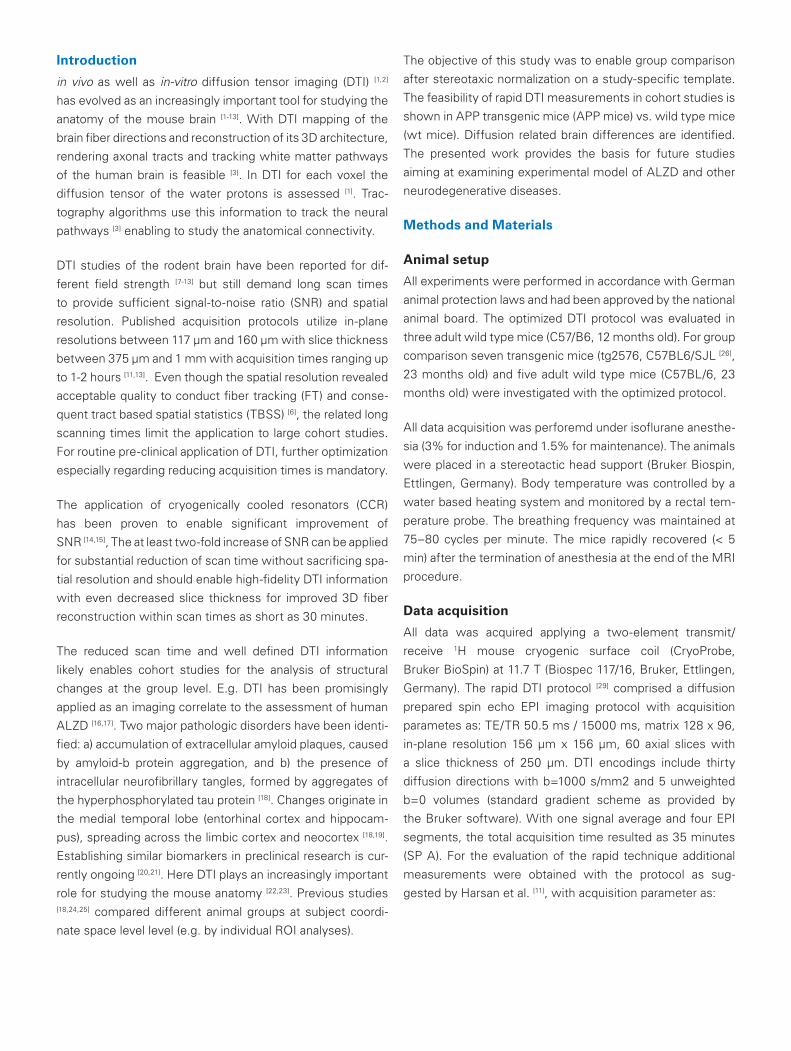
Figure 1: Four-element brain array coil (top) vs. two-element cryogenic cooled resonator (CCR – bottom)Anatomic images (axial slice and coronal reconstruction) used for signal-to-noise ratio (SNR) calculations.
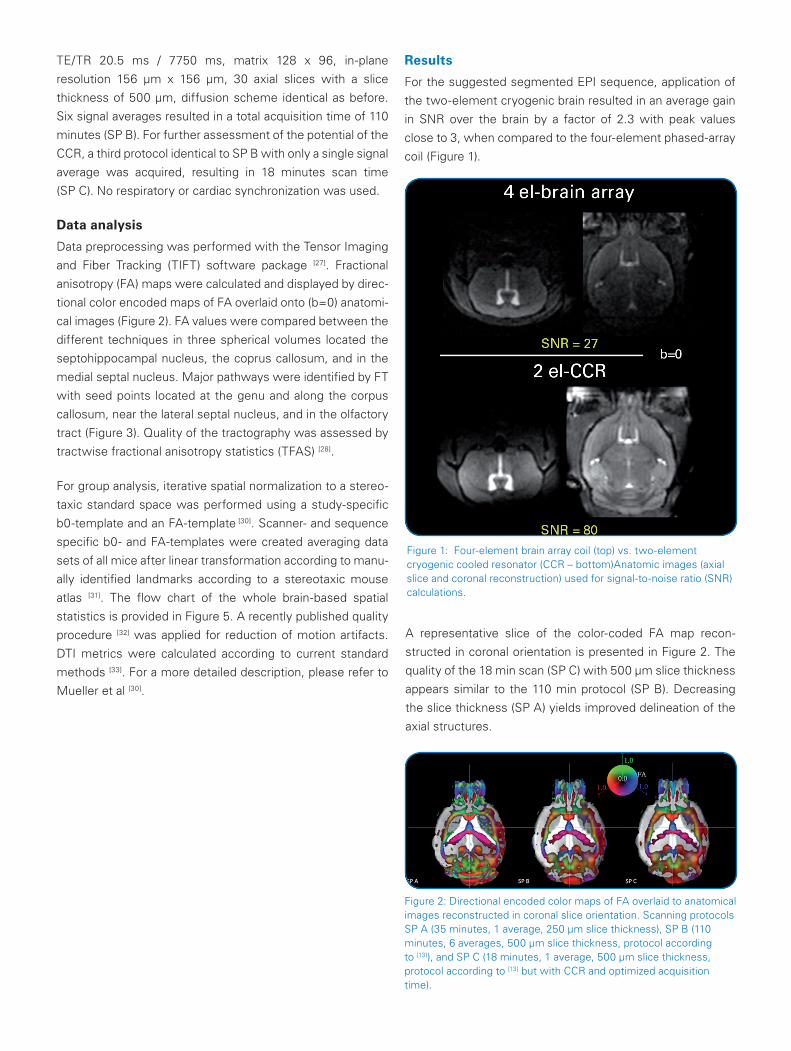
Figure 2: Directional encoded color maps of FA overlaid to anatomical images reconstructed in coronal slice orientation. Scanning protocols SP A (35 minutes, 1 average, 250 µm slice thickness), SP B (110 minutes, 6 averages, 500 µm slice thickness, protocol according to [13]), and SP C (18 minutes, 1 average, 500 µm slice thickness, protocol according to [13] but with CCR and optimized acquisition time).
A representative slice of the color-coded FA map recon-
structed in coronal orientation is presented in Figure 2. The
quality of the 18 min scan (SP C) with 500 µm slice thickness
appears similar to the 110 min protocol (SP B). Decreasing
the slice thickness (SP A) yields improved delineation of the
axial structures.
Results
For the suggested segmented EPI sequence, application of
the two-element cryogenic brain resulted in an average gain
in SNR over the brain by a factor of 2.3 with peak values
close to 3, when compared to the four-element phased-array
coil (Figure 1).
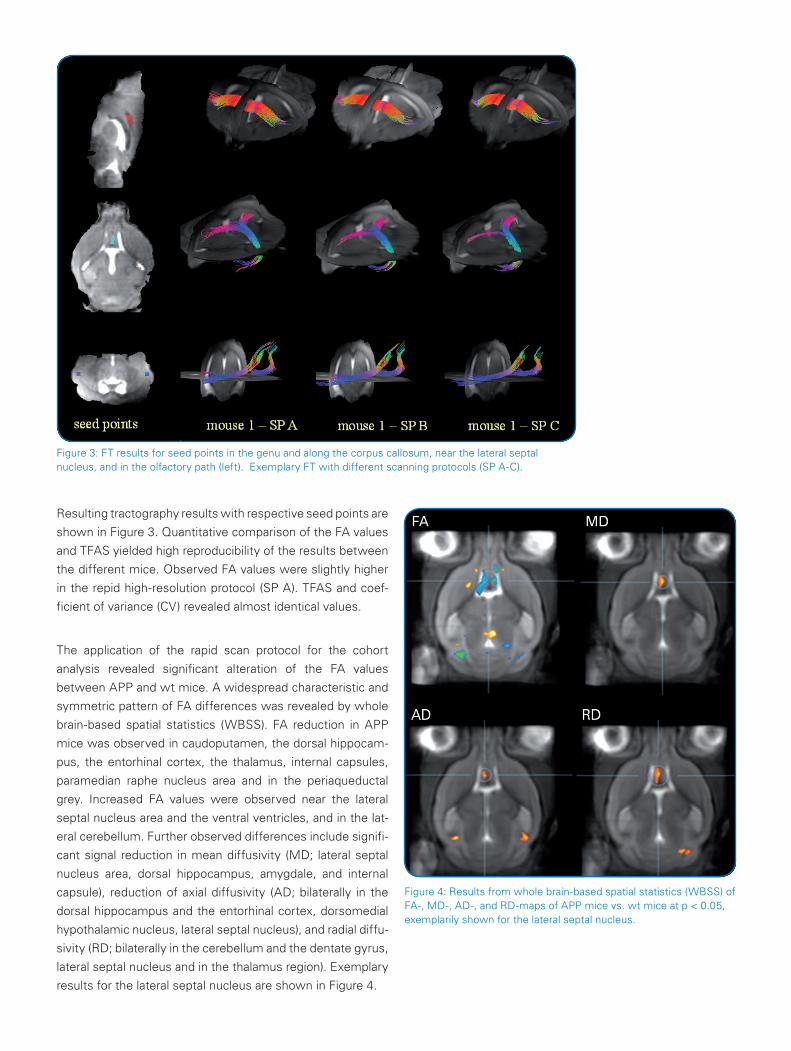
Resulting tractography results with respective seed points are
shown in Figure 3. Quantitative comparison of the FA values
and TFAS yielded high reproducibility of the results between
the different mice. Observed FA values were slightly higher
in the repid high-resolution protocol (SP A). TFAS and coef-
ficient of variance (CV) revealed almost identical values.
The application of the rapid scan protocol for the cohort
analysis revealed significant alteration of the FA values
between APP and wt mice. A widespread characteristic and
symmetric pattern of FA differences was revealed by whole
brain-based spatial statistics (WBSS). FA reduction in APP
mice was observed in caudoputamen, the dorsal hippocam-
pus, the entorhinal cortex, the thalamus, internal capsules,
paramedian raphe nucleus area and in the periaqueductal
grey. Increased FA values were observed near the lateral
septal nucleus area and the ventral ventricles, and in the lat-
eral cerebellum. Further observed differences include signifi-
cant signal reduction in mean diffusivity (MD; lateral septal
nucleus area, dorsal hippocampus, amygdale, and internal
capsule), reduction of axial diffusivity (AD; bilaterally in the
dorsal hippocampus and the entorhinal cortex, dorsomedial
hypothalamic nucleus, lateral septal nucleus), and radial diffu-
sivity (RD; bilaterally in the cerebellum and the dentate gyrus,
lateral septal nucleus and in the thalamus region). Exemplary
results for the lateral septal nucleus are shown in Figure 4.
Figure 4: Results from whole brain-based spatial statistics (WBSS) of FA-, MD-, AD-, and RD-maps of APP mice vs. wt mice at p < 0.05, exemplarily shown for the lateral septal nucleus.
Figure 3: FT results for seed points in the genu and along the corpus callosum, near the lateral septal nucleus, and in the olfactory path (left). Exemplary FT with different scanning protocols (SP A-C).
Conclusions
We could show that using a two-element cryogenically
cooled resonator (CCR) enables in vivo fiber tracking and
microstructural analysis of the mouse brain with high spatial
definition based on MRI DTI data acquired in about 35 min-
utes. The average SNR improvement of a factor of 2.3 with
the CCR enabled DTI scans with only a single signal average
and provides the opportunity to accurately calculate diffusion
tensors and FA-maps yielding reliable FA-values and FT recon-
structions. For high-resolution FT, small preferably isotropic
voxels are paramount. With the presented protocol, spatial
resolutions in the order of axon bundles could be achieved.
Sufficient spatial resolution was provided for enabling the
use of post-processing technique well known from human
group studies. Slight differences in the FA values may be
attributed to the higher spatial resolution and the resulting
less averaging over axons or the reduction of partial volume
effects especially in the vicinity of white matter or CSF.
The experimental setup of this study allows for in vivo large
scale whole brain murine DTI cohort studies as shown
in the presented investigation of structural brain changes
at the group level. The rapid imaging protocol at 11.7 T
ensured sufficient image quality for subsequent analysis at
the group level by WBSS. Significant differences in the FA
values between wt and APP mice could already be observed
in small animal cohorts. The identified bilateral DTI metric
alterations in the dorsal hippocampus and in the entorhinal
cortex may suggest axonal injury. Myelin degeneration in not
coherently aligned fiber structures may cause FA increase in
the cerebellum combined with RD decrease. The small but
significant bilateral RD decrease in the dentate gyrus is not
understood and should be topic to further research.
Interestingly, the regions with identified FA alterations (i.e.
hippocampus and entorhinal cortex) were mainly related
to anatomical structures already identified as ALZD related
in human DTI studies. Other alteration (thalamus, internal
capsule, and hippocampus) have also been identified by DTI
studies in mice. Further regions being likely associated with
ALZD were identified, e.g. the caudoputamen, as well as the
thalamus and the raphe nuclei.
Even though the current study at the group level is still limited
by the small number of animals enrolled and no histological
workup, we believe that the hemispherical symmetry of
the FA alterations indicates a high reliability of the achieved
results.
The single signal average used for the fast DTI imaging pro-
tocol may be prone to motion artifacts. With the suggested
technique for detection and elimination of motion corrupted
volumes, we did not experience any severe limitations in
cases where up to 10 directions have to be excluded from
further analysis. Motion artifacts might be addressed by car-
diac and respiratory gating. Initial experiments did only show
slight to no improvement in image quality while substantially
sacrificing image acquisition time. Therefore automatic iden-
tification of corrupted volumes may be sufficient.
Figure 5: Workflow of the whole brain-based spatial statistics (WBSS). After a quick quality check (i) to eliminate motion corrupted volumes, eddy-current correction was performed prior to DTI-metrics calculation (ii). Smoothing of the DTI-metrics maps (iii), statistical voxelwise comparison (iv), correction for multiple comparisons (v), and clustering (vi) lead to significant group differences.
© B
ruke
r B
ioS
pin
05/
14 T
1468
98
Bruker BioSpinhttp://www.bruker.com/mri [email protected]
References[1] Basser PJ, Mattiello J, LeBihan D (1994) MR diffusion tensor spectros-
copy and imaging. Biophys J 66: 259–267.[2] Mori S, Zhang J (2006) Principles of diffusion tensor imaging and its ap-
plications to basic neuroscience research. Neuron 51: 527–539.[3] Chuang N, Mori S, Yamamoto A, Jiang H, Ye X, et al. (2011) An MRI-based
atlas and database of the developing mouse brain. Neuroimage 54: 80-89.
[4] Gutman DA, Keifer OP Jr, Magnuson ME, Choi DC, Majeed W, et al. (2012) A DTI tractography analysis of infralimbic and prelimbic connectiv-ity in the mouse using high-throughput MRI. Neuroimage 63: 800-811.
[5] Pathak AP, Kim E, Zhang J, Jones MV (2011) Three-dimensional imaging of the mouse neurovasculature with magnetic resonance microscopy. PLoS One 6: e22643.
[6] Ruest T, Holmes WM, Barrie JA, Griffiths IR, Anderson TJ, et al. (2011) High-resolution diffusion tensor imaging of fixed brain in a mouse model of Pelizaeus-Merzbacher disease: comparison with quantitative mea-sures of white matter pathology. NMR Biomed 24: 1369-1379.
[7] Boretius S, Würfel J, Zipp F, Frahm J, Michaelis T (2007) High-field dif-fusion tensor imaging of mouse brain in vivo using single-shot STEAM MRI. J Neurosci Methods161: 112-117.
[8] Guilfoyle DN, Gerum S, Hrabe J (2011) Murine diffusion imaging using snapshot interleaved EPI acquisition at 7T. J Neurosci Methods199: 10-14.
[9] Jiang Y, Johnson GA (2011) Microscopic diffusion tensor atlas of the mouse brain. Neuroimage 56: 1235-1243.
[10] Kumar M, Kim S, Pickup S, Chen R, Fairless AH, et al. (2012) Longitudinal in vivo diffusion tensor imaging for assessing brain develop-mental changes in BALB/cJ mice, a model of reduced sociability relevant to autism. Brain Res 1455: 56-67.
[11] Harsan LA, Paul D, Schnell S, Kreher BW, Hennig J, et al. (2010) in vivo diffusion tensor magnetic resonance imaging and fiber tracking of the mouse brain. NMR Biomed. 23: 884-896.
[12] Aggarwal M, Zhang J, Miller MI, Sidman RL, Mori S (2009) Magnetic resonance imaging and micro-computed tomography combined atlas of developing and adult mouse brains for stereotaxic surgery. Neuroscience 162: 1339-1350.
[13] Aggarwal M, Mori S, Shimogori T, Blackshaw S, Zhang J (2010) Three-dimensional diffusion tensor microimaging for anatomical characteriza-tion of the mouse brain. Magn Reson Med 64: 249-261.
[14] Ratering D, Baltes C, Nordmeyer-Massner J, Marek D, Rudin M (2008) Performance of a 200-MHz cryogenic RF probe designed for MRI and MRS of the murine brain. Magn Reson Med 59: 1440-1447.
[15] Baltes C, Radzwill N, Bosshard S, Marek D, Rudin M (2009) Micro MRI of the mouse brain using a novel 400 MHz cryogenic quadrature RF probe. NMR Biomed 22: 834-842.
[16] Ota M, Sato N, Nakata Y, Arima K, Uno M (2012) Relationship between apathy and diffusion tensor imaging metrics of the brain in Alzheimer’s disease. Int J Geriatr Psychiatry 27: 722-726.
[17] Stebbins GT and Murphy CM (2009) Diffusion tensor imaging in Alzheim-er’s disease and mild cognitive impairment. Behav Neurol 21: 39–49.
[18] Zerbi V, Kleinnijenhuis M, Fang X, Jansen D, Veltien A, et al. (2012) Gray and white matter degeneration revealed by diffusion in an Alzheimer mouse model. Neurobiol Aging doi:pii: S0197-4580(12)00594-5. 10.1016/.
[19] Braak H, Braak E (1995) Staging of Alzheimer’s disease-related neurofibrillary changes. Neurobiol. Aging 16, 271-278; discussion 278-284.
[20] Jack Jr CR, Garwood M, Wengenack TM, Borowski B, Curran GL, et al. (2004) in vivo visualization of Alzheimer’s amyloid plaques by magnetic resonance imaging in transgenic mice without a contrast agent. Magn Reson Med 52: 1263–1271.
[21] Delatour B, Guegan M, Volk A, Dhenain M (2006) in vivo MRI and histological evaluation of brain atrophy in APP/PS1 transgenic mice. Neurobiol Aging 27: 835-847
[22] Harsan LA, Paul D, Schnell S, Kreher BW, Hennig J, et al. (2010) in vivo diffusion tensor magnetic resonance imaging and fiber tracking of the mouse brain. NMR Biomed. 23: 884-896.
[23] Aggarwal M, Mori S, Shimogori T, Blackshaw S, Zhang J (2010) Three-dimensional diffusion tensor microimaging for anatomical characteriza-tion of the mouse brain. Magn Reson Med 64: 249-261.
[24] Sun SW, Song SK, Harms MP, Lin SJ, Holtzman DM, et al. (2005) Detec-tion of age-dependent brain injury in a mouse model of brain amyloidosis associated with Alzheimer’s disease using magnetic resonance diffusion tensor imaging. Exp Neurol 191: 77-85.
[25] Song SK, Kim JH, Lin SJ, Brendza RP, Holtzman DM (2004) Diffusion ten-sor imaging detects age-dependent white matter changes in a transgenic mouse model with amyloid deposition. Neurobiol Dis 15: 640-647.
[26] Hsiao K, Chapman P, Nilsen S, Eckman C, Harigaya Y, et al. (1996) Correla-tive memory deficits, Abeta elevation, and amyloid plaques in transgenic mice. Science 274: 99-102.
[27] Müller HP, Unrath A, Ludolph AC, Kassubek J (2007) Preservation of diffusion tensor properties during spatial normalization by use of tensor imaging and fibre tracking on a normal brain database. Phys Med Biol 52: N99-109.
[28] Müller HP, Unrath A, Sperfeld AD, Ludolph AC, Riecker A, et al. (2007) Dif-fusion tensor imaging and tractwise fractional anisotropy statistics: quan-titative analysis in white matter pathology. Biomed Eng Online 6: 42.
[29] Mueller HP, Vernikouskaya I, Kassubek J, Rasche V. Fast diffusion tensor magnetic resonance imaging of the mouse brain with a cryogenic coil at ultrahigh-field: optimization of the scanning protocol enables acquisition times useful for cohort studies. PLoS One. 2012;7(12):e53389.
[30] Mueller HP, Vernikouskaya I, Kassubek J, Ludolph AC, Stller D, Rasche V. Diffusion tensor magnetic resonance imaging of the brain in APP trans-genic mice: a cohort study. PlosOne 2013;8(6):e67630.
[31] Paxinos G and Franklin KBJ (2007) The mouse brain in stereotaxic coordi-nates. Academic press.Elsevier 3rd ed.
[32] Müller HP, Süssmuth SD, Landwehrmeyer GB, Ludolph A, Tabrizi SJ, et al. (2011) Stability effects on results of diffusion tensor imaging analysis by reduction of the number of gradient directions due to motion artifacts: an application to presymptomatic Huntington’s disease. Version 2. PLoS Curr 3: RRN1292.
[33] Basser PJ, Jones DK (2002) Diffusion-tensor MRI: theory, experimental design and data analysis - a technical review. NMR Biomed 15, 456-467.