Embed Size (px)
Citation preview
Energies 2014, 7, 2740-2760; doi:10.3390/en7052740
energies ISSN 1996-1073
www.mdpi.com/journal/energies
Article
Fast Cut Back Thermal Power Plant Load Rejection and Black Start Field Test Analysis
Kaiwen Zeng 1, Jinyu Wen 1,*, Longpeng Ma 1, Shijie Cheng 1, En Lu 2 and Ning Wang 2
1 State Key Laboratory of Advanced Electromagnetic Engineering and Technology,
Huazhong University of Science and Technology, 1037 Luoyu Road, Wuhan 430074,
Hubei, China; E-Mails: [email protected] (K.Z.); [email protected] (L.M.);
[email protected] (S.C.) 2 Guangdong Power Dispatch Center, 75 Meihua Road, Guangzhou 510600, Guangdong, China;
E-Mails: [email protected] (E.L.); [email protected] (N.W.)
* Author to whom correspondence should be addressed; E-Mail: [email protected];
Tel.: +86-136-5728-8343; Fax: +86-027-8754-0569.
Received: 29 January 2014; in revised form: 20 March 2014 / Accepted: 10 April 2014 /
Published: 25 April 2014
Abstract: Fast and reliable black start plays a key role in improving the ability of
the power system to resist the risk of large-scale blackouts. For a black start with high
voltage and long-distance transmission lines, it is much easier to cause phenomena such as
self-excitation and power frequency/operating overvoltage, which may lead to black start
failure and impact the reliability of the system’s restoration. Meanwhile, the long time
needed to crank up the non-black start units will impact the speed of the restoration.
This paper addresses the advantages of using a thermal power unit with a fast cut back (FCB)
function as a black start unit, and studies the transient process of the FCB unit during
the restoration. Firstly, key problems in the power system black start process are analyzed
and a practical engineering criterion of self-excitation is proposed. Secondly, the dynamic
model of the FCB unit is presented. Thirdly, the field test of the FCB unit load rejection
and black start is introduced, which is the first successful field test of black start with 500 kV
long-distance lines in China Southern Power Grid (CSG). Finally, the transient process of
this test is simulated using the PSCAD/EMTDC software, and the simulation results accord
well with the field test results, which verifies the correctness of the FCB model and the
self-excitation engineering criterion proposed.
OPEN ACCESS
Energies 2014, 7 2741
Keywords: fast cut back (FCB); dynamic model; unit load rejection; black start field
test; self-excitation
1. Introduction
As the electricity demand in society continues to grow, the interconnected power grid is developing
towards large-scale direction. However, new safety problems arise with the increase of the power
grid profits. For example, local faults may induce cascading reactions and cause large-scale
blackouts [1,2]. In recent years, there have been many large-scale power system blackouts worldwide,
resulting in great economic losses and terrible political impacts [3,4]. Restoring the power supply after
a large-scale blackout is a complicated and time-consuming process. A fast and reliable restoration can
significantly reduce the economic losses and social impacts caused by blackouts.
In the power system restoration process, self-excitation and overvoltage caused by line charging,
harmonics, and switch inrushes are the main problems that affect the success of black starts [5].
Research and practice show that the overvoltage problem becomes more serious under the conditions
of high system voltage, long-distance transmission lines, and large charging transformer capacity [6].
Because of the typical high voltage levels and long transmission lines found in modern bulk power
systems, self-excitation and power frequency/operating overvoltage are more likely to occur during
the process of power system restoration, leading to the failure of the black start [7]. Meanwhile, as the
main black start power sources in the traditional power system are hydropower units, diesel generating
units, and gas turbines, it is hard for these small capacity units to crank up other non-black start units,
which will result in a long duration restoration processes. Although thermal power units have the
advantages of large capacity and wide distribution, and stand in the highest flight in the power system,
in general they cannot be used as black start power sources [8,9]. Fortunately, through fast cut back (FCB)
technical reform, the turbines and boilers of thermal power units can remain working after load
rejection caused by the power grid failure [10]. After the elimination of the failure, the unit can parallel
in the grid and start supplying power quickly, which will accelerate the power system restoration process.
Hence, the FCB unit is an ideal kind of power source for a black start.
There are a lot of achievements in black start researches [5–7,11,12], but how to utilize FCB units
to improve the black start capacity remains an open question. The existing literatures about FCB can
be mainly classified into two categories. One mainly discussed the function of the FCB unit and
introduced field tests about it [10]. The other mainly studied how to use the FCB unit to accelerate the
black start process of power systems [13,14]. However, as far as the authors know, there is no paper
that has studied the dynamic response of the FCB unit under load rejection and black start process
conditions. Therefore, this paper studies the dynamic model of the FCB unit and introduces the FCB
field test.
The remaining part of the paper is organized as follows: the key problems in power system
restoration are introduced in Section 2, where an engineering criterion of self-excitation is also
presented; the dynamic model of the FCB unit is proposed in Section 3; the FCB unit load rejection
and the 500 kV transmission line black start field test are introduced in Section 4; the comparative
Energies 2014, 7 2742
analysis between the simulation results and the field test results is presented in Section 5; and the
conclusions are drawn in Section 6.
2. Key Problems in the Black Start Process
The general black start process is as follows: generator units with self-starting ability (such as
hydropower units) start themselves, charge the main transformers and the transmission lines, and finally
start other remote generator units and loads. In this process, some electromagnetic transient problems
may impact the reliability of the power system restoration, and the key ones are the self-excitation
and overvoltage [12].
2.1. Self-Excitation and Its Engineering Criterion
Generator self-excitation is a phenomenon whereby the stator current and voltage will increase
spontaneously because of the assisted effect of armature reactions. Its essence is the parameter
resonance caused by the coordination between the generator stator inductance and the external
circuit capacitance [15,16]. Research shows that the self-excitations of a synchronous generator can be
divided into three categories: reaction synchronous self-excitations, repulsion synchronous self-excitations,
and asynchronous self-excitations. There are manifest differences in terms of the occurrence conditions
and the mechanisms among different types of self-excitations [17,18].
Reaction synchronous self-excitation is the type of self-excitation whose electric frequency is the
same as its synchronous frequency, and the excitation is maintained by the reaction power generated
from the alternations of direct axis reactance and quadrature axis reactance. Repulsion synchronous
self-excitation is the type whose electric frequency is the same as the synchronous frequency, while the
excitation is maintained by the reaction power generated from the alternations of direct axis and
quadrature axis transient or sub-transient reactance. Asynchronous self-excitation is that the rotor
maintains the synchronous speed, while the electric frequency is lower than the synchronous frequency
and the self-excitation is maintained by asynchronous power generated by units. Table 1 shows the
comparison of the three different self-excitation types [15–18].
Table 1. Comparison of three self-excitation types.
Self-excitation types Electric frequency Power source Characteristic
Reaction synchronous self-excitation
Synchronous frequency
Reluctance power Salient-pole machine peculiar
Repulsion synchronous self-excitation
Synchronous frequency
Sub-transient reluctance power
May occur in Salient-pole machine and non-salient pole machine
Asynchronous self-excitationSub-synchronous
frequency Asynchronous power
Diverging oscillations of voltage and current
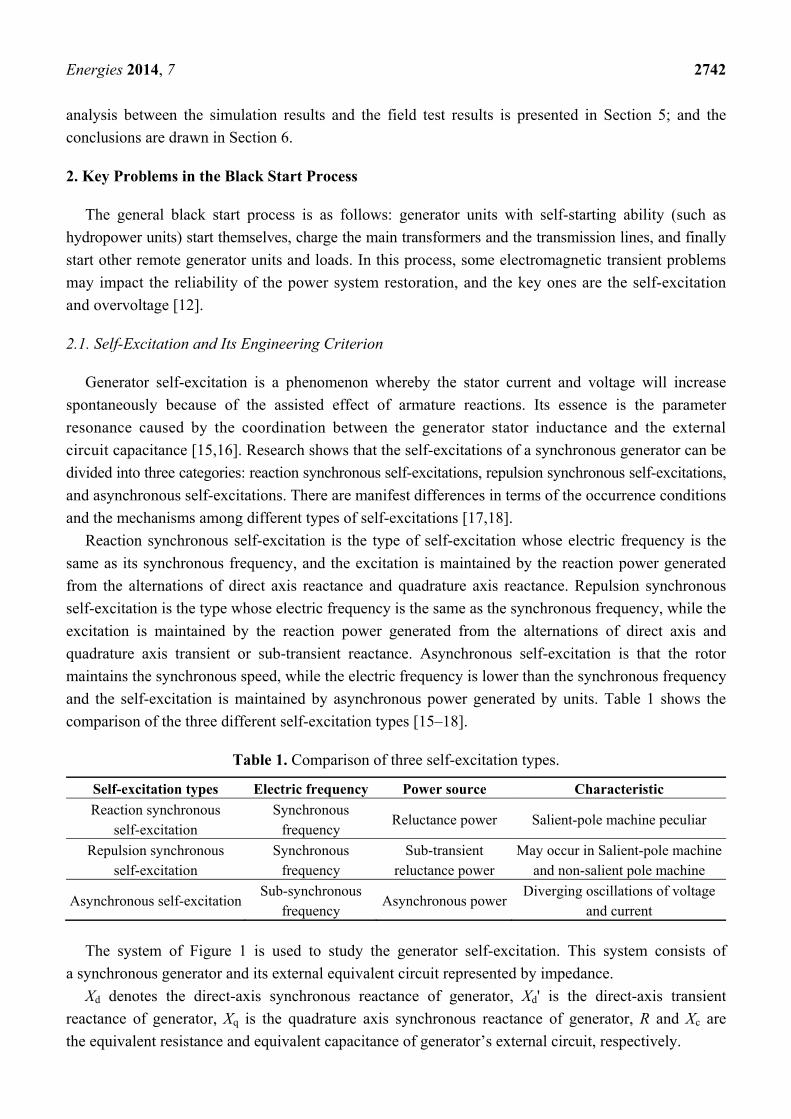
The system of Figure 1 is used to study the generator self-excitation. This system consists of
a synchronous generator and its external equivalent circuit represented by impedance.
Xd denotes the direct-axis synchronous reactance of generator, Xd' is the direct-axis transient
reactance of generator, Xq is the quadrature axis synchronous reactance of generator, R and Xc are
the equivalent resistance and equivalent capacitance of generator’s external circuit, respectively.
Energies 2014, 7 2743
Figure 1. System equivalent circuit.
X ,X ,X d ′d q
R X c
If the parameters R and Xc reach critical values, the system will experience voltage and current
spontaneous increase which is called self-excitation. The three different types of self-excitation are
addressed as follows [18].
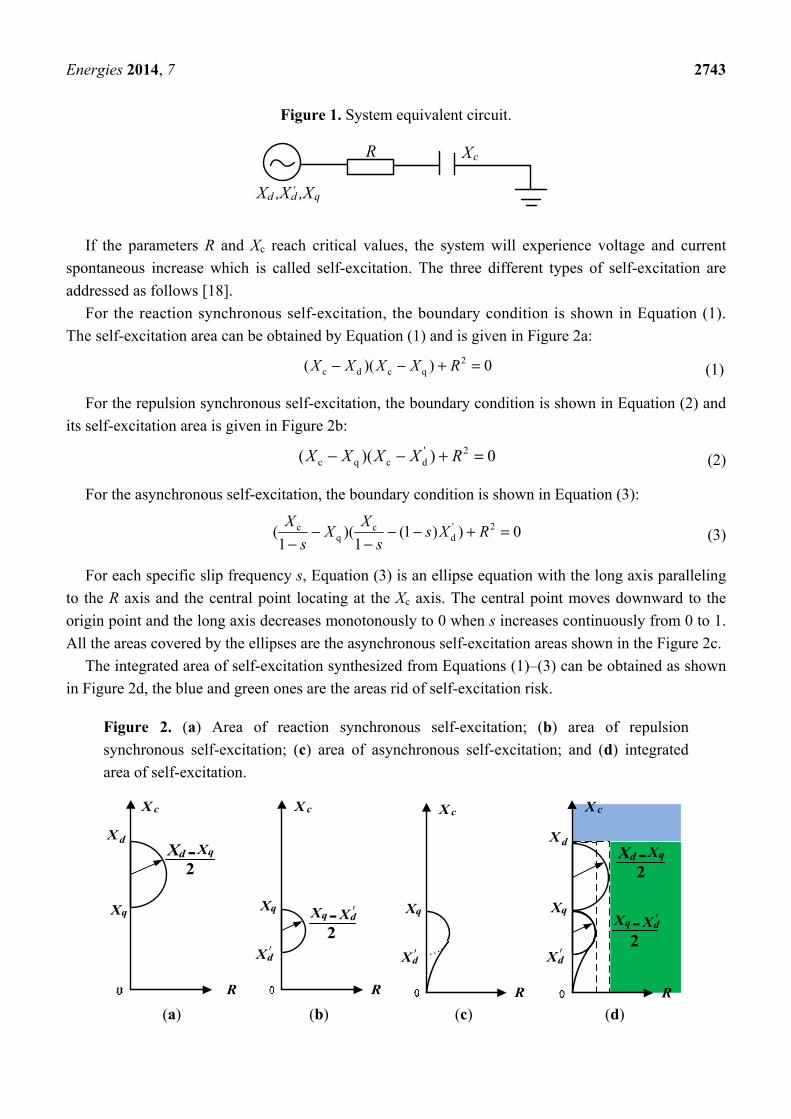
For the reaction synchronous self-excitation, the boundary condition is shown in Equation (1).
The self-excitation area can be obtained by Equation (1) and is given in Figure 2a:
2c d c q( )( ) 0X X X X R− − + = (1)
For the repulsion synchronous self-excitation, the boundary condition is shown in Equation (2) and
its self-excitation area is given in Figure 2b:
' 2c q c d( )( ) 0X X X X R− − + = (2)
For the asynchronous self-excitation, the boundary condition is shown in Equation (3):
' 2c cq d( )( (1 ) ) 0
1 1
X XX s X R
s s− − − + =
− − (3)
For each specific slip frequency s, Equation (3) is an ellipse equation with the long axis paralleling
to the R axis and the central point locating at the Xc axis. The central point moves downward to the
origin point and the long axis decreases monotonously to 0 when s increases continuously from 0 to 1.
All the areas covered by the ellipses are the asynchronous self-excitation areas shown in the Figure 2c.
The integrated area of self-excitation synthesized from Equations (1)–(3) can be obtained as shown
in Figure 2d, the blue and green ones are the areas rid of self-excitation risk.
Figure 2. (a) Area of reaction synchronous self-excitation; (b) area of repulsion
synchronous self-excitation; (c) area of asynchronous self-excitation; and (d) integrated
area of self-excitation.
X c
R
X d
Xq
-X d Xq
2
R
X ′d
Xq -2
Xq X ′d
X c
R
X ′d
Xq
X c
R
X ′d
Xq-2
Xq X ′d
X c
X d-X d Xq
2
(a) (b) (c) (d)

Energies 2014, 7 2744
The quick calculation method and the impedance method are widely used in engineering to check
the generator self-excitation [19]. The criterion of quick calculation method is shown in Table 2,
where Q is the generator capacity (unit: 10 MVA) and L is the length of the line (unit: 100 km).
Table 2. Criterion of quick calculation method.
Voltage of line Criterion of hydro-turbine Criterion of steam turbine
220 kV Q > 2 L Q > 4 L 500 kV Q > 15 L Q > 30 L
The criterion of impedance method is shown in Equation (4):
q c dX X X< < (4)
The quick calculation method criterion offers a rough estimation of the line capacitance, while
the impedance method criterion can only be used to check the reaction synchronous self-excitation and
does not consider the line equivalent resistances. For these reasons, a more comprehensive and
practical engineering criterion for self-excitation is proposed as in Equations (5) and (6):
c dX X> (5)
'd q q dmax{ , }
2 2
X X X XR
− −> (6)
Equation (5) corresponds to the blue area and Equation (6) to the green one in Figure 2d. If the
parameters of the generator and transmission lines satisfy one of Equations (5) and (6), any kind of
self-excitations will not occur during the process of charging the transmission line from the generator.
If self-excitation occurs, the spontaneous increases of the generator current and voltage will damage
the equipment and result in the failure of the black start. Hence, a comprehensive and practical
engineering criterion is needed to assess the risk of the self-excitation. The black start scheme should
be abandoned if a risk of self-excitation is detected by the criterion given in Equations (5) and (6).
2.2. Overvoltage
In the black start process, since the black start power sources are usually far away from the load
center, generator units are required to pick up loads through long lines, which demands a lot of
operations of switching on unloaded lines and may induce overvoltage problems such as the power
frequency overvoltage and the operating overvoltage [12,15].
Power frequency overvoltage is mainly caused by the capacitance effect of the unloaded long lines,
asymmetric grounding and the units’ sudden load rejection. In the process of the black start, the main
factor is the capacitance effect of the long unloaded lines. Power frequency overvoltage is a steady
overvoltage, characterized by small amplitude and normally causes no harm to ordinary insulated
electric equipment in a power system. However, the impact of the power frequency voltage is not
ignorable in the black start process, because its increment will directly affect the amplitude of the
operating overvoltage and the operating conditions of the protection equipment. Therefore, the power
frequency overvoltage problem in the unloaded lines should receive special attention in the black

Energies 2014, 7 2745
start process. According to the basic theory of the power system, the voltage of line terminal can be
easily deduced as shown in Equation (7) [20]:
( ) ( )1
2
s c s
2 2 c
1 γ γ
UU
Z Z Zch l sh l
Z Z Z
=
+ + +
(7)
where Zs is the equivalent impedance of power source; Z2 denotes the lumped parameter of the load;
Zc the characteristic impedance of the transmission line; γ and l the transmission coefficient and the
length of the line, respectively.
Operating overvoltage is a transient overvoltage caused by abrupt operations of breakers and switchers.
In the power system restoration, the line parameters are capacitive. Operating overvoltage is
powered by the system itself, and the voltage amplitude is related to the line attenuation and the power
frequency overvoltage level, i.e., the system parameters such as the system structure, line transmission
characteristics, line length, lightning arrester characteristics, closing resistor, soil resistivity,
paralleling compensation degree, etc. In general, the three most critical factors are: (1) the closing phase;
(2) the asynchronous closing of three phases; and (3) the line residual voltage. The overvoltage is the
largest under the closing phase α = ±90° and the theoretical value of closing overvoltage can reach
3.0 p.u. if there is residual voltage in the line.
3. The Dynamic Model of the FCB Unit
In the process of the power system failure and restoration, the unit parameters change dramatically [21].
The unit splitting from a power grid will cause a series of actions such as overspeed protection control
(OPC) action, power system stabilizer (PSS) operation exit, governor primary frequency regulation
exit, etc. These actions have a great impact on the stability of the unit in the FCB process and the
process of the unit paralleling in the power grid again. However, the existing prime mover models have
not considered the OPC part, the bypass system part and the switch of the governor control modes,
which makes the models applicable only for small disturbance simulation but not for large disturbance
cases such as FCB simulation. By using the No. 6 FCB unit in the Taishan power plant in China as
a prototype, this section will study and establish a dynamic model for the FCB unit, which can be
used to simulate the transient process of the FCB unit load rejection. The whole FCB dynamic
mathematical model should contain the following basic modules: the governor model, the servo
system model, the turbine model, and the generator model. The bypass system and extraction non-return
valve should also be considered in the turbine model. Under the FCB working condition, the pressure
of the boiler can be dredged through a bypass system, which ensures that the temperature and pressure
vibration amplitudes of the boiler stream are small. Therefore, the boiler steam can be regarded as
basically stable, and the influence of the boiler can be ignored in the FCB dynamic model. The whole
structure of the dynamic model is shown in Figure 3.
The FCB unit dynamic model mainly adds the regulating valve fast shut down system, the bypass
system that can affect the power output of the turbine, and the rotor speed control mode of the
governor under FCB condition. Compared with traditional unit models, there is no significant
difference in other parts such as the servo system and the generator.
Energies 2014, 7 2746
Figure 3. The whole structure of the fast cut back (FCB) unit dynamic model. PSS: power
system stabilizer.
GExcitation
systemPSS
Governor Servo system Turbine
PM
VF
∆ω,PE,PM,Pref
∆ω,Peo,Qeo
Vt
3.1. Turbine Model of the FCB Unit
The structure diagram of the traditional reheat condensing stream turbine and its corresponding
mathematical model given by the IEEE Committee are shown in Figures 4 and 5, respectively [22].
Figure 4. Structure diagram of traditional reheat condensing steam turbine. HP: high
pressure; IP: intermediate pressure; and LP: low pressure.
To condenser
From boiler
Axle
Reheater
Steam chest
Figure 5. The classical model of reheat condensing steam turbine.
In Figure 5, TCH, TRH, and TCO are time constants which represent delays due to the steam chest and
inlet piping, reheaters and crossover piping respectively. The fractions FHP, FIP and FLP represent
portions of the total turbine power developed in the various cylinders. More details such as typical
values can be found in literature [22]. This classical model is suitable for power system stability
studies such as small signal simulation, but not for the FCB condition simulation whose
Energies 2014, 7 2747
parameters change dramatically. Hence, it is necessary to develop the dynamic model suited for FCB
condition simulation.
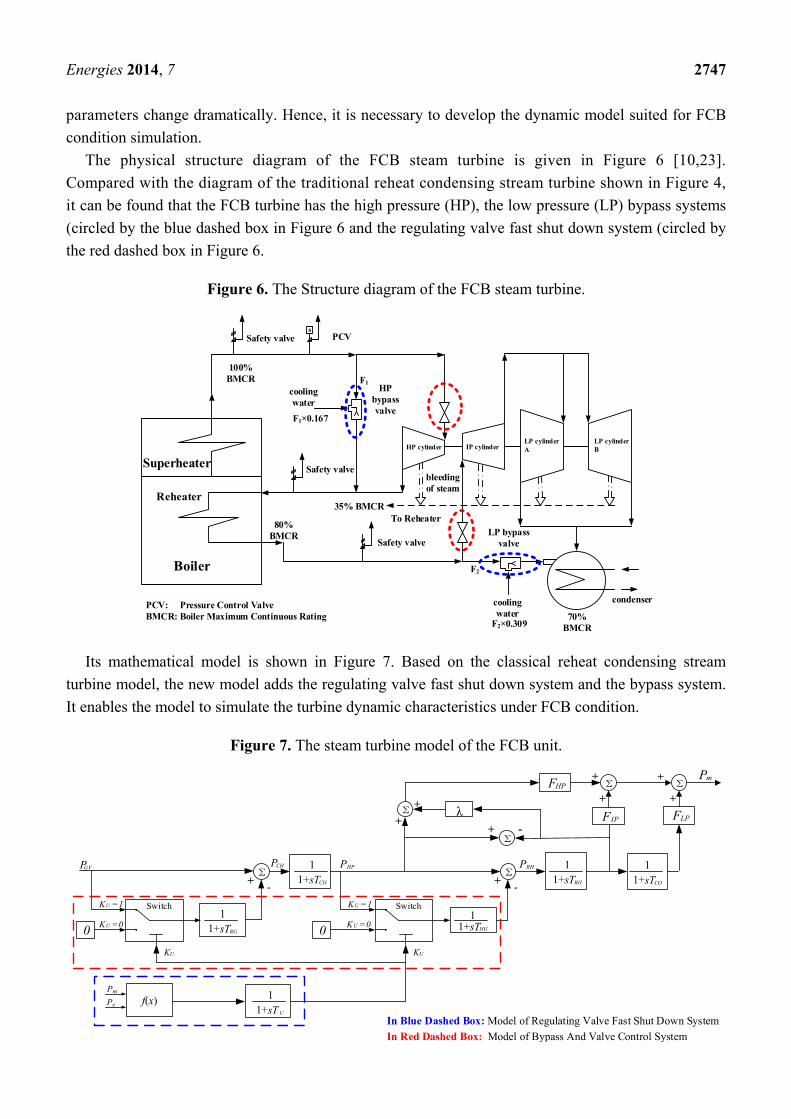
The physical structure diagram of the FCB steam turbine is given in Figure 6 [10,23].
Compared with the diagram of the traditional reheat condensing stream turbine shown in Figure 4,
it can be found that the FCB turbine has the high pressure (HP), the low pressure (LP) bypass systems
(circled by the blue dashed box in Figure 6 and the regulating valve fast shut down system (circled by
the red dashed box in Figure 6.
Figure 6. The Structure diagram of the FCB steam turbine.
s
Superheater
Reheater
Boiler
80% BMCR
35% BMCRTo Reheater
HP cylinder
F2
LP bypass valve
F2×0.30970%
BMCR
condenser
HP bypass valve
cooling water
F1
F1×0.167
100% BMCR
Safety valve PCV
Safety valve
cooling water
Safety valve bleeding of steam
IP cylinderLP cylinder A
LP cylinder B
PCV: Pressure Control ValveBMCR: Boiler Maximum Continuous Rating
Its mathematical model is shown in Figure 7. Based on the classical reheat condensing stream
turbine model, the new model adds the regulating valve fast shut down system and the bypass system.
It enables the model to simulate the turbine dynamic characteristics under FCB condition.
Figure 7. The steam turbine model of the FCB unit.
+
PGV
Σ
sT1
1+ CO
11+sT U
11+sTRG
Σ
-+
In Blue Dashed Box: Model of Regulating Valve Fast Shut Down System
In Red Dashed Box: Model of Bypass And Valve Control System
11+sTRH
11+sTCH
SwitchK =1U
K =0U0
KU
SwitchK =1U
K =0U0
KU
11+sTHG
Σ
-+
+
+ +
+ Pm
FIP FLP
Σ Σ
λ + -
Σ
+
FHP
f(x)Pm
Pe
PCH PHP PRH
Energies 2014, 7 2748
Parameters TCH, TRH, TCO, FHP, FIP, FLP and λ in Figure 7 are the same as those in Figure 5. PGV is
the valve opening given by servo system. KU is a logic signal which indicates whether the unit has
occurred load rejection, and it is generated by the regulating valve fast shut down system (circled by
the blue dashed box in Figure 7. The function f(x) represents the load rejection controller which is
detailed in Section 3.1.1. Pm and Pe are the mechanical power and the electromagnetic power of
the unit, time constant TU represents the motion delay of the regulating valve fast shut down system.
The model of bypass and valve control system (circled by the red dashed box in Figure 7) is addressed
in Section 3.1.2. Definitions for model symbols are presented in Table A1 of the Appendix.
3.1.1. Regulating Valve Fast Shut down System
There will be a load rejection if the generator or the main transformer trips suddenly, which will
cause a great increase of rotor speed. Once the load is cut off, the Digital Electro-Hydraulic Control
System (DEH) will send out the load rejection signal KU, the bypass will open quickly and the
governor will switch to the rotor speed control mode. After that, the stream flow in cylinder drop
quickly and the power output of the turbine drop correspondingly, which finally ensures that the speed
of the unit remains in a reasonable range. The main part of the regulating valve fast shut down system
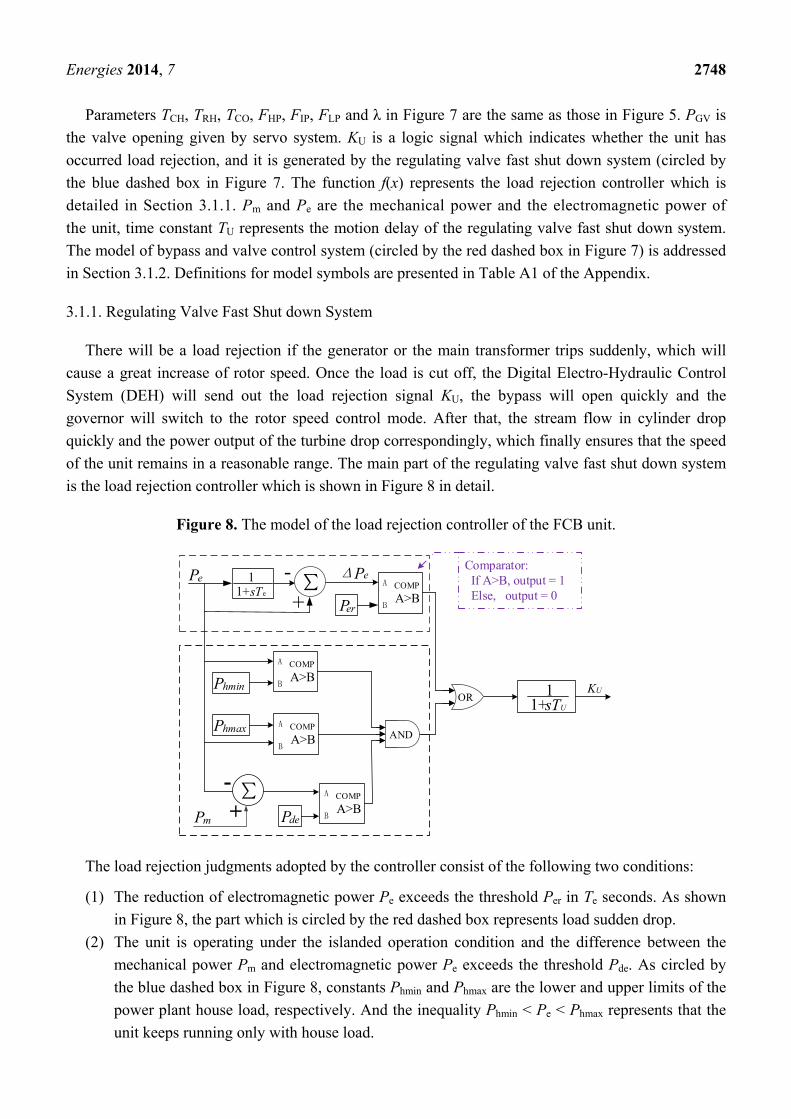
is the load rejection controller which is shown in Figure 8 in detail.
Figure 8. The model of the load rejection controller of the FCB unit.
∑-
+
∑-+
Pe ΔPe11+sTe
Per
COMP
A>BA
B
COMP
A>BA
B
ANDCOMP
A>BA
B
COMP
A>BA
BPde
11+sTU
KU
Pm
ORPhmin
Phmax
Comparator: If A>B, output = 1 Else, output = 0
The load rejection judgments adopted by the controller consist of the following two conditions:
(1) The reduction of electromagnetic power Pe exceeds the threshold Per in Te seconds. As shown
in Figure 8, the part which is circled by the red dashed box represents load sudden drop.
(2) The unit is operating under the islanded operation condition and the difference between the
mechanical power Pm and electromagnetic power Pe exceeds the threshold Pde. As circled by
the blue dashed box in Figure 8, constants Phmin and Phmax are the lower and upper limits of the
power plant house load, respectively. And the inequality Phmin < Pe < Phmax represents that the
unit keeps running only with house load.
Energies 2014, 7 2749
No matter which condition above is satisfied, the controller will send out the load rejection signal
KU to the governor, the servo system and the turbine to start FCB control.
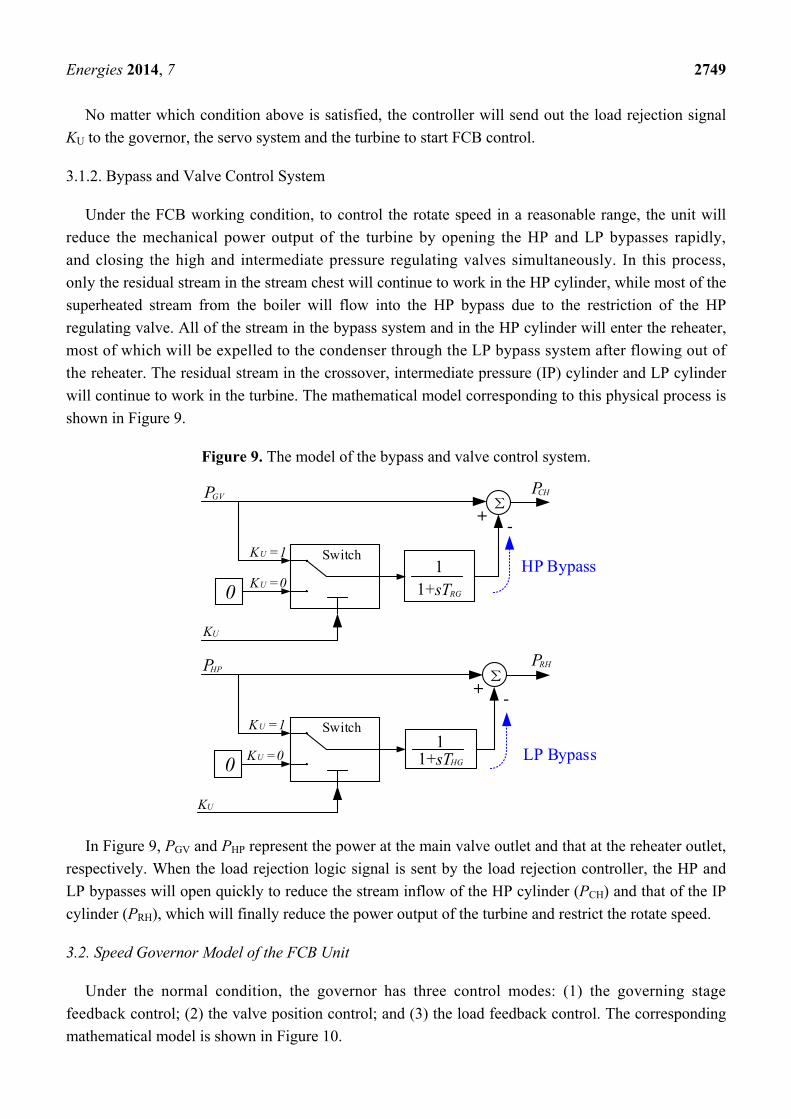
3.1.2. Bypass and Valve Control System
Under the FCB working condition, to control the rotate speed in a reasonable range, the unit will
reduce the mechanical power output of the turbine by opening the HP and LP bypasses rapidly,
and closing the high and intermediate pressure regulating valves simultaneously. In this process,
only the residual stream in the stream chest will continue to work in the HP cylinder, while most of the
superheated stream from the boiler will flow into the HP bypass due to the restriction of the HP
regulating valve. All of the stream in the bypass system and in the HP cylinder will enter the reheater,
most of which will be expelled to the condenser through the LP bypass system after flowing out of
the reheater. The residual stream in the crossover, intermediate pressure (IP) cylinder and LP cylinder
will continue to work in the turbine. The mathematical model corresponding to this physical process is
shown in Figure 9.
Figure 9. The model of the bypass and valve control system.
SwitchK =1U
K =0U0
KU
11+sTHG
Σ
-+
PGV
11+sTRG
Σ
-+
SwitchK =1U
K =0U0
KU
PCH
PRHPHP
HP Bypass
LP Bypass
In Figure 9, PGV and PHP represent the power at the main valve outlet and that at the reheater outlet,
respectively. When the load rejection logic signal is sent by the load rejection controller, the HP and
LP bypasses will open quickly to reduce the stream inflow of the HP cylinder (PCH) and that of the IP
cylinder (PRH), which will finally reduce the power output of the turbine and restrict the rotate speed.
3.2. Speed Governor Model of the FCB Unit
Under the normal condition, the governor has three control modes: (1) the governing stage
feedback control; (2) the valve position control; and (3) the load feedback control. The corresponding
mathematical model is shown in Figure 10.

Energies 2014, 7 2750
Figure 10. Traditional model of speed governor.
The first stage pressure feedback control loop
Load controller
Control mode select
When the unit enters the FCB working condition, the governor will quit the above three control
modes and switch to the rotor speed control mode. After the unit parallels in the grid again, the governor
will quit the rotor speed control mode and reenter one of the three above control modes. The mathematical
model of rotor speed control mode is given in Figure 11.
Figure 11. Speed controller model under FCB condition.
Δω
KPf
KIf /s
PCV
Kmax
Kmin
+
+1
1+sT1
The input parameter of the speed controller is the rotor speed deviation Δω and the output is the
gate position of the valve PCV. Time constant T1 represents the delay of the measurement.
Constants KPf and KIf are the parameters of the proportional integral (PI) controller.
4. Introduction of the FCB Unit Load Rejection and Black Start Field Test
In July 2013, a FCB 50% load rejection and 500 kV transmission line black start field test was
carried out in the Taishan thermal power plant of China Southern Power Grid (CSG). The purpose
of the field test was to simulate the process of the FCB unit splitting from the power grid and
switching to islanded operation after the blackout, then serving as the initial power source to
restore the unpowered grid. The field test consisted of three parts: (1) the FCB unit load rejection test;
(2) the rising voltage from zero test; and (3) the 90% voltage charging unloaded line test. The related
test equipment concludes the No. 6 unit in Taishan thermal power plant, the boosting transformer
of the unit, the “GFC” 500 kV transmission line and the corresponding switches. The No. 6 unit is
a 1000 MW FCB unit with islanded operation function. After splitting from the power grid, it can

Energies 2014, 7 2751
continue islanded operation from 5 min to several hours under 3% rated load (house load). The generator
voltage is 27 kV. The single line diagram of the field test is shown in Figure 12.
Figure 12. Single line diagram of the field test.
G5041
3M 4M
G
M
5051
1M 2M
50525042 5043
M
#7 Unit
#6 FCB Unit
House Load
Taishan thermal power plant
GuiFeng substation
“GFA” Line
“GFC” Line500kV, 72km
“GFD” Line
Before the field test, the Breakers 5041 and 5051 were closed and the Breakers 5042, 5043 and
5052 were in hot standby state. The steps of the field test are shown in detail in Figure 13.
Figure 13. Steps of the field test.
Step 1: Adjust the unit output to 50%
Step 2: Switch off the breaker 5041
Step 3: Wait until all equipment are steady
Step 4: Switch on the breaker 5041
Step1: Switch off the breakers 5041 and 5051
Step 2: switch the excitation system to manual control mode.
Step 3: Adjust the generator voltage to the minimum
Step 4: Switch on the breaker 5042
Step 5: Raise the generator voltage to the rated value slowly
Step1: Switch off the breakers 5042
Step 2: Switch the excitation system to automatic control mode.
Step 3: Boost the generator voltage to 90% rated value
Step 4: Switch on the breaker 5042
Step 5: Switch off the breaker 5042
Step 6: Switch on the breaker 5051, 5052 and 5043 one by one
Step 7: Switch on the breaker 5042
Steps of the 50% Load Rejection Field Test Steps of the Raising Voltage
from Zero Field Test
Steps of the 90% Voltage Charging Unloaded Line Field Test
Energies 2014, 7 2752
4.1. The Field Test of 50% Load Rejection for the FCB Unit
This field test simulates the process of the FCB unit splitting from the power grid and switching to
islanded operation after the blackout. Before the test, the regenerative system and the interlock
protection of the unit have been put into operation. After the FCB function of the unit is triggered,
the boiler reduces to 48% rated load and keeps running steadily, the HP bypass valve and LP bypass
valve open quickly, the steam temperature and steam pressure keep in the normal range, and the rotor
speed remain stable at the rated value after a peak. The test consists of four steps as follows:
Step 1: Adjust the unit output to 50% and wait until it runs steadily for 2 h. Since it is the first time
to do the load rejection field test on the No. 6 unit, for safety reasons, this test is carried out
under the 50% rated capacity of the unit.
Step 2: Switch off the breaker 5041 and trigger FCB logic of the unit. Before the field test, the
Breaker 5042 is open and the No. 6 unit connects to the power grid by the Breaker 5041.
Once the Breaker 5041 is opened, the FCB logic will be triggered and the No. 6 unit will
enter to the FCB working condition.
Step 3: Wait until all equipment are steady. There will be a dramatic change in behaviors of the unit
under the FCB condition and time is needed to stabilize the unit for the next step. For the
No. 6 unit, the minimum time required is 5 min.
Step 4: Switch on the Breaker 5041. The FCB unit can reconnect to the power grid at any time once
the unit is stable.
4.2. The Field Test of Rising Voltage from Zero
This field test is carried out after the 50% load rejection test. In the process of the black start, it is
common that the unit picks up the load through a long transmission line which may induce
generator self-excitation. This field test is designed to check the self-excitation of the No. 6 FCB unit
and consists of five steps as follows:
Step 1: Switch off the Breakers 5041 and 5051 manually one by one. Before this test, the unit
and the “GFC” line connects to the power grid by Breakers 5041 and 5051, respectively.
After these two breakers are opened, the unit and “GFC” line are split from the grid.
Step 2: Switch the No. 6 excitation system to manual control mode.
Step 3: Adjust the generator voltage to the minimum.
Step 4: Switch on the Breaker 5042 and the No. 6 unit connects to the “GFC” line.
Step 5: Raise the generator voltage to the rated value slowly. In this step, once the phenomenon of
the generator self-excitation is detected, emergency measures such as de-excitation should
be taken and the test should be stopped.
4.3. The 90% Voltage Charging Unloaded Line Field Test
Inevitably, there will be a lot of operations of switching on unloaded lines in the process of the
black start which may induce overvoltage problems and lead to failure of the black start. The purpose

Energies 2014, 7 2753
of this field test is to study the operating overvoltage problem in the process of the black start and the
test consists of seven steps as follows:
Step 1: Switch off the Breaker 5042. The unit and the “GFC” line are disconnected.
Step 2: Switch the excitation system to automatic control mode and close the excitation switch.
Step 3: Boost the generator voltage to 90% rated value. In this step, the generator voltage should be
monitored closely and be controlled within the normal range.
Step 4: Switch on the Breaker 5042 manually and charge the “GFC” line by the No. 6 unit.
Step 5: Switch off the Breaker 5042.
Step 6: Switch on the breaker 5051 and charge the “GFC” line by the Guifeng substation. Switch on
the Breakers 5052 and 5043.
Step 7: Ensure that the No. 6 unit runs normally and then close the Breaker 5042. The No. 6 unit
reconnects to the power grid and the field test is completed successfully.
5. Simulation and Test Result Analysis
5.1. Simulation Model
According to the field test, a simulation model based on PSCAD/EMTDC has been built and its
structure diagram is shown in Figure 14. The parameters for the simulation model are presented in
Table A1–A4 of the Appendix.
Figure 14. Model structure diagram.
G
House Load
Arrester
FCB Unit Line
Breaker
Transformer
The FCB unit model is described in Section 3. The type of the excitation system is UNITROL 5000
produced by ABB company (Zurich, Switzerland) and its mathematical model is the FQ type
exciter model. In a black start, the process of charging the unloaded lines is an electromagnetic
transient process of a distributed parameter circuit. In other words, it is a wave process. The Bergeron
model can be applied to simulate this wave process. Arresters are added in terminals of both
transmission lines. The six order model is used for the generator model, the IEEE PSS2A type model
for the PSS and the constant power load model for the house load.
5.2. Analysis for the Load Rejection Test
Before the load rejection test, the generator power output was 500 MW. After the breaker tripped,
the unit entered the islanded operation condition to supply power for the house load (about 30 MW).
The rotor speed was 3001 r/min before load rejection. After the breaker tripped, the speed

Energies 2014, 7 2754
increased drastically, and the unit closed the HP and IP regulating valves, opened the HP and the LP
bypass system, and switched the governor to speed control mode. The rotor speed peaked at 3061 r/min
in 1.1 s after load rejection. Then the HP and IP regulating valves reopened slowly and the speed
tended to be steady after 22 s. Finally, the speed kept steady at 2995 r/min. The comparisons of
waveforms between the field test and the simulation are shown in Figure 15.
Figure 15. Waveform comparison of: (a) Pe; and (b) rotor speed.
Field TestSimulation
Field TestSimulation
(a) (b)
The rotor speed of the unit didn’t increase again after the first peak and decreased steadily without
repeated jitter. The FCB unit ran steadily in the load rejection process, which satisfied the basic
requirements as a black start power source in the system restoration. The simulation results coincided
with the field test results well, which verified the correctness of the built FCB model.
5.3. Analysis for the Raising Voltage from Zero Test
Base on the parameters of the synchronous generator, the transformer and the “GFC” line which
are presented in the Appendix, the generator external equivalent impedance Zin can be calculated by
Equation (8):
in c
a T T
B L L B
3
11 1
2 ( 2 )
3.113 10 13.802
Z R jX
R R jX
j X R j X X
j−
= −
= + + +− +
+ −
= × −
(8)
where Xc > Xd. According to self-excitation criterion presented by Equations (5) and (6), the generator
would not undergo self-excitation.
The rising voltage from zero test was carried out to check whether the unit would occur self-excitation
practically. The measured data are listed in the Table 3.
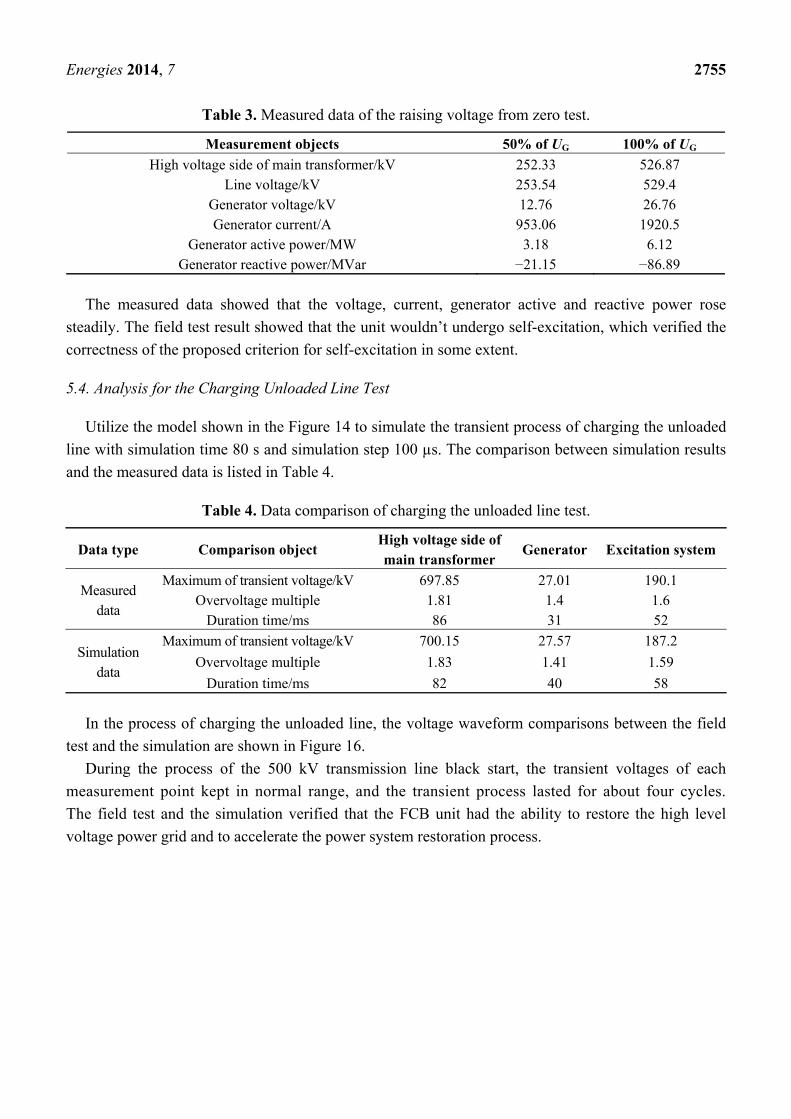
Energies 2014, 7 2755
Table 3. Measured data of the raising voltage from zero test.
Measurement objects 50% of UG 100% of UG
High voltage side of main transformer/kV 252.33 526.87 Line voltage/kV 253.54 529.4
Generator voltage/kV 12.76 26.76 Generator current/A 953.06 1920.5
Generator active power/MW 3.18 6.12 Generator reactive power/MVar −21.15 −86.89
The measured data showed that the voltage, current, generator active and reactive power rose
steadily. The field test result showed that the unit wouldn’t undergo self-excitation, which verified the
correctness of the proposed criterion for self-excitation in some extent.
5.4. Analysis for the Charging Unloaded Line Test
Utilize the model shown in the Figure 14 to simulate the transient process of charging the unloaded
line with simulation time 80 s and simulation step 100 µs. The comparison between simulation results
and the measured data is listed in Table 4.
Table 4. Data comparison of charging the unloaded line test.
Data type Comparison object High voltage side of main transformer
Generator Excitation system
Measured data
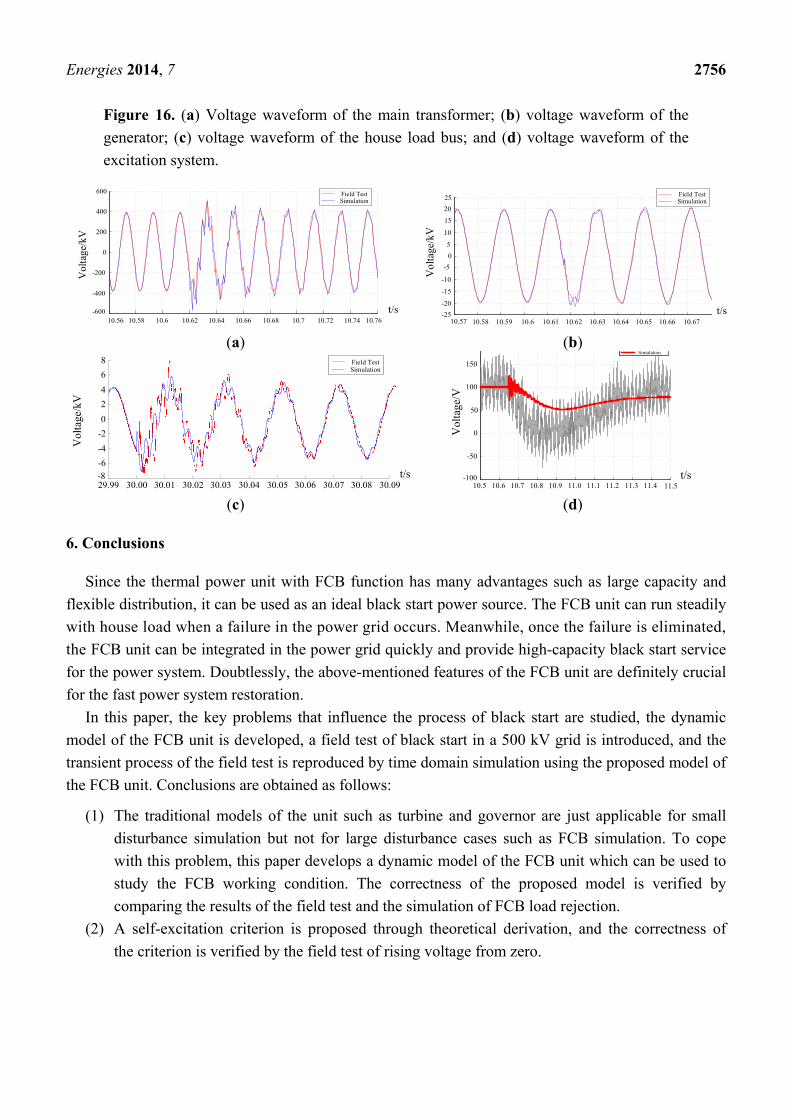
Maximum of transient voltage/kV 697.85 27.01 190.1 Overvoltage multiple 1.81 1.4 1.6
Duration time/ms 86 31 52
Simulation data
Maximum of transient voltage/kV 700.15 27.57 187.2
Overvoltage multiple 1.83 1.41 1.59
Duration time/ms 82 40 58
In the process of charging the unloaded line, the voltage waveform comparisons between the field
test and the simulation are shown in Figure 16.
During the process of the 500 kV transmission line black start, the transient voltages of each
measurement point kept in normal range, and the transient process lasted for about four cycles.
The field test and the simulation verified that the FCB unit had the ability to restore the high level
voltage power grid and to accelerate the power system restoration process.
Energies 2014, 7 2756
Figure 16. (a) Voltage waveform of the main transformer; (b) voltage waveform of the
generator; (c) voltage waveform of the house load bus; and (d) voltage waveform of the
excitation system.
10.56 10.58 10.6 10.62 10.64 10.66 10.68 10.7 10.72 10.74 10.76-600
-400
-200
0
200
400
600
t/s
Vol
tage
/kV
Field TestSimulation
10.57 10.58 10.59 10.6 10.61 10.62 10.63 10.64 10.65 10.66 10.67-25
-20
-15
-10
-5
0
5
10
15
20
25
t/s
Field TestSimulation
Vol
tage
/kV
(a) (b)
29.99 30.00 30.01 30.02 30.03 30.04 30.05 30.06 30.07 30.08 30.09 -8-6
-4
-2
0
2
4
6
8
t/s
Vol
tage
/kV
Field TestSimulation
10.5 10.6 10.7 10.8 10.9 11.0 11.1 11.2 11.3 11.4 11.5-100
-50
0
50
100
150
Simulation
t/s
Vol
tage
/V
(c) (d)
6. Conclusions
Since the thermal power unit with FCB function has many advantages such as large capacity and
flexible distribution, it can be used as an ideal black start power source. The FCB unit can run steadily
with house load when a failure in the power grid occurs. Meanwhile, once the failure is eliminated,
the FCB unit can be integrated in the power grid quickly and provide high-capacity black start service
for the power system. Doubtlessly, the above-mentioned features of the FCB unit are definitely crucial
for the fast power system restoration.
In this paper, the key problems that influence the process of black start are studied, the dynamic
model of the FCB unit is developed, a field test of black start in a 500 kV grid is introduced, and the
transient process of the field test is reproduced by time domain simulation using the proposed model of
the FCB unit. Conclusions are obtained as follows:
(1) The traditional models of the unit such as turbine and governor are just applicable for small
disturbance simulation but not for large disturbance cases such as FCB simulation. To cope
with this problem, this paper develops a dynamic model of the FCB unit which can be used to
study the FCB working condition. The correctness of the proposed model is verified by
comparing the results of the field test and the simulation of FCB load rejection.
(2) A self-excitation criterion is proposed through theoretical derivation, and the correctness of
the criterion is verified by the field test of rising voltage from zero.

Energies 2014, 7 2757
Acknowledgments
This work was supported by Special Fund of Key Science and Technology Projects of Gruangdong
Power Grid Corporation, China (K-GD2011-553).
Author Contributions
Kaiwen Zeng and Longpeng Ma built the dynamic model of the FCB unit and performed the
simulations. En Lu and Ning Wang designed the field test scheme. This work was carried out under the
advisement of and with regular feedback from Jinyu Wen and Shijie Cheng. All authors carried out
data analysis, discussed the results and contributed to writing the paper.
Appendix: Definitions and Values for Model Symbols
In addition to the special instructions, values in the following tables are based on a per unit system
in which speed, valve or gate position, power and impedance are in per unit of rated values. Time constants
are in seconds.
Table A1. Steam turbine model symbols in Figures 7–9.
Symbol Description Value
TCH Steam chest time constant (control valves to HP exhaust) 0.2456 TRH Reheat time constant (HP exhaust to IP exhaust) 9.8957 TCO Crossover time constant (IP exhaust to LP exhaust) 0.6855 FHP HP turbine power fraction 0.2524 FIP IP turbine power fraction 0.2560 FLP LP turbine power fraction 0.4916 λ Natural power overshooting coefficient of HP cylinder 0.6766
TRG HP bypass time constant 0.02 THG LP bypass time constant 0.02 TU Valve fast shut down time system constant 0.08 Te Electromagnetic power delay time constant 0.1 Per Decrement threshold of electromagnetic power 0.875
Pde. Unbalance threshold of electromagnetic power and mechanical power 0.12 Phmin Lower limit of the power plant house load −0.01 Phmax Upper limit of the power plant house load 0.12 PGV Power at gate or valve outlet - PCH Power at steam chest - PHP Power at reheater outlet - PRH Power at intermediate valve outlet - Pm Mechanical (shaft) power - Pe Electromagnetic power - KU Logic signal of load rejection -

Energies 2014, 7 2758
Table A2. Speed controller model symbols in Figure 11. PI: proportional integral.
Symbol Description Value
T1 Measurement delay time constant 0.02 KPf Proportional gain constant of PI controller 35 KIf Integral gain of PI controller 1.0
Kmin Lower limit of gate position 0 Kmax Upper limit of gate position 1.0 Δω Speed deviation - PCV Gate position -
Table A3. Generator model parameters for PSCAD/EMTDC simulation.
Symbol Description Value
PG Rated real power (MW) 1000 UG Rated voltage (kV) 27
cosφ Rated power factor 0.9 N Rated rotor speed (r/min) 3000 Ra Armature resistance 8.22 × 10⁻⁴ Xd. D-axis unsaturated reactance 2.614 Xd' D-axis unsaturated transient reactance 0.264 Xd'' D-axis unsaturated sub-transient reactance 0.225 Xq. Q-axis unsaturated reactance 2.484 Xq' Q-axis unsaturated transient reactance 0.641 Xq'' Q-axis unsaturated sub-transient reactance 0.248 Tj. Inertia constant (s) 3.5
Table A4. Other parameters for PSCAD/EMTDC simulation.
Symbol Description Value
PHL Equivalent load real power of house load (MW) 30 QHL Equivalent load reactive power of house load (MVAr) 27 RT Resistance of the main transformer 5.59 × 10⁻⁴ XT Reactance of the main transformer 0.163 RL Resistance of the “GFC” line 6.9 × 10⁻³ XL Reactance of the “GFC” line 0.089 XB Susceptance of the “GFC” line 27.975
Conflicts of Interest
The authors declare no conflict of interest.
References
1. Chen, Q.; Mili, L. Composite power system vulnerability evaluation to cascading failures using
importance sampling and antithetic variates. IEEE Trans. Power Syst. 2013, 28, 2321–2330.
2. Henneaux, P.; Labeau, P.E.; Maun, J.C. Blackout probabilistic risk assessment and thermal
effects: Impacts of changes in generation. IEEE Trans. Power Syst. 2013, 28, 4722–4731.

Energies 2014, 7 2759
3. U.S.–Canada Power System Outage Task Force; Final Report on the August 14, 2003
Blackout in the United States and Canada: Causes and Recommendation; Minister of Natural
Resources Canada: Ottawa, ON, Canada, 2004.
4. Report of the Enquiry Committee on Grid Disturbance in Northern Region on 30th July 2012 and
in Northern, Eastern & North-Eastern Region on 31st July 2012; Enquiry Committee: New Delhi,
India, 2012.
5. Adibi, M.M.; Alexander, R.W.; Avramovic, B. Overvoltage control during restoration. IEEE Trans.
Power Syst. 1992, 7, 1464–1470.
6. Feltes, J.W.; Grande-Moran, C. Black Start Studies for System Restoration. In Proceedings of the
Power and Energy Society General Meeting—Conversion and Delivery of Electrical Energy in
the 21st Century, Pittsburgh, PS, USA, 20–24 July 2008.
7. Datta, S.; Kolluri, S.; He, T.; Khodabakhchian, B. Development of an Alternative Black-Start
Plan for System Restoration. In Proceedings of the IEEE PES Power Systems Conference and
Exposition, PSCE '06, Atlanta, GA, USA, 29 October–1 November 2006; pp. 1833–1839.
8. Adibi, M.M.; Milanicz, D.P.; Volkmann, T.L. Remote cranking of steam electric stations.
IEEE Trans. Power Syst. 1996, 11, 1613–1618.
9. Lindstrom, R.R. Simulation and field tests of the black start of a large coal-fired generating
station utilizing small remote hydro generation. IEEE Trans. Power Syst. 1990, 5, 162–168.
10. Kitada, M.; Masuya, T.; Tanaka, H. Experimental house load operation at Tanagawa No. 2 oil-fired
power station. IEEE Trans. Power Appar. Syst. 1981, PAS-100, 2796–2803.
11. Adibi, M.M.; Fink, L.H. Overcoming restoration challenges associated with major power system
disturbances-Restoration from cascading failures. IEEE Power Energy Mag. 2006, 4, 68–77.
12. Adibi, M.M.; Martins, N. Power System Restoration Dynamics Issues. In Proceedings of the 2008
IEEE Power and Energy Society General Meeting—Conversion and Delivery of Electrical Energy
in the 21st Century, Pittsburgh, PS, USA, 20–24 July 2008.
13. Lu, E.; Qin, Z.; Liu, M.; Hou, Y.; Wang, N.; Wen, J. Increasing black start capacity by fast cut
back function of thermal power plants. Int. J. Smart Grid Clean Energy 2013, 2, 60–66.
14. Lu, E.; Wang, N.; Qin, Z.; Liu, H.; Hou, Y. Black-Start Strategy for Power Grids including Fast
Cut Thermal Power Units. In Proceedings of the 2013 IEEE Power and Energy Society General
Meeting (PES), Vancouver, BC, Canada, 21–25 July 2013; pp. 1–5.
15. Wang, H.; Liu, Y. Generator Field Overvoltages due to Energizing Lines. In Proceedings of the
International Conference on Power System Technology, PowerCnon 2002, Kunming, Yunnan,
China, 13–17 October 2002; Volume 4, pp. 2122–2125.
16. Machowski, J.; Bialek, J.W.; Bumby, J.R. Power System Dynamic: Stability and Control, 2nd ed.;
John Wiley & Sons: Chichester, UK, 2008; pp. 329–334.
17. Xue, S.; He, J.; Xu, L.; Sun, J. Study of Self-Excitation Over-Voltage and Switching Over-Voltage
and Their Suppression Measure in Ultra-High Long Distance Transmission Lines. In Proceedings
of the 2011 Asia-Pacific Power and Energy Engineering Conference (APPEEC), Wuhan, Hubei,
China, 25–28 March 2011; pp. 1–4.
18. Fusheng, L.; Ronghan, J. Vector analysis of self-excitation of synchronous generators. Proc. CSEE
1987, 7, 67–73. (In Chinese)
Energies 2014, 7 2760
19. Xu, Y. The Practical Criterion of Generator Self Excitation and Its Field Example Analysis.
In Proceedings of the IEEE Region 10 Conference on Computer, Communication, Control and
Power Engineering (TENCON 1993), Beijing, China, 19–21 October 1993; Volume 5, pp. 1–4.
20. Begamudre, R.D. Extra High Voltage A.C. Transmission Engineering, 3rd ed.; New Age
International: New Delhi, India, 2006; pp. 318–323.
21. De Mello, F.P.; Westcott, J.C. Steam plant startup and control in system restoration. IEEE Trans.
Power Syst. 1994, 9, 93–101.
22. IEEE Committee Report. Dynamic models for steam and hydro turbines in power system studies.
IEEE Trans. Power Appar. Syst. 1973, PAS-92, 1904–1915.
23. Wang, L.; Yang, Y.; Morosuk, T.; Tsatsaronis, G. Advanced thermodynamic analysis and
evaluation of a supercritical power plant. Energies 2012, 5, 1850–1863.
© 2014 by the authors; licensee MDPI, Basel, Switzerland. This article is an open access article
distributed under the terms and conditions of the Creative Commons Attribution license
(http://creativecommons.org/licenses/by/3.0/).