Embed Size (px)
Citation preview
Int. J. Reliability and Safety, Vol. 9, No. 1, 2015 51
Copyright © 2015 Inderscience Enterprises Ltd.
Calibration of partial safety factors for offshore foundation design
Farrokh Nadim* Norwegian Geotechnical Institute (NGI), P.O. Box 3930 Ullevaal Stadion, N-0806, Oslo, Norway Email: [email protected] *Corresponding author
Young Jae Choi NGI Houston, 2000 S. Dairy Ashford Suite #322, Houston, Texas, 77494, USA Email: [email protected]
Suzanne Lacasse and Zhongqiang Liu Norwegian Geotechnical Institute (NGI), P.O. Box 3930 Ullevaal Stadion, N-0806, Oslo, Norway Email: [email protected] Email: [email protected]
Abstract: The foundation of an offshore installation is designed to resist the static and dynamic loads it is subjected to during its lifetime. The design codes specify combinations of load factor on the static load, load factor on the dynamic load, and resistance factor on the soil resistance, with reference to the ‘characteristic’ loads acting on the foundation and the ‘characteristic’ foundation capacity. In principle, the designer aims at achieving a target annual failure probability. Whether or not the load and resistance factors specified in the design codes actually achieve a target annual probability of failure depends on the type of installation, the load characteristics, the soil characteristics, the analysis method(s) and the relative importance of static and dynamic loads. The paper calculates the load and resistance factors required for a target annual failure probability of 1 × 10⁻⁴. The calculated load and resistance factors are then compared with the values required by three offshore design guidelines and codes: API LRFD (2003), ISO 19902 (2007) and NORSOK (2004).
Keywords: reliability-based design; offshore foundation; load factor; resistance factor; code calibration.
Reference to this paper should be made as follows: Nadim, F., Choi, Y.J., Lacasse, S. and Liu, Z.Q. (2015) ‘Calibration of partial safety factors for offshore foundation design’, Int. J. Reliability and Safety, Vol. 9, No. 1, pp.51–69.
52 F. Nadim et al.
Biographical notes: Farrokh Nadim is Technical Director at NGI Oslo. He was Director of NGI’s Centre of Excellence, International Centre for Geohazards (ICG) between 2003 and 2012. He has experience with research, consulting and university teaching. His areas of expertise include geotechnical earthquake engineering, offshore foundation design, dynamic soil behaviour, landslides, hazard and risk assessment, and risk management.
Young Jae Choi is a Senior Geotechnical Engineer at NGI Houston. He has wide experience with offshore-related geotechnical design, and has worked extensively on both consulting and research projects. His key fields of expertise related to offshore projects include foundation design, risk and reliability analysis and geohazards study.
Suzanne Lacasse is Technical Director at NGI Oslo. She was Managing Director of NGI between 1991 and 2011. She has experience with research, consulting and university teaching. Her expertise within geotechnical engineering include laboratory and in situ testing, soil behaviour (static and cyclic loading), shallow and deep foundation design, slope stability, hazard and risk assessment, and risk management.
Zhongqiang Liu is a Geotechnical Project Engineer at NGI Oslo. He has broad experience with geohazards and geotechnical risk assessment. His major fields of expertise include reliability-based design of geotechnical structures, geotechnical uncertainty quantification and risk assessment, stability analyses of natural slopes and geohazards.
This paper is a revised and expanded version of a paper entitled ‘Calibration of partial safety factors for foundation design of offshore structures’ presented at the ‘11th International Conference on Structural Safety and Reliability’, New York, USA, 16–20 June 2013.
1 Introduction
Ensuring adequate safety under severe loading conditions is necessary for offshore installations. The foundation must be designed to resist various combinations of static loads, Ps (weight of superstructure, buoyancy, …) and dynamic loads (wave loading during severe storms, earthquake, ship impact, …), Pd. The design equation in most offshore guidelines and standards has the following format:
1Ps + 2Pd < Qult / m (1)
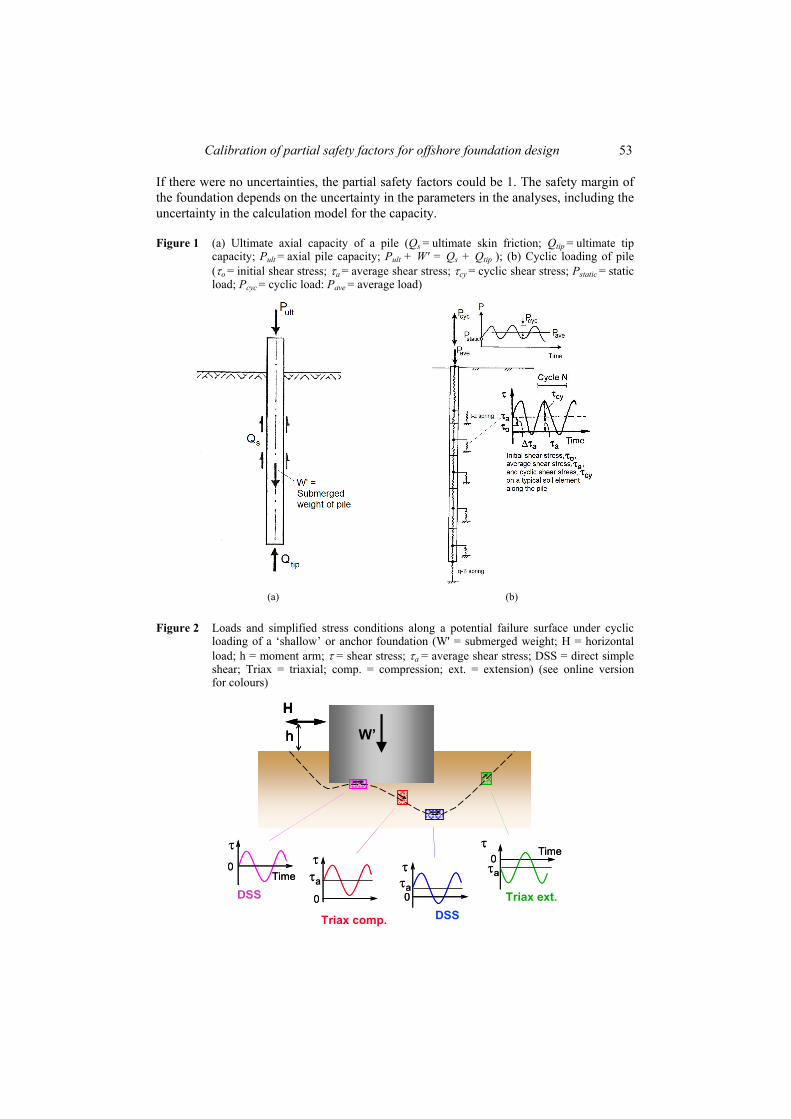
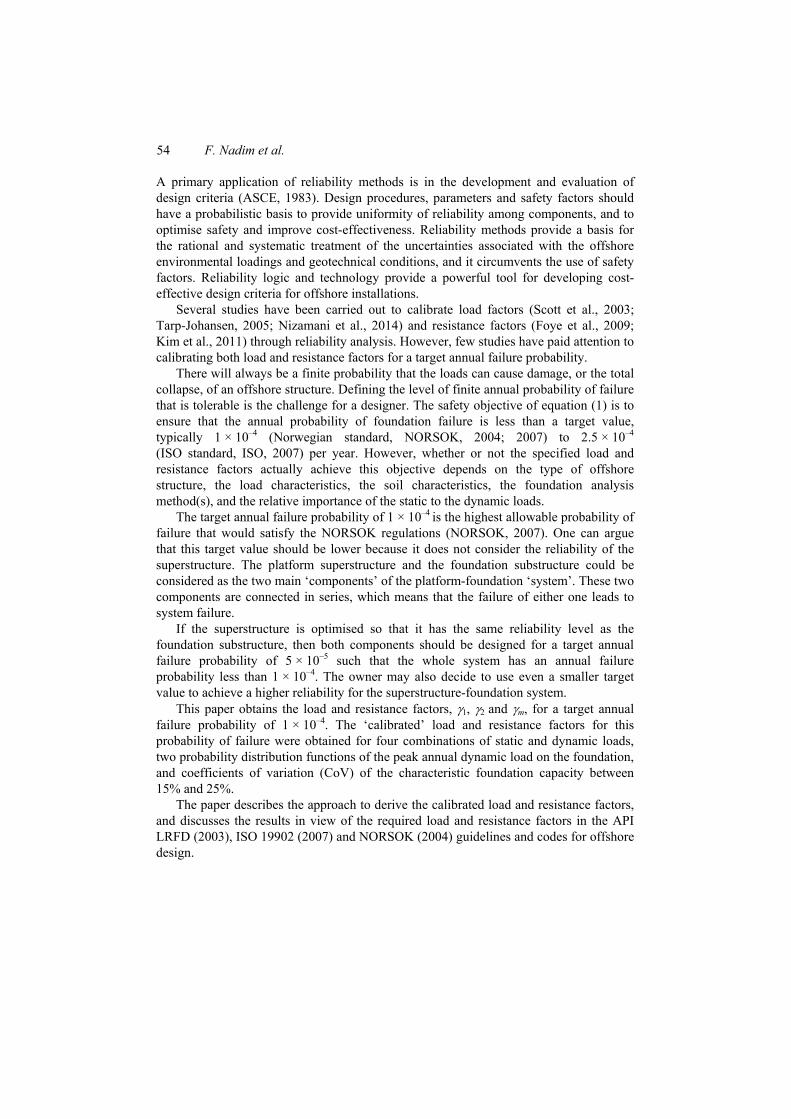
where 1 is the load factor on the characteristic static load, 2 is the load factor on the characteristic dynamic load, m is the resistance factor, and Qult is the characteristic foundation capacity under the applied loads. The return period for Pd depends on the limit state considered. A return period of 100 years is typically used for checking the ultimate limit state of offshore structures in the North Sea. Figures 1 and 2 describe graphically the typical loads on a pile in a jacket offshore and on a ‘shallow’ or anchor foundation. In Figure 1, Ps = Pstatic + W' and Pd = Pave + Pcyc – Pstatic, while in Figure 2, Ps = W' and Pd = H.
Risk is an unavoidable consideration for offshore platforms and is a result or consequence of uncertainty. The designer compensates for the uncertainties by introducing appropriate ‘partial safety factors’ (i.e. 1, 2 and m in equation 1) in design.
Calibration of partial safety factors for offshore foundation design 53
If there were no uncertainties, the partial safety factors could be 1. The safety margin of the foundation depends on the uncertainty in the parameters in the analyses, including the uncertainty in the calculation model for the capacity.
Figure 1 (a) Ultimate axial capacity of a pile (Qs = ultimate skin friction; Qtip = ultimate tip capacity; Pult = axial pile capacity; Pult + W' = Qs + Qtip ); (b) Cyclic loading of pile (o = initial shear stress; a = average shear stress; cy = cyclic shear stress; Pstatic = static load; Pcyc = cyclic load: Pave = average load)
(a) (b)
Figure 2 Loads and simplified stress conditions along a potential failure surface under cyclic loading of a ‘shallow’ or anchor foundation (W' = submerged weight; H = horizontal load; h = moment arm; = shear stress; a = average shear stress; DSS = direct simple shear; Triax = triaxial; comp. = compression; ext. = extension) (see online version for colours)
H
W’h
Triax ext.DSS
DSS
Time
0a
0 0
0
a
a
Time
Triax comp.
H
W’h
H
W’h
Triax ext.DSS
DSS
Time
0a
0 0
0
a
a
Time
Triax comp.
54 F. Nadim et al.
A primary application of reliability methods is in the development and evaluation of design criteria (ASCE, 1983). Design procedures, parameters and safety factors should have a probabilistic basis to provide uniformity of reliability among components, and to optimise safety and improve cost-effectiveness. Reliability methods provide a basis for the rational and systematic treatment of the uncertainties associated with the offshore environmental loadings and geotechnical conditions, and it circumvents the use of safety factors. Reliability logic and technology provide a powerful tool for developing cost-effective design criteria for offshore installations.
Several studies have been carried out to calibrate load factors (Scott et al., 2003; Tarp-Johansen, 2005; Nizamani et al., 2014) and resistance factors (Foye et al., 2009; Kim et al., 2011) through reliability analysis. However, few studies have paid attention to calibrating both load and resistance factors for a target annual failure probability.
There will always be a finite probability that the loads can cause damage, or the total collapse, of an offshore structure. Defining the level of finite annual probability of failure that is tolerable is the challenge for a designer. The safety objective of equation (1) is to ensure that the annual probability of foundation failure is less than a target value, typically 1 × 10⁻⁴ (Norwegian standard, NORSOK, 2004; 2007) to 2.5 × 10⁻⁴ (ISO standard, ISO, 2007) per year. However, whether or not the specified load and resistance factors actually achieve this objective depends on the type of offshore structure, the load characteristics, the soil characteristics, the foundation analysis method(s), and the relative importance of the static to the dynamic loads.
The target annual failure probability of 1 × 10⁻⁴ is the highest allowable probability of failure that would satisfy the NORSOK regulations (NORSOK, 2007). One can argue that this target value should be lower because it does not consider the reliability of the superstructure. The platform superstructure and the foundation substructure could be considered as the two main ‘components’ of the platform-foundation ‘system’. These two components are connected in series, which means that the failure of either one leads to system failure.
If the superstructure is optimised so that it has the same reliability level as the foundation substructure, then both components should be designed for a target annual failure probability of 5 × 10⁻⁵ such that the whole system has an annual failure probability less than 1 × 10⁻⁴. The owner may also decide to use even a smaller target value to achieve a higher reliability for the superstructure-foundation system.
This paper obtains the load and resistance factors, 1, 2 and m, for a target annual failure probability of 1 × 10⁻⁴. The ‘calibrated’ load and resistance factors for this probability of failure were obtained for four combinations of static and dynamic loads, two probability distribution functions of the peak annual dynamic load on the foundation, and coefficients of variation (CoV) of the characteristic foundation capacity between 15% and 25%.
The paper describes the approach to derive the calibrated load and resistance factors, and discusses the results in view of the required load and resistance factors in the API LRFD (2003), ISO 19902 (2007) and NORSOK (2004) guidelines and codes for offshore design.
Calibration of partial safety factors for offshore foundation design 55
2 Uncertainty in load and resistance
2.1 Probabilistic representation of loads
Static Loads: Very little uncertainty is usually found in the static loads induced by gravity (weight of the platform and foundation elements) and buoyancy on the foundation. An uncertainty in gravity-induced loads was not included in the analyses, and 1 was therefore taken as unity (1.0).
Environmental Loads: In the analyses in this paper, the annual maximum storm-or earthquake-induced loads on the foundation were taken to follow either an extreme value distribution or a Pareto distribution.
Typically, the annual maximum storm-induced load on the foundation follows a Gumbel (Type I) extreme value distribution (Lacasse et al., 2013a):
FX(x) = exp{–exp{–(x – α)/β)}} (2)
The extreme value, xq, corresponding to an annual exceedance probability q, is given by:
xq = α – β ln{–ln(1 – q)} (3)
If the q-probability extreme values, xq1 and xq2, are given for two exceedance probability levels, q1 and q2, then the parameters β and α can be estimated from equations (4) and (5):
β = (xq2 – xq1)/(ln{–ln(1 – q1)} – ln{–ln(1 – q2)}) (4)
α = xq1 + β ln{–ln(1 – q1)} (5)
The extreme loads corresponding to different return periods, for example return periods of 10, 100, 1000 and 10,000 years (where the annual exceedance probability is the inverse of the return period) are usually provided by the structural engineer. The parameters of the Gumbel distribution can be estimated from any pair of these extreme loads.
In addition to the Gumbel distribution, the Pareto distribution is another ‘heavy tail’ distribution that seems to be valid when the extreme loads increase more rapidly than an order of magnitude for return periods. The Pareto distribution is expressed by:
FX(x) = 1 – (k/x)a (6)
where k is a scale parameter and a is a shape parameter. Both parameters are positive. If the q-probability extreme values, xq1 and xq2, are given for two exceedance probability levels, q1 and q2, then the parameters a and k can be estimated from equations (7) and (8):
a = {ln(q1) – ln(q2)}/{ln(xq2) – ln(xq1)} (7)
k = xq1 exp{ln(1 – FX(q1))/a} (8)
The Pareto distribution with dynamic load ratio (i.e., Pd-10,000 yr/Pd-100 yr) greater than 2.0 produced very large values for the required load factor due to the heavy-tail characteristic of the distribution. Therefore, if the load ratio is expected to be greater than 2.0, the designer needs to select an appropriate distribution by considering different types of extreme value distributions. Only the results for the Gumbel distribution are presented in the paper.
56 F. Nadim et al.
2.2 Uncertainty in resistance
In the analyses described herein, the characteristic foundation capacity was assumed to have a lognormal distribution, based on a study reported in Lacasse et al. (2013a, 2013b, 2013c). A parametric study of the uncertainty in the soil was performed by including values of coefficient of variation, CoV (defined as ratio of standard deviation to mean value), of 15, 20 and 25%. The next paragraphs describe briefly the evaluation of the probabilistic capacity and of the model uncertainty.
The deterministic model for the calculation of the capacity was combined with structural reliability methods to obtain the component reliability of a foundation in terms of its capacity when subjected to loading. The probabilistic axial capacity of, for example, an offshore pile foundation, with the loads illustrated in Figure 1, required the following calculations:
Deterministic analysis of the axial pile capacity with the best estimate of the mechanical soil properties relevant for the pile capacity method used.
Probabilistic description of pile and soil basic random variables and quantification of the model uncertainty for the pile capacity method used in order to evaluate the uncertainty in the ultimate pile capacity.
Determination of the probability density function for the axial pile capacity.
The calculations of the deterministic and probabilistic capacity involved six steps (Lacasse et al., 2013a, 2013b, 2013c):
1 Establish the mean and standard deviation and the probability density function of the soil parameters from laboratory tests and in situ tests.
2 Establish model uncertainty for the pile capacity calculation method(s).
3 Establish the effect of cyclic loading on the axial pile capacity, if any, and evaluate whether the piles in compression or tension are governing for the capacity.
4 Develop a model for the statistics of the permanent and environmental loads on the top of the piles.
5 Do deterministic analysis with the selected characteristics parameters, the adjusted soil profile and the statistical mean values.
6 Do probabilistic analyses of axial pile capacity, including the uncertainty in all the parameters entering in the analysis of axial pile capacity; obtain the mean, standard deviation and probability density function of the ultimate pile capacity.
Where possible (since geotechnical parameters often suffer from large epistemic uncertainty), the profiles of the soil parameters were established by doing statistical analyses of the available soil data. In each evaluation, the statistical estimates were combined with engineering experience and judgment. Where there were not enough data available, earlier published results were also used.
The probability density function of the axial pile capacity thus obtained was used in the limit state function defined as ‘g = Pile capacity – (Deterministic value of pile capacity)’, where is a factor less than 1 (see explanation in next paragraph). The analyses were repeated for 8 values of . Normal and lognormal probability density
Calibration of partial safety factors for offshore foundation design 57
functions were fitted to the computed values. Based on the better fit of the two distribution functions obtained, the probabilistic description of the axial pile capacity was established.
Since the quantity being evaluated probabilistically is related to resistance rather than loading, the best fit to the lower tail (values below the mean) of the distribution function is the most relevant for the foundation reliability analysis. The following fractions of the deterministic value were used: = 0.5, 0.55, 0.6, 0.65, 0.7, 0.75, 0.8 and 0.85.
The analyses in the Lacasse et al. (2013c) paper indicate that the uncertainty in the model used to calculate the capacity can have a very significant, sometimes overwhelming, effect on the resulting probabilistic capacity and the ensuing probability of failure. The model uncertainty in a calculation method was also quantified in terms of a mean (or bias), standard deviation and the probability density function that best fitted the data. The ideal approach for quantifying the uncertainty in a geotechnical capacity model is to compare the predicted and measured capacity for relevant foundation dimensions and relevant loading conditions, for example with pile load tests for piles supporting a jacket offshore. The main sources of information for the evaluation of model uncertainty are databases of model tests compiled in the literature. However, the model tests are usually for much smaller foundation dimensions and smaller loads than the dimensions of the prototype foundations offshore and static and environmental loads offshore. Aspects such as number of available reliable model tests in the database, the interpretation of the ‘reliable’ model tests, the availability of the original data, scaling factors, and the influence of specific geotechnical characteristics, such as the plasticity of a clay or the density of a sand, are factors that can influence the statistics of the model uncertainty. This renders the evaluation of the model uncertainty difficult with the available database of model tests today (Lacasse et al., 2013b).
For this reason, the analyses were carried out with the uncertainty in the foundation capacity calculation model set to a coefficient of variation, CoV, of 15, 20 and 25%. The CoV of 25% signifies that the estimated foundation capacity could be in error by a factor of 1.0 to 3.
3 Foundation failure probability
The failure probabilities were calculated with the first-order reliability method, FORM (Gollwitzer et al., 1988). In the FORM approximation, one needs to define a performance function, g(X), such that g(X) 0 means satisfactory performance and g(X) < 0 means failure. X is a vector of basic random variables including soil properties and modelling uncertainty. If the joint probability density function of all basic random variables FX(x) is known, the probability of failure, Pf , is given by:
f XLP F x dx (9)
where L is the domain of X where g(X) < 0. In general, the above integral cannot be solved analytically, and an approximation is obtained by the FORM approach. In this approach, the general case is approximated to an ideal situation where X is a vector of independent Gaussian variables with zero mean and unit standard deviation, and g(X) is a linear function. The probability of failure Pf at the ‘design point’ (where the probability of failure is highest) is:
Pf = P[g(X)< 0] = P[iUi – < 0 ]= (–) (10)
58 F. Nadim et al.
where P[…] reads as ‘the probability that’, i is the direction cosine of the random variable Xi, Ui is the transformation of variable Xi in the standard normal space, is the distance between the origin and the hyper-plane g(U) = 0 in the standard normal space, n is the number of basic random variables Xi (and its transformation in the standard normal space U), and is the standard normal distribution function.
The coordinates of the ‘design point’ (at failure) from the probabilistic calculations are important for the calibration of the load and resistance factors in terms of a reliability-based framework. It is important to locate these coordinates and to use and perhaps adjust, in an iterative manner, the uncertainties associated with these coordinates. The significance of the coordinates of the design point in code calibration is discussed further in Section 5.4.
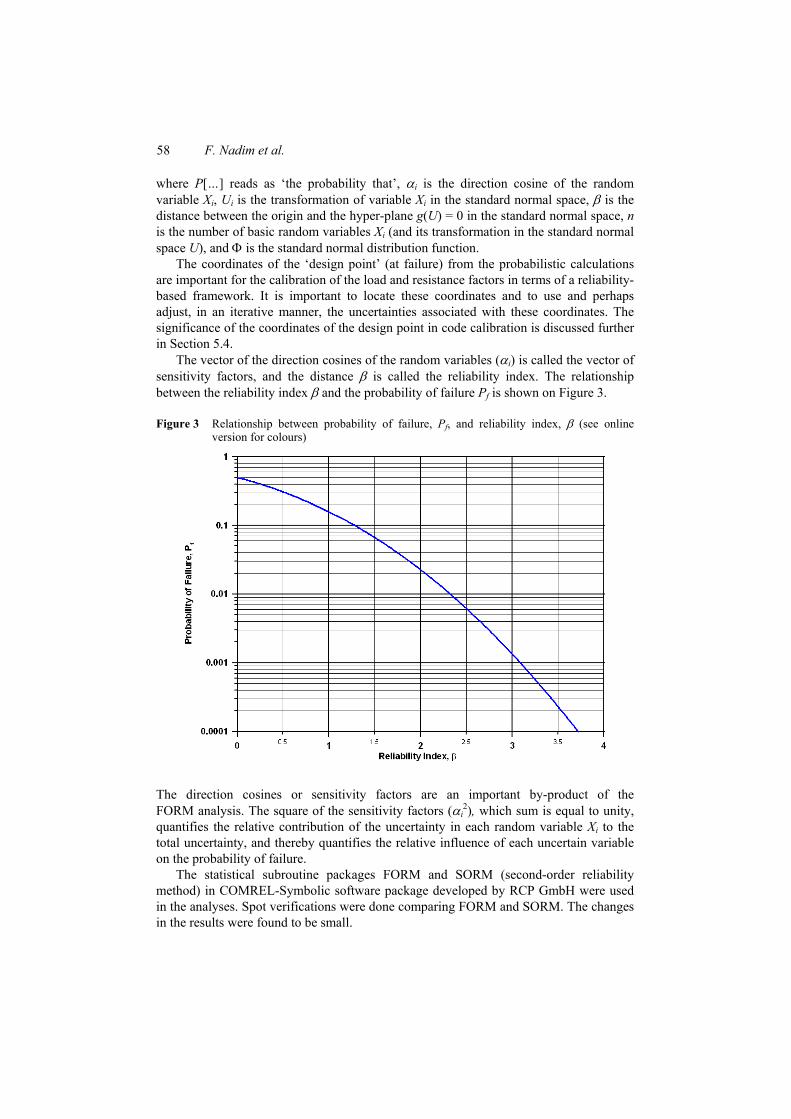
The vector of the direction cosines of the random variables (i) is called the vector of sensitivity factors, and the distance is called the reliability index. The relationship between the reliability index and the probability of failure Pf is shown on Figure 3.
Figure 3 Relationship between probability of failure, Pf, and reliability index, (see online version for colours)
The direction cosines or sensitivity factors are an important by-product of the FORM analysis. The square of the sensitivity factors (i
2), which sum is equal to unity, quantifies the relative contribution of the uncertainty in each random variable Xi to the total uncertainty, and thereby quantifies the relative influence of each uncertain variable on the probability of failure.
The statistical subroutine packages FORM and SORM (second-order reliability method) in COMREL-Symbolic software package developed by RCP GmbH were used in the analyses. Spot verifications were done comparing FORM and SORM. The changes in the results were found to be small.
Calibration of partial safety factors for offshore foundation design 59
4 Analyses
4.1 Distribution functions for characteristic load and foundation capacity
The calculations included first a deterministic design using equation (1). The following parameters (including load and resistance factors) were used:
Loads:
Pd-100yr = 100 (characteristic dynamic load with return period of 100 years)
Partial safety factors:
1 = 1.0, 2 = 1.30, m = 1.30
Ratio of static (Ps) to maximum 100-yr load (Pmax):
Ps / (Ps + Pd-100yr) = Ps / Pmax = 0.1, 0.25, 0.5, 0.75
For each combination of Ps and Pd-100yr, the required ultimate foundation capacity, Qult, was calculated from equation (1):
Qult = (1Ps + 2Pd ) m (11)
Qult was assumed to be the mean value of the foundation capacity in the probabilistic analyses.
In an actual calibration of the load and resistance factors, the calibrated resistance factor is derived for one specific value of capacity (therefore specific values of the soil parameters used to calculate the capacity). Usually, one would do the calibration for both the ‘characteristic’ values of the soil parameters (thus the ‘characteristic’ capacity) and the ‘mean’ values of the soil parameters (therefore the ‘mean’ capacity). The calibrated factors need therefore to be associated with the shear strength parameters they were derived with. For the present study, the Qult, obtained with equation (11), using the resistance factor m, was taken to be the mean capacity. This capacity is denoted simply as Q in the tables of results. Further discussion of the mean versus the characteristic foundation capacity is provided in Section 5.4.
In the probabilistic calculation, the three afore-mentioned cases of uncertainty in the foundation capacity were considered: CoV(Q) = Q /Q = 0.15, 0.20 and 0.25, where CoV is the coefficient of variation, Q denotes the standard deviation of the foundation capacity and Q the mean value of the foundation capacity.
As described in Section 2.1, a Gumbel distribution for the annual maximum dynamic load was used. Using the procedure outlined in Section 2.1, the parameters of the distribution function were estimated for ratios Pd-10,000yr /Pd-100yr of 1.25, 1.5 and 1.75 (3 cases).
4.2 Evaluation of the annual probability of foundation failure
The assessment of the annual probability of foundation failure was done using the FORM approximation in the COMREL-Symbolic software package. The following limit state function g was used in the calculation of the annual foundation failure:
g = Qultscale – (Ps + Pd) (12)
where represents the modelling and statistical uncertainty in load (effect) calculations and ‘scale’ is the scaling factor to be used on Qult to obtain the selected target annual
60 F. Nadim et al.
failure probability. On the basis of three case studies of offshore jackets with piled foundations (Lacasse et al., 2013a), was assumed to have a normal distribution with standard deviation of 0.1 and mean of 1.
5 Results of analyses
5.1 Resistance and load factors
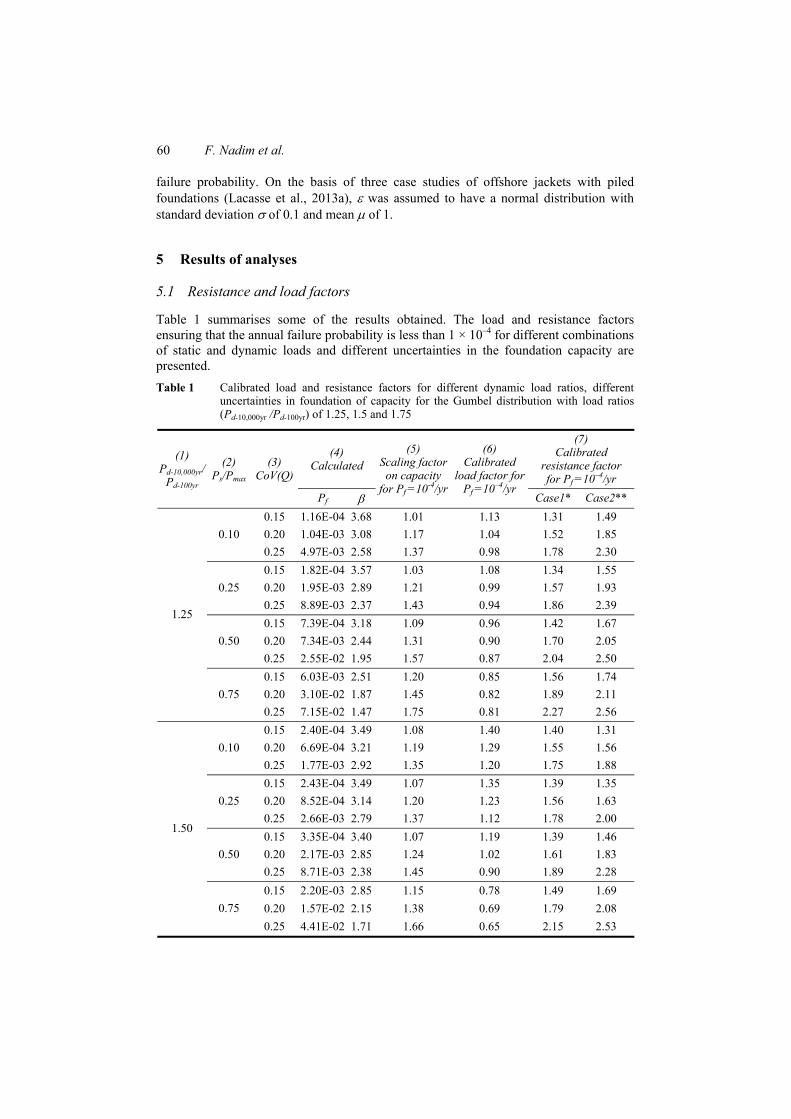
Table 1 summarises some of the results obtained. The load and resistance factors ensuring that the annual failure probability is less than 1 × 10⁻⁴ for different combinations of static and dynamic loads and different uncertainties in the foundation capacity are presented.
Table 1 Calibrated load and resistance factors for different dynamic load ratios, different uncertainties in foundation of capacity for the Gumbel distribution with load ratios (Pd-10,000yr /Pd-100yr) of 1.25, 1.5 and 1.75
(1) Pd-10,000yr/
Pd-100yr
(2) Ps/Pmax
(3) CoV(Q)
(4) Calculated
(5) Scaling factor on capacity
for Pf =10-4/yr
(6) Calibrated
load factor for Pf =10–4/yr
(7) Calibrated
resistance factor for Pf =10–4/yr
Pf Case1* Case2**
1.25
0.10
0.15 1.16E-04 3.68 1.01 1.13 1.31 1.49
0.20 1.04E-03 3.08 1.17 1.04 1.52 1.85
0.25 4.97E-03 2.58 1.37 0.98 1.78 2.30
0.25
0.15 1.82E-04 3.57 1.03 1.08 1.34 1.55
0.20 1.95E-03 2.89 1.21 0.99 1.57 1.93
0.25 8.89E-03 2.37 1.43 0.94 1.86 2.39
0.50
0.15 7.39E-04 3.18 1.09 0.96 1.42 1.67
0.20 7.34E-03 2.44 1.31 0.90 1.70 2.05
0.25 2.55E-02 1.95 1.57 0.87 2.04 2.50
0.75
0.15 6.03E-03 2.51 1.20 0.85 1.56 1.74
0.20 3.10E-02 1.87 1.45 0.82 1.89 2.11
0.25 7.15E-02 1.47 1.75 0.81 2.27 2.56
1.50
0.10
0.15 2.40E-04 3.49 1.08 1.40 1.40 1.31
0.20 6.69E-04 3.21 1.19 1.29 1.55 1.56
0.25 1.77E-03 2.92 1.35 1.20 1.75 1.88
0.25
0.15 2.43E-04 3.49 1.07 1.35 1.39 1.35
0.20 8.52E-04 3.14 1.20 1.23 1.56 1.63
0.25 2.66E-03 2.79 1.37 1.12 1.78 2.00
0.50
0.15 3.35E-04 3.40 1.07 1.19 1.39 1.46
0.20 2.17E-03 2.85 1.24 1.02 1.61 1.83
0.25 8.71E-03 2.38 1.45 0.90 1.89 2.28
0.75
0.15 2.20E-03 2.85 1.15 0.78 1.49 1.69
0.20 1.57E-02 2.15 1.38 0.69 1.79 2.08
0.25 4.41E-02 1.71 1.66 0.65 2.15 2.53
Calibration of partial safety factors for offshore foundation design 61
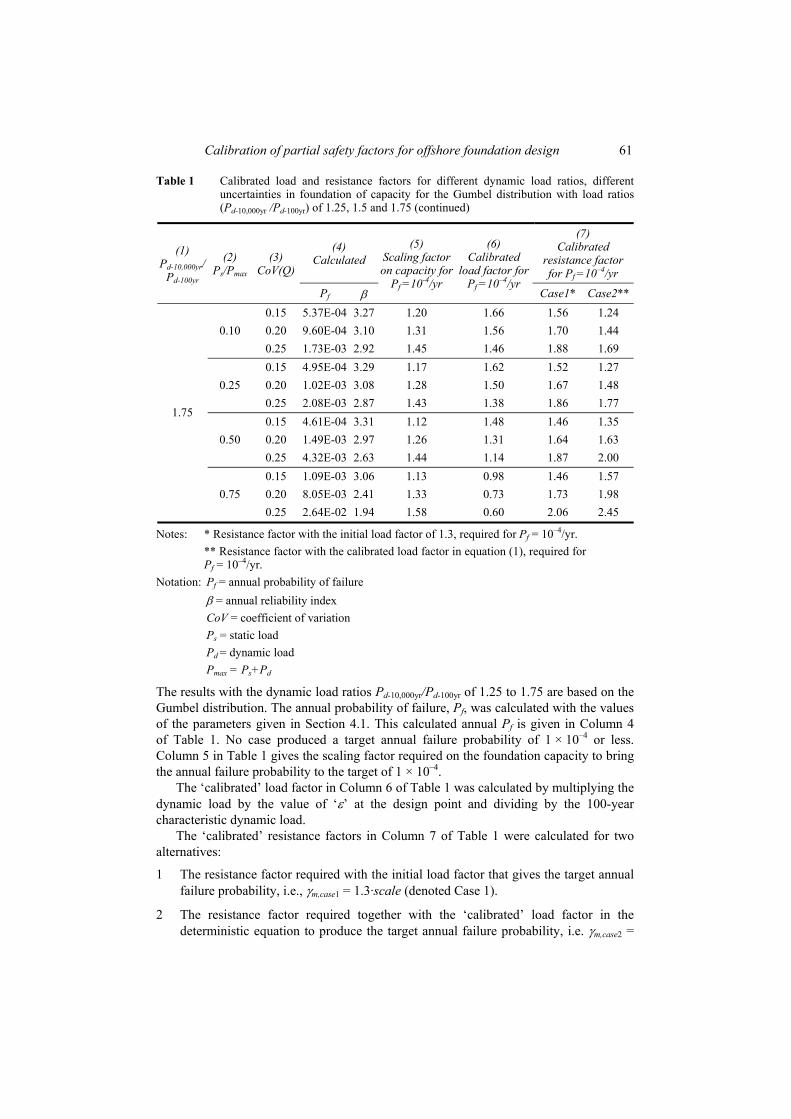
Table 1 Calibrated load and resistance factors for different dynamic load ratios, different uncertainties in foundation of capacity for the Gumbel distribution with load ratios (Pd-10,000yr /Pd-100yr) of 1.25, 1.5 and 1.75 (continued)
(1) Pd-10,000yr/
Pd-100yr
(2) Ps/Pmax
(3) CoV(Q)
(4) Calculated
(5) Scaling factor on capacity for
Pf =10-4/yr
(6) Calibrated
load factor for Pf =10–4/yr
(7) Calibrated
resistance factor for Pf =10–4/yr
Pf Case1* Case2**
1.75
0.10
0.15 5.37E-04 3.27 1.20 1.66 1.56 1.24
0.20 9.60E-04 3.10 1.31 1.56 1.70 1.44
0.25 1.73E-03 2.92 1.45 1.46 1.88 1.69
0.25
0.15 4.95E-04 3.29 1.17 1.62 1.52 1.27
0.20 1.02E-03 3.08 1.28 1.50 1.67 1.48
0.25 2.08E-03 2.87 1.43 1.38 1.86 1.77
0.50
0.15 4.61E-04 3.31 1.12 1.48 1.46 1.35
0.20 1.49E-03 2.97 1.26 1.31 1.64 1.63
0.25 4.32E-03 2.63 1.44 1.14 1.87 2.00
0.75
0.15 1.09E-03 3.06 1.13 0.98 1.46 1.57
0.20 8.05E-03 2.41 1.33 0.73 1.73 1.98
0.25 2.64E-02 1.94 1.58 0.60 2.06 2.45
Notes: * Resistance factor with the initial load factor of 1.3, required for Pf = 10–4/yr.
** Resistance factor with the calibrated load factor in equation (1), required for Pf = 10–4/yr.
Notation: Pf = annual probability of failure
= annual reliability index
CoV = coefficient of variation
Ps = static load
Pd = dynamic load
Pmax = Ps+Pd
The results with the dynamic load ratios Pd-10,000yr/Pd-100yr of 1.25 to 1.75 are based on the Gumbel distribution. The annual probability of failure, Pf, was calculated with the values of the parameters given in Section 4.1. This calculated annual Pf is given in Column 4 of Table 1. No case produced a target annual failure probability of 1 × 10⁻⁴ or less. Column 5 in Table 1 gives the scaling factor required on the foundation capacity to bring the annual failure probability to the target of 1 × 10⁻⁴.
The ‘calibrated’ load factor in Column 6 of Table 1 was calculated by multiplying the dynamic load by the value of ‘’ at the design point and dividing by the 100-year characteristic dynamic load.
The ‘calibrated’ resistance factors in Column 7 of Table 1 were calculated for two alternatives:
1 The resistance factor required with the initial load factor that gives the target annual failure probability, i.e., m,case1 = 1.3·scale (denoted Case 1).
2 The resistance factor required together with the ‘calibrated’ load factor in the deterministic equation to produce the target annual failure probability, i.e. m,case2 =
62 F. Nadim et al.
Q/(value of Qult at the design point for the target annual failure probability). This ‘calibrated’ load factor is defined as the ratio of the dynamic load at the design point to the characteristic dynamic load with return period of 100 years (denoted Case 2).
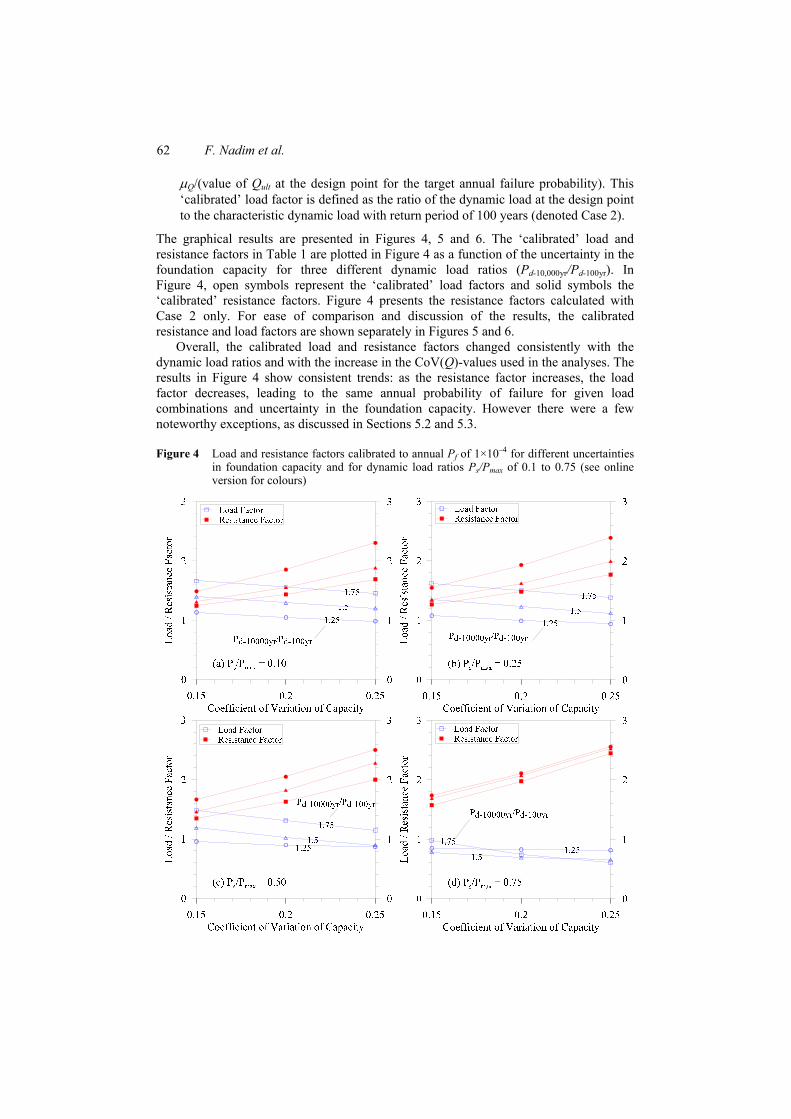
The graphical results are presented in Figures 4, 5 and 6. The ‘calibrated’ load and resistance factors in Table 1 are plotted in Figure 4 as a function of the uncertainty in the foundation capacity for three different dynamic load ratios (Pd-10,000yr/Pd-100yr). In Figure 4, open symbols represent the ‘calibrated’ load factors and solid symbols the ‘calibrated’ resistance factors. Figure 4 presents the resistance factors calculated with Case 2 only. For ease of comparison and discussion of the results, the calibrated resistance and load factors are shown separately in Figures 5 and 6.
Overall, the calibrated load and resistance factors changed consistently with the dynamic load ratios and with the increase in the CoV(Q)-values used in the analyses. The results in Figure 4 show consistent trends: as the resistance factor increases, the load factor decreases, leading to the same annual probability of failure for given load combinations and uncertainty in the foundation capacity. However there were a few noteworthy exceptions, as discussed in Sections 5.2 and 5.3.
Figure 4 Load and resistance factors calibrated to annual Pf of 1×10⁻⁴ for different uncertainties in foundation capacity and for dynamic load ratios Ps/Pmax of 0.1 to 0.75 (see online version for colours)
Calibration of partial safety factors for offshore foundation design 63
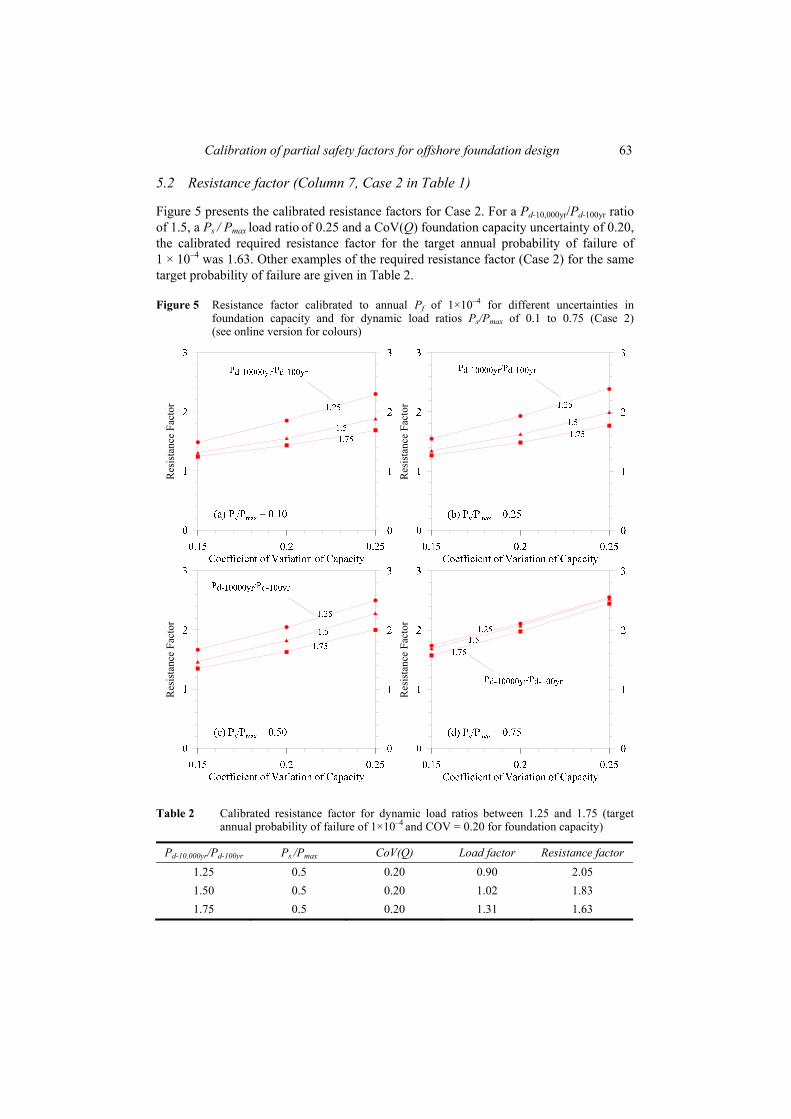
5.2 Resistance factor (Column 7, Case 2 in Table 1)
Figure 5 presents the calibrated resistance factors for Case 2. For a Pd-10,000yr/Pd-100yr ratio of 1.5, a Ps / Pmax load ratio of 0.25 and a CoV(Q) foundation capacity uncertainty of 0.20, the calibrated required resistance factor for the target annual probability of failure of 1 × 10⁻⁴ was 1.63. Other examples of the required resistance factor (Case 2) for the same target probability of failure are given in Table 2.
Figure 5 Resistance factor calibrated to annual Pf of 1×10⁻⁴ for different uncertainties in foundation capacity and for dynamic load ratios Ps/Pmax of 0.1 to 0.75 (Case 2) (see online version for colours)
Res
ista
nce
Fac
tor
Res
ista
nce
Fac
tor
Res
ista
nce
Fac
tor
Res
ista
nce
Fac
tor
Table 2 Calibrated resistance factor for dynamic load ratios between 1.25 and 1.75 (target annual probability of failure of 1×10⁻⁴ and COV = 0.20 for foundation capacity)
Pd-10,000yr/Pd-100yr Ps /Pmax CoV(Q) Load factor Resistance factor
1.25 0.5 0.20 0.90 2.05
1.50 0.5 0.20 1.02 1.83
1.75 0.5 0.20 1.31 1.63
64 F. Nadim et al.
The resistance factor varied with the ratio Pd-10,000yr/Pd-100yr, the load ratio Ps /Pmax and CoV(Q). The calibrated resistance factor increased consistently with increasing uncertainty in the foundation resistance. It however decreased as the ratio of the dynamic loads Pd-10,000yr/Pd-100yr increased. The resistance factor increased slightly with increasing load ratio Ps/Pmax for a given uncertainty in the capacity. The changes in the required resistance factor were quite uniform as the uncertainties in capacity and as the loads ratios were varied.
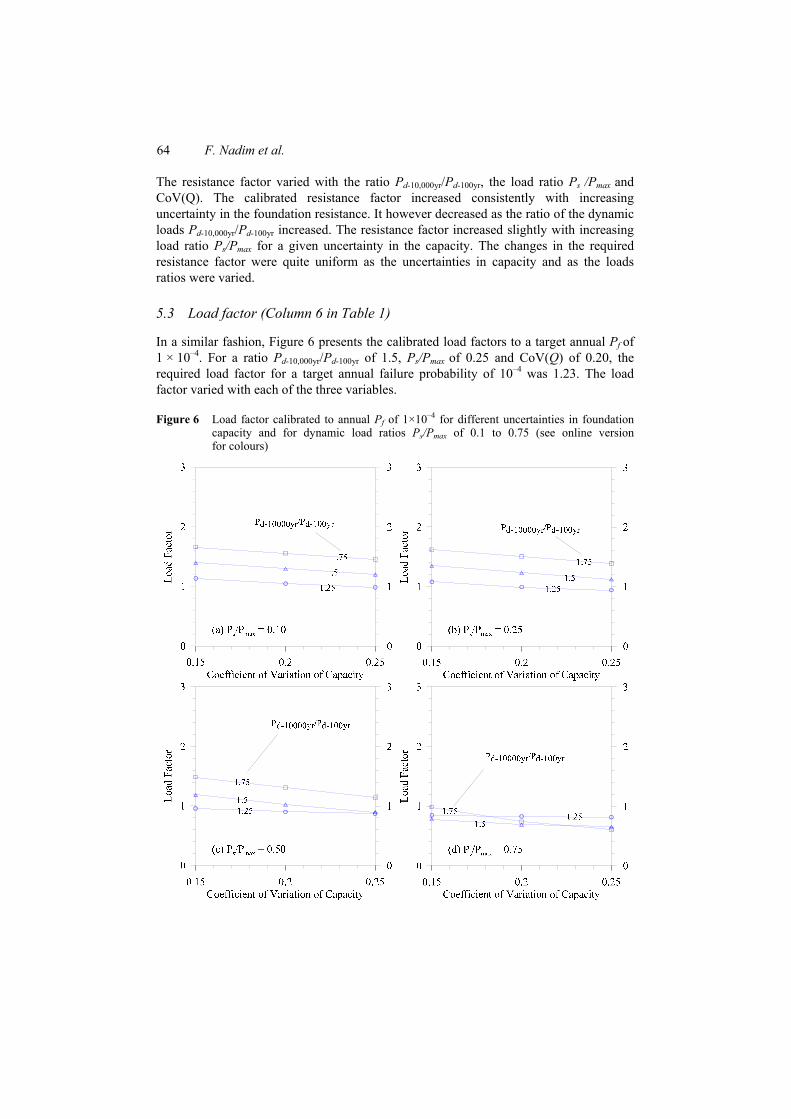
5.3 Load factor (Column 6 in Table 1)
In a similar fashion, Figure 6 presents the calibrated load factors to a target annual Pf of 1 × 10⁻⁴. For a ratio Pd-10,000yr/Pd-100yr of 1.5, Ps/Pmax of 0.25 and CoV(Q) of 0.20, the required load factor for a target annual failure probability of 10–4 was 1.23. The load factor varied with each of the three variables.
Figure 6 Load factor calibrated to annual Pf of 1×10⁻⁴ for different uncertainties in foundation capacity and for dynamic load ratios Ps/Pmax of 0.1 to 0.75 (see online version for colours)
Calibration of partial safety factors for offshore foundation design 65
For a given ratio of Pd-10,000yr/Pd-100yr, the load factor decreased with increasing CoV(Q), though to less degree than the increase in the resistance factor for the same change in CoV(Q). The calibrated load factor decreased with increasing ratio Ps/Pmax, given a fixed uncertainty in foundation capacity. For given uncertainty in foundation capacity and static to dynamic load ratio, the calibrated load factor increased with increasing ratio Pd-10,000yr/Pd-100yr, with the a slight exception of the case with the load ratio Ps/Pmax of 0.75.
The load factor is the ratio of the dynamic load at the design point to the load with 100-year return period, used as the reference characteristic dynamic load. This means that for load factors greater than one, the value of the dynamic load at the design point corresponds to a return period greater than 100 years.
A small uncertainty in the static load induced by gravity (e.g., weight of the platform) was considered in the study. The effect of this uncertainty on the partial safety factors was found to be negligible.
The values of the calibrated resistance and load factors can be compared with the values specified in current guidelines and standards. The most common codes applied for offshore foundation design would be API-RP 2A WSD (2007)/LRFD (2003), ISO 19902 (2007) and NORSOK N-004 (2004). In API 2A WSD (2007), the resistance and load factors are lumped in a single safety factor of 1.5 for extreme condition and 2.0 for operational condition.
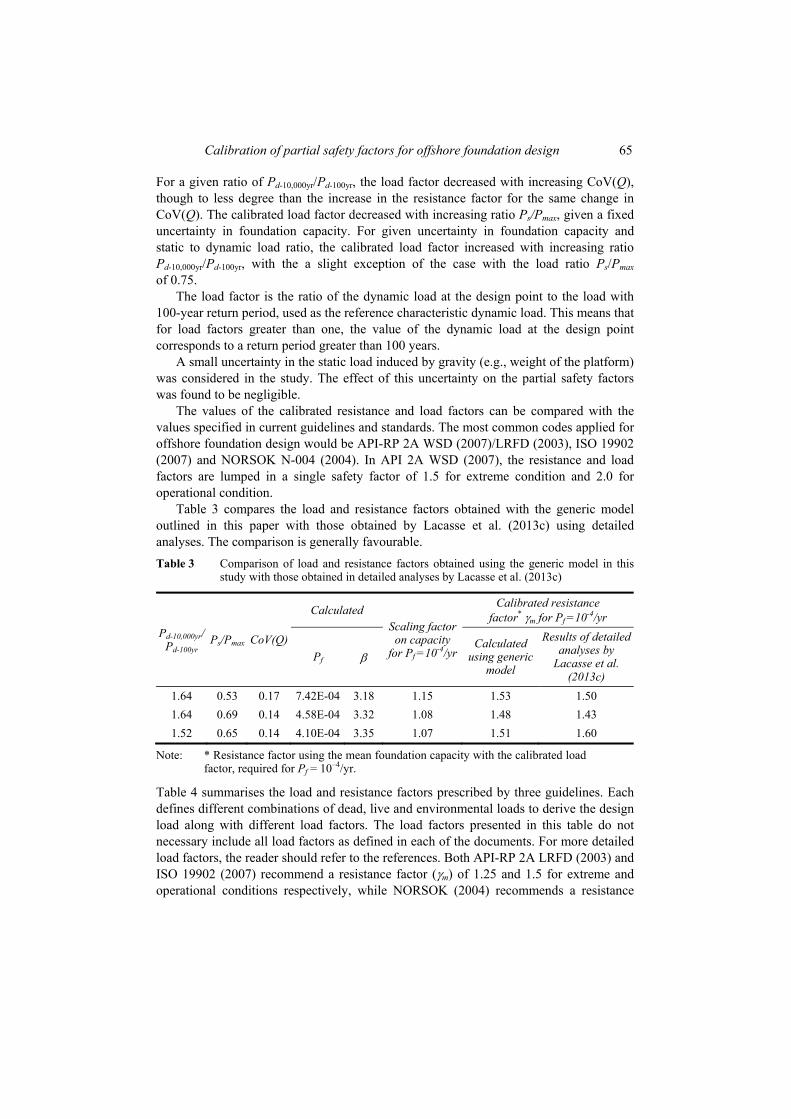
Table 3 compares the load and resistance factors obtained with the generic model outlined in this paper with those obtained by Lacasse et al. (2013c) using detailed analyses. The comparison is generally favourable.
Table 3 Comparison of load and resistance factors obtained using the generic model in this study with those obtained in detailed analyses by Lacasse et al. (2013c)
Pd-10,000yr/ Pd-100yr
Ps/Pmax CoV(Q)
Calculated Scaling factoron capacity
for Pf =10-4/yr
Calibrated resistance factor* m for Pf =10-4/yr
Pf Calculated
using generic model
Results of detailed analyses by
Lacasse et al. (2013c)
1.64 0.53 0.17 7.42E-04 3.18 1.15 1.53 1.50
1.64 0.69 0.14 4.58E-04 3.32 1.08 1.48 1.43
1.52 0.65 0.14 4.10E-04 3.35 1.07 1.51 1.60
Note: * Resistance factor using the mean foundation capacity with the calibrated load factor, required for Pf = 10–4/yr.
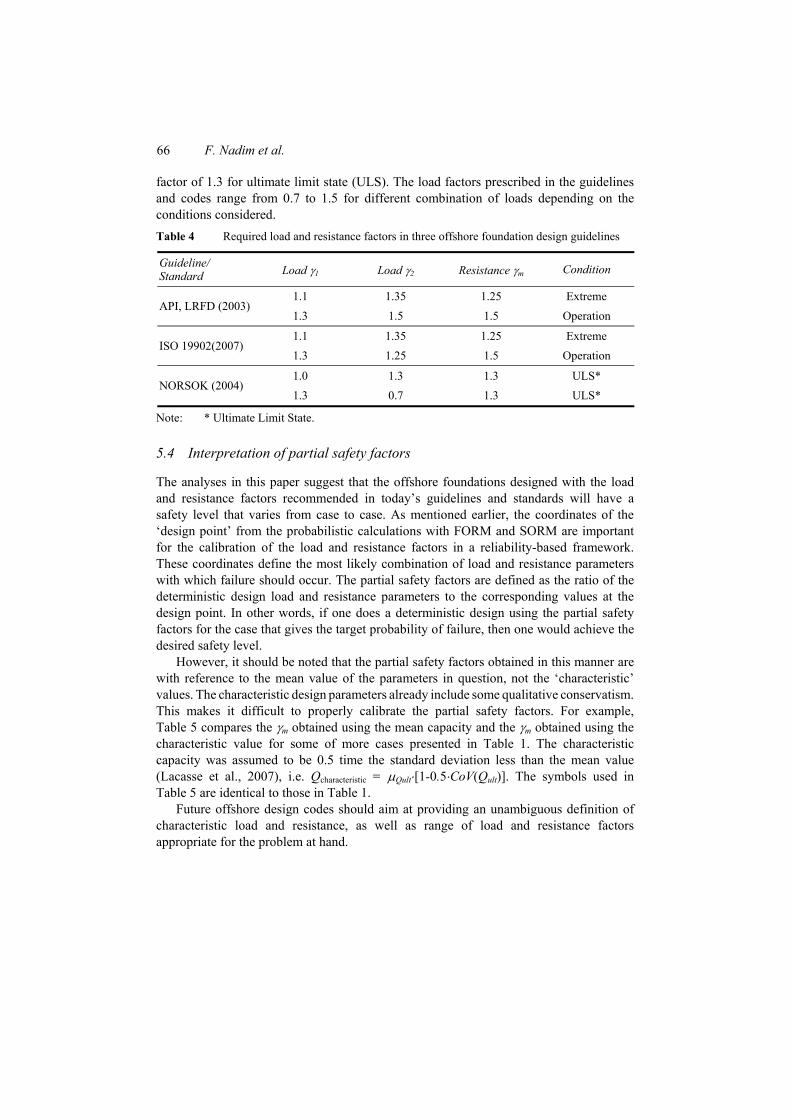
Table 4 summarises the load and resistance factors prescribed by three guidelines. Each defines different combinations of dead, live and environmental loads to derive the design load along with different load factors. The load factors presented in this table do not necessary include all load factors as defined in each of the documents. For more detailed load factors, the reader should refer to the references. Both API-RP 2A LRFD (2003) and ISO 19902 (2007) recommend a resistance factor (m) of 1.25 and 1.5 for extreme and operational conditions respectively, while NORSOK (2004) recommends a resistance
66 F. Nadim et al.
factor of 1.3 for ultimate limit state (ULS). The load factors prescribed in the guidelines and codes range from 0.7 to 1.5 for different combination of loads depending on the conditions considered.
Table 4 Required load and resistance factors in three offshore foundation design guidelines
Guideline/ Standard Load 1 Load 2 Resistance m Condition
API, LRFD (2003) 1.1 1.35 1.25 Extreme
1.3 1.5 1.5 Operation
ISO 19902(2007) 1.1 1.35 1.25 Extreme
1.3 1.25 1.5 Operation
NORSOK (2004) 1.0 1.3 1.3 ULS*
1.3 0.7 1.3 ULS*
Note: * Ultimate Limit State.
5.4 Interpretation of partial safety factors
The analyses in this paper suggest that the offshore foundations designed with the load and resistance factors recommended in today’s guidelines and standards will have a safety level that varies from case to case. As mentioned earlier, the coordinates of the ‘design point’ from the probabilistic calculations with FORM and SORM are important for the calibration of the load and resistance factors in a reliability-based framework. These coordinates define the most likely combination of load and resistance parameters with which failure should occur. The partial safety factors are defined as the ratio of the deterministic design load and resistance parameters to the corresponding values at the design point. In other words, if one does a deterministic design using the partial safety factors for the case that gives the target probability of failure, then one would achieve the desired safety level.
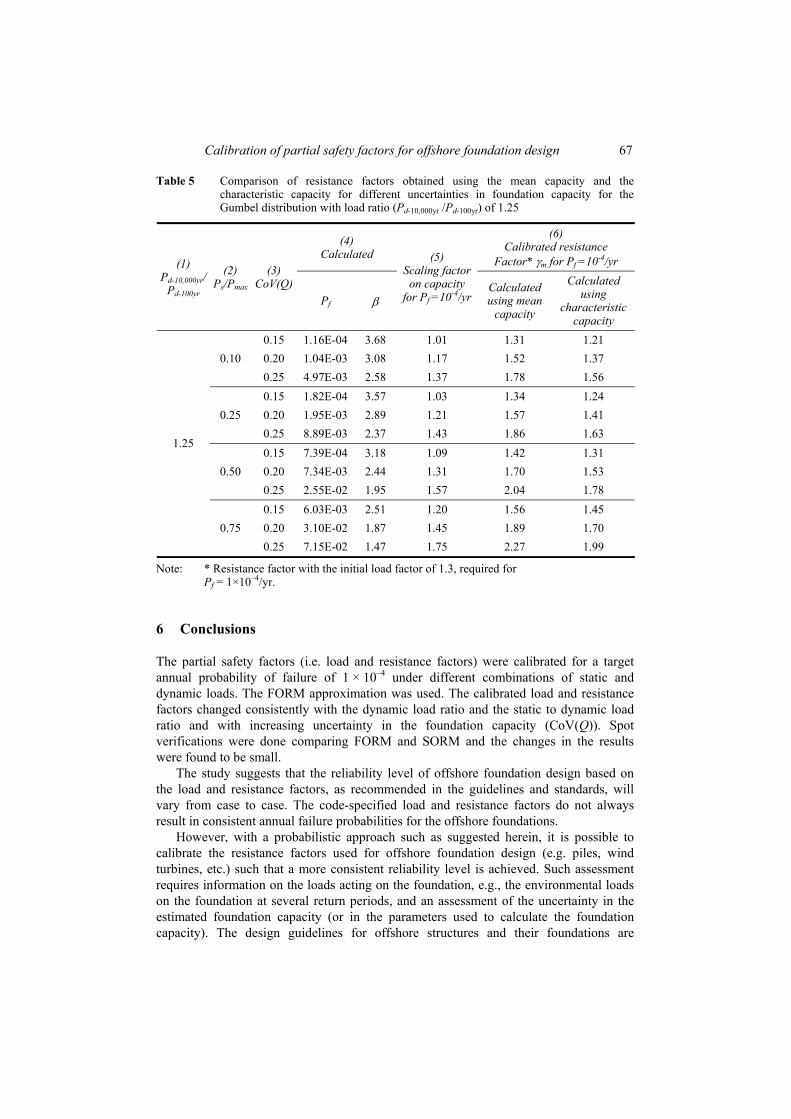
However, it should be noted that the partial safety factors obtained in this manner are with reference to the mean value of the parameters in question, not the ‘characteristic’ values. The characteristic design parameters already include some qualitative conservatism. This makes it difficult to properly calibrate the partial safety factors. For example, Table 5 compares the m obtained using the mean capacity and the m obtained using the characteristic value for some of more cases presented in Table 1. The characteristic capacity was assumed to be 0.5 time the standard deviation less than the mean value (Lacasse et al., 2007), i.e. Qcharacteristic = Qult[1-0.5CoV(Qult)]. The symbols used in Table 5 are identical to those in Table 1.
Future offshore design codes should aim at providing an unambiguous definition of characteristic load and resistance, as well as range of load and resistance factors appropriate for the problem at hand.
Calibration of partial safety factors for offshore foundation design 67
Table 5 Comparison of resistance factors obtained using the mean capacity and the characteristic capacity for different uncertainties in foundation capacity for the Gumbel distribution with load ratio (Pd-10,000yr /Pd-100yr) of 1.25
(1) Pd-10,000yr/
Pd-100yr
(2) Ps/Pmax
(3) CoV(Q)
(4) Calculated (5)
Scaling factor on capacity
for Pf =10-4/yr
(6) Calibrated resistance
Factor* m for Pf =10-4/yr
Pf Calculated using mean
capacity
Calculated using
characteristic capacity
1.25
0.10
0.15 1.16E-04 3.68 1.01 1.31 1.21
0.20 1.04E-03 3.08 1.17 1.52 1.37
0.25 4.97E-03 2.58 1.37 1.78 1.56
0.25
0.15 1.82E-04 3.57 1.03 1.34 1.24
0.20 1.95E-03 2.89 1.21 1.57 1.41
0.25 8.89E-03 2.37 1.43 1.86 1.63
0.50
0.15 7.39E-04 3.18 1.09 1.42 1.31
0.20 7.34E-03 2.44 1.31 1.70 1.53
0.25 2.55E-02 1.95 1.57 2.04 1.78
0.75
0.15 6.03E-03 2.51 1.20 1.56 1.45
0.20 3.10E-02 1.87 1.45 1.89 1.70
0.25 7.15E-02 1.47 1.75 2.27 1.99
Note: * Resistance factor with the initial load factor of 1.3, required for Pf = 1×10⁻⁴/yr.
6 Conclusions
The partial safety factors (i.e. load and resistance factors) were calibrated for a target annual probability of failure of 1 × 10⁻⁴ under different combinations of static and dynamic loads. The FORM approximation was used. The calibrated load and resistance factors changed consistently with the dynamic load ratio and the static to dynamic load ratio and with increasing uncertainty in the foundation capacity (CoV(Q)). Spot verifications were done comparing FORM and SORM and the changes in the results were found to be small.
The study suggests that the reliability level of offshore foundation design based on the load and resistance factors, as recommended in the guidelines and standards, will vary from case to case. The code-specified load and resistance factors do not always result in consistent annual failure probabilities for the offshore foundations.
However, with a probabilistic approach such as suggested herein, it is possible to calibrate the resistance factors used for offshore foundation design (e.g. piles, wind turbines, etc.) such that a more consistent reliability level is achieved. Such assessment requires information on the loads acting on the foundation, e.g., the environmental loads on the foundation at several return periods, and an assessment of the uncertainty in the estimated foundation capacity (or in the parameters used to calculate the foundation capacity). The design guidelines for offshore structures and their foundations are
68 F. Nadim et al.
sometimes conservative and/or ambiguous with regards to partial safety factors to be used for newer design methods (e.g. CPT-based design methods for pile foundations). Using the approach outlined in the paper, one can document the level of safety (e.g. the annual probability of failure) and ‘calibrate’ the required partial safety factors such that the annual probability of failure is below a target level. By explicitly addressing the uncertainties, unnecessary conservatism is avoided and the design is optimised for the target safety level.
The partial safety factors obtained in this paper were with reference to the mean value of the load and resistance parameters, not the ‘characteristic’ values. The characteristic design parameters already include some qualitative conservatism, and this makes it difficult to properly calibrate the partial safety factors. Future offshore design codes should aim at providing an unambiguous definition of characteristic load and resistance, as well as range of resistance load and resistance factors appropriate for the problem at hand.
References
API RP 2A (WSD) (2007) Recommended Practice for Planning, Designing and Constructing Fixed Offshore Platforms – Working Stress Design, 21st ed., December, 2000, with Supplements in December, 2002, September, 2005, and October 2007.
API RP 2A (LRFD) (2003) Recommended Practice for Planning, Designing and Constructing Fixed Offshore Platforms – Load and Resistance Factor Design, 1st ed. reaffirmed, May 2003.
ASCE (1983) ‘Application of reliability methods in design and analysis of offshore platforms. Committee on reliability of offshore structures of the committee on structural safety and reliability of the structural division’, ASCE Journal Structural Engineering, Vol. 109, No. 10, pp.2265–2291.
Foye, K.C., Abou-Jaoude, G., Prezzi, M. and Salgado, R. (2009) ‘Resistance factors for use in load and resistance factor design of driven pipe piles in sands’, Journal of Geotechnical and Geoenvironmental Engineering, Vol. 135, No. 1, pp.1–13.
Gollwitzer, S., Abdo, T. and Rackwitz, R. (1988) FORM (First-Order Reliability Method) Manual. RCP GmbH, Munich, Germany.
ISO 19902:2007 (E) (2007) Petroleum and natural gas industries – Fixed steel offshore structures, 1st ed., December 2007.
Kim D., Chung, M. and Kwak, K. (2011) ‘Resistance factor calculations for LRFD of axially loaded driven piles in sands’, KSCE Journal of Civil Engineering, Vol. 15, No. 7, pp.1185–1196.
Lacasse, S., Nadim, F., Rahim, A. and Guttormsen, T.R. (2007) ‘Statistical description for characteristic soil properties’, Offshore Technology Conference, OTC-19117, Houston, Texas.
Lacasse, S., Nadim, F., Andersen, K.H., Knudsen, S., Eidsvig, U.K., Yetginer, G., Guttormsen, T.R. and Eide, A. (2013a) ‘Reliability of API, NGI, ICP and fugro axial pile capacity calculation methods’, Offshore Technology Conference, OTC-24063, Houston, Texas.
Lacasse, S., Nadim, F., Langford, T., Knudsen, S., Yetginer, G., Guttormsen, T.R. and Eide, A. (2013b) ‘Model uncertainty in axial pile capacity design methods’, Offshore Technology Conference, OTC-24066, Houston, Texas.
Lacasse, S., Nadim, F., Knudsen, S., Eidsvig, U.K., Liu, Z.Q., Yetginer, G. and Guttormsen, T.R. (2013c) ‘Reliability of axial pile capacity calculation methods’, GeoMontréal 67th Canadian Geotechnical Conference, Montréal Canada, 30 September–3 October 2013.
Calibration of partial safety factors for offshore foundation design 69
Nizamani Z., Kurian, V.J. and Liew, M.S. (2014) ‘Determination of environmental load factors for ISO 19902 code in offshore Malaysia using FORM structural reliability method’, Ocean Engineering, Vol. 92, pp.31–43.
NORSOK Standard N-004 (2004) Design of Steel Structures, 2nd ed., October 2004.
NORSOK (2007) Forskrift om utforming og utrustning av innretninger med mer i petroleumsvirksomheten (Innretningsforskriften), Petroleumstilsynet. Available online at: http://www.ptil.no/innretningsforskriften/category380.html (in Norwegian).
Scott B., Kim, B.J. and Salgado, R. (2003) ‘Assessment of current load factors for use in geotechnical load and resistance factor design’, Journal of Geotechnical and Geoenvironmental Engineering, Vol. 129, No. 4, pp.287–295.
Tarp-Johansen, N.J. (2005) ‘Partial safety factors and characteristic values for combined extreme wind and wave load effects’, Journal of Solar Energy Engineering, Vol. 127, No. 2, pp.242–252.