Embed Size (px)
Citation preview
Farmland Values and
Collateral Risk Guidance December 9 2010December 9, 2010
Robert Coleman, Director and Chief Examiner
Office of Examination
Dr. John Moore Chief Economist
Office of Regulatory Policy

Agendag
¾Farm real estate price and debt trends ¾Drivers and risks for farm real estate ¾FCA collateral risk guidance¾FCA collateral risk guidance ¾Future activities
2

t t
Long-Term National Trend in F R l E P iFarm Real Estate Prices 2,500
Nominal and Inflation Adjusted Values of US Farm Real Estate
2,000
3.1 % increase in USDA 2011 Forecast
1,500
er acre
1981‐82 Price Peak 71% Rise 1/03‐1/08
500
1,000
Dollars
p
0
1970 1975 1980 1985 1990 1995 2000 2005 2010
Values on January 1st
106% Rise 1976‐81
3
1970 1975 1980 1985 1990 1995 2000 2005 2010
Inflation Adjusted Values Nominal Values Source: FCA/ORP chart derived from USDA data. GDP Deflator 2005=100.
-
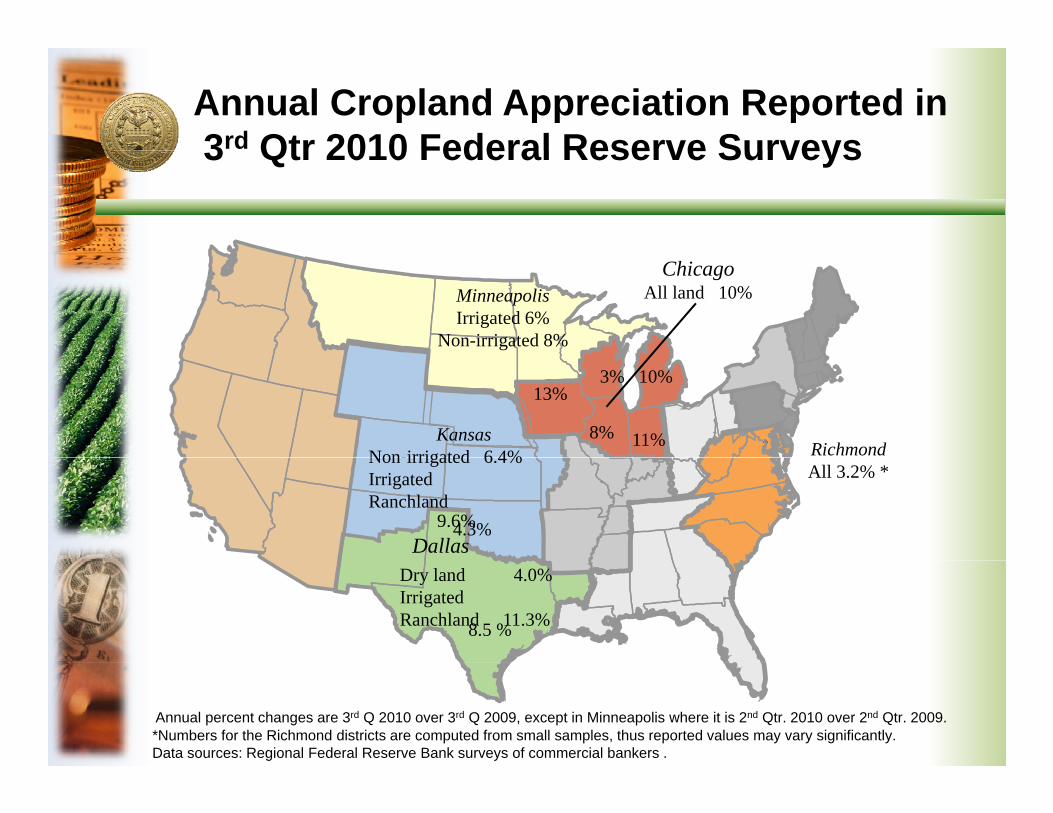
Annual Cropland Appreciation Reported in 3rd Qtr 2010 Federal Reserve Surveys 3 Qtr 2010 Federal Reserve Surveys
Chicago Minneapolis All land 10% Irrigated 6%
Non-irrigated 8%
3% 10% 13%
Kansas Non-irrigated 6 4% Non irrigated 6.4% Irrigated
9.6%
8% 11% Richmond All 3.2% *
Ranchland 4.3%
Dallas Dry land 4.0% Irrigated
8.5 % Ranchland 11.3%
Annual percent changes are 3rd Q 2010 over 3rd Q 2009, except in Minneapolis where it is 2nd Qtr. 2010 over 2nd Qtr. 2009. *Numbers for the Richmond districts are computed from small samples, thus reported values may vary significantly. Data sources: Regional Federal Reserve Bank surveys of commercial bankers .

Debt Owed on Farm Real Estate
18 0 Farm Real Estate Debt‐to‐Asset Ratio or Leverage Ratio
14.0
16.0
18.0 Total farm real estate debt / total value of farm real estate on sector balance sheet
12.9
9.610.0
12.0
7.4
6.0
8.0
0 0
2.0
4.0
Note: this measure includes all farm real estate, regardless of whether debt is owed. Source: FCA/ORP chart derived from USDA data. 5
0.0
1970 1975 1980 1985 1990 1995 2000 2005 2010F
Red = land price decline periods
December 31st of each year
Perccen
t

Concentration of System Real Estate Debt by State as of September 30 2010by State as of September 30, 2010
Total Outstanding System Real Estate Volume $73.1 billion
6
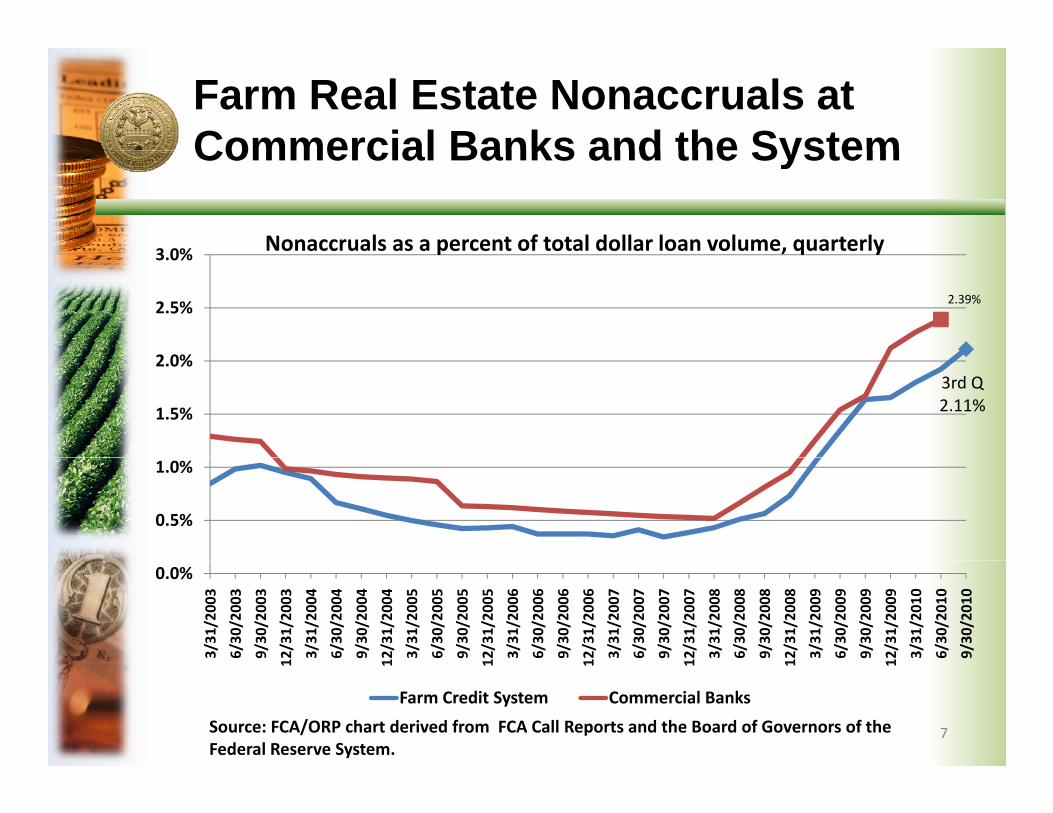
Farm Real Estate Nonaccruals at Commercial Banks and the SystemCommercial Banks and the System
3 0% Nonaccruals as a percent of total dollar loan volume, quarterly
2.39%
2 0%
2.5%
3.0% p , q y
3rd Q 2.11%1.5%
2.0%
0.5%
1.0%
0.0%
3/31/2003
6/30/2003
9/30/2003
12/31/2003
3/31/2004
6/30/2004
9/30/2004
12/31/2004
3/31/2005
6/30/2005
9/30/2005
12/31/2005
3/31/2006
6/30/2006
9/30/2006
12/31/2006
3/31/2007
6/30/2007
9/30/2007
12/31/2007
3/31/2008
6/30/2008
9/30/2008
12/31/2008
3/31/2009
6/30/2009
9/30/2009
12/31/2009
3/31/2010
6/30/2010
9/30/2010
7Source: FCA/ORP chart derived from FCA Call Reports and the Board of Governors of the Federal Reserve System.
1 1 1 1 1 1 1
Farm Credit System Commercial Banks
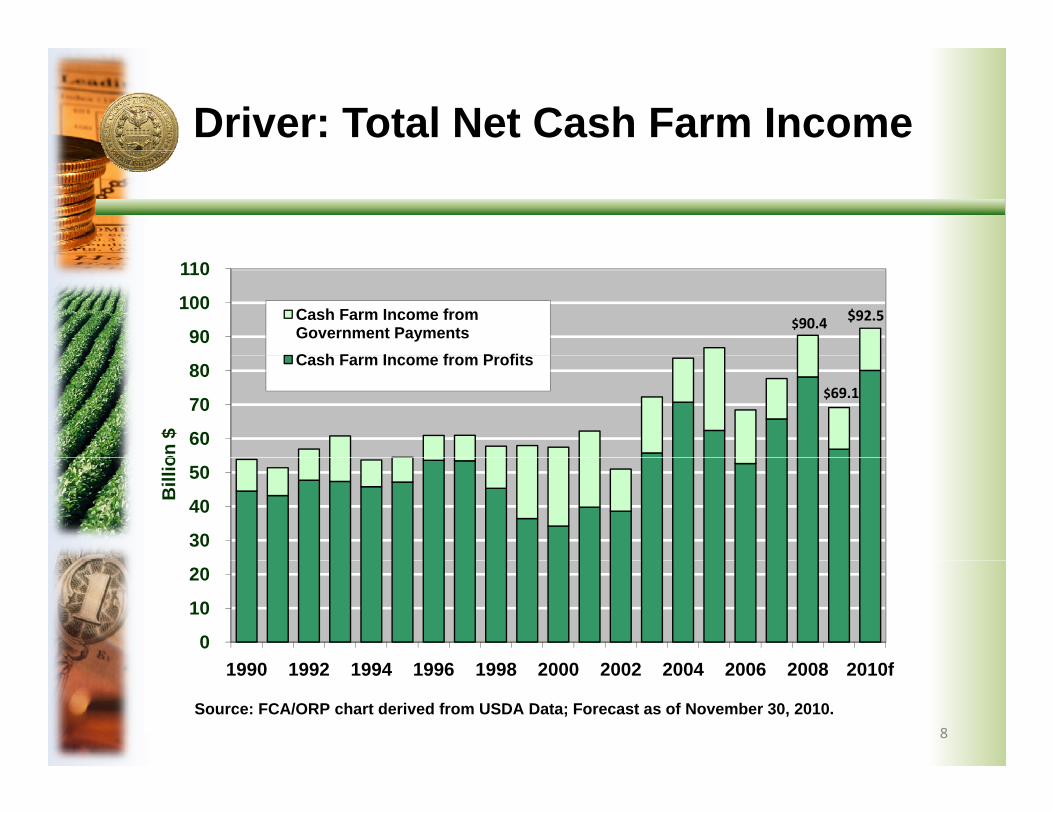
Driver: Total Net Cash Farm Income
90
100
110
Cash Farm Income from Government Payments C h F I f P fit
$90.4 $92.5
60
70
80
on $
Cash Farm Income from Profits
$69.1
30
40
50
Bill
io
0
10
20
1990 1992 1994 1996 1998 2000 2002 2004 2006 2008 2010f1990 1992 1994 1996 1998 2000 2002 2004 2006 2008 2010f
Source: FCA/ORP chart derived from USDA Data; Forecast as of November 30, 2010. 8
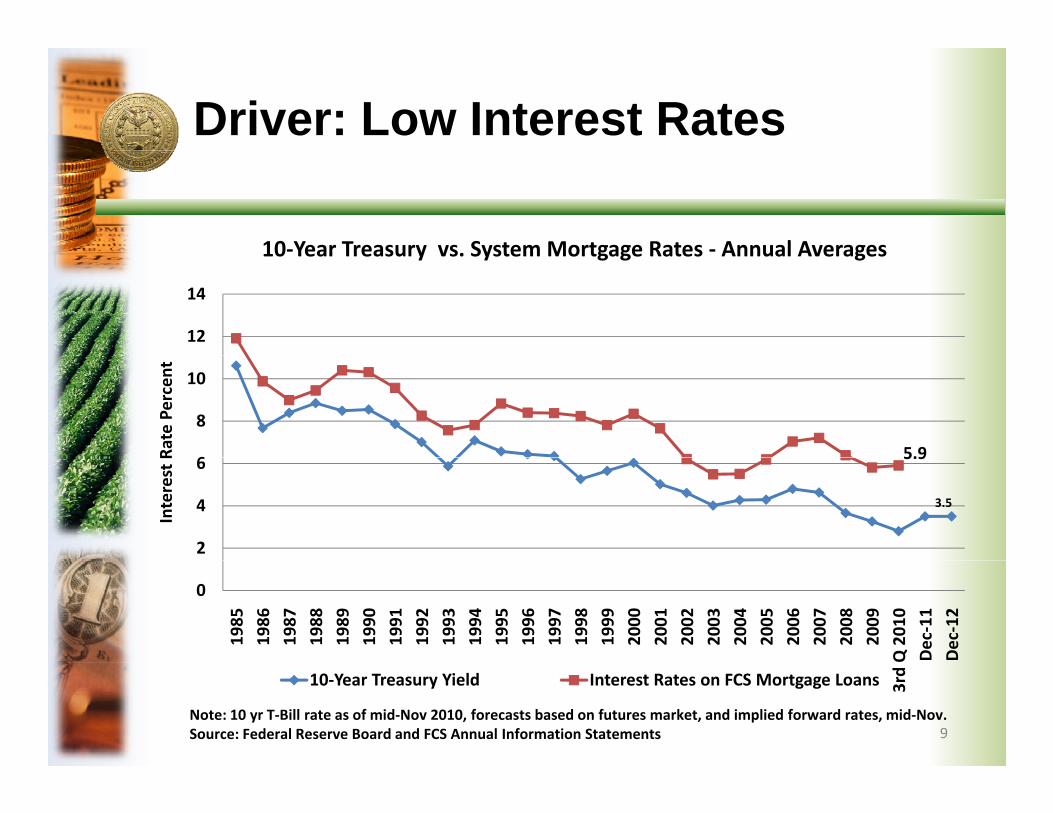
Driver: Low Interest Rates
10‐Year Treasury vs. System Mortgage Rates ‐ Annual Averages
5.9
3.5
5.9
10 Year Treasury vs. System Mortgage Rates Annual Averages
Interest
RRate Pe
rcen
t
14
12
10
8
66
4
2
0
1985
1986
1987
1988
1989
1990
1991
1992
1993
1994
1995
1996
1997
1998
1999
2000
2001
2002
2003
2004
2005
2006
2007
2008
2009
Q 2010
Dec‐11
Dec‐12
9
3rd 10‐Year Treasury Yield Interest Rates on FCS Mortgage Loans
Note: 10 yr T‐Bill rate as of mid‐Nov 2010, forecasts based on futures market, and implied forward rates, mid‐Nov. Source: Federal Reserve Board and FCS Annual Information Statements

This National Level Indicator does Not Sh E id f R t B bblShow Evidence of a Recent Bubble
Market Value of U.S. Farm Real Estate Divided by its Capitalized Value y p
3.5
4.0
4.5 1981 Peak in Land Values
A ratio significantly above 1.0 suggests that land prices may not be supported by returns
Ratio
2.5
3.0
may not be supported by returns.
Ratio = national average farmland price divided by Cap. value. Cap. value = 3‐year averages of net farm income plus
t t t l dl d di id d b th R
1.0
1.5
2.0 net rent to landlords divided by the annualized rate on 10‐year Treasury Notes.
0.0
0.5
1970 1975 1980 1985 1990 1995 2000 2005
10
1970 1975 1980 1985 1990 1995 2000 2005
Ratio of Market Value to Capitalized Value
Source: FCA/ORP chart derived from USDA and Federal Reserve System data.
2010F
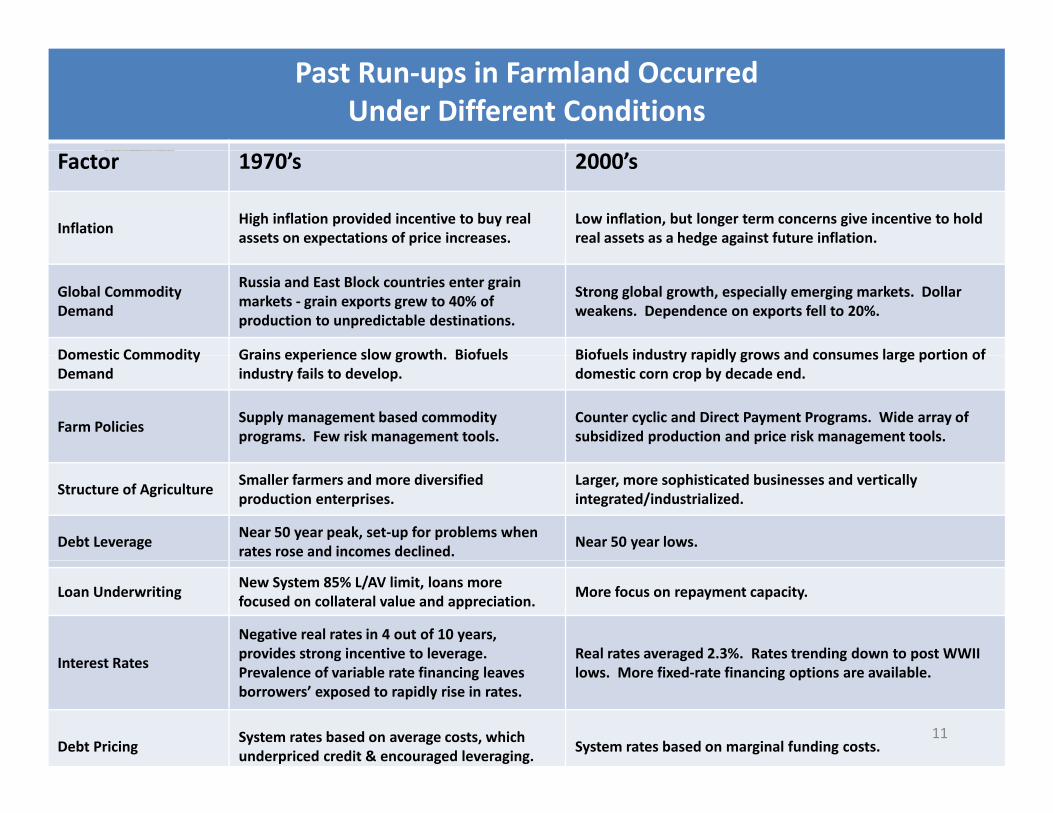
Past Run‐ups in Farmland Occurred Under Different Conditions
Factor 1970’s 2000’s
Inflation High inflation provided incentive to buy real assets on expectations of price increases.
Low inflation, but longer term concerns give incentive to hold real assets as a hedge against future inflation.
Global Commodity Demand
Russia and East Block countries enter grain markets ‐ grain exports grew to 40% of production to unpredictable destinations.
Strong global growth, especially emerging markets. Dollar weakens. Dependence on exports fell to 20%.
Domestic Commodity Grains experience slow growth Biofuels Biofuels industry rapidly grows and consumes large portion of Domestic Commodity Demand
Grains experience slow growth. Biofuels industry fails to develop.
Biofuels industry rapidly grows and consumes large portion of domestic corn crop by decade end.
Farm Policies Supply management based commodity programs. Few risk management tools.
Counter cyclic and Direct Payment Programs. Wide array of subsidized production and price risk management tools.
Structure of Agriculture Smaller farmers and more diversified production enterprises.
Larger, more sophisticated businesses and vertically integrated/industrialized.
Debt Leverage Near 50 year peak, set‐up for problems when rates rose and incomes declined.
Near 50 year lows.
Loan Underwriting New System 85% L/AV limit, loans more focused on collateral value and appreciation.
More focus on repayment capacity.
Interest Rates
Negative real rates in 4 out of 10 years, provides strong incentive to leverage. Real rates averaged 2.3%. Rates trending down to post WWII
Interest Rates Prevalence of variable rate financing leaves borrowers’ exposed to rapidly rise in rates.
lows. More fixed‐rate financing options are available.
Debt Pricing System rates based on average costs, which underpriced credit & encouraged leveraging.
System rates based on marginal funding costs. 11
Observations On Current Farm Real Estate MarketFarm Real Estate Market
¾Most land is sold to farmers - desire to ¾Most land is sold to farmers desire to expand given prospect of attractive returns ¾High Non-farm investor interest - farmland g
returns not correlated with stocks or bonds and far less volatile, diverse buyers ¾Thin markets - owners in no rush to sell in
rising market with strong income and few l i i ialternative investment options
¾Demand for quality land is strong -ti l l d k t k t iti lrecreational land markets weak, transitional
land market gone 12
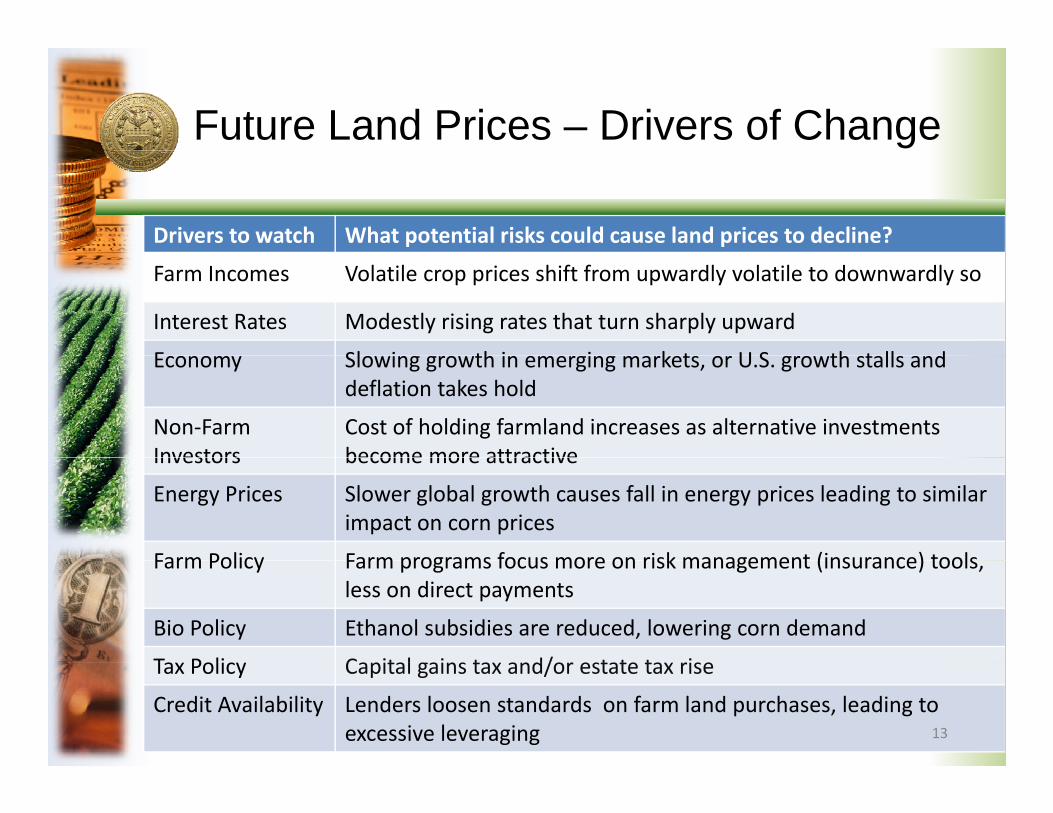
Future Land Prices – Drivers of Change
Drivers to watch What potential risks could cause land prices to decline?
Farm Incomes Volatile crop prices shift from upwardly volatile to downwardly so
Interest Rates Modestly rising rates that turn sharply upward
E Sl i th i i k t U S th t ll dEconomy Slowing growth in emerging markets, or U.S. growth stalls and deflation takes hold
Non‐Farm Investors
Cost of holding farmland increases as alternative investments become more attractive Investors become more attractive
Energy Prices Slower global growth causes fall in energy prices leading to similar impact on corn prices
Farm Policy Farm programs focus more on risk management (insurance) tools Farm Policy Farm programs focus more on risk management (insurance) tools, less on direct payments
Bio Policy Ethanol subsidies are reduced, lowering corn demand
Tax Policy Capital gains tax and/or estate tax rise Tax Policy Capital gains tax and/or estate tax rise
Credit Availability Lenders loosen standards on farm land purchases, leading to excessive leveraging 13
¾
Concluding Observations
Whil i h i h l N i l b bbl i¾ While prices have risen sharply, a National bubble in land prices was not apparent going into 2010.
¾ Land prices in transition areas could continue to¾ Land prices in transition areas could continue to decline and facility liquidations, such as dairy or hogs, could depress land prices in surrounding areas.
¾ Rising interest rates will negatively affect farmland prices, possibly offset by strong commodity prices.
¾ Land prices are likely going higher in 2011 The ¾ Land prices are likely going higher in 2011. The Agency’s guidance and examination of collateral risk management practices will be timely.
14

FCA Guidance on Collateral Risk Management
Robert Coleman
Director and Chief ExaminerDirector and Chief Examiner
Office of Examination

t t
FCA Collateral Risk Management GuidanceGuidance
¾FCA’s collateral risk guidance history � FCA response to the 1980s crisis –
established our collateral evaluation regulations: Section 614 (September 1994) C i li i C ll l Ri k (M h 2005 IM) � Capitalizing Collateral Risk (March 2005 IM) � Significant Asset Growth and Its Implications
(F b 2007 IM) (February 2007 IM)
16

FCA Collateral Risk Management GuidanceGuidance
¾More recent FCA guidance includes:¾More recent FCA guidance includes: � Asset Growth, Market Volatility, and Best
Practices for Fast Growing InstitutionsPractices for Fast Growing Institutions (May 2008 IM) � FCA Bookletter – BL #58 in May 2009y� Guidance for Evaluating the Safety and
Soundness of Real Estate Lending(D b 2009 E B ll ti )(December 2009 Exam Bulletin) � FCA’s Stress Testing Expectations
(March 2010 IM)(March 2010 IM)
17
FCA Collateral Risk Management GuidanceGuidance
¾Collateral Risk Management in FCS¾Collateral Risk Management in FCS Institutions (June 2010 IM) � Encouraged improvement of collateral risk� Encouraged improvement of collateral risk
management practices � Defined real estate collateral riskDefined real estate collateral risk � Urged institutions to stress test impact of a
rising interest rate scenariorising interest rate scenario � Identified examination expectations for
managing collateral riskg g
18

FCA Collateral Risk Management GuidanceGuidance
¾National Oversight Plan for FY2010 and¾National Oversight Plan for FY2010 and FY2011
C ll t l Ri k M t� Collateral Risk Management 9Points to heightened collateral risk in several
stress sectors and regionsstress sectors and regions 9Need for collateral risk studies 9Monitoring and assessing collateral risk 9Adjustments made to better manage collateral
risk 9I fl l d iti d t9Influence on loan underwriting and stress
testing 19

t
Future Analyses and Monitoringy g
¾Evaluate farmland price changes ¾Continue to analyze potential impact ofy p p
changes in collateral values on the FCS ¾Examination activities to continue focus¾Examination activities to continue focus
on collateral risk management ¾More collaboration with other financial¾More collaboration with other financial
regulators ¾I lit f d ¾Improve quality of data
20