Embed Size (px)
Citation preview

7/30/2019 Farming Systems and Sustainable Agriculture
http://slidepdf.com/reader/full/farming-systems-and-sustainable-agriculture 1/149
7/30/2019 Farming Systems and Sustainable Agriculture
http://slidepdf.com/reader/full/farming-systems-and-sustainable-agriculture 2/149
Farming Systems andSustainable Agriculture
7/30/2019 Farming Systems and Sustainable Agriculture
http://slidepdf.com/reader/full/farming-systems-and-sustainable-agriculture 3/149
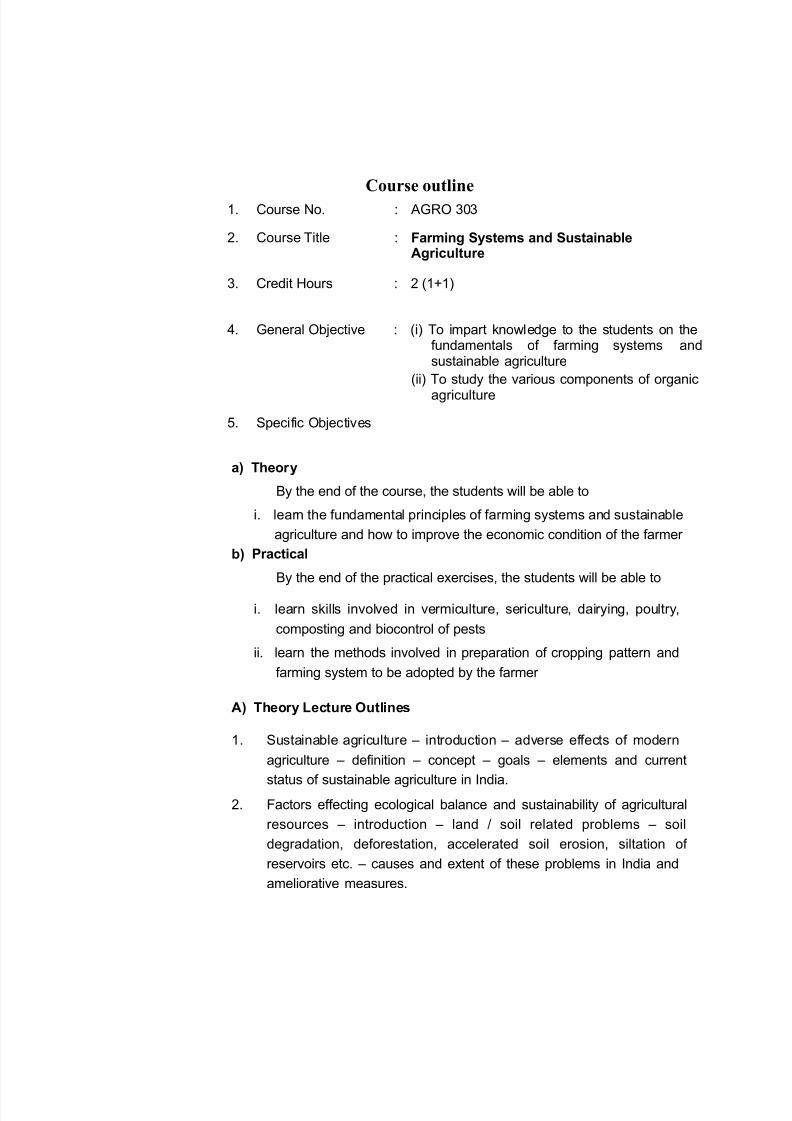
Course outline1.
2.
Course No.
Course Title
:
:
AGRO 303
Farming Systems and SustainableAgriculture
3. Credit Hours : 2 (1+1)
4. General Objective : (i) To impart knowledge to the students on thefundamentals of farming systemssustainable agriculture
and
(ii) To study the various components of organicagriculture
5. Specific Objectives
a) Theory
By the end of the course, the students will be able to
i. learn the fundamental principles of farming systems and sustainable
agriculture and how to improve the economic condition of the farmer
Practical
By the end of the practical exercises, the students will be able to
b)
i. learn skills involved in vermiculture, sericulture, dairying, poultry,
composting and biocontrol of pests
ii. learn the methods involved in preparation of cropping pattern and
farming system to be adopted by the farmer
A) Theory Lecture Outlines
1. Sustainable agriculture – introduction – adverse effects of modern
agriculture – definition – concept – goals – elements and currentstatus of sustainable agriculture in India.
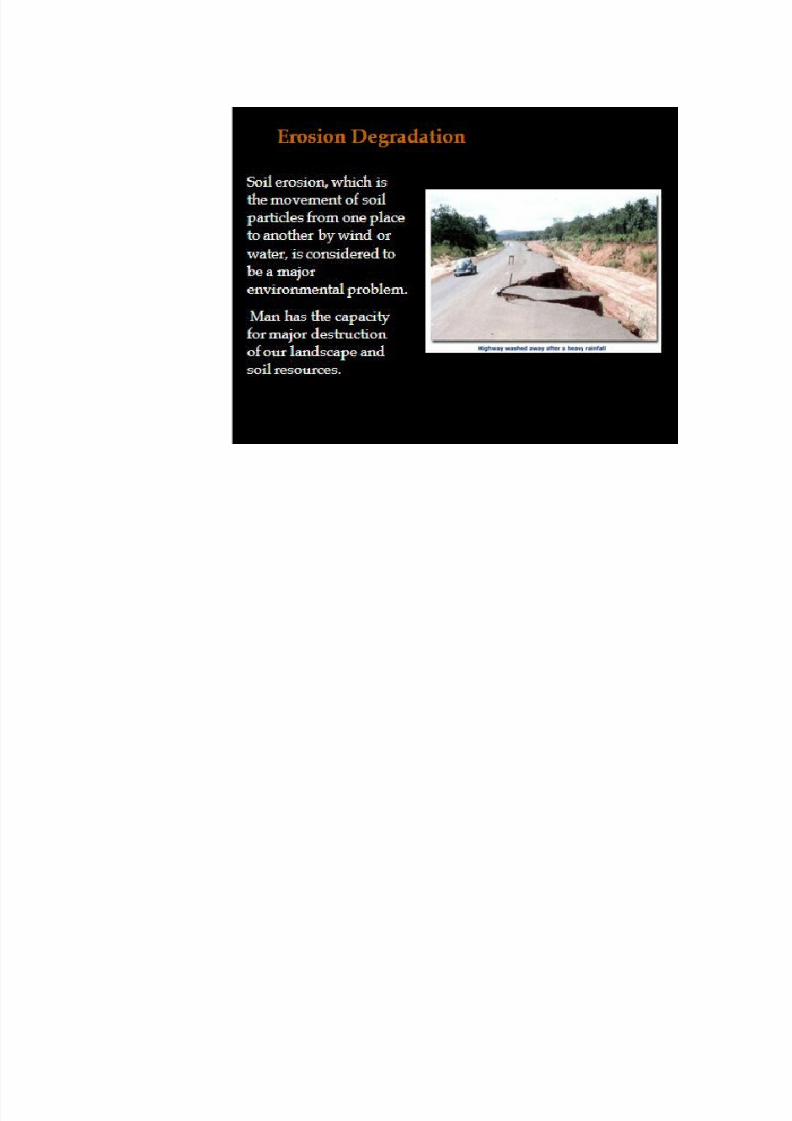
Factors effecting ecological balance and sustainability of agricultural
resources – introduction – land / soil related problems – soil
degradation, deforestation, accelerated soil erosion, siltation of
reservoirs etc. – causes and extent of these problems in India and
ameliorative measures.
2.
7/30/2019 Farming Systems and Sustainable Agriculture
http://slidepdf.com/reader/full/farming-systems-and-sustainable-agriculture 4/149
3. Rise in water table – water logging – salinization and alkalization in
command areas – extent of these problems in India and Andhra
Pradesh – prevention, control and reclamation measures – sea water
inundation and sand casting during cyclonic storms and their effects
on agriculture.
Ground water development – resource availability in India and
Andhra Pradesh – Groundwater development scenario – over
exploitation problems and safe yield concept – artificial recharge
methods
Environmental pollution – Introduction – greenhouse effect and
potential effects on agriculture – depletion of ozone layer, methane
emissions from rice fields and mitigation options
Fertilizers as a source of pollution and control measures –
introduction – nitrate pollution in soil and ground water and
4.
5.
6.
eutrophication – management factors to reduce fertilizer pollution
7. Pesticides as source of pollution and control measures – bio-
pesticides and bio-herbicides
Management of natural resources – introduction – land – water –
irrigation problems – Impact on Low External Input Agriculture (ILEIA)
8.
and Low External Inputs for Sustainable Agriculture (LEISA)
vegetative cover – present scenario and management practices
Conjunctive use of water – definition – objectives – types
advantages and limitations – wasteland and their management
–
9. –
–definition – classification – distribution in India and Andhra Pradesh –
need for development and regenerative measures
Organic farming – definition – principles – relevance to modern
agriculture and components of organic farming – integrated nutrient
management
Organic farming – practices – weed management – pest
management –
Farming systems – system and systems approach – farming system
– determinants of farming system – cropping systems and related
terminology
Study of allied enterprises – significance of integrating crop and
livestock – dairying and sheep and goat rearing – breeds – housing
– feed and fodder requirements – biogas plant
10.
11.
12.
13.
7/30/2019 Farming Systems and Sustainable Agriculture
http://slidepdf.com/reader/full/farming-systems-and-sustainable-agriculture 5/149
14. Study of allied enterprises – poultry farming – breeds – housing –
feed and fodder requirements – apiculture – species and
management
Study of allied enterprises – sericulture – moriculture and silkworm
rearing – agro-forestry systems suitable for dryland farmingBiodiversity – importance – agricultural intensification and biodiversity
– adverse impacts of genetic erosion – conservation of natural
resources
15.
16.
B) Practical Class Outlines
1. Preparation of cropping scheme to suit different irrigated andgarden land situations
Preparation of farming systems to suit to dryland situation
Compost makingVermicompost
Preparation of enriched farmyard manure
Recycling of urban waste
Use of bio-pesticides
Preparation of project proposals for land development
Management of problematic soils
Management practices to prevent environmental deterioration for sustainable agriculture
Visit to wetland farm – observation on resource allocation, recycling
of inputs and economicsVisit to garden land farm – observation on resource allocation,recycling of inputs and economics
Visit to dry land farm – observation on resource allocation, recyclingof inputs and economics
Methods of profitable utilization of agricultural wastes
Methods of profitable utilization of agricultural by-products
Methods of profitable utilization of agro-industry wastes
2.
3.4.
5.
6.
7.
8.
9.
10.
11.
12.
13.
14.
15.
16.
References
Arun, K. Sharma. 2006. A Hand Book of Organic Farming. Agrobios (India),Jodhpur.
Dahama, A.K. 2007. Organic Farming for Sustainable Agriculture. Agrobios
(India), Jodhpur.
Dalela, R.C. and Mani, U.H. 1985. Assessment of Environmental Pollution.
Academy of Environmental Biology, Muzaffarnagar.

7/30/2019 Farming Systems and Sustainable Agriculture
http://slidepdf.com/reader/full/farming-systems-and-sustainable-agriculture 6/149
Deb, D.L. 1994. Natural Resources Management for Sustainable
Agriculture and Environment. Angkor publishers Ltd., New Delhi. Purohit,
S.S. 2006. Trends in Organic Farming in India. Agrobios (India),
Jodhpur.
Ruthenburg, H. 1971. Farming Systems in Tropics. Clarendon Press,
London.
Saroja Raman. 2006. Agricultural Sustainability – Principles, Processes
and Prospects. Food Products Press, New York.
Subramaniyan, S. 2004. Globalization of Sustainable Agriculture. Kalyani
Publishers, Ludhiana.
Thampan, P.K. 1993. Organics in Soil Health and Crop Production. Peekay
Tree Crops Development Foundation, Cochin.
7/30/2019 Farming Systems and Sustainable Agriculture
http://slidepdf.com/reader/full/farming-systems-and-sustainable-agriculture 7/149
Lecture No.1INTRODUCTION TO SUSTAINABLE AGRICULTURE
1.1 Introduction
Over the history of human settlements on the planet earth,agriculture has transformed in tune with the growing population and itschallenging needs. The transformation has been quite remarkable sincethe end of World War II. Food and fibre productivity spared up due toadoption of new technologies viz, HYV, from mechanization, increasedfertilizer & pesticide use, specialized farming practices, water resourcedevelopment & improved irrigation practices and Government policiesthat favored maximizing production. It was in the early 1960s, the GreenRevolution took shape in developing countries, especially India. It led to
the attainment of self- sufficiency in food grain production. This has been described by Donald plunkett (1993), scientific adviser to theCGIAR, ashumankind,change was
the greatest agricultural transformationand most of it has taken place during
brought about the rise of Science-based
in the history of our lifetime. Theagriculture which
permitted higher and more stable food production, ensuring food stabilityand security for a constantly growing world population’. A major
problem was that these benefits have been poorly distributed’. Many people have missed out and hunger still persists in many parts of the
world. Estimates by the FAO and WHO (1992) and the Hunger Project(1991) suggest that around 1 billion people in the world have diets thatare ‘too poor to abstain the energy required for healthy growth of children and minimal activity of adults’. The causes are complex and it isnot entirely the fault of overall availability of food. Nonetheless, the
process of agricultural modernization has been an important contributingfactor, in that the technologies have been more readily available to the
better-off.
Modern agriculture begins on the research station, where researchers
have access to all i.e., necessary inputs of fertilizers, pesticides andlabour at all the appropriate times. But when the package is extended tofarmers, even the best performing farms cannot match the yields theresearchers get. For high productivity per hectare, farmers, need accessto the whole package – modern seeds, water, labour, capital or credit,fertilizers and pesticides. Many poorer farming households simply
7/30/2019 Farming Systems and Sustainable Agriculture
http://slidepdf.com/reader/full/farming-systems-and-sustainable-agriculture 8/149
cannot adopt the whole package. If one element is missing, the seeddelivery system fails or the fertilizer arrives late, or there is insufficientirrigation water, then yields may not be much better than those for traditional varieties. Even if farmers want to use external resources, veryoften delivery systems are unable to supply them on time.
Where production has been improved through these moderntechnologies, all too often there have been adverse environmental andsocial impacts in both the advanced and developing countries includingIndia. These include the following:
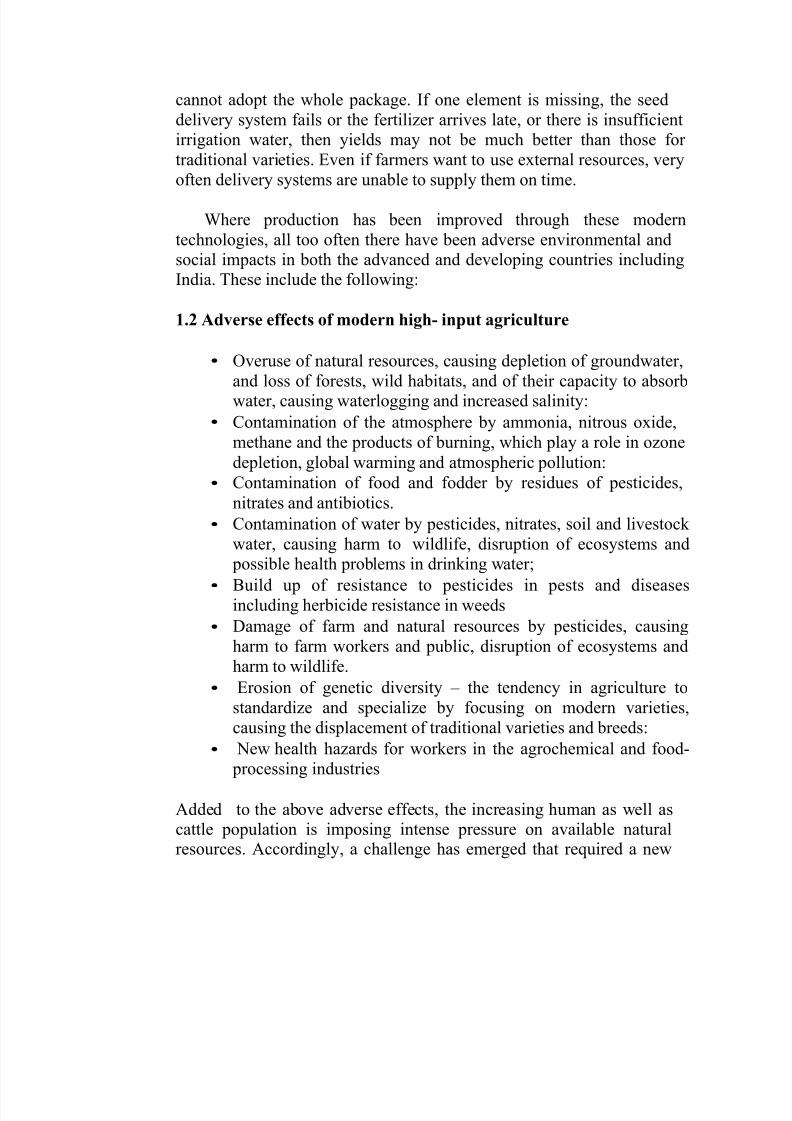
1.2 Adverse effects of modern high- input agriculture
• Overuse of natural resources, causing depletion of groundwater,
and loss of forests, wild habitats, and of their capacity to absorbwater, causing waterlogging and increased salinity:
Contamination of the atmosphere by ammonia, nitrous oxide,methane and the products of burning, which play a role in ozonedepletion, global warming and atmospheric pollution:Contamination of food and fodder by residues of pesticides,nitrates and antibiotics.
Contamination of water by pesticides, nitrates, soil and livestock water, causing harm to wildlife, disruption of ecosystems and
possible health problems in drinking water;Build up of resistance to pesticides in pests and diseasesincluding herbicide resistance in weeds
Damage of farm and natural resources by pesticides, causingharm to farm workers and public, disruption of ecosystems andharm to wildlife.
Erosion of genetic diversity – the tendency in agriculture tostandardize and specialize by focusing on modern varieties,causing the displacement of traditional varieties and breeds:
New health hazards for workers in the agrochemical and food- processing industries
•
•
•
•
•
•
•
Added to the above adverse effects, the increasing human as well ascattle population is imposing intense pressure on available naturalresources. Accordingly, a challenge has emerged that required a new
7/30/2019 Farming Systems and Sustainable Agriculture
http://slidepdf.com/reader/full/farming-systems-and-sustainable-agriculture 9/149
vision, holistic approaches for ecosystem management and renewed partnership between science and society.
In December 1983, the UN General Assembly established the27
thWorld Commission on Environment and Development. In 1987, onof April, at the queen Elizabeth Hall in London, the Prime Minister of
Norway, Mrs. Brundtland, who is also the Chairman of the WorldCommission of Environment and development, released the publicationof “ Our Common Future” by the World Commission on Environmentand Development (WCED) and said: “ Securing our common future willrequire new energy and openness, fresh insights, and an ability to look
beyond the narrow bounds of national frontiers and separate Scientificdisciplines. The young are better at such vision than we, who are toooften constrained by the traditions of former, more fragmented World.
We must tap their energy, their openness, their ability to see theinterdependence of issues…” She suggests that we must adopt a new
paradigm based on a completely new value system. “ Our generation hastoo often been willing to use the resources of the future to meet our ownshort- term goals. It is a debt we can never repay. If we fail to change our ways, these young men and women will suffer more than we, and theyand their children will be denied their fundamental right to a healthy
productive, life-enhancing environment.” Her speech made it clear thatwe are consuming resources, which must be transferred to the nextgeneration. We must recognize that, because resources are limited, weneed a sustainable way of life.
Almost at the same time the realization of prime importance of staple food production for achieving food security for future generationshas brought the concept of “Sustainable Agriculture” to the forefront and
began to take shape in the following three points.
1. The interrelatedness of all the farming systems including thefarmer and the family.The importance of many biological balances in the system.
The need to maximize desired biological relationships in the systemand minimize the use of materials and practices that disrupt theserelations.
2.
3.
Sustainability of agricultural systems has become a global concern todayand many definitions so Sustainable Agriculture have become available.
7/30/2019 Farming Systems and Sustainable Agriculture
http://slidepdf.com/reader/full/farming-systems-and-sustainable-agriculture 10/149
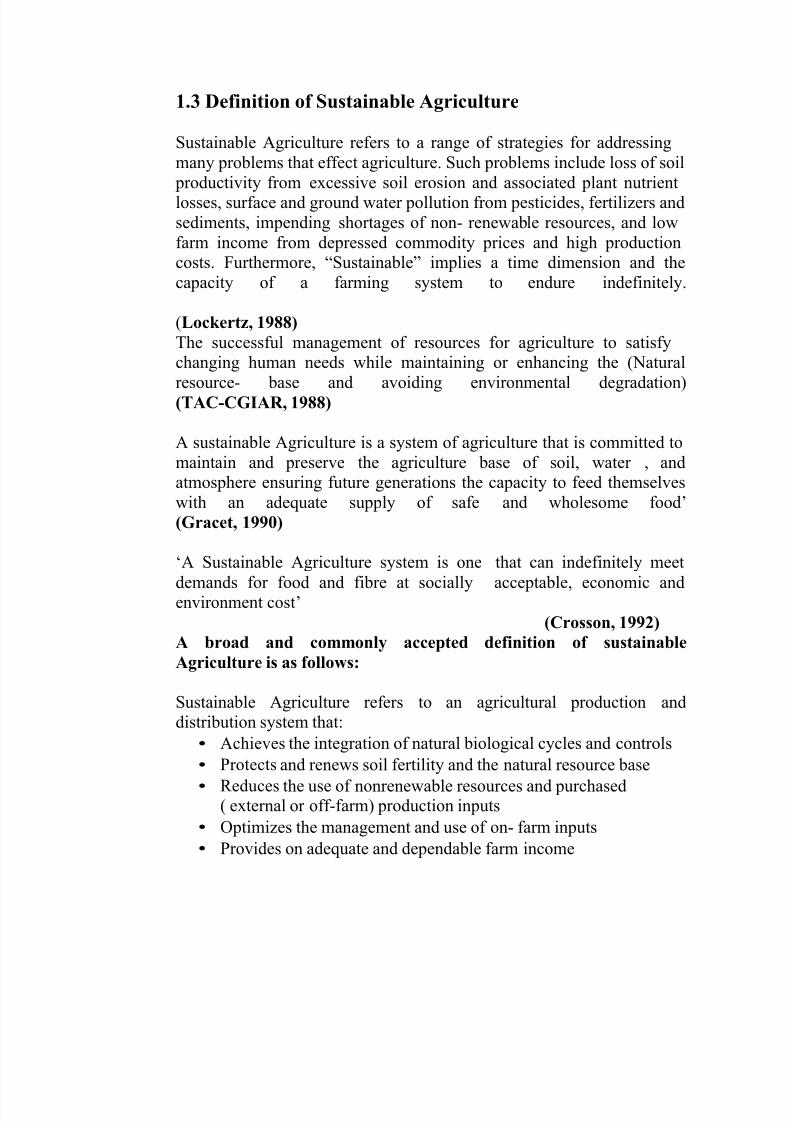
1.3 Definition of Sustainable Agriculture
Sustainable Agriculture refers to a range of strategies for addressingmany problems that effect agriculture. Such problems include loss of soil
productivity from excessive soil erosion and associated plant nutrientlosses, surface and ground water pollution from pesticides, fertilizers andsediments, impending shortages of non- renewable resources, and lowfarm income from depressed commodity prices and high productioncosts. Furthermore, “Sustainable” implies a time dimension and thecapacity of a farming system to endure indefinitely.
(Lockertz, 1988)
The successful management of resources for agriculture to satisfychanging human needs while maintaining or enhancing the (Natural
resource- base and avoiding environmental degradation)(TAC-CGIAR, 1988)
A sustainable Agriculture is a system of agriculture that is committed tomaintain and preserve the agriculture base of soil, water , andatmosphere ensuring future generations the capacity to feed themselveswith an adequate supply of safe and wholesome food’(Gracet, 1990)
‘A Sustainable Agriculture system is onedemands for food and fibre at sociallyenvironment cost’
that can indefinitely meetacceptable, economic and
(Crosson, 1992)
A broad and commonly accepted definition of sustainable
Agriculture is as follows:
Sustainable Agriculture refers to an agricultural production anddistribution system that:
•
•
•
Achieves the integration of natural biological cycles and controls
Protects and renews soil fertility and the natural resource baseReduces the use of nonrenewable resources and purchased( external or off-farm) production inputs
Optimizes the management and use of on- farm inputs
Provides on adequate and dependable farm income
•
•
7/30/2019 Farming Systems and Sustainable Agriculture
http://slidepdf.com/reader/full/farming-systems-and-sustainable-agriculture 11/149
• Promotes opportunity in family farming and farm communities,and
• Minimizes adverse impacts on health, safety, wildlife, water quality and the environment
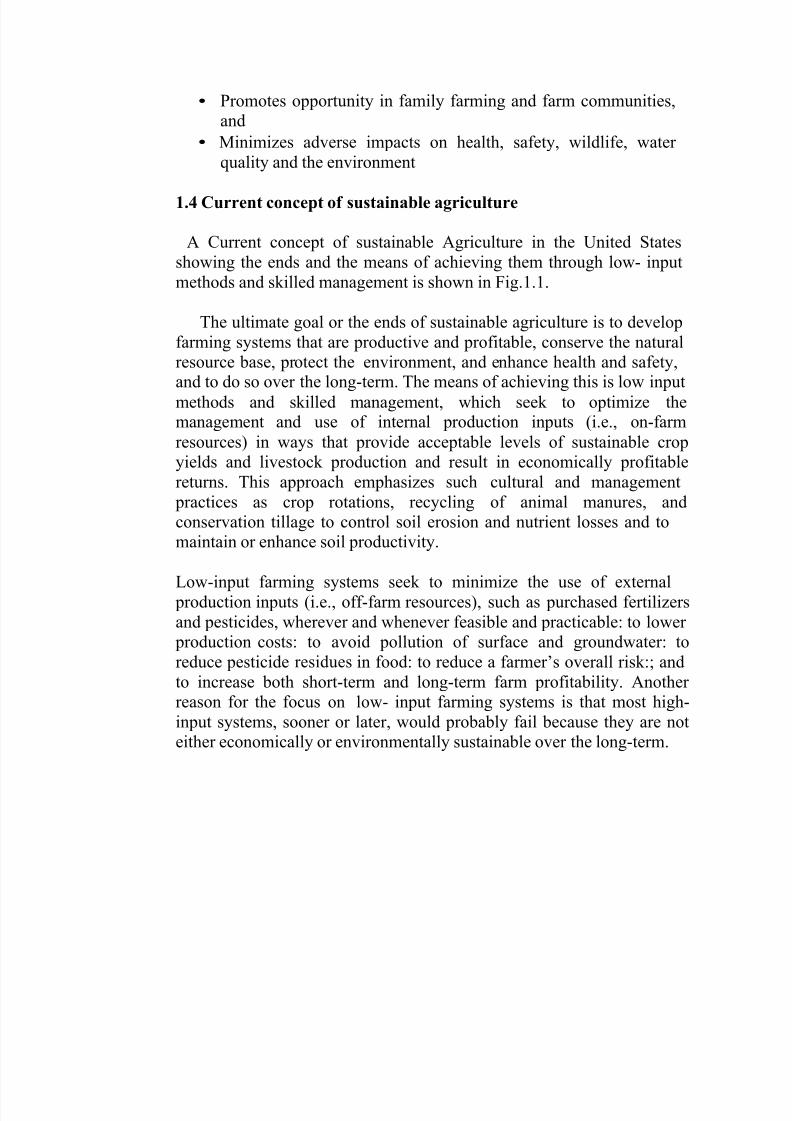
1.4 Current concept of sustainable agriculture
A Current concept of sustainable Agriculture in the United Statesshowing the ends and the means of achieving them through low- inputmethods and skilled management is shown in Fig.1.1.
The ultimate goal or the ends of sustainable agriculture is to developfarming systems that are productive and profitable, conserve the naturalresource base, protect the environment, and enhance health and safety,
and to do so over the long-term. The means of achieving this is low inputmethods and skilled management, which seek to optimize themanagement and use of internal production inputs (i.e., on-farmresources) in ways that provide acceptable levels of sustainable cropyields and livestock production and result in economically profitablereturns. This approach emphasizes such cultural and management
practices as crop rotations, recycling of animal manures, andconservation tillage to control soil erosion and nutrient losses and tomaintain or enhance soil productivity.
Low-input farming systems seek to minimize the use of external production inputs (i.e., off-farm resources), such as purchased fertilizersand pesticides, wherever and whenever feasible and practicable: to lower
production costs: to avoid pollution of surface and groundwater: toreduce pesticide residues in food: to reduce a farmer’s overall risk:; andto increase both short-term and long-term farm profitability. Another reason for the focus on low- input farming systems is that most high-input systems, sooner or later, would probably fail because they are noteither economically or environmentally sustainable over the long-term.
7/30/2019 Farming Systems and Sustainable Agriculture
http://slidepdf.com/reader/full/farming-systems-and-sustainable-agriculture 12/149
and safety
1.2.3.
Reduceduse of syntheticchemical inputsBiological pest control
7. Crop rotations8.Use of Organic wastes
9.Crop- livestock diversification
4. Soil and water conservation practicesUse of animal and greenmanures
Biotechnology
10. Mechanical cultivation11. Naturallyoccurring
processes5.
6.
Fig.1.1 A current concept of States
sustainable Agriculture in The United
1.5 Goals of sustainable Agriculture
A sustainable Agriculture, therefore, is any system of food or fiber production that systematically pursues the following goals:
Low input
methods andskilled
management
Enhances healthProductive andProfitable
ConservesResources and protects the
environment
7/30/2019 Farming Systems and Sustainable Agriculture
http://slidepdf.com/reader/full/farming-systems-and-sustainable-agriculture 13/149
• A more thorough incorporation of natural processes such asnutrient cycling nitrogen fixation and pest-predator relationshipsinto agricultural production processes:
A reduction in the use of those off-farm, external and non-
renewable inputs with the greatest potential to damage theenvironment or harm the health of farmers and consumers, andmore targeted use of the remaining inputs used with a view tominimizing variable costs:
The full participation of farmers and rural people in all processesof problem analysis and technology development, adoption andextension.
A more equitable access to predictive resources and opportunities,and progress towards more socially just forms of Agriculture:
A greater productive use of the biological and genetic potential of plant and animal species:
A greater productive use of local knowledge and practices,including innovation in approaches not yet fully understood byscientists or widely adopted by farmers:
An increase in self-reliance among farmers and rural people
An improvement in the match between cropping patterns and the productive potential and environmental constraints of climate andlandscape to ensure long-term sustainability of current productionlevels: and
Profitable and efficient production with an emphasis on integratedform management: and the conservation of soil, water, energy and
biological resources
•
•
•
•
•
•
•
•
1.6 Elements of sustainability
There are many ways to improve the sustainability of a givenfarming system, and these vary from region to region, However, thereare some common sets of practices among farmers trying to take a
more sustainable approach, in part through greater use of on-farm or local resources each contributing in some way to long- term profitability, environmental stewardship and rural quality of life.
a) Soil conservation- Many soil conservation methods, includingcontour cultivates contour bunding, graded bunding, vegetative barriers,
7/30/2019 Farming Systems and Sustainable Agriculture
http://slidepdf.com/reader/full/farming-systems-and-sustainable-agriculture 14/149
strip cropping cover cropping, reduced tillage etc help prevent loss of soil due to wind and water erosion
b) Crop diversity- Growing a greater variety of crops on a farm canhelp reduce risks from extremes in weather, market conditions or crop
pests. Increased diversity crops and other plants, such as trees andshrubs, also can contribute to soil conservation, wildlife habitat andincreased populations of beneficial insects
c) Nutrient management- Proper management of nitrogen and other plant nutrients con improve the soil and protect environment. Increaseduse of farm nutrient sources such as manure and leguminous cover crops,also reduces purchased fertilizer costs.
d) Integrated pest management (IPM)- IPM is a sustainable approachto managing pests by combining biological, cultural, physical andchemical tools in way that minimizes economic, health andenvironmental risks.
e) Cover crops- Growing plant such as sun hemp, horse gram, pillipesara in the off season after harvesting a grain or vegetable crop can provide several benefits, including weed suppression, erosion control,and improved soil nutrients and soil quality .
f) Rotational grazing- New management- intensive grazing systemstake animals out barn into the pasture to provide high-quality forage andreduced feed cost .
g) Water quality & water conservation- Water conservation and protection have important part of Agricultural stewardship. Many practices have been develop conserve Viz., deep ploughing, mulching,micro irrigation techniques etc.., protect quality of drinking and surfacewater .
h) Agro forestry- Trees and other woody perennials are oftenunderutilized on ----covers a range of practices Viz., ogi-silvicuture,silive-pastoral, agri-silvi-pagri-horticulture, horti/silvipastoral, alleycropping, tree farming , lay farm that help conserve, soil and water.
i) Marketing- Farmers across the country are finding that improvedmarketing -----way to enhance profitability, direct marketing of
7/30/2019 Farming Systems and Sustainable Agriculture
http://slidepdf.com/reader/full/farming-systems-and-sustainable-agriculture 15/149
agricultural product from farmers to consumers is becoming much morecommon, including through Rythu bazaar rod side stands .
1.7 Status of sustainable Agriculture in India
The survival and well being of the nation depends on sustainabledevelopment. It is a process of social and economic betterment thatsatisfy needs and values of interest groups without foreclosing options.Suitable Development of India demands access to state of are ‘clean’technologies and have as strategic role in increasing the capabilities of the country both o the environment as well as to provide thrust towardsconservation and sustainable agriculture. Current research programmestowards sustainable agriculture are as follows:
1. Resistant crop varieties to soil, climatic and biotic stresses2. Multiple cropping system for irrigated areas and tree based
farming system rainfall area.3. Integrated nutrient management
a. Combined use of organic and inorganic sources of nutrients
Use of green manures (Sesbania, Crotalaria etc)Inclusion of pulse crops in crop sequenceUse of bio fertilizers
b.c.d.
4. Integrated pest managementa. b.c.
Microbial controlUse of botanicalsUse of predators
5. Soil and water conservationa.
b.c.
WatershedmanagementUse of organics as mulch and manureUse of bio-fencing like vettiver
6. Agroforestry systems in dry lands/ sloppy areas and erosion proneareas
7. Farm implements to save energy in agriculture8. Use of non-conventional energy in Agriculture9. Input use efficiency
a. Water technology b. Fertilizer technology
10. Plant genetic resource collection and conservation.***
7/30/2019 Farming Systems and Sustainable Agriculture
http://slidepdf.com/reader/full/farming-systems-and-sustainable-agriculture 16/149
Lecture No.2
FACTORS AFFECTING ECOLOGICAL BALANCE AND
SUSTANABILITY OF AGRICULTURAL RESOURCES
2.1 Introduction
Technology generated and implemented for increasingAgricultural productivity during past three decades resulted in depletionof natural resource base besides creating several environmental andecological problems. In contrast the demand scenario features a growthrare in food requirements to meet the ever-increasing demand of thegrowing population. The total food grain demand of India by 2020 isestimated at 294 million tones as against the present 224 million tonnes(2010-11), which has to come from the almost static net cultivated area
of about 142 million ha. This improvement in food grain production hasto be achieved while dealing with the factors affecting the ecological
balance and sustainability of Agricultural resources.
Major factors affecting the ecological balance and
agricultural resources are:
a) Land/soil related problems
sustainability of
•
•
•
•
•
Soil degradatiom
Deforestation
Accelerated soil erosionSiltation of reserves
Wind erosion
b) Irrigation related problems
•
•
•
Rise in groundwater table & water logging
Soil salinization & alkalization
Over- exploitation of groundwater c) Indiscriminate use of agro-chemicals
• Fertilizer pollution
•
Pesticide pollutiond) Environmental pollution
•
•
•
•
Greenhouse effect
Depletion emissions
Methane emission
Eutrophication
7/30/2019 Farming Systems and Sustainable Agriculture
http://slidepdf.com/reader/full/farming-systems-and-sustainable-agriculture 17/149
e) Erosion of genetic biodiversity
2.2 Land/soil related problems
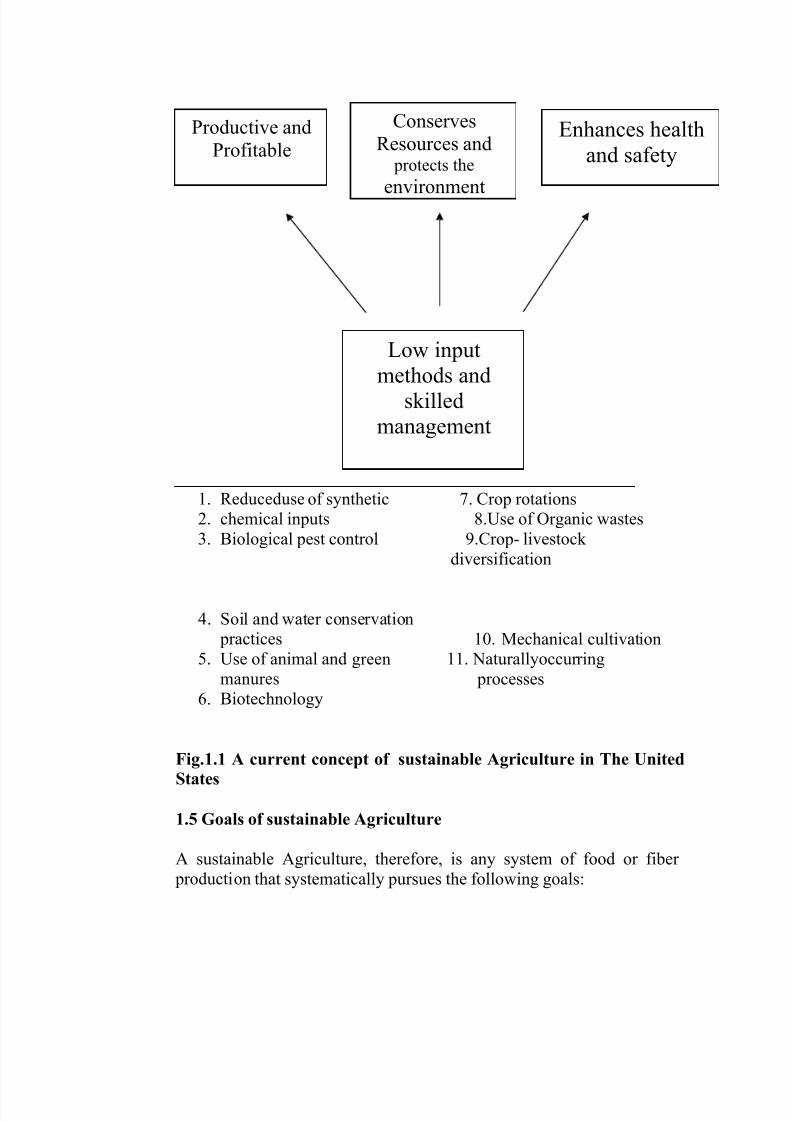
2.2.1 Soil degradation
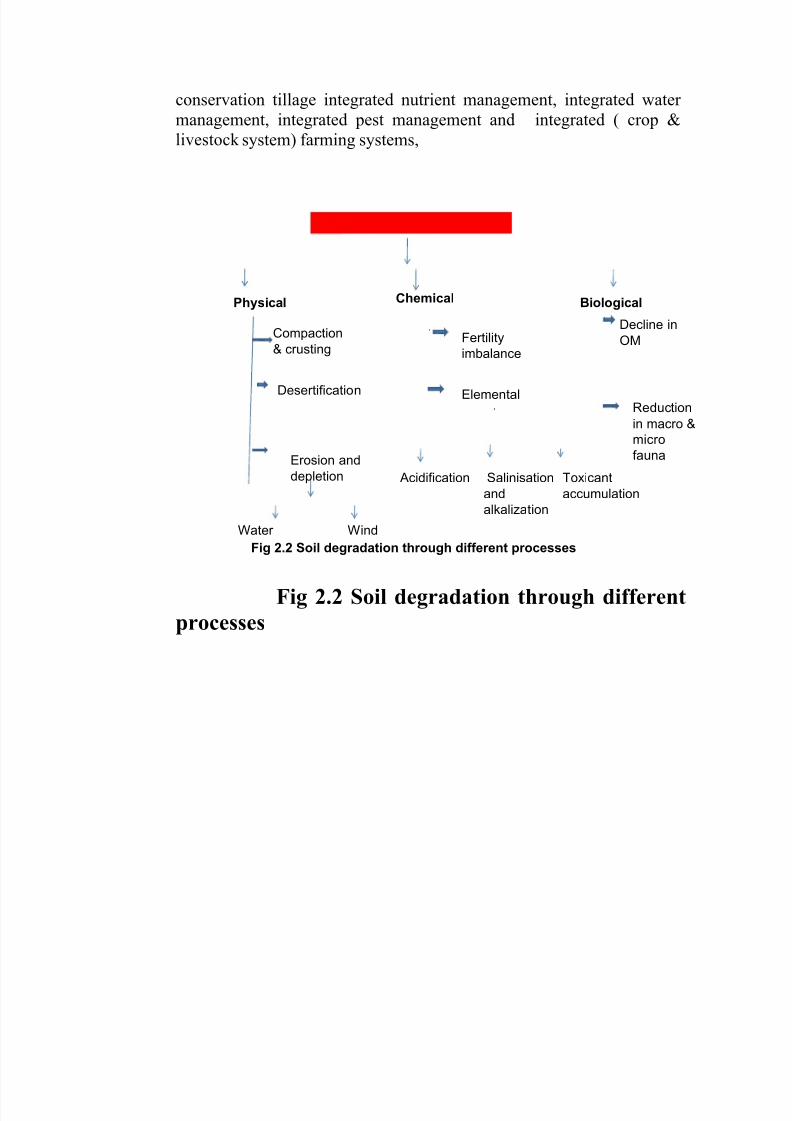
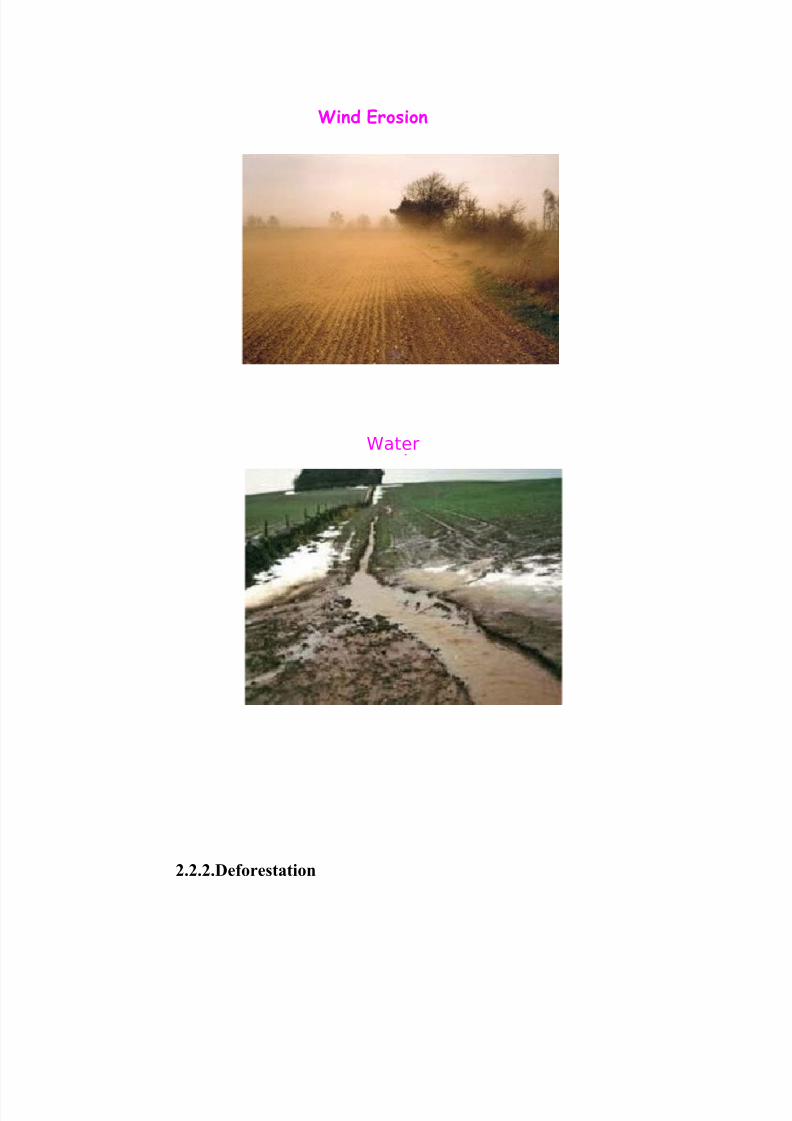
Soil degradation refers to decline tin the productive capacity of land dueto decline in soil quality caused through processed induced mainly byhuman activities. It is a global problem. The Global Assessment of theStatus of Human-induced soil Degradation (GLASOD) was the firstworldwide comparative analysis focusing specifically on soildegradation. Worldwide around 1.96. Billion ha are affected by human-induced soil degradation, mainly caused by water and wind erosion(1094 and 548 million ha respectively). Chemical degradation accountedfor 240 million ha, mainly nutrient decline (136 million ha) and
salinization (77 million ha), physical degradation occurred on 83 millionha, mainly as a result of compaction, sealing and crusting.It is also a very important problem in India, which shares only 2.4% of the world’s land resource and supports more than 18% of the world’shuman population and 15% of livestock population. Estimates of soildegradation are varied depending upon the criteria used.
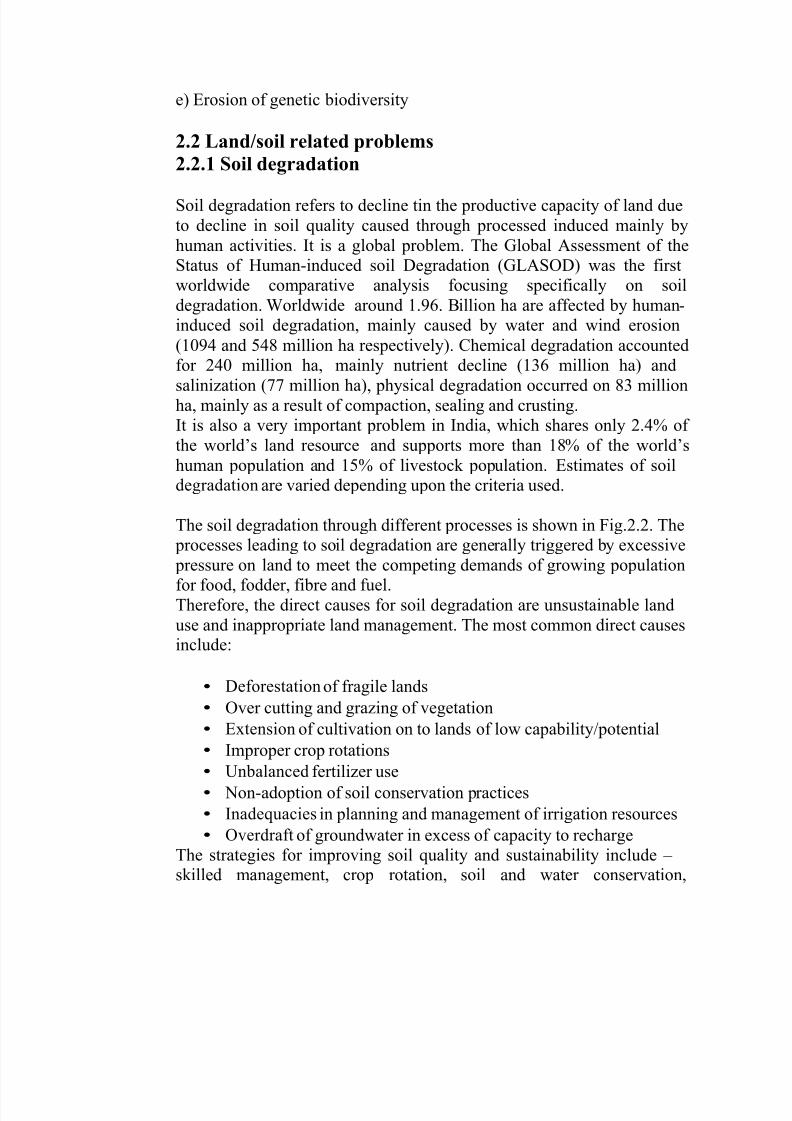
The soil degradation through different processes is shown in Fig.2.2. The processes leading to soil degradation are generally triggered by excessive
pressure on land to meet the competing demands of growing populationfor food, fodder, fibre and fuel.Therefore, the direct causes for soil degradation are unsustainable landuse and inappropriate land management. The most common direct causesinclude:
•
•
•
•
•
•
•
•
Deforestationof fragile lands
Over cutting and grazing of vegetation
Extension of cultivation on to lands of low capability/potential
Improper crop rotationsUnbalanced fertilizer use
Non-adoption of soil conservation practices
Inadequacies in planning and management of irrigation resources
Overdraft of groundwater in excess of capacity to rechargeThe strategies for improving soil quality and sustainability include – skilled management, crop rotation, soil and water conservation,
7/30/2019 Farming Systems and Sustainable Agriculture
http://slidepdf.com/reader/full/farming-systems-and-sustainable-agriculture 18/149
conservation tillage integrated nutrient management, integrated water management, integrated pest management andlivestock system) farming systems,
integrated ( crop &
ChemicalPhysical Biological
Decline in
OMCompaction
& crustingFertility
imbalance
Desertification ElementalReduction
in macro &
micro
faunaErosion and
depletion Acidification Salinisation
and
alkalization
Toxicant
accumulation
Water Wind
Fig 2.2 Soil degradation through different processes
Fig 2.2 Soil degradation through different
processes
7/30/2019 Farming Systems and Sustainable Agriculture
http://slidepdf.com/reader/full/farming-systems-and-sustainable-agriculture 19/149
Wind Erosion
Water
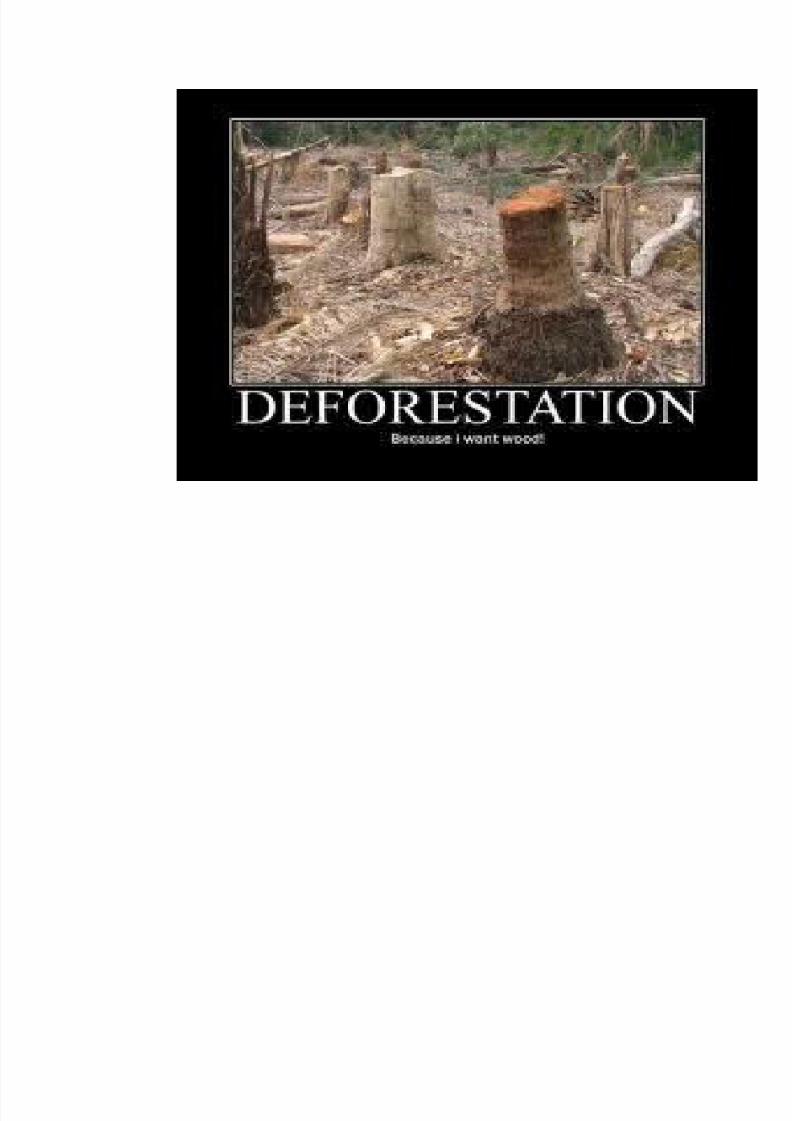
2.2.2.Deforestation
7/30/2019 Farming Systems and Sustainable Agriculture
http://slidepdf.com/reader/full/farming-systems-and-sustainable-agriculture 20/149
Deforestation, in strict sense of the term, refers to the transfer of forest land to non-forest uses and includes all land where the forest cover has been stripped off and the land converted to such uses as permanentcultivation, shifting cultivation, human settlements, mining, reservoirsetc. Deforestation continues to threaten and erode the area under forestcover in several countries of the World.The underlying causes of deforestation are rooted in a complex web of social, economic and institutional problems. They include:
(i) The combined effects of poverty, skewed land distribution, andrising population pressure
(ii) Increased demand for tropical timber and Agricultural products, and
International debt obligations, which can lead developingcountries to accelerate the pace of forest exploitation in order to earn needed foreign exchange
forest area in India has shrunk from 33% in 1947 to 22.6 % at
(iii)
The present. As per the recommended norm of the National Forest Policy1988, about 33% of the geographical area should be under the forestcover, which comes to about 110 million ha compared to 68.83 millionha presently under the forest cover in IndiaDeforestation, together with over grazing, is modifying the climate, andaccelerating the erosion of biodiversity, which in turn posing the threatto ecological sustainability and food security .
India has established an organization called the NationalAfforestation and Ecodevelopment Board (NAEB) in 1992 to take upafforestation programmes and bring back the productivity from thedegraded forestlands.
7/30/2019 Farming Systems and Sustainable Agriculture
http://slidepdf.com/reader/full/farming-systems-and-sustainable-agriculture 21/149
7/30/2019 Farming Systems and Sustainable Agriculture
http://slidepdf.com/reader/full/farming-systems-and-sustainable-agriculture 22/149
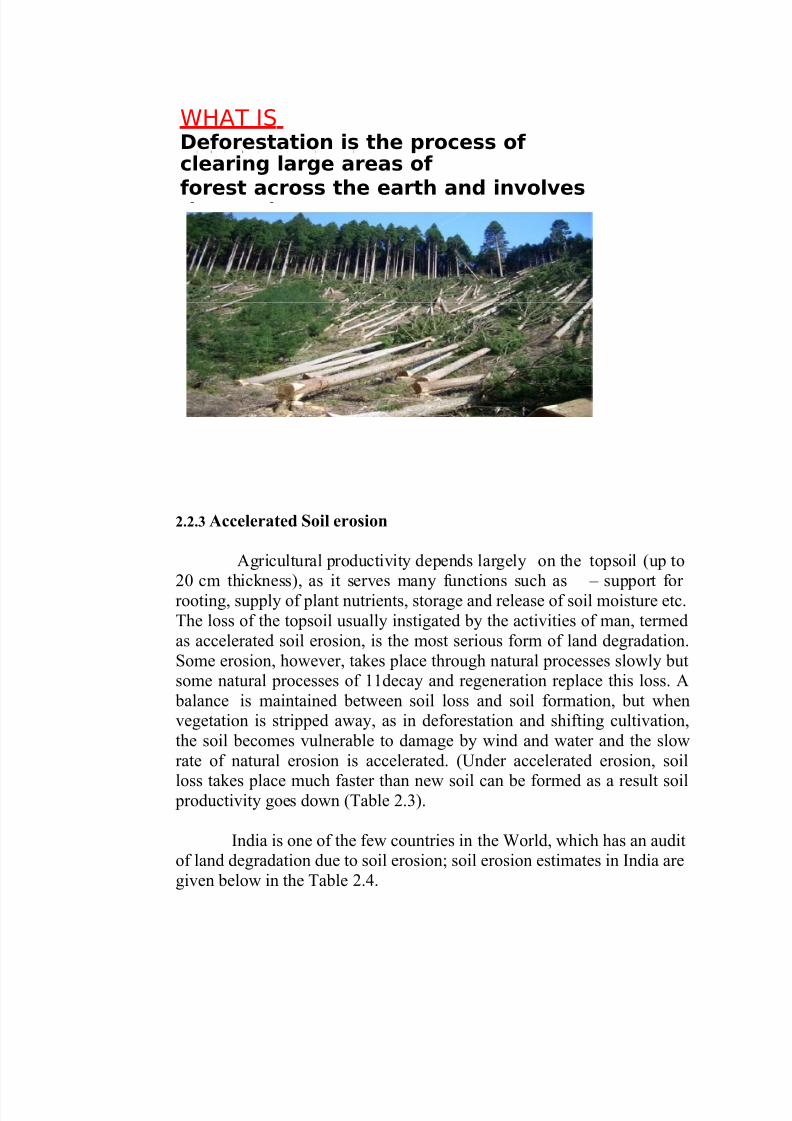
WH A T ISDeforestation is the process of clearing large areas of
forest across the earth and involves
2.2.3 Accelerated Soil erosion
Agricultural productivity depends largely on the topsoil (up to20 cm thickness), as it serves many functions such as – support for rooting, supply of plant nutrients, storage and release of soil moisture etc.The loss of the topsoil usually instigated by the activities of man, termedas accelerated soil erosion, is the most serious form of land degradation.Some erosion, however, takes place through natural processes slowly butsome natural processes of 11decay and regeneration replace this loss. A
balance is maintained between soil loss and soil formation, but whenvegetation is stripped away, as in deforestation and shifting cultivation,the soil becomes vulnerable to damage by wind and water and the slow
rate of natural erosion is accelerated. (Under accelerated erosion, soilloss takes place much faster than new soil can be formed as a result soil
productivity goes down (Table 2.3).
India is one of the few countries in the World, which has an auditof land degradation due to soil erosion; soil erosion estimates in India aregiven below in the Table 2.4.
7/30/2019 Farming Systems and Sustainable Agriculture
http://slidepdf.com/reader/full/farming-systems-and-sustainable-agriculture 23/149
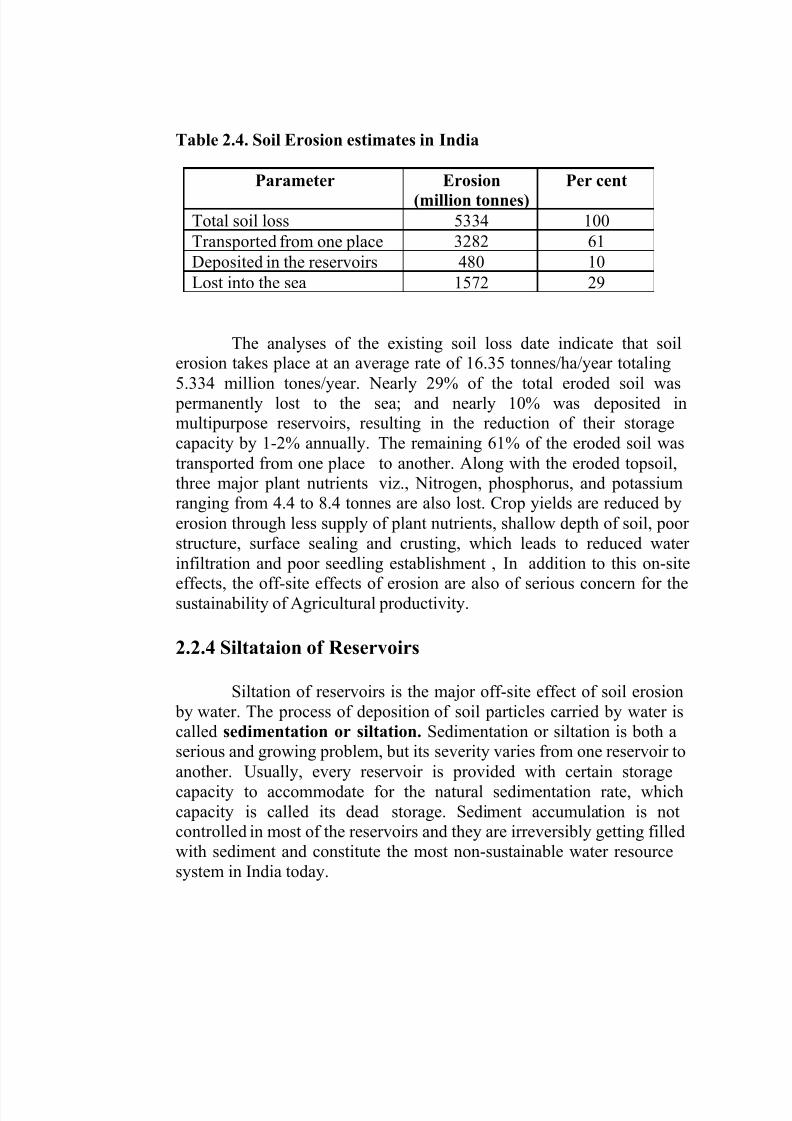
Table 2.4. Soil Erosion estimates in India
The analyses of the existing soil loss date indicate that soilerosion takes place at an average rate of 16.35 tonnes/ha/year totaling
5.334 million tones/year. Nearly 29% of the total eroded soil was permanently lost to the sea; and nearly 10% was deposited inmultipurpose reservoirs, resulting in the reduction of their storagecapacity by 1-2% annually.transported from one placethree major plant nutrients
The remaining 61% of the eroded soil wasto another. Along with the eroded topsoil,viz., Nitrogen, phosphorus, and potassium
ranging from 4.4 to 8.4 tonnes are also lost. Crop yields are reduced byerosion through less supply of plant nutrients, shallow depth of soil, poor structure, surface sealing and crusting, which leads to reduced water
infiltration and poor seedling establishment , In addition to this on-siteeffects, the off-site effects of erosion are also of serious concern for thesustainability of Agricultural productivity.
2.2.4 Siltataion of Reservoirs
Siltation of reservoirs is the major off-site effect of soil erosion by water. The process of deposition of soil particles carried by water iscalled sedimentation or siltation. Sedimentation or siltation is both a
serious and growing problem, but its severity varies from one reservoir toanother.capacitycapacity
Usually, every reservoir is provided with certain storageto accommodate for the natural sedimentation rate, whichis called its dead storage. Sediment accumulation is not
controlled in most of the reservoirs and they are irreversibly getting filledwith sediment and constitute the most non-sustainable water resourcesystem in India today.
Parameter Erosion(million tonnes) Per cent
Total soil loss 5334 100
Transported from one place 3282 61
Deposited in the reservoirs 480 10
Lost into the sea 1572 29
7/30/2019 Farming Systems and Sustainable Agriculture
http://slidepdf.com/reader/full/farming-systems-and-sustainable-agriculture 24/149
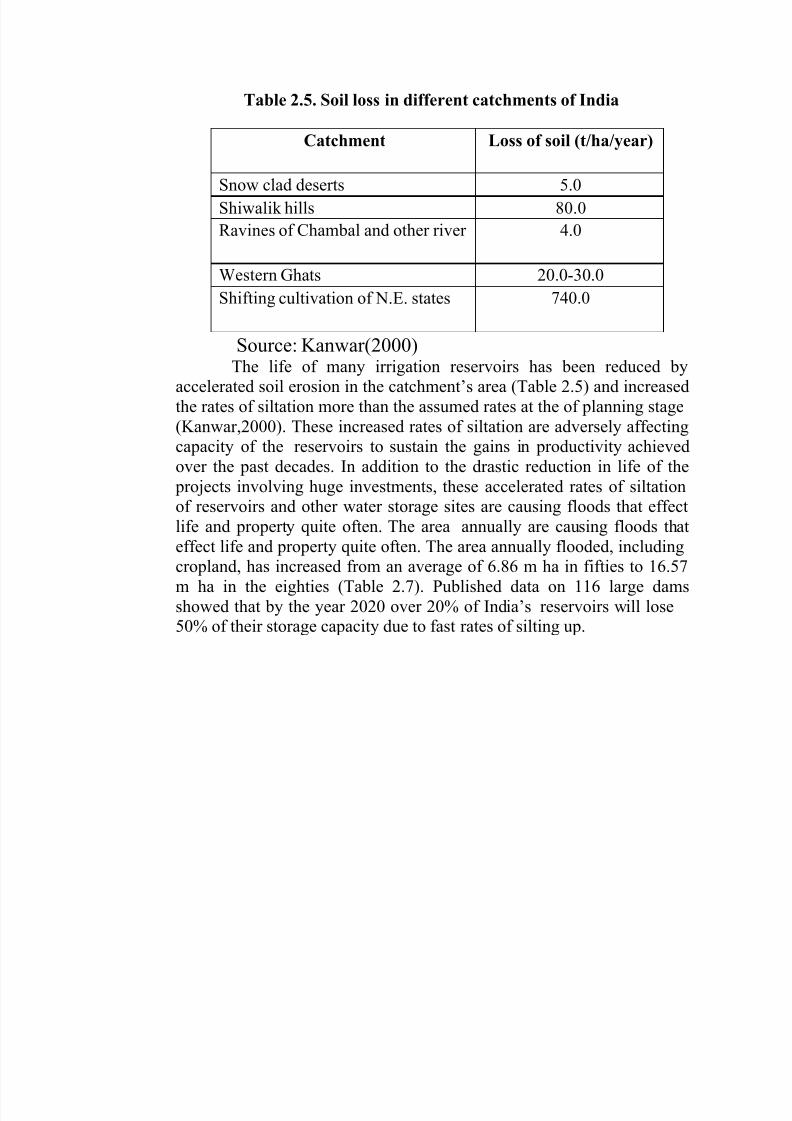
Table 2.5. Soil loss in different catchments of India
Source: Kanwar(2000)The life of many irrigation reservoirs has been reduced by
accelerated soil erosion in the catchment’s area (Table 2.5) and increasedthe rates of siltation more than the assumed rates at the of planning stage(Kanwar,2000). These increased rates of siltation are adversely affectingcapacity of the reservoirs to sustain the gains in productivity achievedover the past decades. In addition to the drastic reduction in life of the
projects involving huge investments, these accelerated rates of siltationof reservoirs and other water storage sites are causing floods that effectlife and property quite often. The area annually are causing floods thateffect life and property quite often. The area annually flooded, including
cropland, has increased from an average of 6.86 m ha in fifties to 16.57m ha in the eighties (Table 2.7). Published data on 116 large damsshowed that by the year 2020 over 20% of India’s reservoirs will lose50% of their storage capacity due to fast rates of silting up.
Catchment Loss of soil (t/ha/year)
Snow clad deserts 5.0Shiwalik hills 80.0
Ravines of Chambal and other river 4.0
WesternGhats 20.0-30.0
Shifting cultivation of N.E. states 740.0
7/30/2019 Farming Systems and Sustainable Agriculture
http://slidepdf.com/reader/full/farming-systems-and-sustainable-agriculture 25/149
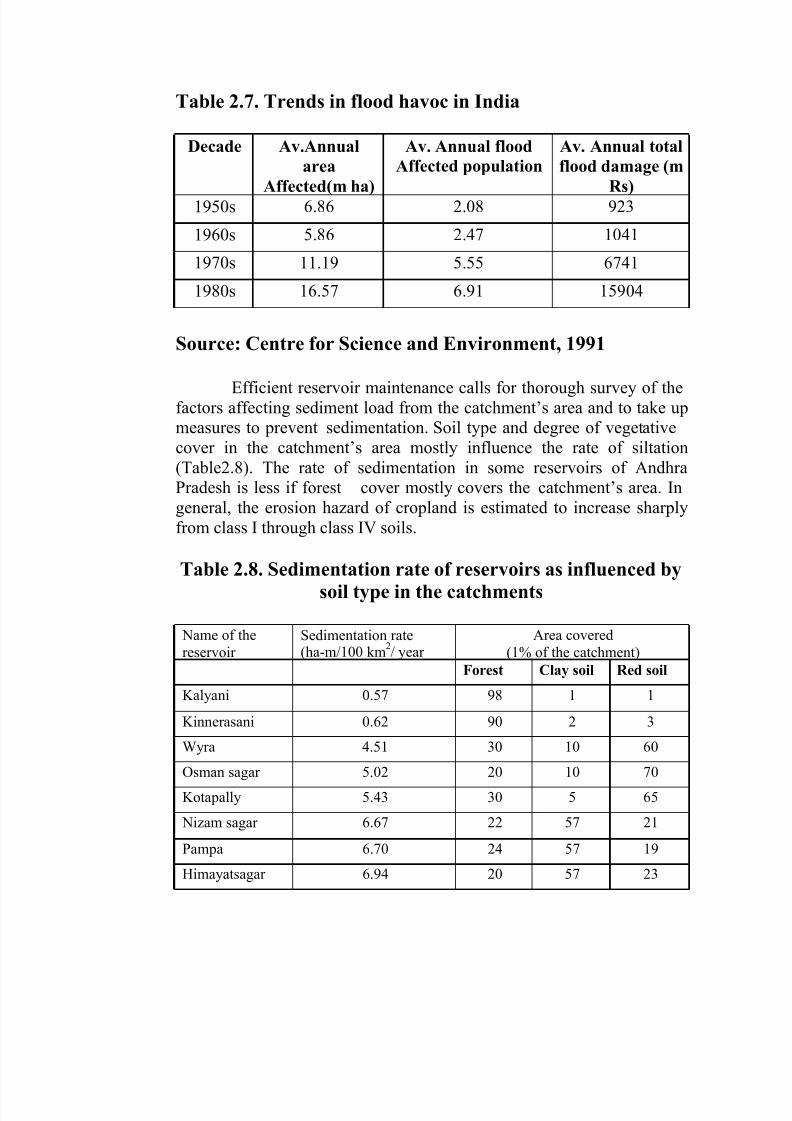
Table 2.7. Trends in flood havoc in India
Source: Centre for Science and Environment, 1991
Efficient reservoir maintenance calls for thorough survey of thefactors affecting sediment load from the catchment’s area and to take upmeasures to prevent sedimentation. Soil type and degree of vegetativecover in the catchment’s area mostly influence the rate of siltation(Table2.8). The rate of sedimentation in some reservoirs of AndhraPradesh is less if forest cover mostly covers the catchment’s area. Ingeneral, the erosion hazard of cropland is estimated to increase sharplyfrom class I through class IV soils.
Table 2.8. Sedimentation rate of reservoirs as influenced bysoil type in the catchments
(1% of the catchment) Name of thereservoir
Sedimentation rate(ha-m/100 km
2/ year
Area covered
Forest Clay soil Red soil
Kalyani 0.57 98 1 1
Kinnerasani 0.62 90 2 3
Wyra 4.51 30 10 60
Osman sagar 5.02 20 10 70
Kotapally 5.43 30 5 65
Nizam sagar 6.67 22 57 21
Pampa 6.70 24 57 19
Himayatsagar 6.94 20 57 23
Decade Av.Annual
area
Affected(m ha)
Av. Annual flood
Affected population
Av. Annual total
flood damage (m
Rs)1950s 6.86 2.08 923
1960s 5.86 2.47 1041
1970s 11.19 5.55 6741
1980s 16.57 6.91 15904
7/30/2019 Farming Systems and Sustainable Agriculture
http://slidepdf.com/reader/full/farming-systems-and-sustainable-agriculture 26/149
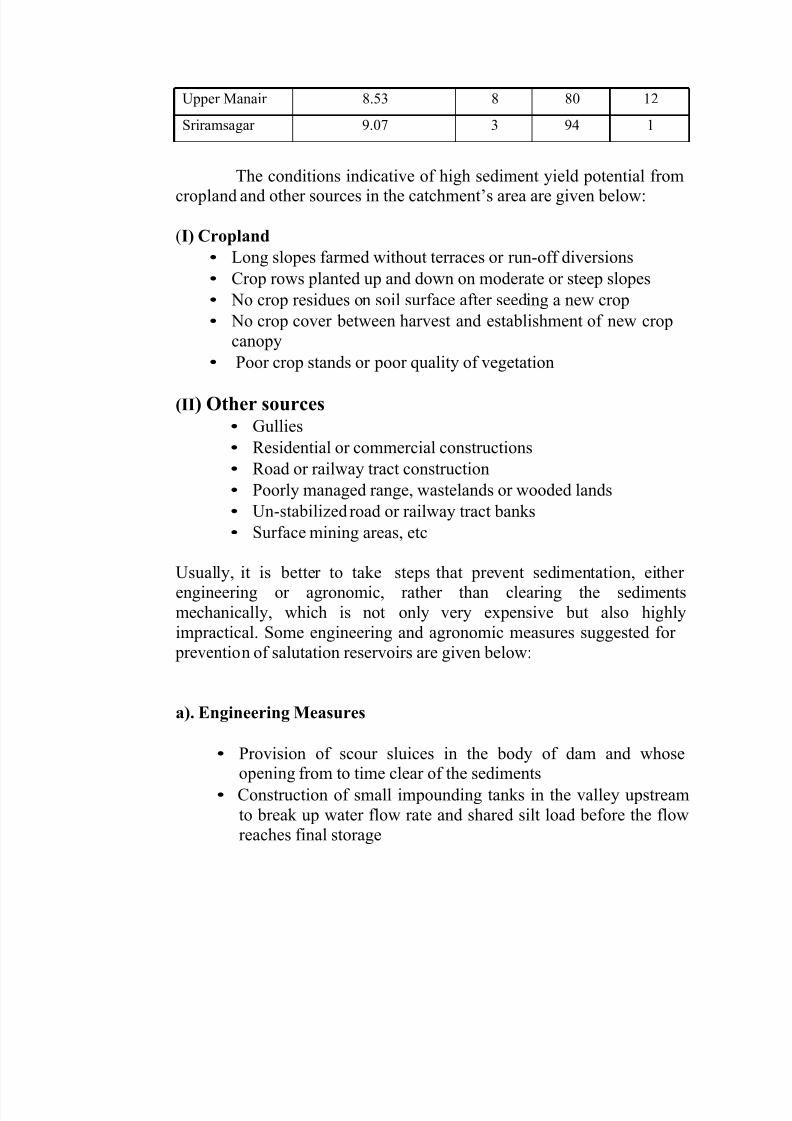
The conditions indicative of high sediment yield potential fromcropland and other sources in the catchment’s area are given below:
(I) Cropland
•
•
•
•
Long slopes farmed without terraces or run-off diversions
Crop rows planted up and down on moderate or steep slopes
No crop residues on soil surface after seeding a new crop
No crop cover between harvest and establishment of new cropcanopy
Poor crop stands or poor quality of vegetation•
(II) Other sources•
•
•
•
•
•
Gullies
Residential or commercial constructions
Road or railway tract construction
Poorly managed range, wastelands or wooded lands
Un-stabilized road or railway tract banks
Surfacemining areas, etc
Usually, it is better to take steps that prevent sedimentation, either engineering or agronomic, rather than clearing the sedimentsmechanically, which is not only very expensive but also highlyimpractical. Some engineering and agronomic measures suggested for prevention of salutation reservoirs are given below:
a). Engineering Measures
•
Provision of scour sluices in the body of dam and whoseopening from to time clear of the sediments
• Construction of small impounding tanks in the valley upstreamto break up water flow rate and shared silt load before the flowreaches final storage
Upper Manair 8.53 8 80 12
Sriramsagar 9.07 3 94 1
7/30/2019 Farming Systems and Sustainable Agriculture
http://slidepdf.com/reader/full/farming-systems-and-sustainable-agriculture 27/149
b). Agronomic Measures
•
•
•
•
•
•
•
Cover crops
Afforestation
Pastures
Contour cultivationContour bunding
Live bunding
Grassed waterways
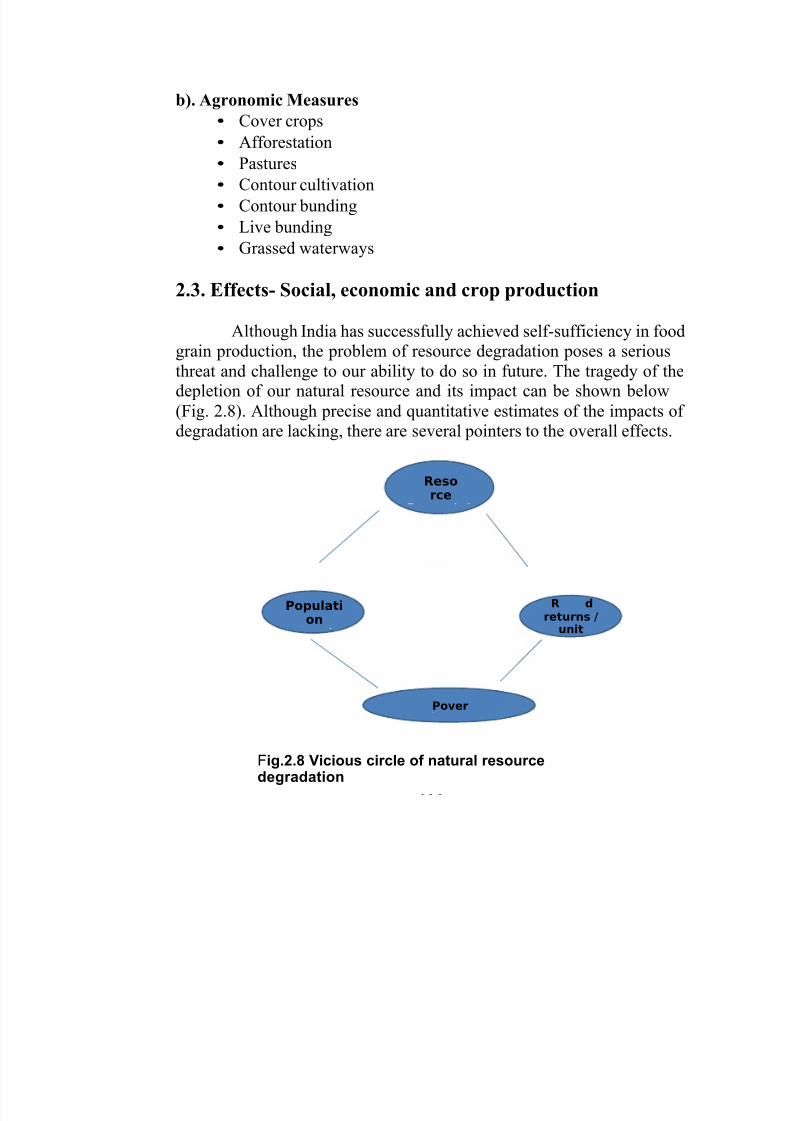
2.3. Effects- Social, economic and crop production
Although India has successfully achieved self-sufficiency in foodgrain production, the problem of resource degradation poses a serious
threat and challenge to our ability to do so in future. The tragedy of thedepletion of our natural resource and its impact can be shown below(Fig. 2.8). Although precise and quantitative estimates of the impacts of degradation are lacking, there are several pointers to the overall effects.
Resorce
R dPopulation returns /
unit
Pover
Fig.2.8 Vicious circle of natural resourcedegradation
7/30/2019 Farming Systems and Sustainable Agriculture
http://slidepdf.com/reader/full/farming-systems-and-sustainable-agriculture 28/149
Lecture No .3
RISE IN WATE TABLE, WATER LOGGING,SALANIZATION & ALKALIZATION AND SEA WATER
INUNDATION & ITS EFFECTS ON AGRICULTURE
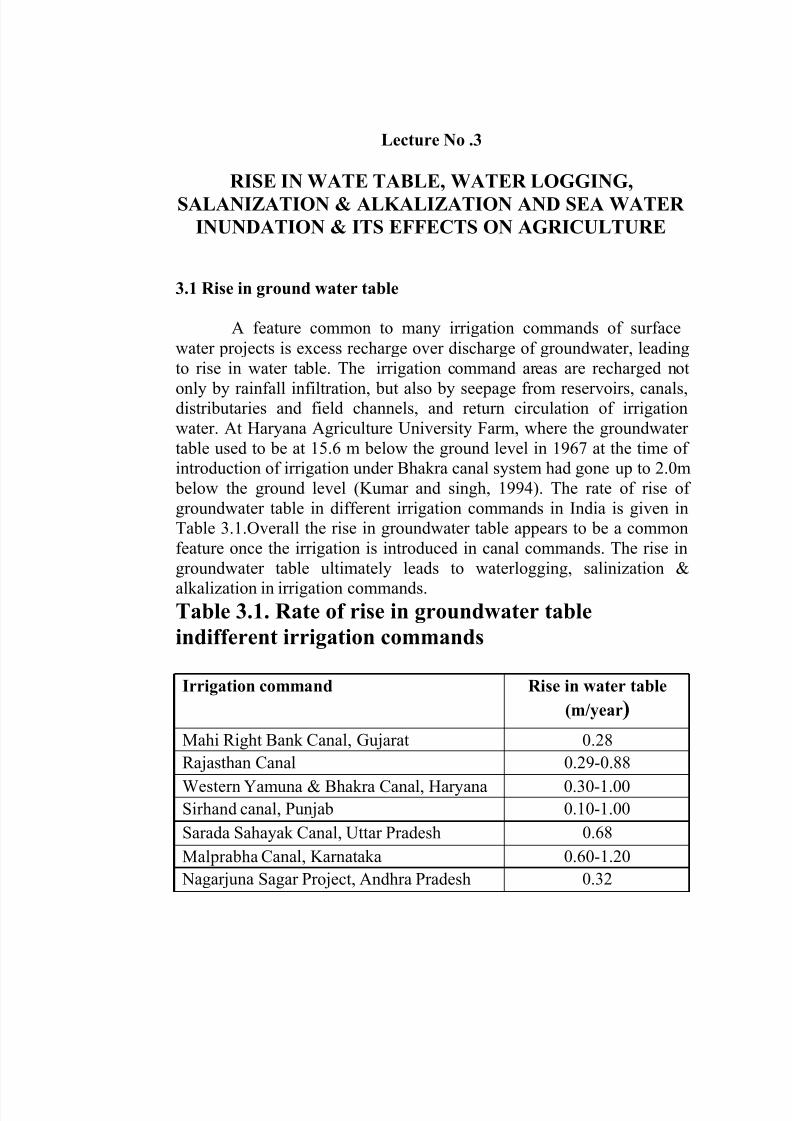
3.1 Rise in ground water table
A feature common to many irrigation commands of surfacewater projects is excess recharge over discharge of groundwater, leadingto rise in water table. The irrigation command areas are recharged notonly by rainfall infiltration, but also by seepage from reservoirs, canals,distributaries and field channels, and return circulation of irrigationwater. At Haryana Agriculture University Farm, where the groundwater table used to be at 15.6 m below the ground level in 1967 at the time of introduction of irrigation under Bhakra canal system had gone up to 2.0m
below the ground level (Kumar and singh, 1994). The rate of rise of groundwater table in different irrigation commands in India is given inTable 3.1.Overall the rise in groundwater table appears to be a commonfeature once the irrigation is introduced in canal commands. The rise in
groundwater table ultimately leads to waterlogging, salinization &alkalization in irrigation commands.
Table 3.1. Rate of rise in groundwater table
indifferent irrigation commands
Irrigation command Rise in water table
(m/year)
Mahi Right Bank Canal, Gujarat 0.28
Rajasthan Canal 0.29-0.88
WesternYamuna & Bhakra Canal, Haryana 0.30-1.00
Sirhand canal, Punjab 0.10-1.00
Sarada Sahayak Canal, Uttar Pradesh 0.68
MalprabhaCanal, Karnataka 0.60-1.20
Nagarjuna Sagar Project, Andhra Pradesh 0.32
7/30/2019 Farming Systems and Sustainable Agriculture
http://slidepdf.com/reader/full/farming-systems-and-sustainable-agriculture 29/149
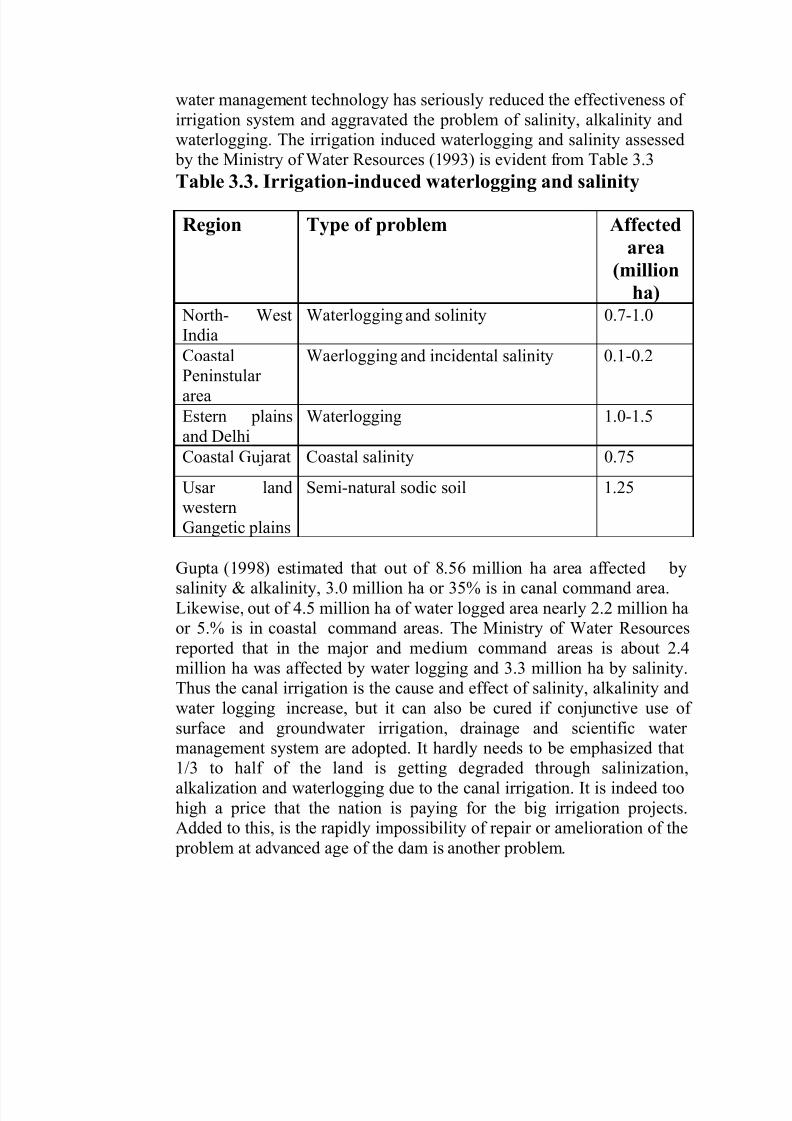
3.2 Waterlogging
Presence of excess water in or near the root zone or standing
water above the soil surface for any substantial period of time known aswater logging. Water logging is said to occur when the water table risesto within the root zone of crops. The water table which is consideredharmful would depend upon the type of crop, soil type and water quality.The actual depth of water table, when it starts affecting the crop yieldadversely, may from zero for rice to about 1.5m for other crops. Thenorms for characterization of water logging are given below in Table 3.2:
Table 3.2. Norms for characterization of
Water logging
Ministry of agriculture estimates indicate that about 11.6 million
ha, representing 3.5% of the geographical area of India, has beensuffering from physical deterioration caused by waterlogging(Kanwar,2000).
The National Commission on Agriculture (1976) estimated thearea affected by waterlogging in Andhra Pradesh at 3.39 million ha.
3.3 Salinization & Alkalization
The most well understood problem is of salinization and alkalizationof soils, which is reported to extend to 10.1 million ha in India. The
problem is increasing at an alarming rate in the canal-irrigated areasthrough increase in water table, poor water management practices andlack of drainage. The rate of increase of the problem is fast in the black soil regions of heavy texture, with serious drainage problem. The vastirrigation development without drainage, adequate field channels and
Depth of water table (m) Nomenclature< 2.0 Waterlogged2.0-3.0 Potentially waterlogged
> 3.0 Safe
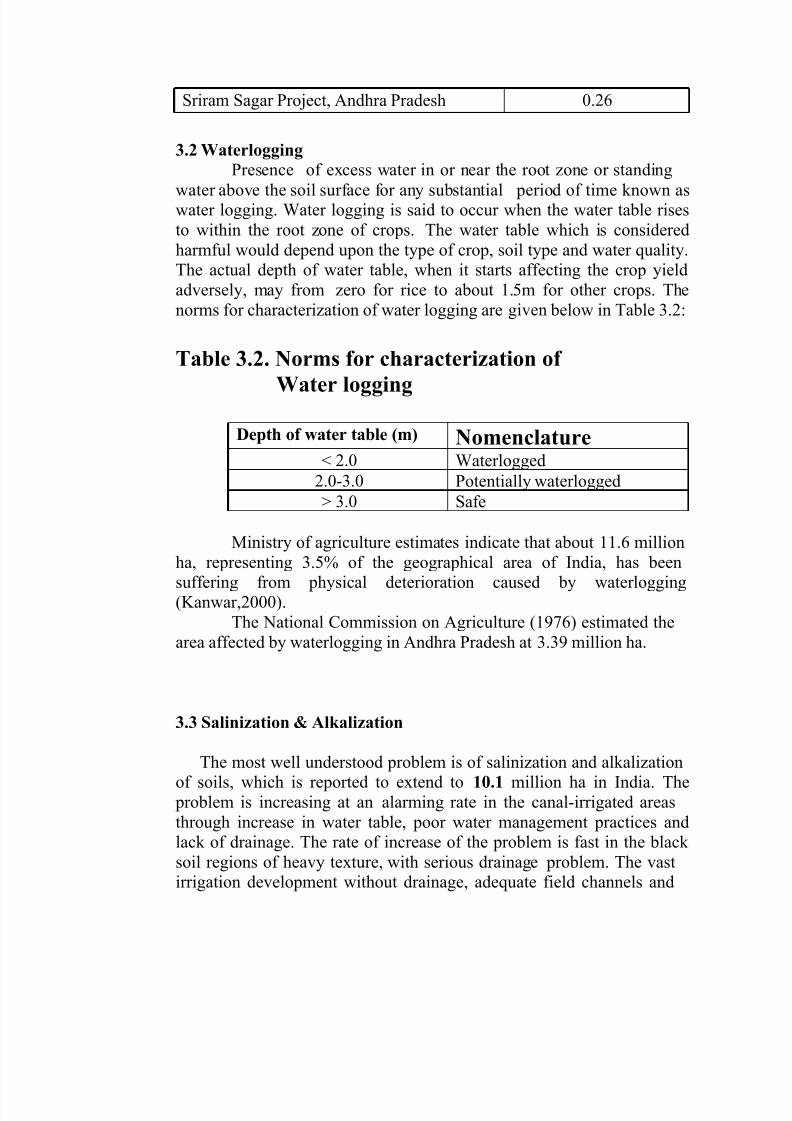
Sriram Sagar Project, Andhra Pradesh 0.26
7/30/2019 Farming Systems and Sustainable Agriculture
http://slidepdf.com/reader/full/farming-systems-and-sustainable-agriculture 30/149
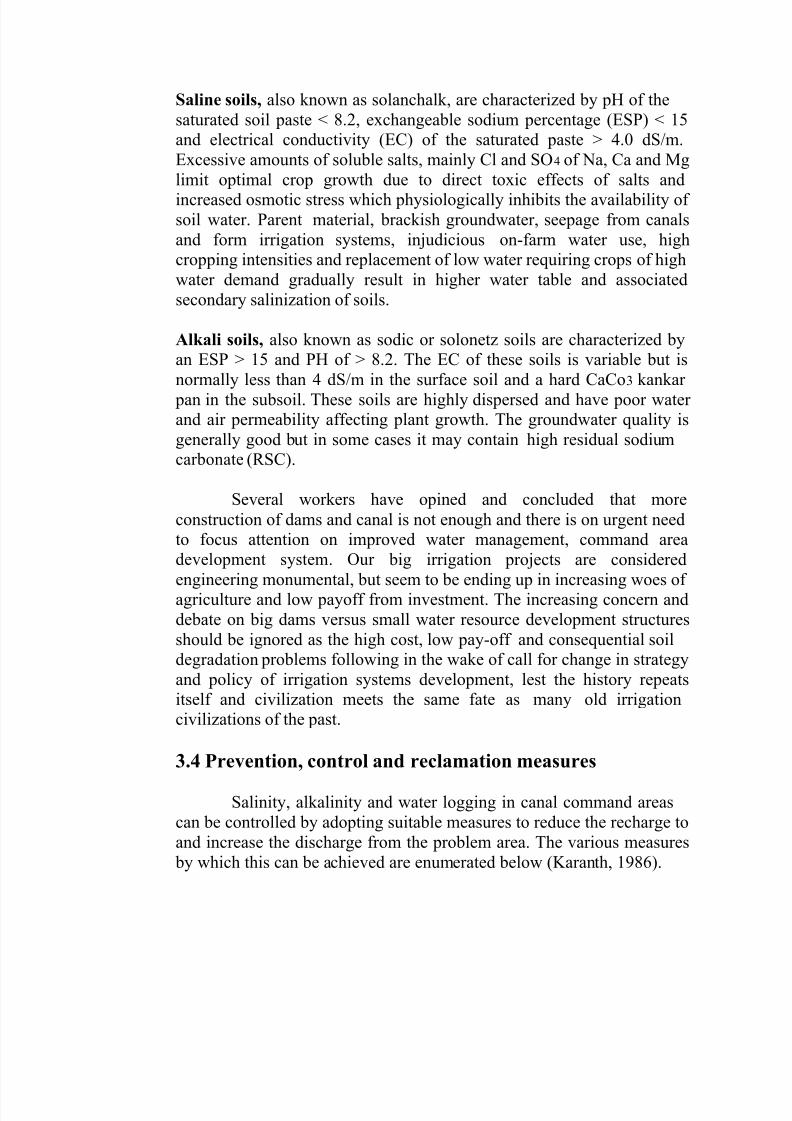
water management technology has seriously reduced the effectiveness of irrigation system and aggravated the problem of salinity, alkalinity andwaterlogging. The irrigation induced waterlogging and salinity assessed
by the Ministry of Water Resources (1993) is evident from Table 3.3
Table 3.3. Irrigation-induced waterlogging and salinity
Gupta (1998) estimated that out of 8.56 million ha area affected bysalinity & alkalinity, 3.0 million ha or 35% is in canal command area.Likewise, out of 4.5 million ha of water logged area nearly 2.2 million haor 5.% is in coastal command areas. The Ministry of Water Resourcesreported that in the major and medium command areas is about 2.4million ha was affected by water logging and 3.3 million ha by salinity.Thus the canal irrigation is the cause and effect of salinity, alkalinity andwater logging increase, but it can also be cured if conjunctive use of surface and groundwater ir rigation, drainage and scientific water management system are adopted. It hardly needs to be emphasized that1/3 to half of the land is getting degraded through salinization,alkalization and waterlogging due to the canal irrigation. It is indeed toohigh a price that the nation is paying for the big irrigation projects.Added to this, is the rapidly impossibility of repair or amelioration of the
problem at advanced age of the dam is another problem.
Region Type of problem Affected
area
(million
ha) North- WestIndia
Waterlogging and solinity 0.7-1.0
Coastal
Peninstular area
Waerlogging and incidental salinity 0.1-0.2
Estern plainsand Delhi
Waterlogging 1.0-1.5
Coastal Gujarat Coastal salinity 0.75
Usar landwesternGangetic plains
Semi-natural sodic soil 1.25
7/30/2019 Farming Systems and Sustainable Agriculture
http://slidepdf.com/reader/full/farming-systems-and-sustainable-agriculture 31/149
Saline soils, also known as solanchalk, are characterized by pH of thesaturated soil paste < 8.2, exchangeable sodium percentage (ESP) < 15and electrical conductivity (EC) of the saturated paste > 4.0 dS/m.Excessive amounts of soluble salts, mainly Cl and SO4 of Na, Ca and Mglimit optimal crop growth due to direct toxic effects of salts andincreased osmotic stress which physiologically inhibits the availability of soil water. Parent material, brackish groundwater, seepage from canalsand form irrigation systems, injudicious on-farm water use, highcropping intensities and replacement of low water requiring crops of highwater demand gradually result in higher water table and associatedsecondary salinization of soils.
Alkali soils, also known as sodic or solonetz soils are characterized byan ESP > 15 and PH of > 8.2. The EC of these soils is variable but is
normally less than 4 dS/m in the surface soil and a hard CaCo3 kankar pan in the subsoil. These soils are highly dispersed and have poor water and air permeability affecting plant growth. The groundwater quality isgenerally good but in some cases it may contain high residual sodiumcarbonate (RSC).
Several workers have opined and concluded that moreconstruction of dams and canal is not enough and there is on urgent needto focus attention on improved water management, command areadevelopment system. Our big irrigation projects are consideredengineering monumental, but seem to be ending up in increasing woes of agriculture and low payoff from investment. The increasing concern anddebate on big dams versus small water resource development structuresshould be ignored as the high cost, low pay-off and consequential soildegradation problems following in the wake of call for change in strategyand policy of irrigation systems development, lest the history repeatsitself and civilization meets the same fate as many old irrigationcivilizations of the past.
3.4 Prevention, control and reclamation measures
Salinity, alkalinity and water logging in canal command areascan be controlled by adopting suitable measures to reduce the recharge toand increase the discharge from the problem area. The various measures
by which this can be achieved are enumerated below (Karanth, 1986).
7/30/2019 Farming Systems and Sustainable Agriculture
http://slidepdf.com/reader/full/farming-systems-and-sustainable-agriculture 32/149
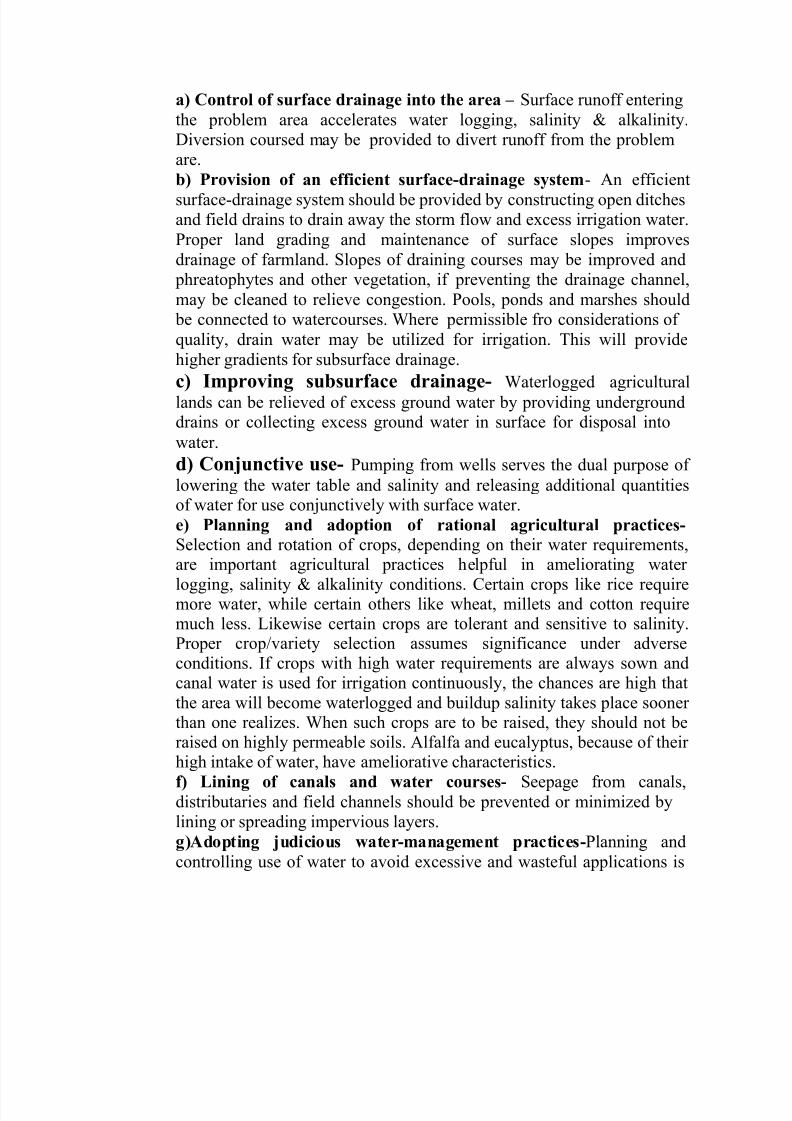
a) Control of surface drainage into the area – Surface runoff enteringthe problem area accelerates water logging, salinity & alkalinity.Diversion coursed may be provided to divert runoff from the problemare.b) Provision of an efficient surface-drainage system- An efficientsurface-drainage system should be provided by constructing open ditchesand field drains to drain away the storm flow and excess irrigation water.Proper land grading and maintenance of surface slopes improvesdrainage of farmland. Slopes of draining courses may be improved and
phreatophytes and other vegetation, if preventing the drainage channel,may be cleaned to relieve congestion. Pools, ponds and marshes should
be connected to watercourses. Where permissible fro considerations of quality, drain water may be utilized for irrigation. This will providehigher gradients for subsurface drainage.
c) Improving subsurface drainage- Waterlogged agriculturallands can be relieved of excess ground water by providing undergrounddrains or collecting excess ground water in surface for disposal intowater.
d) Conjunctive use- Pumping from wells serves the dual purpose of lowering the water table and salinity and releasing additional quantitiesof water for use conjunctively with surface water.e) Planning and adoption of rational agricultural practices-
Selection and rotation of crops, depending on their water requirements,
are
important agricultural practices helpful in ameliorating water logging, salinity & alkalinity conditions. Certain crops like rice requiremore water, while certain others like wheat, millets and cotton requiremuch less. Likewise certain crops are tolerant and sensitive to salinity.Proper crop/variety selection assumes significance under adverseconditions. If crops with high water requirements are always sown andcanal water is used for irrigation continuously, the chances are high thatthe area will become waterlogged and buildup salinity takes place sooner than one realizes. When such crops are to be raised, they should not beraised on highly permeable soils. Alfalfa and eucalyptus, because of their
high intake of water, have ameliorative characteristics.f) Lining of canals and water courses- Seepage from canals,distributaries and field channels should be prevented or minimized bylining or spreading impervious layers.g)Adopting judicious water-management practices-Planning andcontrolling use of water to avoid excessive and wasteful applications is
7/30/2019 Farming Systems and Sustainable Agriculture
http://slidepdf.com/reader/full/farming-systems-and-sustainable-agriculture 33/149
important measure that involve no extra expenditure. Excessiveapplication of water is as detrimental to crop growth as inadequateapplication, a maxim many farmers are unaware of any need to beeducated about.h) Adoption of water use efficient application methods like sprinkler
and drip systems in high value crops
i) Reclamation of saline and alkaline soils-
• For saline soils with efflorescence of salts at the surface:Scraping of the surface salts and flushing with water to washaway the excess salts
For saline soils with high concentration of soluble salts into•
great depth but with deep water table: Impounding rain or irrigation water for leaching salts to a safe limit and subsurfacedrains coupled with flushing to remove salts both by surface &subsurface drainage
For saline soils with high concentration of soluble salts intogreat depth but with high water table: Lowering of water tableeither by pumping or subsurface drainage
For alkali soils: Treating the soils with chemical amendmentslike gypsum & sulphur, addition of organic material viz., FYM,
crop residues, green manuring etc, leaching the products of reaction after amendments are added, deep ploughing to break the hard pan for improving drainage.
•
•
After reclamation of the salt affected soils, it is necessary to prevent their resalinization and alkalization. Maintaining a salt balance, drainage andcontrolling the depth of water table will achieve this.
3.5 Seawater inundation and Sand casting
Natural calamities, like cyclones and floods, affect nations all over the world. Because of the large geographical size of the country. Indiaoften faces natural calamities like floods, cyclones and droughts,occurring fairly frequently in different parts of the country. At times, thesame area is subjected to cyclones & floods in successive seasons or years.
7/30/2019 Farming Systems and Sustainable Agriculture
http://slidepdf.com/reader/full/farming-systems-and-sustainable-agriculture 34/149
Cyclonic storm arising from Bay of Bengal often cross the east-coast plains of Orissa, Andhra Pradesh and Tamil nadu during October-January resulting in wide spread damages to standing crops besides other losses. The cyclones cause and ingression of sea water/ tidal waves. Thelatter cause the problem of soil salinity and sand casting of varyingdepths in lower reaches.
Cyclone damage
7/30/2019 Farming Systems and Sustainable Agriculture
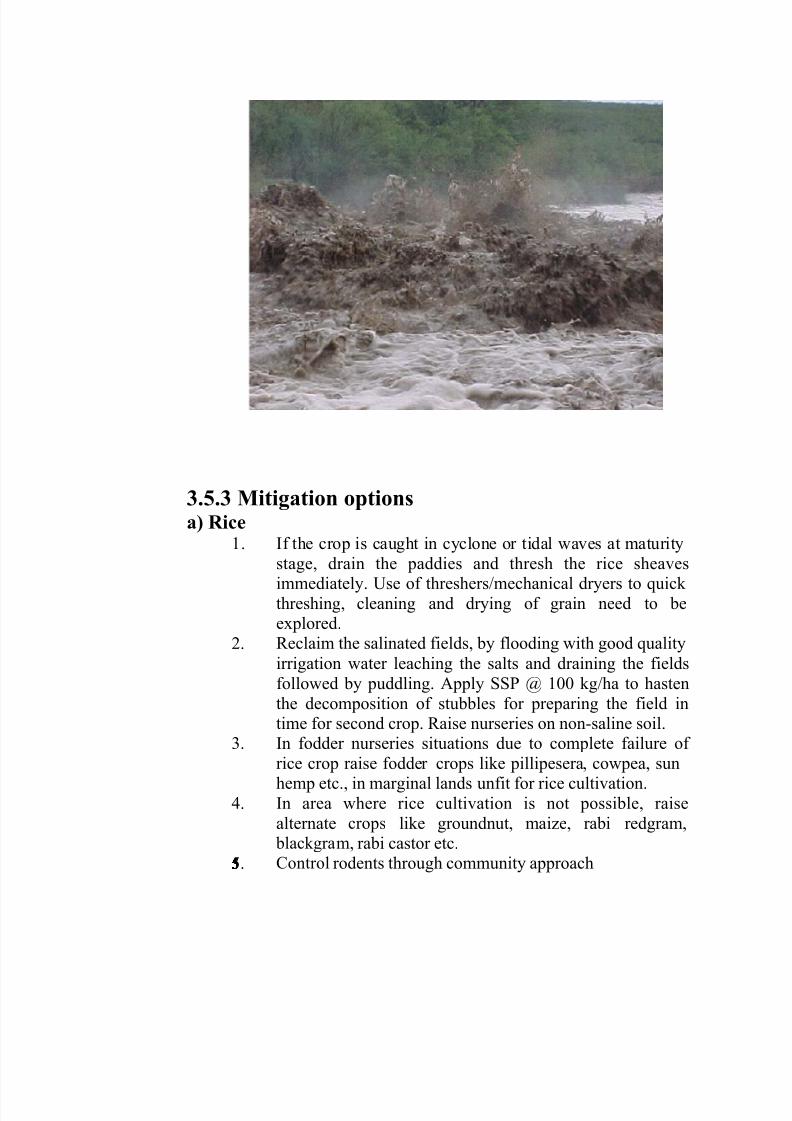
http://slidepdf.com/reader/full/farming-systems-and-sustainable-agriculture 35/149
Flood damage
7/30/2019 Farming Systems and Sustainable Agriculture
http://slidepdf.com/reader/full/farming-systems-and-sustainable-agriculture 36/149
3.5.1 Nature of damages caused by cyclones to agricultural
crops1.2.
3.
Mortality of plantsSuppression of tillering in rice
Complete or partial lodging in rice, cotton, sugarcane,vegetables, tobacco etcUprooting of plants in coconut, banana, sugarcane,orchards and field cropsYellowing and shedding of leavesExcessive vegetative growth in cottonIncreased virulence of pests and diseases. For Example sheath
blight, bacterial leaf blight, brown plant hopper in rice, pod borers, die-back, fruit rot in vegetables like chillies and tomato,helicoverpa incidence and rotting of bolls in cotton and wilting
of plants.Shattering of grains/pods where the crop is in ripening or
maturity phase Nutritional disorders and toxicitiesWetting of harvested rice sheaves in the fieldSoil salinity build up and soil erosion in varying degrees
depending upon the land topography.Water logging of cultivated lands
Sand casting in land areas due to tidal waves lashing the coast
Difficulty in threshing, cleaning and drying of agriculturalProduce
4.
5.6.7.
8.
9.10.11.
12.13.
14.
3.5.2 Economic consequences of cyclones1. Land degradation and loss of soil productivity2. Considerable expenditure on land reclamation3. Reduction in total agricultural production4. Damage to the ecosystem
5. Disruption of roads, transport, communicationand human settlements
6. Reduction in aquaculture activity
7/30/2019 Farming Systems and Sustainable Agriculture
http://slidepdf.com/reader/full/farming-systems-and-sustainable-agriculture 37/149
7/30/2019 Farming Systems and Sustainable Agriculture
http://slidepdf.com/reader/full/farming-systems-and-sustainable-agriculture 38/149
3.5.3 Mitigation optionsa) Rice
1. If the crop is caught in cyclone or tidal waves at maturity
stage, drain the paddies and thresh the rice sheavesimmediately. Use of threshers/mechanical dryers to quick threshing, cleaning and drying of grain need to beexplored.Reclaim the salinated fields, by flooding with good qualityirrigation water leaching the salts and draining the fieldsfollowed by puddling. Apply SSP @ 100 kg/ha to hastenthe decomposition of stubbles for preparing the field intime for second crop. Raise nurseries on non-saline soil.In fodder nurseries situations due to complete failure of
rice crop raise fodder crops like pillipesera, cowpea, sunhemp etc., in marginal lands unfit for rice cultivation.In area where rice cultivation is not possible, raisealternate crops like groundnut, maize, rabi redgram, blackgram, rabi castor etc.Control rodents through community approach
2.
3.
4.
5.555555555555555
7/30/2019 Farming Systems and Sustainable Agriculture
http://slidepdf.com/reader/full/farming-systems-and-sustainable-agriculture 39/149
b) Cotton and chillles
1. Carryout the earthing up by carefully lifting the lodged plants
2. Raise coriander or Chickpea or Black gram or sunnhemp infields where the cotton crop is completely damaged due touprootingSpray 2% urea on cotton plants having foliage3.
c) Banana
1.2.
Remove the damaged plants by leaving two suckersFertilize the plants for four months @ 80 g urea and 80gmuriate of potash/plant.Cover the bunches on damged plants with leaves and harvest
them within 15 to 20 days
3.
d) Coconut
1.2.3.
Cut and remove the twisted leavesProvide support to hanging bunchesApply a booster fertilizer dose @ 0.5 kg Diammonium phosphate,0.5 kg Urea and 1.5 kg muriate of potash per plant to bearing
palm trees
e) Acid lime
1.2.
Uplift the fallen trees and carryout the earthing upRemove the damaged branches and apply Bordeaux paste
Sand casting
Deposition of sand particles on the agricultural fields due tonatural calamities is termed as sand casting
1. Where sand casting is about 15 cm, incorporate the same into the
soil by ploughing with wooden or mould board or disc plough.This may be followed by normal cultivation.
2. Where the sand casting is between 15 to 60 cm, sand may beremoved using bulldozers. This may be followed by normalcultivation.Where sand casting is more than 60 cm, no reclamation or removal of sand is suggested, since this would be costly and
3.333333333333333
7/30/2019 Farming Systems and Sustainable Agriculture
http://slidepdf.com/reader/full/farming-systems-and-sustainable-agriculture 40/149
difficult to dump the sand so removed in the nearby fields: insuch cases, plant horticultural crops like cashew nut, coconutand casuarinas etc, in situ,
SAN CASTIN
***
7/30/2019 Farming Systems and Sustainable Agriculture
http://slidepdf.com/reader/full/farming-systems-and-sustainable-agriculture 41/149
Lecture No.4
GROUNDWATER DEVELOPMENT4.1 Introduction
Groundwater is a significant source of water supply for roughly half of the country’s net irrigated area. Groundwater irrigation (using dugwells, bore wells, and dug- cum-bore wells) began to expand rapidlywith the advent of HYV technology in the second half of the 1960s.according to estimates ( Dains & Power 1987) 70-80% of the value of the irrigated agricultural production in the country may depend ongroundwater irrigation. Besides being a key contributor to agriculturalGDP, the spread of groundwater irrigation supports employmentgeneration and thus rural development and poverty alleviation.
4.2 Groundwater resources availability in India1. The groundwater resource has two components viz., in-
storage and replenishable. The in-storage freshgroundwater resources i.e.(aquifer zones below the zone of water table fluctuation) of the country have been estimatedas 10812 billion m3 (1081.2 Mha-m). The replenishablecomponent,which is replenished annually, has beenassessed as 432 billion m3 (43.2 Mha-m) (CGWB, 1995).
As per the National Water Policy, development of groundwater resources is to be limited powaterlicytherefore forbids utilization of in-storage resources to
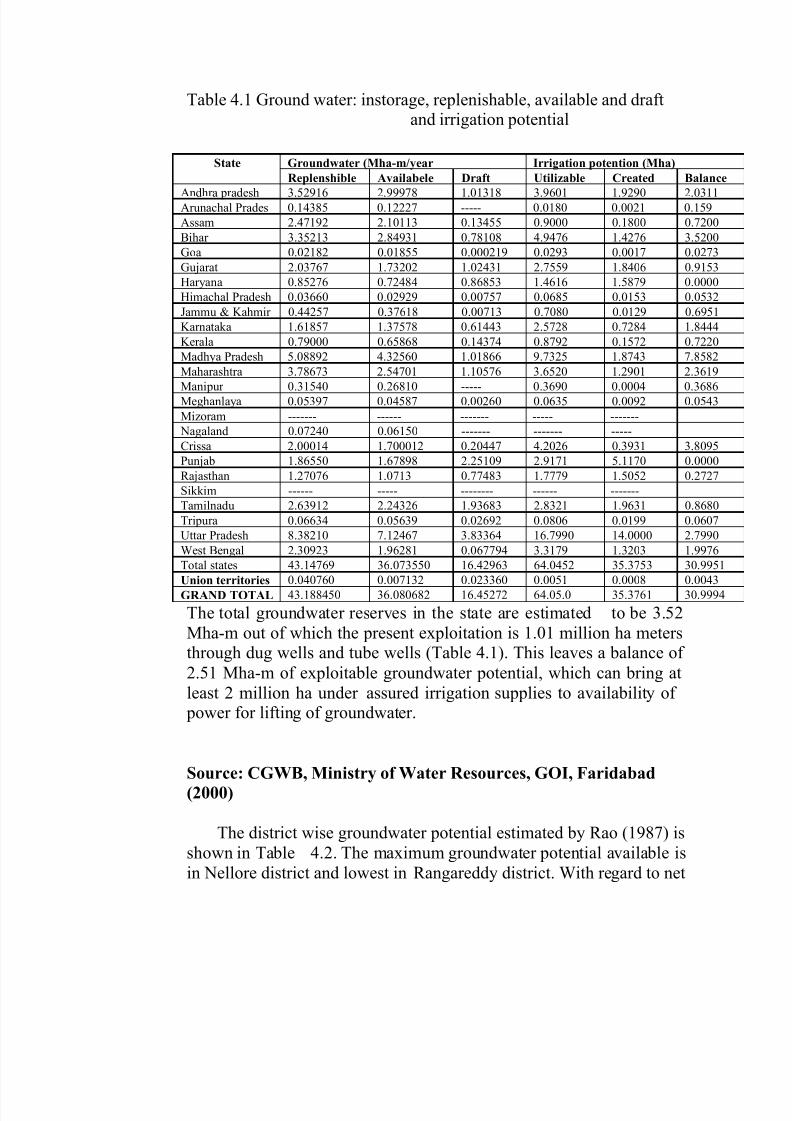
prevent groundwater mining. After making a provision of 71.2 billion m3 (7.12 Mha-m) for domestic, industrial andother uses, the available groundwater resource for irrigation is assessed as 360.8 billion m3 (63.08 Mha-m).Based on crop water requirements and availability of cultivable land, utilizable irrigation potential has beenestimated at 64 million ha. State- wise availability of replenish able groundwater, utilizable irrigation potentialand irrigation potential created from groundwater resources are shown in Table 4.1.
7/30/2019 Farming Systems and Sustainable Agriculture
http://slidepdf.com/reader/full/farming-systems-and-sustainable-agriculture 42/149
Table 4.1 Ground water: instorage, replenishable, available and draftand irrigation potential
The total groundwater reserves in the state are estimated to be 3.52Mha-m out of which the present exploitation is 1.01 million ha metersthrough dug wells and tube wells (Table 4.1). This leaves a balance of 2.51 Mha-m of exploitable groundwater potential, which can bring atleast 2 million ha under assured irrigation supplies to availability of
power for lifting of groundwater.
Source: CGWB, Ministry of Water Resources, GOI, Faridabad
(2000)
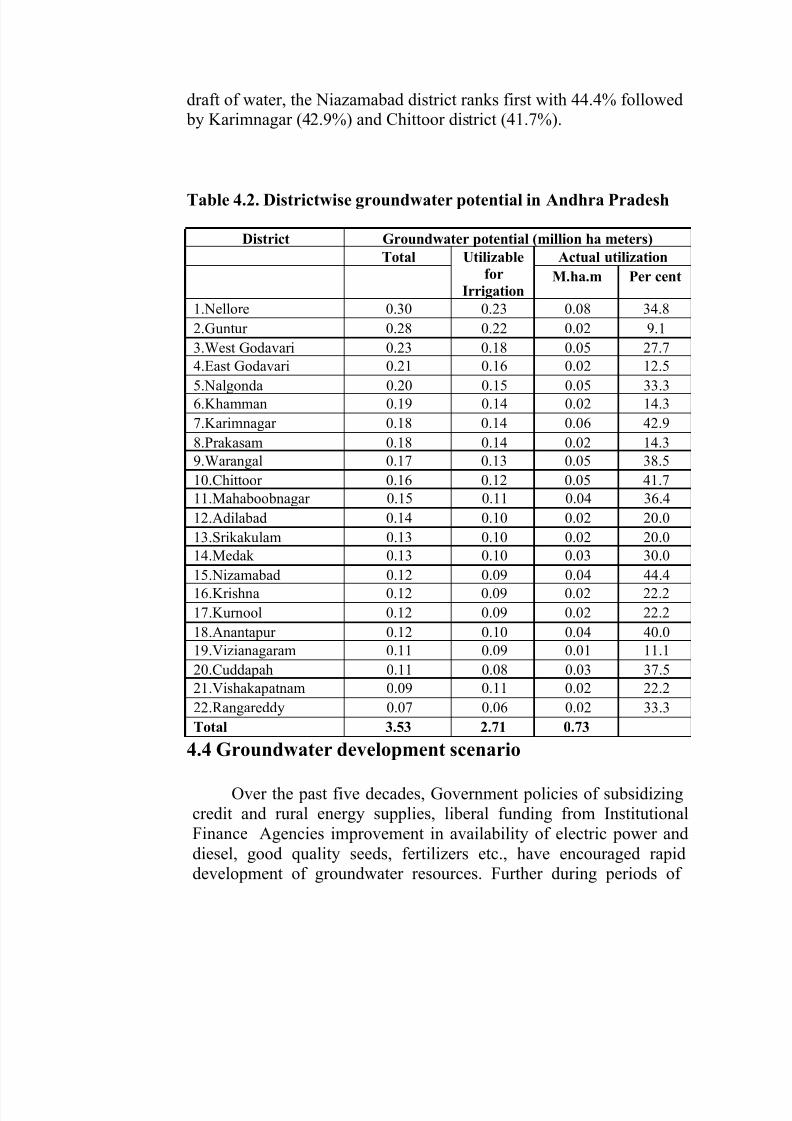
The district wise groundwater potential estimated by Rao (1987) isshown in Table 4.2. The maximum groundwater potential available isin Nellore district and lowest in Rangareddy district. With regard to net
State Groundwater (Mha-m/year Irrigation potention (Mha)
Replenshible Availabele Draft Utilizable Created Balance
Andhra pradesh 3.52916 2.99978 1.01318 3.9601 1.9290 2.0311Arunachal Prades 0.14385 0.12227 ----- 0.0180 0.0021 0.159
Assam 2.47192 2.10113 0.13455 0.9000 0.1800 0.7200
Bihar 3.35213 2.84931 0.78108 4.9476 1.4276 3.5200
Goa 0.02182 0.01855 0.000219 0.0293 0.0017 0.0273
Gujarat 2.03767 1.73202 1.02431 2.7559 1.8406 0.9153
Haryana 0.85276 0.72484 0.86853 1.4616 1.5879 0.0000
Himachal Pradesh 0.03660 0.02929 0.00757 0.0685 0.0153 0.0532
Jammu & Kahmir 0.44257 0.37618 0.00713 0.7080 0.0129 0.6951
Karnataka 1.61857 1.37578 0.61443 2.5728 0.7284 1.8444
Kerala 0.79000 0.65868 0.14374 0.8792 0.1572 0.7220
Madhya Pradesh 5.08892 4.32560 1.01866 9.7325 1.8743 7.8582
Maharashtra 3.78673 2.54701 1.10576 3.6520 1.2901 2.3619
Manipur 0.31540 0.26810 ----- 0.3690 0.0004 0.3686
Meghanlaya 0.05397 0.04587 0.00260 0.0635 0.0092 0.0543
Mizoram ------- ------ ------- ----- -------
Nagaland 0.07240 0.06150 ------- ------- -----
Crissa 2.00014 1.700012 0.20447 4.2026 0.3931 3.8095
Punjab 1.86550 1.67898 2.25109 2.9171 5.1170 0.0000
Rajasthan 1.27076 1.0713 0.77483 1.7779 1.5052 0.2727
Sikkim ------ ----- -------- ------ -------
Tamilnadu 2.63912 2.24326 1.93683 2.8321 1.9631 0.8680
Tripura 0.06634 0.05639 0.02692 0.0806 0.0199 0.0607
Uttar Pradesh 8.38210 7.12467 3.83364 16.7990 14.0000 2.7990
West Bengal 2.30923 1.96281 0.067794 3.3179 1.3203 1.9976
Total states 43.14769 36.073550 16.42963 64.0452 35.3753 30.9951Union territories 0.040760 0.007132 0.023360 0.0051 0.0008 0.0043
GRAND TOTAL 43.188450 36.080682 16.45272 64.05.0 35.3761 30.9994
7/30/2019 Farming Systems and Sustainable Agriculture
http://slidepdf.com/reader/full/farming-systems-and-sustainable-agriculture 43/149
draft of water, the Niazamabad district ranks first with 44.4% followed by Karimnagar (42.9%) and Chittoor district (41.7%).
Table 4.2. Districtwise groundwater potential in Andhra Pradesh
4.4 Groundwater development scenario
Over the past five decades, Government policies of subsidizingcredit and rural energy supplies, liberal funding from InstitutionalFinance Agencies improvement in availability of electric power anddiesel, good quality seeds, fertilizers etc., have encouraged rapiddevelopment of groundwater resources. Further during periods of
District Groundwater potential (million ha meters)
Total Utilizable
for
Irrigation
Actual utilization
M.ha.m Per cent
1.Nellore 0.30 0.23 0.08 34.8
2.Guntur 0.28 0.22 0.02 9.1
3.West Godavari 0.23 0.18 0.05 27.7
4.East Godavari 0.21 0.16 0.02 12.5
5.Nalgonda 0.20 0.15 0.05 33.3
6.Khamman 0.19 0.14 0.02 14.3
7.Karimnagar 0.18 0.14 0.06 42.9
8.Prakasam 0.18 0.14 0.02 14.3
9.Warangal 0.17 0.13 0.05 38.5
10.Chittoor 0.16 0.12 0.05 41.7
11.Mahaboobnagar 0.15 0.11 0.04 36.4
12.Adilabad 0.14 0.10 0.02 20.0
13.Srikakulam 0.13 0.10 0.02 20.0
14.Medak 0.13 0.10 0.03 30.0
15.Nizamabad 0.12 0.09 0.04 44.4
16.Krishna 0.12 0.09 0.02 22.2
17.Kurnool 0.12 0.09 0.02 22.2
18.Anantapur 0.12 0.10 0.04 40.0
19.Vizianagaram 0.11 0.09 0.01 11.1
20.Cuddapah 0.11 0.08 0.03 37.5
21.Vishakapatnam 0.09 0.11 0.02 22.2
22.Rangareddy 0.07 0.06 0.02 33.3
Total 3.53 2.71 0.73
7/30/2019 Farming Systems and Sustainable Agriculture
http://slidepdf.com/reader/full/farming-systems-and-sustainable-agriculture 44/149
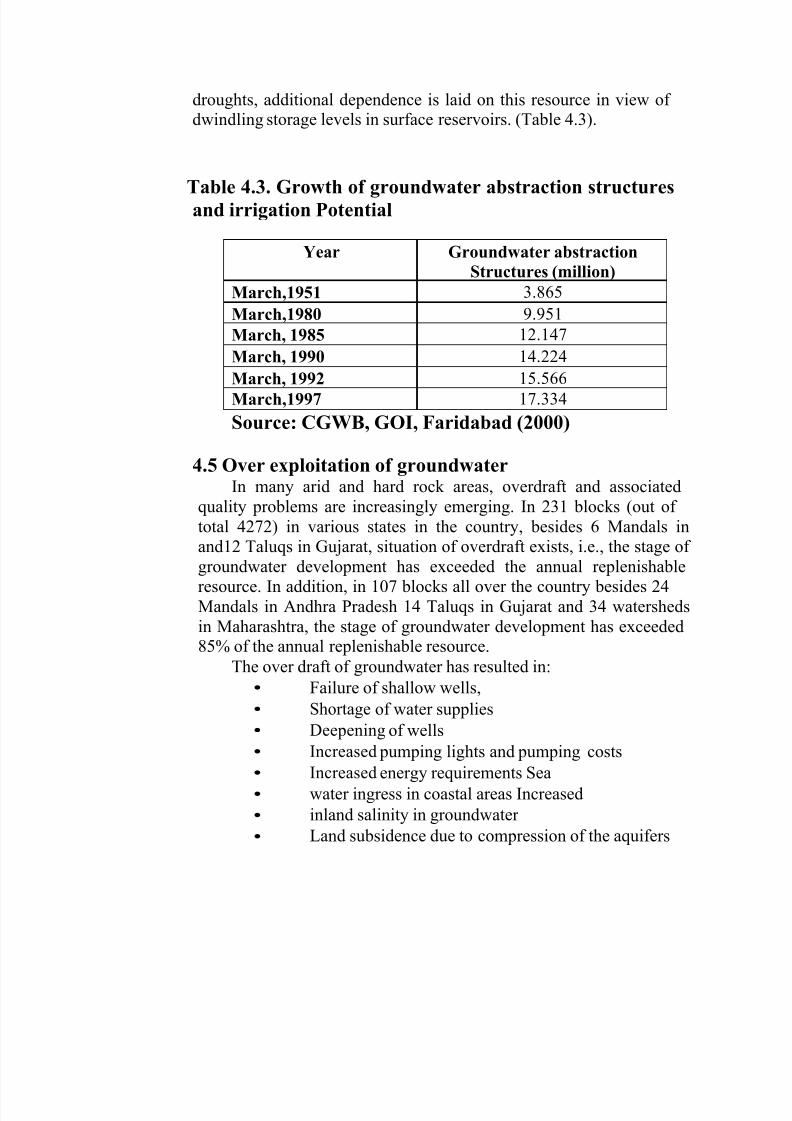
droughts, additional dependence is laid on this resource in view of dwindling storage levels in surface reservoirs. (Table 4.3).
Table 4.3. Growth of groundwater abstraction structuresand irrigation Potential
Source: CGWB, GOI, Faridabad (2000)
4.5 Over exploitation of groundwaterIn many arid and hard rock areas, overdraft and associated
quality problems are increasingly emerging. In 231 blocks (out of total 4272) in various states in the country, besides 6 Mandals inand12 Taluqs in Gujarat, situation of overdraft exists, i.e., the stage of
groundwater development has exceeded the annual replenishableresource. In addition, in 107 blocks all over the country besides 24Mandals in Andhra Pradesh 14 Taluqs in Gujarat and 34 watershedsin Maharashtra, the stage of groundwater development has exceeded85% of the annual replenishable resource.
The over draft of groundwater has resulted in:
•
•
•
•
•
•
•
•
Failure of shallow wells,
Shortage of water supplies
Deepening of wells
Increased pumping lights and pumping costsIncreased energy requirements Sea
water ingress in coastal areas Increased
inland salinity in groundwater
Land subsidence due to compression of the aquifers
Year Groundwater abstraction
Structures (million)
March,1951 3.865
March,1980 9.951
March, 1985 12.147
March, 1990 14.224
March, 1992 15.566March,1997 17.334
7/30/2019 Farming Systems and Sustainable Agriculture
http://slidepdf.com/reader/full/farming-systems-and-sustainable-agriculture 45/149
Although groundwater is a renewable resource, it in notinexhaustible. If groundwater supplies are to be maintained
perennially, the recharge must balance discharge. However, all thatrecharged is not necessarily recoverable. The groundwater withdrawalmust be limited to safe yield, which is defined as the amount of water that can be withdrawn annually from a groundwater basin without
producing an undesired result. While the permissive sustained yield
is the maximum rate at which water can be economically and legallywithdrawn perennially from a specified source, without bringingabout some undesired result. It is always less than natural rechargeand in limited by physical or other constraints.
Overdraft (or over development) of aquifers occurs if groundwater extraction exceeds the sustained yield. Perennial
pumping more than natural drainage may lead to decline in water
levels without any indication of water levels stabilizing, diminishingyields and sometimes deterioration in water quality. The areas whichsuffer from non- availability of groundwater due to perennial over draft are known as dark areas. For example, widespread declineshave been reported from several places in India viz., Mehasana andAhmedabad in Gujarat, Rangareddy and Chittoor in Andhra Pradeshand Coimbatore in Tamilnadu State. Many water supply wells inAhmedabad and Rangareddy have ceased functioning due to
persistent decline in water levels to the extent of nearly 30-300m.Overdraft may be reduced or controlled by changing over to less
water consuming crops, industrial processed etc., providing alternatesources of supplies and most importantly by artificial recharge.Administrative and legislative measures to discourage / prohibitfurther exploitation become indispensable before critical overdraft isreached.
4.6 Artificial recharge of groundwaterArtificial recharge may be defined as the process by which
infiltration of surface water into groundwater systems in increased by
altering natural conditions of replenishment. Artificial rechargeimplies diverting of excess surface water resources (which otherwisewould go as runoff and unexploited) to the needs areas and providefor infiltration into the groundwater zones. In the context of man’sever increasing demands on water resources, artificial recharge of groundwater is gaining importance as one of the strategies of water
7/30/2019 Farming Systems and Sustainable Agriculture
http://slidepdf.com/reader/full/farming-systems-and-sustainable-agriculture 46/149
management. Several methods of artificial recharge are in vogue, thechoice being dictated by local conditions:
•
•
•
•
•
•
Spreadingmethods
Recharge through pits
Recharge by irrigation and agricultural practicesPercolation thanks
Recharge through well
Other methods of artificial recharge include, high blastingof rocks to cause intensive fracture system in the near impervious zones, into water could be disposed of byinfiltration and deep percolation.
***
7/30/2019 Farming Systems and Sustainable Agriculture
http://slidepdf.com/reader/full/farming-systems-and-sustainable-agriculture 47/149
Lecture No.5
ENVIRONEMTNTAL POLLUTIION5.1 Introduction
Theclimaticdioxide,
major environmental problem today is global warming or change due to accumulation of several gases like carbonand nitrous oxide, Chlorofluorocarbons, along with water
vapour in the atmosphere causing greenhouse effect and depletion of ozone layer in stratosphere affecting the several aspects of humanityon planet earth.
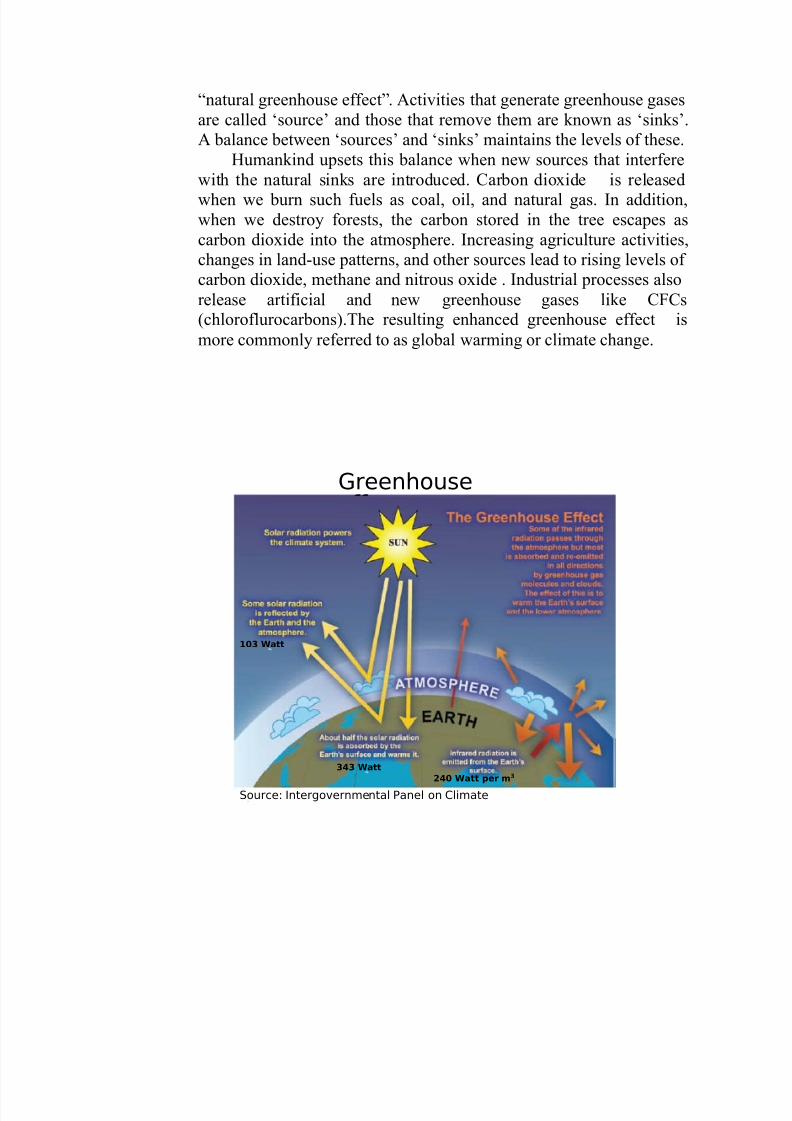
5.2 Greenhouse effectThe earth receives energy from the sun, which warms the earth’s
surface, as this energy passes through the atmosphere, a certain percentage (about 30) gets scattered. Some part of this energy isreflected back into the atmosphere from the land and ocean surface.
The rest (70%) actually remains behind to heat the earth. In order toestablish a balance, therefore, the earth must radiate some energy
back into the atmosphere. As the earth is much cooler than the sun, itdoes not emit energy as visible light. It emits thorough infrared or thermal radiation. However, certain gases in the atmosphere form asort of blanket around the earth and absorb some of this energyemitted back into the atmosphere. Without this blanket effect, the
earth would be around 30oC colder than it normally is. These gases
like carbon dioxide, methane, and nitrous oxide, along with water vapor, comprise less than one per cent of the atmosphere. They arecalled “greenhouse gases”, as the working principle is same as thatwhich accurs in a greenhouse. Just as the glass of the greenhouse
prevents the radiation of excess energy, this “gas blanket” absorbssome of the energy emitted by the earth and keeps temperature levelsintact. This effect was first recognized by a French Scientist, JeanBaptiste Fourier, who pointed out the similarity in what happens inthe atmosphere and in a greenhouse. Hence the term the “greenhouse”effect. The greenhouse effect is essentially a positive, life-giving
process that maintains the earth’s temperature at levels tolerable by itslife forms.
This gas blanket has been in place ever since the creation of theearth. Since the industrial revolution, human activities have beenreleasing more and more of these greenhouse gases into theatmosphere. This leads to the blanket becoming thicker and upsets the
7/30/2019 Farming Systems and Sustainable Agriculture
http://slidepdf.com/reader/full/farming-systems-and-sustainable-agriculture 48/149
“natural greenhouse effect”. Activities that generate greenhouse gasesare called ‘source’ and those that remove them are known as ‘sinks’.A balance between ‘sources’ and ‘sinks’ maintains the levels of these.
Humankind upsets this balance when new sources that interferewith the natural sinks are introduced. Carbon dioxide is releasedwhen we burn such fuels as coal, oil, and natural gas. In addition,when we destroy forests, the carbon stored in the tree escapes ascarbon dioxide into the atmosphere. Increasing agriculture activities,changes in land-use patterns, and other sources lead to rising levels of carbon dioxide, methane and nitrous oxide . Industrial processes alsorelease artificial and new greenhouse gases like CFCs(chloroflurocarbons).The resulting enhanced greenhouse effectmore commonly referred to as global warming or climate change.
is
Greenhouse
103 Watt
343 Watt
240 Watt per m3
Source: Intergovernmental Panel on Climate
7/30/2019 Farming Systems and Sustainable Agriculture
http://slidepdf.com/reader/full/farming-systems-and-sustainable-agriculture 49/149
5.3 Potential Effects of Greenhouse effect or Global
Warming
Some potential effects on agriculture and others associated withclimate change are listed in the following (From U.S. Climate Actionreport). Therefore, climate change is a threat to humanity!
1. Biomass production- decrease in productivity of crops andgrazing lands directly through changes in temperature and
precipitation, frequency of droughts/floods and indirectlythrough changes in soil quality, pests, and diseases, shifts inagro ecological zones. Alteration in the species diversity anddie-back of tropical forests and grasslands due to change inthe pattern of rainfall etc.Decline in soil quality- due to decline in soil structure,increased soil crusting and compaction, accelerated soilerosion, leaching & acidification, salinization, and organiccarbon decline and nutrient depletion.Water resources & quality- warmer climate will changerainfall & snowfall patterns leads to increased droughts &floods, melting of glaciers and polar ice sheets resulting inaccelerated sea- level rise affecting freshwater resources,coastal agriculture, fisheries & aquaculture, forests, natural
ecological systems, human settlements, loss of land due toinundation & erosion, salt-water intrusion, increased sedimentload, eutrophication etc.Air quality- increase dust concentrations, greenhouse gases,industrial pollution etc.
2.
3.
4.
5. General – warmer and wetter climate will favour the growthand spread of vector borne diseases like malaria & dengueaffecting human health increased frequency of storm and
hydro-power
disruption inother extreme event caouse decrease ingeneration, loss of infrastructure, tourism,transport routes, human settlements, industries, building
7/30/2019 Farming Systems and Sustainable Agriculture
http://slidepdf.com/reader/full/farming-systems-and-sustainable-agriculture 50/149
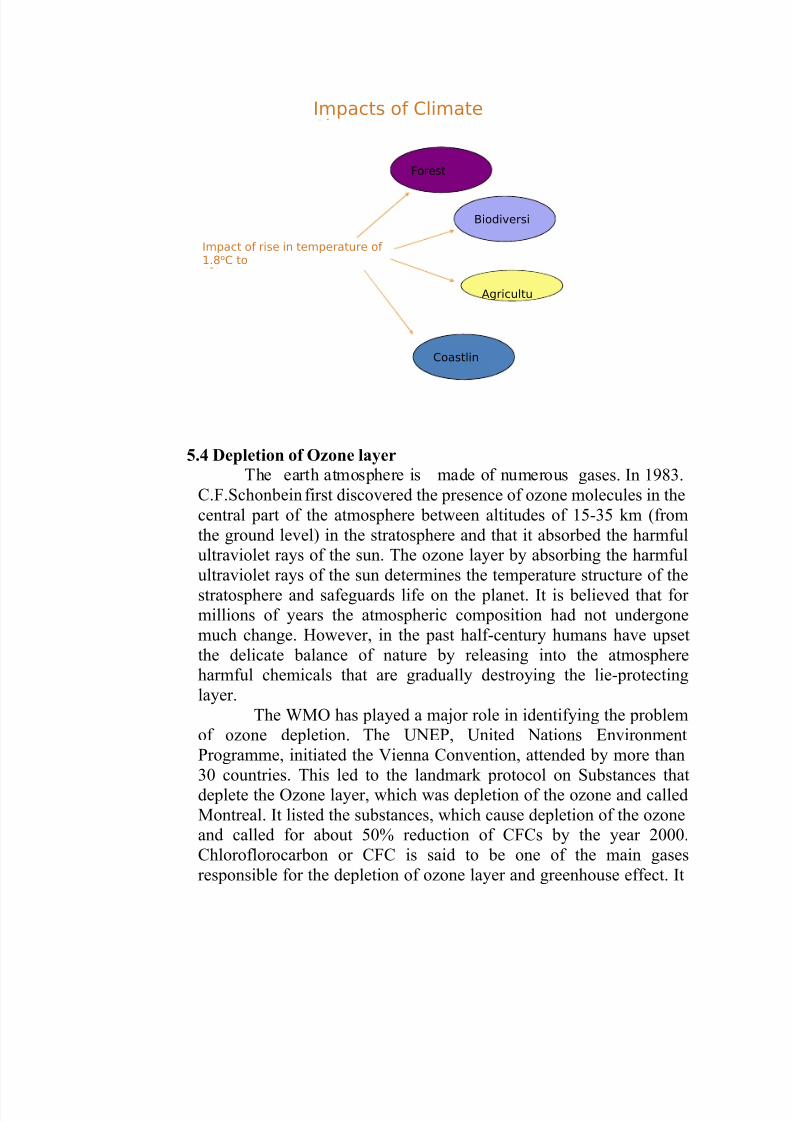
Impacts of Climate
Forest
Biodiversi
Impact of rise in temperature of 1.8oC to
Agricultu
Coastlin
5.4 Depletion of Ozone layer
The earth atmosphere is made of numerous gases. In 1983.C.F.Schonbein first discovered the presence of ozone molecules in thecentral part of the atmosphere between altitudes of 15-35 km (fromthe ground level) in the stratosphere and that it absorbed the harmfulultraviolet rays of the sun. The ozone layer by absorbing the harmful
ultraviolet rays of the sun determines the temperature structure of thestratosphere and safeguards life on the planet. It is believed that for millions of years the atmospheric composition had not undergonemuch change. However, in the past half-century humans have upsetthe delicate balance of nature by releasing into the atmosphereharmful chemicals that are gradually destroying the lie-protectinglayer.
The WMO has played a major role in identifying the problemof ozone depletion. The UNEP, United Nations Environment
Programme, initiated the Vienna Convention, attended by more than30 countries. This led to the landmark protocol on Substances thatdeplete the Ozone layer, which was depletion of the ozone and calledMontreal. It listed the substances, which cause depletion of the ozoneand called for about 50% reduction of CFCs by the year 2000.Chloroflorocarbon or CFC is said to be one of the main gasesresponsible for the depletion of ozone layer and greenhouse effect. It
7/30/2019 Farming Systems and Sustainable Agriculture
http://slidepdf.com/reader/full/farming-systems-and-sustainable-agriculture 51/149
is emitted mainly from air conditioners, refrigerators and aerosols or spray can propellants. Another widely used chemical that is a threat tothe ozone layer is methyl bromide. This can release bromide, which is30 to 50 times as destructive to ozone as chlorine. It is used as afumigant (fumes used as disinfectants for control of soil-borne pathogens) for soil and commodities and as a transport fuel additive.
It has to be clearly stated that the expected recovery of the ozonelayer would have been impossible without the Montreal Protocol onSubstances that Deplete the Ozone Layer (1987), which called for a
phased reduction of all ozone depleting substances. .
5.5Methane Emission from Rice Fields
Wetland rice fields have recently been identified as a major
source of atmospheric methane. Methane is produced as the terminalstep of the anaerobic breakdown of organic matter in wetland ricesoils. In a natural wetland, flooding a rice field cuts off the oxygensupply from the atmosphere to the soil, which results in anaerobicfermentation of soil organic matter. Methane is a major end productof anaerobic fermentation. It is released from submerged soils to theatmosphere by diffusion and ebullition and through roots and stems of rice plants. Recent global estimates of emission rates from wetlandrice field’s range from 20 to 100 Tg/year (IPCC 1992). The current
burden of methane in the atmosphere is is approximately 4700 Tg (1Tg=1 million tons), and the global annual emission is estimated to be500 Tg with an apparent net flux of 40 Tg/year. Continued increase inatmospheric methane concentrations at the current rate of approximately 1% per year is likely to contribute more to futureclimatic change than any other gas except carbon dioxide. Methane isexclusivelyonly in the
produced by methanogenic bacteria that can metabolizestrict absence of free oxygen and at redox potentials of
less than- 150 mV. In tropical flooded rice soils, where soiltemperatures are 25-30
oC, methane production is rapid in alkaline and
calcareous soils(may start hours after flooding)and slow in acid soils(formed five or more weeks after flooding). Methane production isnegatively correlated with a soil redox potential and positivelycorrelated with soil temperature, soil carbon content, and rice growth.Easily degradable crop residues, fallow weeds, and soil organicmatter are the major source for initial methane production. At later
7/30/2019 Farming Systems and Sustainable Agriculture
http://slidepdf.com/reader/full/farming-systems-and-sustainable-agriculture 52/149
growth stages of rice, root exudates, decaying roots, and aquatic biomass seem to be more important.
5.5.1 Conditions favouring methane production and emission in
rice fields
•
•
Anaerobic conditions in wetland soils
Disturbance of wetland soil by cultural practices favourssoil trapped methane to escape to atmosphere throughebullition
Use of organic amendments
Application of chemical fertilizers
•
•
5.5.2 Mitigation options
• Prevent of submergence of rice fields where ever feasiblewithout affecting the rice productivity
Increased adoption of direct seeding (wet and dry seeding)instead of transplanting
Crop diversification in rice based cropping systems
Water management- intermittent drying and mid-seasondrainage in controlled water situations
Growing rice cultivars having traits with low methane
emission potentialUse of sulfate-containing fertilizer reduces methaneemission
Minimization of soil disturbance during growing season toreduce escape of entrapped methane
Use of properly composted organic amendments
•
•
•
•
•
•
•
***
7/30/2019 Farming Systems and Sustainable Agriculture
http://slidepdf.com/reader/full/farming-systems-and-sustainable-agriculture 53/149
Lecture No.6
FERTILIZER AS A SOURCE OF
POLLUTION AND CONTROL MEASURES
6.1IntroductionThroughout human history, increasing population growth andchanging dietary patterns have resulted in more and more land
moving from forest or grasslands into agricultural production.Over the past few decades, the greatly increased use of chemicalfertilizers plus changes in irrigation practices and improved cropvarieties, have enabled land already under cultivation to befarmed much more intensively. Synthetic fertilizers have playeda dominant role in agricultural intensification in industrializedand developing countries like India for decades. Both fertilizers
and pesticides have become widely distributed in theenvironment and most of the concern today related to the healthconsequences of agriculture now centers on these two (as asource of environmental pollution).
6.2 Fertilizers as a source of pollution
India has come a long way, since independence, in respect of production and consumption of fertilizers. In the year 1951-52 thecountry produced a mere 27,000 tonnes of fertilizers, which now rose
to a level of 13,4 million tone (2000-01). Likewise the per haconsumption of fertilizers, which was as low as 1,5 kg/ha during1951-52 has now increased to 94 kg/ha in 2000-01. the increased useof fertilizers beginning with the year 1966-67 was due tointensification of agriculture, particularly in irrigated areas.
Several problems linking excessive use of fertilizer withenvironment have been identified. The increase of nitrates in thedrinking water, a development about which general public is greatlyconcerned, and believed to be due to excessive use of N fertilizers andanimal manures, is regarded as most important fertilizer related
pollution issue. Nutrient enrichment, eutrophication and deteriorationof surface water quality due to transpiration of nutrients appliedthrough fertilizers via leaching and /or runoff and sediment erosion isanother problem. The contamination of soils by heavy metals throughfertilizers such as cadmium from phosphatic fertilizers, is alsoreceiving increasing attention of environmentalists.
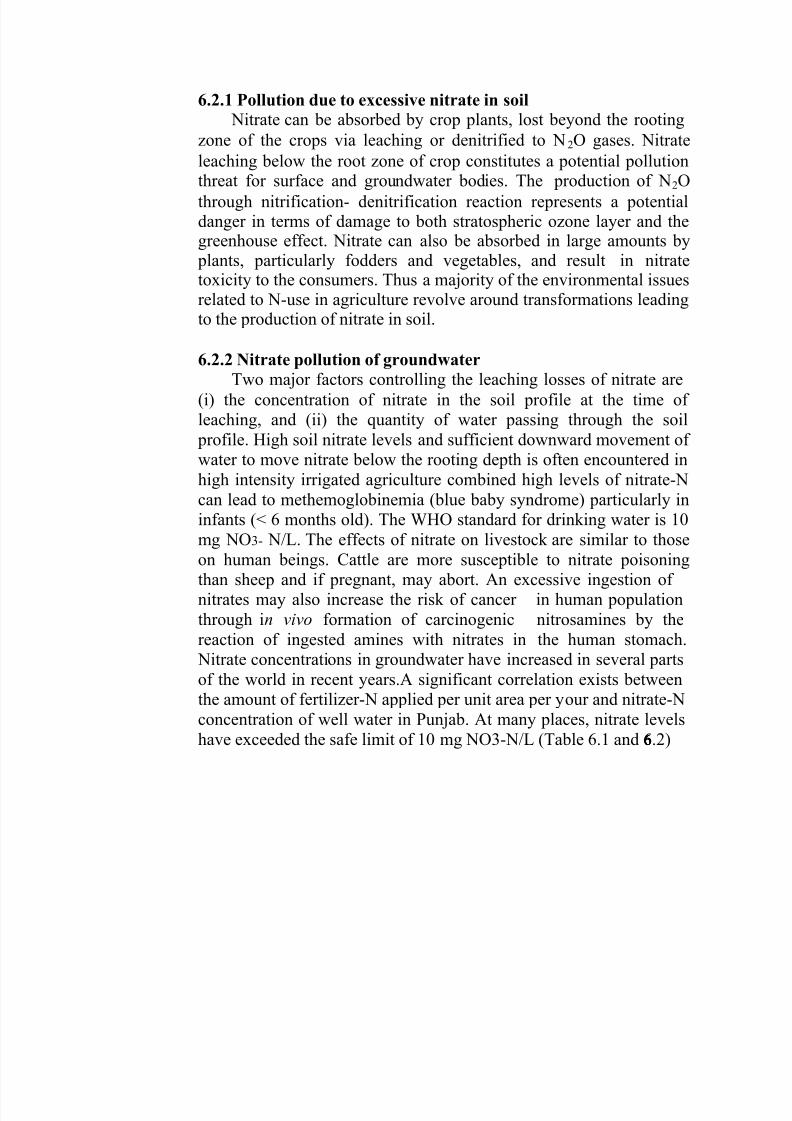
7/30/2019 Farming Systems and Sustainable Agriculture
http://slidepdf.com/reader/full/farming-systems-and-sustainable-agriculture 54/149
6.2.1 Pollution due to excessive nitrate in soil
Nitrate can be absorbed by crop plants, lost beyond the rooting
zone of the crops via leaching or denitrified to N2O gases. Nitrate
leaching below the root zone of crop constitutes a potential pollution
threat for surface and groundwater bodies. The production of N2Othrough nitrification- denitrification reaction represents a potentialdanger in terms of damage to both stratospheric ozone layer and thegreenhouse effect. Nitrate can also be absorbed in large amounts by
plants, particularly fodders and vegetables, and result in nitratetoxicity to the consumers. Thus a majority of the environmental issuesrelated to N-use in agriculture revolve around transformations leadingto the production of nitrate in soil.
6.2.2 Nitrate pollution of groundwater
Two major factors controlling the leaching losses of nitrate are(i) the concentration of nitrate in the soil profile at the time of leaching, and (ii) the quantity of water passing through the soil
profile. High soil nitrate levels and sufficient downward movement of water to move nitrate below the rooting depth is often encountered inhigh intensity irrigated agriculture combined high levels of nitrate-Ncan lead to methemoglobinemia (blue baby syndrome) particularly ininfants (< 6 months old). The WHO standard for drinking water is 10mg NO3- N/L. The effects of nitrate on livestock are similar to thoseon human beings. Cattle are more susceptible to nitrate poisoningthan sheep and if pregnant, may abort. An excessive ingestion of nitrates may also increase the risk of cancer through in vivo formation of carcinogenicreaction of ingested amines with nitrates in
in human populationnitrosamines by thethe human stomach.
Nitrate concentrations in groundwater have increased in several partsof the world in recent years.A significant correlation exists betweenthe amount of fertilizer-N applied per unit area per your and nitrate-Nconcentration of well water in Punjab. At many places, nitrate levelshave exceeded the safe limit of 10 mg NO3-N/L (Table 6.1 and 6.2)6666
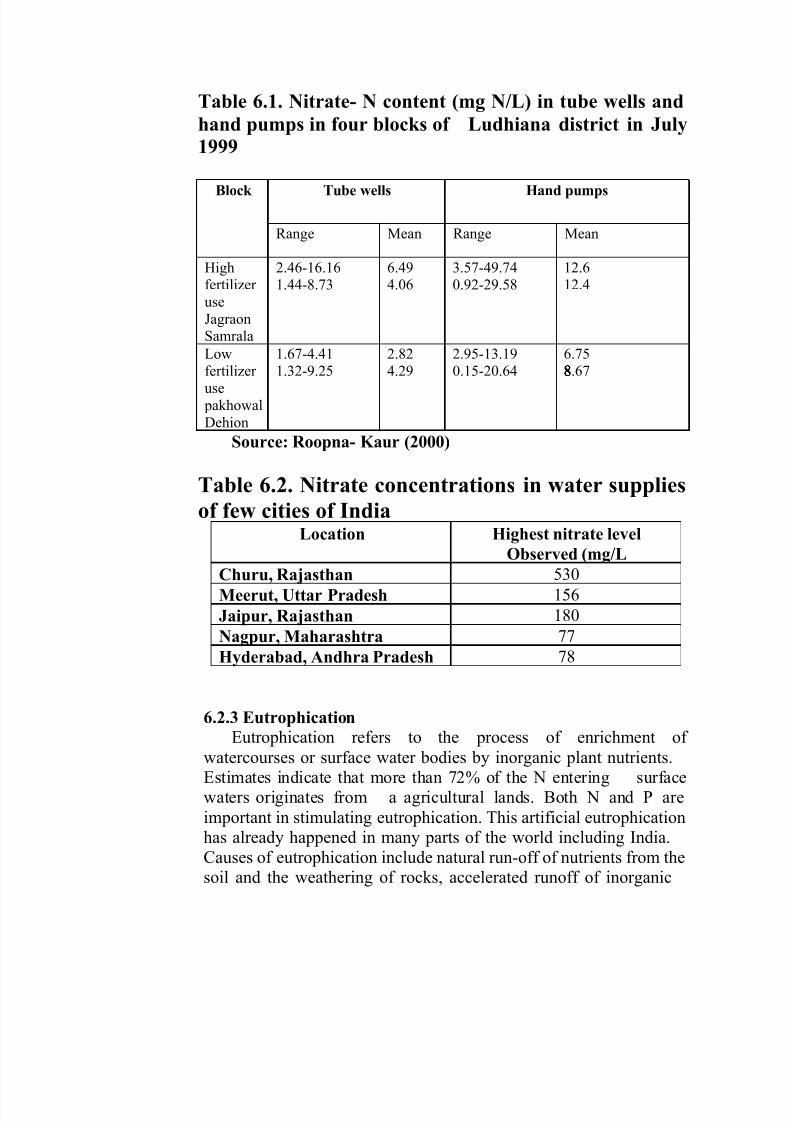
7/30/2019 Farming Systems and Sustainable Agriculture
http://slidepdf.com/reader/full/farming-systems-and-sustainable-agriculture 55/149
Table 6.1. Nitrate- N content (mg N/L) in tube wells and
hand pumps in four blocks of
1999
Ludhiana district in July
Source: Roopna- Kaur (2000)
Table 6.2. Nitrate concentrations
of few cities of India
in water supplies
6.2.3 Eutrophication
Eutrophication refers to the process of enrichment of
watercourses or surface water bodies by inorganic plant nutrients.Estimates indicate that more than 72% of the N entering surfacewaters originates from a agricultural lands. Both N and P areimportant in stimulating eutrophication. This artificial eutrophicationhas already happened in many parts of the world including India.Causes of eutrophication include natural run-off of nutrients from thesoil and the weathering of rocks, accelerated runoff of inorganic
Location Highest nitrate level
Observed (mg/L
Churu, Rajasthan 530Meerut, Uttar Pradesh 156
Jaipur, Rajasthan 180
Nagpur, Maharashtra 77
Hyderabad, Andhra Pradesh 78
Block Tube wells Hand pumps
Range Mean Range Mean
Highfertilizer useJagraonSamrala
2.46-16.161.44-8.73
6.494.06
3.57-49.740.92-29.58
12.612.4
Lowfertilizer use pakhowalDehion
1.67-4.411.32-9.25
2.824.29
2.95-13.190.15-20.64
6.758.678888

7/30/2019 Farming Systems and Sustainable Agriculture
http://slidepdf.com/reader/full/farming-systems-and-sustainable-agriculture 56/149
fertilizer & manures (containing nitrates and phosphates) fromagricultural lands, runoff from areas following mining, constructionwork or poor land use, discharge of detergents (containing phosphates) through domestic wastewater.
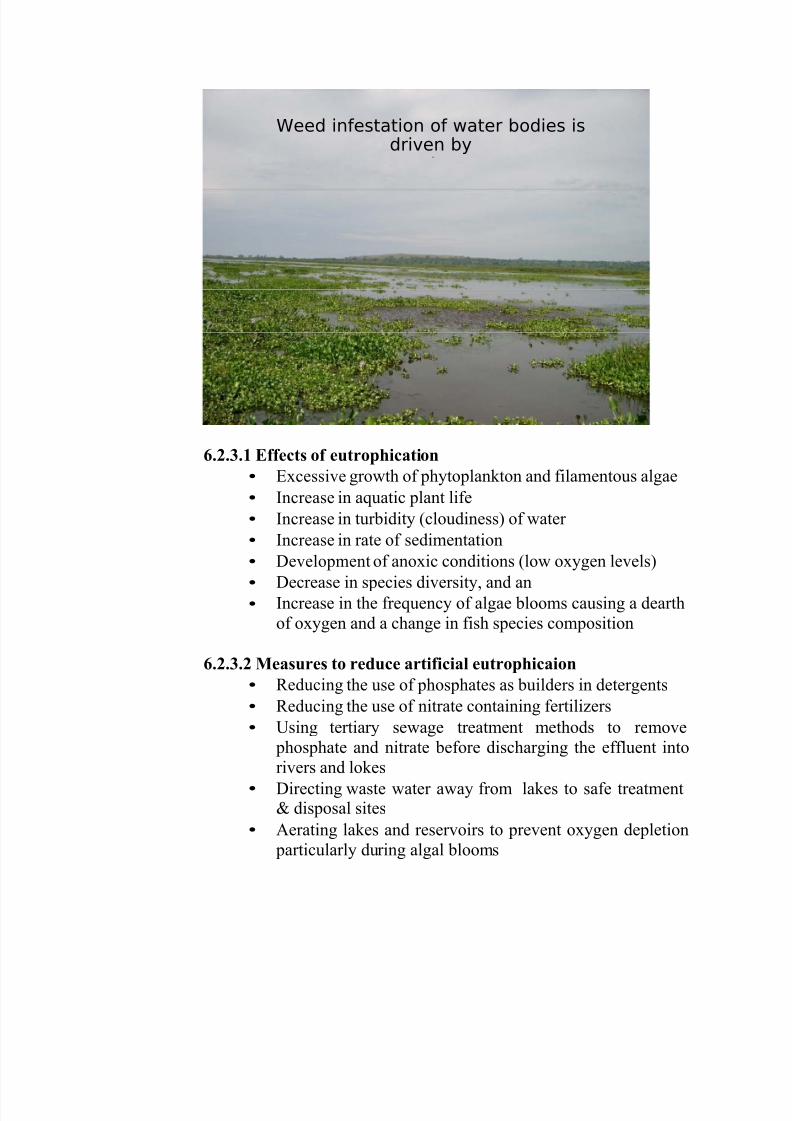
7/30/2019 Farming Systems and Sustainable Agriculture
http://slidepdf.com/reader/full/farming-systems-and-sustainable-agriculture 57/149
Weed infestation of water bodies isdriven by
6.2.3.1 Effects of eutrophication
•
•
•
•
•
•
•
Excessive growth of phytoplankton and filamentous algae
Increase in aquatic plant life
Increase in turbidity (cloudiness) of water
Increase in rate of sedimentation
Development of anoxic conditions (low oxygen levels)Decrease in species diversity, and an
Increase in the frequency of algae blooms causing a dearthof oxygen and a change in fish species composition
6.2.3.2 Measures to reduce artificial eutrophicaion
•
•
•
Reducing the use of phosphates as builders in detergents
Reducing the use of nitrate containing fertilizers
Using tertiary sewage treatment methods to remove phosphate and nitrate before discharging the effluent intorivers and lokes
Directing waste water away from lakes to safe treatment& disposal sites
Aerating lakes and reservoirs to prevent oxygen depletion particularly during algal blooms
•
•
7/30/2019 Farming Systems and Sustainable Agriculture
http://slidepdf.com/reader/full/farming-systems-and-sustainable-agriculture 58/149
• Removing phosphate- rich plant material from affectedlakes
Removing phosphate rich sediments by dredging•
1.3 Management practices to reduce fertilizer pollution by N
Some of the management practices that can reduceenvironmental pollution by N originating from agricultural lands arelisted below:
1. Improved fertilizer use efficiency
•
•
Apply optimum dose of N
Timing the fertilizer N applications to coincide with thecrop needs
Apply N fertilizer in split doses Apply
balanced doses of N,P and K Incorporate or
deep place fertilizer N into soil Use slow
release fertilizers
Use urea and nitrification inhibitors
•
•
•
•
•
2. Land management techniques
•
•
Adopt crop rotation and catch crops
Improve irrigation scheduling to encourage plant growth
and minimize leachingConservation tillage to control surface runoff
Crop residue recycling
Use of terrace, contouring and retention bases to catchsediments
Genetic manipulation of plant material to be moreefficient at N-recovery and N2 fixation
•
•
•
•
***
7/30/2019 Farming Systems and Sustainable Agriculture
http://slidepdf.com/reader/full/farming-systems-and-sustainable-agriculture 59/149
Lecture No.7
PESTICIDES AS A SOURCE OF
POLLUTION AND CONTROL MEASURES
7.1. Introduction
In 1995, world pesticide consumption reached 2.6 million metrictons of “active ingredients”, the biologically active chemicals at the heartof commercial pesticide formulations, with a market value of $38 billion(US dollars). Roughly 85% of this consumption was used in agriculture.India is currently the largest manufacturer of pesticides and the secondlargest producer of agrochemicals in Asia.
The use of pesticides (insecticides, fungicides, herbicides) inIndia is increasing at the rate of 2 to 5% per annum. The pesticidedemand is close to 90,000 MT per annum. The per capita consumption is600 gm per hectare as compared to 10-12 kg/ha in developed economies.Yet, the problem of pesticide use has assumed serious proportions inIndia because of the non-uniform use of the plant protection chemicals indifferent regions, cropping systems and crop and indiscriminate use andmisuse and abuse of these chemicals. Obviously, there is a mismatch
between pesticide use and cropped area. Cotton, rice, fruits andvegetables, which account for less than 35 per cent of the cropped area,consume 84 per cent of the pesticides. On the other extreme, wheat,coarse cereals, millets and pulses contributing to 54 per cent of thecropped area consume only 3per cent of the pesticides used. Insecticide(73%) dominates the market, followed by herbicide (14%) and fungicide(11%). Although it is expected that herbicide will grow faster in thefuture, insecticides will continue to dominate the market. Cotton, riceand wheat growers account for almost 70% of pesticide consumption,and the states consuming more in the decreasing order are AndhraPradesh, Punjab, Karnataka and Gujarat.
Pesticides were considered as panacea to contain pestilence oncrops. This attitude led to a phenomenal growth of pesticide use inagriculture. The pesticides upset natural balance and ecosystem and alsoaffect the field workers. If the residues go undetected, the consumer mayalso be affected. Pesticides residues in soil, water, environment, foodsetc, are of serious environmental concern.
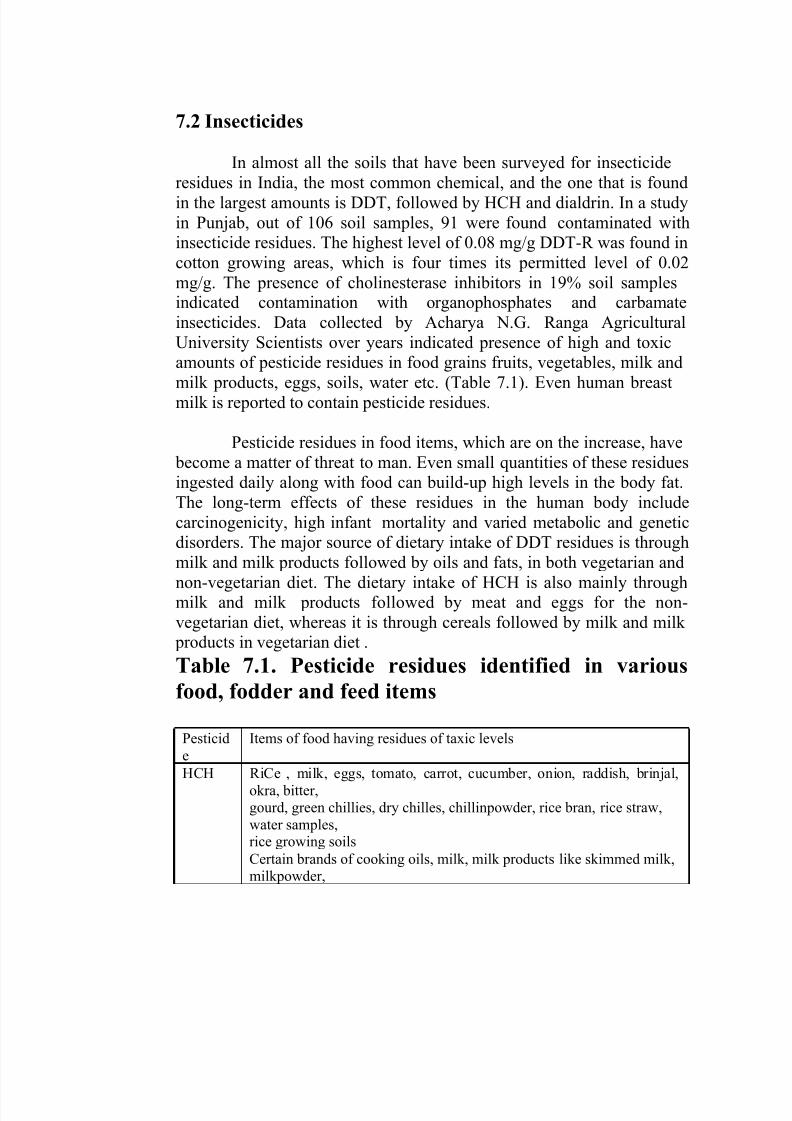
7/30/2019 Farming Systems and Sustainable Agriculture
http://slidepdf.com/reader/full/farming-systems-and-sustainable-agriculture 60/149
7.2 Insecticides
In almost all the soils that have been surveyed for insecticide
residues in India, the most common chemical, and the one that is foundin the largest amounts is DDT, followed by HCH and dialdrin. In a studyin Punjab, out of 106 soil samples, 91 were found contaminated withinsecticide residues. The highest level of 0.08 mg/g DDT-R was found incotton growing areas, which is four times its permitted level of 0.02mg/g. The presence of cholinesterase inhibitors in 19% soil samplesindicated contamination with organophosphates and carbamateinsecticides. Data collected by Acharya N.G. Ranga AgriculturalUniversity Scientists over years indicated presence of high and toxicamounts of pesticide residues in food grains fruits, vegetables, milk and
milk products, eggs, soils, water etc. (Table 7.1). Even human breastmilk is reported to contain pesticide residues.
Pesticide residues in food items, which are on the increase, have become a matter of threat to man. Even small quantities of these residuesingested daily along with food can build-up high levels in the body fat.The long-term effects of these residues in the human body includecarcinogenicity, high infant mortality and varied metabolic and geneticdisorders. The major source of dietary intake of DDT residues is through
milk and milk products followed by oils and fats, in both vegetarian andnon-vegetarian diet. The dietary intake of HCH is also mainly throughmilk and milk products followed by meat and eggs for the non-vegetarian diet, whereas it is through cereals followed by milk and milk products in vegetarian diet .
Table 7.1. Pesticide residues identified in various
food, fodder and feed items
Pesticid
e
Items of food having residues of taxic levels
HCH RiCe , milk, eggs, tomato, carrot, cucumber, onion, raddish, brinjal,okra, bitter,gourd, green chillies, dry chilles, chillinpowder, rice bran, rice straw,water samples,rice growing soils
Certain brands of cooking oils, milk, milk products like skimmed milk,milkpowder,
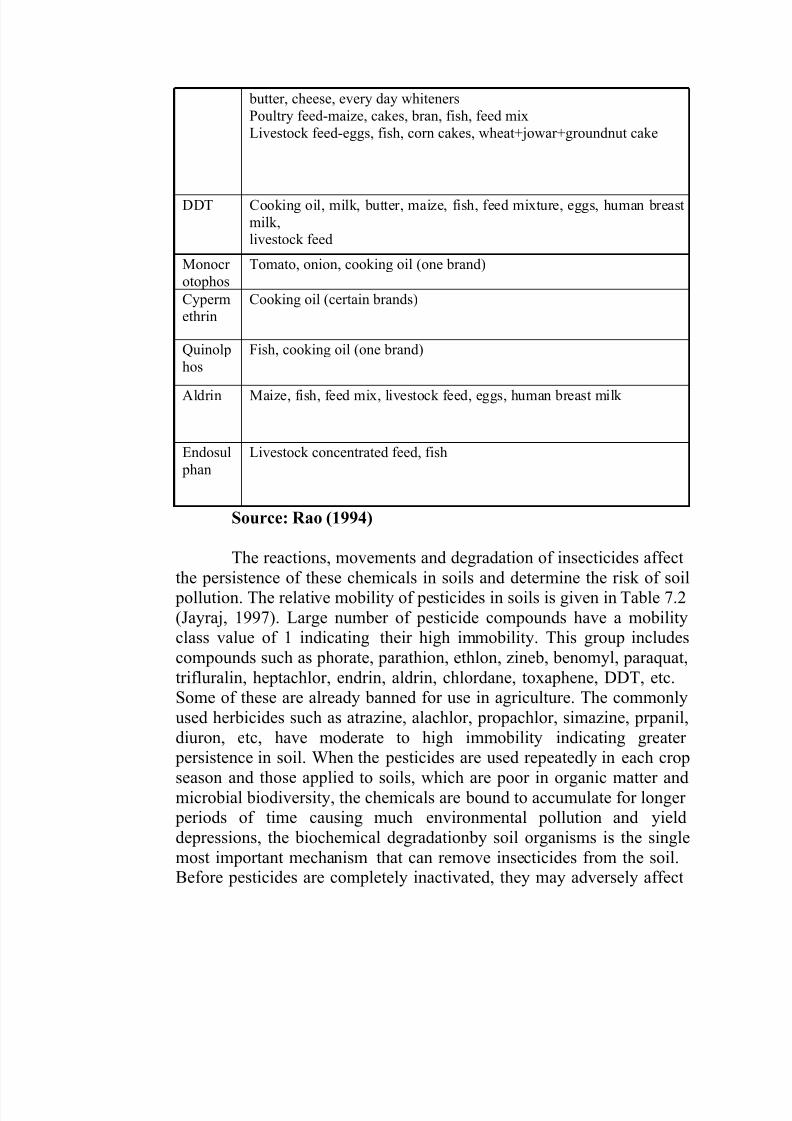
7/30/2019 Farming Systems and Sustainable Agriculture
http://slidepdf.com/reader/full/farming-systems-and-sustainable-agriculture 61/149
Source: Rao (1994)
The reactions, movements and degradation of insecticides affectthe persistence of these chemicals in soils and determine the risk of soil
pollution. The relative mobility of pesticides in soils is given in Table 7.2(Jayraj, 1997). Large number of pesticide compounds have a mobilityclass value of 1 indicating their high immobility. This group includescompounds such as phorate, parathion, ethlon, zineb, benomyl, paraquat,trifluralin, heptachlor, endrin, aldrin, chlordane, toxaphene, DDT, etc.Some of these are already banned for use in agriculture. The commonlyused herbicides such as atrazine, alachlor, propachlor, simazine, prpanil,diuron, etc, have moderate to high immobility indicating greater
persistence in soil. When the pesticides are used repeatedly in each cropseason and those applied to soils, which are poor in organic matter andmicrobial biodiversity, the chemicals are bound to accumulate for longer
periods of time causing much environmental pollution and yielddepressions, the biochemical degradationby soil organisms is the singlemost important mechanism that can remove insecticides from the soil.Before pesticides are completely inactivated, they may adversely affect
butter, cheese, every day whitenersPoultry feed-maize, cakes, bran, fish, feed mixLivestock feed-eggs, fish, corn cakes, wheat+jowar+groundnut cake
DDT Cooking oil, milk, butter, maize, fish, feed mixture, eggs, human breastmilk,livestock feed
Monocr otophos
Tomato, onion, cooking oil (one brand)
Cypermethrin
Cooking oil (certain brands)
Quinolphos
Fish, cooking oil (one brand)
Aldrin Maize, fish, feed mix, livestock feed, eggs, human breast milk
Endosul phan
Livestock concentrated feed, fish
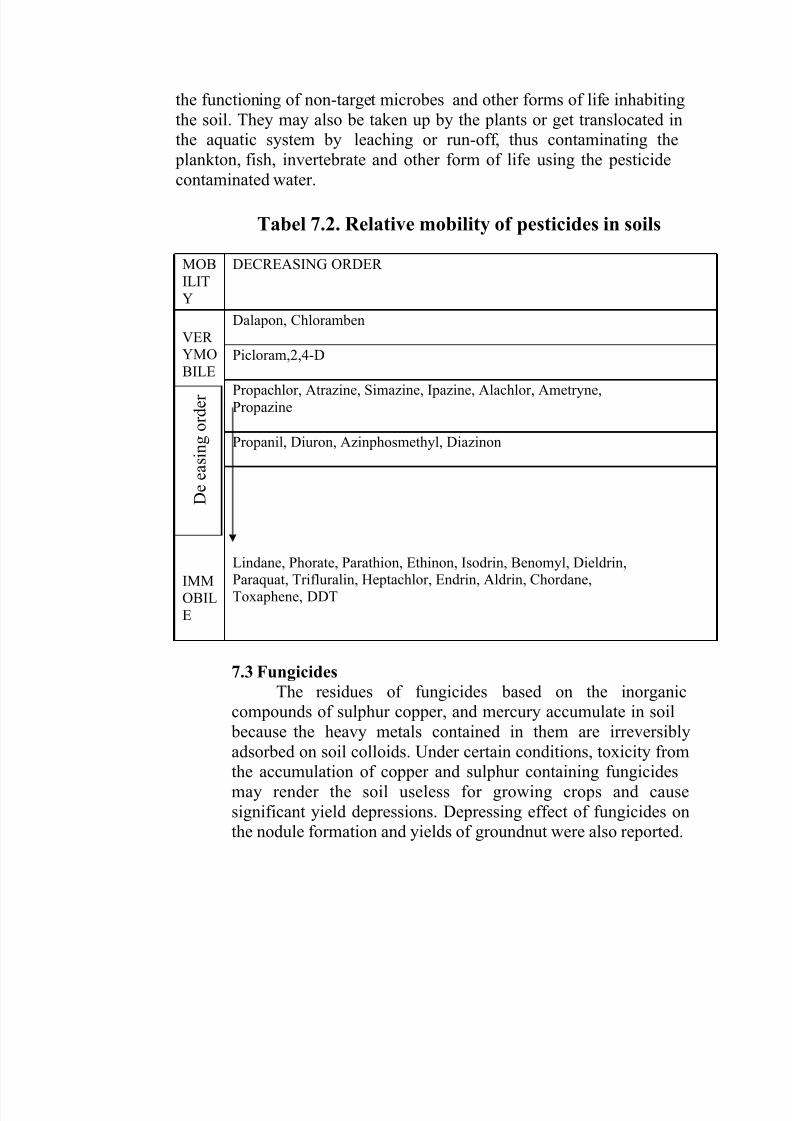
7/30/2019 Farming Systems and Sustainable Agriculture
http://slidepdf.com/reader/full/farming-systems-and-sustainable-agriculture 62/149
the functioning of non-target microbes and other forms of life inhabitingthe soil. They may also be taken up by the plants or get translocated inthe aquatic system by leaching or run-off, thus contaminating the
plankton, fish, invertebrate and other form of life using the pesticidecontaminated water.
Tabel 7.2. Relative mobility of pesticides in soils
7.3 Fungicides
The residues of fungicides based on the inorganiccompounds of sulphur copper, and mercury accumulate in soil
because the heavy metals contained in them are irreversibly
adsorbed on soil colloids. Under certain conditions, toxicity fromthe accumulation of copper and sulphur containing fungicidesmay render the soil useless for growing crops and causesignificant yield depressions. Depressing effect of fungicides onthe nodule formation and yields of groundnut were also reported.
MOBILITY
DECREASING ORDER
VER YMO
BILE
Dalapon, Chloramben
Picloram,2,4-D
Propachlor, Atrazine, Simazine, Ipazine, Alachlor, Ametryne,Propazine
D e e a s i n g o r d e r
Propanil, Diuron, Azinphosmethyl, Diazinon
Lindane, Phorate, Parathion, Ethinon, Isodrin, Benomyl, Dieldrin,Paraquat, Trifluralin, Heptachlor, Endrin, Aldrin, Chordane,Toxaphene, DDT
IMMOBILE
7/30/2019 Farming Systems and Sustainable Agriculture
http://slidepdf.com/reader/full/farming-systems-and-sustainable-agriculture 63/149
7.4 Herbicides
In intensive and diversified cropping rotation systems, theherbicide applied to one crop may persist in the soil atconcentrations high enough to damage the subsequent sensitivecrops. Under Indian conditions, when a herbicide dose of 0.5 to2.0 kg/ha is applied, it results in a buildup of residues in therange of 0.25 to 1.0 mg/g/, which is safely below the potentialresidual effect. But the same herbicide when applied repeatedly itstarts building undesirable residues in the soil. For example,fluchloralin, metabenzthiazuron and atrazine were detected inamounts that could adversely affect not only other crop plants
but also several processes in soil leasing to inefficient nutrientmanagement and in turn, reduced crop yields. The herbicide, 2,4-D, restricts the growth of azotobacter, Lindane applied at
normal rates considerably reduces the number and weight of nodules in groundnut.
7.5 Control measures to reduce pesticide pollution
•
•
•
•
Application of easily decomposable organic matter
Use of large quantities of organic manures
Raising high N cover crops
Growing of crop plants that a tendency to accumulate the pesticide
Follow soil management practices leading to increasedleaching of pesticides
Adoption of biological control methods
Use of biochemical pesticides
Need based plant protection
•
•
•
•
7.6 Biopesticides and bioherbicides
7.6.1 Introduction
Biological control is defined as applied naturalwherein man intervenes to improve the efficiency of enemies including parasites, predators, and pathogens
controlnaturalof pest
species by introductions, conservation, or augmentation tomaintain pest populations below economically injurious levels.
Biological control by means of entomopathogens andother microbial pest control agents involves the application of
7/30/2019 Farming Systems and Sustainable Agriculture
http://slidepdf.com/reader/full/farming-systems-and-sustainable-agriculture 64/149
microorganisms on to the crop for ingestion by insect’s pests or directly on the noxious insects, fungus or weed with theobjective of destroying the, these bio control agents include
bacteria, protozoa, fungi, viruses and nematodes.
7.6.2 Biopesticdes
Biopesticides also known as biological pesticides are certaintypes of pesticides dervived from such materials as animals,
bacteria, and certain minerals. These are an important group of pesticides that can reduce pesticide risks.
7.6.2.1 Characteristics of Bio-pesticides
• Have a narrow target range and a very specific mode of action
Are slow actingHave relatively critical application times
Suppress, rather than eliminate, a pest population
Have limited field persistence and short shelf life
•
•
•
•
• Are safer to humans and the environment thanconventional pesticides
Present no residue problems•
7.6.2.2 Advantages of using bio-pesticides
• Biopesticides are inherently less harmful thanconventional pesticides
Biopesticides are designed to affect only one specific pestor, in some cases, a few target organisms, in contrast to
broad spectrum, conventional pesticides that may affectorganisms as different as birds, insects, and mammalsBiopesticides often are effective in very small quantitiesand they decompose quickly thereby resulting in lower exposures and largely avoiding the pollution problems
caused by conventional pesticides
•
•
• When used as a component of integrated pestManagementdecrease the
(IPM) programs, biopesticides can greatlyuse of conventional pesticides while crop
yields remain high
To use biopesticides effectively; however, users need toknow a great deal aboutmanaging pests
•
7/30/2019 Farming Systems and Sustainable Agriculture
http://slidepdf.com/reader/full/farming-systems-and-sustainable-agriculture 65/149
7.6.2.3 Microbial pesticides
Microbial pesticides contain a microorganism (bacterium,fungus, virus. Protozoon or algae) as the active ingredient. Theysuppress pests by
•
•
•
Producing a toxin specific to the pest;
Causing a disease;
Preventing establishment of other microorganisms throughcompetition; or
Other modes of action•
An example of microbial pesticide is Bacillus thuringiensis ot Bt. Bacillus thuringiensis is a naturally occurring soil bacteria that istoxic to the larvae of several species of insects but non-toxic to
non-target organisms. Bacillus thuringiensis can be applied to plant foliage or incorporated in to the genetic material of cropseg. Bt cottons. Bacillus thuringiensis as discovered is toxic to thecaterpillars (larvae) of moths and butterflies. Several strains of Bthave been developed and now strains are available that controlfly larvae. These can be used in controlling mosquitoes and black flies. Microbial pesticides need to be continuously monitored toensure they do not become capable of harmingorganisms, including humans. Other examples of
pesticides include the following:
non-targetmicrobial
• Bacillus thuringensis against caterpillars of Earias, Spodoptera etc
Heliothis,
• Pseudomonas fluoroscenes against Pythium spp., Rhizoctonia spp., Fusarium spp.
Nematodes like Green commandoes and Soil commandoesagainst caterpillars & grubs
Nuclear Polyhedrosis Virus(NPV)
Trichoderma virdi against many common diseases of
vegetables and spicesWeevils Neochitina eichorniae & N bruchi against water hyacinth
Beetle Zygogramma biocolorata against Parthenium
•
•
•
•
•
7.6.2.4 Biochemical pesticidesppppppp
7/30/2019 Farming Systems and Sustainable Agriculture
http://slidepdf.com/reader/full/farming-systems-and-sustainable-agriculture 66/149
These are naturally occurring substances that control pests bynon-toxic mechanisms. (Conventional pesticides, by contrast, aresynthetic materials that usually kill or inactivate the pest).Biochemical pesticides include substances that interfere withgrowth or mating, such as growth regulators, or substances thatrepel or attract pests, such as pheromones. Pheromones are oftenused to detect or monitor insect populations, or in some cases, tocontrol them.
7.6.3 Bioherbicides
The biological control of weeds involves the use of livingorganisms such as plant pathogens, insects and mites,herbivorous fish, nematodes, other animals and competitive
plants to limit their infestation. The objectives of biological
control are not eradication, rather the reduction and, regulation of weed population below the levels of economic injury. Asuccessful bio-agent is host specific, rapid destroyer of the targetweed, effective on several taxa of the weed in question,adjustable to new environment and easy to multiply. Biologicalcontrol of weeds has had a long and successful record in theUnited States and several other countries.
“A bioherbicide is a plant pathogen used as a weed controlagent through inundative and repeated application of itsinoculums or by augmentation of natural, seasonal disease levelsthrough small releases of inoculums. The bioherbicide can
provide an effective, safe and viable method of weed control”. Alist of bioherbicides is presented in Table 7.3.
A bioherbicide can often live in the environment and wait for thenext growing season when there will be more weeds to infects.This reduces the farmer’s cost of applying herbicides year after year. A new range of bioherbicides may essentially allow
farmers to replace or reduce the expensive chemical herbicidesthat they now use. They also allow farmers to get rid of weedthat interfere with their crop’s productivity without threateningthe environment.ttttttt
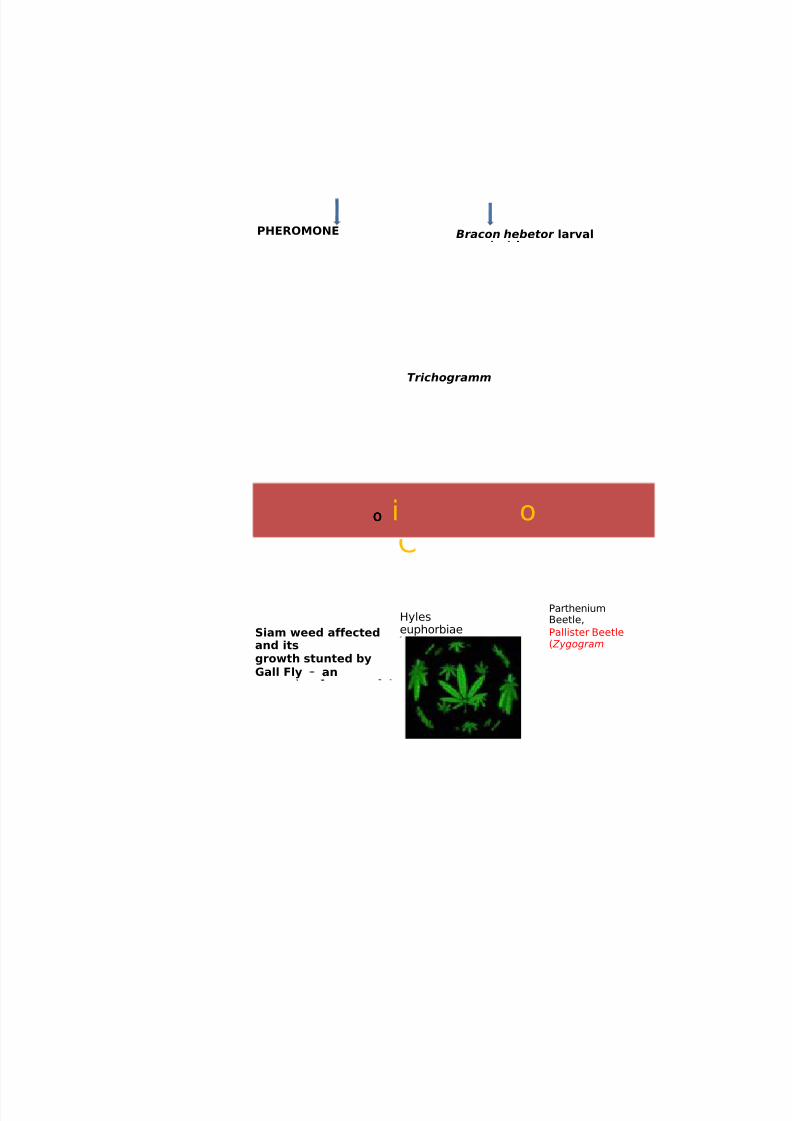
7/30/2019 Farming Systems and Sustainable Agriculture
http://slidepdf.com/reader/full/farming-systems-and-sustainable-agriculture 67/149
ntrolcal WeeC
Bioloooooooo
PHEROMONE Bracon hebetor larval
Trichogramm
PartheniumBeetle,
Pallister Beetle( Zygogram
HyleseuphorbiaeSiam weed affected
and itsgrowth stunted byGall Fly ‐ an
i o
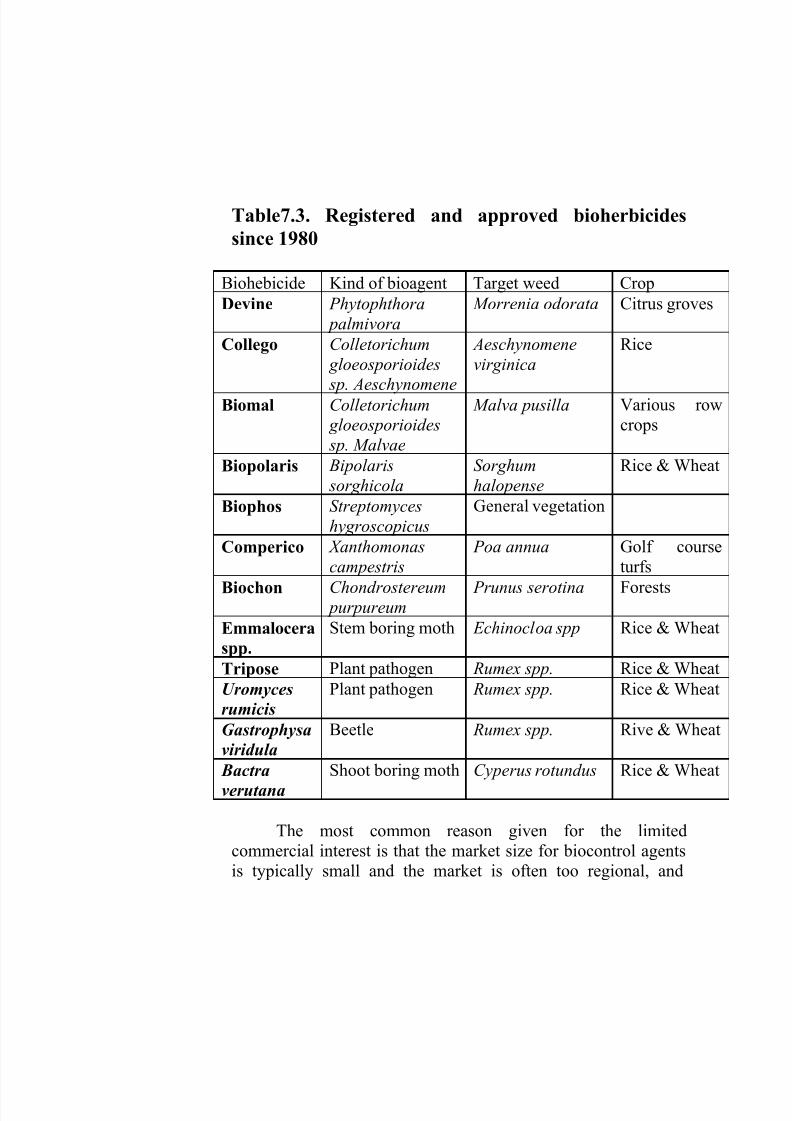
7/30/2019 Farming Systems and Sustainable Agriculture
http://slidepdf.com/reader/full/farming-systems-and-sustainable-agriculture 68/149
Table7.3.
since 1980
Registered and approved bioherbicides
The most common reason given for the limitedcommercial interest is that the market size for biocontrol agentsis typically small and the market is often too regional, and
Biohebicide Kind of bioagent Target weed Crop
Devine Phytophthora
palmivora
Morrenia odorata Citrus groves
Collego Colletorichum
gloeosporioides
sp. Aeschynomene
Aeschynomene
virginica
Rice
Biomal Colletorichum
gloeosporioides
sp. Malvae
Malva pusilla Various rowcrops
Biopolaris Bipolaris
sorghicola
Sorghum
halopense
Rice & Wheat
Biophos Streptomyces
hygroscopicus
General vegetation
Comperico Xanthomonas
campestris
Poa annua Golf course
turfsBiochon Chondrostereum
purpureum
Prunus serotina Forests
Emmalocera
spp.
Stem boring moth Echinocloa spp Rice & Wheat
Tripose Plant pathogen Rumex spp. Rice & Wheat
Uromyces
rumicis
Plant pathogen Rumex spp. Rice & Wheat
Gastrophysa
viridula
Beetle Rumex spp. Rive & Wheat
Bactra
verutana
Shoot boring moth Cyperus rotundus Rice & Wheat

7/30/2019 Farming Systems and Sustainable Agriculture
http://slidepdf.com/reader/full/farming-systems-and-sustainable-agriculture 69/149
consequently the financial returns from biocontrol agents are toosmall for big industries. The potential to use a bioherbicide indiverse crops and against several weeds might create commercialinterest in this technology.
***
7/30/2019 Farming Systems and Sustainable Agriculture
http://slidepdf.com/reader/full/farming-systems-and-sustainable-agriculture 70/149
Lecture No. 8
MANAGEMENT OF NATURAL
RESOURCES
(SOIL, WATER, VEGETATION AND ENERGY)
8.1 Introduction
Man has been relaying on the natural resources to meet
the basic requirements since time immemorial. With theunprecedented increase in the population during the last fewdecades, clearly mankind faces formidable problem to ensurefood and nutritional security for all, considering reduced per capita land, reduced availability of water, depleting biodiversity
and need to preserve ecology and environment. The physical and biological environment of the earth is so rich in its potential thatis can support the need of its inhabitants for a long time to come.However, the man’s greed rather than his needs is puttingenormous pressure in the capacity of the biosphere resulting inover-exploitation of the natural resources, as the demand is notwithin the paradigm set by ecological constraints.
The natural resource management at most places in theworld including India is inappropriate, exploitative andunscientifically planned. Even today, land and water are being
exploited without restraint considering them inexhaustible, andwastes are discharged freely into air and water assuming thatthese have unlimited assimilative and carrying capacities. As aresult, very disturbing trends of natural resource degradationhave emerged. Human activities inflict harsh and oftenirreversible damage on the environment and on the criticalnatural resources. If not checked, many of our current practiceswill put, at serious risk, the future that we wish for humanSociety and the plant and animal kingdom.
Agenda 21 for Natural Resource management
The United Nations Conference on Environment andDevelopment (UNCED) at the earth summit held in Rio-de-Janario, Brazil in 1992 focused attention on the harmful effect of development of the earth’s life sustaining capacity. Theconference also adopted Agenda 21- a global blue print for
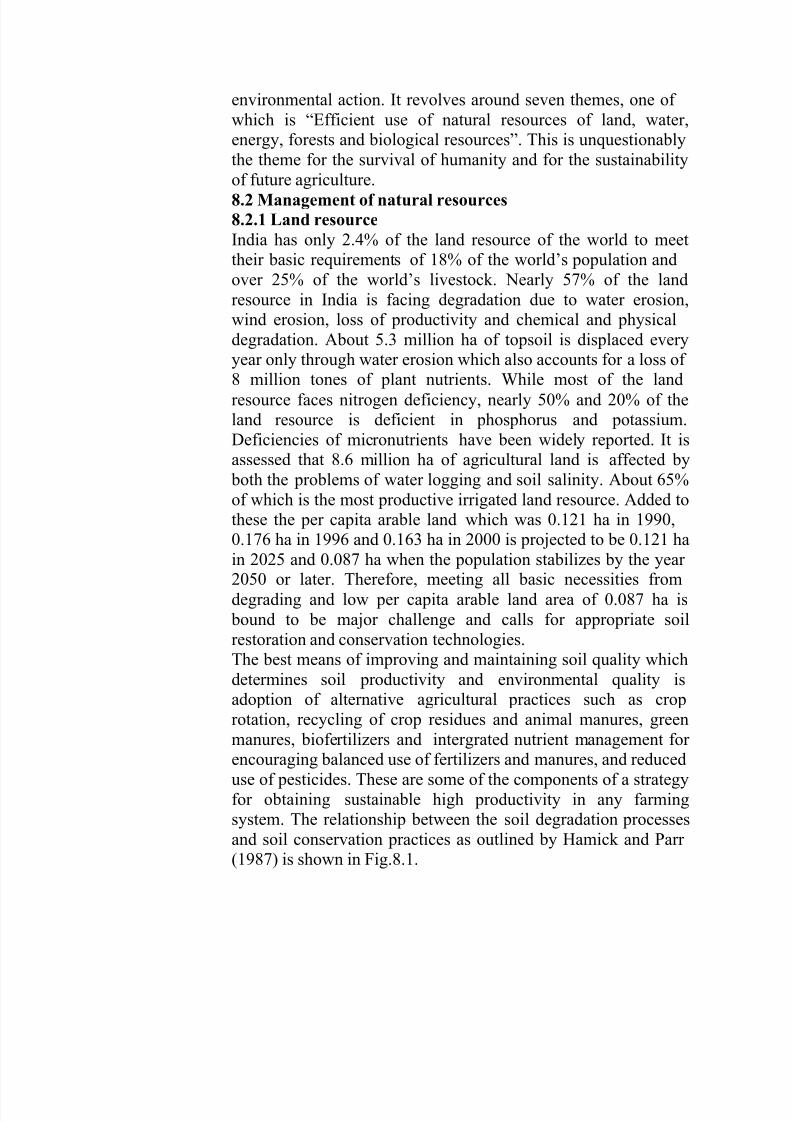
7/30/2019 Farming Systems and Sustainable Agriculture
http://slidepdf.com/reader/full/farming-systems-and-sustainable-agriculture 71/149
environmental action. It revolves around seven themes, one of which is “Efficient use of natural resources of land, water,energy, forests and biological resources”. This is unquestionablythe theme for the survival of humanity and for the sustainabilityof future agriculture.8.2 Management of natural resources
8.2.1 Land resource
India has only 2.4% of the land resource of the world to meettheir basic requirements of 18% of the world’s population andover 25% of the world’s livestock. Nearly 57% of the landresource in India is facing degradation due to water erosion,wind erosion, loss of productivity and chemical and physicaldegradation. About 5.3 million ha of topsoil is displaced everyyear only through water erosion which also accounts for a loss of
8 million tones of plant nutrients. While most of the landresource faces nitrogen deficiency, nearly 50% and 20% of theland resource is deficient in phosphorus and potassium.Deficiencies of micronutrients have been widely reported. It isassessed that 8.6 million ha of agricultural land is affected by
both the problems of water logging and soil salinity. About 65%of which is the most productive irrigated land resource. Added tothese the per capita arable land which was 0.121 ha in 1990,0.176 ha in 1996 and 0.163 ha in 2000 is projected to be 0.121 hain 2025 and 0.087 ha when the population stabilizes by the year 2050 or later. Therefore, meeting all basic necessities fromdegrading and low per capita arable land area of 0.087 ha is
bound to be major challenge and calls for appropriate soilrestoration and conservation technologies.The best means of improving and maintaining soil quality whichdetermines soil productivity and environmental quality isadoption of alternative agricultural practices such as croprotation, recycling of crop residues and animal manures, greenmanures, biofertilizers and intergrated nutrient management for
encouraging balanced use of fertilizers and manures, and reduceduse of pesticides. These are some of the components of a strategyfor obtaining sustainable high productivity in any farmingsystem. The relationship between the soil degradation processesand soil conservation practices as outlined by Hamick and Parr (1987) is shown in Fig.8.1.
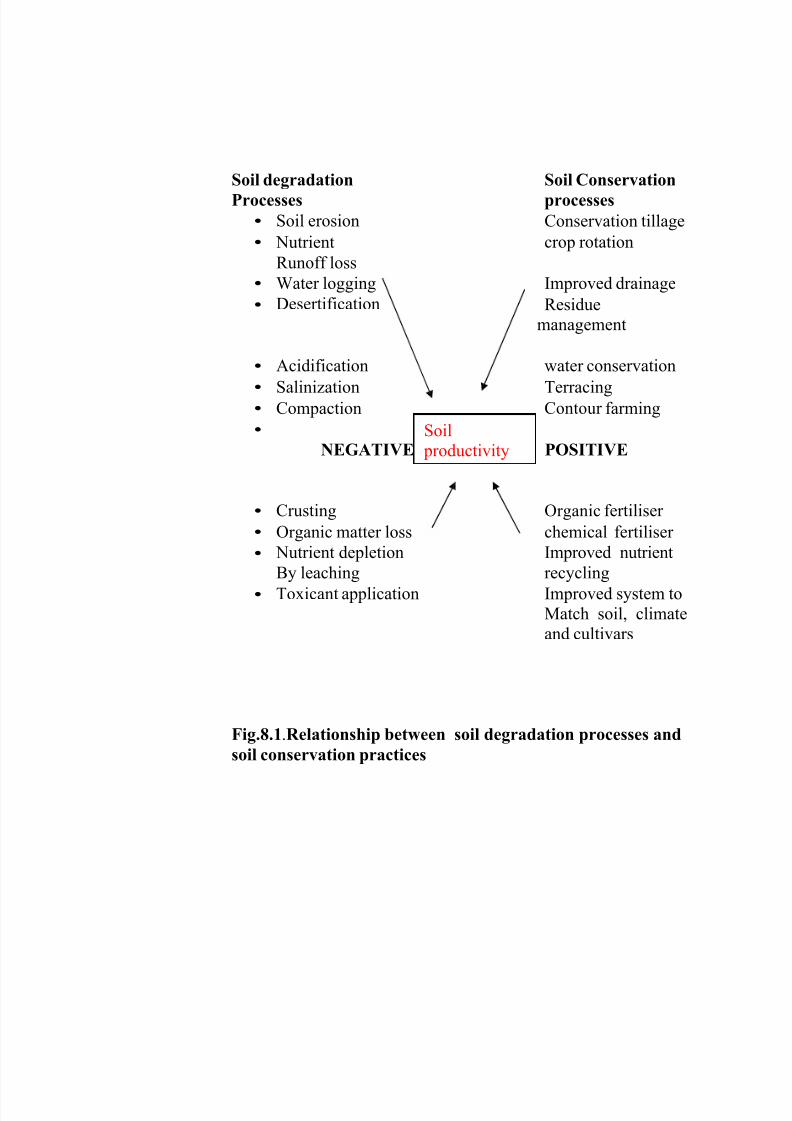
7/30/2019 Farming Systems and Sustainable Agriculture
http://slidepdf.com/reader/full/farming-systems-and-sustainable-agriculture 72/149
Soil degradation
Processes
Soil Conservation
processes
Conservation tillage
crop rotation
•
•
Soil erosion
Nutrient
Runoff loss
Water logging
Desertification
•
•
Improved drainage
Residuemanagement
•
•
•
•
Acidification
Salinization
Compaction
water conservation
Terracing
Contour farming
NEGATIVE POSITIVE
•
•
•
Crusting
Organic matter loss Nutrient depletion
By leachingToxicant application
Organic fertiliser
chemical fertiliser Improved nutrient
recyclingImproved system toMatch soil, climateand cultivars
•
Fig.8.1.Relationship between
soil conservation practices
soil degradation processes and
Soil productivity
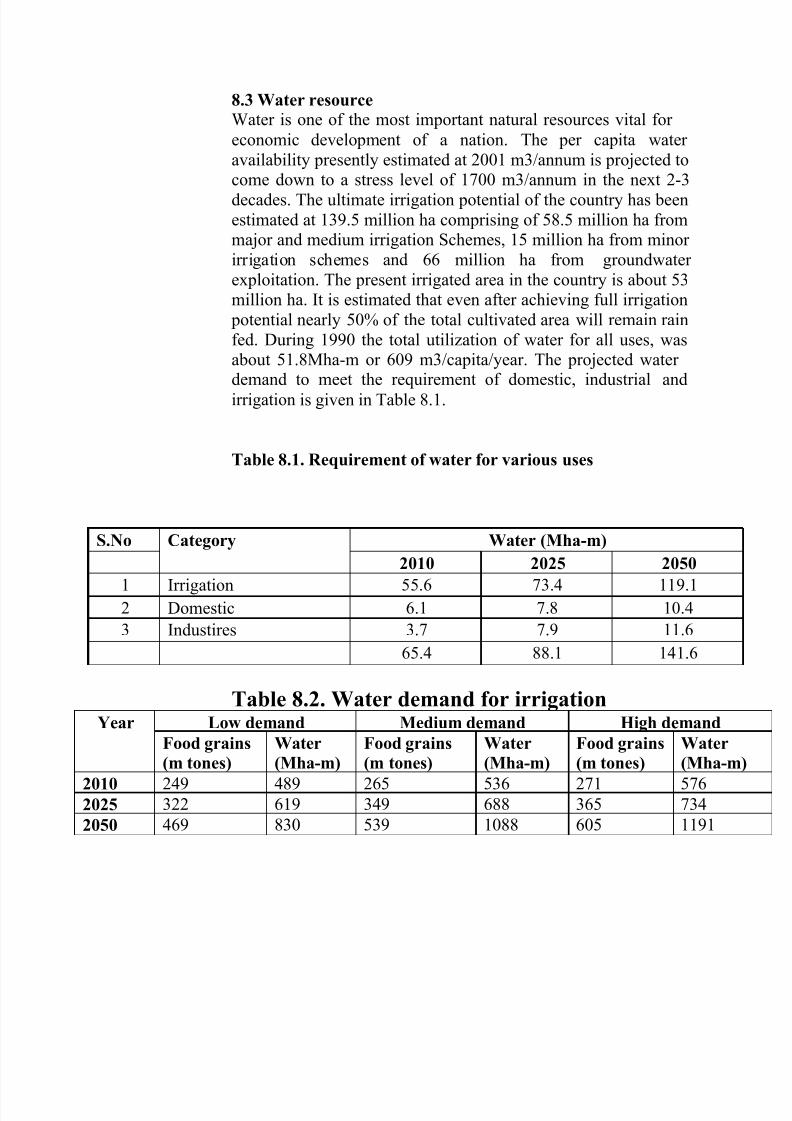
7/30/2019 Farming Systems and Sustainable Agriculture
http://slidepdf.com/reader/full/farming-systems-and-sustainable-agriculture 73/149
8.3 Water resource
Water is one of the most important natural resources vital for economic development of a nation. The per capita water availability presently estimated at 2001 m3/annum is projected tocome down to a stress level of 1700 m3/annum in the next 2-3decades. The ultimate irrigation potential of the country has beenestimated at 139.5 million ha comprising of 58.5 million ha frommajor and medium irrigation Schemes, 15 million ha from minor irrigation schemes and 66 million ha from groundwater exploitation. The present irrigated area in the country is about 53million ha. It is estimated that even after achieving full irrigation
potential nearly 50% of the total cultivated area will remain rainfed. During 1990 the total utilization of water for all uses, wasabout 51.8Mha-m or 609 m3/capita/year. The projected water
demand to meet the requirement of domestic, industrialirrigation is given in Table 8.1.
and
Table 8.1. Requirement of water for various uses
Table 8.2. Water demand for irrigationYear Low demand Medium demand High demand
Food grains
(m tones)
Water
(Mha-m)
Food grains
(m tones)
Water
(Mha-m)
Food grains
(m tones)
Water
(Mha-m2010 249 489 265 536 271 576
2025 322 619 349 688 365 734
2050 469 830 539 1088 605 1191
S.No Category Water (Mha-m)
2010 2025 20501 Irrigation 55.6 73.4 119.1
2 Domestic 6.1 7.8 10.4
3 Industires 3.7 7.9 11.6
65.4 88.1 141.6
7/30/2019 Farming Systems and Sustainable Agriculture
http://slidepdf.com/reader/full/farming-systems-and-sustainable-agriculture 74/149
While the water demand for irrigation to maximize agricultural production with the maximum possible level of irrigation toachieve self sufficiency in food grains is given in Table 8.2.
Thus water is a limiting factor for crop production andscientific water management is the key for sustainableagriculture both irrigated and rain fed farming systems. Growingdemand for fresh water supplies by industry, urban & civic uses,low water use efficiency, prohibitive costs of irrigationdevelopment, from poor water management makes agriculture a
poor competitor for its use. Therefore the available water must be used most efficiently. The efficient use of thiscrop production consists of:i) Water conservation- it involves two steps (a)runoff losses and increasing its infiltration in the
resource for
reduction of soil through
land shaping, tillage mechanical structures and vegetative barriers to reduce water flow, proper crop rotations, applicationof soil amendments and mulching (b) reduction of losses throughdeep drainage (by increasing water storage capacity & soilmoisture retentivity), and direct evaporation from soil (byfollowing shallow tillage, straw mulching).ii) Scheduling of irrigation to crops- the timing and amount of irrigation to crops plays a significant role in optimizing crop
production with a given amount of water and avoiding effects of either over-irrigation or under irrigation on soil environment.Approaches to irrigation scheduling vary depending on situationse.g., water is adequate irrigation water is available on demand tosecure potential yield and where available supplies fall short of the full irrigation water requirement of crops over the entirecommand area.iii) Maximizing the utilization of resource by crop and
maximizing returns per unit resource used by the crop- TheWorld Bank (1999) in a working paper on irrigation sector observed that 25% improvement both in water use efficiency and
crop yields (WUE rising from 35 to 43%) would generate anadditional food grain production of represents an equivalent of 44%
production by the year 2025. This isthe country needs to exploit. The
85 million tones,increase in foodthe latent potential
which
grain
whichICAR experts feel that
irrigation water use from the present level of 40% is possible toincrease to 60% with the adoption of water use efficiency
7/30/2019 Farming Systems and Sustainable Agriculture
http://slidepdf.com/reader/full/farming-systems-and-sustainable-agriculture 75/149
technologies. Using technologies such as sprinkler irrigation anddrip irrigation in commercial and horticultural crops, a WUE of 85 to 95% can be obtained.iv) Conjunctive use of different sources of water for increasingthe returns from available water resources and reducing soil-degrading effect. Conjunctive use of saline water and canal water can be effective in avoiding the deleterious effect of saline water on crops. Judging from the present trends it can be surmised thatwater quality will become most serious constraint in future andagriculture have to use more marginal quality water.v) Participatory irrigation management-Promoting
participatory irrigation management through establishment of Water User’s Associations (WUA). The Government of AndhraPradesh has established 10292 WUA for effective maintenance
of irrigation- systems and use of waters.
For dryland agriculture, increased efficiency of rain-water is
essential and it can be achieved in the following ways:
1.2.3.
Retain precipitation in situ and minimize the run-off,Reduce evaporation in relation to transpiration,Growing drought tolerant crops that match the rainfall
patternRecycle the run-off drainage water for high value cropadopting life saving irrigation approach
4.
5. Watershed approach for maximization of rainwater harvesting and recycling and
6. Ensure farmers’ cooperation by assuring equity indistribution of benefit and maximization of the
profitability of cropping system.
The can be achieved by following practices viz., contour cultivation, bench terracing, strip-cropping and different types
of land configuration: Storage structures viz., farm ponds, lowearthern dams, nala bunds and percolation tanks: Agronomic
practices viz., tillage practices, fallowing, crops and croppingsystems versus water availability periods, mulching,manipulation of plant geometry etc.
7/30/2019 Farming Systems and Sustainable Agriculture
http://slidepdf.com/reader/full/farming-systems-and-sustainable-agriculture 76/149
8.4 Vegetative cover
Vegetation acts as a protective cover to the planet earth.Deforestation and over grazing have been causing tremendoussoil erosion and landslides. At present (2000 A.D.), the per capita forest area in India is around 0.07 ha compared to theworld’s average of about 1 ha. Hardly 4% of the geographicalin India is under pastures and grasslands. With the passingtime the stress on vegetative cover in India is increasing withthe growing demand for food, fodder, fuel and timber. Thequantity of firewood that can be annually removed fromforests on a sustainable basis is only 40 million m3 as againstthe existing demand for firewood in the country is 235 millionm3. Similarly, about 90 cattle units graze in the forest whilethe carrying capacity of forests is estimated only at 31 million
cattle units.Measures to conserve and to improve vegetative cover are
highly essential to restore ecological balance, maintain biological diversity, conserve soil and water, and to preventflood havoc. To increase the vegetation in the country,
plantation practices such as the following are encouraged:
1. Afforestation: establishment of forest by artificialmeans on an area from which forest vegetation hasalways or long been absentReforestation: restocking of felled or otherwisecleared woodlandSocial forestry: adoption of forestry practices by thesociety to meet its common requirements such as fuel,fodder etcAgro forestry: adoption of suitable land use systemsthat maintains or increases total yield by combiningfood crops (annuals) with tree crops (perennials)
2.
3.
4.
These interventions reduce erosivity of rainfall/runoff anderodability of soil through dissipation of rainfall energy bycanopy, surface litter, obstructing overland flow, root bindingand improving physico-chemical conditions, restore ecological
balance and reduce the risk of environmental degradation.
7/30/2019 Farming Systems and Sustainable Agriculture
http://slidepdf.com/reader/full/farming-systems-and-sustainable-agriculture 77/149
Forest (conservation) Act 1980 was enacted with a view tocheck indiscriminate destruction and diversion of forest-lands to
non-forest purposes. The Forest (conservation) Act 1980 wasamended in 1988 to incorporate stricter panel punishments
against violators. Recent scientific thinking is that the pumpedinto atmosphere and to reduce or mitigate the effect of increased
carbon dioxide content.8.5 Energy and Agriculture
Agriculture has evolved as the largest and most importanthuman enterprise, comprising not only production but also
processing, packaging, transport and trade and distribution of food products. Energy is needed in all stages of agriculture fromland preparation, water lifting and pumping to planting and
transplanting, weed control, harvesting, transport and processing.
Sustainable management of the natural resources like land,water, air and biodiversity is the mantra for sustainableAgriculture.The ecological; services provided by nature regulateand sustain the stability of production in natural ecosystems. Thequality and quantity of energy used are transformed andconsumed all of which is vital to food security.
Energy use in agriculture follows two extreme patterns.High external input and highly mechanized factory metal of agriculture of the advanced countries is so times as in energyintensive as traditional agriculture.Very low or nil external input agricultural that is a part of thesubsistence agriculture prevalent in many of the stressedecosystem(LEISA).
A direct relationship exists between energy consumption andagricultural yield. Traditional agriculture systems depend largely
on the metabolic energy of human and animals and solar energy,where as the energy requirement of modern agriculture arealmost completely met from fossil fuels mostly petroleum.
8.5.1 Impact of low e n ergy u s e in A g riculture
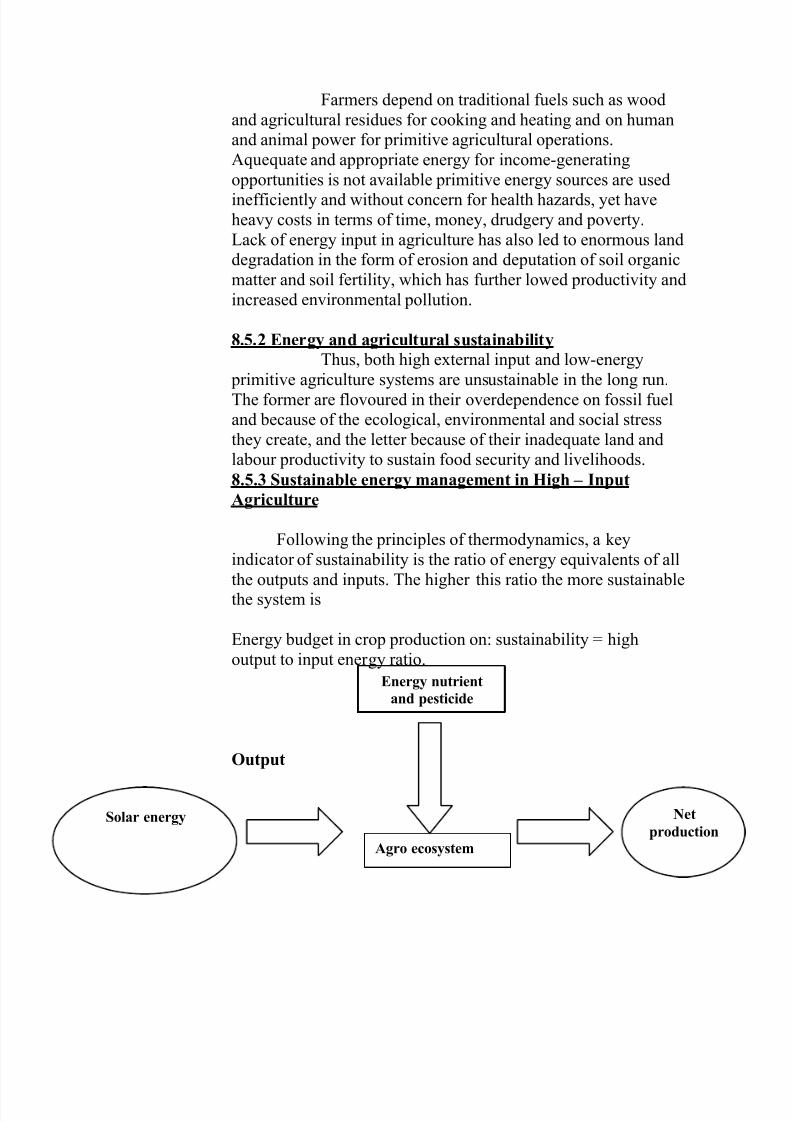
7/30/2019 Farming Systems and Sustainable Agriculture
http://slidepdf.com/reader/full/farming-systems-and-sustainable-agriculture 78/149
Farmers depend on traditional fuels such as woodand agricultural residues for cooking and heating and on humanand animal power for primitive agricultural operations.Aquequate and appropriate energy for income-generatingopportunities is not available primitive energy sources are usedinefficiently and without concern for health hazards, yet haveheavy costs in terms of time, money, drudgery and poverty.Lack of energy input in agriculture has also led to enormous landdegradation in the form of erosion and deputation of soil organicmatter and soil fertility, which has further lowed productivity andincreased environmental pollution.
8.5.2 Energy and agricultural susta inab ility
Thus, both high external input and low-energy
primitive agriculture systems are unsustainable in the long run.The former are flovoured in their overdependence on fossil fueland because of the ecological, environmental and social stressthey create, and the letter because of their inadequate land andlabour productivity to sustain food security and livelihoods.8.5.3 Sustainable energy management in High – Input
Agriculture
Following the principles of thermodynamics, a keyindicator of sustainability is the ratio of energy equivalents of allthe outputs and inputs. The higher this ratio the more sustainablethe system is
Energy budget in crop production on: sustainability = highoutput to input ener gy ratio.
Output
Net
productionSolar energy
Agro ecosystem
Energy nutrient
and pesticide
7/30/2019 Farming Systems and Sustainable Agriculture
http://slidepdf.com/reader/full/farming-systems-and-sustainable-agriculture 79/149
The basic way to improve the sustainability of modernagriculture is to decrease both the direct and embodied externalenergy component by increasing their efficiency of use in all
possible agricultural practices. Maintaining high productivitywith an acceptable impact on resources, environmental andeconomics is the key to sustainability the used non-pollutingalternative sustainability.
A multipronged approach to achieving better energy
efficiency along with resource conservation environmental safetyand economic prudence has been adopted in the post decadethrough technologies that are holistic and make integrated use of natural ecological processes and external inputs. Conservationtillage, integrated pest management, integrated plant nutrientsupply, crop rotation, micro irrigation techniques and precisionagriculture belong to this category.
Conservation tillage practices were initially introduced toreduce the cost of mechanization but have turned out to offer several ecological and economic benefits such as low soilerosion, reduced runoff, more natural pest control, greater water storage and infiltration, increased cropping intensity and savingson inputs. Conservation tillage has become very popular wherefarms are large.
Similarly managing water more efficiently using drip andsprinkler irrigation and using mulching to improve water storageand reduce ET are simple ways of improving the productivity of
water, which is likely to be the most limiting resource for agriculture in the future.
These practices not only result in energy savings but alsoattract other bonuses such as lower nutrient loss, higher efficiency of input use, and freedom from waterlogging &salinization. IPM combines several virtues, including cost
7/30/2019 Farming Systems and Sustainable Agriculture
http://slidepdf.com/reader/full/farming-systems-and-sustainable-agriculture 80/149
reduction, environmental and human safety, prevention of pesticide resistance and post resurgence, with a favourableenergy balance.
Biodiversity enhancement through polyculture, croprotation, mixed cropping and strip cropping has been shown tohave a variety of positive effects such as conservation. Efficiencyof use of nutrients and water, erosion control, biological pest anddisease control and improvement of soil quality. Integratedtechnologies are the best way to balance all factors related to thesustainability, stability and productivity of agro ecosystems.
8.5.4 Bio mass energy
Biomass is stored energy that is not subject to seasonalvagaries, it can produce all forms of energy, such as heat,electricity, gas and liquid fuel. These can be harnessed to createsmall and big industries in rural areas to employment and also toincrease the profitability of the agricultural sector.
8.5.5 Other ren e w a b le sources of energy
Solar energy, wind energy, biomass energy and hydro andgeothermal tidal energies are being evolved as potential forms of renewable energy. They are non-polluting, non-emission sourcesand are suitable for small to medium-scale operations, especiallyin rural and remote areas.
Solar, wind and bio energy are particularly useful in ruralareas because of this local availability, adaptability to dispersalsmall and medium scale energy requirements, reliability andenvironmental safety.
Solar energy is the second fastest growing source of energy.
Wind energy is one of the fastest growing forms of alternative energy.Conclusion
Energy has been identified as the second most criticalfactor, next only to water, for sustainable development. Attentionto the quantity and quality of energy and the efficiency of its usein agriculture is crucial for sustainability.
7/30/2019 Farming Systems and Sustainable Agriculture
http://slidepdf.com/reader/full/farming-systems-and-sustainable-agriculture 81/149
Energy overuse leaves dirty ecological foot prints whereasenergy poverty creates serious impediments to food security,livelihoods and human development.
Energy poor systems require energy infusion, preferablyof renewable kind such as solar, wind and biomass energy.
Exploiting the food-energy nesses by convertingagricultural by-products to heat or other forms of energy cancreate livelihood opportunities in the form of small commercialenterprises and also mitigate climate change, as biomass is acarbon-natural resource.
***
7/30/2019 Farming Systems and Sustainable Agriculture
http://slidepdf.com/reader/full/farming-systems-and-sustainable-agriculture 82/149
Lecture.9
CONJUNCTIVE USE OF WATER 9.1 Definition
The term “Conjunctive use “of water resource implies the
coordinatedefficiency of use of water
and harmonious development for increasedwater from different resources. Thus Conjunctiveresource can be defined as “ the management of
multiple water resources in a coordinated operation such that, thewater yield of the system over a period of time exceeds, the sumof yields of the individual components of the system, resultingfrom in-coordinated operation”.
It is not mutely providing groundwater supply anddistribution system as a back up for a surface water system or vice versa, rather it is a concept in which one system
for thecomplements and supplements the other to compensateinadequacies of both “.
It is integrated management of both surface and groundwater components in order to make best use of the complementary potential of each and to optimize the use of water resources.
9.2 Objectives
1. Mitigating the effect of shortages in canal water
supplyIncreasing the dependability of existing water supplyAlleviating the problem of high water table andsalinityFacilitating the use of high salinity ground water Mitigating the damages due to droughtIncreasing the efficiency of surface water system
2.
3.
4.5.6.
9.3 Systems of conjunctive use
Abrol et al. (1988) listed the following systems of conjunctiveuse:
1.2.3.
Canal water and ground water systemRainfall and irrigation water systemSaline water and fresh water system
7/30/2019 Farming Systems and Sustainable Agriculture
http://slidepdf.com/reader/full/farming-systems-and-sustainable-agriculture 83/149
9.4 Advantages
1. Use of ground water helps reduce peak demands for irrigation, size of canals, and hence construction costsSupplemental supplies from groundwater ensure proper irrigation scheduling raising multiple crops and earlysowing even if rainfall is delayedIncreased water resources ensure supply to tail end areasof higher elevation.Ground water exploitation lowers the water table andreduces danger of water logging and consequent wastageof water for leaching of soilsSurface and subsurface out flows are minimized causingreduction in peak run off and flood discharge
2.
3.
4.
5.
6. Conjunctive use when integrated with an artificialrecharge project the need for lining of canals is reduced asseepage from canals recharges ground water
7. During periods of peak water demand irrigationrequirement can be met by surface water sources, so power saved can be diverted to other sectorsConjunctive use is an attractive benefit considering thedifficult political and environmental challenges facingmany surface water storage projects
8.
9.5 Constraints
1. Possibility of deterioration in ground-water quality due toinflux of salts leached down from the soil which may bequite marked as a result of recycling within cones of depressions and / or upward and lateral migration of salinewater intro fresh water zones in response to pumping.
2. Increased power consumption to sustain pump age fromwells. Possible dislocation of groundwater supplies due to
power failure in critical periods, and decrease in pump
efficiencies supplies due large fluctuations in water levels.Operation, supervision and control of conjunctive use andartificial recharge projects are more complexAdministrative difficulties in evolving acceptable andequitable water rates, providing motivation and incentivesto accept groundwater use when surface water is available
3.
4.

7/30/2019 Farming Systems and Sustainable Agriculture
http://slidepdf.com/reader/full/farming-systems-and-sustainable-agriculture 84/149
(Aquifer storage and Recovery (ASR) is a form of conjunctive use where excess water is stored under ground is a suitable aquifer later as needed).
***
7/30/2019 Farming Systems and Sustainable Agriculture
http://slidepdf.com/reader/full/farming-systems-and-sustainable-agriculture 85/149
Lecture No.10
WASTELANDS AND THEIR
MANAGTEMENT
10.1 Definition
Wasteland is defined as “degraded land which can be brought under vegetative cover with reasonable effort, and whichis currently under utilized and land which is deteriorating for lack of appropriate water and soil management or on account of natural causes. Wastelands can result from inherent/imposeddisabilities such as by location, environment, chemical and
physical properties of the soil or financial or managementconstraints”.
10.2 Classification of Wastelands
Confronted by various estimates by different agenciesincluding data thrown up by latest technological tools likeRemote Sensing, it become evident that a precise definition of wastelands of various categories is required. Therefore, atechnical Task force Group was constituted by planningCommission(NWDB) toclassification
and National Wasteland Development Boardarrive at precise definition of categories. Thesystem developed by the Technical Task Force
Group and subsequently slightly modified into 13 categories of wastelands are as follows:
1.2.3.4.5.6.
7.8.9.
Gullied and /or Ravinous landLand with or without scrubWaterlogged and marshy landLand affected by salinity/alkalinity-Coastal or inlandShifting cultivation areaUnderutilized / degraded notified forest land
Degraded pastures/grazing landDegraded land under plantation cropsSands-Desertic/coastal
10.Mining/ industrial wastelands11.Barren rocky/ stony waste/sheet rock area12.Steep sloping area13.Snow covered and/ or glacial area
7/30/2019 Farming Systems and Sustainable Agriculture
http://slidepdf.com/reader/full/farming-systems-and-sustainable-agriculture 86/149
10.3 Need for development of wastelands
India is the seventh largest and the second most populouscountry in the world with unique physical landscape has resultedin different types of land which are subjected to different typesof land which are subjected to different types of utilization. Dueto increasing pressure of population, there is an excessivedemand of more land both for agricultural and non-agriculturaluse. This has resulted in uncontrolled exploitation of landresources resulting in vast stretches of wastelands such asdegraded land, soil salinity, waterlogging, desertification, soilerosion etc., and also led to decrease in per capita availability of cultivable land besides ecological imbalances. Keeping this inview, the then Prime Minister of India said, “Continuing
deforestation has brought us to face all the major ecological andsocio-economic crises. The trend must be halted. Hence, he
proposed to set up a National Wasteland Development Boardwith the objective of bringing 5 million ha of land every year under fuel wood and fodder plantations. This has resulted in theformation of NWDB in 1985.
10.4 Distribution of Wastelands
10.4.1 India
The total wastelands area in districts (584) in India isestimated at 6.38518.31 Km2
accounting for 20.17% of thegeographical area (Table 10.1). The very high percentage of areaunder wasteland in Jammu an Kashimr (64.55%), HimachalPradesh (56.87%) are due to snow cover and degraded forest;
Nagaland(50.69%), Assam (25.52%), Manipur (58%),Meghalaya (44.16), Mizoram (19.31%) are due to shiftingcultivation; Sikkim (50.30%) is due to degraded forest and inRajasthan (30.87%) die to sandy area. Among all the statesKerala has a minimum 2.73% and Jammu and Kashmir has a
maximum 64.55% of area under wastelands. The category-wisedistribution of wastelands shows that highest percentage (6.13%)
belongs to the category land “with or without scrub” followed by “under utilized forestland” (4.44%) (Table 10.2). Theformer is mainly distributed in the southern states of Indiawhereas the later is distributed throughout the country.
7/30/2019 Farming Systems and Sustainable Agriculture
http://slidepdf.com/reader/full/farming-systems-and-sustainable-agriculture 87/149
10.4.2 Andhra Pradesh
The total wastelands area in the Andhra Pradesh state isestimated at 51750.19 Km
2accounting for 18.81% of the
geographical area (Table 10.3). The very high percentage o
wastelands area (38.76%) is in Chittoor district closely followed by Nellore (37.61%), while the lowest is in Hyderabad (0.0%) belongs category wise distribution of lands shows that highes
ercenta e 8.08% belon s to “de raded notified forest land”followed by(Table10.4).
“land with or without scrub” (7.36%)
10.5 Regeneration of wastelands
Regeneration of wastelands involves the following aspects:
•
•
•
•
Pasture development for fodder supply and erosion control
Tree plantation for fuel and timber purpose
Social forestry for labour employment
Silve-pastroal programme for purposes
fodder, fuel, timber
•
•
•
Agri-horticulturesystem for income generation
Medicinal and Aromatic plants for revenue generation
Grasslands and fish farming in low lying areas
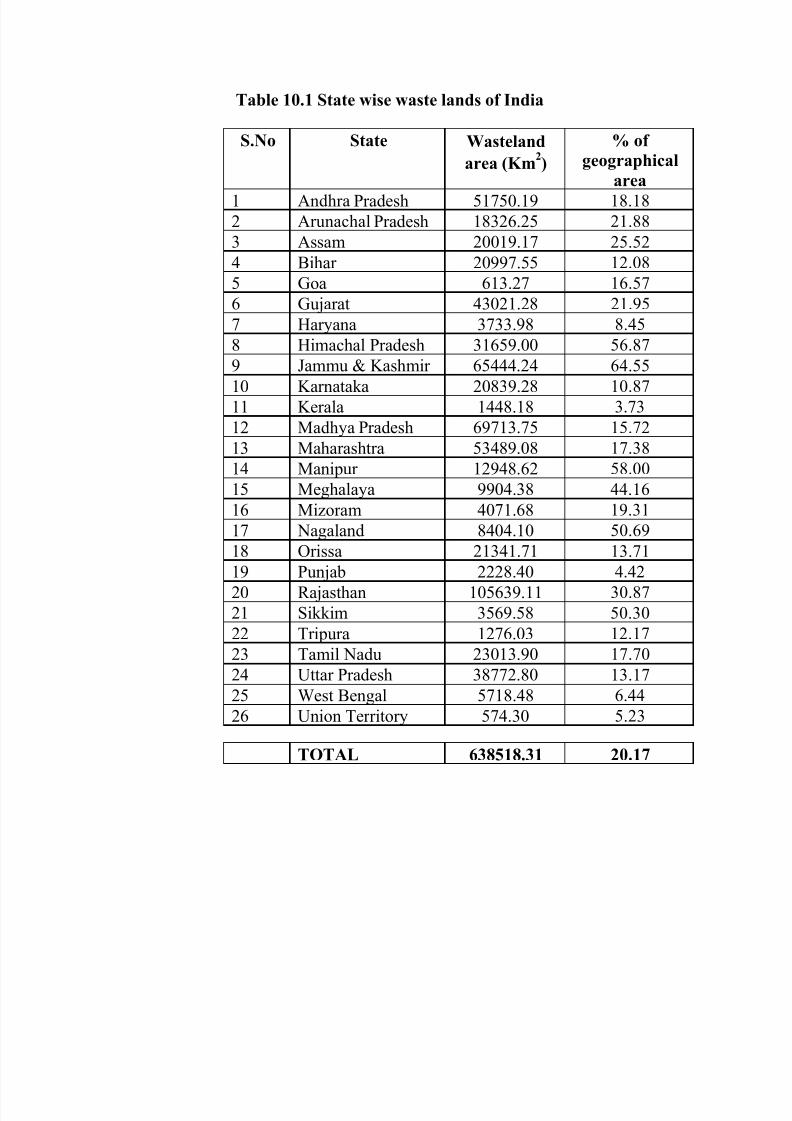
7/30/2019 Farming Systems and Sustainable Agriculture
http://slidepdf.com/reader/full/farming-systems-and-sustainable-agriculture 88/149
Table 10.1 State wise waste lands of India
area
TOTAL 638518.31 20.17
S.No State Wasteland
area (Km2)
% of
geographical
1 Andhra Pradesh 51750.19 18.18
2 Arunachal Pradesh 18326.25 21.88
3 Assam 20019.17 25.52
4 Bihar 20997.55 12.08
5 Goa 613.27 16.57
6 Gujarat 43021.28 21.95
7 Haryana 3733.98 8.45
8 Himachal Pradesh 31659.00 56.87
9 Jammu & Kashmir 65444.24 64.55
10 Karnataka 20839.28 10.87
11 Kerala 1448.18 3.73
12 Madhya Pradesh 69713.75 15.72
13 Maharashtra 53489.08 17.38
14 Manipur 12948.62 58.00
15 Meghalaya 9904.38 44.16
16 Mizoram 4071.68 19.31
17 Nagaland 8404.10 50.69
18 Orissa 21341.71 13.71
19 Punjab 2228.40 4.4220 Rajasthan 105639.11 30.87
21 Sikkim 3569.58 50.30
22 Tripura 1276.03 12.17
23 Tamil Nadu 23013.90 17.70
24 Uttar Pradesh 38772.80 13.17
25 West Bengal 5718.48 6.44
26 Union Territory 574.30 5.23
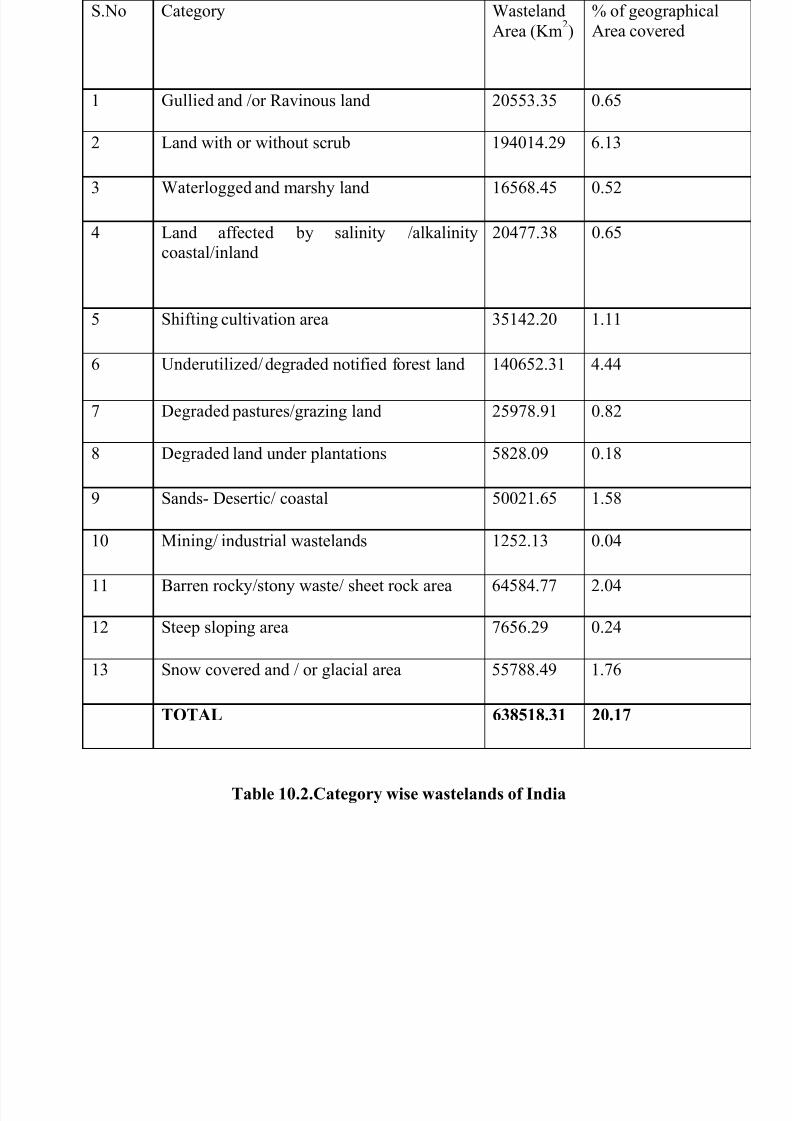
7/30/2019 Farming Systems and Sustainable Agriculture
http://slidepdf.com/reader/full/farming-systems-and-sustainable-agriculture 89/149
Area covered
Table 10.2.Category wise wastelands of India
S.No Category WastelandArea (Km
2)
% of geographical
1 Gullied and /or Ravinous land 20553.35 0.65
2 Land with or without scrub 194014.29 6.13
3 Waterlogged and marshy land 16568.45 0.52
4 Land affected by salinity /alkalinitycoastal/inland
20477.38 0.65
5 Shifting cultivation area 35142.20 1.11
6 Underutilized/degraded notified forest land 140652.31 4.44
7 Degraded pastures/grazing land 25978.91 0.82
8 Degraded land under plantations 5828.09 0.18
9 Sands- Desertic/ coastal 50021.65 1.58
10 Mining/ industrial wastelands 1252.13 0.04
11 Barren rocky/stony waste/ sheet rock area 64584.77 2.04
12 Steep sloping area 7656.29 0.24
13 Snow covered and / or glacial area 55788.49 1.76
TOTAL 638518.31 20.17
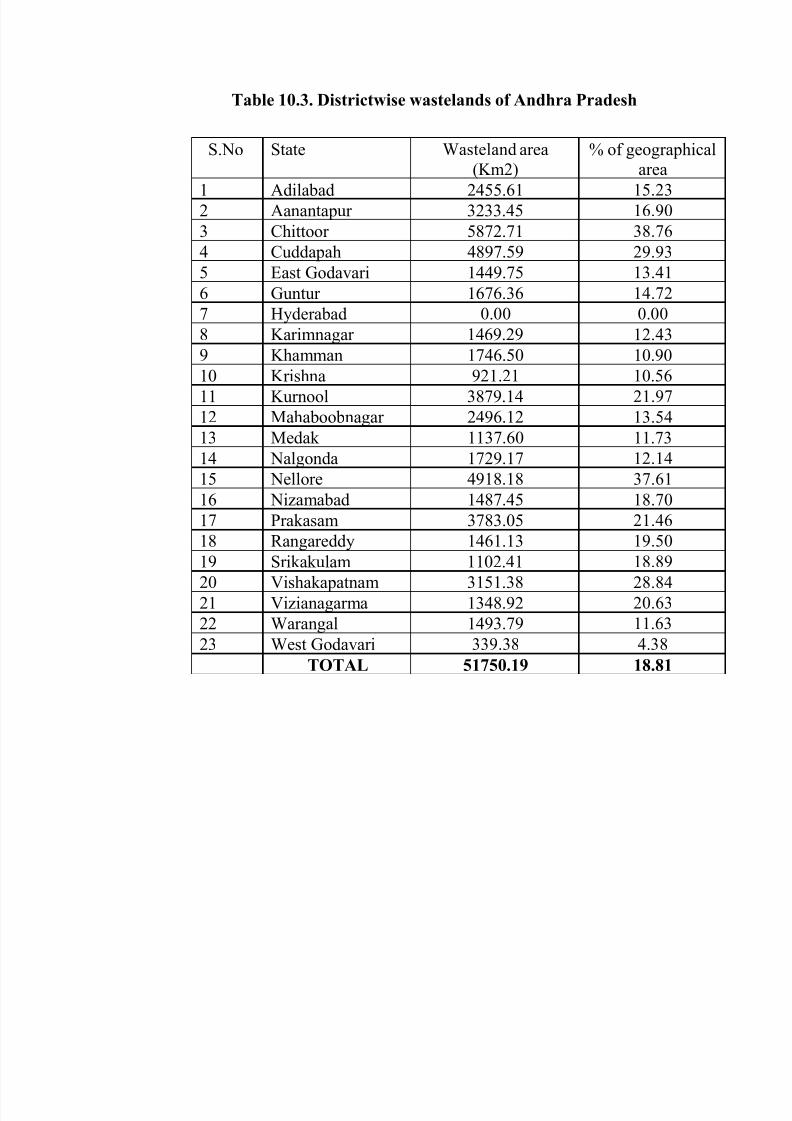
7/30/2019 Farming Systems and Sustainable Agriculture
http://slidepdf.com/reader/full/farming-systems-and-sustainable-agriculture 90/149
Table 10.3. Districtwise wastelands of Andhra Pradesh
S.No State Wasteland area(Km2)
% of geographicalarea
1 Adilabad 2455.61 15.232 Aanantapur 3233.45 16.90
3 Chittoor 5872.71 38.76
4 Cuddapah 4897.59 29.93
5 East Godavari 1449.75 13.41
6 Guntur 1676.36 14.72
7 Hyderabad 0.00 0.00
8 Karimnagar 1469.29 12.43
9 Khamman 1746.50 10.90
10 Krishna 921.21 10.5611 Kurnool 3879.14 21.97
12 Mahaboobnagar 2496.12 13.54
13 Medak 1137.60 11.73
14 Nalgonda 1729.17 12.14
15 Nellore 4918.18 37.61
16 Nizamabad 1487.45 18.70
17 Prakasam 3783.05 21.46
18 Rangareddy 1461.13 19.50
19 Srikakulam 1102.41 18.8920 Vishakapatnam 3151.38 28.84
21 Vizianagarma 1348.92 20.63
22 Warangal 1493.79 11.63
23 West Godavari 339.38 4.38
TOTAL 51750.19 18.81
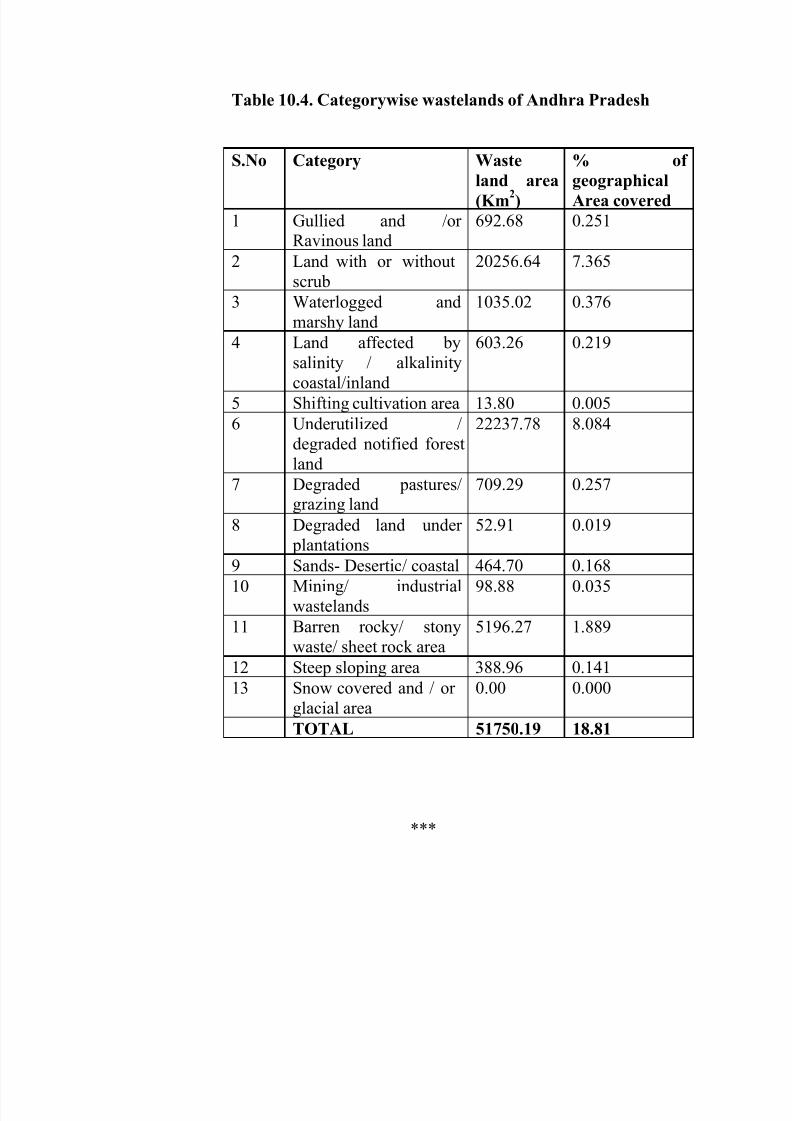
7/30/2019 Farming Systems and Sustainable Agriculture
http://slidepdf.com/reader/full/farming-systems-and-sustainable-agriculture 91/149
Table 10.4. Categorywise wastelands of Andhra Pradesh
Area covered
***
S.No Category Waste
land area(Km2)
% of
geographical
1 Gullied and /or Ravinous land
692.68 0.251
2 Land with or withoutscrub
20256.64 7.365
3 Waterlogged andmarshy land
1035.02 0.376
4 Land affected bysalinity / alkalinity
coastal/inland
603.26 0.219
5 Shifting cultivation area 13.80 0.005
6 Underutilized /degraded notified forestland
22237.78 8.084
7 Degraded pastures/grazing land
709.29 0.257
8 Degraded land under plantations
52.91 0.019
9 Sands- Desertic/ coastal 464.70 0.16810 Mining/ industrial
wastelands98.88 0.035
11 Barren rocky/ stonywaste/ sheet rock area
5196.27 1.889
12 Steep sloping area 388.96 0.141
13 Snow covered and / or glacial area
0.00 0.000
TOTAL 51750.19 18.81
7/30/2019 Farming Systems and Sustainable Agriculture
http://slidepdf.com/reader/full/farming-systems-and-sustainable-agriculture 92/149
Lecture No.11
ORGANIC FARMING11.1 Definition
Organic farming “is a production system which avoids or largely
excludes the use of synthetically compounded fertilizers, pesticides, growth regulators, and livestock feed additives. Tothe maximum extent feasible, organic agriculture systems relyupon crop rotations, crop residues, animal manure, legumes,green manure, off-farm organic wastes, mechanical cultivation,mineral bearing rocks, and aspects of biological pest control tomaintain soil productivity, tilth, to supply plant nutrients, and tocontrol insects, weeds, and other pests”. (USDA,1980).
The concept of the soil as a living system which must be
“fed” in a way that does not restrict the activities of beneficialorganisms necessary for recycling nutrients and producinghumus is central to this definition.
“Organic agriculture is a holistic production management systemwhich promotes and enhances agro-ecosystem health, including
bio-diversity, biological cycles and soil biological activity. Itemphasizes the use of management practices in preference to theuse of off-farm inputs, taking into account that regionalconditions require locally adapted systems. This is accomplished
by using wherever possible, agronomic, biological, andmechanical methods, as opposed to using synthetic materials, tofulfill any specific function within the system”(Codex, 1999).
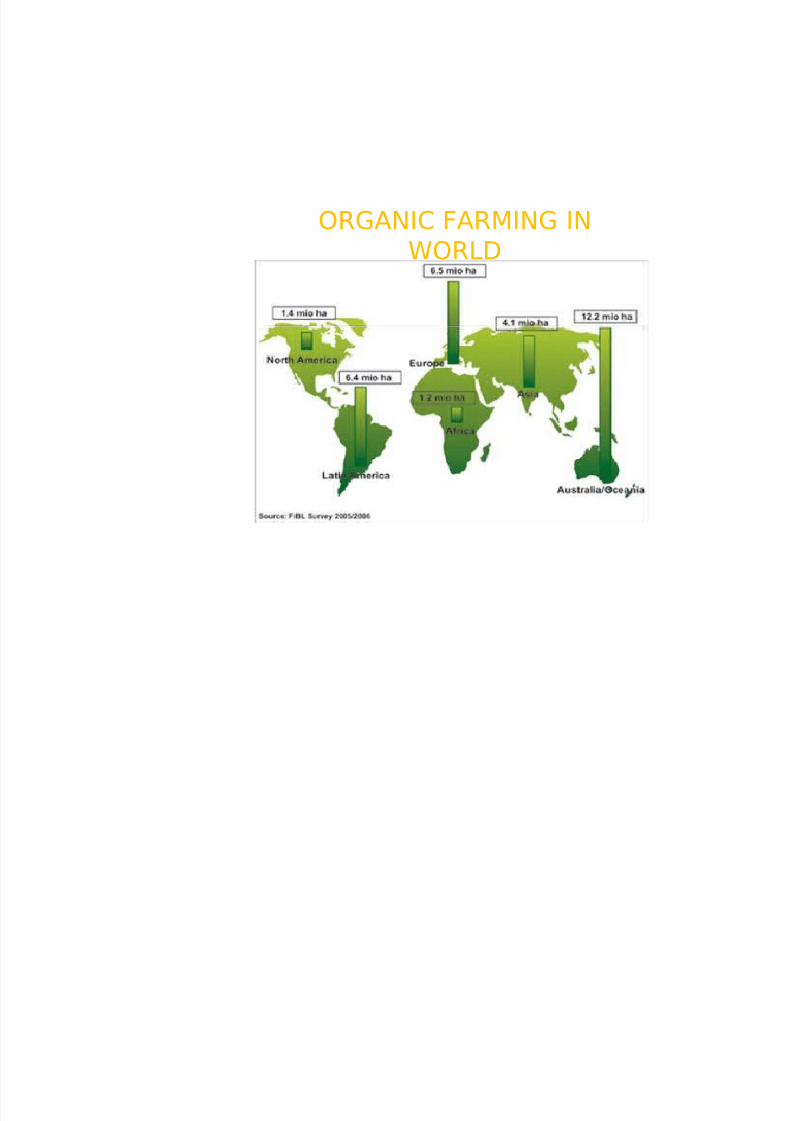
7/30/2019 Farming Systems and Sustainable Agriculture
http://slidepdf.com/reader/full/farming-systems-and-sustainable-agriculture 93/149
ORGANIC FARMING IN
WORLD
7/30/2019 Farming Systems and Sustainable Agriculture
http://slidepdf.com/reader/full/farming-systems-and-sustainable-agriculture 94/149
11.2 Principles of organic farming
1. To produce food of high nutritional quality in sufficientquantityTo interact in a constructive and life enhancing way withall natural systems and cyclesTo encourage and biological cycles with in the farmingsystem, involving micro-organisms, soil flora and fauna,
plants and animals and careful mechanical interventionTo maintain and increase long-term fertility of soilsTo promote the healthy use and proper care of water,water resources and all life thereinTo help in the conservation of soil and water To use, as far as is possible, renewable resources in locally
organized agricultural systemsTo work, as far as possible, within a closed system withregard to organic matter and nutrient elementsTo work, as far as possible, with materials and substanceswhich can be reused or recycled, either on the farm or elsewhere
2.
3.
4.5.
6.7.
8.
9.
10.To give all livestock conditions of life which allow themto perform the basic aspects of their innate behavior
11.To maintain all forms of pollution that may result fromagricultural practices
12.To maintain the genetic diversity of the production systemand its surroundings including the protection of wild lifehabitats
13.To allow everyone involved in organic production and processing a quality of life confirming to the UN HumanRights Charter, to cover their basic needs and obtain anadequate return and satisfaction from their work, includinga safe working environment
14.To consider the wider social and ecological impact of the
farming system15.To produce non-food products from renewable resources,
which are fully degradable16. Weed, disease and pest control relaying primarily on crop
rotation, natural predators, diversity, organic manuring,resistant varieties, and limited (preferably minimal)thermal, biological and chemical intervention
7/30/2019 Farming Systems and Sustainable Agriculture
http://slidepdf.com/reader/full/farming-systems-and-sustainable-agriculture 95/149
17.To create harmonious balance between crop productionand animal husbandry
18.To encourage organic agriculture associations to functionalong democratic lines and the principle of division of
powers19.To progress towards an entire production, processing and
distribution chain which is both socially just andecologically responsible
11.3 Relevance of organic farming
Interest in organic agricultural methods is growing,especially in areas where the present modern farming system hasunleashed many agro-ecological and environmental problems
both on and off the farm, which threaten food security. The
following are some examples:a)
b)Degradation of soil quality (structured & fertility)Pollution of soil, water and food with pesticides andnitratesHealth effects on farmers, farm workers, farm families,rural communities (apart from concerns about the non-intended effects of pesticides on human beings in general,sound use of pesticides requires a technical knowledgewhich is often lacking in developing countries)Resistance of pests to pesticidesDependence on off-farm agricultural inputs which canincrease poor farmers’ dependence on credit facilities (to
purchase synthetic fertilizers, pesticides and seed), whichmay result in decreased local food security and self-reliance
c)
d)e)
Further consumer awareness of the environmental costs of agriculture is increasing. The awareness of quality and health is often promoted by
groups, especially in developed countries.
environmentalenvironmental
The resultingdemand for organic products creates the opportunity to sellorganic products at premium prices, enabling organic farmersto continue, and often expand. Some governments have begunto recognize the possibility that it may be cheaper to supportorganic agriculture than to rectify problems associated withcertain resource- destruction production practices. For this
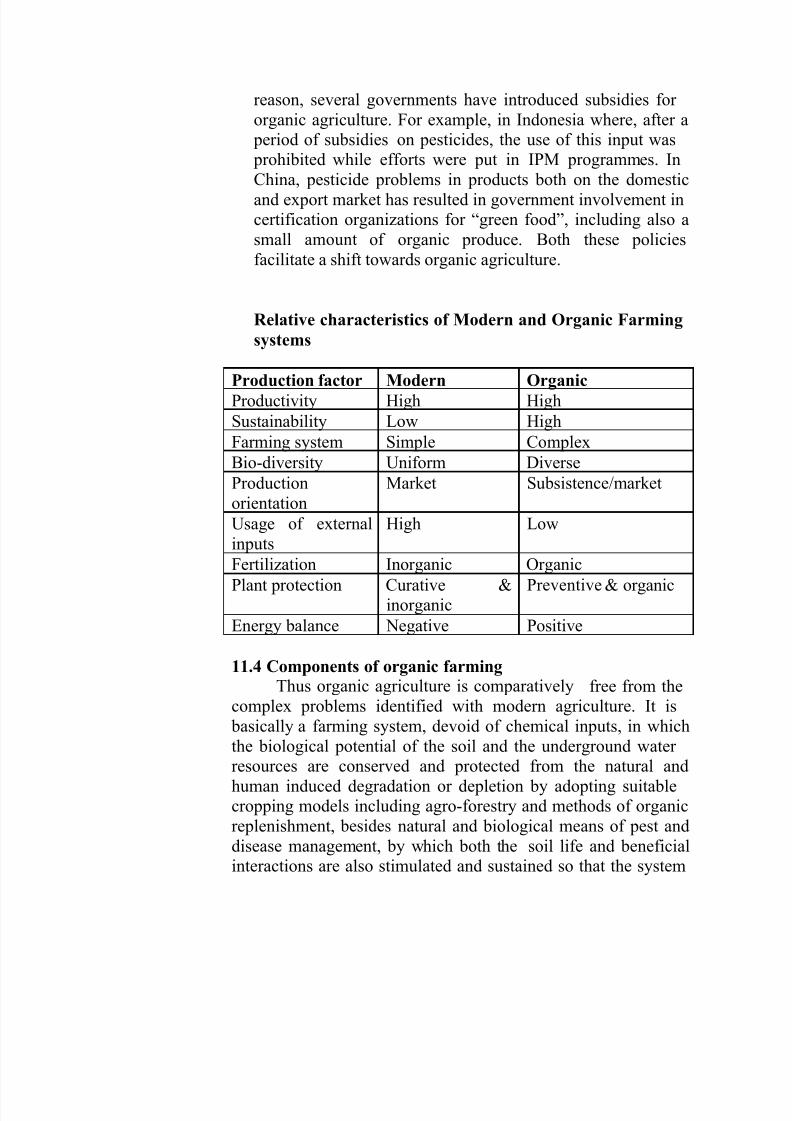
7/30/2019 Farming Systems and Sustainable Agriculture
http://slidepdf.com/reader/full/farming-systems-and-sustainable-agriculture 96/149
reason, several governments have introduced subsidies for organic agriculture. For example, in Indonesia where, after a
period of subsidies on pesticides, the use of this input was prohibited while efforts were put in IPM programmes. InChina, pesticide problems in products both on the domesticand export market has resulted in government involvement incertification organizations for “green food”, including also asmall amount of organic produce. Both these policiesfacilitate a shift towards organic agriculture.
Relative characteristics of Modern and Organic Farming
systems
11.4 Components of organic farming
Thus organic agriculture is comparatively free from thecomplex problems identified with modern agriculture. It is
basically a farming system, devoid of chemical inputs, in whichthe biological potential of the soil and the underground water resources are conserved and protected from the natural andhuman induced degradation or depletion by adopting suitablecropping models including agro-forestry and methods of organicreplenishment, besides natural and biological means of pest anddisease management, by which both the soil life and beneficialinteractions are also stimulated and sustained so that the system
Production factor Modern OrganicProductivity High High
Sustainability Low High
Farming system Simple Complex
Bio-diversity Uniform Diverse
Productionorientation
Market Subsistence/market
Usage of externalinputs
High Low
Fertilization Inorganic OrganicPlant protection Curative &
inorganicPreventive& organic
Energy balance Negative Positive
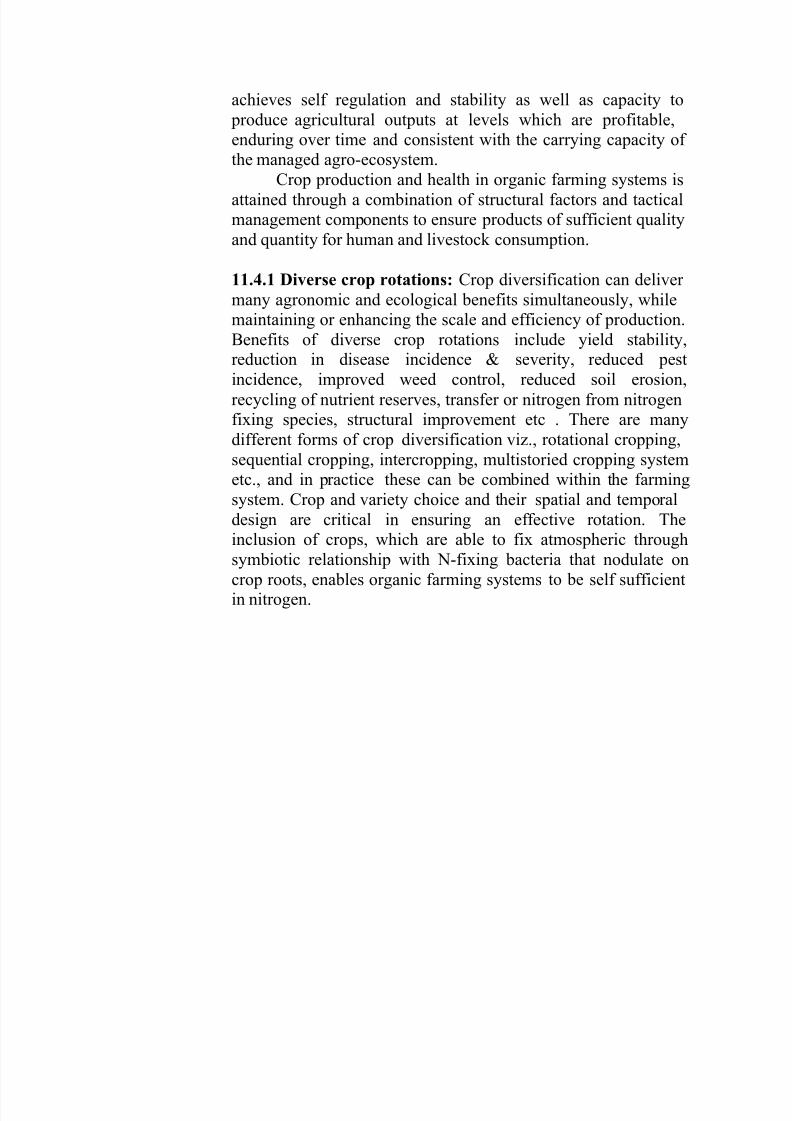
7/30/2019 Farming Systems and Sustainable Agriculture
http://slidepdf.com/reader/full/farming-systems-and-sustainable-agriculture 97/149
achieves self regulation and stability as well as capacity to produce agricultural outputs at levels which are profitable,enduring over time and consistent with the carrying capacity of the managed agro-ecosystem.
Crop production and health in organic farming systems isattained through a combination of structural factors and tacticalmanagement components to ensure products of sufficient qualityand quantity for human and livestock consumption.
11.4.1 Diverse crop rotations: Crop diversification can deliver many agronomic and ecological benefits simultaneously, whilemaintaining or enhancing the scale and efficiency of production.Benefits of diverse crop rotationsreduction in disease incidence &
include yield stability,severity, reduced pest
incidence, improved weed control, reduced soil erosion,recycling of nutrient reserves, transfer or nitrogen from nitrogenfixing species, structural improvement etc . There are manydifferent forms of crop diversification viz., rotational cropping,sequential cropping, intercropping, multistoried cropping systemetc., and in practice these can be combined within the farmingsystem. Crop and variety choice and their spatial and temporaldesign are critical in ensuring an effective rotation. Theinclusion of crops, which are able to fix atmospheric throughsymbiotic relationship with N-fixing bacteria that nodulate oncrop roots, enables organic farming systems to be self sufficientin nitrogen.
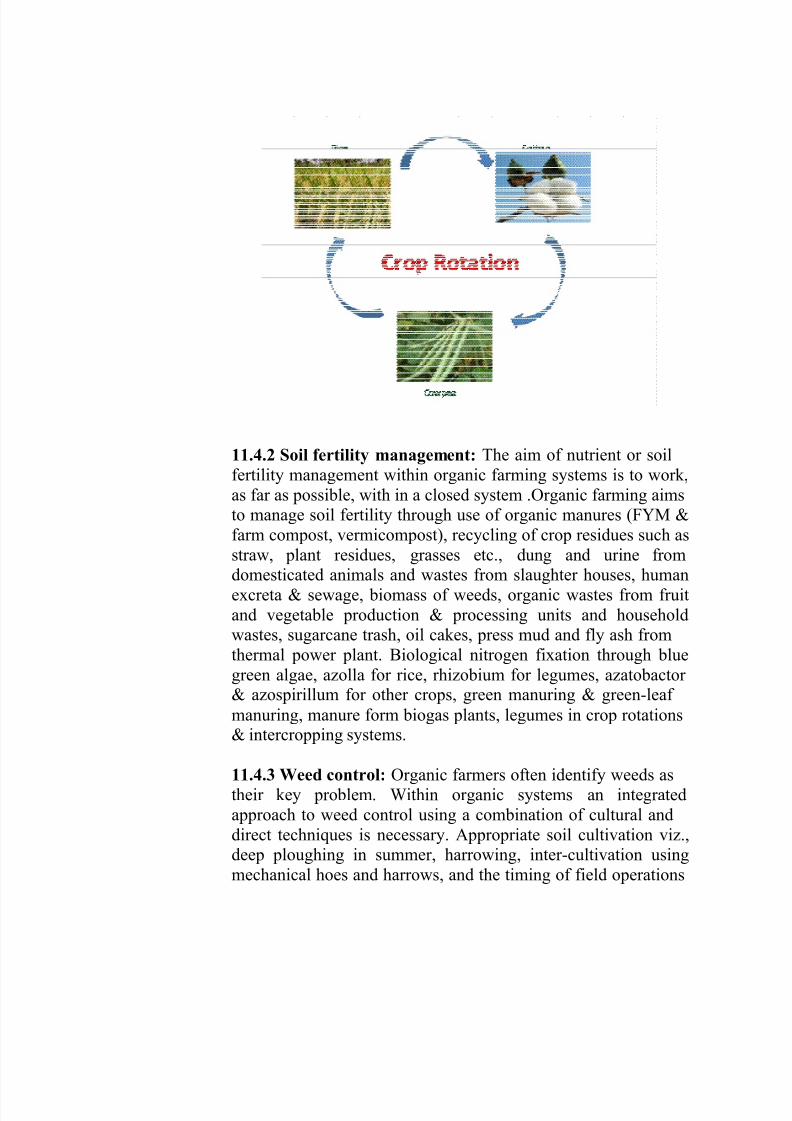
7/30/2019 Farming Systems and Sustainable Agriculture
http://slidepdf.com/reader/full/farming-systems-and-sustainable-agriculture 98/149
11.4.2 Soil fertility management: The aim of nutrient or soilfertility management within organic farming systems is to work,as far as possible, with in a closed system .Organic farming aimsto manage soil fertility through use of organic manures (FYM &farm compost, vermicompost), recycling of crop residues such asstraw, plant residues, grasses etc., dung and urine from
domesticated animals and wastes from slaughter houses, humanexcreta & sewage, biomass of weeds, organic wastes from fruitand vegetable production & processing units and householdwastes, sugarcane trash, oil cakes, press mud and fly ash fromthermal power plant. Biological nitrogen fixation through bluegreen algae, azolla for rice, rhizobium for legumes, azatobactor & azospirillum for other crops, green manuring & green-leaf manuring, manure form biogas plants, legumes in crop rotations& intercropping systems.
11.4.3 Weed control: Organic farmers often identify weeds astheir key problem. Within organic systems an integratedapproach to weed control using a combination of cultural anddirect techniques is necessary. Appropriate soil cultivation viz.,deep ploughing in summer, harrowing, inter-cultivation usingmechanical hoes and harrows, and the timing of field operations
7/30/2019 Farming Systems and Sustainable Agriculture
http://slidepdf.com/reader/full/farming-systems-and-sustainable-agriculture 99/149
and good crop establishment are vital for successful control of weeds. Mulching the soil surface can physically suppress weedseedling emergence. Soil solarization, to heat field soil under
plastic sheeting to temperatures high enough to kill weed seeds
(>65
o
C) can also be used for weed, control in some parts of India. Good seedbed preparation, timely sowing, line sowing,crop rotation, smoother crops & intercropping systems etc.,suppress the weed growth and favour normal growth anddevelopment of crops in organic systems.
11.4.4 Natural pest and disease control: One of the importantfeatures of organic farming is the exclusion of plant protectionchemicals for pest and disease control. The system relies on theon-farm diversity, improved health of the soil and crops,
protective influence of beneficial soil organisms against soil borne pathogens and use of plant based insecticides and biological control measures. The population of naturallyoccurring beneficial insects and other organisms which act as biocontrol agents multiplies making natural control of pests possiblewhen the system is free from the indiscriminate use of chemicals.Few examples are:a) Manipulation of crop rotations, to minimize survival of crop-
specific pests (in the form of, for example insect eggs, fungi)which can infest the next crop
b) Strip cropping, to moderate spreading of pests over largeareas
c) Manipulation of the moisture level or pH level of the soil (inirrigated areas)
d) Manipulation of planting dates, to plant at a time most optimalfor the crop, or least beneficial for the pest
e) Adjustment of seeding rate, to achieve an optimal densitygiven the need to check weeds or avoid insects
f) Use of appropriate plant varieties for local conditions
g) Biological control methods, to encourage natural enemies of pests by providing habitat or by breeding and releasing themin areas where they are required.
• Bacillus thuringensis against caterpillars of Heliothis,
Earias, Spodoptera etc
• Pseudomonas fluoroscenes against Pythium spp.,
Rhizoctonia spp., Fusarium spp. s s s s
7/30/2019 Farming Systems and Sustainable Agriculture
http://slidepdf.com/reader/full/farming-systems-and-sustainable-agriculture 100/149
• Nematodes like Green commandoes and Soilcommandoes against caterpillars & grubs
Nuclear Polyhedrosis virus (NPV) against caterpillars•
• Trichoderma virdi against
vegetables and spices
many common diseases of
• Weevils Neochitina eichorniae & N. bruchi against water hyacinth
Beetle Zygogramma biocolorata against partheniumTrapping insects, possibly with the use of lures such as
pheromonesUse of domesticated birdsBiological pesticides (for example neem oil, nicotine) of which the active ingredient is short-lasting, and whichmay be produced locally
•
h)
i) j)
11.5 Integrated nutrient management
Integrated nutrient management system envisagesconjunctive use of organic manures, crop residues, biofertilizers,legumes in crop rotation and green manuring. It combinestraditional and im proved technologies to gain from the symbiosisand synergy of crop- soil-environment bio-interactions. Theconcept is for optimization of all available sources of plantnutrients to improve soil fertility availing nature’s gifts.Development of INM system involving and appropriate mix of
organics, biological N fixation, phosphate solubilising microbes,and need based chemical fertilizers would be crucial for sustainability of production and soil as a resource base for it.
11.5.1 Bulky organic manures: In India, the estimate production of rural compost is about 226 million tons and urbancompostdecreaseholding
of 6.6 million tons annually. Aggregate stability,in pH, resistance to compaction, infiltration and water capacity. Proper methods of preparation of
FYM/Compost therefore have to be popularized.11.5.2 Recycling of organic wastes: Substantial quantities of crop residues (350 million tons) are produced in India everyyear. Crop residues in combination with organics have beenshown to improve availability of plant nutrients, soil organicmatter, aggregate stability, infiltration rate, microbial populationetc.eeee
7/30/2019 Farming Systems and Sustainable Agriculture
http://slidepdf.com/reader/full/farming-systems-and-sustainable-agriculture 101/149
11.5.3 Bio-fertilizers: Bio-fertilizers such as rhizobium cultureis an effective source of N supply to leguminous corps.Azotobacter and Azospirillium help in N fixation and supply tocrops like rice, wheat, sorghum, maize, cotton, sugarcane, fruitcorps and vegetables. Phosphate solubilising bacteria viz.,
Bacillus aspergillus help in making available soil P to the cropsand increase the solubility of indigenous sources of P like rock
phosphate. Blue green algae and Azolla have shown promise inlow land rice. These are renewable and environment friendlysupplementary sources of nutrients and are presently being usedin quantities between 8-10 tons per year. Vesicular arbuscular
mycorrhiza (VAM) has beneficial effect on plant growth, particularly in P deficient soils. Improved uptake of water, production of plant hormones and microbial
prime benefits of mycorrhizal inoculations.
activity are the
zotobac
zospirul
Vermicomtt
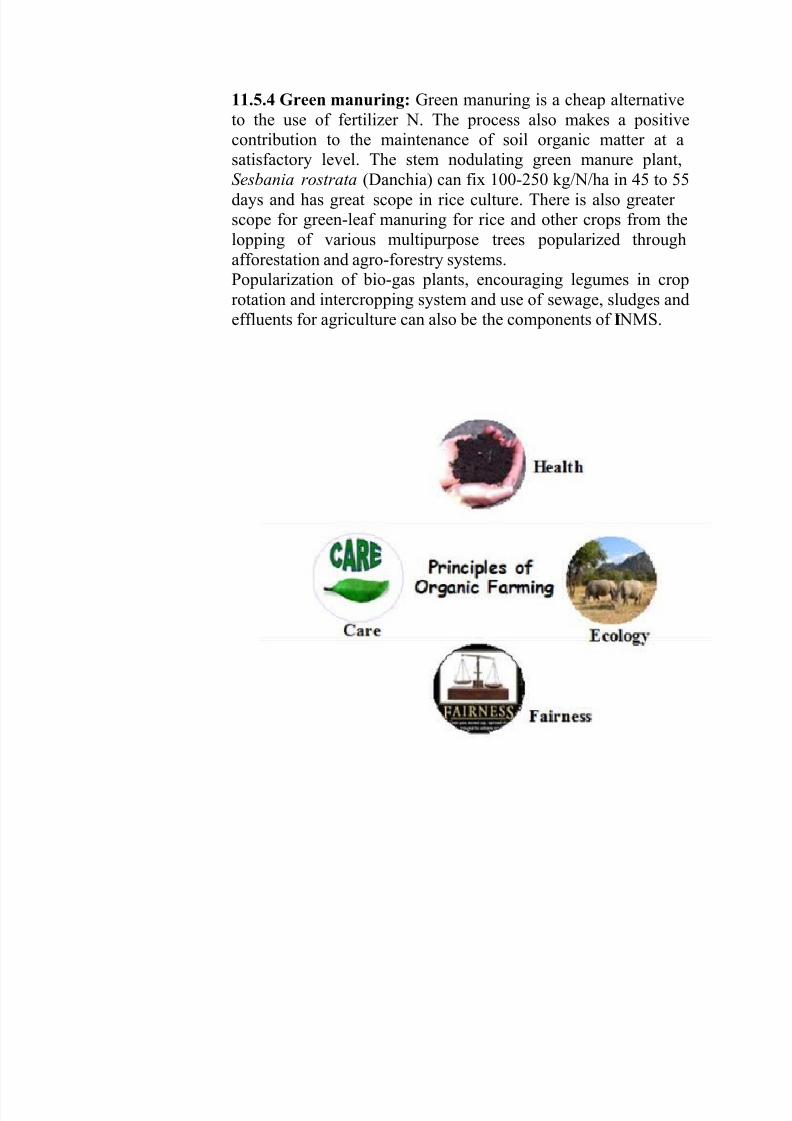
7/30/2019 Farming Systems and Sustainable Agriculture
http://slidepdf.com/reader/full/farming-systems-and-sustainable-agriculture 102/149
11.5.4 Green manuring: Green manuring is a cheap alternativeto the use of fertilizer N. The process also makes a positivecontribution to the maintenance of soil organic matter at asatisfactory level. The stem nodulating green manure plant,Sesbania rostrata (Danchia) can fix 100-250 kg/N/ha in 45 to 55days and has great scope in rice culture. There is also greater scope for green-leaf manuring for rice and other crops from thelopping of various multipurpose trees popularized throughafforestation and agro-forestry systems.Popularization of bio-gas plants, encouraging legumes in croprotation and intercropping system and use of sewage, sludges andeffluents for agriculture can also be the components of INMS.II

7/30/2019 Farming Systems and Sustainable Agriculture
http://slidepdf.com/reader/full/farming-systems-and-sustainable-agriculture 103/149
***
7/30/2019 Farming Systems and Sustainable Agriculture
http://slidepdf.com/reader/full/farming-systems-and-sustainable-agriculture 104/149
Lecture No.12
FARMING SYSTEMS-I12.1 What is a System?
A system is a group of interacting components, operatingtogether for a common purpose, capable of reacting as a whole toexternal stimuli: it is unaffected directly by its own outputs andhas a specified boundary based on the inclusion of all significantfeedbacks.
For example, the human body is a system-it has a boundary (e.g., the skin) enclosing a number of components(heart, lungs) that interact (the heart pumps blood to the lungs)for a common purpose (to maintain and operate the living body).
Collection of unrelated items does not constitute a system.
A bag of marbles is not a system: if a marble is added or subtracted, a bag of marbles remains and may be almostcompletely unaffected by the change. The marbles only behaveas a whole if the whole bag is influenced, for example bydropping it, but if it bursts the constituent parts go their ownways. It is the properties of the system that chiefly matter andthey may be summarized in the phrase ‘behavior as a whole inresponse to stimuli to any part’.
12.2 Systems approach
In system approach all the components and activities arelinked, they affect each other. It is not sensible to look atcomponent by itself without recognizing that what it doeswhat happens to it will affect other parts of the system.example consider what happens when you stub your toe:
oneandFor the
whole body may react and different parts may responddifferently. Eyes may water, the voice may make appropriatesounds, the pulse rate may increase and hands may try to rub the
damaged toe. It would be very rash to alter any component of asystem without regard to the consequences and reactionselsewhere.You cannot, for example, improve a car (system) by doingresearch on one wheel and then making it rather bigger than therest. Or increase the power and size of the engine without regardto the ability of the chassis to support it.
7/30/2019 Farming Systems and Sustainable Agriculture
http://slidepdf.com/reader/full/farming-systems-and-sustainable-agriculture 105/149
These things are common sense in such familiar contexts- theyalso apply to biological and agricultural systems.
In agriculture, management practices were usually formulated for individual corp. However, farmers are cultivating different cropsin different seasons based on their adaptability to a particular season, domestic needs and profitability. Therefore, productiontechnology or management practices should be developed inview all the crops grown in a year or more than one than oneyear if any sequence or rotation extends beyond one year. Such a
package of management practices for all crops leads to efficientuse of costly inputs, besides reduction in production cost. For instance, residual effect of manures and fertilizers applied andnitrogen fixed can considerably bring down the production cost
if all the crops are considered than individual crops.
12.3 Farming system
Farming system is a complex inter-related matrix of soil, plants, animals implements, power, labour, capital and other inputs controlled in part by farm families and influenced byvarying degrees of political, economic, institutional and socialforces that operate at many levels. In other words it is defined asunique and reasonably stable arrangement of farm enterprisesthat the household manages according to its physical, biological,economic and socio-cultural environment in accordance with thehousehold’s goals, preferences and resources. Conceptually itrefers to a set of elements or components that are interrelatedwhich interact among themselves. At the center of the interactionis the farmer exercising control and choice regarding the typeand result of interaction.
It is a resource management strategy to achieve economicand sustained production to meet diverse requirement of farmhouseholdwhile preserving resource base and maintaining a high
level of environmental quality.For example it represents integration of farm enterprises
such as cropping systems, animal husbandry, fisheries, forestry,sericulture, poultry etc for optimal utilization of resources
bringing prosperity to the farmer. The farm products other thanthe economic products, for which the crops are grown, can be
7/30/2019 Farming Systems and Sustainable Agriculture
http://slidepdf.com/reader/full/farming-systems-and-sustainable-agriculture 106/149
better utilized for productive purposes in the farming systemsapproach.
12.4 Farming systems concept
In farming system, the farm is viewed in a holistic manner.Farming enterprises include crops, dairying, poultry, fishery,sericulture, piggery, apiary tree crops etc. a combination of oneor more enterprises with cropping when carefully chosen,
planned and executed, gives greater dividends than a singleenterprise, especially for small and marginal farmers. Farm as aunit is to be considered and planned for effective integration of the enterprises to be combined with crop production activity,such that the end-products and wastes of one enterprise areutilized effectively as inputs in other enterprise. For example the
wastes of dairying viz., dung, urine, refuse etc are used in preparation of FYM or compost which serves as an input incropping system. Likewise the straw obtained from crops (maize,rice, sorghum etc) is used as a fodder for dairy cattle.Further, in sericulture the leaves of mulberry crop as a feedingmaterial for silkworms, grain from maize crop are used as a feedin poultry etc.
Sustainability is the objective of the farming system where production process is optimized through efficient utilization of inputs without infringing on the quality of environment withwhich it interacts on one hand and attempt to meet the nationalgoals on the other. The concept has an undefined timedimension. The magnitude of time dimension depends upon onesobjectives, being shorter for economic gains and longer for concerns pertaining to environment, soil productivity and landdegradation.
12.5 Principles of farming system
•
•
•
•
•
•
•
Minimization of risk
Recycling of wastes and residuesIntegration of two or more enterprises
Optimum utilization of all resources
Maximum productivity and profitability
Ecological balance
Generation of employment potential
7/30/2019 Farming Systems and Sustainable Agriculture
http://slidepdf.com/reader/full/farming-systems-and-sustainable-agriculture 107/149
• Increased input use efficiency
• Use of end products from one enterprise as input in other enterprise
12.6 Characteristics of farming system1.2.3.4.5.6.7.8.9.
Farmer oriented & holistic approachEffective farmers participationUnique problem solving systemDynamic systemGender sensitiveResponsible to societyEnvironmental sustainabilityLocation specificity of technologyDiversified farming enterprises to avoid risks due to
environmental constraints10.Provides feedback from farmers
12.7 Objectives of farming system
1. Productivity- Farming system provides onopportunity to increase economic yield per unit area
per unit time by virtue of intensification of crop andallied enterprises. Time concept by crop intensificationand space concept by building up of vertical
dimension through crops and allied enterprises.2. Profitability - The system as a whole provides anopportunity to make use of produce/waste material of one enterprise as an input in another enterprise atlow/no cost. Thus by reducing the cost of productionthe profitability and benefit cost ratio works out to behigh.
3. Potentiality – Soil health, a key factor for sustainability is gettingto faulty agricultural
deteriorated and polluted duemanagement practices viz.,
excessive use of inorganic fertilizers, pesticides,herbicides, high intensity irrigation etc. In farmingsystem, organic supplementation through effective useof manures and waste recycling is done, thus
providing an opportunity to sustain potentiality of production base for much longer time.
7/30/2019 Farming Systems and Sustainable Agriculture
http://slidepdf.com/reader/full/farming-systems-and-sustainable-agriculture 108/149
4. Balanced food- In farming system, diverse enterprisesare involved andnutrition namelyminerals etc form
they produce different sources of proteins, carbohydrates, fats &the same unit land, which helps in
solving the malnutrition problem prevalent among themarginal and sub-marginal farming households.Environmental safety- The very nature of farmingsystem is to make use or conserve the byproduct/waste
product of one component as input in another component and use of bio-control measures for pest &disease control. These eco-friendly practices bringdown the application of huge quantities of fertilizers,
pesticides and herbicides, which pollute the soil water and environment to an alarming level. Whereas IFS
will greatly reduces environmental pollution.
5.
6. Income/cash flow round the year- Unlikeconventional single enterprise crop activity where theincome is expected onlyeconomic produce after upon the duration of the
at the time of disposal of several months dependingcrop, the IFS enables cash
flow round the year by way of sale of products fromdifferent enterprises viz., eggs from poultry, milk fromdairy, fish from fisheries, silkworm cocoons fromsericulture, honey from apiculture etc. This not onlyenhances the purchasing power of the farmer but also
provides an opportunity to invest in improvedtechnologies for enhanced production.Saving energy- Availability of fossil fuel has beendeclining at a rapid rate leading to a situation whereinthe whole world may suffer for want of fossil fuel by2030 AD. In farming system, effective recycling of organic wastes to generate energy from biogas plantscan mitigate to certain extent this energy crisis.
Meeting fodder crises- In IFS every inch of land area
7.
8.is effectively utilized. Alley cropping or fodder legume along the border or water intensification of cropping including fodder in cropping systems helps to produce thefodder and greatly relieve the problem
growingcourses,legumesrequiredof non-
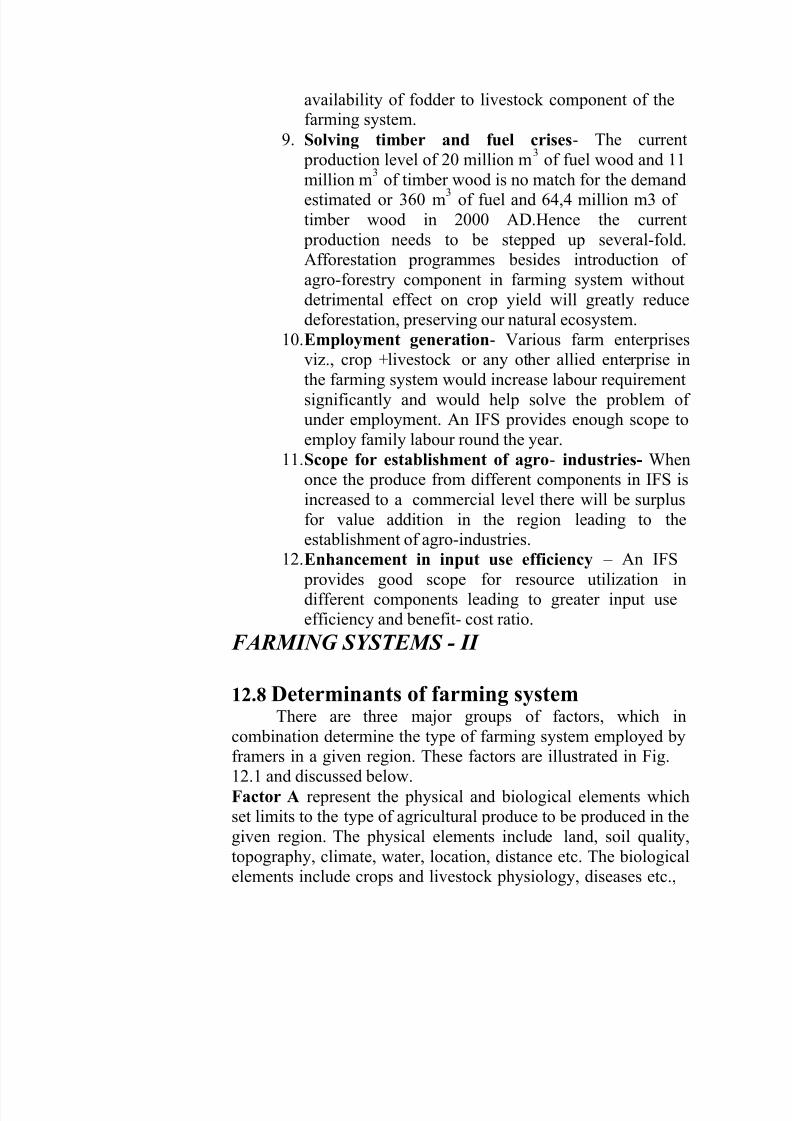
7/30/2019 Farming Systems and Sustainable Agriculture
http://slidepdf.com/reader/full/farming-systems-and-sustainable-agriculture 109/149
availability of fodder to livestock component of thefarming system.
9. Solving timber and fuel crises- The current production level of 20 million m
3of fuel wood and 11
million m3
of timber wood is no match for the demandestimated or 360 m3 of fuel and 64,4 million m3 of timber wood in 2000 AD.Hence the current
production needs to be stepped up several-fold.Afforestation programmes besides introduction of agro-forestry component in farming system withoutdetrimental effect on crop yield will greatly reducedeforestation, preserving our natural ecosystem.
10.Employment generation- Various farm enterprisesviz., crop +livestock or any other allied enterprise in
the farming system would increase labour requirementsignificantly and would help solve the problem of under employment. An IFS provides enough scope toemploy family labour round the year.
11.Scope for establishment of agro- industries- Whenonce the produce from different components in IFS isincreased to a commercial level there will be surplusfor value addition in the region leading to theestablishment of agro-industries.
12.Enhancement in input use efficiency – An IFS provides good scope for resource utilization indifferent components leading to greater input useefficiency and benefit- cost ratio.
FARMING SYSTEMS - II
12.8 Determinants of farming systemThere are three major groups of factors, which in
combination determine the type of farming system employed by
framers in a given region. These factors are illustrated in Fig.12.1 and discussed below.Factor A represent the physical and biological elements whichset limits to the type of agricultural produce to be produced in thegiven region. The physical elements include land, soil quality,topography, climate, water, location, distance etc. The biologicalelements include crops and livestock physiology, diseases etc.,
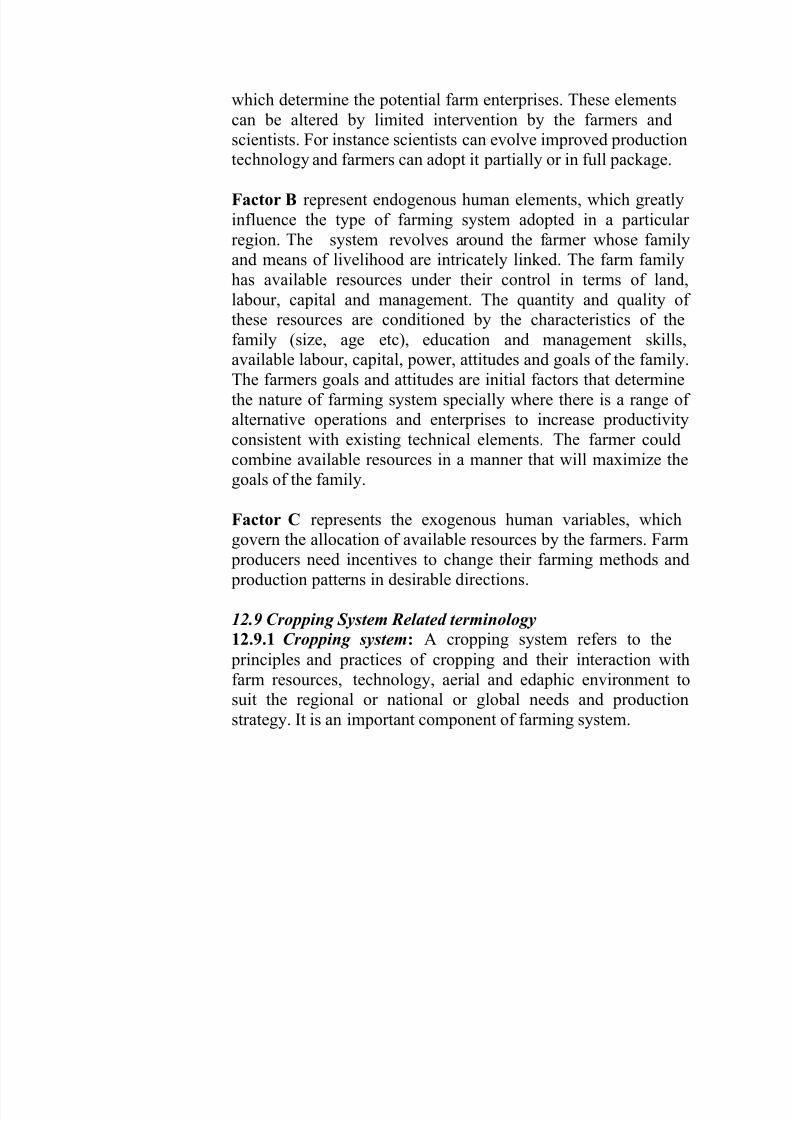
7/30/2019 Farming Systems and Sustainable Agriculture
http://slidepdf.com/reader/full/farming-systems-and-sustainable-agriculture 110/149
which determine the potential farm enterprises. These elementscan be altered by limited intervention by the farmers andscientists. For instance scientists can evolve improved productiontechnology and farmers can adopt it partially or in full package.
Factor B represent endogenous human elements, which greatlyinfluence the type of farming system adopted in a particular region. The system revolves around the farmer whose familyand means of livelihood are intricately linked. The farm familyhas available resources under their control in terms of land,labour, capital and management. The quantity and quality of these resources are conditioned by the characteristics of thefamily (size, age etc), education and management skills,available labour, capital, power, attitudes and goals of the family.
The farmers goals and attitudes are initial factors that determinethe nature of farming system specially where there is a range of alternative operations and enterprises to increase productivityconsistent with existing technical elements. The farmer couldcombine available resources in a manner that will maximize thegoals of the family.
Factor C represents the exogenous human variables, whichgovern the allocation of available resources by the farmers. Farm
producers need incentives to change their farming methods and production patterns in desirable directions.
12.9 Cropping System Related terminology12.9.1 Cropping system: A cropping system refers to the
principles and practices of cropping and their interaction withfarm resources, technology, aerial and edaphic environment tosuit the regional or national or global needs and productionstrategy. It is an important component of farming system.
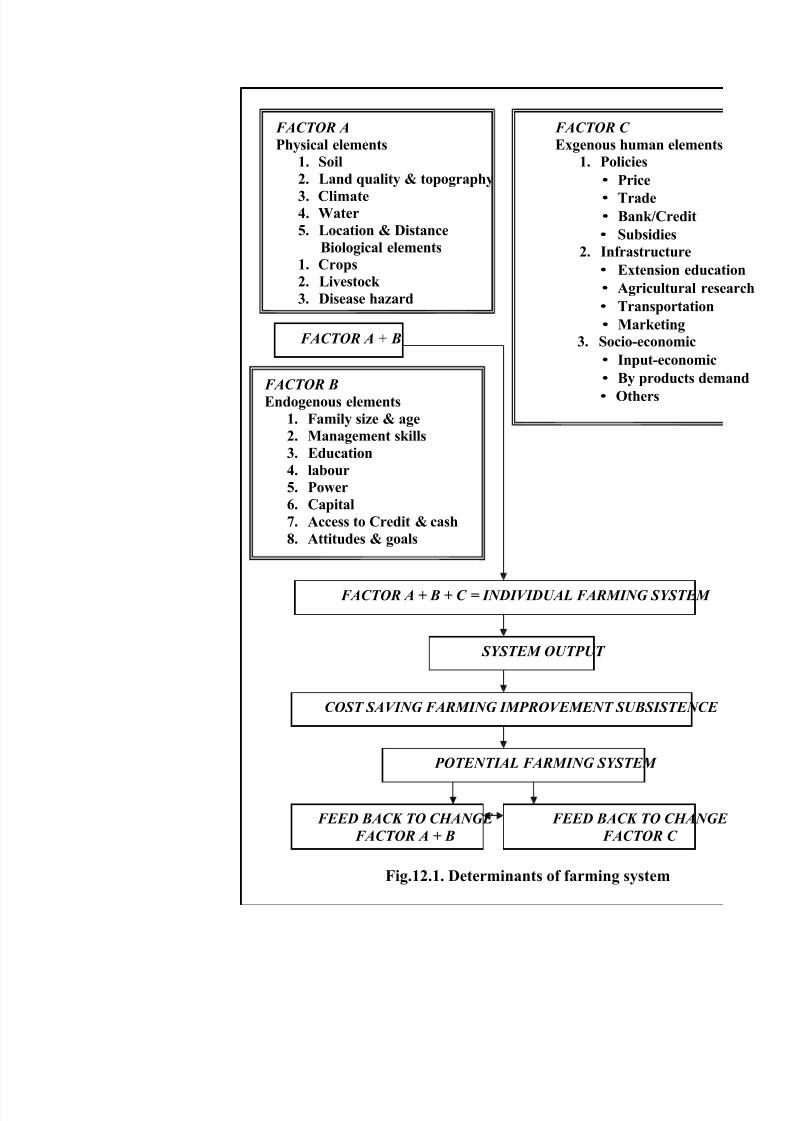
7/30/2019 Farming Systems and Sustainable Agriculture
http://slidepdf.com/reader/full/farming-systems-and-sustainable-agriculture 111/149
• Subsidies
• Extension educati
• Transportation
3. Socio-economic
• Others
FACTOR C
Exgenous human elements
1. Policies
• Price
• Trade
• Bank/Credit
2. Infrastructure
• Agricultural resea
• Marketing
• Input-economic
• By products dema
Fig.12.1. Determinants of farming system
FEED BACK TO CHANGE
FACTOR C
FEED BACK TO CHANGE
FACTOR A + B
POTENTIAL FARMING SYSTEM
COST SAVING FARMING IMPROVEMENT SUBSISTENCE
SYSTEM OUTPUT
FACTOR A + B + C = INDIVIDUAL FARMING SYSTEM
FACTOR B
Endogenous elements
1. Family size & age
2. Management skills
3. Education
4. labour
5. Power
6. Capital
7. Access to Credit & cash
8. Attitudes & goals
FACTOR A + B
FACTOR A
Physical elements
1. Soil
2. Land quality & topography
3. Climate
4. Water
5. Location & Distance
Biological elements
1. Crops
2. Livestock
3. Disease hazard
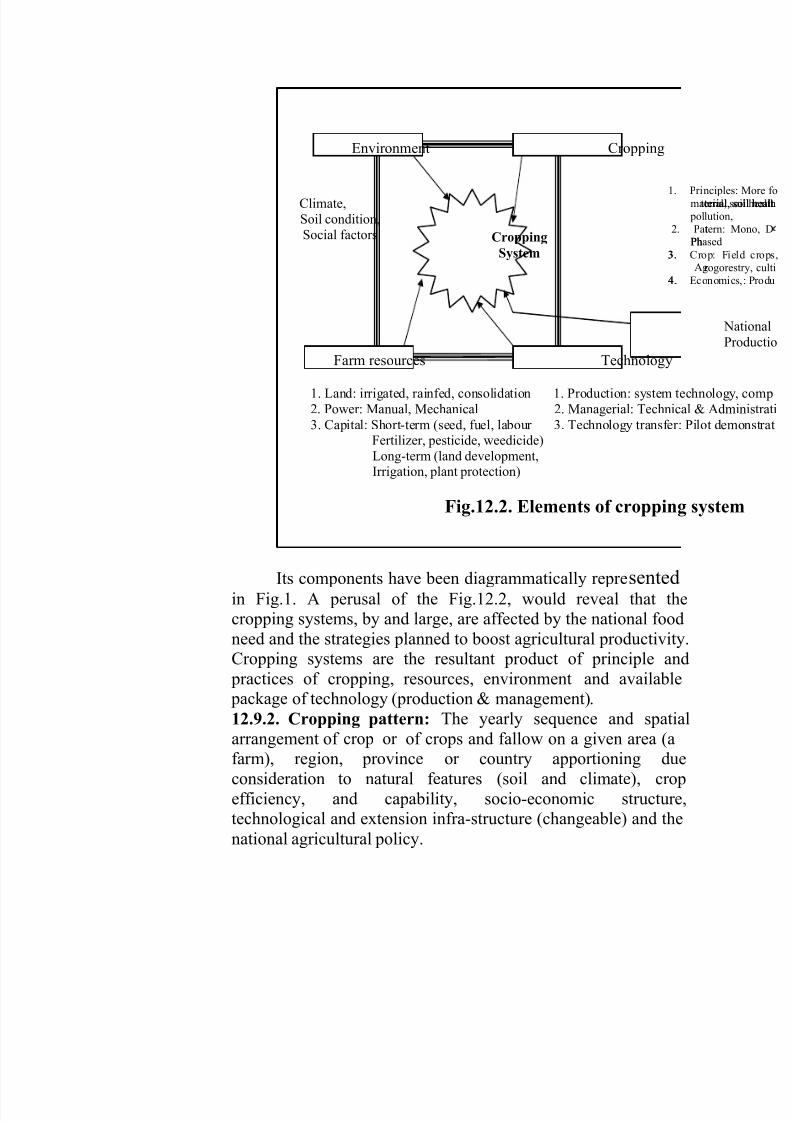
7/30/2019 Farming Systems and Sustainable Agriculture
http://slidepdf.com/reader/full/farming-systems-and-sustainable-agriculture 112/149
terial,
Its components have been diagrammatically representedin Fig.1. A perusal of the Fig.12.2, would reveal that thecropping systems, by and large, are affected by the national foodneed and the strategies planned to boost agricultural productivity.Cropping systems are the resultant product of principle and
practices of cropping, resources, environment and available package of technology (production & management).12.9.2. Cropping pattern: The yearly sequence and spatialarrangement of crop or of crops and fallow on a given area (a
farm), region, province or country apportioning dueconsideration to natural features (soil and climate), cropefficiency, and capability, socio-economic structure,technological and extension infra-structure (changeable) and thenational agricultural policy.
Environment Cropping
terial,
Social factors
3. Crop: Fi
1. Land: irrigated, rainfed, consolidation 1. Production: system technolog2. Power: Manual, Mechanical 2. Managerial: Technical & Adm3. Capital: Short-term (seed, fuel, labour 3. Technology transfer: Pilot de
Fertilizer, pesticide, weedicide)Long-term (land development,Irrigation, plant protection)
Fig.12.2. Elements of cropping syste
NP
Climate,Soil condition,
ncipleterial,lutiontern:
Phased
rogor4. Economi
Cropping
System
1. Prima
pol2. Pat
Ph3.
Ag
4.
Farm resources Technology
7/30/2019 Farming Systems and Sustainable Agriculture
http://slidepdf.com/reader/full/farming-systems-and-sustainable-agriculture 113/149
12.9.3 Multiple cropping
Multiple cropping refers to intensification of cropping both intime and space. It includes sequential cropping, inter-croppingand mixed cropping.
a) Sequential cropping: Growing two or more crops in asequence on the same field in a farming year (twelve months) for irrigated land and is limited to the period of adequate soilmoisture availability for crop growth in semi-arid & arid areas.The succeeding crop is planted after the preceding crop has beenharvested. Crop intensification is only in time dimension. Thereis no inter-crop competition. Farmers manage only one crop at atime in the same field.
b) Intercropping : It refers to growing of two or more dissimilar crops simultaneously on the same piece of land, base cropnecessarily in distinct row arrangement. The recommendedoptimum plant population of the base crop is suitably combinedwith appropriate additional plant density of theassociated/component crop. The objective is intensification of cropping both in time and space dimensions and to raise
productivity per unit area and inputs by increasing the pressureof plant population. The following four types of inter-croppingare identified.
7/30/2019 Farming Systems and Sustainable Agriculture
http://slidepdf.com/reader/full/farming-systems-and-sustainable-agriculture 114/149
i) Mixed inter-cropping: Growing component cropssimultaneously with no distinct row arrangement. Thisis commonly used in labour intensive subsistencefarming situations.Row inter-cropping: Growing component cropssimultaneously in different row arrangement. This isused in mechanized agriculture.Strip inter-cropping: Growing component crops indifferent strips wide enough to permit independentcultivation but narrow enough to the crop to interactagronomically.Relay inter-cropping: Growing component crops in
relay, so that growth cycles overlap. It necessarily doesnot mean planting of succeeding crop before floweringstage of preceding crop or attainment of reproductive
ii)
iii)
iv)
stage of preceding crop. It referssucceeding crop before the harvest of
planting of succeeding crop may be
to planting of preceding crop,done before or
after flowering before or after attainment of reproductive stage, completion of active life cycle,senescence of leaves or attainment of physiologicalmaturity.
12.9.4 Mixed cropping: Mixed cropping is growing of two or more crops simultaneously on the same piece of land seededeither after the seeds of the crops intended to be grown mixed or sowing alternate rows in various replacement ratios. This may or may not have distinct row arrangement and the mixed plantcommunity faces inter and intra row competition with a different
plant type/variety. The basic objective in mixed cropping isminimization of risk and insurance against crop failure due to
aberrant weather conditions. In inter-cropping systems, pressureof plant density per unit are is more than that in a sole croppingsystem, while in mixed cropping the plant population pressure isgenerally equal to sole cropping and in some cases it may even
be less than sole cropping system.Besides the above few other terms commonly used in
cropping systems approach are defined below:
7/30/2019 Farming Systems and Sustainable Agriculture
http://slidepdf.com/reader/full/farming-systems-and-sustainable-agriculture 115/149
12.9.5 Monoculture: The repetitive growing of the sole crop onthe same piece of land. It may either be due to climatologicallimitation or due to specialization by a farmer to grow a
particular crop.
12.9.6 Staggered planting: It means sowing of a crop is spreadover and around optimum period of planting either to minimizerisks or to use labour & machinery more effectively or tominimize competition (in inter-cropping) or to prolong the periodof supply to the market or the factories.
12.9.7 Ratoon cropping: The cultivation of crops’ re-growthcoming out of roots or stalks of the preceding crop after harvest,
although not necessarily for grain is termed as ratooncropping/ratooning.
12.9.8 Mixed farming: It is defined as a system of farming on a particular farm (regardless of size) which includes crop production, raising of livestock, poultry, fish and bee keeping,and/or tress to sustain and satisfy as many necessities of theowner (farmer) as is possible. Subsistence is the objective here. Itis based on the principle of give and take. Farm animals feed onfarm produce and in return manure is given to the crops.
7/30/2019 Farming Systems and Sustainable Agriculture
http://slidepdf.com/reader/full/farming-systems-and-sustainable-agriculture 116/149
Lecture No.13
STUDY OF ALLIED ENTERPRISES – I
(DAIRYING AND SHEEP & GOAT REARING)
In an integrated farming system, it is always emphasized tocombine cropping with other enterprises/activities. Manyenterprises are available and these primarily include dairying,sheep & goat rearing, poultry, fisheries, sericulture, bee keepingetc. Any one or more can be combined with the cropping system.
13.1 Significance or integrating crops and livestock
Animals can perform numerous functions in smallholder systems. They provide products such as meat, milk eggs, wooletc. They serve socio-cultural functions, as bride wealth, for
ceremonial feasts, and as gifts or loans, which strengthen social bonds. Integration of livestock into the farming system is particularly important for:
• Increasing subsistence security by diversifying thefood generating activities of the farm family
• Transferring nutrient and energy between animals andcrops via manure and forage from cropped areas viause of draught animals
Diversification into livestock keeping expends the risk
reduction strategies of farmers beyond multiple croppingand thus increases the economic stability of the farmingsystem. Livestock can enhance farm productivity byintensifying nutrient and energy cycles. Stubble in thefields and crop residues are important sources of forage insmallholder systems.Lower mature leaves stripped fromstanding crops, plants thinned from cereal stands andvegetation on fallow fields offer addional fodder resourcesrelated to food cropping. When animals consumevegetation and produce dung, nutrients are recycled more
quickly than when the vegetation decays naturally.Grazing livestock transfer nutrients from range to croplandand concentrate them on selected areas of the farm.
Integrating agro-forestry and fodder production intocrop rotations can enhance the sustainability of a farmingsystem, particularly to the extent that perennial grasses andlegumes, including shrubs and trees are involved. These
7/30/2019 Farming Systems and Sustainable Agriculture
http://slidepdf.com/reader/full/farming-systems-and-sustainable-agriculture 117/149
may use nutrient and water from deeper soil fertility and protect the soil during periods when arable crops are notgrown. Forage crops can play an important role in nutrienttransfer also within the farm by providing better qualitydung, which can be used as manure for crops. Part of theforage crop can also be used as green manure or mulch.Trees solve the problem of fuel and fodder requirement.
When animals are used for traction, some of theenergy gained from grazing wasteland and temporarilyuncultivated land can be exploited for crop production.Animals power can also be used to process farm productse.g, for threshing, and for transporting them from thefields to storage or market.
13.2 DairyingDairy farming is one of the economically viable
enterprises that could provide constant income throughout theyear to farmers when combined with cropping. The success of dairying depends solely on the availability of inputs like feed andfodder and better marketing facilities to milk. To maximize
benefits from dairying selection of proper breed to suit the localconditions is very essential. The dairy cattle are broadlyclassified into the following 5 groups.
1. Draft breeds: The bullocks of these breeds are good draftanimals, but the cows are poor milkers e.g, Nagore,Hallikar Kangeyam, Mali.Dairy breeds: The cows are high milk yielders and the
bullocks are with good draft work capacity e.g., Sahiwal,Sindhi, Gir.Dual Purpose: The cows are fairly good milkers and the
bullocks are with good draft work capacity e.g., Hariana,Ongole and Kankerj.
Exotic breeds: The exotic breeds are high milk yeilders,e.g., Jersey, Holstein-Friesian, Aryshire, Brown Swiss andGuernseyBuffaloes: Important dairy breeds of buffalo are Murrah,
Nili Ravi (Which has its home tract in Pakistan, Mehsana,Suti, Zafarabadi, Godavari and Bhadwari. Of these
2.
3.
4.
5.
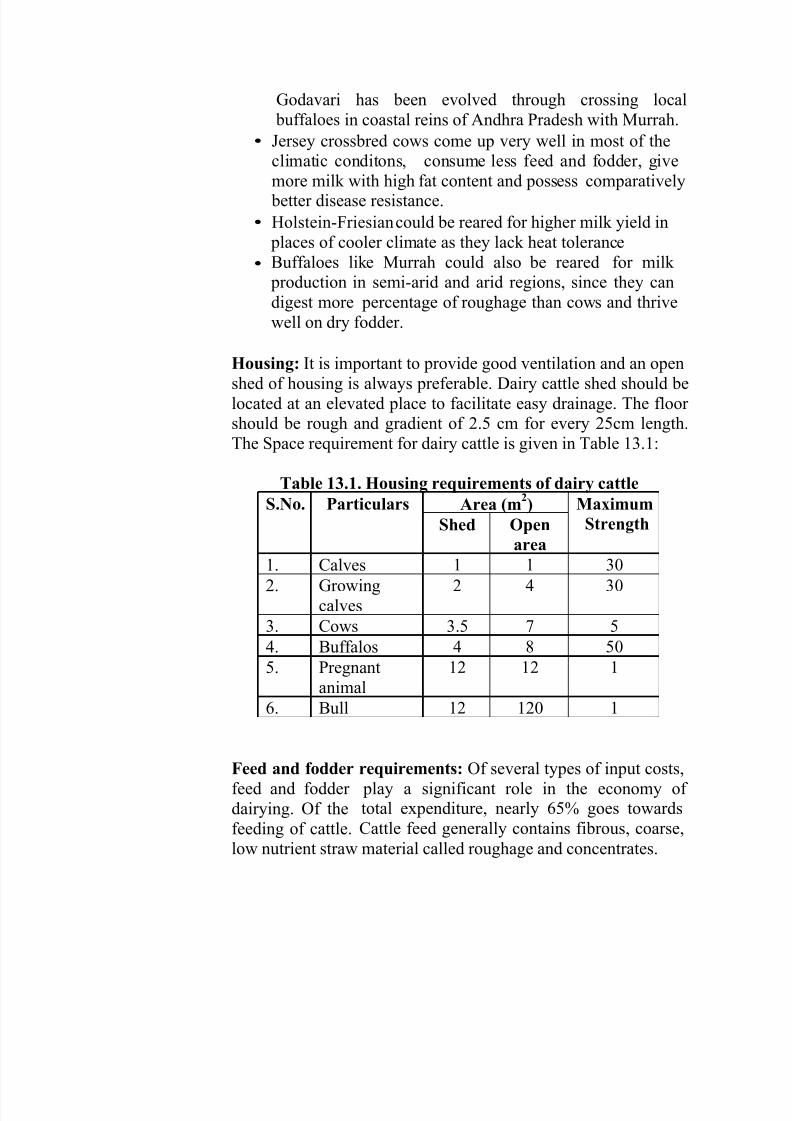
7/30/2019 Farming Systems and Sustainable Agriculture
http://slidepdf.com/reader/full/farming-systems-and-sustainable-agriculture 118/149
Godavari has been evolved through crossing local buffaloes in coastal reins of Andhra Pradesh with Murrah.
Jersey crossbred cows come up very well in most of the•
climatic conditons, consume less feed and fodder, give
more milk with high fat content and possess comparatively better disease resistance.
Holstein-Friesiancould be reared for higher milk yield in places of cooler climate as they lack heat toleranceBuffaloes like Murrah could also be reared for milk
production in semi-arid and arid regions, since they candigest more percentage of roughage than cows and thrivewell on dry fodder.
•
•
Housing: It is important to provide good ventilation and an open
shed of housing is always preferable. Dairy cattle shed should belocated at an elevated place to facilitate easy drainage. The floor should be rough and gradient of 2.5 cm for every 25cm length.The Space requirement for dairy cattle is given in Table 13.1:
Table 13.1. Housing requirements of dairy cattle
Feed and fodder requirements: Of several types of input costs,feed and fodder dairying. Of thefeeding of cattle.
play a significant role in the economy of total expenditure, nearly 65% goes towardsCattle feed generally contains fibrous, coarse,
low nutrient straw material called roughage and concentrates.
S.No. Particulars Area (m2) Maximum
StrengthShed Open
area
1. Calves 1 1 302. Growing
calves2 4 30
3. Cows 3.5 7 5
4. Buffalos 4 8 50
5. Pregnantanimal
12 12 1
6. Bull 12 120 1
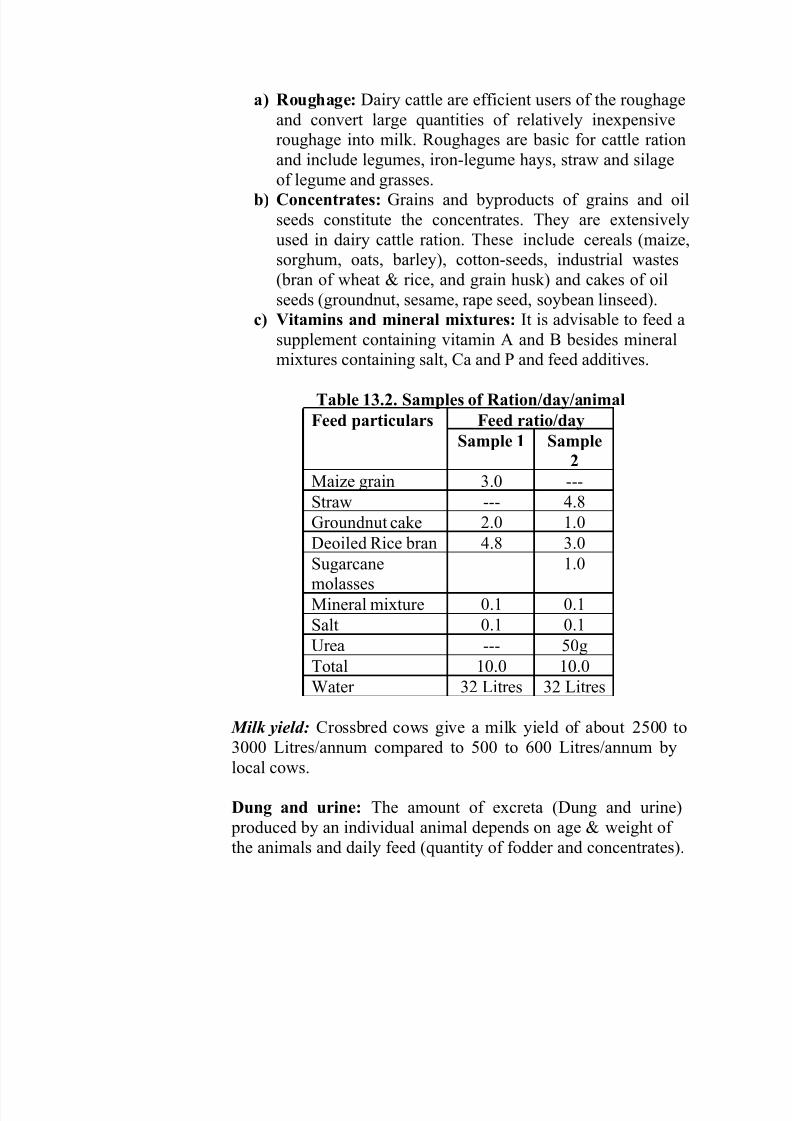
7/30/2019 Farming Systems and Sustainable Agriculture
http://slidepdf.com/reader/full/farming-systems-and-sustainable-agriculture 119/149
a) Roughage: Dairy cattle are efficient users of the roughageand convert large quantities of relatively inexpensiveroughage into milk. Roughages are basic for cattle rationand include legumes, iron-legume hays, straw and silageof legume and grasses.Concentrates: Grains and byproducts of grains and oilseeds constitute the concentrates. They are extensivelyused in dairy cattle ration. These include cereals (maize,sorghum, oats, barley), cotton-seeds, industrial wastes(bran of wheat & rice, and grain husk) and cakes of oilseeds (groundnut, sesame, rape seed, soybean linseed).Vitamins and mineral mixtures: It is advisable to feed asupplement containing vitamin A and B besides mineralmixtures containing salt, Ca and P and feed additives.
b)
c)
Table 13.2. Samples of Ration/day/animal
Milk yield: Crossbred cows give a milk yield of about 2500 to3000 Litres/annum compared to 500 to 600 Litres/annum bylocal cows.
Dung and urine: The amount of excreta (Dung and urine) produced by an individual animal depends on age & weight of the animals and daily feed (quantity of fodder and concentrates).
Feed particulars Feed ratio/day
Sample 1 Sample
2
Maize grain 3.0 ---
Straw --- 4.8
Groundnut cake 2.0 1.0
Deoiled Rice bran 4.8 3.0
Sugarcanemolasses1.0
Mineral mixture 0.1 0.1
Salt 0.1 0.1
Urea --- 50g
Total 10.0 10.0
Water 32 Litres 32 Litres
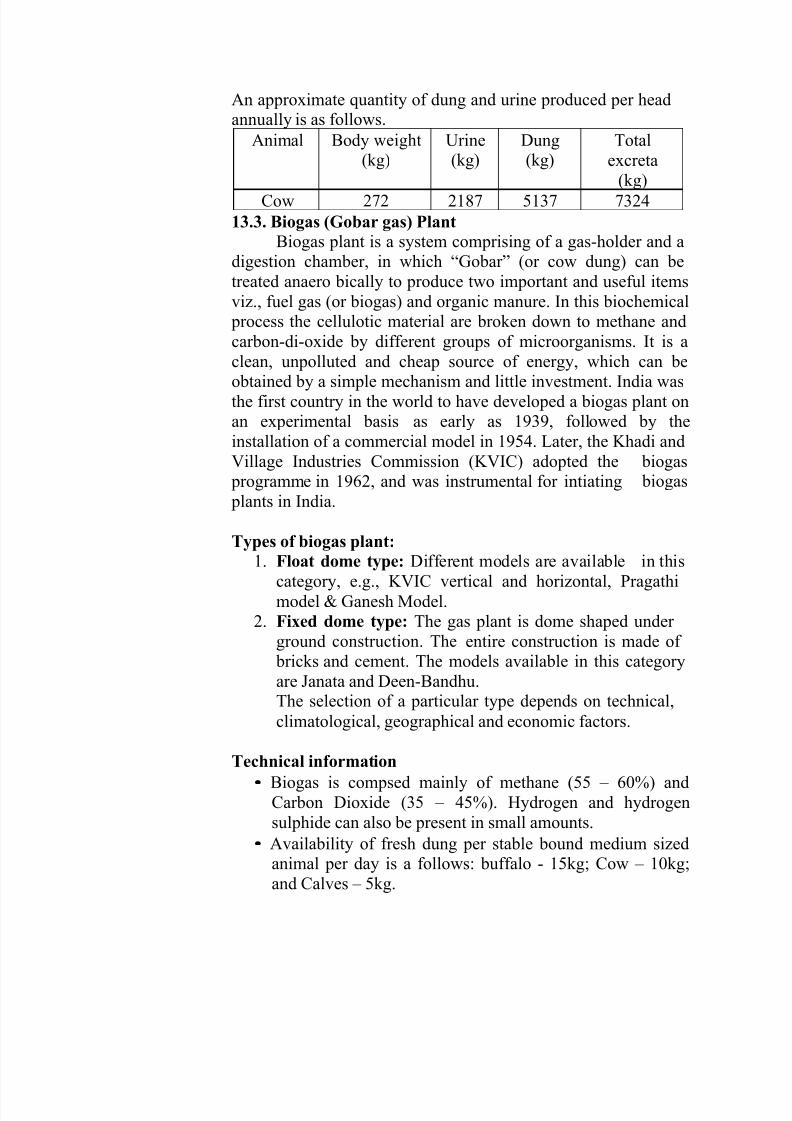
7/30/2019 Farming Systems and Sustainable Agriculture
http://slidepdf.com/reader/full/farming-systems-and-sustainable-agriculture 120/149
An approximate quantity of dung and urine produced per headannually is as follows.
13.3. Biogas (Gobar gas) Plant
Biogas plant is a system comprising of a gas-holder and adigestion chamber, in which “Gobar” (or cow dung) can betreated anaero bically to produce two important and useful itemsviz., fuel gas (or biogas) and organic manure. In this biochemical
process the cellulotic material are broken down to methane andcarbon-di-oxide by different groups of microorganisms. It is aclean, unpolluted and cheap source of energy, which can be
obtained by a simple mechanism and little investment. India wasthe first country in the world to have developed a biogas plant onan experimental basis as early as 1939, followed by theinstallation of a commercial model in 1954. Later, the Khadi andVillage Industries Commission (KVIC) adopted the
programme in 1962, and was instrumental for intiating plants in India.
biogas biogas
Types of biogas plant:
1. Float dome type: Different models are available in thiscategory, e.g., KVIC vertical and horizontal, Pragathimodel & Ganesh Model.
2. Fixed dome type: The gas plant is dome shaped under ground construction. The entire construction is made of
bricks and cement. The models available in this categoryare Janata and Deen-Bandhu.The selection of a particular type depends on technical,climatological, geographical and economic factors.
Technical information• Biogas is compsed mainly of methane (55 – 60%) and
Carbon Dioxide (35 – 45%). Hydrogen and hydrogensulphide can also be present in small amounts.
• Availability of fresh dung per stable bound medium sizedanimal per day is a follows: buffalo - 15kg; Cow – 10kg;and Calves – 5kg.
Animal Body weight(kg)
Urine(kg)
Dung(kg)
Totalexcreta(kg)
Cow 272 2187 5137 7324
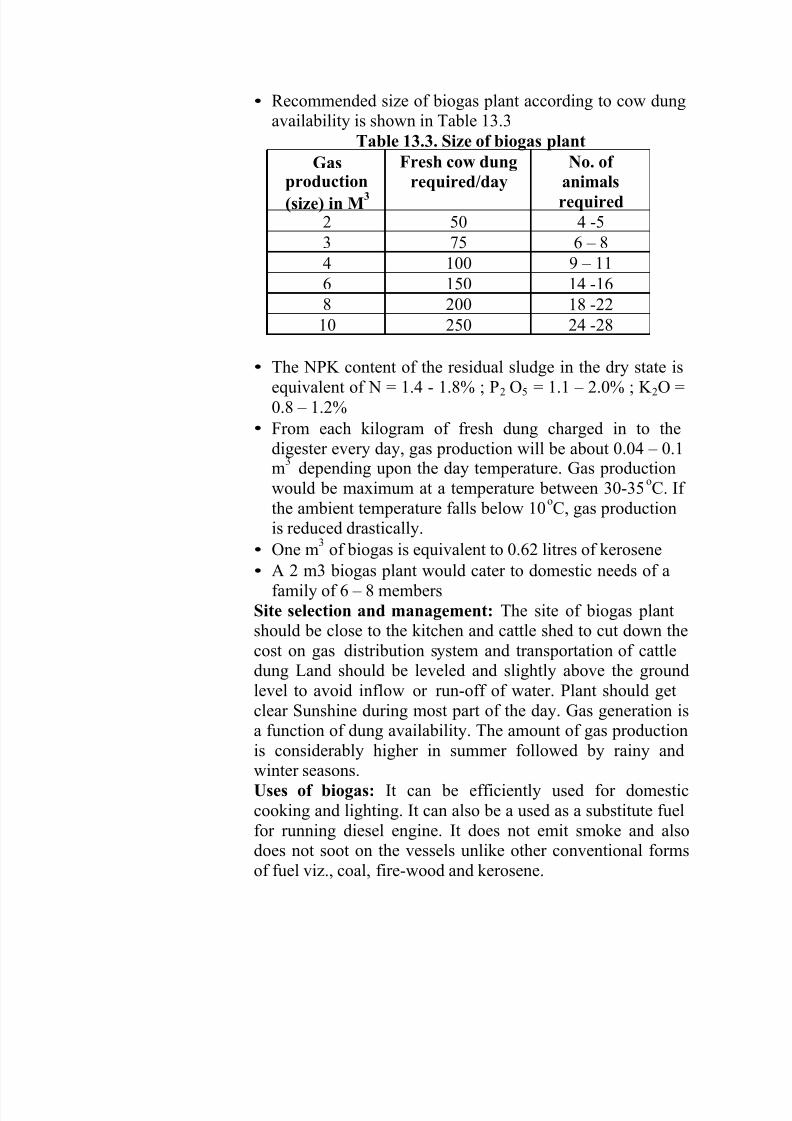
7/30/2019 Farming Systems and Sustainable Agriculture
http://slidepdf.com/reader/full/farming-systems-and-sustainable-agriculture 121/149
• Recommended size of biogas plant according to cow dungavailability is shown in Table 13.3
Table 13.3. Size of biogas plant
required
• The NPK content of the residual sludge in the dry state isequivalent of N = 1.4 - 1.8% ; P2 O5 = 1.1 – 2.0% ; K 2O =0.8 – 1.2%
From each kilogram of fresh dung charged in to thedigester every day, gas production will be about 0.04 – 0.1
•
m3
depending upon the day temperature. Gas productionwould be maximum at a temperature between 30-35
oC. If
the ambient temperature falls below 10oC, gas production
is reduced drastically.
One m3
of biogas is equivalent to 0.62 litres of kerosene
A 2 m3 biogas plant would cater to domestic needs of afamily of 6 – 8 members
•
•
Site selection and management: The site of biogas plantshould be close to the kitchen and cattle shed to cut down thecost on gas distribution system and transportation of cattledung Land should be leveled and slightly above the groundlevel to avoid inflow or run-off of water. Plant should getclear Sunshine during most part of the day. Gas generation isa function of dung availability. The amount of gas production
is considerably higher in summer followed by rainy andwinter seasons.Uses of biogas: It can be efficiently used for domesticcooking and lighting. It can also be a used as a substitute fuelfor running diesel engine. It does not emit smoke and alsodoes not soot on the vessels unlike other conventional formsof fuel viz., coal, fire-wood and kerosene.
Gas
production(size) in M3
Fresh cow dung
required/day
No. of
animals
2 50 4 -5
3 75 6 – 8
4 100 9 – 11
6 150 14 -168 200 18 -22
10 250 24 -28
7/30/2019 Farming Systems and Sustainable Agriculture
http://slidepdf.com/reader/full/farming-systems-and-sustainable-agriculture 122/149
Uses of bio-gas slurry: Slurry is obtained after the production of bio-gas. It is enriched manure containing NPK and humus. Another positive aspect of this manure is thateven after weeks of exposure to the atmosphere, the slurrydoes not attract fleas and worms.
13.4 Sheep and goat rearing
Rearing sheep and goat is one of the important commonlivestock enterprises followed by small and marginal farmfamilies and landless labourers in drought prone, hilly and desertareas. Goat farming needs less capital when compared todairying, and the animals can be raised in small farms as well.This enterprise provides employment opportunities round theyear for the farm household as well as for the unemployed and
under employed rural population and forms one of the important practicable and profitable components of an integrated farmingsystem. Not much financial inputs are required but steadyincome is assured throughout the year. Even with the poor grazing facilities and with minimum managerial resources sheepand goats can return high profits to farmers. They not only helpthe household with regular cash flow but also improve the healthof family members by providing milk and meat regularly.
The sheep and goat have a high adaptability to extremeand different agro-climatic conditions, disease tolerance givingmultiple kids with faster growth rate and excellent marketingfacilities. Small and marginal farmers could easily maintain 20animals with available fodder in one ha area. Per capitaavailability of meat is very poor in India. It is around6g/person/day as against 57g worldwide. It indicates atremendous scope for sheep and goat production potential inIndia. Goat milk constitutes about 2.4 per cent of the total milk
production. Goat milk has excellent market value, as it is a
scarce commodity for the preparation of many ayurvedicmedicines and for human diet.
Breeds
Goats: Tellicherry, Jamunapari, Barberi, Osmanabadi, Malaberi,Kashmeri, Beetal, Surti, Gujarati. A few exotic goats such asSaanen, Toggenburg, Angora, Anglo-Nubian, British Alpine and
7/30/2019 Farming Systems and Sustainable Agriculture
http://slidepdf.com/reader/full/farming-systems-and-sustainable-agriculture 123/149
French Alpine have been found to be well adapted to Indianconditions.Sheep: Himalayan region – Gurez, Karanah, Bhakarwal;Western region – Bikanari, Marwari, Kathiawari, Kutchi;Southern region – Deccani, Nellore, Bellary, Mandya & Bandur
Housing: Successful sheep and goat rearing depends on theselection of proper site. Sheep and goats do not thrive on marshyor swampy ground. They have to be provided with a dry,comfortable, safe and inclement weather. The kids of goats andlambs of sheep are kept under large inverted baskets until theyare old enough to run along with their mothers. Males andfemales are generally kept together. The space requirement for asheep and goats varies between 4.5 50 5.4 sq.m.
Feeding: The requirement of nutrients per head in respect of sheep and goats is relatively low. Hence, they are suitable for resource poor small farmers with marginal grazing lands.Goats are essentially browsers and eat plants, which any other animals won’t touch. They eat 4-5 times that of their bodyweight. Since the profit depends on weight addition, adequate
proteins and calorie should be given to goats. They eat more of tree leaf fodder (Subabul, Acacia etc) and legume fodder (Lucerne, Berseem, Soyabean, Pillipeasera etc) @ 4kg/day andthe rest with other grass species (Maize, Jowar, Bajra, Anjangrass, Sudan grass, Hybrid napier etc). Goats should be fed withconcentrates of maize, wheat, horse-gram, groundnut cake, fishmeal and wheat bran, Common salt and vitamin mixtures shouldalso be added.Sheep are excellent gleaners and make use of much of the wastefeed. They consume large quantities of roughage, converting arelatively cheap food into a good cash product. The feed andfodder requirements of sheep include:
Green fodder: Legumes (Berseem, Lucerne, Stylo, Pillipesera,etc), Cereal (Maize, Jowar Ragi, Bajra besides Napier &Paragrass are also preferred), paddy and wheat straw mixed withurea and gur molasses.Concentrates: Grains of maize, jowar, bajra, ragi, pulses, rice
bran, wheat bran, maize bran, groundnut, seseme, sunflower,safflower and cotton seed cakes. A sheep requires about 1 -2 kg
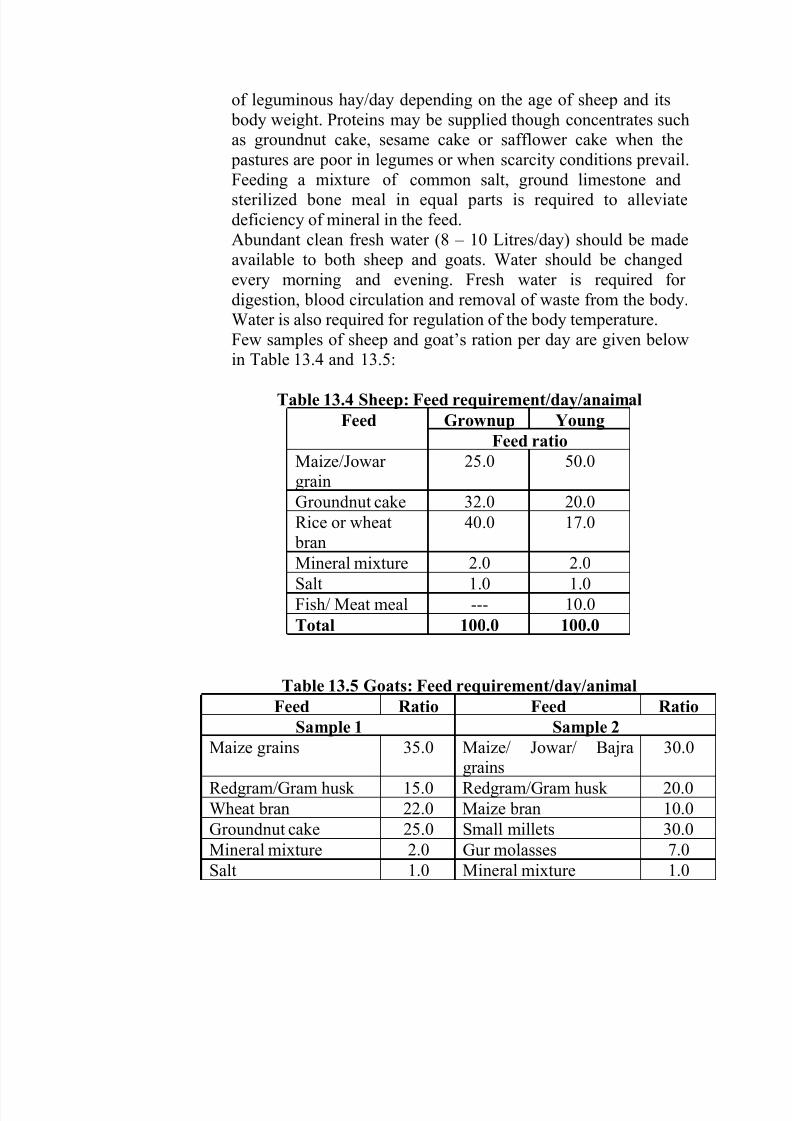
7/30/2019 Farming Systems and Sustainable Agriculture
http://slidepdf.com/reader/full/farming-systems-and-sustainable-agriculture 124/149
of leguminous hay/day depending on the age of sheep and its body weight. Proteins may be supplied though concentrates suchas groundnut cake, sesame cake or safflower cake when the
pastures are poor in legumes or when scarcity conditions prevail.Feeding a mixture of common salt, ground limestone andsterilized bone meal in equal parts is required to alleviatedeficiency of mineral in the feed.Abundant clean fresh water (8 – 10 Litres/day) should be madeavailable to both sheep and goats. Water should be changedevery morning and evening. Fresh water is required for digestion, blood circulation and removal of waste from the body.Water is also required for regulation of the body temperature.Few samples of sheep and goat’s ration per day are given belowin Table 13.4 and 13.5:
Table 13.4 Sheep: Feed requirement/day/anaimal
Table 13.5 Goats: Feed requirement/day/animal
Feed Ratio Feed Ratio
Sample 1 Sample 2
Maize grains 35.0 Maize/ Jowar/ Bajragrains
30.0
Redgram/Gram husk 15.0 Redgram/Gram husk 20.0
Wheat bran 22.0 Maize bran 10.0
Groundnut cake 25.0 Small millets 30.0
Mineralmixture 2.0 Gur molasses 7.0
Salt 1.0 Mineralmixture 1.0
Feed Grownup Young
Feed ratio
Maize/Jowar grain
25.0 50.0
Groundnut cake 32.0 20.0
Rice or wheat bran
40.0 17.0
Mineral mixture 2.0 2.0Salt 1.0 1.0
Fish/ Meat meal --- 10.0
Total 100.0 100.0
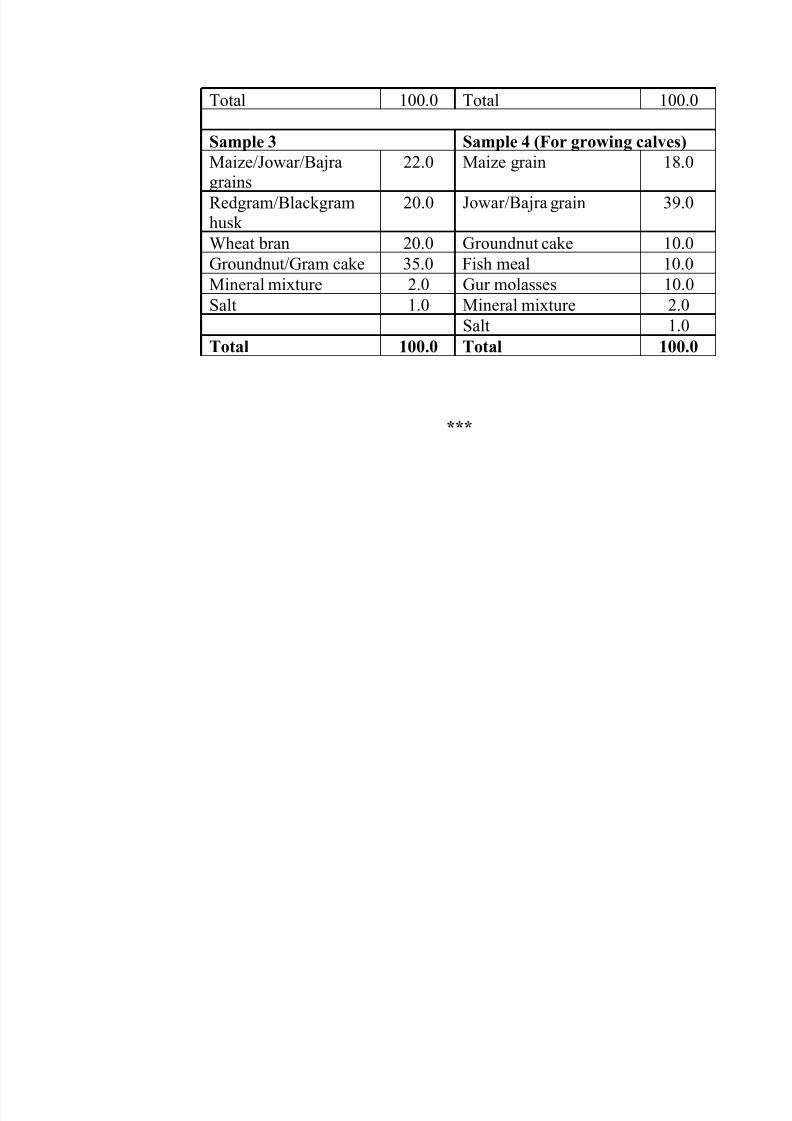
7/30/2019 Farming Systems and Sustainable Agriculture
http://slidepdf.com/reader/full/farming-systems-and-sustainable-agriculture 125/149
***
Total 100.0 Total 100.0
Sample 3 Sample 4 (For growing calves)
Maize/Jowar/Bajra
grains
22.0 Maize grain 18.0
Redgram/Blackgramhusk
20.0 Jowar/Bajra grain 39.0
Wheat bran 20.0 Groundnut cake 10.0
Groundnut/Gram cake 35.0 Fish meal 10.0
Mineralmixture 2.0 Gur molasses 10.0
Salt 1.0 Mineralmixture 2.0
Salt 1.0
Total 100.0 Total 100.0
7/30/2019 Farming Systems and Sustainable Agriculture
http://slidepdf.com/reader/full/farming-systems-and-sustainable-agriculture 126/149
LECTURE No. 14
STUDY OF ALLIED ENTERPRISES – II (POULTRY
FARMING, FISHERIES AND APICULTURE)
14.1 Poultry farming
Poultry farming is emerging as an important livestock activity in Farming system for enhancing economic stability,nutrition and providing regular employment and cash flow.Poultry meat accounts for about 27% of the total meat consumedworld wide, and its consumption is growing at an average of 5%annually. The total egg production in India was worth Rs.5000crores (2001). Broiler production is increasing at the rate of 12%
per year. Nevertheless the present per capita consumption is very
low, 100g/year. The average global consumption is 120 eggs per person per year and in India, it is only 32 – 33 eggs per capita per year. As per the nutritional recommendation, the per capitaconsumption is estimated at 180 eggs/year and 9 kg meat/year.
Breeds: Specific poultry stocks for egg and broiler productionare available. A majority of the stocks used for egg productionare crosses involving the strains or inbred lines of whiteLeghorn. Under good management the egg laying potential of these breeds is 280 – 310 eggs/annum. To a limited extent, other
breeds like Rhode Island Red, California Grey and Australop areused. There are many hatcheries in Andhra Pradesh Supplyingthe strains/inbred lines of layers and broiler chicks (Table 14.1 &14.2). Heavy breeds such as white Plymouth Rock, WhiteCornish and New Hampshire are used for cross-bred broiler chicken. Hence, it is essential to consider the strain within the
breed at the time of purchase. Several commercial poultry breeders are selling day old chicks in India. It is best to start withthe day old chicks.
Table 14.1. Hatcheries supplying chicks of layers
S.No Hatchery Breed
1. ANGRAU,Hyderabad ILR – 90Jubliee
2. AVN Hatcheries Private Limited, Secunderabad BOWENS
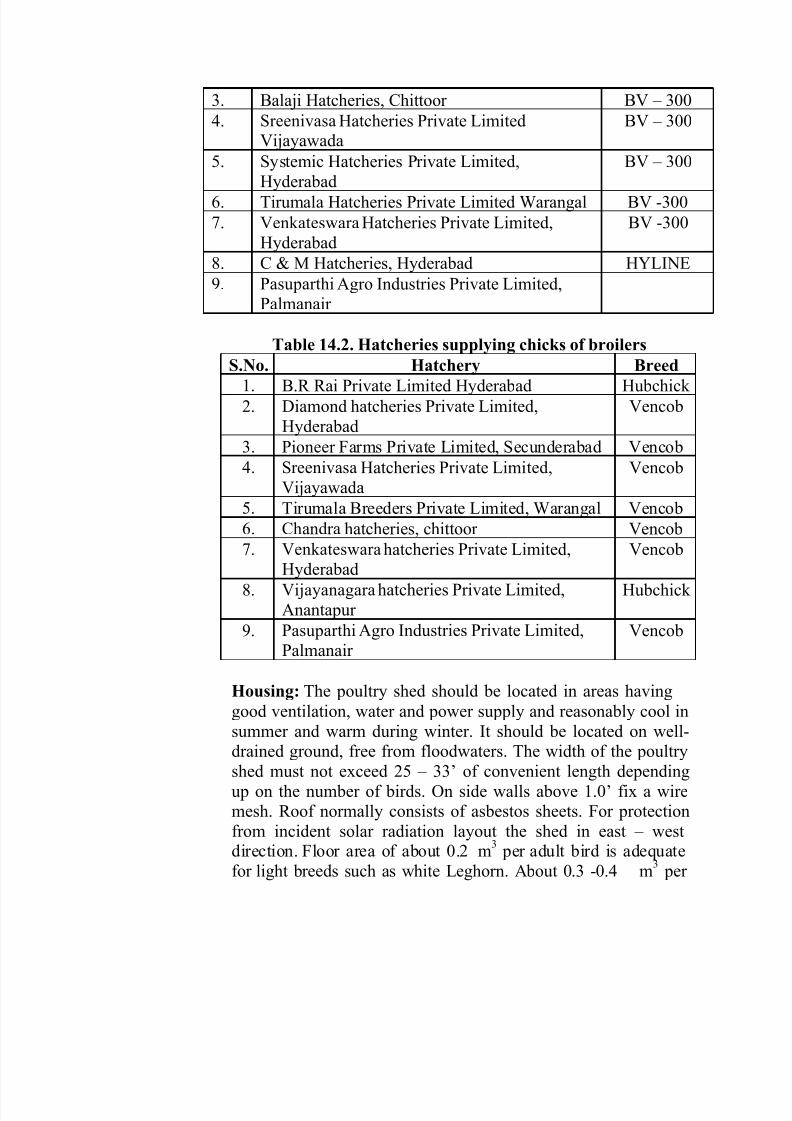
7/30/2019 Farming Systems and Sustainable Agriculture
http://slidepdf.com/reader/full/farming-systems-and-sustainable-agriculture 127/149
Table 14.2. Hatcheries supplying chicks of broilers
Housing: The poultry shed should be located in areas havinggood ventilation, water and power supply and reasonably cool insummer and warm during winter. It should be located on well-
drained ground, free from floodwaters. The width of the poultryshed must not exceed 25 – 33’ of convenient length dependingup on the number of birds. On side walls above 1.0’ fix a wiremesh. Roof normally consists of asbestos sheets. For protectionfrom incident solar radiation layout the shed in east – west
m3
direction. Floor area of about 0.2 per adult bird is adequatem
3for light breeds such as white Leghorn. About 0.3 -0.4 per
S.No. Hatchery Breed
1. B.R Rai Private Limited Hyderabad Hubchick 2. Diamond hatcheries Private Limited,
HyderabadVencob
3. Pioneer Farms Private Limited, Secunderabad Vencob
4. SreenivasaHatcheries Private Limited,Vijayawada
Vencob
5. Tirumala Breeders Private Limited, Warangal Vencob6. Chandra hatcheries, chittoor Vencob
7. Venkateswarahatcheries Private Limited,
Hyderabad
Vencob
8. Vijayanagara hatcheries Private Limited,Anantapur
Hubchick
9. PasuparthiAgro Industries Private Limited,Palmanair
Vencob
3. Balaji Hatcheries, Chittoor BV – 300
4. SreenivasaHatcheries Private LimitedVijayawada
BV – 300
5. Systemic Hatcheries Private Limited,
Hyderabad
BV – 300
6. Tirumala Hatcheries Private Limited Warangal BV -300
7. VenkateswaraHatcheries Private Limited,Hyderabad
BV -300
8. C & M Hatcheries, Hyderabad HYLINE
9. PasuparthiAgro Industries Private Limited,Palmanair
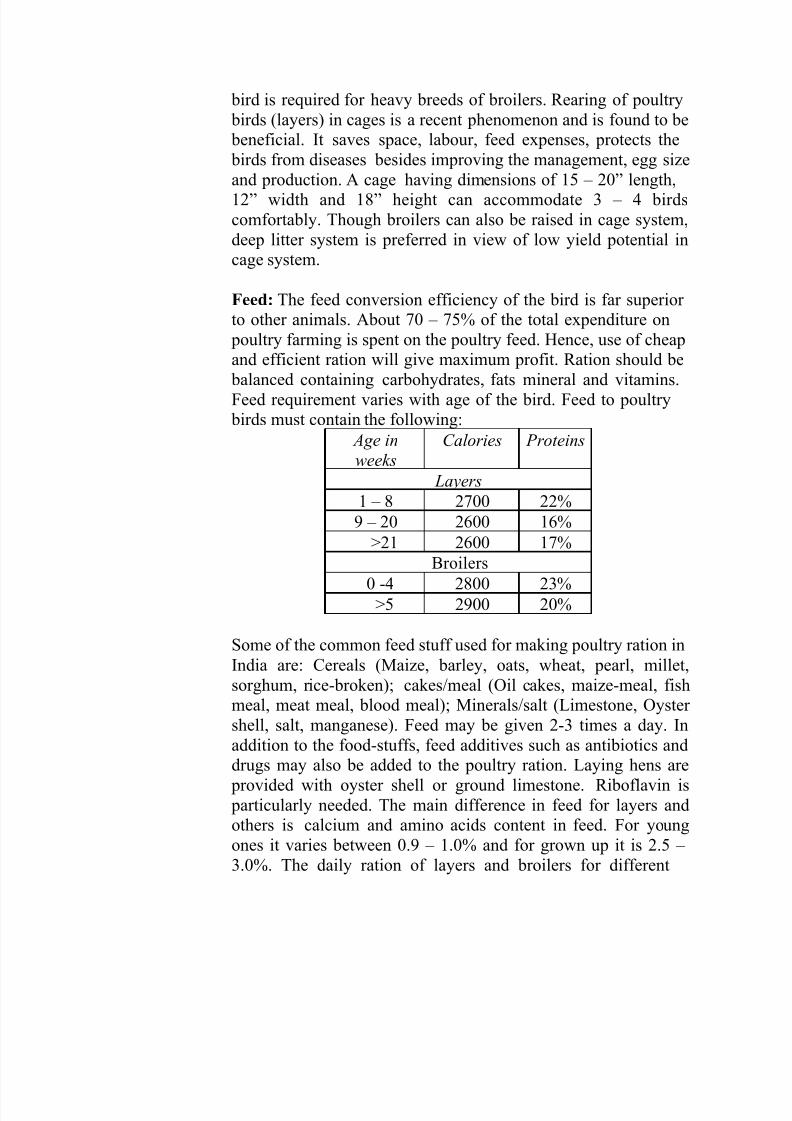
7/30/2019 Farming Systems and Sustainable Agriculture
http://slidepdf.com/reader/full/farming-systems-and-sustainable-agriculture 128/149
bird is required for heavy breeds of broilers. Rearing of poultry birds (layers) in cages is a recent phenomenon and is found to be beneficial. It saves space, labour, feed expenses, protects the birds from diseases besides improving the management, egg sizeand production. A cage having dimensions of 15 – 20” length,12” width and 18” height can accommodate 3 – 4 birdscomfortably. Though broilers can also be raised in cage system,deep litter system is preferred in view of low yield potential incage system.
Feed: The feed conversion efficiency of the bird is far superior to other animals. About 70 – 75% of the total expenditure on
poultry farming is spent on the poultry feed. Hence, use of cheapand efficient ration will give maximum profit. Ration should be
balanced containing carbohydrates, fats mineral and vitamins.Feed requirement varies with age of the bird. Feed to poultry
birds must contain the following:
Some of the common feed stuff used for making poultry ration inIndia are: Cereals (Maize, barley, oats, wheat, pearl, millet,sorghum, rice-broken); cakes/meal (Oil cakes, maize-meal, fishmeal, meat meal, blood meal); Minerals/salt (Limestone, Oyster shell, salt, manganese). Feed may be given 2-3 times a day. Inaddition to the food-stuffs, feed additives such as antibiotics and
drugs may also be added to the poultry ration. Laying hens are provided with oyster shell or ground limestone. Riboflavin is particularly needed. The main difference in feed for layers andothers is calcium and amino acids content in feed. For youngones it varies between 0.9 – 1.0% and for grown up it is 2.5 – 3.0%. The daily ration of layers and broilers for different
Age in
weeks
Calories Proteins
Layers
1 – 8 2700 22%
9 – 20 2600 16%
>21 2600 17%
Broilers0 -4 2800 23%
>5 2900 20%
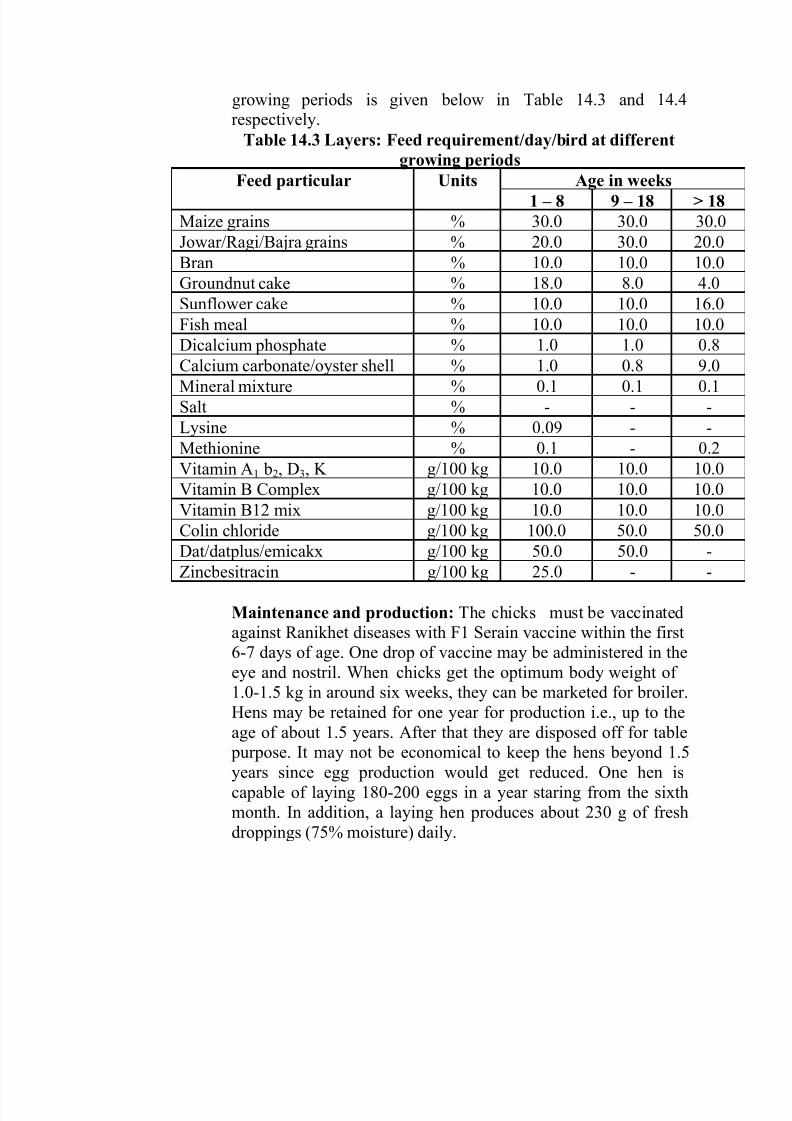
7/30/2019 Farming Systems and Sustainable Agriculture
http://slidepdf.com/reader/full/farming-systems-and-sustainable-agriculture 129/149
growing periods is given below in Table 14.3 and 14.4respectively.
Table 14.3 Layers: Feed requirement/day/bird at different
growing periods
Maintenance and production: The chicks must be vaccinatedagainst Ranikhet diseases with F1 Serain vaccine within the first6-7 days of age. One drop of vaccine may be administered in theeye and nostril. When chicks get the optimum body weight of 1.0-1.5 kg in around six weeks, they can be marketed for broiler.Hens may be retained for one year for production i.e., up to theage of about 1.5 years. After that they are disposed off for table
purpose. It may not be economical to keep the hens beyond 1.5years since egg production would get reduced. One hen iscapable of laying 180-200 eggs in a year staring from the sixthmonth. In addition, a laying hen produces about 230 g of freshdroppings (75% moisture) daily.
Feed particular Units Age in weeks1 – 8 9 – 18 > 18
Maize grains % 30.0 30.0 30.0
Jowar/Ragi/Bajra grains % 20.0 30.0 20.0
Bran % 10.0 10.0 10.0Groundnut cake % 18.0 8.0 4.0
Sunflower cake % 10.0 10.0 16.0
Fish meal % 10.0 10.0 10.0
Dicalcium phosphate % 1.0 1.0 0.8
Calcium carbonate/oyster shell % 1.0 0.8 9.0
Mineralmixture % 0.1 0.1 0.1
Salt % - - -
Lysine % 0.09 - -
Methionine % 0.1 - 0.2
Vitamin A1 b2, D3, K g/100 kg 10.0 10.0 10.0
Vitamin B Complex g/100 kg 10.0 10.0 10.0
Vitamin B12 mix g/100 kg 10.0 10.0 10.0
Colin chloride g/100 kg 100.0 50.0 50.0
Dat/datplus/emicakx g/100 kg 50.0 50.0 -
Zincbesitracin g/100 kg 25.0 - -
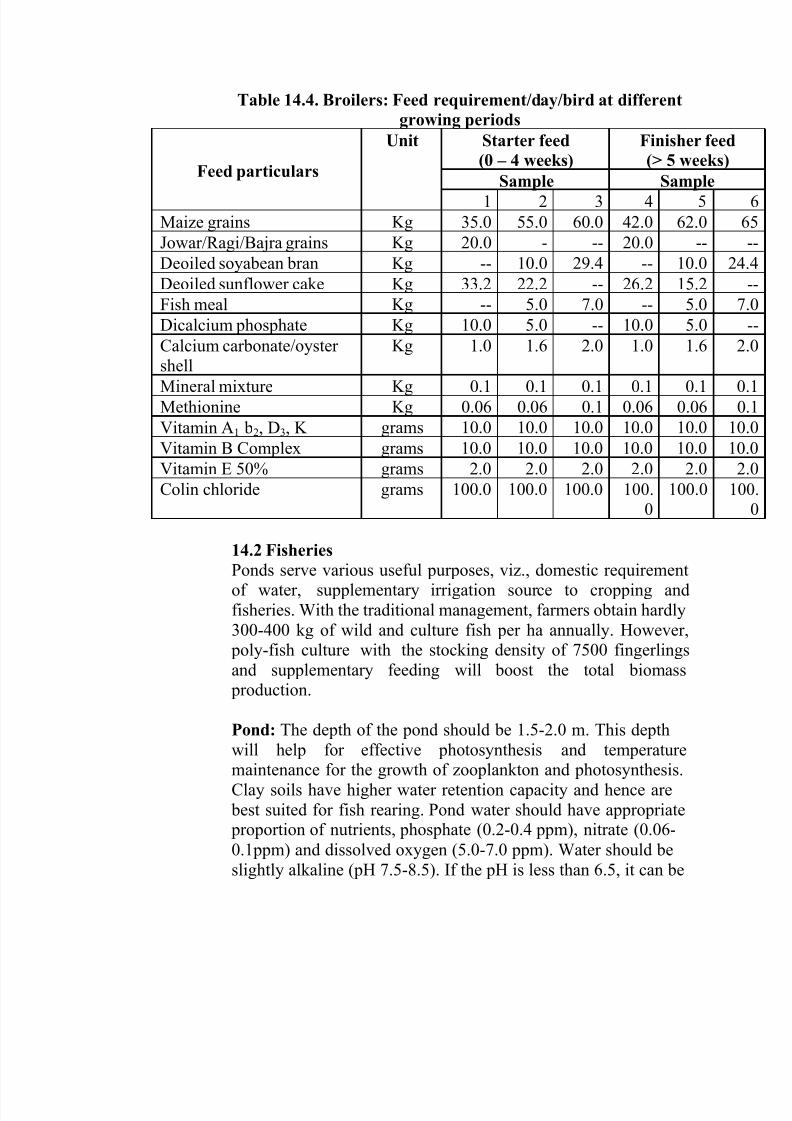
7/30/2019 Farming Systems and Sustainable Agriculture
http://slidepdf.com/reader/full/farming-systems-and-sustainable-agriculture 130/149
Table 14.4. Broilers: Feed requirement/day/bird at different
growing periods
14.2 Fisheries
Ponds serve various useful purposes, viz., domestic requirementof water, supplementary irrigation source to cropping andfisheries. With the traditional management, farmers obtain hardly300-400 kg of wild and culture fish per ha annually. However,
poly-fish culture with the stocking density of 7500 fingerlingsand supplementary feeding will boost the total biomass
production.
Pond: The depth of the pond should be 1.5-2.0 m. This depth
will help for effective photosynthesis and temperaturemaintenance for the growth of zooplankton and photosynthesis.Clay soils have higher water retention capacity and hence are
best suited for fish rearing. Pond water should have appropriate proportion of nutrients, phosphate (0.2-0.4 ppm), nitrate (0.06-0.1ppm) and dissolved oxygen (5.0-7.0 ppm). Water should beslightly alkaline (pH 7.5-8.5). If the pH is less than 6.5, it can be
Feed particulars
Unit Starter feed
(0 – 4 weeks)
Finisher feed
(> 5 weeks)
Sample Sample1 2 3 4 5
Maize grains Kg 35.0 55.0 60.0 42.0 62.0
Jowar/Ragi/Bajra grains Kg 20.0 - -- 20.0 --
Deoiled soyabean bran Kg -- 10.0 29.4 -- 10.0
Deoiled sunflower cake Kg 33.2 22.2 -- 26.2 15.2
Fish meal Kg -- 5.0 7.0 -- 5.0
Dicalcium phosphate Kg 10.0 5.0 -- 10.0 5.0
Calcium carbonate/oyster shell
Kg 1.0 1.6 2.0 1.0 1.6
Mineralmixture Kg 0.1 0.1 0.1 0.1 0.1
Methionine Kg 0.06 0.06 0.1 0.06 0.06
Vitamin A1 b2, D3, K grams 10.0 10.0 10.0 10.0 10.0
Vitamin B Complex grams 10.0 10.0 10.0 10.0 10.0
Vitamin E 50% grams 2.0 2.0 2.0 2.0 2.0
Colin chloride grams 100.0 100.0 100.0 100.
0
100.0
7/30/2019 Farming Systems and Sustainable Agriculture
http://slidepdf.com/reader/full/farming-systems-and-sustainable-agriculture 131/149
adjusted with the addition of lime at an interval of 2-3days.Higher pH (>8.5) can be reduced with the addition of gypsum.Application of fresh dung may also reduce high pH in the water.Organic manure such as FYM and poultry droppings may also beapplied to promote the growth of phyto and zooplankton. Thearea allocated for pond in rice – fish – poultry farming systemvaries between 10 – 33%.
Species of fish:
1. Among the Indian major carps, Catla (Catla catla)is the fast growing fish. It consumes a lot of vegetation and decomposing higher plants.mainly a surface feeder.Rohu ( Labeo rohita) is a column feeder and
on growing plants decomposing vegetation,colonial algae, zooplankton and detritus to aextent.
It is
2. feeds
largesmall
3. Calbasu ( Labea calbasu) is a bottom feeder ondetritus. Mrigal (Cirrhimus mrigale) is also a bottomfeeder, taking dertritus on a large content, diatoms,filamentous and other algae and higher plants.Common carp (Cyprinus carpio) is a bottom feeder and omnivorous.
4. Silver carp ( Hypophthalmichlthya malitrix) ismainly a surface and phytoplankton feeder and alsofeeds on microplants.Grass carp (Cyernus carpia) is a specialized feeder on aquatic plants, cut grass and other vegetablematter. It is also a fast growing exotic fish.
5.
Poly fish culture: The phytophagous fish (Catla, Rohu andMrigal) can be combined with omnivorous (Common Carp),Plankton-feed (Silver Carp) and Mud-eaters (Mrigal and
Calbasu) in a composite fish culture system. For example acombination of silver carp (surface feeder), Mrigal (bottomfeeder), rohu (column feeder), and grass carp (specializedfeeder on aquatic plants) can be successfully used in the ratioof 4:3:2:1 in poly fish culture. The recommended stockingdensity is 7500 fingerlings/ha
7/30/2019 Farming Systems and Sustainable Agriculture
http://slidepdf.com/reader/full/farming-systems-and-sustainable-agriculture 132/149
Management: The fish are to be nourished throughsupplementary feeding of rice bran, oil seed cakes and poultryexcreta. This will enable faster growth and better yield. Thisstocking density will enable to get maximum yield of 2000 to5000 kg/ha of fish annually.
14.3. Bee keeping (Apiculture)
Bee keeping is one of the most important agro-basedindustries, which does not require any raw material from theartisan like other industries. Nectar and pollen from flowersare the raw materials, which are available in plenty in nature.
Species : There are three species, Apis cerana indica (IndianBee), Apis dorsata (Rock bee) and Apis mellifera, (ItalianBee), ar e complentary to each other but have differentadaptations. A. cerana is better acclimatized to higher altitudes of the Himalayan region. A. mellifera & Apis
dorsata is more profitable in the plains.
Management: The bee-keeper should be familiar with thesource of nectar and pollen within his locality. The mostimportant sources are nectar and pollen. The sources of nectar are Tamarind, Mango, Guava and most of the fruit crops.Whereas the sources of pollen include crops such as maize,sorghum & other millets, bulrush, sunflower and palm tree.The plants which will provide nectar and pollen for honey
bees are known as bee pasturages. The bee keeping activitymust begin with flowering season. The beginner should startwith 2 and not more than 5 colonies. A minimum of 2colonies is recommended because in the event of somemishap, such as the loss of the queen occurring in one,
advantage may be taken with the other.The bees are reared in beehives viz., Newtons beehive,Longstroth beehive. The beehive consists of floor-board,
brood chamber, super chamber, top cover, inner cover, framesand entrance rod. These parts can easily be separated. Thehive may be double walled or single walled. The singlewalled hive is light and cheap.
7/30/2019 Farming Systems and Sustainable Agriculture
http://slidepdf.com/reader/full/farming-systems-and-sustainable-agriculture 133/149
The most suitable time for commencing bee keeping in alocality is the arrival of the swarming season. Swarming is anatural tendency of bees to divide their colonies under conditions that are generally favourable for the survival of
both parent colony and the swarm. The castes of bees includequeen, king & droves. This occurs during the late spring or early summer.
Honey collection: Honey should have good quality to meetthe national and international standards. Qualities such asaroma, colour, consistency and floral sources are important.Proper honey straining and processing are needed to improve the
quality of the produce. Honey varies in the proportion of itsconstituents owing to the differences in the nectar produced
by different plants. The nectar collected by bees is processedand placed in comb cells for ripening. During the ripening,sucrose is converted into glucose and fructose by an enzymecalled invertase which is added to it by the bees. Honey is anexcellent energy food with an average of about 3500 calories
per kg. It is directly absorbed into the human blood stream,requiring no digestion.
***
7/30/2019 Farming Systems and Sustainable Agriculture
http://slidepdf.com/reader/full/farming-systems-and-sustainable-agriculture 134/149
LECTURE NO. 15
STUDY OF ALLIED ENTERPRISES – III
(SERICULTURE AND AGROFORESTRY
SYSTEMS)
15.1 Sericulture
Sericulture is an agro-industry, the end product of which issilk Sericulture involves thee activities viz., Mulberrycultivation, Silkworm rearing, Reeling fo the silk from thecocoons formed by the worms. The first two activities are
basicallydifferent
producer
agriculture in nature and the later is an industry of financial investments. India is the second largestof mulberry silk after china. It currently produces
about 1, 27,495 tons of reeling cocoons and 14,048 tonnes of raw silk from a mulberry cropped area of 2,82,244 ha. Thesericulture is practiced in India both in tropical (Karnataka,Andhra Pradesh, Tamilnadu and West Bengal) andtemperate(Jammu and Kashmir)climates. The mulberry silk goods produced in India are mainly exported to USA,Germany, United Kingdom, France, Italy, Singapore, Canada,UAE, Switzerland, Netherlands, Spain, Japan, Thailand etc.
15.1.1.Moriculture: Cultivation of mulberry plants is called
as moriculture. Morus is the Latin word for mulberry. Themulberry plant is exploited for commercial production of silk,since it constitutes the chief food for mulberry silkworm,
Bombyx mori . Mulberry leaf protein is the source for thesilkworm to bio-synthesize the silk, which is made up of two
proteins, fibroin and sericin. Nearly 70 per cent to the silk proteins produced by a silkworm are directly derived from the proteins of the mulberry leaves. There are about 20 species of mulberry, of which four are commonly cultivated. They are
Morus alba, M. Indica, M. Serrata and M. latifolia. It can becultivated on wide range of soils. The recommended NPK dose is 120 – 50 – 50 kg/ha under rain fed and 300 -120 – 120kg/ha under irrigated conditions. The important mulberryvarieties are Kanva-2 (M5), S13, S30, S36, S41, S54, DD, V1 andAnanta. A spacing of 90 cm X 90 cm under rainfed conditions(pit method) and 120cm x 60cm under irrigated conditions is
7/30/2019 Farming Systems and Sustainable Agriculture
http://slidepdf.com/reader/full/farming-systems-and-sustainable-agriculture 135/149
commonly followed. It is mainly propagated by cuttings. The planting season is July – August. The crop can yield well for 12 years, after which they are pulled out and fresh planting isdone yield of mulberry leaves is 30-40 t/ha/year.
15.1.2.Silk worm rearing
There are four types of silk worms viz., mulberry silk worm – Bombyx mori, Eri silk worm – Philosamia ricini, Tassar silk worm – Antheraea mylitta, Muga silk worm – Antheraea
assama. The silkworm is reared in a rearing house.Maintenance of proper temperature (24 – 28 0C) andhumidity (70 – 85%) depending upon the silkworm stage (i.e.,instar) is very essential. Initially the disease free layings(DFLS) or egg cards are collected from a Government
Grainage and kept for hatching in a dark and cool place. OneDFL is equivalent to 400 eggs. After hatching brushing isdone which is defined as transferring of hatched larvae intorearing trays. The rearing trays usually made up of
bamboo/plastic. The space requirement for 100 DFLs variesm
21
st1
stm
2from 4 -14 during during instar to 181 – 360during 5
thinstar. The newly hatched larvae after one hour of
hatching get ready to feed on mulberry leaves. The leaf
requirement of growing silkworms is estimated at 2-4kg
during 1
st
instar to 600 650 kg during 5
th
instar for 100 DFLs.During the first three instars (which is known as chawkirearin the silkworms are fed with tender cho ed leaves,
4th
5th
while during the late age rearing i.e., and instar theworms are fed with entire leaves without any chopping.
5th
4th
During the instar i.e., after 5 days of the moult thesilkworm becomes fully matured and ready to spin into acacoon. This is the last stage of rearing operation. After thisstage the mature silkworms are transferred on to the cocoonframes or mountages for spinning of cocoons. The mountages
are popularly known as chandrke. Each chandrika canaccommodate 1000 – 1200 worms depending upon thesilkworm race. The spinning activity is completed within 2days and the larvae enter into pupal stage which lasts for 6 -7days. Within a week the cocoons are harvested and sent for stifling (killing of pupae before emergence) and storage.
7/30/2019 Farming Systems and Sustainable Agriculture
http://slidepdf.com/reader/full/farming-systems-and-sustainable-agriculture 136/149
On an average the cacoon yield is estimated at 55 to 60 kgfor 100 DFLs per crop. Normally 5 to 6 crops are taken per annum. The length of silk filament per cacoon is about 350meter in Indian multivoltine, whereas it is about 1800 m incase of Japanese bivoltine race.
15.2 Agro-forestry
Agro-forestry may be defined as an integrated self sustained land management system, which involves deliberateintroduction/retention of woody components with agriculturalcrops including pasture/livestock, simultaneously or sequential on the same unit of land, meeting the ecologicaland socio-economic needs of people. An Agro-forestrysystem is more acceptable than tree farming alone, since the
intercropped annuals regulate income when the tress are tooyoung to yield beneficial produce. On the other hand, maturetrees bring about more stability in the system because of their innate ability to withstand destructive aberrations in rainfall.Their perennial character helps make use of the non-seasonalrains. In addition an agro-forestry system provides to variedneeds of the farmer – food, fuel, fodder and employment.Some Agro-forestry systems (agri-horticulture) enhanceemployment opportunities by spreading labour needs whichotherwise are concentrated in the cropping season. Importantagro-forestry systems relevant to farming systems approachare discussed below.
15.2.1.Agrisilviculture – In this system agricultural crops areintercropped with tree crops in the interspaces available
between trees. Tree component gives fodder, fuel and timber including green leaf manure. It is ideal for Class IV soils of dry lands with annual rainfall around 750 mm. The positiveassociative effect of Leucaena leucocephala and Sesbania
aegyptica has been found in crops like hybrid Napier,Lucerne, oat and several other cereal forages.
15.2.2 Silvi-pastoral system – The system is primarily meantfor augmenting the scarce food supply. It integrates pastureand/or animals with tress. In Marginal lands (Class IVonwards), this system promotes sustainability via resource
7/30/2019 Farming Systems and Sustainable Agriculture
http://slidepdf.com/reader/full/farming-systems-and-sustainable-agriculture 137/149
conservation and its efficient use, improvement in soil qualityand by linking agriculture with cattle.
15.2.3 Agri-silvipastoral system – The system integratescrop and /or animal with trees. Woody perennials preferablyof fodder value are introduced deliberately. Such systems can
be used for food production and soil conservation besides providing fodder and fuel. It may be tree-livestock crop mixaround homestead, wood-hedge rows for browsing, green-leaf manure and soil conservation or for an integrated productionof pasture, crops animals and wood.
15.2.4 Agri-horticultural system – It is one form of agro-forestry in which tree component is fruit tree. It is also called
as food-cum-fruit system. In which short duration arablecrops are raised in the interspaces of fruit trees. Some of thefruit trees that can be considered are guava, pomegranate,custard apple, sapota and mango. Pulses are the importantarable crops for this system. However, depending upon therequirements, others like sorghum and pearl millet can begrown in the interspaces of fruit trees. Reasons for this systemnot being widely adopted are:
• Economic position of farmers may not permit awaiting
income for 5-6 yearsWatering of fruit trees, till their establishment is a problemin summer period
Marketing problems for perishable horticultural produce
•
•
15.2.5 (a) . Horti/silvipastoral system- Class IV and abovesoils, uneconomical for arable crop production are termed asnon-arable lands. Horti-Pastoral system is an agro-forestrysystem involving integration of fruit trees with pasture. Whena top feed tree replaces fruit tree, it is called horti-pastoral
system. Guava, custard apple and ber suits well in an horti- pastoral system with grasses like Cenchrus ciliaris (“anjan”),
C.setigerus (birdfoot), Panicum antidotale (blue panic), Dicanthium annulatum (marvel) and Chloris gayana
(Rhodes), and legumes like Stylosanthes hamata, S. scabra(stylo) and Macroptilum atropurpurium (siratro).
7/30/2019 Farming Systems and Sustainable Agriculture
http://slidepdf.com/reader/full/farming-systems-and-sustainable-agriculture 138/149
(b) Top-feed trees ideal for Silvi-pastoral system are:
Acacia nilotica(babul) , Acacia senagel(gum Arabica) ,
Bauhinea purpurea(khairwal) , Dalbergia sissoo(shisham) ,
Gmelina arborea(gummadi teak) , Hardwickia binata(yepi),
Leucaena leucocephala(subabul), Sesbania
grandiflora(avise). Grasses and legumes indicated under horti-passtoral system are also suitable for silvi-pastoralsystem.
15.2.6 Alley cropping
Food crops are grown in alleys formed by hedgerows of trees or shrubs in arable lands. It is also known as “hedgerow”intercropping”. Hedgerows are cut back at about one meter height at planting and kept pruned during cropping to prevent
shading and to reduce competition with food crops. It isrecommended for humid tropics, primarily as an alternative toshifting cultivation. In semi-arid regions of India, alleycropping provides fodder during dry period since mulchingthe crop with hedgerow pruning does not usually contribute toincreased crop production. Advantages of this system are :
• Provision of green fodder during lean period of theyear.
Higher total biomass production per unit area than
arable crops alone.Efficient use of off season precipitation in the absenceof a crop.
Additional employment during off-season.
It serves as a barrier to surface runoff leading to soiland water conservation.
Based on the objectives , three types of alleycropping are recognized(i)Forage alley cropping(ii)Forage-cum-mulching alley system and(iii)Forage-cum-pole system.In all the three systems, crops are grown in alleys andforage obtained from the lopping of hedgerows.However, gross returns are higher in all the alleycropping systems than the sole crop system.
•
•
•
•
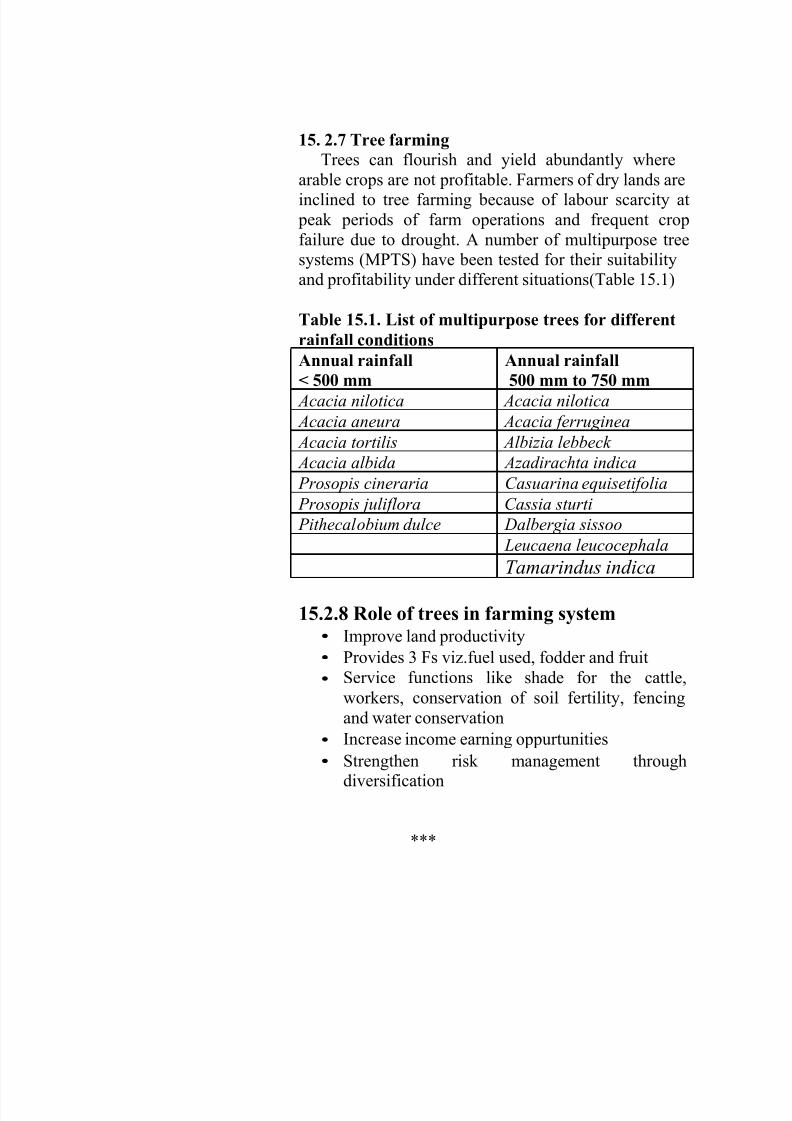
7/30/2019 Farming Systems and Sustainable Agriculture
http://slidepdf.com/reader/full/farming-systems-and-sustainable-agriculture 139/149
15. 2.7 Tree farming
Trees can flourish and yield abundantly wherearable crops are not profitable. Farmers of dry lands areinclined to tree farming because of labour scarcity at
peak periods of farm operations and frequent cropfailure due to drought. A number of multipurpose treesystems (MPTS) have been tested for their suitabilityand profitability under different situations(Table 15.1)
Table 15.1. List of multipurpose trees for different
rainfall conditions
15.2.8 Role of trees in farming system•
•
•
Improve land productivity
Provides 3 Fs viz.fuel used, fodder and fruitService functions like shade for the cattle,workers, conservation of soil fertility, fencingand water conservation
Increase income earning oppurtunities•
• Strengthendiversification
risk management through
***
Annual rainfall
< 500 mm
Annual rainfall
500 mm to 750 mm Acacia nilotica Acacia nilotica
Acacia aneura Acacia ferruginea
Acacia tortilis Albizia lebbeck
Acacia albida Azadirachta indica
Prosopis cineraria Casuarina equisetifolia
Prosopis juliflora Cassia sturti
Pithecalobium dulce Dalbergia sissoo
Leucaena leucocephala
Tamarindus indica
7/30/2019 Farming Systems and Sustainable Agriculture
http://slidepdf.com/reader/full/farming-systems-and-sustainable-agriculture 140/149
LECTURE NO. 16
Bio-Diversity
16.1 Bio-diversity and sustainable Agr i culture
What is Biodiversity?
Biodiversity refers to rich and diverse energy of
living organisms of all species, the genes they contain and the
ecosystem they constitute.
“Biological diversity means the variability among
living organisms from all sources including, interalia, terrestrial,
marine and other aquatic ecosystems and the ecological
complexes of which they are part, this includes diversity with in
species, between species and of ecosystems”
Thus biodiversity is considered at three levels:
genetic diversity
species diversity
ecosystem diversity
a)
b)
c)
a) Genetic diversity refers to the variation of genes between
different populations of a species as well as between
species.
Species/organismal diversity refer to the variety of living
species.
b)
7/30/2019 Farming Systems and Sustainable Agriculture
http://slidepdf.com/reader/full/farming-systems-and-sustainable-agriculture 141/149
c) Ecosystem biodiversity relates to the variety of habitats,
biotic communities and ecological processes and the
enormous diversity present within ecosystems interms of
habitat differences and the variety of ecological processes.
16.2 Importance of biodivers ity
Biodiversity is recognized as the most important natural
resources, it directly and indirectly influences and regulates the
functioning of the other natural resources of soil, water and air in
the ecosystem.
Humans derive all of their food almost 40 percent of their
medicines, and industrial products from the wild and
domesticated components of biological diversity.
16.3 Human Impact on Biodiversity
Human interventions can alter biodiversity directly and
indirectly through changes in land, water and atmosphere.
Human impact is greater than that of most natural processes that
lead to a decline in biodiversity. The most significant human
impact on biodiversity and also the earliest was the
domestication of plants and animals for food which started more
than 10,000 years ago.
The root cause of human-induced biodiversity loss is
actually the manner in which human society functions in the
7/30/2019 Farming Systems and Sustainable Agriculture
http://slidepdf.com/reader/full/farming-systems-and-sustainable-agriculture 142/149
present global context with respect to its natural resources, trade
and economic systems, and human and social values.
Human activities change biological diversity globally in
two fundamental ways 1) by affecting a globally dynamic system
such as the atmosphere directly and 2) through the collective
consequences of individual effects in various places and at
various times building up to globally significant impact. For
instance, global warming is due to direct excessive emission of
green house gasses from burning fossil fuels as well as to the
cumulative effect of deforestation, land clearance and faculty
agricultural practices in various parts of the world.
16.4 Reduction in B iodiversity and its ecological
Implications
The truly irreversible nature of the loss of species and
genetic diversity is the most serious cause for concern for human
beings. The high intensity and rate of human Intervention
increase the threat of a decrease in species populations. Which
can eventually lead to their extinction. A decline in biodiversity
can result in a perceptible deficiency in the quality and amount
of ecological services provided by nature. Over exploitation of
both natural and man made resources, such as timber extraction
from natural forests and over utilization of crop lands, can lead to
the disruption of ecosystem services and increased costs.
7/30/2019 Farming Systems and Sustainable Agriculture
http://slidepdf.com/reader/full/farming-systems-and-sustainable-agriculture 143/149
16.5 Importance of Agricultural Bio diversity
1.
2.
3.
4.
5.
Recycling of nutrients
Control of microclimate
Regulation of local hydrological processes
Detoxification of waste and toxic chemicals
Regulation of the abundance of desirable
undesirable organisms.
Soil structure
Infiltration and run off Soil erosion
Natural pest and disease control
Pollination and
and
6.
7.
8.
9.
10. Genetic Introgression and hybridization
16.6 Agricultural Intensification & biodiversity
Agricultural activities have three types of impacts on
biodiversity.
1. They alter the characteristics of natural ecosystems and
their constituent species.
They impact the species and genetic variability of the
chooses cultivated species themselves and also their
nonfood components.
The affect on and off farm non food bio diversity through
2.
3.
such adverse physiochemical effects as erosion,
salinization and pesticide pollution. The magnitude of
these impacts varies with the intensity of the intervention.
7/30/2019 Farming Systems and Sustainable Agriculture
http://slidepdf.com/reader/full/farming-systems-and-sustainable-agriculture 144/149
The magnitude of these impacts varies with the intensity
of the intervention.
Population pressure and the concomitant decline in
per capital land availability have made-productivity-
oriented, chemically intensive, high-yielding-variety
monoculture and irrigated agriculture unavoidable in large
parts of the world. This has caused an incalculable loss of
biodiversity both on and off-farm and at all levels.
Thus modern agriculture has evolved as a major
threat to biodiversity in general and to diversity of
importance to agriculture itself.
16.7 Impact of biodiversity reduction on modern
agricultural systems
Species d iversity:- Products of plant origin make
up 93 percent of the human diet and 3000 species are
regularly exploited for food. However modern agriculture
has drastically shrunk the vast food basket provided by
nature and put ot use by humans over thousand of years.
Only 103 species contribute 90 percent of the
world’s plant food supply just three crops Rice, wheat and
maize-account for 90 percent of the calories and 56
percent of the proteins people derive from plants. The
7/30/2019 Farming Systems and Sustainable Agriculture
http://slidepdf.com/reader/full/farming-systems-and-sustainable-agriculture 145/149
other thousands of species contribute the remaining 10
percent of the plant food supply, though they have
considerable importance in the diet of poor people
confined to more isolated areas.
16.8 Reasons for the oversimplificat io n of edible plant
species.
The factors responsible for the adoption of and extremely
limited no. of species for the food security of a large segment of
the global population are diverse: some have been deliberate and
some by default. The discovery and wide spread use of modern
technologies of production such as fertilisers, Pest control
chemicals, mechanization and high-yielding these countries in
terms of production and productivity. Apart from the fact that
these regions are home to much more limited species diversity.
Their commercial and economic insects were saved by the wide
production and a part of a few popular species of crops.
The adoption of similar strategies became unavoidable in
developing to meet the food scarcity.
16.8.1 Genetic erosion
Genetic erosion consists of the loss of genes, gene
complexes and unique combinations of genes that occur in
different land. The primary cause of the less of genetic diversity
of the widely used plant crops and vegetables is the wide speed
7/30/2019 Farming Systems and Sustainable Agriculture
http://slidepdf.com/reader/full/farming-systems-and-sustainable-agriculture 146/149
adoption of a limited number if modern varities that are generally
bred for higher yield, resistance to insect pests and diseases, and
high performance over a range of biophysical environment, thus
reducing the need for specific local adaptations.
Further, advanced methods of cultivation using fertilizers,
irrigation, and pest control chemicals have lowered the demand
for land races, which have evolved largely through careful
selection and area adapted to marginal growing conditions.
Without a rich reserve of varietal diversity, long term
sustainability and food security and livelihoods of poor farmers
in complex, diverse and risk prone areas will be jeopardized.
Modern agricultural production practices have created
tensions related to different aspects of agricultural biodiversity
such as
- Severe reduction in the no. of species of food plants
cultivated.
Loss of genetic diversity of the presently cultivated crops
and vegetables.
Destabilization of pest species in agro ecosystems.
Deficiency in soul biodiversity and
-
-
-
- Erosion of cultural diversity, loss of indigenous
knowledge of traditional farming systems and
environmental degradation.
Thus the immense potential of soil biodiversity for agricultural
productivity and sustainability is still undervalued and needs to
be understood and harnessed. Assigning intellectual property

7/30/2019 Farming Systems and Sustainable Agriculture
http://slidepdf.com/reader/full/farming-systems-and-sustainable-agriculture 147/149
heights to biological materials that have been nurtured and
developed over thousands of years by traditional farmers is a
contentious issue and cannot be divorced from considerations of
human ethics and values.
***
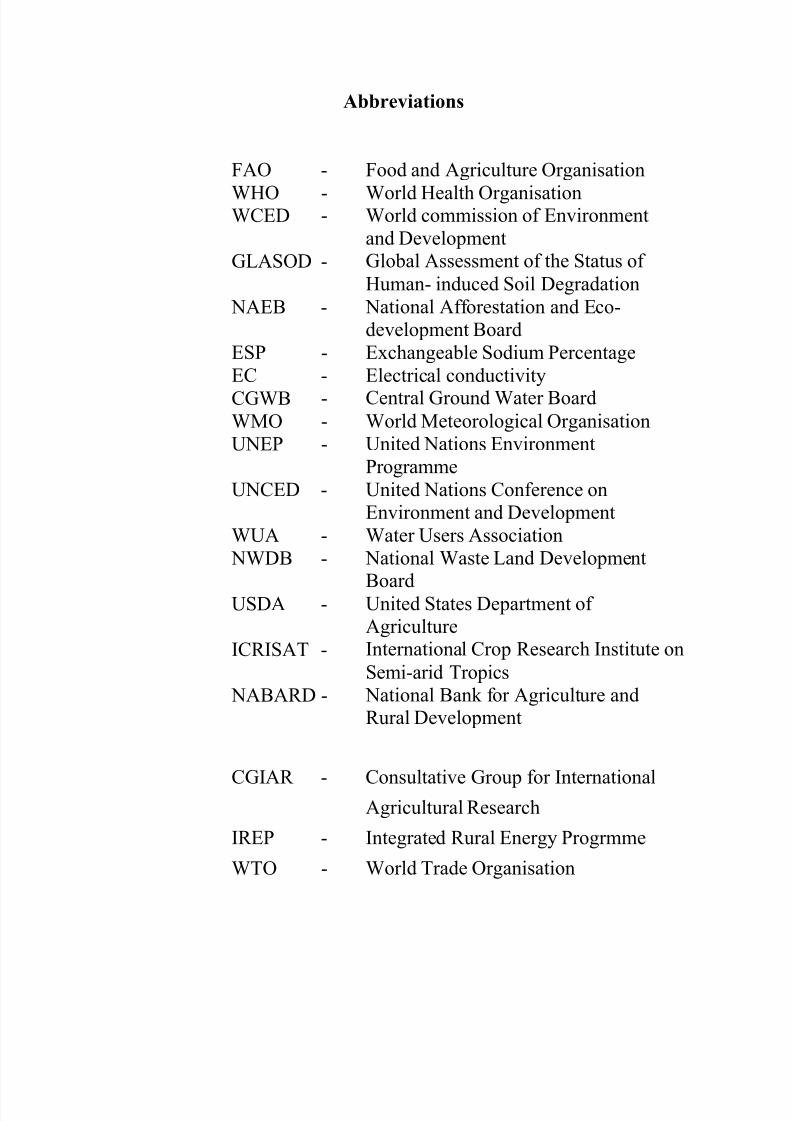
7/30/2019 Farming Systems and Sustainable Agriculture
http://slidepdf.com/reader/full/farming-systems-and-sustainable-agriculture 148/149
Abbreviations
FAO
WHOWCED
-
--
Food and Agriculture Organisation
World Health OrganisationWorld commission of Environmentand DevelopmentGlobal Assessment of the Status of Human- induced Soil Degradation
National Afforestation and Eco-development BoardExchangeable Sodium Percentage
Electrical conductivityCentral Ground Water BoardWorld Meteorological OrganisationUnited Nations EnvironmentProgrammeUnited Nations Conference onEnvironment and DevelopmentWater Users Association
National Waste Land DevelopmentBoardUnited States Department of AgricultureInternational Crop Research Institute onSemi-arid Tropics
National Bank for Agriculture andRural Development
GLASOD -
NAEB -
ESP
ECCGWBWMOUNEP
-
----
UNCED -
WUA NWDB
--
USDA -
ICRISAT -
NABARD -
CGIAR - Consultative Group for International
Agricultural Research
Integrated Rural Energy Progrmme
World Trade Organisation
IREP
WTO
-
-
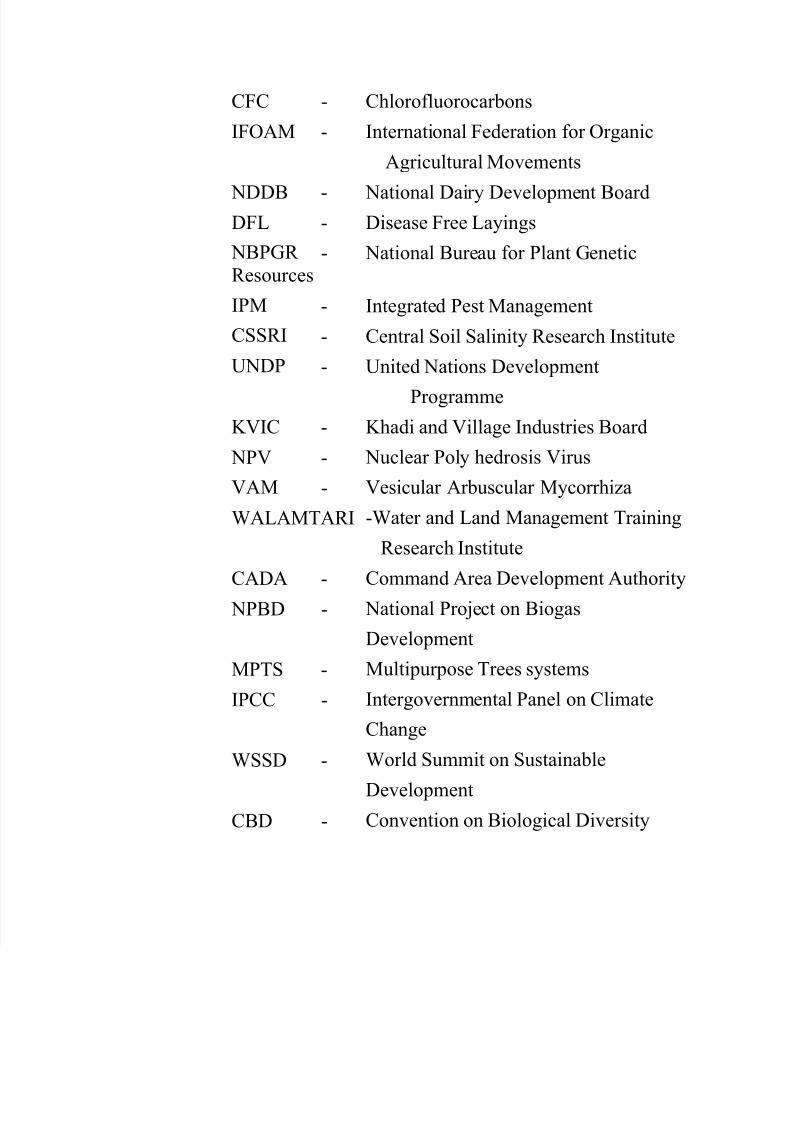
7/30/2019 Farming Systems and Sustainable Agriculture
http://slidepdf.com/reader/full/farming-systems-and-sustainable-agriculture 149/149
CFC
IFOAM
-
-
Chlorofluorocarbons
International Federation for Organic
Agricultural Movements
National Dairy Development Board
Disease Free Layings
National Bureau for Plant Genetic
NDDB
DFL
NBPGR Resources
IPM
CSSRI
UNDP
-
-
-
-
-
-
Integrated Pest Management
Central Soil Salinity Research Institute
United Nations Development
Programme
Khadi and Village Industries Board
Nuclear Poly hedrosis Virus
Vesicular Arbuscular Mycorrhiza
-Water and Land Management Training
KVIC
NPV
VAM
-
-
-
WALAMTARI