Embed Size (px)
Citation preview
Farm-scale modelling of C sequestration and GHG mitigation by shelterbelts: Holos, 3PG and CBM-CFS3 simulations
Amadi, C.*, R. Farrell and K. Van ReesDepartment of Soil Science, University of Saskatchewan, Saskatoon, SK. Canada.
Centre for Northern Agroforestry and Afforestation
Environmental benefits of shelterbelts on agricultural farmlands
Shelterbelts accumulate atmospheric C in plant biomass
Increase soil carbon
Reduce N2O emissions due to deep roots
Increase soil CH4 oxidation
Knowledge gap – Changes on total farm GHG emissions due to the integration of shelterbelts is not well understood
Objective
To assess the impact of five levels of white spruce (Picea
glauca) shelterbelt establishment on the global warming
potential of a model farm after 60 years of cultivation
Farm carbon change Soil N2O emissions Soil CH4 fluxes
Model Farm Information
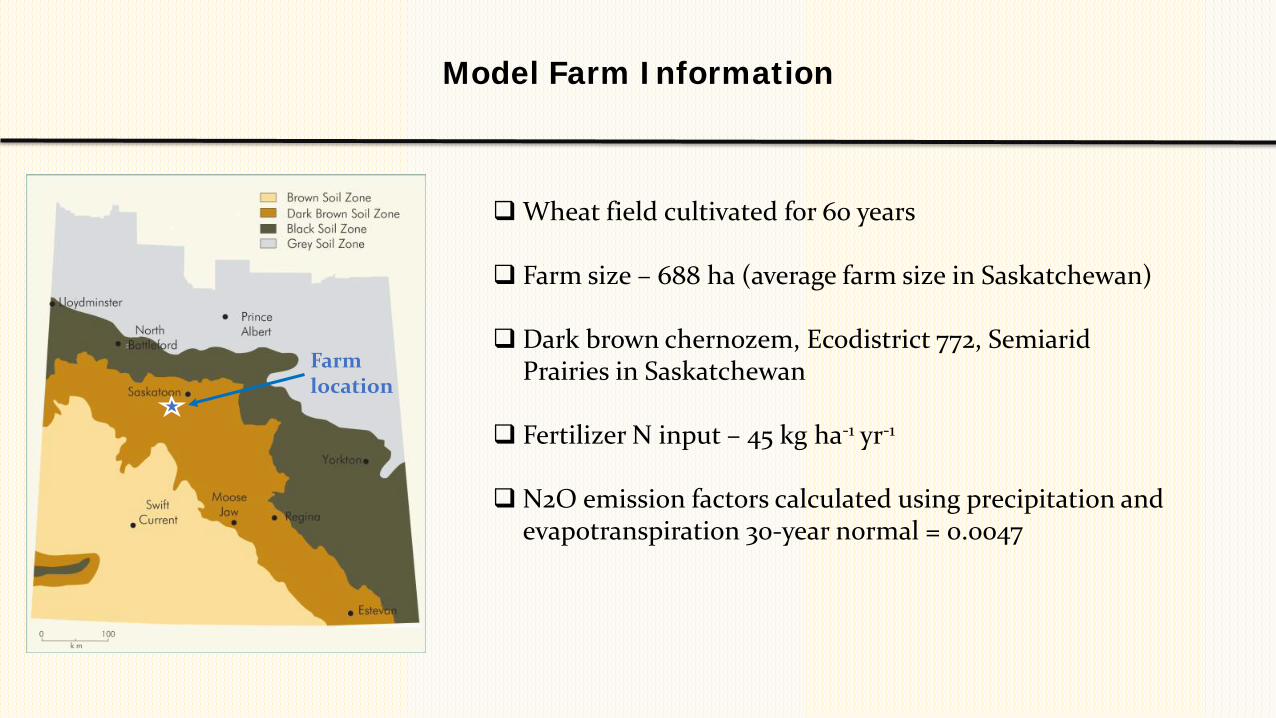
Wheat field cultivated for 60 years
Farm size – 688 ha (average farm size in Saskatchewan)
Dark brown chernozem, Ecodistrict 772, Semiarid Prairies in Saskatchewan
Fertilizer N input – 45 kg ha-1 yr-1
N2O emission factors calculated using precipitation and evapotranspiration 30-year normal = 0.0047
Farm location
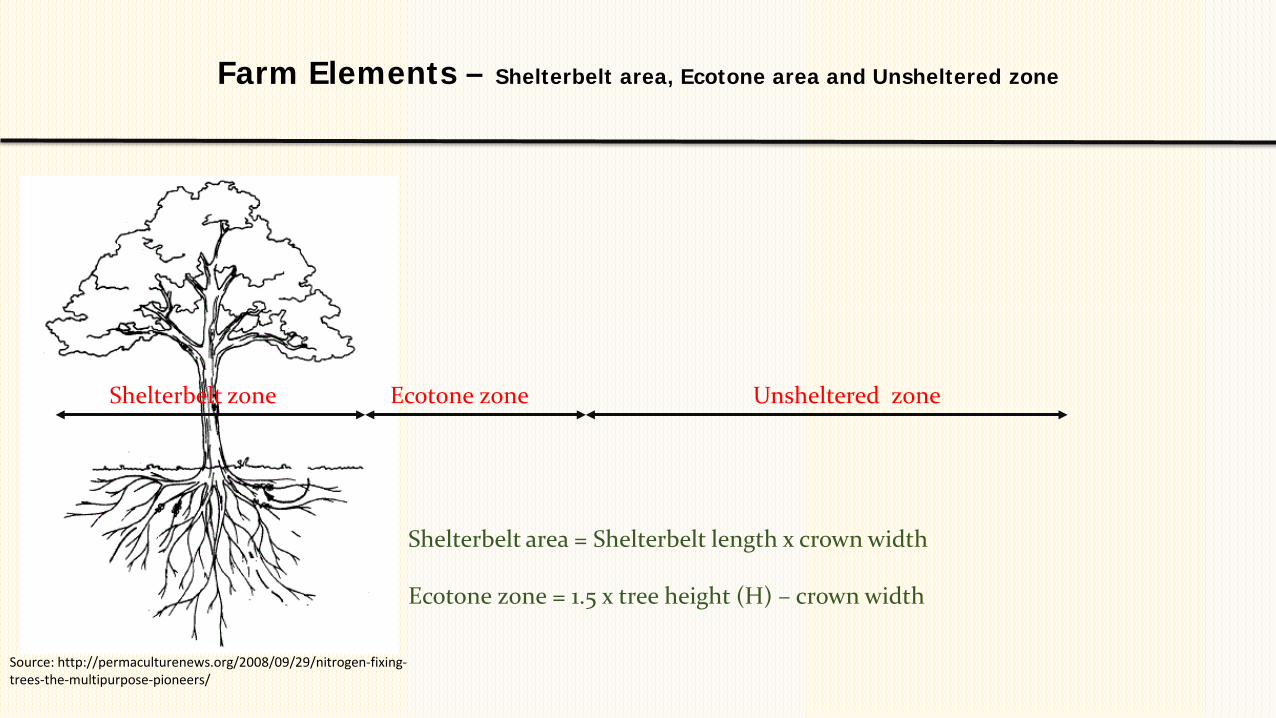
Farm Elements – Shelterbelt area, Ecotone area and Unsheltered zone
Shelterbelt zone Ecotone zone Unsheltered zone
Ecotone zone = 1.5 x tree height (H) – crown width
Shelterbelt area = Shelterbelt length x crown width
Source: http://permaculturenews.org/2008/09/29/nitrogen-fixing-trees-the-multipurpose-pioneers/
Basic Assumptions
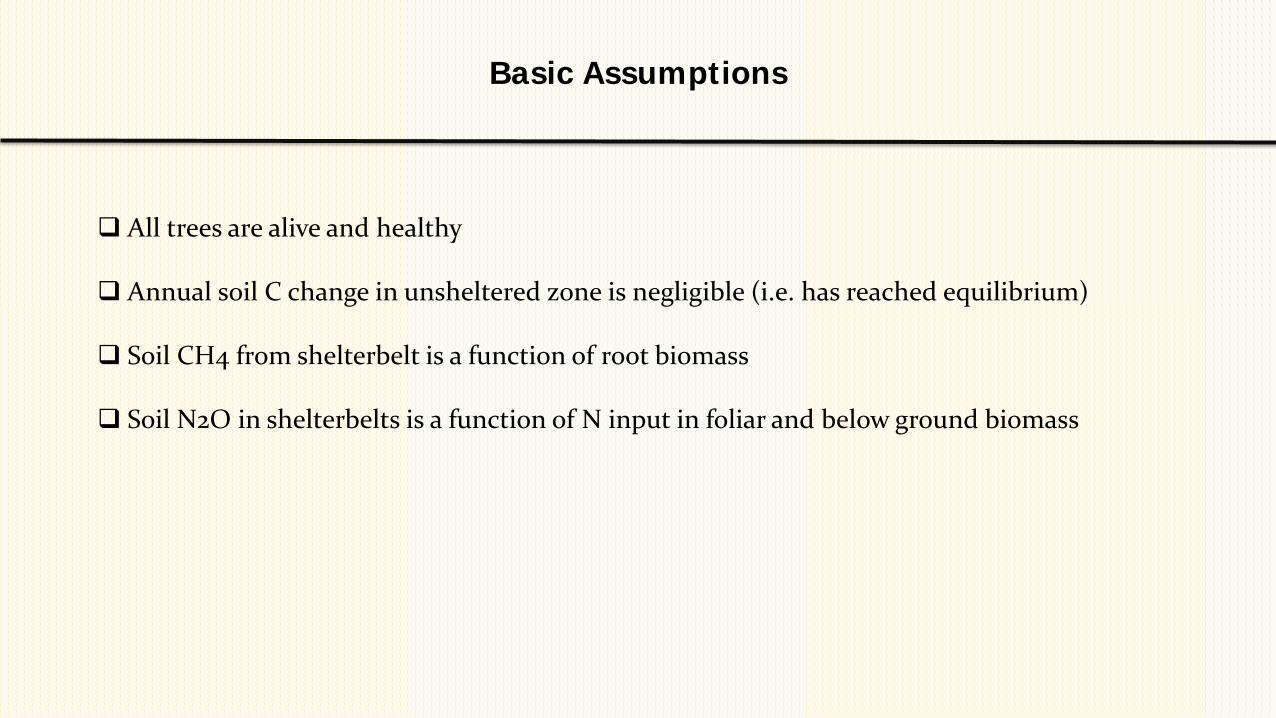
All trees are alive and healthy
Annual soil C change in unsheltered zone is negligible (i.e. has reached equilibrium)
Soil CH4 from shelterbelt is a function of root biomass
Soil N2O in shelterbelts is a function of N input in foliar and below ground biomass
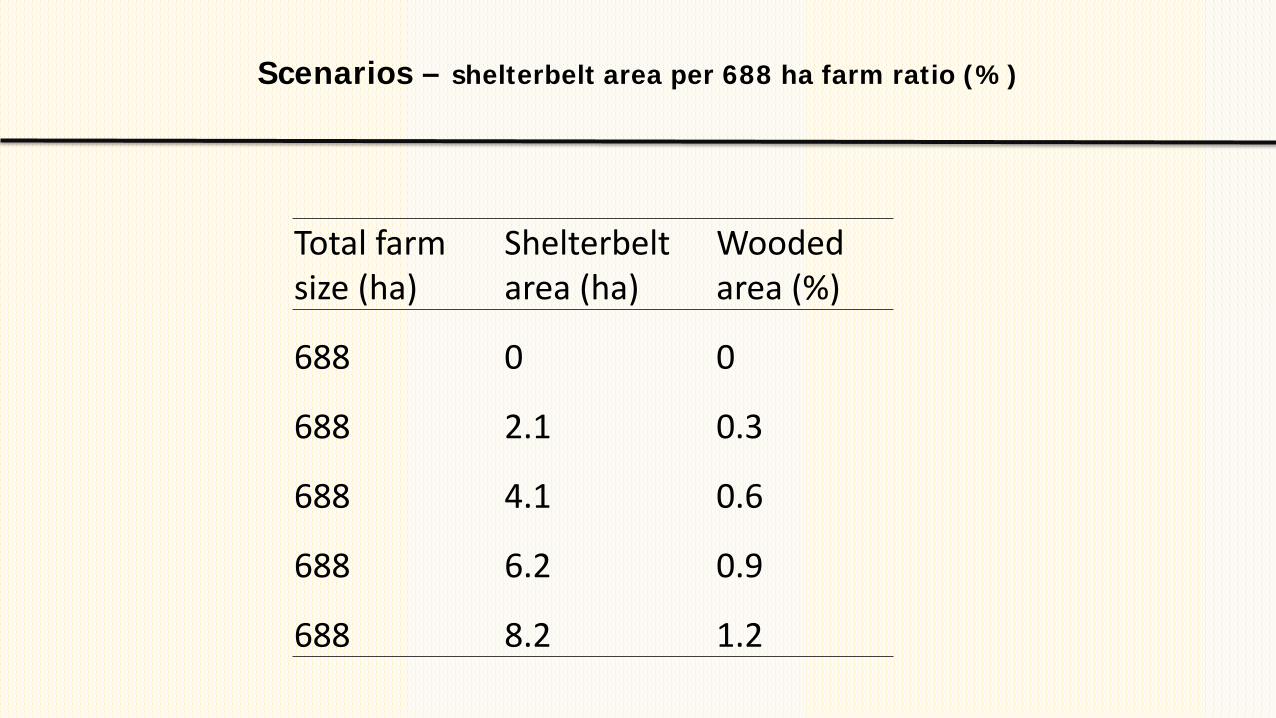
Scenarios – shelterbelt area per 688 ha farm ratio (%)
Total farm size (ha)
Shelterbelt area (ha)
Wooded area (%)
688 0 0
688 2.1 0.3
688 4.1 0.6
688 6.2 0.9
688 8.2 1.2
Farm GHG Models
White spruce Growth – 3PG Model
Soil C simulations – CBM-CFS3 Model
Soil N2O and CH4 emissions – Holos Model
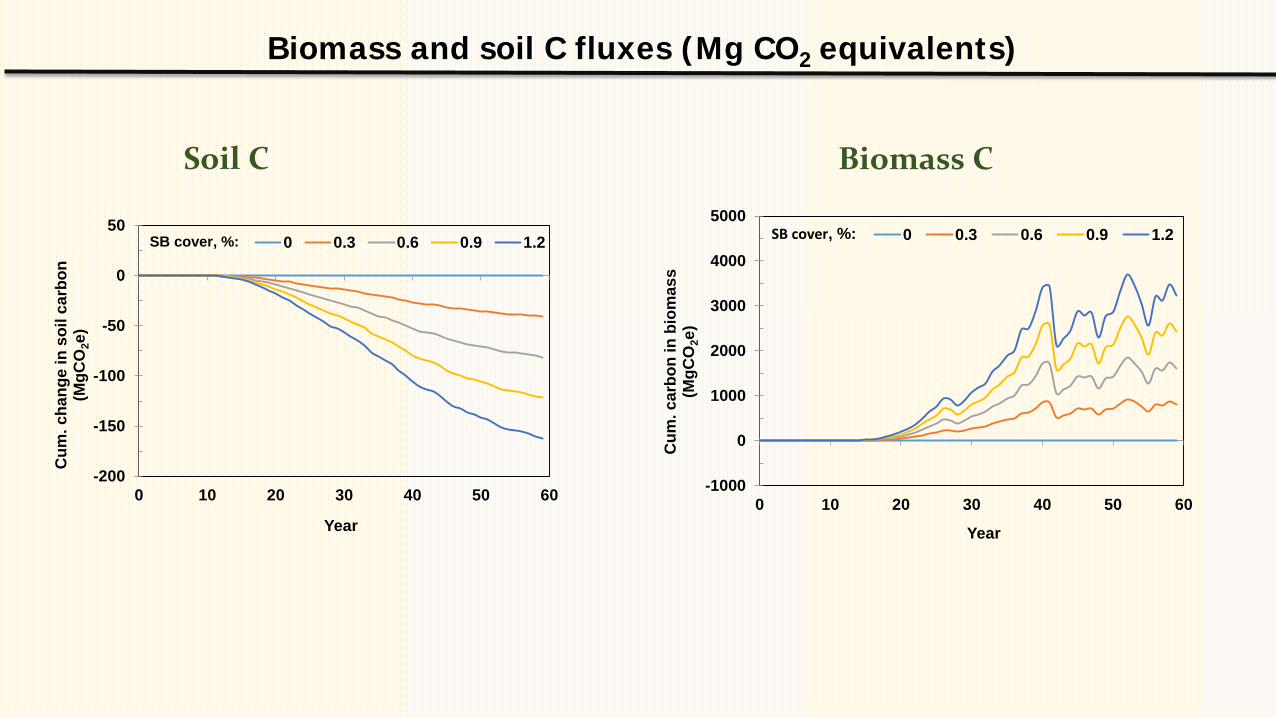
Biomass and soil C fluxes (Mg CO2 equivalents)
-200
-150
-100
-50
0
50
0 10 20 30 40 50 60
Cum
. cha
nge
in s
oil c
arbo
n (M
gCO
2e)
Year
0 0.3 0.6 0.9 1.2SB cover, %:
-1000
0
1000
2000
3000
4000
5000
0 10 20 30 40 50 60
Cum
. car
bon
in b
iom
ass
(MgC
O2e
)
Year
0 0.3 0.6 0.9 1.2SB cover, %:
Biomass CSoil C
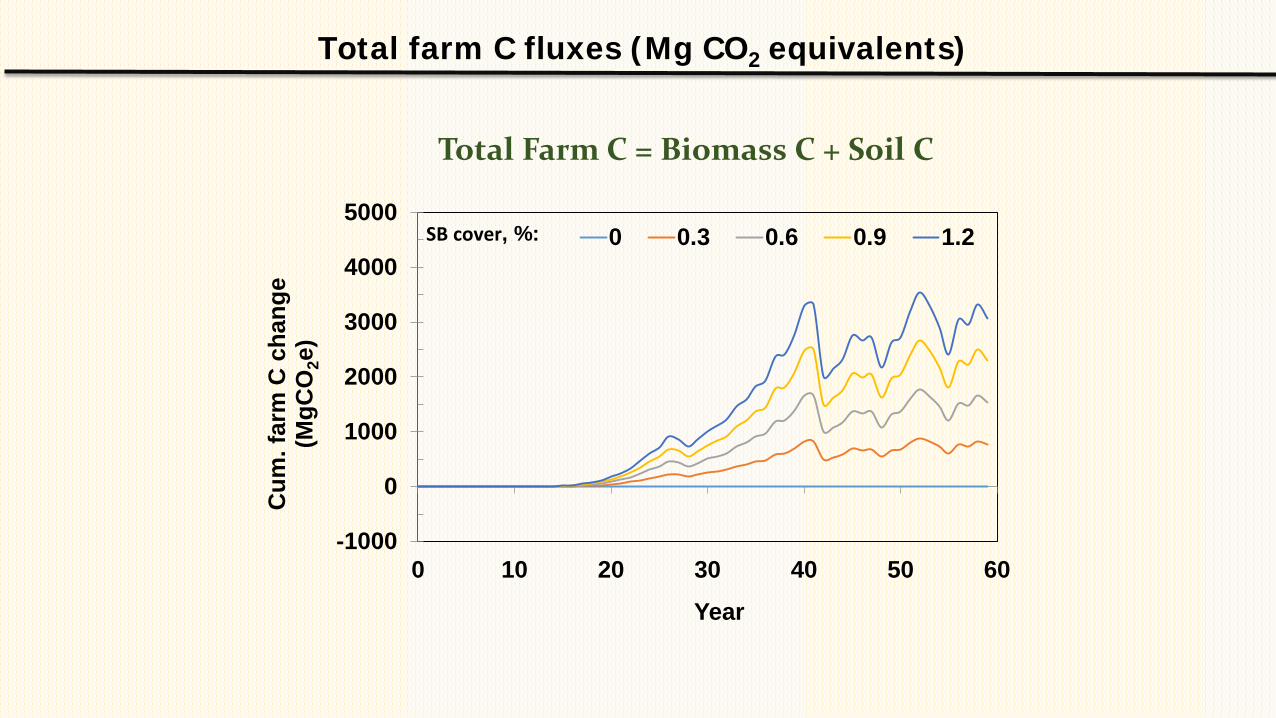
Total farm C fluxes (Mg CO2 equivalents)
-1000
0
1000
2000
3000
4000
5000
0 10 20 30 40 50 60
Cum
. far
m C
cha
nge
(MgC
O2e
)
Year
0 0.3 0.6 0.9 1.2SB cover, %:
Total Farm C = Biomass C + Soil C
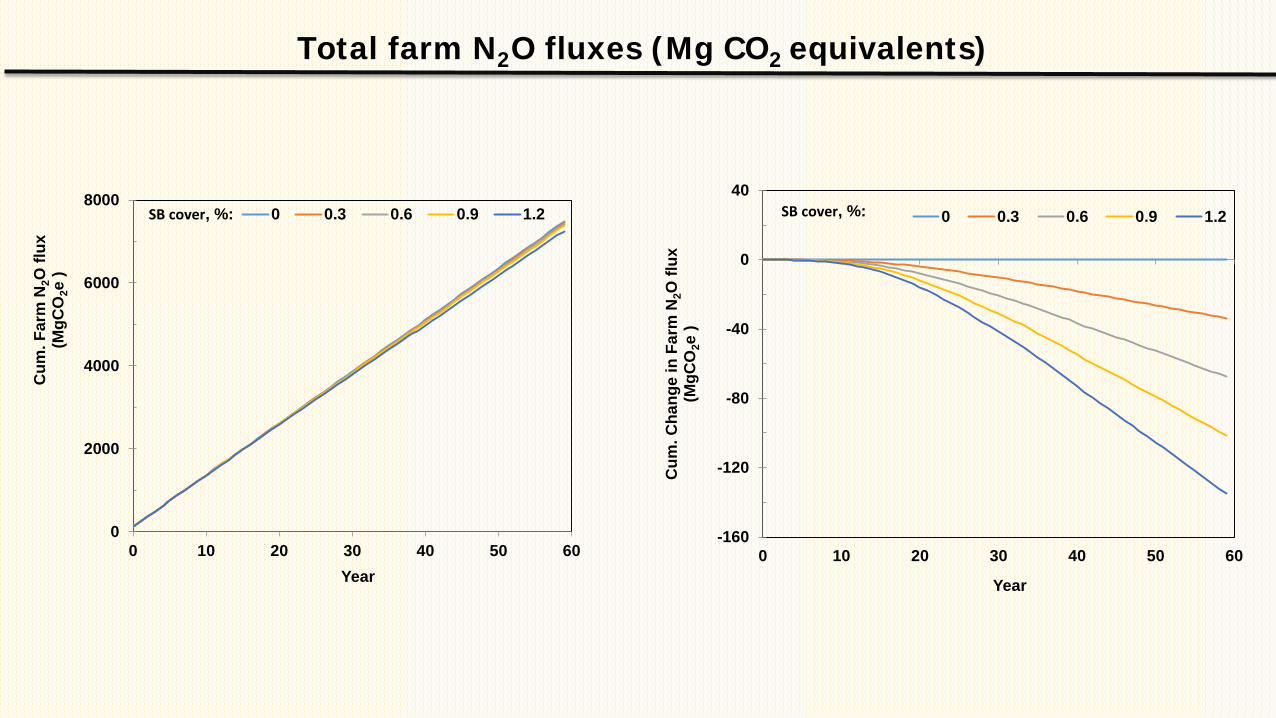
Total farm N2O fluxes (Mg CO2 equivalents)
0
2000
4000
6000
8000
0 10 20 30 40 50 60
Cum
. Far
m N
2O fl
ux(M
gCO
2e )
Year
0 0.3 0.6 0.9 1.2SB cover, %:
-160
-120
-80
-40
0
40
0 10 20 30 40 50 60
Cum
. Cha
nge
in F
arm
N2O
flux
(MgC
O2e
)
Year
0 0.3 0.6 0.9 1.2SB cover, %:
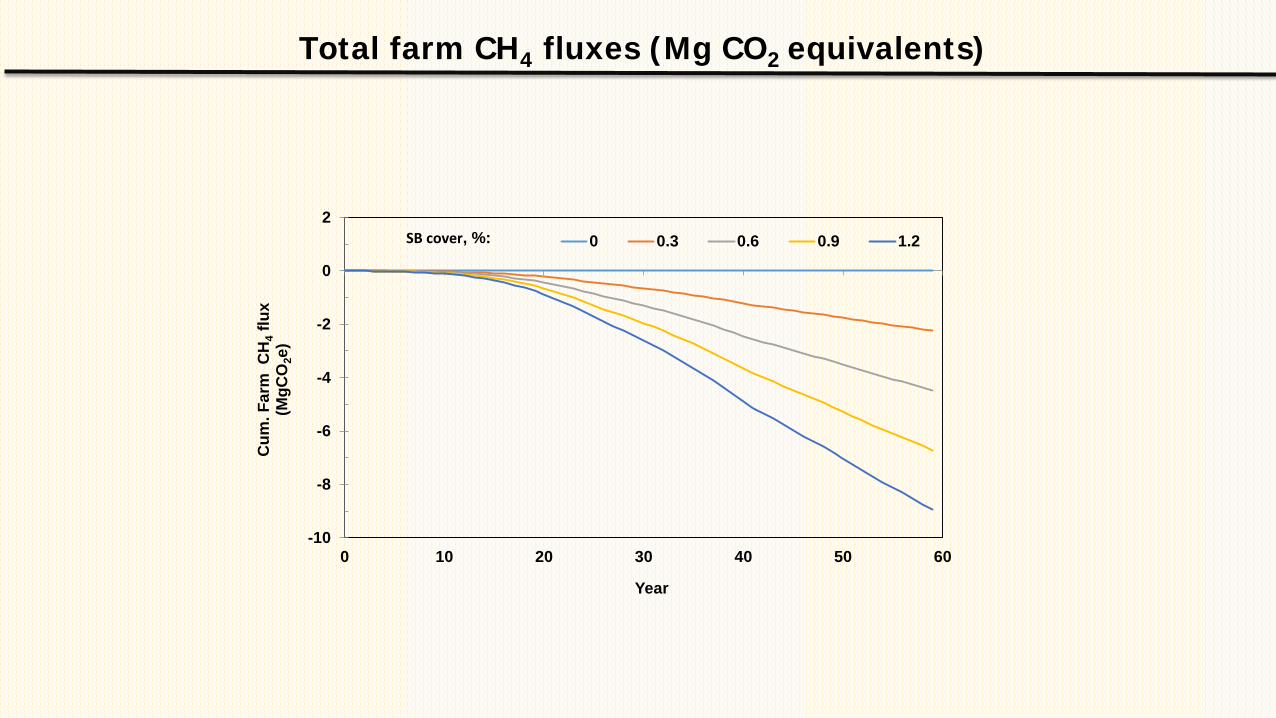
Total farm CH4 fluxes (Mg CO2 equivalents)
-10
-8
-6
-4
-2
0
2
0 10 20 30 40 50 60
Cum
. Far
m C
H4
flux
(MgC
O2e
)
Year
0 0.3 0.6 0.9 1.2SB cover, %:
Overall Farm emissions
Total GHG emissions = Total farm C emissions + N2O fluxes + CH4 fluxes
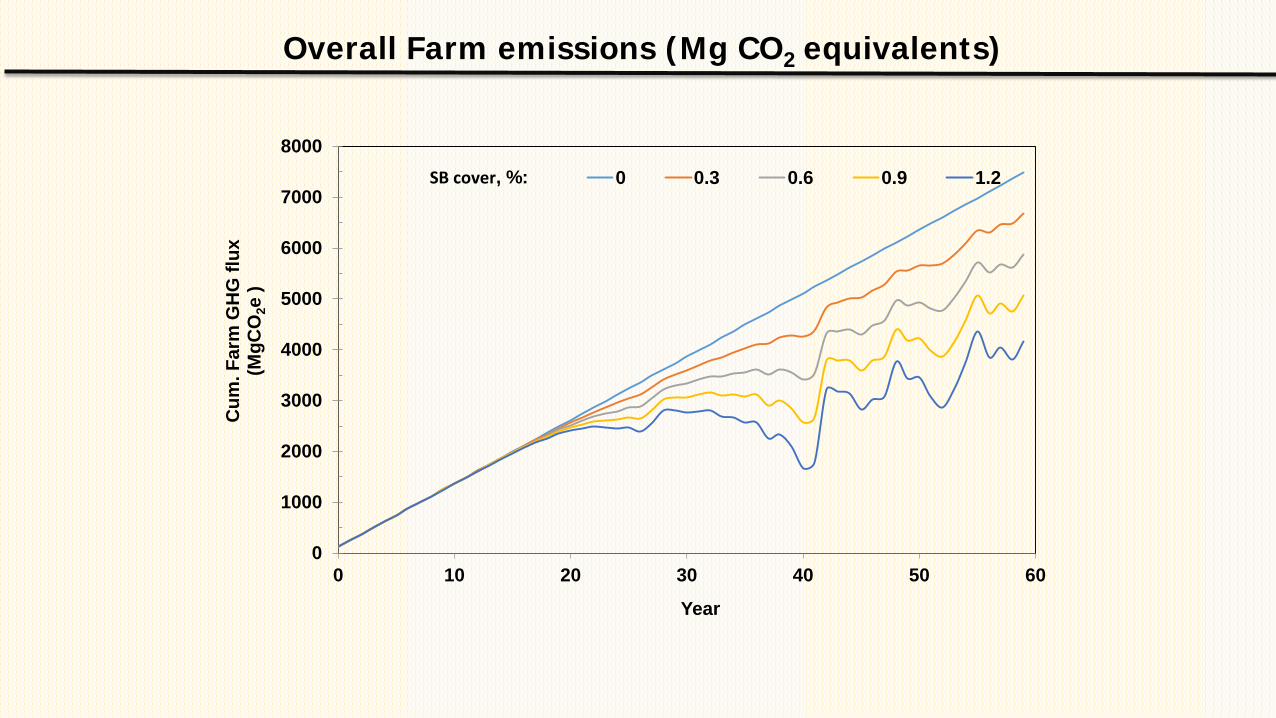
Overall Farm emissions (Mg CO2 equivalents)
0
1000
2000
3000
4000
5000
6000
7000
8000
0 10 20 30 40 50 60
Cum
. Far
m G
HG
flux
(MgC
O2e
)
Year
0 0.3 0.6 0.9 1.2SB cover, %:
Summary of Results
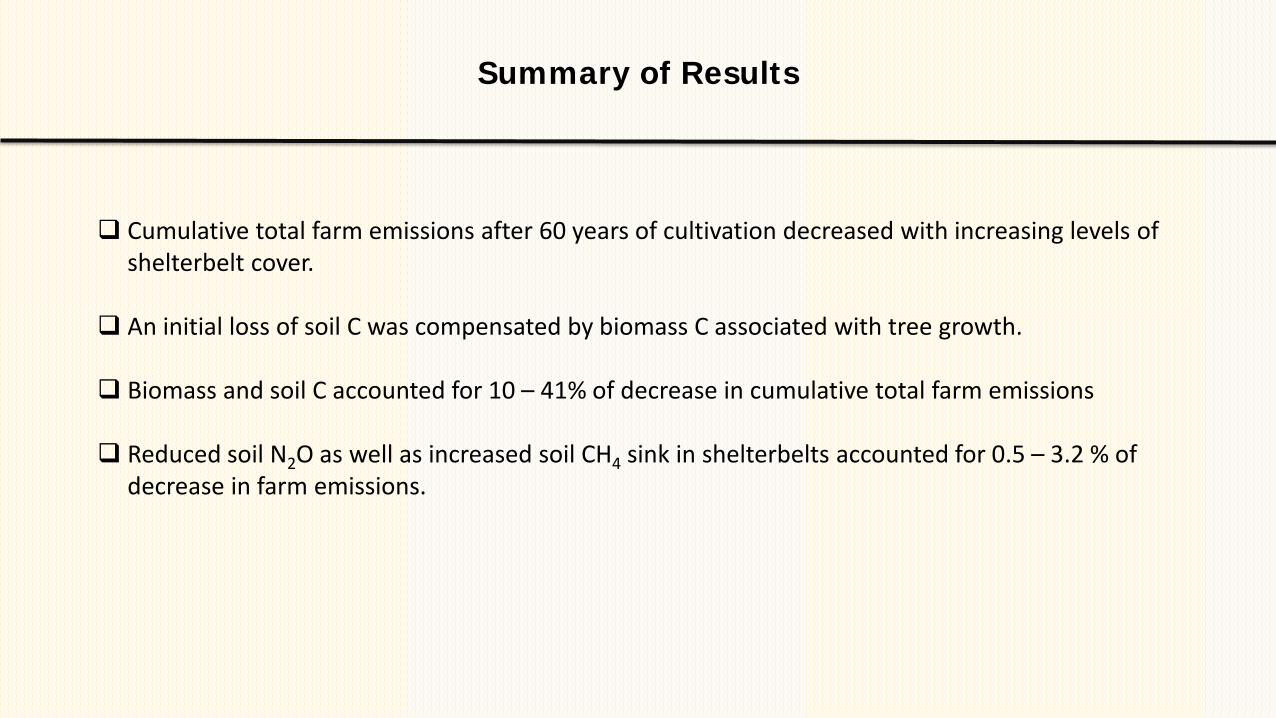
Cumulative total farm emissions after 60 years of cultivation decreased with increasing levels of shelterbelt cover.
An initial loss of soil C was compensated by biomass C associated with tree growth.
Biomass and soil C accounted for 10 – 41% of decrease in cumulative total farm emissions
Reduced soil N2O as well as increased soil CH4 sink in shelterbelts accounted for 0.5 – 3.2 % of decrease in farm emissions.
Acknowledgement
Funding was provided by Agriculture and Agri-Food Canada – Agricultural Greenhouse Gas Program (AGGP).
Additional support was provided by the Saskatchewan Ministry of Agriculture – Strategic Research Program – Soils & Environment
We appreciate support and technical assistance from D. Jackson, D. Richman, F. Krignen, M. Cooke, M. Jones, S. Poppy and C. Braaten.