Embed Size (px)
Citation preview
Farm Labor
ISSN: 1949-0909I did
Released May 26, 2021, by the National Agricultural Statistics Service (NASS), Agricultural Statistics Board, United States Department of
Agriculture (USDA).
Special Note Beginning with 2020, base wage rates and hours are included in this report. These items are found throughout the report.
April Hired Workers Down 11 Percent; Wage Rate Increased 6 Percent from Previous Year
There were 613,000 workers hired directly by farm operators on the Nation's farms and ranches during the week
of April 11-17, 2021, down 11 percent from the April 2020 reference week. Workers hired directly by farm operators
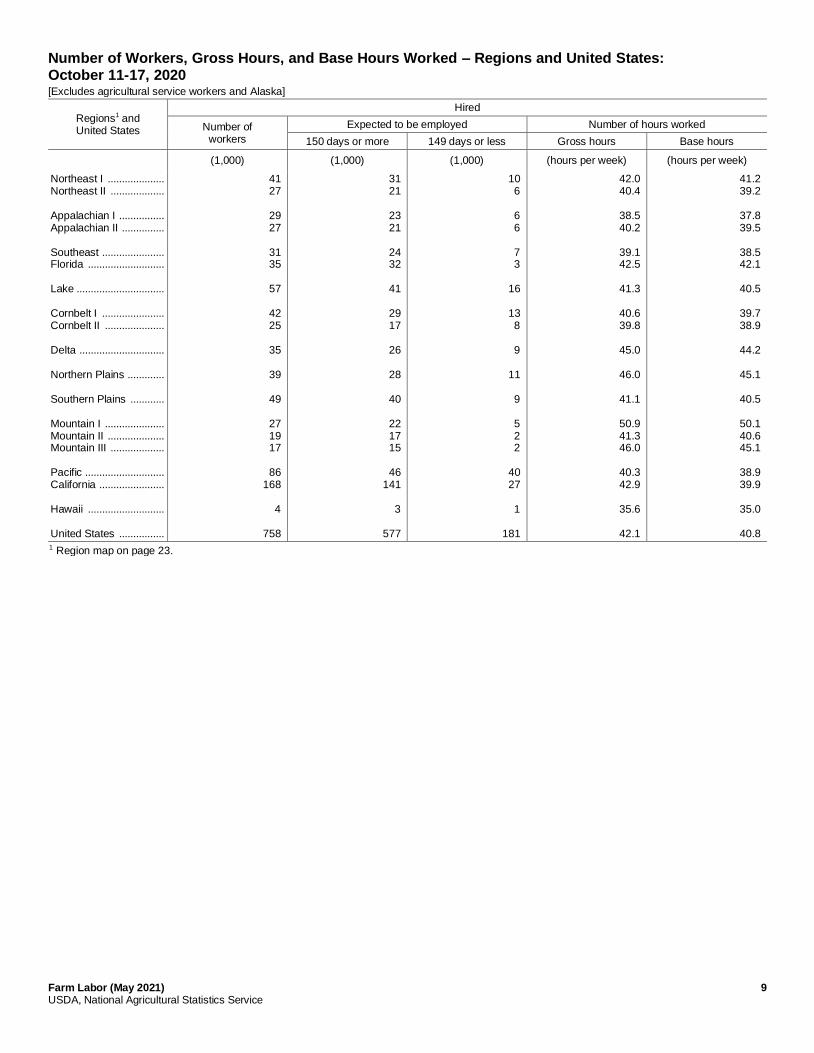
numbered 506,000 during the week of January 10-16, 2021, down 11 percent from the January 2020 reference week.
Farm operators paid their hired workers an average wage of $15.97 per hour during the April 2021 reference week,
up 6 percent from the April 2020 reference week. Field workers received an average of $15.19 per hour, up 7 percent. Livestock workers earned $14.81 per hour, up 5 percent. The field and livestock worker combined wage rate, at $15.06
per hour, was up 6 percent from the 2020 reference week. Hired laborers worked an average of 40.9 hours during the
April 2021 reference week, up 1 percent from the hours worked during the April 2020 reference week.
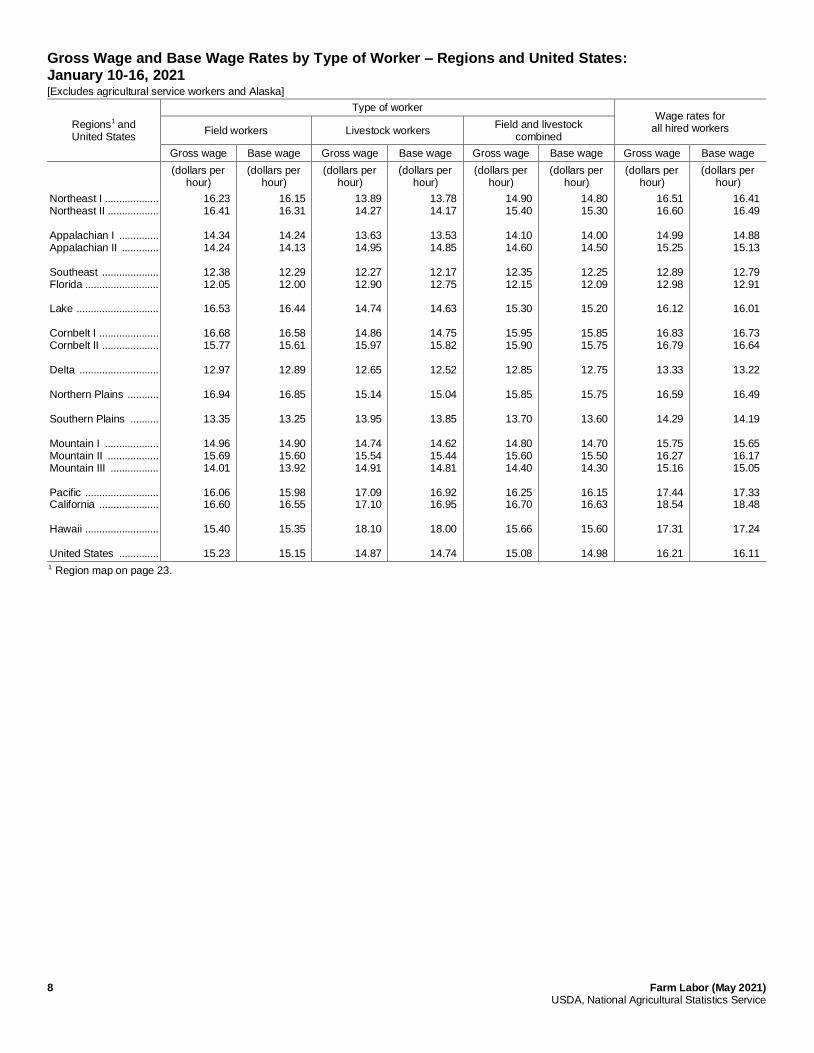
Farm operators paid their hired workers an average wage of $16.21 per hour during the January 2021 reference week,
up 6 percent from the January 2020 reference week. Field workers received an average of $15.23 per hour, up 7 percent, while livestock workers earned $14.87 per hour, up 5 percent from a year earlier. The field and livestock worker
combined wage rate, at $15.08 per hour, was up 6 percent from the January 2020 reference week. Hired laborers worked
an average of 40.2 hours during the January 2021 reference week, unchanged from the hours worked during the January 2020 reference week.
2 Farm Labor (May 2021) USDA, National Agricultural Statistics Service
Contents
Hired Workers, Hours Worked by Hired Workers, Gross Wage Rates, and Base Wage Rates – United States ................... 4
Number of Workers, Gross Hours, and Base Hours Worked – Regions and United States: April 11-17, 2021 .................... 5
Gross Wage and Base Wage Rates by Type of Worker – Regions and United States: April 11-17, 2021 ............................ 6
Number of Workers, Gross Hours, and Base Hours Worked – Regions and United States: January 10-16, 2021 ................ 7
Gross Wage and Base Wage Rates by Type of Worker – Regions and United States: January 10-16, 2021 ........................ 8
Number of Workers, Gross Hours, and Base Hours Worked – Regions and United States: October 11-17, 2020 ............... 9
Gross Wage and Base Wage Rates by Type of Worker – Regions and United States: October 11-17, 2020 ......................10
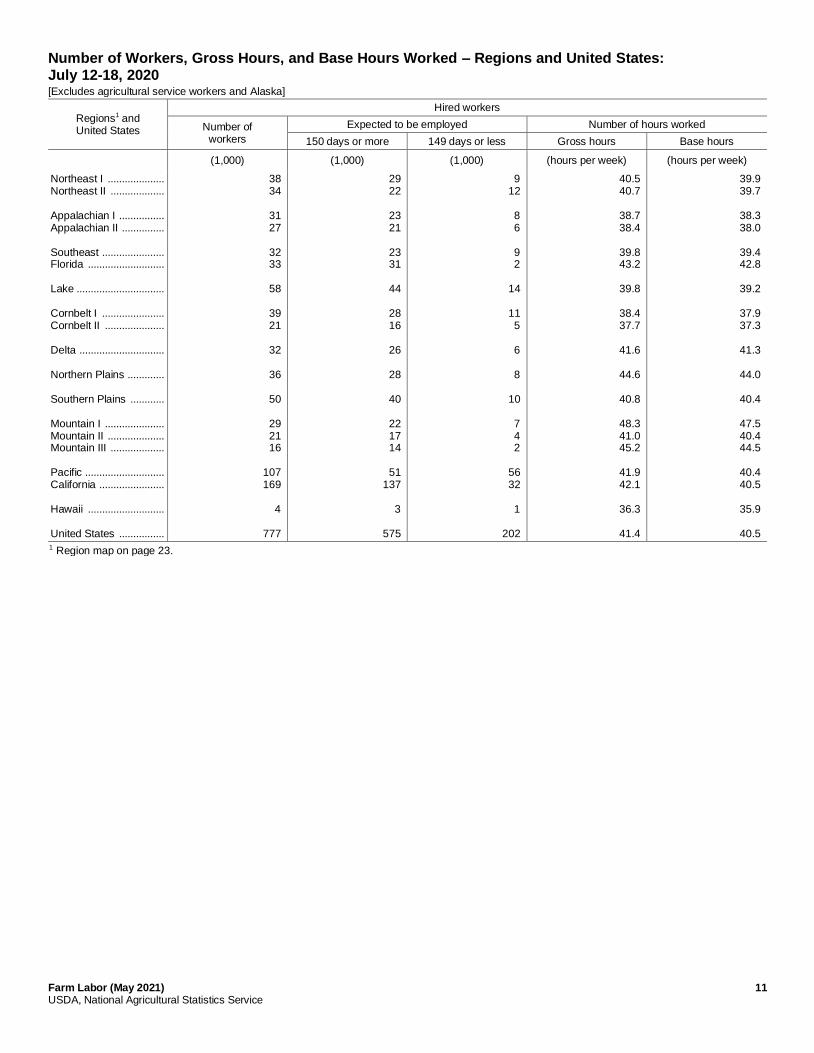
Number of Workers, Gross Hours, and Base Hours Worked – Regions and United States: July 12-18, 2020 ....................11
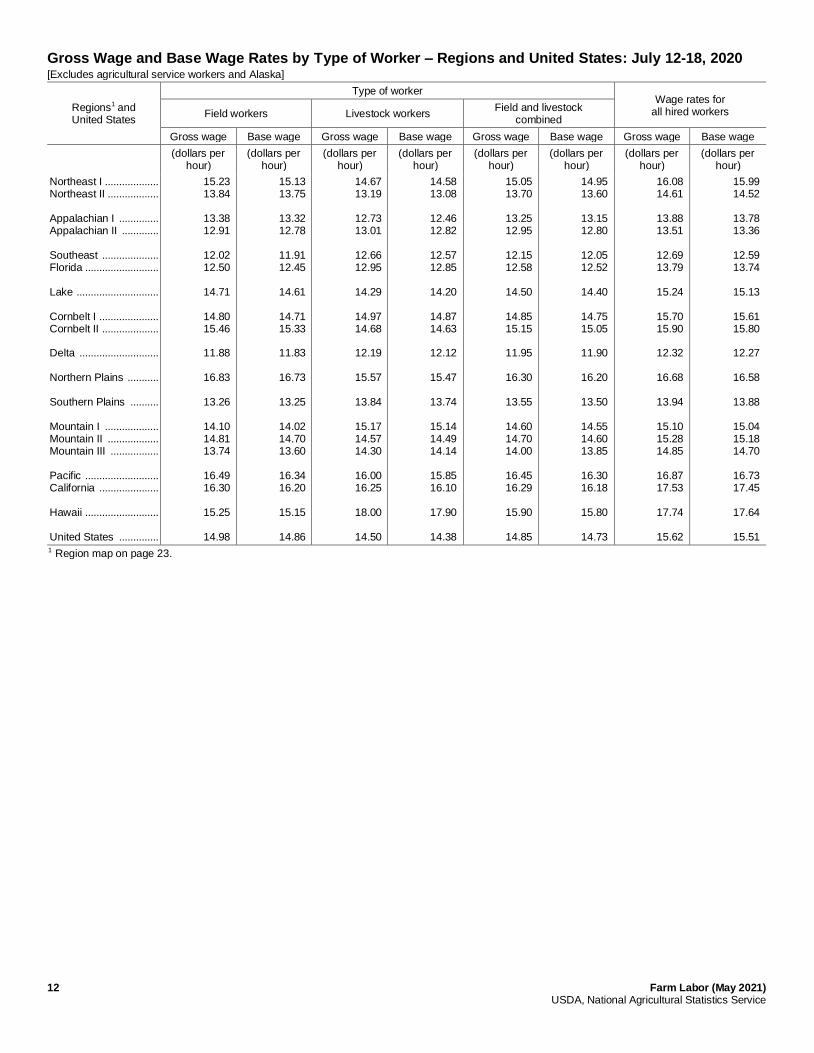
Gross Wage and Base Wage Rates by Type of Worker – Regions and United States: July 12-18, 2020 ............................12
Number of Workers, Gross Hours, and Base Hours Worked – Regions and United States: April 12-18, 2020 ...................13
Gross Wage and Base Wage Rates by Type of Worker – Regions and United States: April 12-18, 2020 ...........................14
Number of Workers, Gross Hours, and Base Hours Worked – Regions and United States: January 12-18, 2020 ...............15
Gross Wage and Base Wage Rates by Type of Worker – Regions and United States: January 12-18, 2020 .......................16
Combined Field and Livestock Worker Gross Wage Rates by Type of Farm – Regions and 48 States:
April 11-17, 2021 ..............................................................................................................................................................17
Combined Field and Livestock Worker Gross Wage Rates by Type of Farm – Regions and 48 States:
January 10-16, 2021 ..........................................................................................................................................................17
Combined Field and Livestock Worker Gross Wage Rates by Type of Farm – Regions and 48 States:
April 12-18, 2020 ..............................................................................................................................................................18
Combined Field and Livestock Worker Gross Wage Rates by Type of Farm – Regions and 48 States:
January 12-18, 2020 ..........................................................................................................................................................18
All Hired Worker Gross Wage Rates by Economic Class of Farm – Regions and 48 States: April 11-17, 2021 ................19
All Hired Worker Gross Wage Rates by Economic Class of Farm – Regions and 48 States:
January 10-16, 2021 ..........................................................................................................................................................19
All Hired Worker Gross Wage Rates by Economic Class of Farm – Regions and 48 States: April 12-18, 2020 ................20
All Hired Worker Gross Wage Rates by Economic Class of Farm – Regions and 48 States:
January 12-18, 2020 ..........................................................................................................................................................20
Field and Livestock Workers by Type of Farm ..................................................................................................................21
Hired Workers by Economic Class of Farm .......................................................................................................................21
Hired Workers by Number of Workers on Farm ................................................................................................................21
Hired Workers by Standard Occupational Classification (SOC) System ............................................................................22
Gross Wage Rates by Standard Occupational Classification (SOC) System ......................................................................22
Base Wage Rates by Standard Occupational Classification (SOC) System ........................................................................22
Farm Labor Regions ..........................................................................................................................................................23
Farm Labor Definitions .....................................................................................................................................................24
Farm Labor (May 2021) 3 USDA, National Agricultural Statistics Service
Survey Methodology ......................................................................................................................................................... 26
Information Contacts ......................................................................................................................................................... 28
4 Farm Labor (May 2021) USDA, National Agricultural Statistics Service
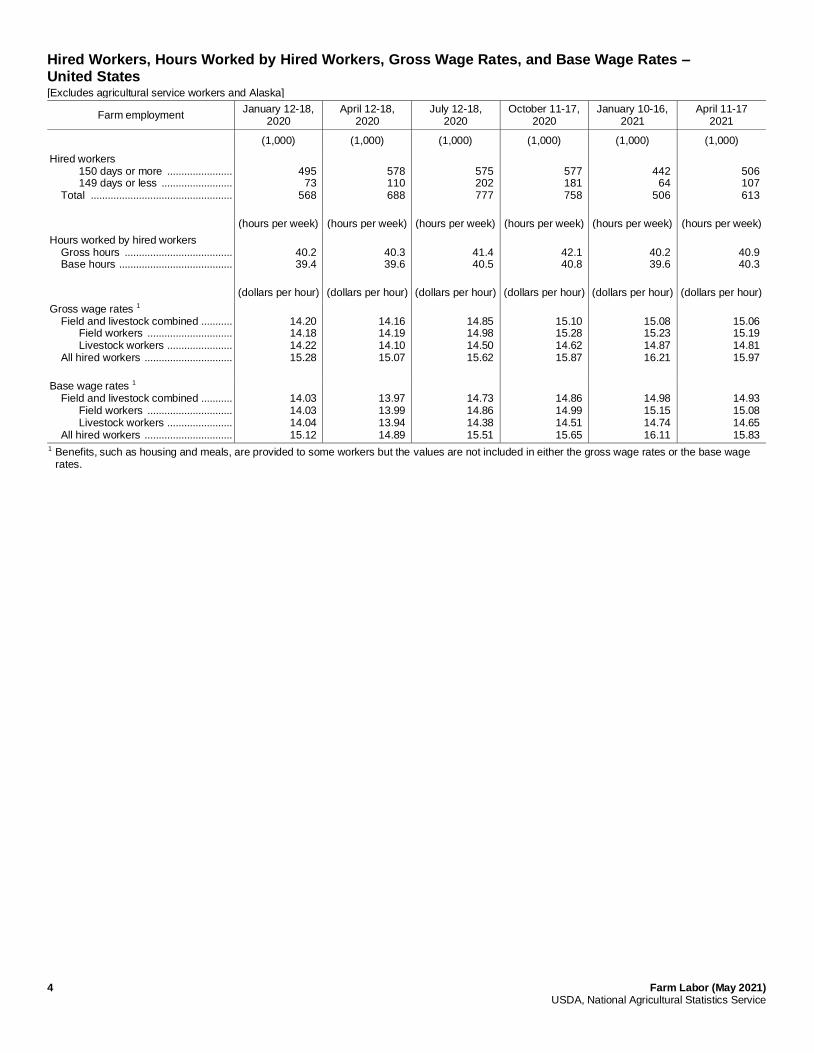
Hired Workers, Hours Worked by Hired Workers, Gross Wage Rates, and Base Wage Rates – United States [Excludes agricultural service workers and Alaska]
Farm employment January 12-18,
2020 April 12-18,
2020 July 12-18,
2020 October 11-17,
2020 January 10-16,
2021 April 11-17
2021
(1,000) (1,000) (1,000) (1,000) (1,000) (1,000)
Hired workers 150 days or more ....................... 149 days or less ......................... Total ..................................................
495
73 568
578 110 688
575 202 777
577 181 758
442
64 506
506 107 613
(hours per week) (hours per week) (hours per week) (hours per week) (hours per week) (hours per week)
Hours worked by hired workers Gross hours ...................................... Base hours ........................................
40.2 39.4
40.3 39.6
41.4 40.5
42.1 40.8
40.2 39.6
40.9 40.3
(dollars per hour) (dollars per hour) (dollars per hour) (dollars per hour) (dollars per hour) (dollars per hour)
Gross wage rates 1 Field and livestock combined ........... Field workers .............................. Livestock workers ....................... All hired workers ...............................
14.20 14.18 14.22 15.28
14.16 14.19 14.10 15.07
14.85 14.98 14.50 15.62
15.10 15.28 14.62 15.87
15.08 15.23 14.87 16.21
15.06 15.19 14.81 15.97
Base wage rates 1 Field and livestock combined ........... Field workers .............................. Livestock workers ....................... All hired workers ...............................
14.03 14.03 14.04 15.12
13.97 13.99 13.94 14.89
14.73 14.86 14.38 15.51
14.86 14.99 14.51 15.65
14.98 15.15 14.74 16.11
14.93 15.08 14.65 15.83
1 Benefits, such as housing and meals, are provided to some workers but the values are not included in either the gross wage rates or the base wage rates.

Farm Labor (May 2021) 5 USDA, National Agricultural Statistics Service
Number of Workers, Gross Hours, and Base Hours Worked – Regions and United States: April 11-17, 2021 [Excludes agricultural service workers and Alaska]
Regions1 and United States
Hired workers
Number of workers
Expected to be employed Number of hours worked
150 days or more 149 days or less Gross hours Base hours
(1,000) (1,000) (1,000) (hours per week) (hours per week)
Northeast I .................... Northeast II ................... Appalachian I ................ Appalachian II ............... Southeast ...................... Florida ........................... Lake ............................... Cornbelt I ...................... Cornbelt II ..................... Delta .............................. Northern Plains ............. Southern Plains ............ Mountain I ..................... Mountain II .................... Mountain III ................... Pacific ............................ California ....................... Hawaii ........................... United States ................
32 25
30 20
31 28
50
32 25
27
35
51
21 15 16
47
123
5
613
26 20
25 17
23 23
37
24 18
21
29
45
18 13 15
40
108
4
506
6 5
5 3
8 5
13
8 7
6
6
6
3 2 1
7
15
1
107
41.0 39.9
40.1 41.5
39.6 40.4
40.9
39.3 39.9
41.2
43.0
41.8
47.8 43.5 46.3
42.6 38.8
35.9
40.9
40.3 39.3
39.5 40.4
39.0 39.7
40.1
38.7 39.0
40.6
42.3
41.2
47.1 42.7 45.5
42.1 38.1
35.5
40.3
1 Region map on page 23.
6 Farm Labor (May 2021) USDA, National Agricultural Statistics Service
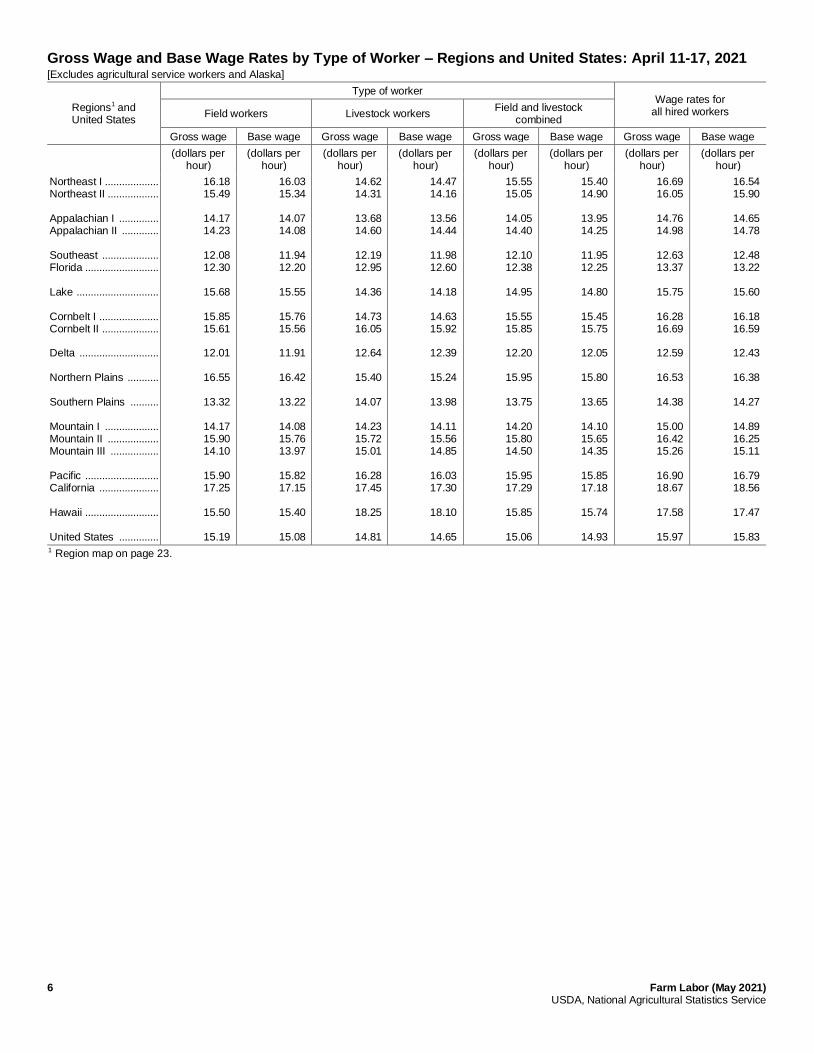
Gross Wage and Base Wage Rates by Type of Worker – Regions and United States: April 11-17, 2021 [Excludes agricultural service workers and Alaska]
Regions1 and United States
Type of worker Wage rates for
all hired workers Field workers Livestock workers Field and livestock
combined
Gross wage Base wage Gross wage Base wage Gross wage Base wage Gross wage Base wage
(dollars per
hour) (dollars per
hour) (dollars per
hour) (dollars per
hour) (dollars per
hour) (dollars per
hour) (dollars per
hour) (dollars per
hour)
Northeast I ................... Northeast II .................. Appalachian I .............. Appalachian II ............. Southeast .................... Florida .......................... Lake ............................. Cornbelt I ..................... Cornbelt II .................... Delta ............................ Northern Plains ........... Southern Plains .......... Mountain I ................... Mountain II .................. Mountain III ................. Pacific .......................... California ..................... Hawaii .......................... United States ..............
16.18 15.49
14.17 14.23
12.08 12.30
15.68
15.85 15.61
12.01
16.55
13.32
14.17 15.90 14.10
15.90 17.25
15.50
15.19
16.03 15.34
14.07 14.08
11.94 12.20
15.55
15.76 15.56
11.91
16.42
13.22
14.08 15.76 13.97
15.82 17.15
15.40
15.08
14.62 14.31
13.68 14.60
12.19 12.95
14.36
14.73 16.05
12.64
15.40
14.07
14.23 15.72 15.01
16.28 17.45
18.25
14.81
14.47 14.16
13.56 14.44
11.98 12.60
14.18
14.63 15.92
12.39
15.24
13.98
14.11 15.56 14.85
16.03 17.30
18.10
14.65
15.55 15.05
14.05 14.40
12.10 12.38
14.95
15.55 15.85
12.20
15.95
13.75
14.20 15.80 14.50
15.95 17.29
15.85
15.06
15.40 14.90
13.95 14.25
11.95 12.25
14.80
15.45 15.75
12.05
15.80
13.65
14.10 15.65 14.35
15.85 17.18
15.74
14.93
16.69 16.05
14.76 14.98
12.63 13.37
15.75
16.28 16.69
12.59
16.53
14.38
15.00 16.42 15.26
16.90 18.67
17.58
15.97
16.54 15.90
14.65 14.78
12.48 13.22
15.60
16.18 16.59
12.43
16.38
14.27
14.89 16.25 15.11
16.79 18.56
17.47
15.83
1 Region map on page 23.

Farm Labor (May 2021) 7 USDA, National Agricultural Statistics Service
Number of Workers, Gross Hours, and Base Hours Worked – Regions and United States: January 10-16, 2021 [Excludes agricultural service workers and Alaska]
Regions1 and United States
Hired workers
Number of workers
Expected to be employed Number of hours worked
150 days or more 149 days or less Gross hours Base hours
(1,000) (1,000) (1,000) (hours per week) (hours per week)
Northeast I .................... Northeast II ................... Appalachian I ................ Appalachian II ............... Southeast ...................... Florida ........................... Lake ............................... Cornbelt I ...................... Cornbelt II ..................... Delta .............................. Northern Plains ............. Southern Plains ............ Mountain I ..................... Mountain II .................... Mountain III ................... Pacific ............................ California ....................... Hawaii ........................... United States ................
21 19
21 17
23 28
39
22 20
19
27
45
15 12 16
35
122
5
506
19 16
18 15
19 25
32
20 18
16
25
41
14 11 15
29
105
4
442
2 3
3 2
4 3
7
2 2
3
2
4
1 1 1
6
17
1
64
41.6 39.1
38.4 39.8
38.6 42.0
41.0
37.9 38.4
38.2
42.0
40.2
42.6 42.1 46.5
38.6 40.1
36.4
40.2
41.1 38.7
37.9 39.0
38.3 41.4
40.2
37.5 38.0
37.7
41.5
39.7
41.7 41.5 45.9
38.2 39.1
36.0
39.6
1 Region map on page 23.
8 Farm Labor (May 2021) USDA, National Agricultural Statistics Service
Gross Wage and Base Wage Rates by Type of Worker – Regions and United States: January 10-16, 2021 [Excludes agricultural service workers and Alaska]
Regions1 and United States
Type of worker Wage rates for
all hired workers Field workers Livestock workers Field and livestock
combined
Gross wage Base wage Gross wage Base wage Gross wage Base wage Gross wage Base wage
(dollars per
hour) (dollars per
hour) (dollars per
hour) (dollars per
hour) (dollars per
hour) (dollars per
hour) (dollars per
hour) (dollars per
hour)
Northeast I ................... Northeast II .................. Appalachian I .............. Appalachian II ............. Southeast .................... Florida .......................... Lake ............................. Cornbelt I ..................... Cornbelt II .................... Delta ............................ Northern Plains ........... Southern Plains .......... Mountain I ................... Mountain II .................. Mountain III ................. Pacific .......................... California ..................... Hawaii .......................... United States ..............
16.23 16.41
14.34 14.24
12.38 12.05
16.53
16.68 15.77
12.97
16.94
13.35
14.96 15.69 14.01
16.06 16.60
15.40
15.23
16.15 16.31
14.24 14.13
12.29 12.00
16.44
16.58 15.61
12.89
16.85
13.25
14.90 15.60 13.92
15.98 16.55
15.35
15.15
13.89 14.27
13.63 14.95
12.27 12.90
14.74
14.86 15.97
12.65
15.14
13.95
14.74 15.54 14.91
17.09 17.10
18.10
14.87
13.78 14.17
13.53 14.85
12.17 12.75
14.63
14.75 15.82
12.52
15.04
13.85
14.62 15.44 14.81
16.92 16.95
18.00
14.74
14.90 15.40
14.10 14.60
12.35 12.15
15.30
15.95 15.90
12.85
15.85
13.70
14.80 15.60 14.40
16.25 16.70
15.66
15.08
14.80 15.30
14.00 14.50
12.25 12.09
15.20
15.85 15.75
12.75
15.75
13.60
14.70 15.50 14.30
16.15 16.63
15.60
14.98
16.51 16.60
14.99 15.25
12.89 12.98
16.12
16.83 16.79
13.33
16.59
14.29
15.75 16.27 15.16
17.44 18.54
17.31
16.21
16.41 16.49
14.88 15.13
12.79 12.91
16.01
16.73 16.64
13.22
16.49
14.19
15.65 16.17 15.05
17.33 18.48
17.24
16.11
1 Region map on page 23.
Farm Labor (May 2021) 9 USDA, National Agricultural Statistics Service
Number of Workers, Gross Hours, and Base Hours Worked – Regions and United States: October 11-17, 2020 [Excludes agricultural service workers and Alaska]
Regions1 and United States
Hired
Number of workers
Expected to be employed Number of hours worked
150 days or more 149 days or less Gross hours Base hours
(1,000) (1,000) (1,000) (hours per week) (hours per week)
Northeast I .................... Northeast II ................... Appalachian I ................ Appalachian II ............... Southeast ...................... Florida ........................... Lake ............................... Cornbelt I ...................... Cornbelt II ..................... Delta .............................. Northern Plains ............. Southern Plains ............ Mountain I ..................... Mountain II .................... Mountain III ................... Pacific ............................ California ....................... Hawaii ........................... United States ................
41 27
29 27
31 35
57
42 25
35
39
49
27 19 17
86
168
4
758
31 21
23 21
24 32
41
29 17
26
28
40
22 17 15
46
141
3
577
10 6
6 6
7 3
16
13 8
9
11
9
5 2 2
40 27
1
181
42.0 40.4
38.5 40.2
39.1 42.5
41.3
40.6 39.8
45.0
46.0
41.1
50.9 41.3 46.0
40.3 42.9
35.6
42.1
41.2 39.2
37.8 39.5
38.5 42.1
40.5
39.7 38.9
44.2
45.1
40.5
50.1 40.6 45.1
38.9 39.9
35.0
40.8
1 Region map on page 23.

10 Farm Labor (May 2021) USDA, National Agricultural Statistics Service
Gross Wage and Base Wage Rates by Type of Worker – Regions and United States: October 11-17, 2020 [Excludes agricultural service workers and Alaska]
Regions1 and United States
Type of worker Wage rates for
all hired workers Field workers Livestock workers Field and livestock
combined
Gross wage Base wage Gross wage Base wage Gross wage Base wage Gross wage Base wage
(dollars per
hour) (dollars per
hour) (dollars per
hour) (dollars per
hour) (dollars per
hour) (dollars per
hour) (dollars per
hour) (dollars per
hour)
Northeast I ................... Northeast II .................. Appalachian I .............. Appalachian II ............. Southeast .................... Florida .......................... Lake ............................. Cornbelt I ..................... Cornbelt II .................... Delta ............................ Northern Plains ........... Southern Plains .......... Mountain I ................... Mountain II .................. Mountain III ................. Pacific .......................... California ..................... Hawaii .......................... United States ..............
15.32 14.56
13.28 13.11
12.02 12.35
15.75
15.80 15.86
11.67
17.04
13.47
14.69 14.80 13.56
17.54 16.50
16.00
15.28
15.20 14.37
13.18 13.00
11.92 12.25
15.61
15.65 15.68
11.57
16.85
13.37
14.58 14.62 13.40
16.60 16.20
15.75
14.99
14.92 13.42
12.94 13.22
12.37 13.15
14.28
15.16 14.81
12.05
15.52
14.08
15.37 14.70 14.37
16.63 16.25
17.70
14.62
14.84 13.37
12.84 13.13
12.27 13.00
14.21
15.01 14.72
11.95
15.43
13.98
15.29 14.58 14.23
16.59 16.05
17.55
14.51
15.20 14.25
13.20 13.15
12.10 12.48
15.00
15.65 15.50
11.75
16.45
13.80
15.00 14.75 13.90
17.45 16.46
16.27
15.10
15.10 14.10
13.10 13.05
12.00 12.37
14.90
15.50 15.35
11.65
16.30
13.70
14.90 14.60 13.75
16.60 16.17
16.04
14.86
16.16 15.34
13.90 13.70
12.73 13.82
15.72
16.30 16.10
12.09
16.83
14.30
15.48 15.42 14.71
17.88 17.64
18.13
15.87
16.06 15.21
13.81 13.61
12.63 13.72
15.61
16.16 15.96
11.99
16.69
14.21
15.38 15.29 14.57
17.10 17.41
17.94
15.65
1 Region map on page 23.
Farm Labor (May 2021) 11 USDA, National Agricultural Statistics Service
Number of Workers, Gross Hours, and Base Hours Worked – Regions and United States: July 12-18, 2020 [Excludes agricultural service workers and Alaska]
Regions1 and United States
Hired workers
Number of workers
Expected to be employed Number of hours worked
150 days or more 149 days or less Gross hours Base hours
(1,000) (1,000) (1,000) (hours per week) (hours per week)
Northeast I .................... Northeast II ................... Appalachian I ................ Appalachian II ............... Southeast ...................... Florida ........................... Lake ............................... Cornbelt I ...................... Cornbelt II ..................... Delta .............................. Northern Plains ............. Southern Plains ............ Mountain I ..................... Mountain II .................... Mountain III ................... Pacific ............................ California ....................... Hawaii ........................... United States ................
38 34
31 27
32 33
58
39 21
32
36
50
29 21 16
107 169
4
777
29 22
23 21
23 31
44
28 16
26
28
40
22 17 14
51
137
3
575
9 12
8 6
9 2
14
11 5
6
8
10
7 4 2
56 32
1
202
40.5 40.7
38.7 38.4
39.8 43.2
39.8
38.4 37.7
41.6
44.6
40.8
48.3 41.0 45.2
41.9 42.1
36.3
41.4
39.9 39.7
38.3 38.0
39.4 42.8
39.2
37.9 37.3
41.3
44.0
40.4
47.5 40.4 44.5
40.4 40.5
35.9
40.5
1 Region map on page 23.
12 Farm Labor (May 2021) USDA, National Agricultural Statistics Service
Gross Wage and Base Wage Rates by Type of Worker – Regions and United States: July 12-18, 2020 [Excludes agricultural service workers and Alaska]
Regions1 and United States
Type of worker Wage rates for
all hired workers Field workers Livestock workers Field and livestock
combined
Gross wage Base wage Gross wage Base wage Gross wage Base wage Gross wage Base wage
(dollars per
hour) (dollars per
hour) (dollars per
hour) (dollars per
hour) (dollars per
hour) (dollars per
hour) (dollars per
hour) (dollars per
hour)
Northeast I ................... Northeast II .................. Appalachian I .............. Appalachian II ............. Southeast .................... Florida .......................... Lake ............................. Cornbelt I ..................... Cornbelt II .................... Delta ............................ Northern Plains ........... Southern Plains .......... Mountain I ................... Mountain II .................. Mountain III ................. Pacific .......................... California ..................... Hawaii .......................... United States ..............
15.23 13.84
13.38 12.91
12.02 12.50
14.71
14.80 15.46
11.88
16.83
13.26
14.10 14.81 13.74
16.49 16.30
15.25
14.98
15.13 13.75
13.32 12.78
11.91 12.45
14.61
14.71 15.33
11.83
16.73
13.25
14.02 14.70 13.60
16.34 16.20
15.15
14.86
14.67 13.19
12.73 13.01
12.66 12.95
14.29
14.97 14.68
12.19
15.57
13.84
15.17 14.57 14.30
16.00 16.25
18.00
14.50
14.58 13.08
12.46 12.82
12.57 12.85
14.20
14.87 14.63
12.12
15.47
13.74
15.14 14.49 14.14
15.85 16.10
17.90
14.38
15.05 13.70
13.25 12.95
12.15 12.58
14.50
14.85 15.15
11.95
16.30
13.55
14.60 14.70 14.00
16.45 16.29
15.90
14.85
14.95 13.60
13.15 12.80
12.05 12.52
14.40
14.75 15.05
11.90
16.20
13.50
14.55 14.60 13.85
16.30 16.18
15.80
14.73
16.08 14.61
13.88 13.51
12.69 13.79
15.24
15.70 15.90
12.32
16.68
13.94
15.10 15.28 14.85
16.87 17.53
17.74
15.62
15.99 14.52
13.78 13.36
12.59 13.74
15.13
15.61 15.80
12.27
16.58
13.88
15.04 15.18 14.70
16.73 17.45
17.64
15.51
1 Region map on page 23.
Farm Labor (May 2021) 13 USDA, National Agricultural Statistics Service
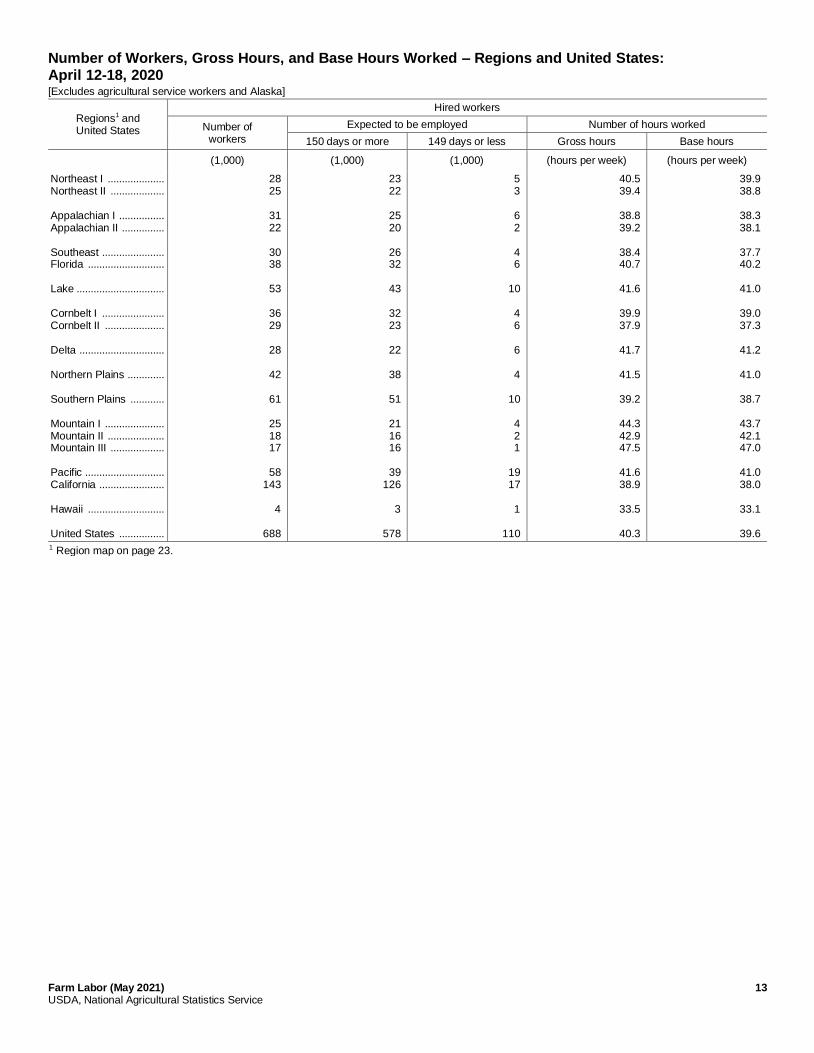
Number of Workers, Gross Hours, and Base Hours Worked – Regions and United States: April 12-18, 2020 [Excludes agricultural service workers and Alaska]
Regions1 and United States
Hired workers
Number of workers
Expected to be employed Number of hours worked
150 days or more 149 days or less Gross hours Base hours
(1,000) (1,000) (1,000) (hours per week) (hours per week)
Northeast I .................... Northeast II ................... Appalachian I ................ Appalachian II ............... Southeast ...................... Florida ........................... Lake ............................... Cornbelt I ...................... Cornbelt II ..................... Delta .............................. Northern Plains ............. Southern Plains ............ Mountain I ..................... Mountain II .................... Mountain III ................... Pacific ............................ California ....................... Hawaii ........................... United States ................
28 25
31 22
30 38
53
36 29
28
42
61
25 18 17
58
143
4
688
23 22
25 20
26 32
43
32 23
22
38
51
21 16 16
39
126
3
578
5 3
6 2
4 6
10
4 6
6
4
10
4 2 1
19 17
1
110
40.5 39.4
38.8 39.2
38.4 40.7
41.6
39.9 37.9
41.7
41.5
39.2
44.3 42.9 47.5
41.6 38.9
33.5
40.3
39.9 38.8
38.3 38.1
37.7 40.2
41.0
39.0 37.3
41.2
41.0
38.7
43.7 42.1 47.0
41.0 38.0
33.1
39.6
1 Region map on page 23.
14 Farm Labor (May 2021) USDA, National Agricultural Statistics Service
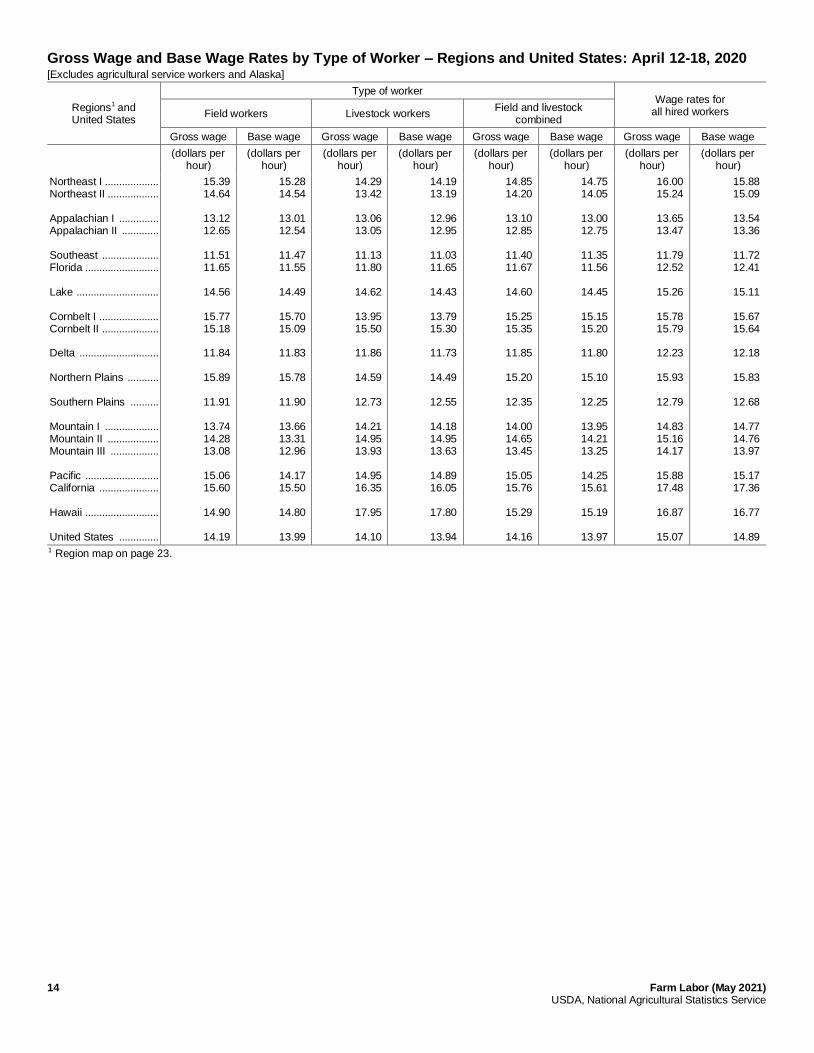
Gross Wage and Base Wage Rates by Type of Worker – Regions and United States: April 12-18, 2020 [Excludes agricultural service workers and Alaska]
Regions1 and United States
Type of worker Wage rates for
all hired workers Field workers Livestock workers Field and livestock
combined
Gross wage Base wage Gross wage Base wage Gross wage Base wage Gross wage Base wage
(dollars per
hour) (dollars per
hour) (dollars per
hour) (dollars per
hour) (dollars per
hour) (dollars per
hour) (dollars per
hour) (dollars per
hour)
Northeast I ................... Northeast II .................. Appalachian I .............. Appalachian II ............. Southeast .................... Florida .......................... Lake ............................. Cornbelt I ..................... Cornbelt II .................... Delta ............................ Northern Plains ........... Southern Plains .......... Mountain I ................... Mountain II .................. Mountain III ................. Pacific .......................... California ..................... Hawaii .......................... United States ..............
15.39 14.64
13.12 12.65
11.51 11.65
14.56
15.77 15.18
11.84
15.89
11.91
13.74 14.28 13.08
15.06 15.60
14.90
14.19
15.28 14.54
13.01 12.54
11.47 11.55
14.49
15.70 15.09
11.83
15.78
11.90
13.66 13.31 12.96
14.17 15.50
14.80
13.99
14.29 13.42
13.06 13.05
11.13 11.80
14.62
13.95 15.50
11.86
14.59
12.73
14.21 14.95 13.93
14.95 16.35
17.95
14.10
14.19 13.19
12.96 12.95
11.03 11.65
14.43
13.79 15.30
11.73
14.49
12.55
14.18 14.95 13.63
14.89 16.05
17.80
13.94
14.85 14.20
13.10 12.85
11.40 11.67
14.60
15.25 15.35
11.85
15.20
12.35
14.00 14.65 13.45
15.05 15.76
15.29
14.16
14.75 14.05
13.00 12.75
11.35 11.56
14.45
15.15 15.20
11.80
15.10
12.25
13.95 14.21 13.25
14.25 15.61
15.19
13.97
16.00 15.24
13.65 13.47
11.79 12.52
15.26
15.78 15.79
12.23
15.93
12.79
14.83 15.16 14.17
15.88 17.48
16.87
15.07
15.88 15.09
13.54 13.36
11.72 12.41
15.11
15.67 15.64
12.18
15.83
12.68
14.77 14.76 13.97
15.17 17.36
16.77
14.89
1 Region map on page 23.

Farm Labor (May 2021) 15 USDA, National Agricultural Statistics Service
Number of Workers, Gross Hours, and Base Hours Worked – Regions and United States: January 12-18, 2020 [Excludes agricultural service workers and Alaska]
Regions1 and United States
Hired
Number of workers
Expected to be employed Number of hours worked
150 days or more 149 days or less Gross hours Base hours
(1,000) (1,000) (1,000) (hours per week) (hours per week)
Northeast I .................... Northeast II ................... Appalachian I ................ Appalachian II ............... Southeast ...................... Florida ........................... Lake ............................... Cornbelt I ...................... Cornbelt II ..................... Delta .............................. Northern Plains ............. Southern Plains ............ Mountain I ..................... Mountain II .................... Mountain III ................... Pacific ............................ California ....................... Hawaii ........................... United States ................
21 20
24 18
23 39
44
28 25
20
35
55
18 15 18
39
121
5
568
18 18
20 17
21 30
38
26 21
17
33
47
17 14 16
32
107
3
495
3 2
4 1
2 9
6
2 4
3
2
8
1 1 2
7
14
2
73
41.6 38.9
38.3 38.9
37.3 40.9
41.0
36.9 37.2
37.6
40.9
39.1
42.7 43.5 47.5
36.9 42.0
33.8
40.2
41.0 38.4
37.7 38.1
36.7 40.6
40.4
36.5 36.8
37.1
40.1
38.6
42.3 42.3 46.9
36.5 40.8
33.6
39.4
1 Region map on page 23.
16 Farm Labor (May 2021) USDA, National Agricultural Statistics Service
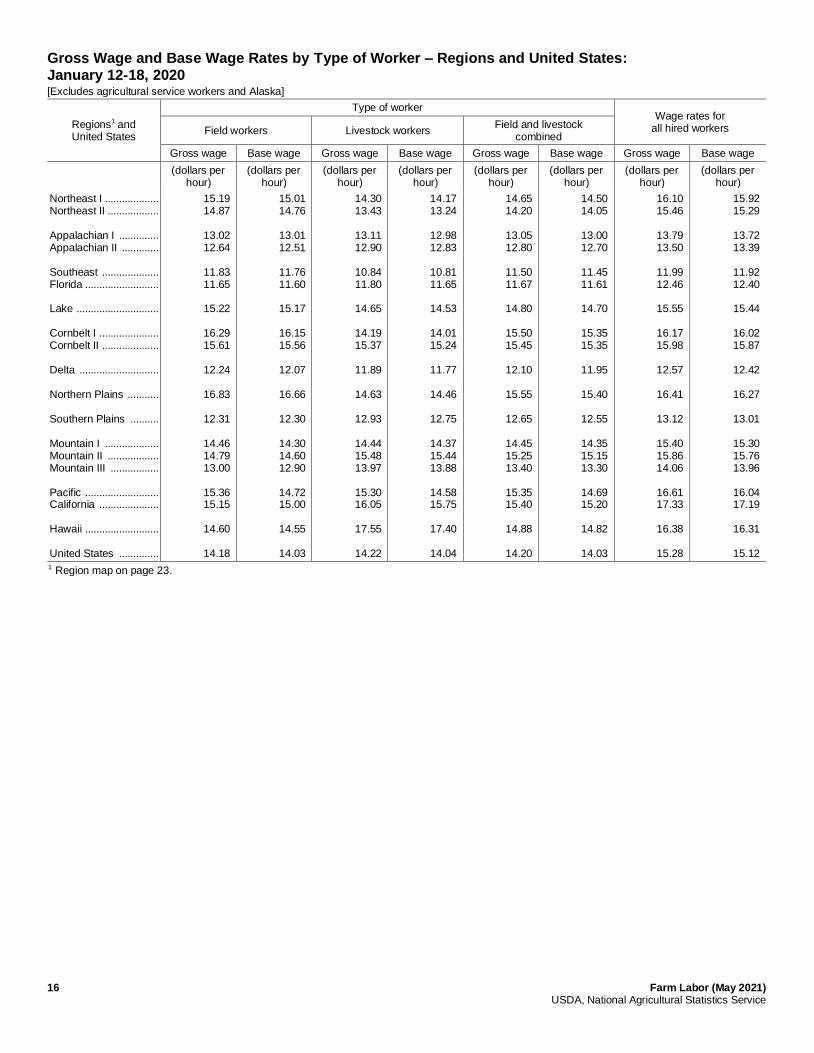
Gross Wage and Base Wage Rates by Type of Worker – Regions and United States: January 12-18, 2020 [Excludes agricultural service workers and Alaska]
Regions1 and United States
Type of worker Wage rates for
all hired workers Field workers Livestock workers Field and livestock
combined
Gross wage Base wage Gross wage Base wage Gross wage Base wage Gross wage Base wage
(dollars per
hour) (dollars per
hour) (dollars per
hour) (dollars per
hour) (dollars per
hour) (dollars per
hour) (dollars per
hour) (dollars per
hour)
Northeast I ................... Northeast II .................. Appalachian I .............. Appalachian II ............. Southeast .................... Florida .......................... Lake ............................. Cornbelt I ..................... Cornbelt II .................... Delta ............................ Northern Plains ........... Southern Plains .......... Mountain I ................... Mountain II .................. Mountain III ................. Pacific .......................... California ..................... Hawaii .......................... United States ..............
15.19 14.87
13.02 12.64
11.83 11.65
15.22
16.29 15.61
12.24
16.83
12.31
14.46 14.79 13.00
15.36 15.15
14.60
14.18
15.01 14.76
13.01 12.51
11.76 11.60
15.17
16.15 15.56
12.07
16.66
12.30
14.30 14.60 12.90
14.72 15.00
14.55
14.03
14.30 13.43
13.11 12.90
10.84 11.80
14.65
14.19 15.37
11.89
14.63
12.93
14.44 15.48 13.97
15.30 16.05
17.55
14.22
14.17 13.24
12.98 12.83
10.81 11.65
14.53
14.01 15.24
11.77
14.46
12.75
14.37 15.44 13.88
14.58 15.75
17.40
14.04
14.65 14.20
13.05 12.80
11.50 11.67
14.80
15.50 15.45
12.10
15.55
12.65
14.45 15.25 13.40
15.35 15.40
14.88
14.20
14.50 14.05
13.00 12.70
11.45 11.61
14.70
15.35 15.35
11.95
15.40
12.55
14.35 15.15 13.30
14.69 15.20
14.82
14.03
16.10 15.46
13.79 13.50
11.99 12.46
15.55
16.17 15.98
12.57
16.41
13.12
15.40 15.86 14.06
16.61 17.33
16.38
15.28
15.92 15.29
13.72 13.39
11.92 12.40
15.44
16.02 15.87
12.42
16.27
13.01
15.30 15.76 13.96
16.04 17.19
16.31
15.12
1 Region map on page 23.
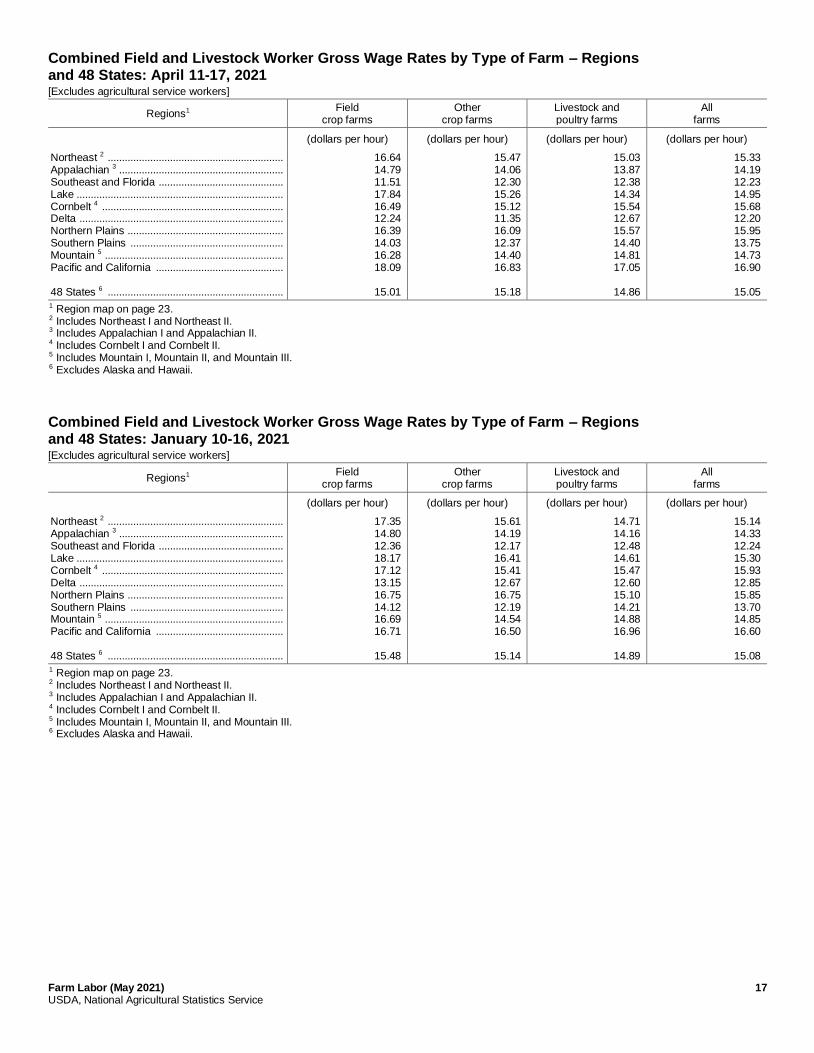
Farm Labor (May 2021) 17 USDA, National Agricultural Statistics Service
Combined Field and Livestock Worker Gross Wage Rates by Type of Farm – Regions and 48 States: April 11-17, 2021 [Excludes agricultural service workers]
Regions1 Field
crop farms Other
crop farms Livestock and poultry farms
All farms
(dollars per hour) (dollars per hour) (dollars per hour) (dollars per hour)
Northeast 2 .............................................................. Appalachian 3 .......................................................... Southeast and Florida ............................................ Lake ......................................................................... Cornbelt 4 ................................................................ Delta ........................................................................ Northern Plains ....................................................... Southern Plains ...................................................... Mountain 5 ............................................................... Pacific and California ............................................. 48 States 6 ..............................................................
16.64 14.79 11.51 17.84 16.49 12.24 16.39 14.03 16.28 18.09
15.01
15.47 14.06 12.30 15.26 15.12 11.35 16.09 12.37 14.40 16.83
15.18
15.03 13.87 12.38 14.34 15.54 12.67 15.57 14.40 14.81 17.05
14.86
15.33 14.19 12.23 14.95 15.68 12.20 15.95 13.75 14.73 16.90
15.05
1 Region map on page 23. 2 Includes Northeast I and Northeast II. 3 Includes Appalachian I and Appalachian II. 4 Includes Cornbelt I and Cornbelt II. 5 Includes Mountain I, Mountain II, and Mountain III. 6 Excludes Alaska and Hawaii.
Combined Field and Livestock Worker Gross Wage Rates by Type of Farm – Regions and 48 States: January 10-16, 2021 [Excludes agricultural service workers]
Regions1 Field
crop farms Other
crop farms Livestock and poultry farms
All farms
(dollars per hour) (dollars per hour) (dollars per hour) (dollars per hour)
Northeast 2 .............................................................. Appalachian 3 .......................................................... Southeast and Florida ............................................ Lake ......................................................................... Cornbelt 4 ................................................................ Delta ........................................................................ Northern Plains ....................................................... Southern Plains ...................................................... Mountain 5 ............................................................... Pacific and California ............................................. 48 States 6 ..............................................................
17.35 14.80 12.36 18.17 17.12 13.15 16.75 14.12 16.69 16.71
15.48
15.61 14.19 12.17 16.41 15.41 12.67 16.75 12.19 14.54 16.50
15.14
14.71 14.16 12.48 14.61 15.47 12.60 15.10 14.21 14.88 16.96
14.89
15.14 14.33 12.24 15.30 15.93 12.85 15.85 13.70 14.85 16.60
15.08
1 Region map on page 23. 2 Includes Northeast I and Northeast II. 3 Includes Appalachian I and Appalachian II. 4 Includes Cornbelt I and Cornbelt II. 5 Includes Mountain I, Mountain II, and Mountain III. 6 Excludes Alaska and Hawaii.
18 Farm Labor (May 2021) USDA, National Agricultural Statistics Service
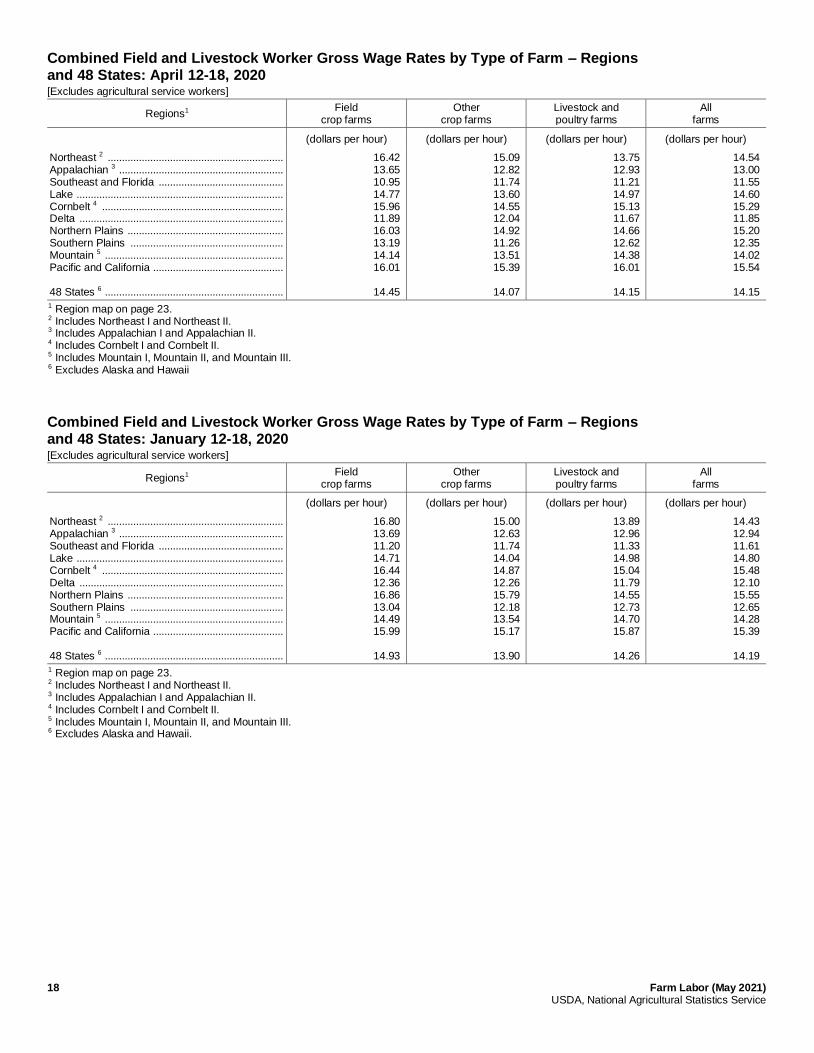
Combined Field and Livestock Worker Gross Wage Rates by Type of Farm – Regions and 48 States: April 12-18, 2020 [Excludes agricultural service workers]
Regions1 Field
crop farms Other
crop farms Livestock and poultry farms
All farms
(dollars per hour) (dollars per hour) (dollars per hour) (dollars per hour)
Northeast 2 .............................................................. Appalachian 3 .......................................................... Southeast and Florida ............................................ Lake ......................................................................... Cornbelt 4 ................................................................ Delta ........................................................................ Northern Plains ....................................................... Southern Plains ...................................................... Mountain 5 ............................................................... Pacific and California .............................................. 48 States 6 ...............................................................
16.42 13.65 10.95 14.77 15.96 11.89 16.03 13.19 14.14 16.01
14.45
15.09 12.82 11.74 13.60 14.55 12.04 14.92 11.26 13.51 15.39
14.07
13.75 12.93 11.21 14.97 15.13 11.67 14.66 12.62 14.38 16.01
14.15
14.54 13.00 11.55 14.60 15.29 11.85 15.20 12.35 14.02 15.54
14.15
1 Region map on page 23. 2 Includes Northeast I and Northeast II. 3 Includes Appalachian I and Appalachian II. 4 Includes Cornbelt I and Cornbelt II. 5 Includes Mountain I, Mountain II, and Mountain III. 6 Excludes Alaska and Hawaii
Combined Field and Livestock Worker Gross Wage Rates by Type of Farm – Regions and 48 States: January 12-18, 2020 [Excludes agricultural service workers]
Regions1 Field
crop farms Other
crop farms Livestock and poultry farms
All farms
(dollars per hour) (dollars per hour) (dollars per hour) (dollars per hour)
Northeast 2 .............................................................. Appalachian 3 .......................................................... Southeast and Florida ............................................ Lake ......................................................................... Cornbelt 4 ................................................................ Delta ........................................................................ Northern Plains ....................................................... Southern Plains ...................................................... Mountain 5 ............................................................... Pacific and California .............................................. 48 States 6 ...............................................................
16.80 13.69 11.20 14.71 16.44 12.36 16.86 13.04 14.49 15.99
14.93
15.00 12.63 11.74 14.04 14.87 12.26 15.79 12.18 13.54 15.17
13.90
13.89 12.96 11.33 14.98 15.04 11.79 14.55 12.73 14.70 15.87
14.26
14.43 12.94 11.61 14.80 15.48 12.10 15.55 12.65 14.28 15.39
14.19
1 Region map on page 23. 2 Includes Northeast I and Northeast II. 3 Includes Appalachian I and Appalachian II. 4 Includes Cornbelt I and Cornbelt II. 5 Includes Mountain I, Mountain II, and Mountain III. 6 Excludes Alaska and Hawaii.
Farm Labor (May 2021) 19 USDA, National Agricultural Statistics Service
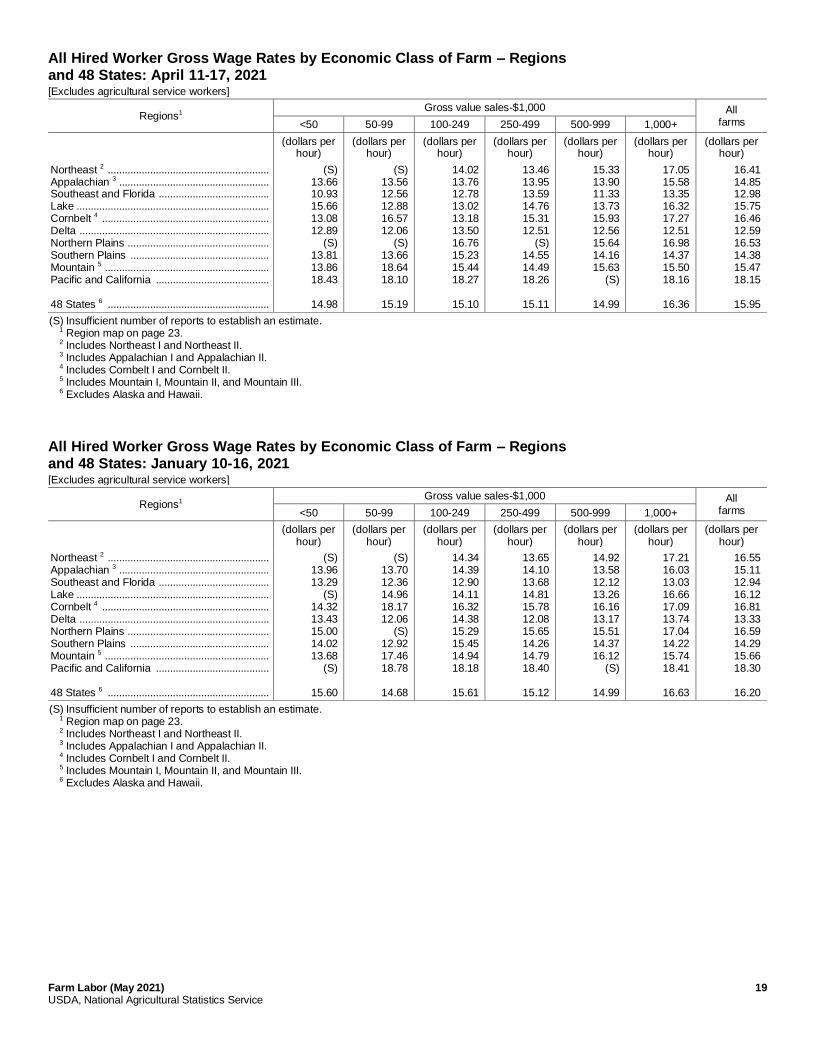
All Hired Worker Gross Wage Rates by Economic Class of Farm – Regions and 48 States: April 11-17, 2021 [Excludes agricultural service workers]
Regions1 Gross value sales-$1,000 All
farms <50 50-99 100-249 250-499 500-999 1,000+
(dollars per
hour) (dollars per
hour) (dollars per
hour) (dollars per
hour) (dollars per
hour) (dollars per
hour) (dollars per
hour)
Northeast 2 ......................................................... Appalachian 3 ..................................................... Southeast and Florida ....................................... Lake .................................................................... Cornbelt 4 ........................................................... Delta ................................................................... Northern Plains .................................................. Southern Plains ................................................. Mountain 5 .......................................................... Pacific and California ........................................ 48 States 6 .........................................................
(S) 13.66 10.93 15.66 13.08 12.89
(S) 13.81 13.86 18.43
14.98
(S) 13.56 12.56 12.88 16.57 12.06
(S) 13.66 18.64 18.10
15.19
14.02 13.76 12.78 13.02 13.18 13.50 16.76 15.23 15.44 18.27
15.10
13.46 13.95 13.59 14.76 15.31 12.51
(S) 14.55 14.49 18.26
15.11
15.33 13.90 11.33 13.73 15.93 12.56 15.64 14.16 15.63
(S)
14.99
17.05 15.58 13.35 16.32 17.27 12.51 16.98 14.37 15.50 18.16
16.36
16.41 14.85 12.98 15.75 16.46 12.59 16.53 14.38 15.47 18.15
15.95
(S) Insufficient number of reports to establish an estimate. 1 Region map on page 23. 2 Includes Northeast I and Northeast II. 3 Includes Appalachian I and Appalachian II. 4 Includes Cornbelt I and Cornbelt II. 5 Includes Mountain I, Mountain II, and Mountain III. 6 Excludes Alaska and Hawaii.
All Hired Worker Gross Wage Rates by Economic Class of Farm – Regions and 48 States: January 10-16, 2021 [Excludes agricultural service workers]
Regions1 Gross value sales-$1,000 All
farms <50 50-99 100-249 250-499 500-999 1,000+
(dollars per
hour) (dollars per
hour) (dollars per
hour) (dollars per
hour) (dollars per
hour) (dollars per
hour) (dollars per
hour)
Northeast 2 ......................................................... Appalachian 3 ..................................................... Southeast and Florida ....................................... Lake .................................................................... Cornbelt 4 ........................................................... Delta ................................................................... Northern Plains .................................................. Southern Plains ................................................. Mountain 5 .......................................................... Pacific and California ........................................ 48 States 6 .........................................................
(S) 13.96 13.29
(S) 14.32 13.43 15.00 14.02 13.68
(S)
15.60
(S) 13.70 12.36 14.96 18.17 12.06
(S) 12.92 17.46 18.78
14.68
14.34 14.39 12.90 14.11 16.32 14.38 15.29 15.45 14.94 18.18
15.61
13.65 14.10 13.68 14.81 15.78 12.08 15.65 14.26 14.79 18.40
15.12
14.92 13.58 12.12 13.26 16.16 13.17 15.51 14.37 16.12
(S)
14.99
17.21 16.03 13.03 16.66 17.09 13.74 17.04 14.22 15.74 18.41
16.63
16.55 15.11 12.94 16.12 16.81 13.33 16.59 14.29 15.66 18.30
16.20
(S) Insufficient number of reports to establish an estimate. 1 Region map on page 23. 2 Includes Northeast I and Northeast II. 3 Includes Appalachian I and Appalachian II. 4 Includes Cornbelt I and Cornbelt II. 5 Includes Mountain I, Mountain II, and Mountain III. 6 Excludes Alaska and Hawaii.
20 Farm Labor (May 2021) USDA, National Agricultural Statistics Service
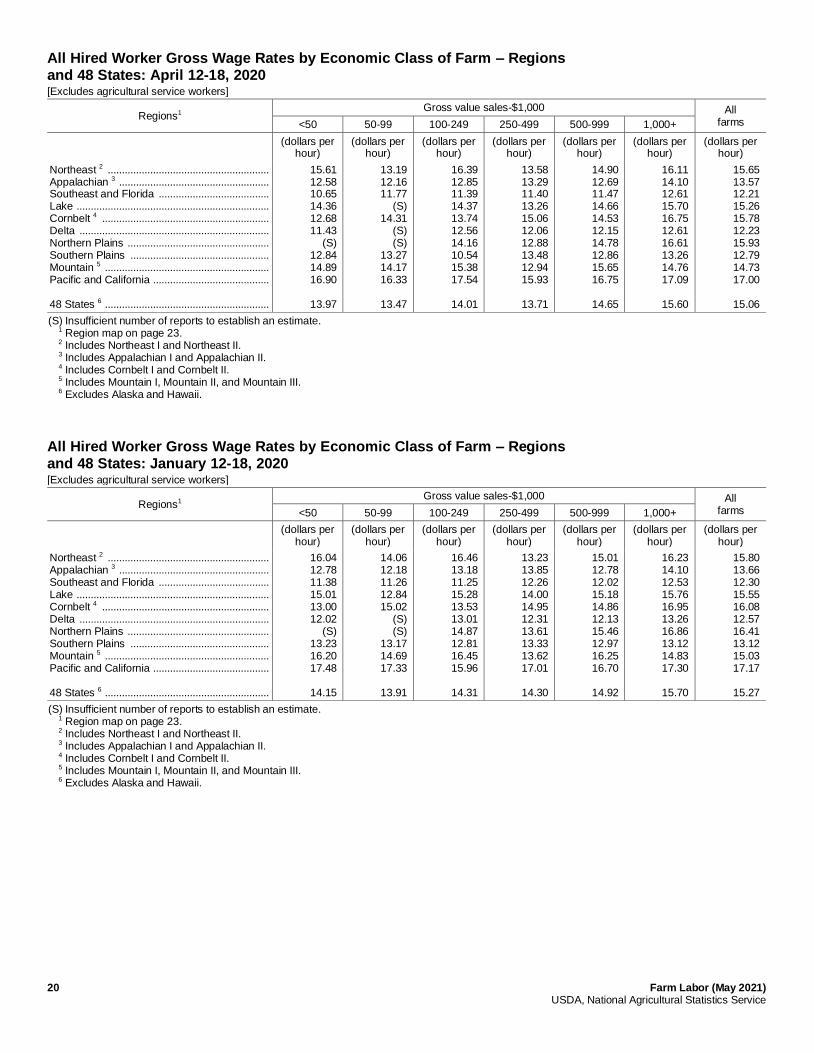
All Hired Worker Gross Wage Rates by Economic Class of Farm – Regions and 48 States: April 12-18, 2020 [Excludes agricultural service workers]
Regions1 Gross value sales-$1,000 All
farms <50 50-99 100-249 250-499 500-999 1,000+
(dollars per
hour) (dollars per
hour) (dollars per
hour) (dollars per
hour) (dollars per
hour) (dollars per
hour) (dollars per
hour)
Northeast 2 ......................................................... Appalachian 3 ..................................................... Southeast and Florida ....................................... Lake .................................................................... Cornbelt 4 ........................................................... Delta ................................................................... Northern Plains .................................................. Southern Plains ................................................. Mountain 5 .......................................................... Pacific and California ......................................... 48 States 6 ..........................................................
15.61 12.58 10.65 14.36 12.68 11.43
(S) 12.84 14.89 16.90
13.97
13.19 12.16 11.77
(S) 14.31
(S) (S)
13.27 14.17 16.33
13.47
16.39 12.85 11.39 14.37 13.74 12.56 14.16 10.54 15.38 17.54
14.01
13.58 13.29 11.40 13.26 15.06 12.06 12.88 13.48 12.94 15.93
13.71
14.90 12.69 11.47 14.66 14.53 12.15 14.78 12.86 15.65 16.75
14.65
16.11 14.10 12.61 15.70 16.75 12.61 16.61 13.26 14.76 17.09
15.60
15.65 13.57 12.21 15.26 15.78 12.23 15.93 12.79 14.73 17.00
15.06
(S) Insufficient number of reports to establish an estimate. 1 Region map on page 23. 2 Includes Northeast I and Northeast II. 3 Includes Appalachian I and Appalachian II. 4 Includes Cornbelt I and Cornbelt II. 5 Includes Mountain I, Mountain II, and Mountain III. 6 Excludes Alaska and Hawaii.
All Hired Worker Gross Wage Rates by Economic Class of Farm – Regions and 48 States: January 12-18, 2020 [Excludes agricultural service workers]
Regions1 Gross value sales-$1,000 All
farms <50 50-99 100-249 250-499 500-999 1,000+
(dollars per
hour) (dollars per
hour) (dollars per
hour) (dollars per
hour) (dollars per
hour) (dollars per
hour) (dollars per
hour)
Northeast 2 ......................................................... Appalachian 3 ..................................................... Southeast and Florida ....................................... Lake .................................................................... Cornbelt 4 ........................................................... Delta ................................................................... Northern Plains .................................................. Southern Plains ................................................. Mountain 5 .......................................................... Pacific and California ......................................... 48 States 6 ..........................................................
16.04 12.78 11.38 15.01 13.00 12.02
(S) 13.23 16.20 17.48
14.15
14.06 12.18 11.26 12.84 15.02
(S) (S)
13.17 14.69 17.33
13.91
16.46 13.18 11.25 15.28 13.53 13.01 14.87 12.81 16.45 15.96
14.31
13.23 13.85 12.26 14.00 14.95 12.31 13.61 13.33 13.62 17.01
14.30
15.01 12.78 12.02 15.18 14.86 12.13 15.46 12.97 16.25 16.70
14.92
16.23 14.10 12.53 15.76 16.95 13.26 16.86 13.12 14.83 17.30
15.70
15.80 13.66 12.30 15.55 16.08 12.57 16.41 13.12 15.03 17.17
15.27
(S) Insufficient number of reports to establish an estimate. 1 Region map on page 23. 2 Includes Northeast I and Northeast II. 3 Includes Appalachian I and Appalachian II. 4 Includes Cornbelt I and Cornbelt II. 5 Includes Mountain I, Mountain II, and Mountain III. 6 Excludes Alaska and Hawaii.
Farm Labor (May 2021) 21 USDA, National Agricultural Statistics Service
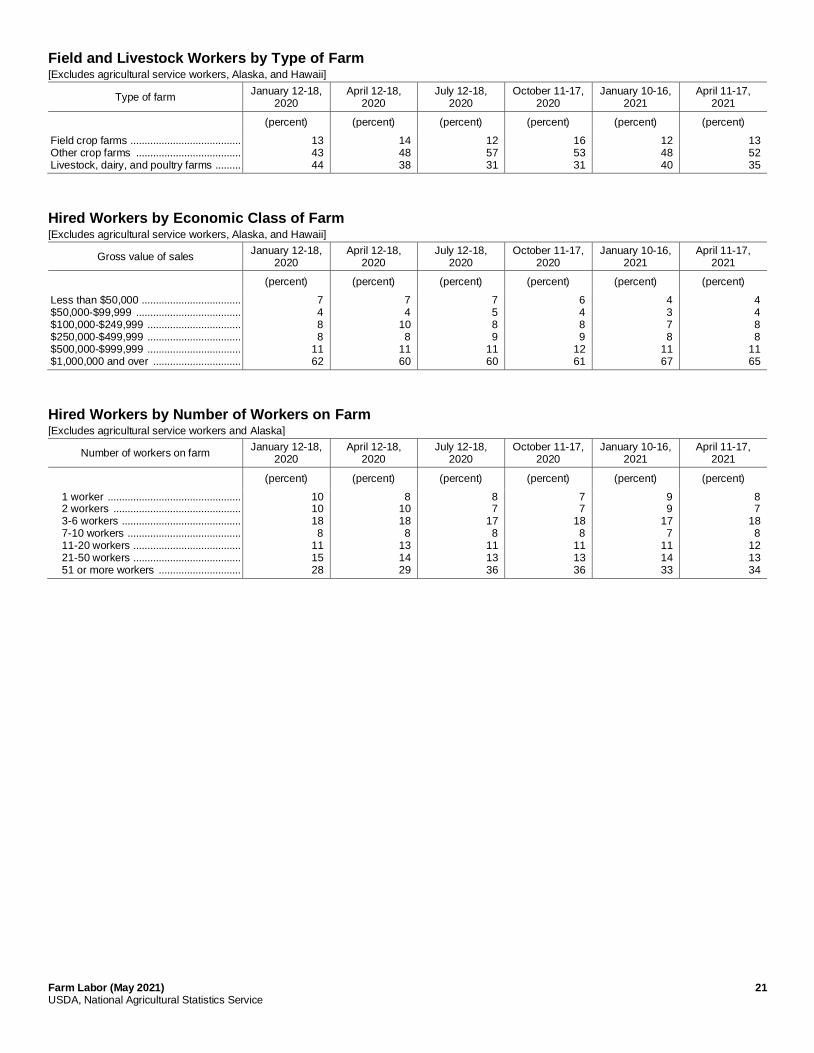
Field and Livestock Workers by Type of Farm [Excludes agricultural service workers, Alaska, and Hawaii]
Type of farm January 12-18,
2020 April 12-18,
2020 July 12-18,
2020 October 11-17,
2020 January 10-16,
2021 April 11-17,
2021
(percent) (percent) (percent) (percent) (percent) (percent)
Field crop farms ....................................... Other crop farms ..................................... Livestock, dairy, and poultry farms .........
13 43 44
14 48 38
12 57 31
16 53 31
12 48 40
13 52 35
Hired Workers by Economic Class of Farm [Excludes agricultural service workers, Alaska, and Hawaii]
Gross value of sales January 12-18,
2020 April 12-18,
2020 July 12-18,
2020 October 11-17,
2020 January 10-16,
2021 April 11-17,
2021
(percent) (percent) (percent) (percent) (percent) (percent)
Less than $50,000 ................................... $50,000-$99,999 ..................................... $100,000-$249,999 ................................. $250,000-$499,999 ................................. $500,000-$999,999 ................................. $1,000,000 and over ...............................
7 4 8 8
11 62
7 4
10 8
11 60
7 5 8 9
11 60
6 4 8 9
12 61
4 3 7 8
11 67
4 4 8 8
11 65
Hired Workers by Number of Workers on Farm [Excludes agricultural service workers and Alaska]
Number of workers on farm January 12-18,
2020 April 12-18,
2020 July 12-18,
2020 October 11-17,
2020 January 10-16,
2021 April 11-17,
2021
(percent) (percent) (percent) (percent) (percent) (percent)
1 worker ............................................... 2 workers ............................................. 3-6 workers .......................................... 7-10 workers ........................................ 11-20 workers ...................................... 21-50 workers ...................................... 51 or more workers .............................
10 10 18 8
11 15 28
8 10 18 8
13 14 29
8 7
17 8
11 13 36
7 7
18 8
11 13 36
9 9
17 7
11 14 33
8 7
18 8
12 13 34
22 Farm Labor (May 2021) USDA, National Agricultural Statistics Service
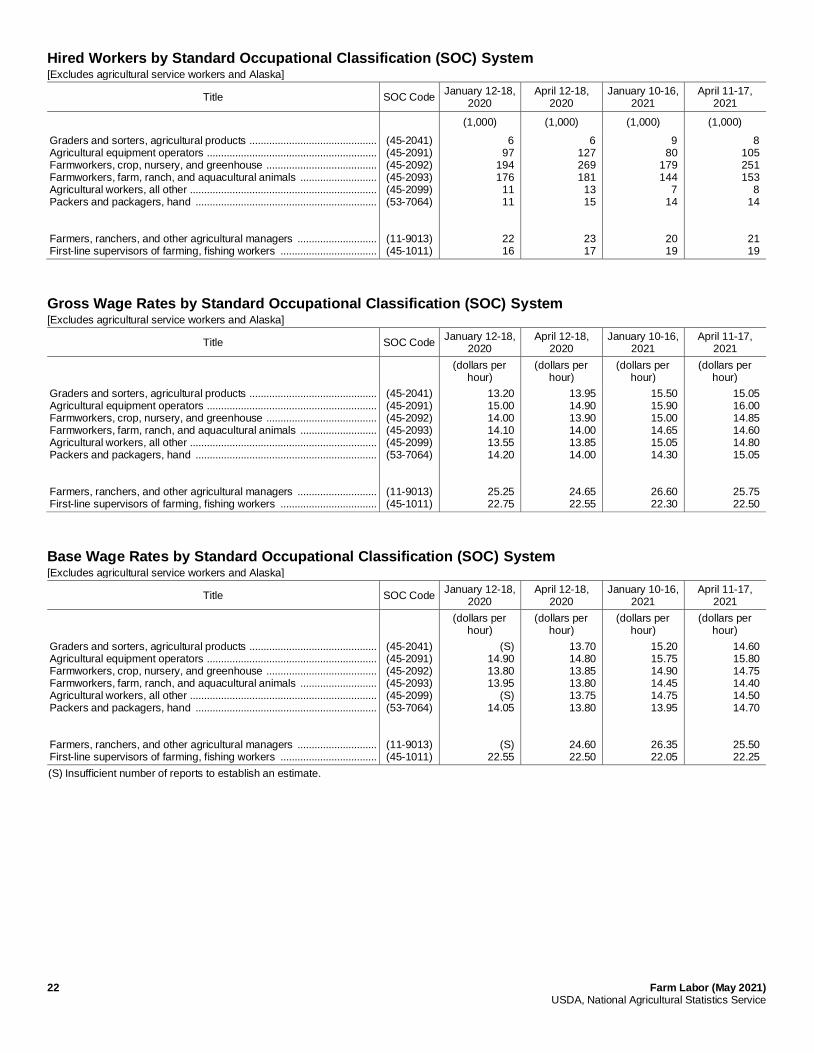
Hired Workers by Standard Occupational Classification (SOC) System [Excludes agricultural service workers and Alaska]
Title SOC Code January 12-18,
2020 April 12-18,
2020 January 10-16,
2021 April 11-17,
2021
(1,000) (1,000) (1,000) (1,000)
Graders and sorters, agricultural products ............................................. Agricultural equipment operators ............................................................ Farmworkers, crop, nursery, and greenhouse ....................................... Farmworkers, farm, ranch, and aquacultural animals ........................... Agricultural workers, all other .................................................................. Packers and packagers, hand ................................................................ Farmers, ranchers, and other agricultural managers ............................ First-line supervisors of farming, fishing workers ..................................
(45-2041) (45-2091) (45-2092) (45-2093) (45-2099) (53-7064)
(11-9013) (45-1011)
6 97
194 176
11 11
22 16
6 127 269 181
13 15
23 17
9 80
179 144
7 14
20 19
8 105 251 153
8 14
21 19
Gross Wage Rates by Standard Occupational Classification (SOC) System [Excludes agricultural service workers and Alaska]
Title SOC Code January 12-18,
2020 April 12-18,
2020 January 10-16,
2021 April 11-17,
2021
(dollars per
hour) (dollars per
hour) (dollars per
hour) (dollars per
hour)
Graders and sorters, agricultural products ............................................. Agricultural equipment operators ............................................................ Farmworkers, crop, nursery, and greenhouse ....................................... Farmworkers, farm, ranch, and aquacultural animals ........................... Agricultural workers, all other .................................................................. Packers and packagers, hand ................................................................ Farmers, ranchers, and other agricultural managers ............................ First-line supervisors of farming, fishing workers ..................................
(45-2041) (45-2091) (45-2092) (45-2093) (45-2099) (53-7064)
(11-9013) (45-1011)
13.20 15.00 14.00 14.10 13.55 14.20
25.25 22.75
13.95 14.90 13.90 14.00 13.85 14.00
24.65 22.55
15.50 15.90 15.00 14.65 15.05 14.30
26.60 22.30
15.05 16.00 14.85 14.60 14.80 15.05
25.75 22.50
Base Wage Rates by Standard Occupational Classification (SOC) System [Excludes agricultural service workers and Alaska]
Title SOC Code January 12-18,
2020 April 12-18,
2020 January 10-16,
2021 April 11-17,
2021
(dollars per
hour) (dollars per
hour) (dollars per
hour) (dollars per
hour)
Graders and sorters, agricultural products ............................................. Agricultural equipment operators ............................................................ Farmworkers, crop, nursery, and greenhouse ....................................... Farmworkers, farm, ranch, and aquacultural animals ........................... Agricultural workers, all other .................................................................. Packers and packagers, hand ................................................................ Farmers, ranchers, and other agricultural managers ............................ First-line supervisors of farming, fishing workers ..................................
(45-2041) (45-2091) (45-2092) (45-2093) (45-2099) (53-7064)
(11-9013) (45-1011)
(S) 14.90 13.80 13.95
(S) 14.05
(S) 22.55
13.70 14.80 13.85 13.80 13.75 13.80
24.60 22.50
15.20 15.75 14.90 14.45 14.75 13.95
26.35 22.05
14.60 15.80 14.75 14.40 14.50 14.70
25.50 22.25
(S) Insufficient number of reports to establish an estimate.
Farm Labor (May 2021) 23 USDA, National Agricultural Statistics Service
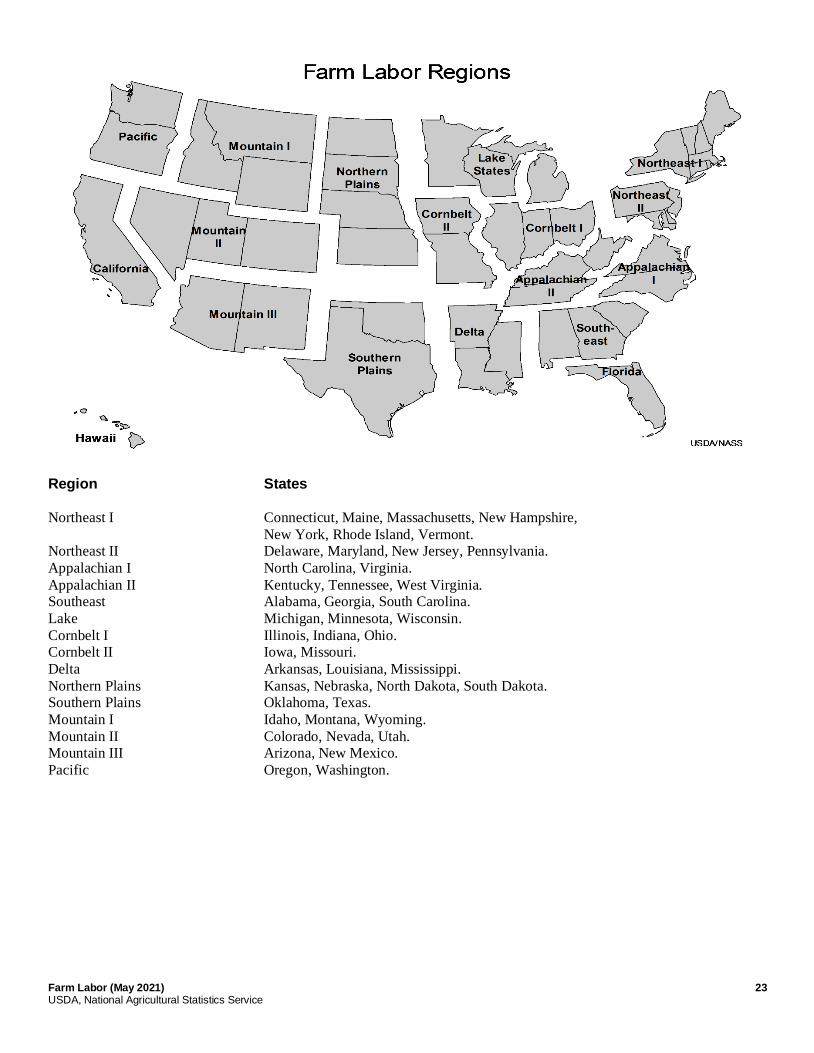
Region States
Northeast I Connecticut, Maine, Massachusetts, New Hampshire,
New York, Rhode Island, Vermont. Northeast II Delaware, Maryland, New Jersey, Pennsylvania.
Appalachian I North Carolina, Virginia.
Appalachian II Kentucky, Tennessee, West Virginia. Southeast Alabama, Georgia, South Carolina.
Lake Michigan, Minnesota, Wisconsin.
Cornbelt I Illinois, Indiana, Ohio. Cornbelt II Iowa, Missouri.
Delta Arkansas, Louisiana, Mississippi.
Northern Plains Kansas, Nebraska, North Dakota, South Dakota. Southern Plains Oklahoma, Texas.
Mountain I Idaho, Montana, Wyoming.
Mountain II Colorado, Nevada, Utah. Mountain III Arizona, New Mexico.
Pacific Oregon, Washington.
24 Farm Labor (May 2021) USDA, National Agricultural Statistics Service
Farm Labor Definitions The following definitions are provided to assist in interpreting statistics published in Farm Labor reports. To ensure
consistency in data collection, the questionnaires and instruction manual used by the interviewers provide more in-depth
explanations of these terms.
Farm or Ranch: The target population unit for the Farm Labor Survey, which is any place with $1,000 or more in annual
agricultural sales (or potential sales).
Agricultural Work: Work done on a farm or ranch in connection with the production of agricultural products, including
nursery and greenhouse products and animal specialties such as fur farms or apiaries. Also included is work done off the farm to handle farm related business, such as trips to buy feed or deliver products to local market.
Hired Worker: Anyone, other than an agricultural service worker, who was paid for at least one hour of agricultural work on a farm or ranch. Worker type is determined by what the employee was primarily hired to do, not necessarily what
work was done during the survey week. Types of workers include:
Field Workers: Employees engaged in planting, tending and harvesting crops including operation of farm machinery
on crop farms. The Standard Occupation Classification (SOC) codes and titles associated with field workers are 45-
2041: Graders and Sorters, Agricultural Products; 45-2091: Agricultural Equipment Operators; 45-2092: Farmworkers and Laborers, Crop, Nursery and Greenhouse; 45-2099: Agricultural Workers, All Other; 53-7064:
Packers and Packagers, Hand.
Livestock Workers: Employees tending livestock, milking cows or caring for poultry, including operation of farm
machinery on livestock or poultry operations. SOC codes and titles associated with livestock workers are 45-2041:
Graders and Sorters, Agricultural Products; 45-2093: Farmworkers, Farm, Ranch, and Aquacultural Animals; 45-2099: Agricultural Workers, All Other; 53-7064: Packers and Packagers, Hand.
Supervisors: Hired managers, range foremen, crew leaders, etc. SOC codes and titles associated with supervisors are 11-9013: Farmers, Ranchers, and Other Agricultural Managers; 45-1011: First-Line Supervisors of Farming, Fishing,
and Forestry Workers.
Other Workers: Employees engaged in agricultural work not included in the other three categories. Bookkeepers
and pilots are examples. SOC codes and titles associated with other workers include but are not limited to 45-2011:
Agricultural Inspectors; 45-2021: Animal Breeders; 37-2012: Pesticide Handlers, Sprayers, and Applicators, Vegetation.
For more information on the applicable Standard Occupational Classification codes, see “Crosswalk from National Agricultural Statistics Service Farm Labor Survey to the Standard Occupational Classification System” at the “Surveys
and Programs” page for Farm Labor, on the NASS website (http://www.nass.usda.gov).
Methods of Pay: All wage rates are calculated based on total wages paid and total hours worked during the survey
reference week. Wages paid other than hourly (bi-weekly, monthly, etc.) are converted to an hourly basis prior to
summarization. Wages paid by piece rate (per quantity of produce picked, etc.) are also converted to an hourly basis.
Base Hours: Base hours are the number of hours worked, for which base wages are paid. Base hours are used in the
calculation of base wage rates beginning in year 2020. Base hours were not collected prior to year 2020.
Gross Wage Rate: Gross wages are the total amount paid to workers before taxes and other deductions; the rate is per
hour. The worker’s share of social security and unemployment insurance is included, but the employer’s share is excluded. Gross wages may include in-kind payments (e.g., agricultural product like a side of beef, bushels of grain, etc.) provided
in lieu of wages for work done. The value of perquisites is excluded from gross wages.
Farm Labor (May 2021) 25 USDA, National Agricultural Statistics Service
Base Wage Rate: Base wages are gross wages less regularly paid bonuses, overtime pay, or other incentive pay.
Beginning in year 2020, the rate is per base hour. In 2019, the rate is per gross hour. For employees receiving incentive pay such as piece rate pay or commissions, base wages are the minimum amount guaranteed.
Perquisites: Benefits, such as cash bonuses, housing, or meals, provided to an employee in addition to pay are included in perquisites. Wage rates published in this release do not include the value of these benefits.
Term of Employment: The length of time during the year the farm operator expects to employ those workers who were on the payroll during the survey week.
Agricultural Service: Any farm-related service performed on a farm or ranch on a contract or fee basis. This primarily includes activities performed by contract workers on fruit, vegetable, or berry operations. It also includes custom work,
veterinarian work, artificial insemination, sheep shearing, milk testing, or any other farm-related activity performed on a
farm or ranch on a “fee per service” basis. The agricultural services component has been discontinued from the Farm Labor Survey.
Contract Labor: Contract workers are paid by a crew leader, contractor, buyer, processor, cooperative, or other person who has an oral or written agreement with a farmer/rancher. Pruning, thinning, weeding or harvesting of fruit, vegetable
or berry crops are examples. A machine is not a part of the service activity provided by the contractor. The Farm Labor
Survey excludes measures of contract labor.
Custom Work: Work performed by machines and labor hired as a unit. Hay baling, combining, corn or cotton picking,
spraying, fertilizing, and laser leveling are examples of custom work when the equipment is included in the service activity. The Farm Labor Survey excludes measures of custom labor.
Type of Farm (or Ranch): An operation is classified in the farm type which accounts for the largest portion of the total gross value of sales for its agricultural production.
Types of farms broken out in this publication are:
Field Crops: A farm producing wheat, rice, corn, soybeans, barley, dry beans, rye, sorghum, cotton, popcorn,
tobacco, or other such crops.
Other Crops: A farm producing vegetables, melons, berry crops, grapes, tree nuts, citrus fruits, deciduous tree
fruits, avocados, dates, figs, olives, nursery, or greenhouse crops. This category also includes farms producing potatoes, sugar crops, hay, peanuts, hops, mint, and maple syrup.
Livestock or Poultry: A farm producing cattle, hogs, sheep, goats, milk, chickens, eggs, turkeys, or animal specialties such as furs, fish, honey, etc.
Gross Value of Sales: This includes all income during a year from the sale of crops, livestock, dairy, poultry, or other related agricultural products, including the landlord's share and the value of products produced under contract. When
commodities are placed under CCC loan, they are considered sold.
26 Farm Labor (May 2021) USDA, National Agricultural Statistics Service
Survey Methodology
Survey Procedures: The NASS Agricultural (Farm) Labor Survey is conducted semi-annually in April and October, in
all surveyed states except California. During the April data collection, data for both January and April reference weeks are
collected. During the October data collection, data for both July and October reference weeks are collected. The quarterly reference week is the Sunday to Saturday period which includes the 12th day of the month. For California, collection of
these data is currently conducted on a quarterly basis, as part of the California Employment Development Department
monthly labor program.
The target population for the Farm Labor Survey program is all operations which meet the definition of a farm or ranch.
An optimal sample is selected in each state. Beginning with the July and October 2019 survey, the sample size was increased to approximately 38,000 operations to accommodate program expansion. The Farm Labor Survey is a multiple
frame survey, incorporating samples from both the NASS list and area frames to ensure adequate coverage.
Farms on the list frame are sampled through a hierarchical stratified design, with strata based on measures of size. Those
operations with associated control data indicating peak numbers of workers are stratified based on these values, and those
expected to employ large numbers of workers (higher peak number values) are selected with the greatest frequency. Farms on the list frame which do not have peak worker control data are stratified and sampled based on farm value of
sales. Farms stratified by farm value of sales are selected at a lower frequency.
In order to provide coverage of farms not currently part of the NASS list frame, a second sample is drawn consisting of
segments of land selected from the NASS area frame. The area frame contains all land in the state and, as such, is
complete. The land is stratified according to intensity of agriculture using satellite imagery. The land in each stratum is divided into segments of roughly one square mile. Segments are optimally allocated and sampled to effectively measure
crops and livestock. The sampled segments are fully enumerated in June. All farms and ranches found operating tracts in
these segments are checked to see if they are included in the list frame hired labor population. The farms and ranches that are not included in the list frame labor population, called nonoverlap tracts, are sampled for the Farm Labor Survey so that
the target population is completely represented. The area frame component is enumerated during each semi-annual data
collection period along with the list sample.
Most respondents are first contacted through self-administered mailed questionnaires, which can be completed either by
hand or securely online. Nonresponse to the mail and online request is followed-up by telephone enumeration. All manually completed survey questionnaires are returned to the NASS National Operations Center, where they are visually
reviewed and key entered.
Throughout the data collection process, steps are taken to minimize the impact of nonsampling errors such as reporting,
recording, and editing errors. These steps include questionnaire testing, comprehensive interviewer training, validation,
and verification of processing systems, application of detailed computer edits, and evaluation of the data via the analysis tools.
Estimating Procedures: Nonresponse adjustment is necessary to account for producers who refuse to participate in the survey, cannot be located during the data collection period, or who submit incomplete reports. These nonrespondents must
be accounted for if accurate estimates of farm labor are to be made. For the Farm Labor Survey, nonrespondents are
accounted for by adjusting the weights of the respondents. The adjustment occurs by stratum as all strata represent homogeneous groupings of similar sized farms. The adjustment is performed by individual item on the questionnaire so
adjustments for item nonresponse (partial reports) and unit nonresponse (refusals and inaccessibles) are done in a single
calculation.
For estimation of data items, point estimates called direct expansions are calculated by multiplying the reported value by
the final adjusted weight (initial sampling weight adjusted for nonresponse) and summing to a stratum total. A variance estimate is also computed at the stratum level. The nonoverlap tracts are treated as an additional stratum. Totals and
variances are additive across strata to form state level point estimates.
Farm Labor (May 2021) 27 USDA, National Agricultural Statistics Service
Ratio estimates are also computed for many items. For example, wage rates are calculated as the ratio of total wages to
total hours worked. Ratio estimates use the reweighted estimator described above for the numerator and denominator direct expansions. Both the numerator and denominator must be usable in order for that record to be used in the ratio
estimator.
The number of hired workers, average hours worked, average wage rate data, and all associated sub-items are summarized
from the dataset. Because an identical data collection instrument (questionnaire) and follow-up interview are used for all
states, as well as identical editing, analysis, and summarization processes, state data can be summarized and regional and national survey point estimates computed. For estimation purposes, point estimates are adopted as survey indicat ions for
all data items. The summary results provide multiple direct and ratio indications for each data series being estimated. The
results also provide information used to assess the performance of the current survey and evaluate the quality of the survey indications. NASS Regional Field Offices review the state level indications and submit state level comments
documenting state specific concerns to NASS headquarters. NASS headquarters completes the regional and national level
summaries, which utilize the same estimators and produce the same indications as the state level summaries.
All estimates are set at NASS headquarters. Starting in 2020, model-based estimates of hired workers, average hours
worked, average wage rates, and the associated sub-items are produced to support NASS estimation processes. Statistical models are mathematical equations that relate quantities of interest (in this case, number of workers, hours, and wage
rates) to a set of important input factors. The models used by NASS relate the direct expansions obtained from the current
Farm Labor Survey to previous year, same quarter official estimates. This modeling approach improves the precision of the resulting estimates. In particular, estimates in publication cells derived from few reports become more precise than
estimates derived from survey alone.
For the final step in the estimation process, NASS assembles a panel of statisticians to serve as the Agricultural Statistics
Board (ASB) for the Farm Labor Survey. The Farm Labor ASB reviews both the modeled and survey indications and
establishes all final, official estimates for the Farm Labor Survey program. Since larger sample sizes yield more precise results, the ASB employs the “top-down” approach by determining the national level estimates first and reconciling the
state, regional, and national numbers for all estimates including number of hired workers, average hours worked, average
wage rates, and associated sub-items. As part of the semi-annual process, the ASB also considers revised indications and issues revisions of previously published estimates where appropriate. Additionally, the ASB reviews the annual average
estimates for the November publication, which are summarized from the final regional and national level estimates for
each of the four quarters. Through examining indications across states and regions, re-examining outliers, and considering state level comments, the ASB is able to establish all final estimates according to both local conditions and regional and
national conditions and trends.
Revision Policy: Farm labor statistics are subject to revision semi-annually and annually. Revisions must be supported by
additional data that directly affect the level of the estimate. Worker numbers and wage rates for January, April, and
October 2020 were subject to revision with this report.
For More Information
For more information on the Farm Labor Survey methodology and quality measures, see “Farm Labor Survey Methodology and Quality Measures” on the NASS website (http://www.nass.usda.gov).
28 Farm Labor (May 2021) USDA, National Agricultural Statistics Service
Information Contacts Listed below are the commodity statisticians in the Environmental, Economics, and Demographics Branch of the National
Agricultural Statistics Service to contact for additional information. E-mail inquiries may be sent to [email protected].
Tony Dorn, Chief, Environmental, Economics, and Demographics Branch .................................................. (202) 720-6146
Bruce Boess, Head, Economics Section ........................................................................................................ (202) 720-4447
Stephanie Brennan – Farm Computer Use, Farm Production Expenditures ............................................ (202) 690-0392
Kuan Chen – Prices, Prices Indexes, Parity Prices .................................................................................. (202) 690-3347 Doug Farmer – Chemical Use, Land Values........................................................................................... (202) 690-3229
Zoe Johnson – Cash Receipts, Farm Production Expenditures ............................................................... (202) 720-5446
Thomas Laidley – Prices Received Indexes, Parity Prices ...................................................................... (202) 221-9280 Michael Mathison – Cash Rents, Farms, Land in Farms, Grazing Fees .................................................. (202) 720-3243
Max Reason – Prices Received Indexes, Parity Prices, Prices Paid Indexes ........................................... (202) 720-8844
Theresa Varner – Farm Labor ................................................................................................................ (202) 690-3231
Access to NASS Reports For your convenience, you may access NASS reports and products the following ways:
➢ All reports are available electronically, at no cost, on the NASS web site: www.nass.usda.gov
➢ Both national and state specific reports are available via a free e-mail subscription. To set-up this free
subscription, visit www.nass.usda.gov and click on “National” or “State” in upper right corner above “search” box to create an account and select the reports you would like to receive.
➢ Cornell’s Mann Library has launched a new website housing NASS’s and other agency’s archived reports. The new website, https://usda.library.cornell.edu. All email subscriptions containing reports will be sent from the new
website, https://usda.library.cornell.edu. To continue receiving the reports via e-mail, you will have to go to the
new website, create a new account and re-subscribe to the reports. If you need instructions to set up an account or subscribe, they are located at: https://usda.library.cornell.edu/help. You should whitelist notifications@usda-
esmis.library.cornell.edu in your email client to avoid the emails going into spam/junk folders.
For more information on NASS surveys and reports, call the NASS Agricultural Statistics Hotline at (800) 727-9540,
7:30 a.m. to 4:00 p.m. ET, or e-mail: [email protected].
The U.S. Department of Agriculture (USDA) prohibits discrimination against its customers, employees, and applicants for
employment on the basis of race, color, national origin, age, disability, sex, gender identity, religion, reprisal, and where
applicable, political beliefs, marital status, familial or parental status, sexual orientation, or all or part of an individual's income is derived from any public assistance program, or protected genetic information in employment or in any program
or activity conducted or funded by the Department. (Not all prohibited bases will apply to all programs and/or
employment activities.)
If you wish to file a Civil Rights program complaint of discrimination, complete the USDA Program Discrimination Complaint Form (PDF), found online at www.ascr.usda.gov/filing-program-discrimination-complaint-usda-customer, or
at any USDA office, or call (866) 632-9992 to request the form. You may also write a letter containing all of the
information requested in the form. Send your completed complaint form or letter to us by mail at U.S. Department of Agriculture, Director, Office of Adjudication, 1400 Independence Avenue, S.W., Washington, D.C. 20250-9410, by fax
(202) 690-7442 or email at [email protected].