Embed Size (px)
Citation preview

FARM-GATE PRICE MONITORING IN SELECTED IMPACT COUNTRIES
EL SALVADOR
March 2015
CONTENTS
CONTE NTS ................................................................................................................................................... 1
1. INTRO DUCT ION ................................................................................................................................... 2
2. FAR M-GATE PRICE D ATA C OLL ECT ION I N EL SALVAD OR : DAT A REPORT ING ................................... 3
3. PRICE TRENDS AND PRI C E DI FFERE NTI AL S ......................................................................................... 4
4. SALE VOL UME S AND FARM ERS ’ SELECT IO N O F M ARKE TI NG CH ANNEL S ......................................... 10
5. INCO ME RECE IVED : M AI N COMMO DIT IE S AND M ARK ETING CH ANNEL S ......................................... 15
ANNEX I . REG ULAR ITY O F DAT A RE PORTI NG .......................................................................................... 17
ANNEX I I - INDIVI DU AL SALES ................................................................................................................. 18
KEY FINDINGS
Between July 2013 and February 2014, maize was the primary crop sold by monitored farmers, counting 114 Mt (two thirds of total supplies). Western municipalities were the main sales area and absorbed 82% of marketed volumes for any commodity.
Access to multiple marketing channels was limited for farmers in the data sample: nearly half of farmers did not record any sales during the reporting period; 80% of the remaining farmers relied on only one or two marketing channels for selling their produce.
P4P-supported contracting involved 4 sampled lead farmers only (20% of the sample), who globally provided 80 Mt of crops (43% of total sales) during harvesting and lean season.
The analysis of sale trends suggests that there was no clear relationship between price differences among selling points and marketing decisions, even when more options were available to single farmers. The farm gate was the main channel for maize during harvest, despite prices being equal or lower than at other points of sale. This affirmation seems coherent with the circumstance that selling at the farm gate minimizes transaction costs for smallholders.
During harvest, nearly 97% of marketed beans were channeled through P4P-supported FOs although the price for this commodity was on average lower than corresponding prices at the farm gate or in other markets. This statement is difficult to explain without further qualitative data to complement limited quantitative data available. Possible motivations could lay in specific agreements between farmers and FOs, for example regarding improved access to private buyers or input suppliers.
Farm Gate Price Monitoring - El Salvador Report - VAM P a g e | 2
1. Introduction
Since 2013, the P4P-VAM Farm-Gate Price Data Collection pilot has established a GRASP-based monitoring
system for prices and sales of P4P-supported farmers’ organizations (FOs) in four impact countries: El
Salvador, Ethiopia, Ghana, and Tanzania.
El Salvador was the first country to launch the price monitoring exercise with the dual aim to promote
better understanding of farmers’ marketing behaviour and to support the strengthening of price data
collection through the integration of farm gate prices into VAM’s online price tools.
This report provides an analysis of major sales and price trends based on data recorded in the country
between August 2013 and February 2014.
The data collection in El Salvador involved 18
lead farmers in diverse municipalities2, all of
them being members of FOs supported by P4P
activities since 2009 (Box 1). The farmers
submitted 590 weekly reports, which reduced to
250 after data cleaning.
The dataset comprises weekly observations of
prevailing market prices, farmers’ selling prices,
and sale volumes of four commodities (beans,
maize, rice, and sorghum) in diverse marketing
channels: local markets, farm-gate,
intermediaries (coyotes), P4P-supported FOs or
other markets (en otro mercado).
Results from the analysis will be discussed in light
of the four dimensions3: marketing channel,
time, price, and volume.
More specifically, the study aims to:
Analyse regularity in data reporting and
data availability for successive analysis
(Section 2);
Compare average selling prices and seasonal price trends of main commodities in the data
sample(Section 3.2; Section 3.3) ; track major differentials among average selling prices at
different points of sale and in relation to prevailing market price levels (Section 3.4);
Analyse farmers’ access to marketing channels (Section 4.2), main sales patterns (Section 4.3) and
trends in the allocation of sale volumes during data collection (Section 4.4);
Report on shares of the income received by main commodities and marketing channels in the data
sample (Section 5).
1 Source: Purchase for Progress (P4P) El Salvador. Available at: http://documents.wfp.org/stellent/groups/public/documents/communications/wfp265562.pdf. 2 Based on GPS co-ordinates provided by the GRASP-based system, the following municipalities were identified: San Lorenzo, Tacuba, Turin, and Atiquizaya in the western area of the country, San Esteban, San Sebastian, Santa Elena, Ciudad Barrios in central and eastern zones; 3 As highlighted during the NFR of a meeting on P4P-VAM farm-gate price monitoring in February 2012.
Box 1 – Background: P4P in El Salvador
Since 2009, Purchase for Progress (P4P) implementation in El Salvador focused on enhancing smallholder farmers’ market opportunities and access to credit.
Totally, the P4P five-year-pilot involved 8,588 farmers distributed in 20 farmers’ organizations (FOs).
Negotiation rounds were established to promote sustainable connections between FOs and the private sector, comprising input suppliers and buyers. P4P-supported farmers received training for improving their capacity to meet buyers’ requirements and improve the collective marketing of their produce.
P4P support to the management of revolving funds helped FOs in becoming reliable actors for financial institutions and benefit from more favourable credit conditions.
Sales through P4P-supported FOs provided smallholder farmers with enhanced access to WFP and non-WFP procurement processes: nearly 5,758 Mt of food were purchased by WFP in El Salvador during the pilot; additional 5,866 Mt of grains (mostly maize and beans) were purchased by other buyers in the private sector.1
Farm Gate Price Monitoring - El Salvador Report - VAM P a g e | 3
2. Farm-gate price data collection in El Salvador: data reporting
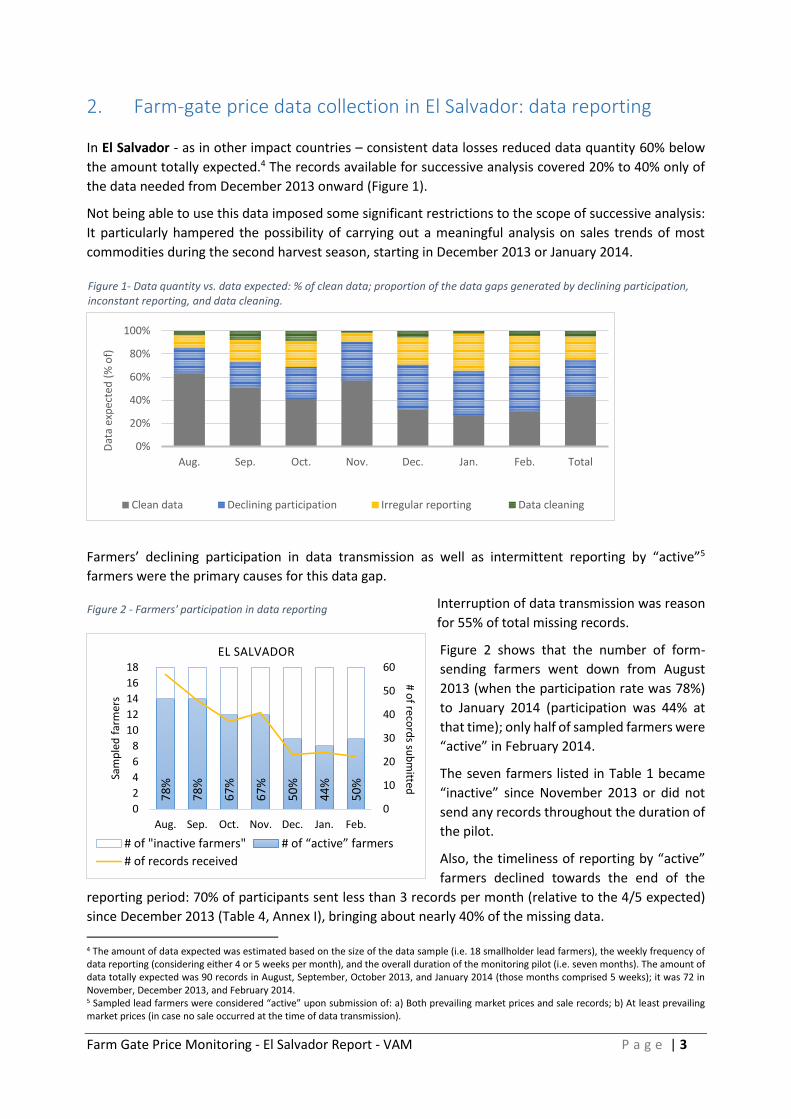
In El Salvador - as in other impact countries – consistent data losses reduced data quantity 60% below
the amount totally expected.4 The records available for successive analysis covered 20% to 40% only of
the data needed from December 2013 onward (Figure 1).
Not being able to use this data imposed some significant restrictions to the scope of successive analysis:
It particularly hampered the possibility of carrying out a meaningful analysis on sales trends of most
commodities during the second harvest season, starting in December 2013 or January 2014.
Farmers’ declining participation in data transmission as well as intermittent reporting by “active”5
farmers were the primary causes for this data gap.
Interruption of data transmission was reason
for 55% of total missing records.
Figure 2 shows that the number of form-
sending farmers went down from August
2013 (when the participation rate was 78%)
to January 2014 (participation was 44% at
that time); only half of sampled farmers were
“active” in February 2014.
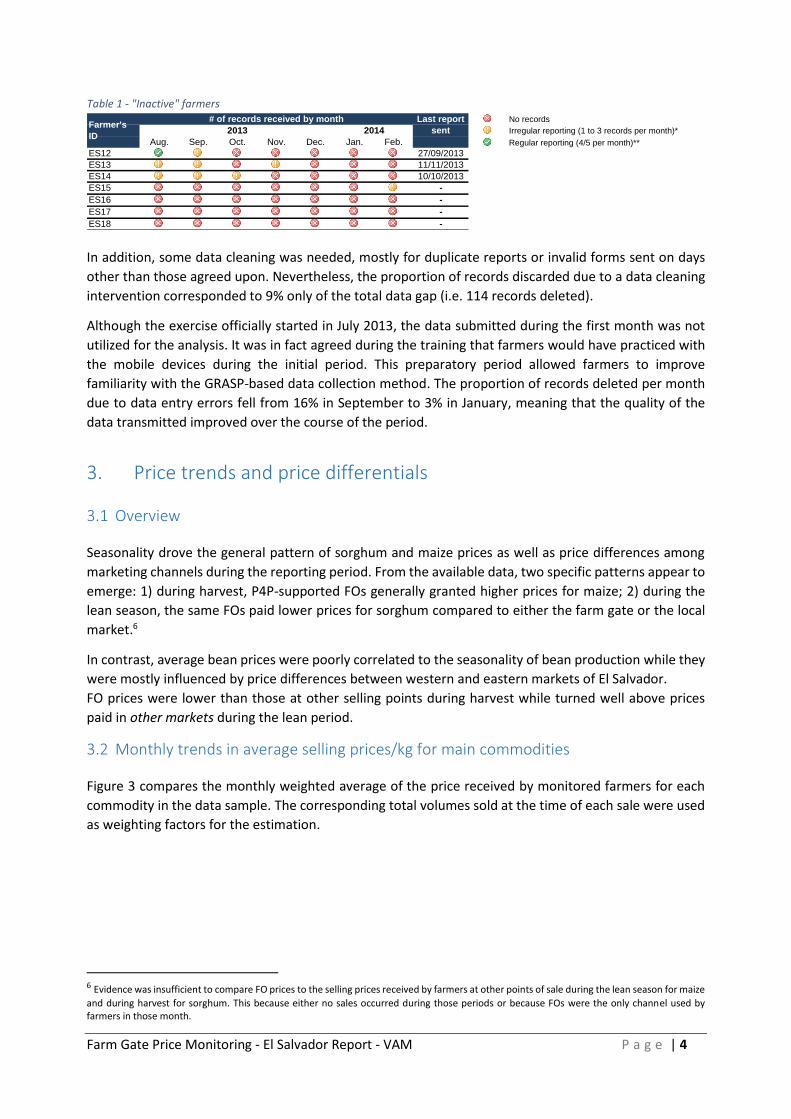
The seven farmers listed in Table 1 became
“inactive” since November 2013 or did not
send any records throughout the duration of
the pilot.
Also, the timeliness of reporting by “active”
farmers declined towards the end of the
reporting period: 70% of participants sent less than 3 records per month (relative to the 4/5 expected)
since December 2013 (Table 4, Annex I), bringing about nearly 40% of the missing data.
4 The amount of data expected was estimated based on the size of the data sample (i.e. 18 smallholder lead farmers), the weekly frequency of data reporting (considering either 4 or 5 weeks per month), and the overall duration of the monitoring pilot (i.e. seven months). The amount of data totally expected was 90 records in August, September, October 2013, and January 2014 (those months comprised 5 weeks); it was 72 in November, December 2013, and February 2014. 5 Sampled lead farmers were considered “active” upon submission of: a) Both prevailing market prices and sale records; b) At least prevailing market prices (in case no sale occurred at the time of data transmission).
Figure 2 - Farmers' participation in data reporting
Figure 1- Data quantity vs. data expected: % of clean data; proportion of the data gaps generated by declining participation, inconstant reporting, and data cleaning.
0%
20%
40%
60%
80%
100%
Aug. Sep. Oct. Nov. Dec. Jan. Feb. Total
Dat
a ex
pec
ted
(%
of)
Clean data Declining participation Irregular reporting Data cleaning
78
%
78
%
67
%
67
%
50
%
44
%
50
%
0
10
20
30
40
50
60
0
2
4
6
8
10
12
14
16
18
Aug. Sep. Oct. Nov. Dec. Jan. Feb.
# of reco
rds su
bm
itted
Sam
ple
d f
arm
ers
EL SALVADOR
# of "inactive farmers" # of “active” farmers
# of records received
Farm Gate Price Monitoring - El Salvador Report - VAM P a g e | 4
In addition, some data cleaning was needed, mostly for duplicate reports or invalid forms sent on days
other than those agreed upon. Nevertheless, the proportion of records discarded due to a data cleaning
intervention corresponded to 9% only of the total data gap (i.e. 114 records deleted).
Although the exercise officially started in July 2013, the data submitted during the first month was not
utilized for the analysis. It was in fact agreed during the training that farmers would have practiced with
the mobile devices during the initial period. This preparatory period allowed farmers to improve
familiarity with the GRASP-based data collection method. The proportion of records deleted per month
due to data entry errors fell from 16% in September to 3% in January, meaning that the quality of the
data transmitted improved over the course of the period.
3. Price trends and price differentials
3.1 Overview
Seasonality drove the general pattern of sorghum and maize prices as well as price differences among
marketing channels during the reporting period. From the available data, two specific patterns appear to
emerge: 1) during harvest, P4P-supported FOs generally granted higher prices for maize; 2) during the
lean season, the same FOs paid lower prices for sorghum compared to either the farm gate or the local
market.6
In contrast, average bean prices were poorly correlated to the seasonality of bean production while they
were mostly influenced by price differences between western and eastern markets of El Salvador.
FO prices were lower than those at other selling points during harvest while turned well above prices
paid in other markets during the lean period.
3.2 Monthly trends in average selling prices/kg for main commodities
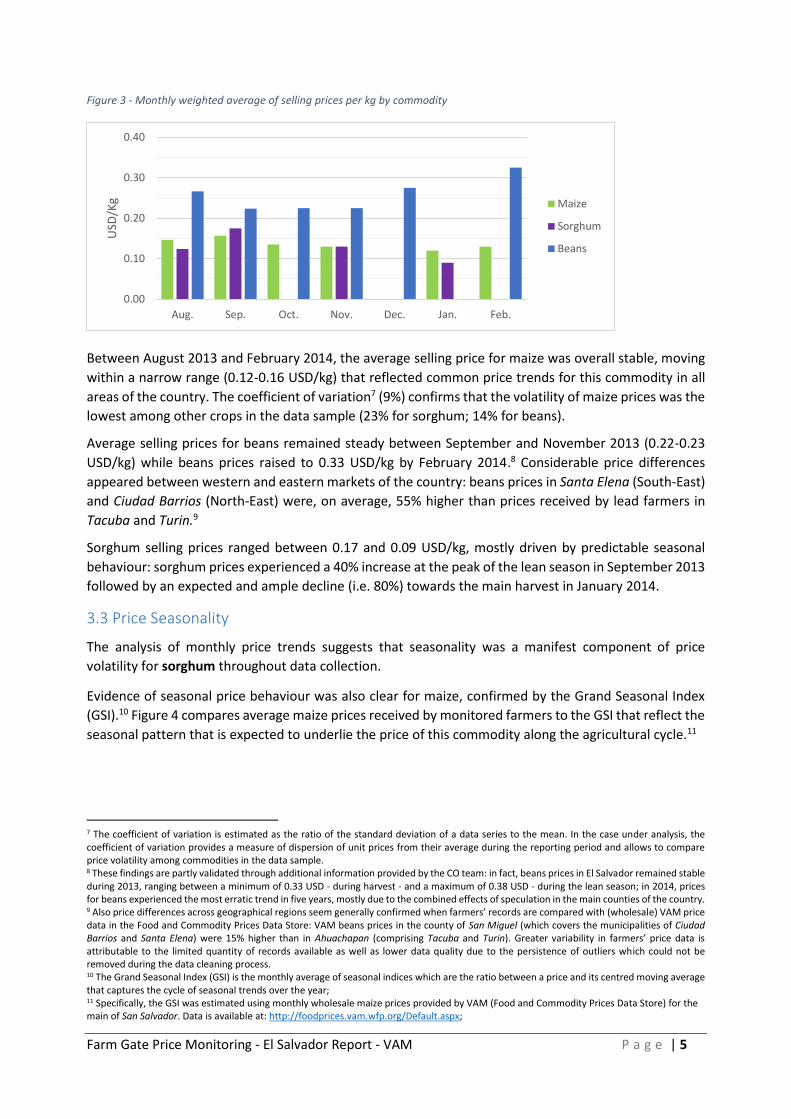
Figure 3 compares the monthly weighted average of the price received by monitored farmers for each
commodity in the data sample. The corresponding total volumes sold at the time of each sale were used
as weighting factors for the estimation.
6 Evidence was insufficient to compare FO prices to the selling prices received by farmers at other points of sale during the lean season for maize
and during harvest for sorghum. This because either no sales occurred during those periods or because FOs were the only channel used by farmers in those month.
No records
Irregular reporting (1 to 3 records per month)*
Aug. Sep. Oct. Nov. Dec. Jan. Feb. Regular reporting (4/5 per month)**
ES12 27/09/2013
ES13 11/11/2013
ES14 10/10/2013
ES15 -
ES16 -
ES17 -
ES18 -
# of records received by month Last report
sent2013 2014Farmer's
ID
Table 1 - "Inactive" farmers
Farm Gate Price Monitoring - El Salvador Report - VAM P a g e | 5
Figure 3 - Monthly weighted average of selling prices per kg by commodity
Between August 2013 and February 2014, the average selling price for maize was overall stable, moving
within a narrow range (0.12-0.16 USD/kg) that reflected common price trends for this commodity in all
areas of the country. The coefficient of variation7 (9%) confirms that the volatility of maize prices was the
lowest among other crops in the data sample (23% for sorghum; 14% for beans).
Average selling prices for beans remained steady between September and November 2013 (0.22-0.23
USD/kg) while beans prices raised to 0.33 USD/kg by February 2014.8 Considerable price differences
appeared between western and eastern markets of the country: beans prices in Santa Elena (South-East)
and Ciudad Barrios (North-East) were, on average, 55% higher than prices received by lead farmers in
Tacuba and Turin.9
Sorghum selling prices ranged between 0.17 and 0.09 USD/kg, mostly driven by predictable seasonal
behaviour: sorghum prices experienced a 40% increase at the peak of the lean season in September 2013
followed by an expected and ample decline (i.e. 80%) towards the main harvest in January 2014.
3.3 Price Seasonality
The analysis of monthly price trends suggests that seasonality was a manifest component of price
volatility for sorghum throughout data collection.
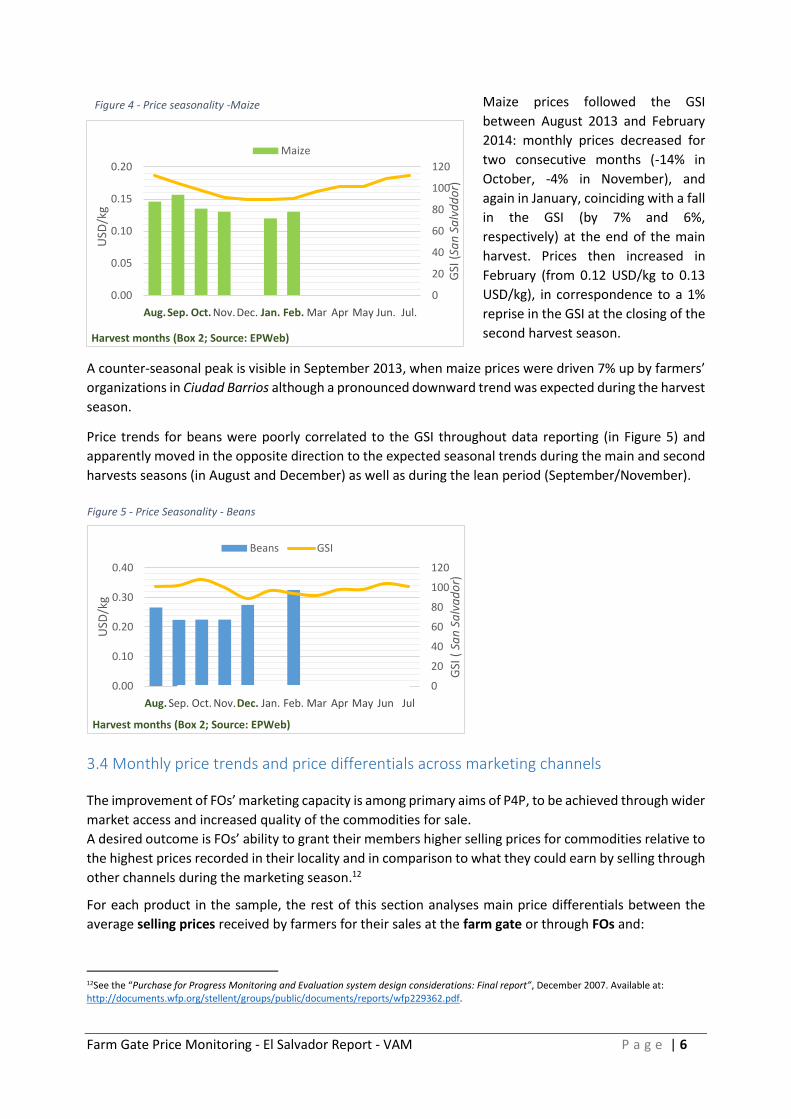
Evidence of seasonal price behaviour was also clear for maize, confirmed by the Grand Seasonal Index
(GSI).10 Figure 4 compares average maize prices received by monitored farmers to the GSI that reflect the
seasonal pattern that is expected to underlie the price of this commodity along the agricultural cycle.11
7 The coefficient of variation is estimated as the ratio of the standard deviation of a data series to the mean. In the case under analysis, the coefficient of variation provides a measure of dispersion of unit prices from their average during the reporting period and allows to compare price volatility among commodities in the data sample. 8 These findings are partly validated through additional information provided by the CO team: in fact, beans prices in El Salvador remained stable during 2013, ranging between a minimum of 0.33 USD - during harvest - and a maximum of 0.38 USD - during the lean season; in 2014, prices for beans experienced the most erratic trend in five years, mostly due to the combined effects of speculation in the main counties of the country. 9 Also price differences across geographical regions seem generally confirmed when farmers’ records are compared with (wholesale) VAM price data in the Food and Commodity Prices Data Store: VAM beans prices in the county of San Miguel (which covers the municipalities of Ciudad Barrios and Santa Elena) were 15% higher than in Ahuachapan (comprising Tacuba and Turin). Greater variability in farmers’ price data is attributable to the limited quantity of records available as well as lower data quality due to the persistence of outliers which could not be removed during the data cleaning process. 10 The Grand Seasonal Index (GSI) is the monthly average of seasonal indices which are the ratio between a price and its centred moving average that captures the cycle of seasonal trends over the year; 11 Specifically, the GSI was estimated using monthly wholesale maize prices provided by VAM (Food and Commodity Prices Data Store) for the main of San Salvador. Data is available at: http://foodprices.vam.wfp.org/Default.aspx;
0.00
0.10
0.20
0.30
0.40
Aug. Sep. Oct. Nov. Dec. Jan. Feb.
USD
/Kg Maize
Sorghum
Beans
Farm Gate Price Monitoring - El Salvador Report - VAM P a g e | 6
Maize prices followed the GSI
between August 2013 and February
2014: monthly prices decreased for
two consecutive months (-14% in
October, -4% in November), and
again in January, coinciding with a fall
in the GSI (by 7% and 6%,
respectively) at the end of the main
harvest. Prices then increased in
February (from 0.12 USD/kg to 0.13
USD/kg), in correspondence to a 1%
reprise in the GSI at the closing of the
second harvest season.
A counter-seasonal peak is visible in September 2013, when maize prices were driven 7% up by farmers’
organizations in Ciudad Barrios although a pronounced downward trend was expected during the harvest
season.
Price trends for beans were poorly correlated to the GSI throughout data reporting (in Figure 5) and
apparently moved in the opposite direction to the expected seasonal trends during the main and second
harvests seasons (in August and December) as well as during the lean period (September/November).
3.4 Monthly price trends and price differentials across marketing channels
The improvement of FOs’ marketing capacity is among primary aims of P4P, to be achieved through wider
market access and increased quality of the commodities for sale.
A desired outcome is FOs’ ability to grant their members higher selling prices for commodities relative to
the highest prices recorded in their locality and in comparison to what they could earn by selling through
other channels during the marketing season.12
For each product in the sample, the rest of this section analyses main price differentials between the
average selling prices received by farmers for their sales at the farm gate or through FOs and:
12See the “Purchase for Progress Monitoring and Evaluation system design considerations: Final report”, December 2007. Available at: http://documents.wfp.org/stellent/groups/public/documents/reports/wfp229362.pdf.
Aug. Dec.Sep. Oct. Nov. Jan. Feb. Mar Apr May Jun Jul
0
20
40
60
80
100
120
0.00
0.10
0.20
0.30
0.40
Aug. Sep. Oct. Nov.Dec. Jan. Feb. Mar Apr May Jun Jul
GSI
( S
an
Sa
lva
do
r)
USD
/kg
Harvest months (Box 2; Source: EPWeb)
Beans GSI
Aug.Sep. Oct. Jan. Feb.Nov.Dec. Mar Apr May Jun. Jul.
0
20
40
60
80
100
120
0.00
0.05
0.10
0.15
0.20
Aug. Sep. Oct. Nov.Dec. Jan. Feb. Mar Apr May Jun. Jul.
GSI
(Sa
n S
alv
dd
or)
USD
/kg
Harvest months (Box 2; Source: EPWeb)
Maize
Figure 4 - Price seasonality -Maize
Figure 5 - Price Seasonality - Beans
Farm Gate Price Monitoring - El Salvador Report - VAM P a g e | 7
The average selling prices received at other points of sale: the local market, coyotes, and what
was referred to by farmers as other market (en otro mercado);
The market price level prevailing in their municipality on the agreed reporting day.13
MAIZE
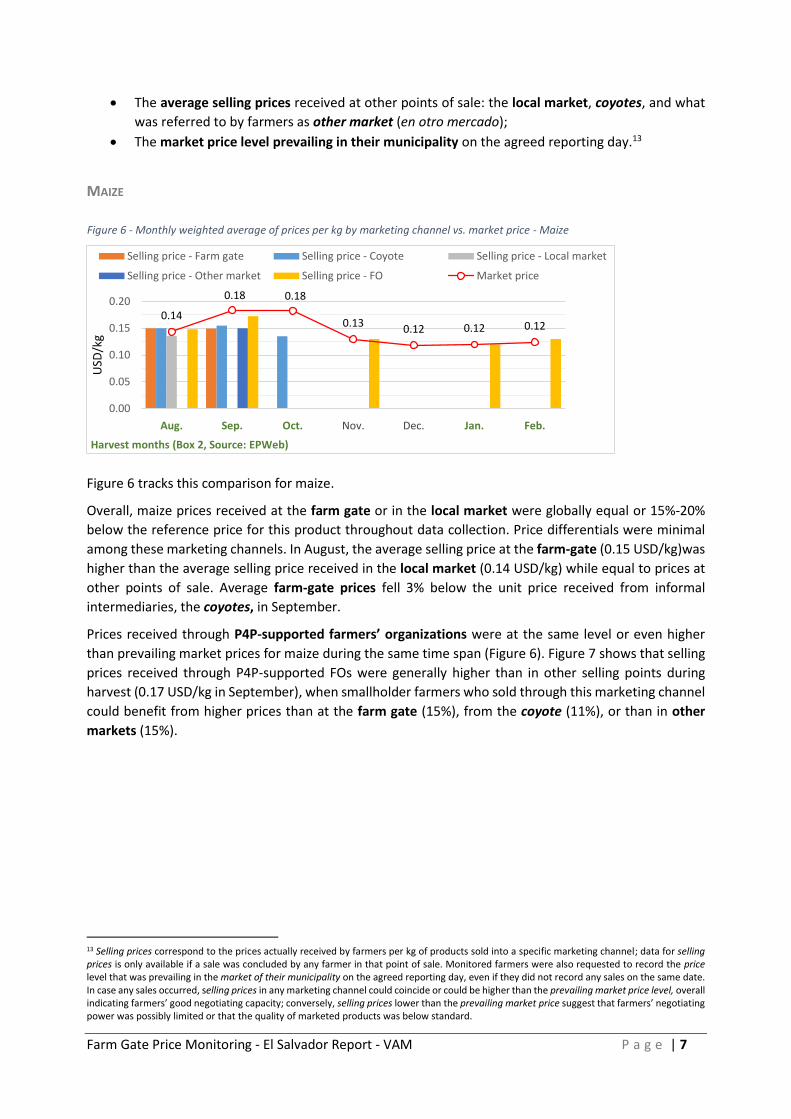
Figure 6 tracks this comparison for maize.
Overall, maize prices received at the farm gate or in the local market were globally equal or 15%-20%
below the reference price for this product throughout data collection. Price differentials were minimal
among these marketing channels. In August, the average selling price at the farm-gate (0.15 USD/kg)was
higher than the average selling price received in the local market (0.14 USD/kg) while equal to prices at
other points of sale. Average farm-gate prices fell 3% below the unit price received from informal
intermediaries, the coyotes, in September.
Prices received through P4P-supported farmers’ organizations were at the same level or even higher
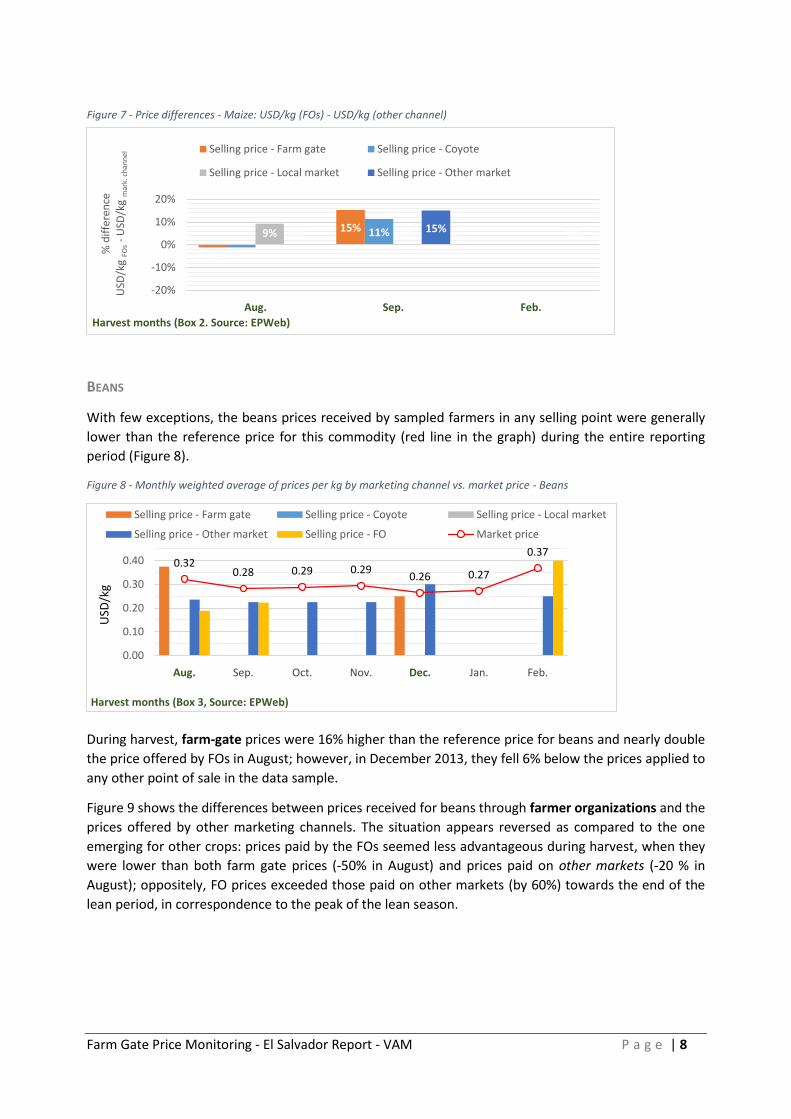
than prevailing market prices for maize during the same time span (Figure 6). Figure 7 shows that selling
prices received through P4P-supported FOs were generally higher than in other selling points during
harvest (0.17 USD/kg in September), when smallholder farmers who sold through this marketing channel
could benefit from higher prices than at the farm gate (15%), from the coyote (11%), or than in other
markets (15%).
13 Selling prices correspond to the prices actually received by farmers per kg of products sold into a specific marketing channel; data for selling prices is only available if a sale was concluded by any farmer in that point of sale. Monitored farmers were also requested to record the price level that was prevailing in the market of their municipality on the agreed reporting day, even if they did not record any sales on the same date. In case any sales occurred, selling prices in any marketing channel could coincide or could be higher than the prevailing market price level, overall indicating farmers’ good negotiating capacity; conversely, selling prices lower than the prevailing market price suggest that farmers’ negotiating power was possibly limited or that the quality of marketed products was below standard.
0.14
0.18 0.18
0.130.12 0.12 0.12
Aug. Sep. Oct. Jan. Feb.Nov. Dec.
0.00
0.05
0.10
0.15
0.20
Aug. Sep. Oct. Nov. Dec. Jan. Feb.
USD
/kg
Harvest months (Box 2, Source: EPWeb)
Selling price - Farm gate Selling price - Coyote Selling price - Local market
Selling price - Other market Selling price - FO Market price
Figure 6 - Monthly weighted average of prices per kg by marketing channel vs. market price - Maize
Farm Gate Price Monitoring - El Salvador Report - VAM P a g e | 8
BEANS
With few exceptions, the beans prices received by sampled farmers in any selling point were generally
lower than the reference price for this commodity (red line in the graph) during the entire reporting
period (Figure 8).
During harvest, farm-gate prices were 16% higher than the reference price for beans and nearly double
the price offered by FOs in August; however, in December 2013, they fell 6% below the prices applied to
any other point of sale in the data sample.
Figure 9 shows the differences between prices received for beans through farmer organizations and the
prices offered by other marketing channels. The situation appears reversed as compared to the one
emerging for other crops: prices paid by the FOs seemed less advantageous during harvest, when they
were lower than both farm gate prices (-50% in August) and prices paid on other markets (-20 % in
August); oppositely, FO prices exceeded those paid on other markets (by 60%) towards the end of the
lean period, in correspondence to the peak of the lean season.
-1%
15% 11%9% 0%0% 15% 0%
Aug. Sep. Feb.
-20%
-10%
0%
10%
20%
Aug. Sep. Feb.
% d
iffe
ren
ceU
SD/k
g FO
s-
USD
/kg
mar
k. c
han
nel
Harvest months (Box 2. Source: EPWeb)
Selling price - Farm gate Selling price - Coyote
Selling price - Local market Selling price - Other market
0.320.28 0.29 0.29
0.26 0.27
0.37
Sep. Oct. Nov.Aug. Dec. Jan. Feb.
0.00
0.10
0.20
0.30
0.40
Aug. Sep. Oct. Nov. Dec. Jan. Feb.
USD
/kg
Harvest months (Box 3, Source: EPWeb)
Selling price - Farm gate Selling price - Coyote Selling price - Local market
Selling price - Other market Selling price - FO Market price
Figure 7 - Price differences - Maize: USD/kg (FOs) - USD/kg (other channel)
Figure 8 - Monthly weighted average of prices per kg by marketing channel vs. market price - Beans

Farm Gate Price Monitoring - El Salvador Report - VAM P a g e | 9
Figure 9 - Price differences - Beans: USD/kg (FOs) - USD/kg (other channel)
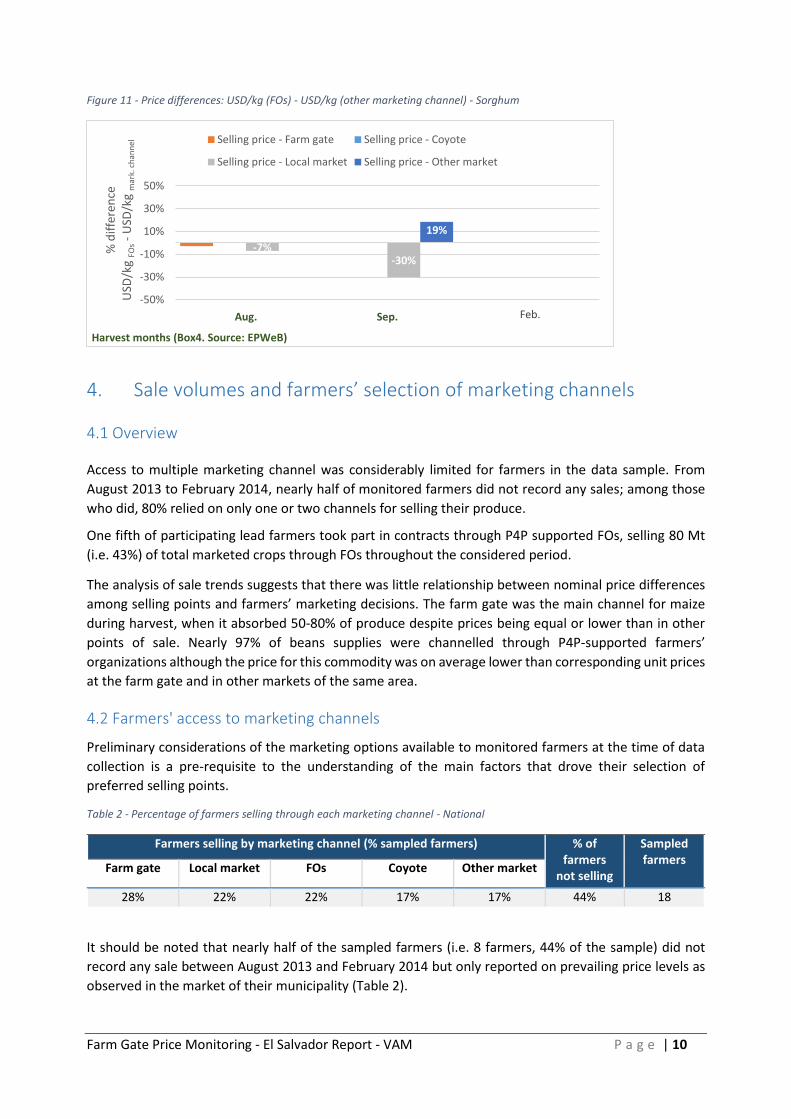
SORGHUM
Figure 10 shows that the average selling prices for sorghum at the farm gate and in other markets were
equal or 10% lower than the price level prevailing for this product at harvest time (August-September).
Selling prices received in the local market were 60% higher than the reference price for sorghum in
September; they were on average 40%-60% above the prices of FOs or other markets, mostly driven up
by the unit selling price in the local market of Ciudad Barrios.
Figure 10 - Monthly weighted average of prices per kg by marketing channel vs. market price - Sorghum
As for other commodities, revenues offered by P4P-supported farmer organizations were below the
prices received at the farm gate (-3% in August) and in local market (-7% in August; -30% in September),
coinciding with the peak of the country's lean period.
-50%-20%
60%
Sep.Aug. Feb.
-50%
-30%
-10%
10%
30%
50%
70%
Aug. Sep. Feb.
% d
iffe
ren
ceU
SD/k
g F O
s-
USD
/kg
mar
k.ch
ann
el
Harvest months (Box 3. Source: EPWeB)
Selling price - Farm gate Selling price - Coyote
Selling price - Local market Selling price - Other market
0.13 0.14 0.13 0.13 0.12 0.11 0.11
Sep. Oct. Nov.Aug. Dec. Jan. Feb.
0.00
0.20
0.40
Aug. Sep. Oct. Nov. Dec. Jan. Feb.
USD
/kg
Harvest months (Box 4, Source: EPWeb)
Selling price - Farm gate Selling price - Coyote Selling price - Local market
Selling price - Other market Selling price - FO Market price
Farm Gate Price Monitoring - El Salvador Report - VAM P a g e | 10
Figure 11 - Price differences: USD/kg (FOs) - USD/kg (other marketing channel) - Sorghum
4. Sale volumes and farmers’ selection of marketing channels
4.1 Overview
Access to multiple marketing channel was considerably limited for farmers in the data sample. From
August 2013 to February 2014, nearly half of monitored farmers did not record any sales; among those
who did, 80% relied on only one or two channels for selling their produce.
One fifth of participating lead farmers took part in contracts through P4P supported FOs, selling 80 Mt
(i.e. 43%) of total marketed crops through FOs throughout the considered period.
The analysis of sale trends suggests that there was little relationship between nominal price differences
among selling points and farmers’ marketing decisions. The farm gate was the main channel for maize
during harvest, when it absorbed 50-80% of produce despite prices being equal or lower than in other
points of sale. Nearly 97% of beans supplies were channelled through P4P-supported farmers’
organizations although the price for this commodity was on average lower than corresponding unit prices
at the farm gate and in other markets of the same area.
4.2 Farmers' access to marketing channels
Preliminary considerations of the marketing options available to monitored farmers at the time of data
collection is a pre-requisite to the understanding of the main factors that drove their selection of
preferred selling points.
Table 2 - Percentage of farmers selling through each marketing channel - National
Farmers selling by marketing channel (% sampled farmers) % of farmers
not selling
Sampled farmers
Farm gate Local market FOs Coyote Other market
28% 22% 22% 17% 17% 44% 18
It should be noted that nearly half of the sampled farmers (i.e. 8 farmers, 44% of the sample) did not
record any sale between August 2013 and February 2014 but only reported on prevailing price levels as
observed in the market of their municipality (Table 2).
-7%-30%
19%
Aug. Sep. Feb.-50%
-30%
-10%
10%
30%
50%
Aug. Sep. Feb.
% d
iffe
ren
ceU
SD/k
g FO
s-
USD
/kg
mar
k. c
han
nel
Harvest months (Box4. Source: EPWeB)
Selling price - Farm gate Selling price - Coyote
Selling price - Local market Selling price - Other market
Farm Gate Price Monitoring - El Salvador Report - VAM P a g e | 11
Access to multiple marketing channels was limited for the remaining farmers. 14 Specifically, 60% of the
10 farmers who sold during the reporting period (i.e. 6 farmers) relied on only one point of sale, mostly
the farm gate or the local market. An additional 20% (i.e. 2 farmers) chose farmer organizations (FOs)
or indicated other market (“en otro mercado”) as a second channel.
Differently, farmers who interacted with other intermediaries (such as the coyote) during data collection
sold in at least four or all other marketing channels factored in by the monitoring exercise.15 Only 2
monitored farmers (11% of the sample) had access to four or more points of sale.
Finally, only 22% of farmers in the data sample (i.e. 4 farmers) took part in contracting through FOs,
distributed in San Lorenzo and Tacuba, in the western area of the country, and Ciudad Barrios, in the
north-east.
Based on WFP experience at country office level, FOs’ limited buying capacity was identified as the
primary cause for this finding: lack of adequate financial resources often constrain farmer organizations
in El Salvador to purchase only a limited proportion of farmers’ produce or to exclude some members
from sales through this marketing channel.
4.3 Sale volumes and marketing channels
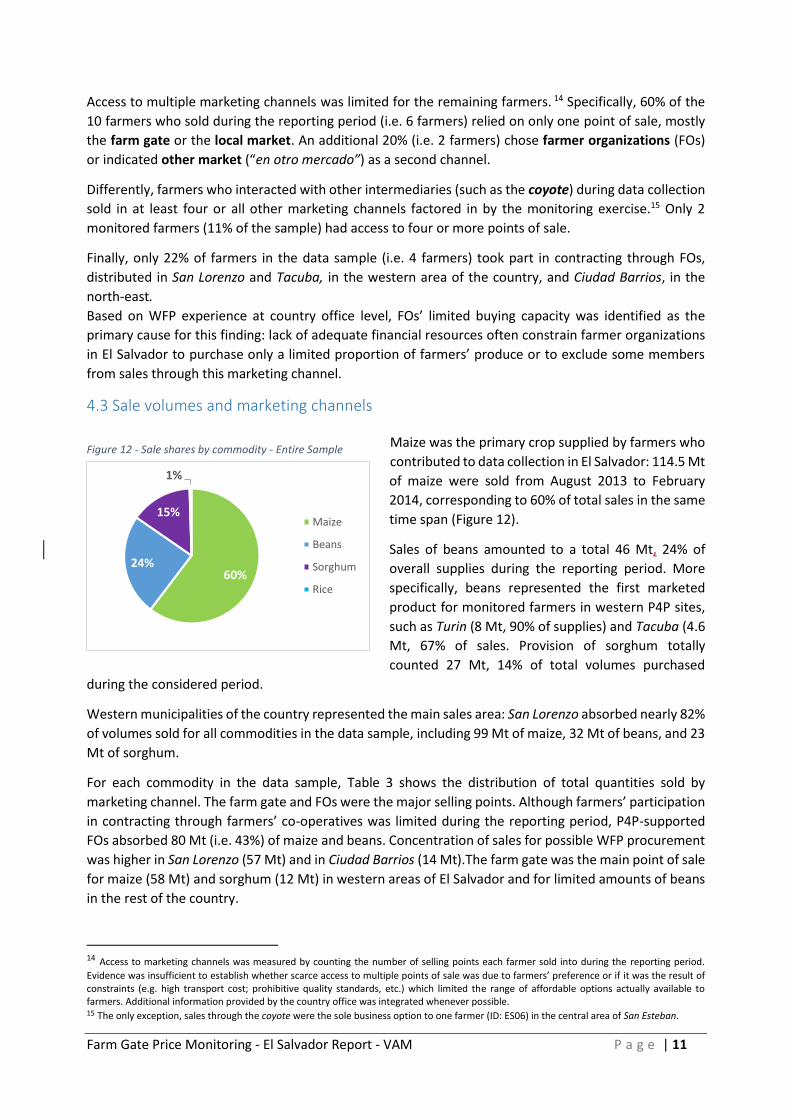
Maize was the primary crop supplied by farmers who
contributed to data collection in El Salvador: 114.5 Mt
of maize were sold from August 2013 to February
2014, corresponding to 60% of total sales in the same
time span (Figure 12).
Sales of beans amounted to a total 46 Mt, 24% of
overall supplies during the reporting period. More
specifically, beans represented the first marketed
product for monitored farmers in western P4P sites,
such as Turin (8 Mt, 90% of supplies) and Tacuba (4.6
Mt, 67% of sales. Provision of sorghum totally
counted 27 Mt, 14% of total volumes purchased
during the considered period.
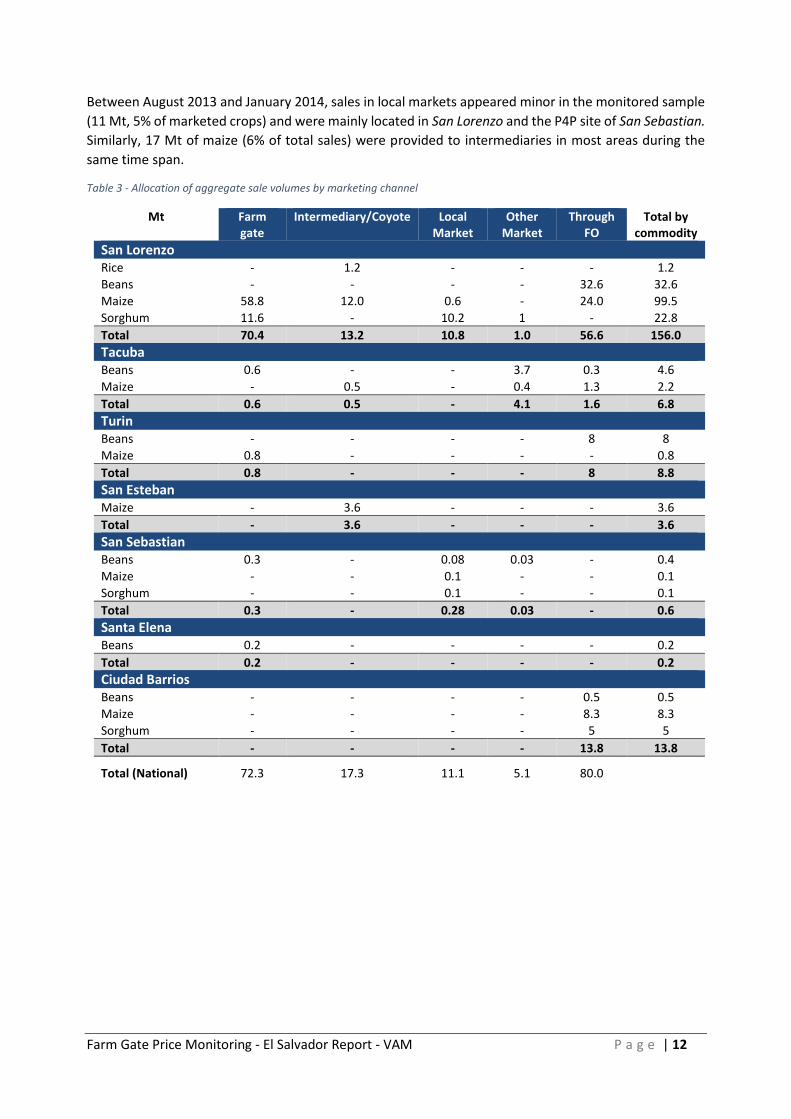
Western municipalities of the country represented the main sales area: San Lorenzo absorbed nearly 82%
of volumes sold for all commodities in the data sample, including 99 Mt of maize, 32 Mt of beans, and 23
Mt of sorghum.
For each commodity in the data sample, Table 3 shows the distribution of total quantities sold by
marketing channel. The farm gate and FOs were the major selling points. Although farmers’ participation
in contracting through farmers’ co-operatives was limited during the reporting period, P4P-supported
FOs absorbed 80 Mt (i.e. 43%) of maize and beans. Concentration of sales for possible WFP procurement
was higher in San Lorenzo (57 Mt) and in Ciudad Barrios (14 Mt).The farm gate was the main point of sale
for maize (58 Mt) and sorghum (12 Mt) in western areas of El Salvador and for limited amounts of beans
in the rest of the country.
14 Access to marketing channels was measured by counting the number of selling points each farmer sold into during the reporting period.
Evidence was insufficient to establish whether scarce access to multiple points of sale was due to farmers’ preference or if it was the result of constraints (e.g. high transport cost; prohibitive quality standards, etc.) which limited the range of affordable options actually available to farmers. Additional information provided by the country office was integrated whenever possible. 15 The only exception, sales through the coyote were the sole business option to one farmer (ID: ES06) in the central area of San Esteban.
60%24%
15%
1%
Maize
Beans
Sorghum
Rice
Figure 12 - Sale shares by commodity - Entire Sample
Farm Gate Price Monitoring - El Salvador Report - VAM P a g e | 12
Between August 2013 and January 2014, sales in local markets appeared minor in the monitored sample
(11 Mt, 5% of marketed crops) and were mainly located in San Lorenzo and the P4P site of San Sebastian.
Similarly, 17 Mt of maize (6% of total sales) were provided to intermediaries in most areas during the
same time span.
Table 3 - Allocation of aggregate sale volumes by marketing channel
Mt Farm gate
Intermediary/Coyote Local Market
Other Market
Through FO
Total by commodity
San Lorenzo Rice - 1.2 - - - 1.2
Beans - - - - 32.6 32.6
Maize 58.8 12.0 0.6 - 24.0 99.5
Sorghum 11.6 - 10.2 1 - 22.8
Total 70.4 13.2 10.8 1.0 56.6 156.0
Tacuba Beans 0.6 - - 3.7 0.3 4.6
Maize - 0.5 - 0.4 1.3 2.2
Total 0.6 0.5 - 4.1 1.6 6.8
Turin Beans - - - - 8 8
Maize 0.8 - - - - 0.8
Total 0.8 - - - 8 8.8
San Esteban Maize - 3.6 - - - 3.6
Total - 3.6 - - - 3.6
San Sebastian Beans 0.3 - 0.08 0.03 - 0.4
Maize - - 0.1 - - 0.1
Sorghum - - 0.1 - - 0.1
Total 0.3 - 0.28 0.03 - 0.6
Santa Elena Beans 0.2 - - - - 0.2
Total 0.2 - - - - 0.2
Ciudad Barrios Beans - - - - 0.5 0.5
Maize - - - - 8.3 8.3
Sorghum - - - - 5 5
Total - - - - 13.8 13.8
Total (National) 72.3 17.3 11.1 5.1 80.0
Farm Gate Price Monitoring - El Salvador Report - VAM P a g e | 13
4.4 Trends in sale volumes across marketing channels
MAIZE
Figure 13 - Trends in maize sale volumes
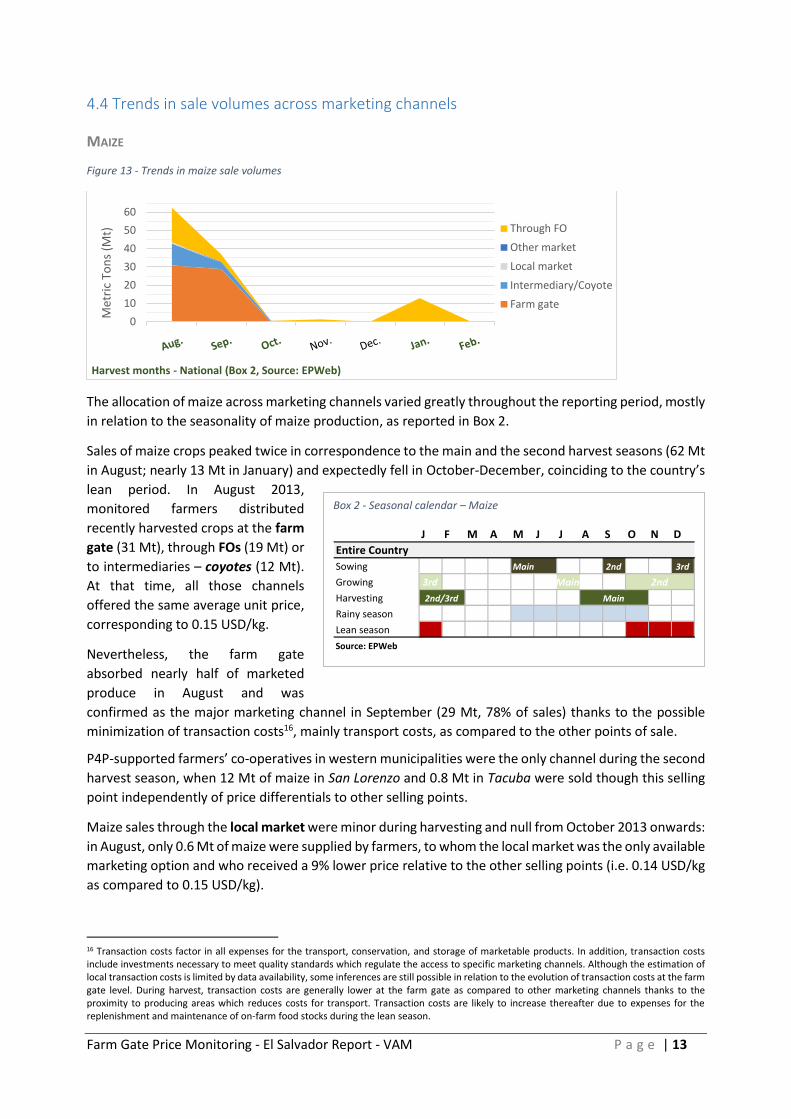
The allocation of maize across marketing channels varied greatly throughout the reporting period, mostly
in relation to the seasonality of maize production, as reported in Box 2.
Sales of maize crops peaked twice in correspondence to the main and the second harvest seasons (62 Mt
in August; nearly 13 Mt in January) and expectedly fell in October-December, coinciding to the country’s
lean period. In August 2013,
monitored farmers distributed
recently harvested crops at the farm
gate (31 Mt), through FOs (19 Mt) or
to intermediaries – coyotes (12 Mt).
At that time, all those channels
offered the same average unit price,
corresponding to 0.15 USD/kg.
Nevertheless, the farm gate
absorbed nearly half of marketed
produce in August and was
confirmed as the major marketing channel in September (29 Mt, 78% of sales) thanks to the possible
minimization of transaction costs16, mainly transport costs, as compared to the other points of sale.
P4P-supported farmers’ co-operatives in western municipalities were the only channel during the second
harvest season, when 12 Mt of maize in San Lorenzo and 0.8 Mt in Tacuba were sold though this selling
point independently of price differentials to other selling points.
Maize sales through the local market were minor during harvesting and null from October 2013 onwards:
in August, only 0.6 Mt of maize were supplied by farmers, to whom the local market was the only available
marketing option and who received a 9% lower price relative to the other selling points (i.e. 0.14 USD/kg
as compared to 0.15 USD/kg).
16 Transaction costs factor in all expenses for the transport, conservation, and storage of marketable products. In addition, transaction costs include investments necessary to meet quality standards which regulate the access to specific marketing channels. Although the estimation of local transaction costs is limited by data availability, some inferences are still possible in relation to the evolution of transaction costs at the farm gate level. During harvest, transaction costs are generally lower at the farm gate as compared to other marketing channels thanks to the proximity to producing areas which reduces costs for transport. Transaction costs are likely to increase thereafter due to expenses for the replenishment and maintenance of on-farm food stocks during the lean season.
0
10
20
30
40
50
60
Aug. Sep. Oct. Nov. Dec. Jan. Feb.
Met
ric
Ton
s (M
t)
Harvest months - National (Box 2, Source: EPWeb)
Through FO
Other market
Local market
Intermediary/Coyote
Farm gate
Box 2 - Seasonal calendar – Maize
J F M A M J J A S O N D
Entire Country
Sowing Main 2nd 3rd
Growing 3rd Main
Harvesting
Rainy season
Lean season
Source: EPWeb
Main2nd/3rd
2nd
Farm Gate Price Monitoring - El Salvador Report - VAM P a g e | 14
BEANS
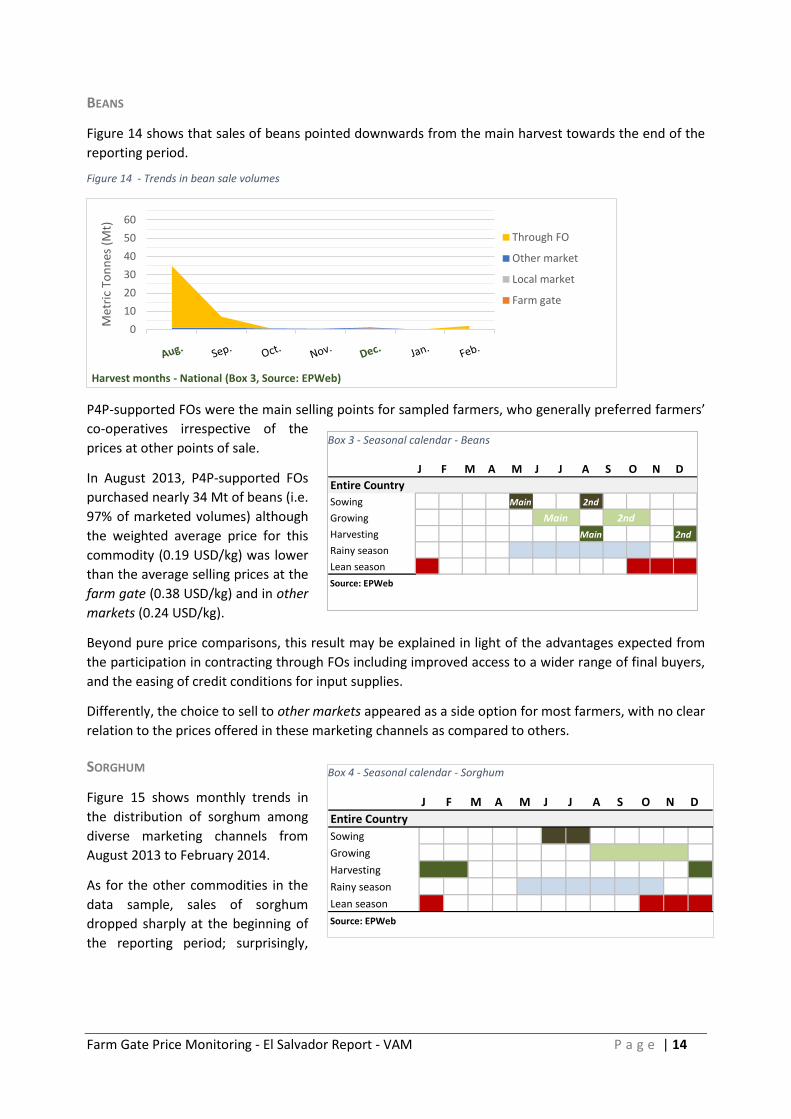
Figure 14 shows that sales of beans pointed downwards from the main harvest towards the end of the
reporting period.
Figure 14 - Trends in bean sale volumes
P4P-supported FOs were the main selling points for sampled farmers, who generally preferred farmers’
co-operatives irrespective of the
prices at other points of sale.
In August 2013, P4P-supported FOs
purchased nearly 34 Mt of beans (i.e.
97% of marketed volumes) although
the weighted average price for this
commodity (0.19 USD/kg) was lower
than the average selling prices at the
farm gate (0.38 USD/kg) and in other
markets (0.24 USD/kg).
Beyond pure price comparisons, this result may be explained in light of the advantages expected from
the participation in contracting through FOs including improved access to a wider range of final buyers,
and the easing of credit conditions for input supplies.
Differently, the choice to sell to other markets appeared as a side option for most farmers, with no clear
relation to the prices offered in these marketing channels as compared to others.
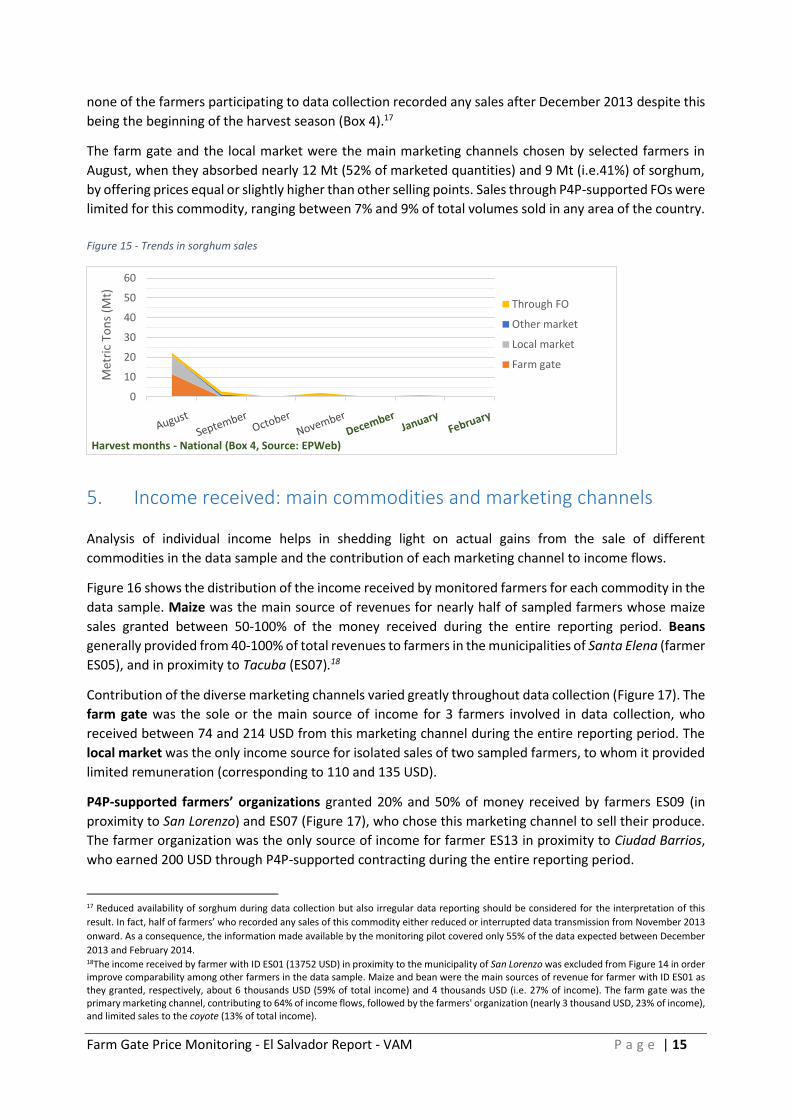
SORGHUM
Figure 15 shows monthly trends in
the distribution of sorghum among
diverse marketing channels from
August 2013 to February 2014.
As for the other commodities in the
data sample, sales of sorghum
dropped sharply at the beginning of
the reporting period; surprisingly,
0
10
20
30
40
50
60
Aug. Sep. Oct. Nov. Dec. Jan. Feb.
Met
ric
Ton
nes
(M
t)
Harvest months - National (Box 3, Source: EPWeb)
Through FO
Other market
Local market
Farm gate
Box 4 - Seasonal calendar - Sorghum
J F M A M J J A S O N D
Entire Country
Sowing
Growing
Harvesting
Rainy season
Lean season
Source: EPWeb
Box 3 - Seasonal calendar - Beans
J F M A M J J A S O N D
Entire Country
Sowing Main 2nd
Growing
Harvesting Main 2nd
Rainy season
Lean season
Source: EPWeb
Main 2nd
Farm Gate Price Monitoring - El Salvador Report - VAM P a g e | 15
none of the farmers participating to data collection recorded any sales after December 2013 despite this
being the beginning of the harvest season (Box 4).17
The farm gate and the local market were the main marketing channels chosen by selected farmers in
August, when they absorbed nearly 12 Mt (52% of marketed quantities) and 9 Mt (i.e.41%) of sorghum,
by offering prices equal or slightly higher than other selling points. Sales through P4P-supported FOs were
limited for this commodity, ranging between 7% and 9% of total volumes sold in any area of the country.
Figure 15 - Trends in sorghum sales
5. Income received: main commodities and marketing channels
Analysis of individual income helps in shedding light on actual gains from the sale of different
commodities in the data sample and the contribution of each marketing channel to income flows.
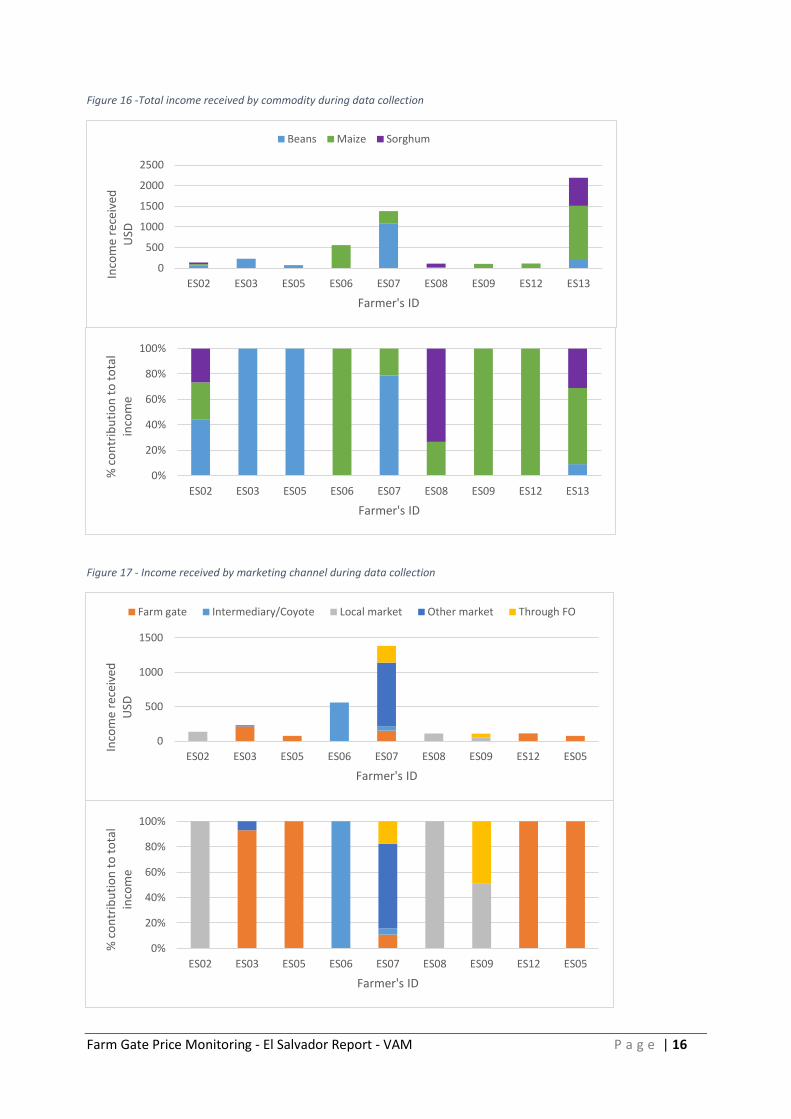
Figure 16 shows the distribution of the income received by monitored farmers for each commodity in the
data sample. Maize was the main source of revenues for nearly half of sampled farmers whose maize
sales granted between 50-100% of the money received during the entire reporting period. Beans
generally provided from 40-100% of total revenues to farmers in the municipalities of Santa Elena (farmer
ES05), and in proximity to Tacuba (ES07).18
Contribution of the diverse marketing channels varied greatly throughout data collection (Figure 17). The
farm gate was the sole or the main source of income for 3 farmers involved in data collection, who
received between 74 and 214 USD from this marketing channel during the entire reporting period. The
local market was the only income source for isolated sales of two sampled farmers, to whom it provided
limited remuneration (corresponding to 110 and 135 USD).
P4P-supported farmers’ organizations granted 20% and 50% of money received by farmers ES09 (in
proximity to San Lorenzo) and ES07 (Figure 17), who chose this marketing channel to sell their produce.
The farmer organization was the only source of income for farmer ES13 in proximity to Ciudad Barrios,
who earned 200 USD through P4P-supported contracting during the entire reporting period.
17 Reduced availability of sorghum during data collection but also irregular data reporting should be considered for the interpretation of this
result. In fact, half of farmers’ who recorded any sales of this commodity either reduced or interrupted data transmission from November 2013
onward. As a consequence, the information made available by the monitoring pilot covered only 55% of the data expected between December
2013 and February 2014. 18The income received by farmer with ID ES01 (13752 USD) in proximity to the municipality of San Lorenzo was excluded from Figure 14 in order improve comparability among other farmers in the data sample. Maize and bean were the main sources of revenue for farmer with ID ES01 as they granted, respectively, about 6 thousands USD (59% of total income) and 4 thousands USD (i.e. 27% of income). The farm gate was the primary marketing channel, contributing to 64% of income flows, followed by the farmers' organization (nearly 3 thousand USD, 23% of income), and limited sales to the coyote (13% of total income).
0
10
20
30
40
50
60
August October December February
Met
ric
Ton
s (M
t)
Harvest months - National (Box 4, Source: EPWeb)
Through FO
Other market
Local market
Farm gate
Farm Gate Price Monitoring - El Salvador Report - VAM P a g e | 16
Figure 16 -Total income received by commodity during data collection
Figure 17 - Income received by marketing channel during data collection
0
500
1000
1500
2000
2500
ES02 ES03 ES05 ES06 ES07 ES08 ES09 ES12 ES13
Inco
me
rece
ived
USD
Farmer's ID
Beans Maize Sorghum
0%
20%
40%
60%
80%
100%
ES02 ES03 ES05 ES06 ES07 ES08 ES09 ES12 ES13
% c
on
trib
uti
on
to
to
tal
inco
me
Farmer's ID
0
500
1000
1500
ES02 ES03 ES05 ES06 ES07 ES08 ES09 ES12 ES05
Inco
me
rece
ived
USD
Farmer's ID
Farm gate Intermediary/Coyote Local market Other market Through FO
0%
20%
40%
60%
80%
100%
ES02 ES03 ES05 ES06 ES07 ES08 ES09 ES12 ES05
% c
on
trib
uti
on
to
to
tal
inco
me
Farmer's ID

Farm Gate Price Monitoring - El Salvador Report - VAM P a g e | 17
Annex I. Regularity of data reporting
Table 4 - Regularity of data reporting by sampled farmers
20142013# of records
# of records received by month
Farmer's ID
Augus
t
Septe
mbe
r
Octob
er
Nov
embe
r
Dec
embe
r
Janu
ary
Febru
aryFarmer's ID
ES01 31
ES02 29
ES03 25
ES04 23
ES05 22
ES06 22
ES07 18
ES08 18
ES09 17
ES10 16
ES11 10
ES12 8
ES13 6
ES14 4
ES15 1
ES16 0
ES17 0
ES18 0
57 46 37 41 23 24 22 250
No records
Irregular reporting (1 to 3 records per month)*
Regular reporting (4/5 per month)**

Farm Gate Price Monitoring - El Salvador Report - VAM P a g e | 18
Annex II - Individual sales
Table 5- Individual sale volumes by commodity and marketing channel
Kg Farm gate
Intermediary/Coyote Local Market
Other Market
Through FO/
Total (farmer)
ES01
Beans - - - - 40.6 40.6
Maize 58.8 12 - - 27.6 98.4
Rice - 1.2 - - - 1.2
Sorghum 11.6 - 9.3 1 - 21.9
Total 70.4 13.2 9.3 1 68.2 162.1
ES02
Beans - - 0.1 - - 0.1
Maize - - 0.1 - - 0.1
Sorghum - - 0.1 - - 0.1
Total - - 0.3 - - 0.3
ES03
Beans 0.3 - - 0.02 - 0.3
Total 0.3 - - 0.0 - 0.3
ES05
Beans 0.2 - - - - 0.2
Total 0.2 - - - - 0.2
ES06
Maize - 3.6 - - - 3.6
Total - 3.6 - - - 3.6
ES07
Beans 0.6 - - 3.7 0.3 4.6
Maize - 0.5 - 0.4 1.3 2.2
Total 0.6 0.5 - 4.1 1.6 6.8
ES08
Maize - - 0.2 - - 0.2
Sorghum - - 0.9 - - 0.9
Total - - 1.1 - - 1.1
ES09
Maize - - 0.4 - 0.4 0.8
Total - - 0.4 - 0.4 0.8
ES12
Maize 0.8 - - - - 0.8
Total 0.8 - - - - 0.8
ES13
Beans - - - - 0.5 0.5
Maize - - - - 8.3 8.3
Sorghum - - - - 5.0 5.0
Total - - - - 13.8 13.8