Embed Size (px)
Citation preview
Farm management extension guide
FARM BUSINESS ANALYSISusing benchmarking
byDavid Kahan
FOOD AND AGRICULTURE ORGANIZATION OF THE UNITED NATIONSRome 2010
4
The designations employed and the presentation of material in this information product do not imply the expression of any opinion whatsoever on the part of the Food and Agriculture Organization of the United Nations (FAO) concerning the legal or development status of any country, territory, city or area or of its authorities, or concerning the delimitation of its frontiers or boundaries. The mention of specific companies or products of manufacturers, whether or not these have been patented, does not imply that these have been endorsed or recommended by FAO in preference to others of a similar nature that are not mentioned.
The views expressed in this information product are those of the author(s) and do not necessarily reflect the views or policies of FAO.
ISBN 978-92-5-107545-6 (print)E-ISBN 978-92-5-107546-3 (PDF)
© FAO 2013
FAO encourages the use, reproduction and dissemination of material in this information product. Except where otherwise indicated, material may be copied, downloaded and printed for private study, research and teaching purposes, or for use in non-commercial products or services, provided that appropriate acknowledgement of FAO as the source and copyright holder is given and that FAO’s endorsement of users’ views, products or services is not implied in any way.
All requests for translation and adaptation rights, and for resale and other commercial use rights should be made via www.fao.org/contact-us/licence-request or addressed to [email protected].
FAO information products are available on the FAO website (www.fao.org/publications) and can be purchased through [email protected].
iii
PrefaceFarming for profit calls for a different approach to farming. Farmers are not only concerned with the day to day tasks involved in making a living but they increasingly plan for the future in an effort to make money. For business minded farmers profit is viewed as the goal; the goal that ensures survival of the business. The performance of the farm can best be explained by better understanding the farm business, identifying the goals set by the farmer and examining the factors that affect them.
Performance is concerned not only with the ‘bottom line’ of making money but also technical aspects of farming that contribute to making the farm business profitable and efficient. Improving the performance of the farm business requires a good understanding of both the business and technical aspects of farming. ‘Benchmarking’ is a concept that is used to analyse and better understand the farm as a business. To do this benchmarking is conducted in a way similar to a doctor diagnosing the condition of a patient. Diagnosing performance means understanding business concepts such as profitability and efficiency, identifying the problems that prevent the farm from achieving its potential and formulating strategies and actions to improve its business performance.
How do you, as an extension worker, assist farmers in finding ways of making improvements to the farm business? How do you as an extension worker help farmers improve profitability and performance?
Acknowledgements
The author would like to acknowledge the assistance of colleagues and friends. Thanks are due to Doyle Baker and Steve Worth for their review of the guide, Martin Hilmi for his contributions and reviews, Tom Laughlin, who managed the post-production process and Michael Breece, for the design and final layout of the publication.
David KahanSenior Officer, Agricultural Innovationand Extension
iv
v
ContentsPreface ................................................................................ iiiAcknowledgements .............................................................. ivAttention extension workers .................................................vi
Part 1 INTRODUCTION TO BENCHMARKING
Chapter 1: Benchmarking in farm business analysis ........... 3Chapter 2: Steps involved in benchmarking ..................... 19Chapter 3: Benchmarking in extension .............................. 27
Part 2STEP-BY-STEP FIELD GUIDE
OrganizationStep 1: Organize benchmark learning groups ................... 42Identification Step 2: Identify problems to be examined ......................... 48Step 3: Identify performance indicators ............................. 52Step 4: Identify benchmark farms ...................................... 72Data collection Step 5: Collect comparable data and information ............. 77ComparisonStep 6: Compare performance .......................................... 93AnalysisStep 7: Interpret differences ............................................. 99SharingStep 8: Share findings and results .................................. 113Plan for changeStep 9: Devise plans and implement changes ................ 119Monitor and evaluateStep 10: Reflect and evaluate results ............................... 125
Annex: Business concepts for benchmarking .................. 129
Glossary ........................................................................... 137Bibliography ...................................................................... 141
vi
Attention extension workers
The methods recommended in this guide require familiarity with basic farm management economics as covered in Farm Management Extension Guide 2. The guide is expected to be used by extension workers with university level training and at least an introductory training in farm management economics. In countries where extension workers do not have this background, the more likely user of the guide would be farm management specialists. The role of farm management specialists is broad and their responsibilities are covered in Farm Management Extension Guide 4.
While benchmarking is useful for all types of small-scale farmers, family farmers that produce mainly for household consumption as well as market-oriented farmers, its practical use in farm business analysis will be more appreciated among commercially minded farmers that wish to improve their profitability and competitiveness.
While the guide draws on known farm management methods and experiences, the recommendations on approaches and activities for benchmarking are new and mostly untested. This guide is therefore being made available to stimulate innovation and adaptation.
Benchmarking may at first seem somewhat complex, but when the procedure is carefully explained and given an operational structure to follow, the process becomes much easier. This guide sets out to do just that. How the guide has been structured and what the reader can expect to find is briefly described below.
vii
Part 1: Introduction to benchmarking and overview. This part begins with a discussion on benchmarking and how it is applied (informally, formally, internally, externally) followed by an introduction to the key concepts needed to analyse and measure farm and enterprise performance (profit, profitability, efficiency). A brief overview of a ten-step process to conduct a benchmarking exercise is also given. This part ends with a section on benchmarking and its application in extension work.
Part 2: Step-by-step field guide. This part has been structured to provide detailed guidance for extension workers on how to undertake a benchmarking exercise: A ten-step process is described. Readers are urged to study the sequence from beginning to end until the process is clearly understood. Benchmarking procedures and data collection are discussed including some things ‘to do’ and some things ‘not to do’ in the field.
Each of the ten steps includes ‘Tips’ and ‘Questions to initiate discussion’ when conducting an exercise. This is to help and support you in the practical application of benchmarking.
Undoubtedly, during the course of reading, you will develop ideas of your own on how you plan to conduct your field exercises. These should be listed. Space has been provided for notes and observations. The material that has been covered here, together with your list of ideas, is intended to be used as a field guide. Remember, the best way to learn how to benchmark is by practice.


P a r t 1Introduction to benchmarking

Chapter 1Benchmarking in farm business analysis
4 Farm business analysis using benchmarking
CHAPTER 1BEnCHmARking: An ovERviEw
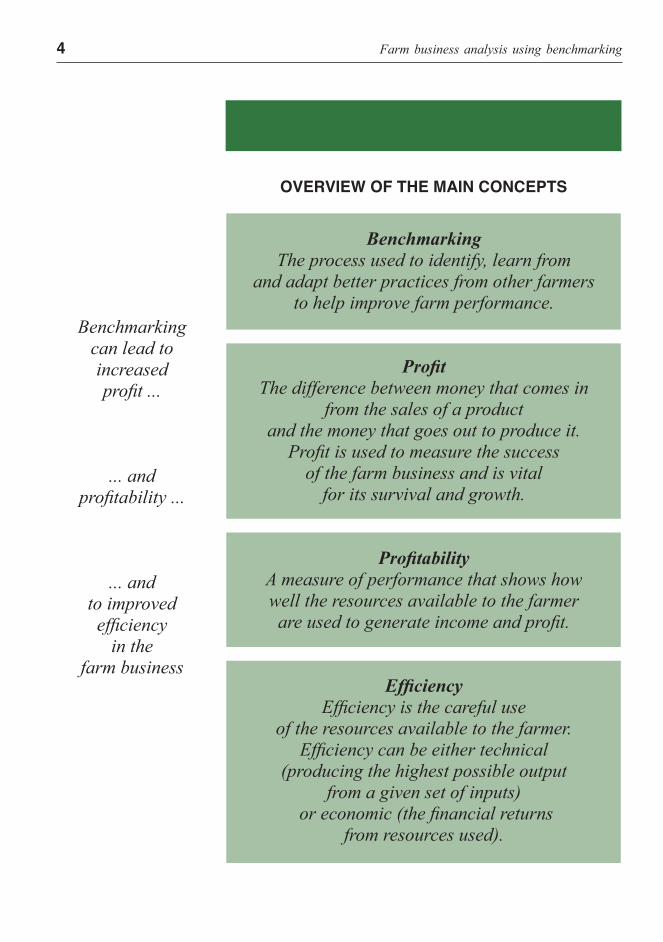
OVERVIEW OF THE MAIN CONCEPTS
BenchmarkingThe process used to identify, learn from
and adapt better practices from other farmers to help improve farm performance.
ProfitThe difference between money that comes in
from the sales of a productand the money that goes out to produce it.
Profit is used to measure the successof the farm business and is vital
for its survival and growth.
ProfitabilityA measure of performance that shows how well the resources available to the farmer are used to generate income and profit.
Efficiency Efficiency is the careful use
of the resources available to the farmer. Efficiency can be either technical
(producing the highest possible output from a given set of inputs)
or economic (the financial returns from resources used).
Benchmarkingcan lead toincreased profit ...
... and profitability ...
... and to improvedefficiency
in thefarm business
Benchmarking in farm business analysis 5
BENCHMARKING
What is benchmarking?The term ‘benchmarking’ is used to cover a number of practices found in farming that are designed to highlight the good and make it possible to avoid the harmful. Benchmarking ,in business practice, is used to signify a particular systematic approach in which a business evaluates its own operations and procedures through a detailed comparison with those of another business, in order to establish best practices and improve performance.
When using benchmarking in farming, it involves gathering data about the best performing farms and comparing them with other farms. Benchmarking can show how higher levels of performance can be achieved. Many insights can be gained through a benchmarking exercise. It can uncover problems of production, management practices and other factors that affect productivity, cost of production and profitability. These insights and discoveries can be used to improve farm performance.
The process starts by identifying farms and farmers that are performing well and are successful at what they do. It requires a thorough understanding of their farming practices in order to identify strengths and weaknesses and steps needed to improve performance. The performance of these ‘benchmark’ farms are set as a standard for farmers to compare themselves against.
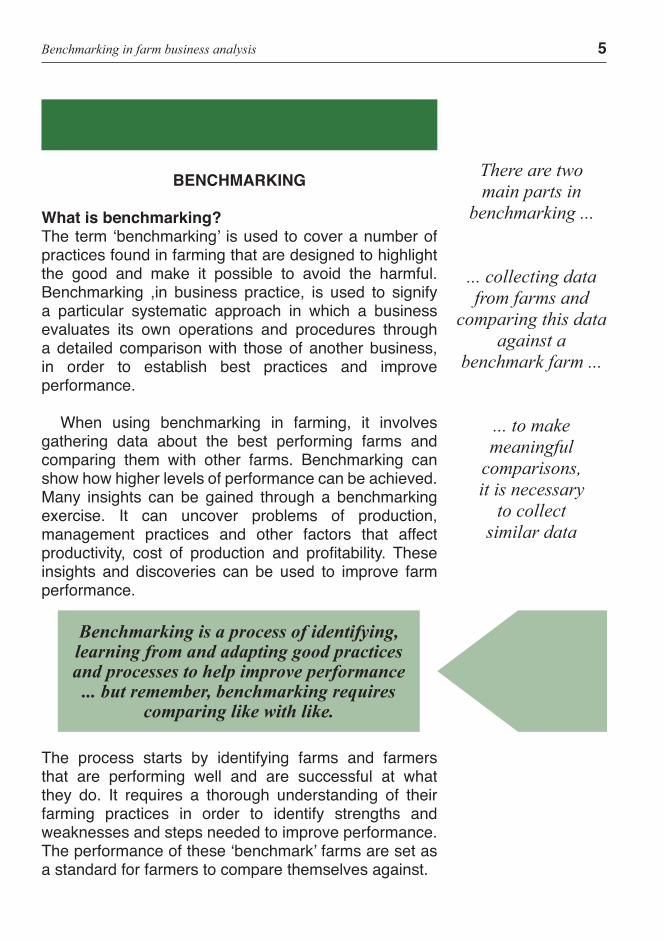
Benchmarking is a process of identifying, learning from and adapting good practices and processes to help improve performance
... but remember, benchmarking requires comparing like with like.
There are twomain parts in
benchmarking ...
... collecting datafrom farms and
comparing this dataagainst a
benchmark farm ...
... to makemeaningful
comparisons, it is necessary
to collect similar data
6 Farm business analysis using benchmarking
Informal benchmarkingFarmers often do benchmarking informally. A farmer sees another farmer with a larger harvest or one who gets a better price for the same product at the same market. Why is this so? A farmer hears of another farmer who reduces costs by introducing a new technology. Should she or he do the same? By observing and talking to successful farmers, others can learn how to improve the performance of their farms. Informal benchmarking can result from something as straightforward as a walk around someone else’s farm. Farm visits are considered an important part of benchmarking and will be discussed later.
Formal benchmarkingHowever, for best results farmers will need to learn how to benchmark through a more systematic approach. Formal benchmarking takes farmers through the following steps:
• examine their own farms and look for areas for improvement;
• identify a similar farm that is performing better; • study that farm in detail and try to find out what it is
that the farmer does better; • compare the performance of the two farms and
understand the reasons for differences; • plan and introduce changes to their farms based on
what they have learned.
Formal benchmarking provides a standard for comparison. It can be applied to:
• compare the performance of any farm with a more successful farm;
• compare the past performance of a farm; • compare a farm plan with the actual outcome; • compare production levels to check if the farm is
technically efficient; • compare production costs to check if the farm is
economically efficient; • examine the production and marketing processes to
determine if they are sound;
Informalbenchmarking
can help improveperformance ...
... however, to beefficient farmersneed to approachthe process in amore structured,formal manner
Benchmarking in farm business analysis 7
• learn from the experience of other farmers and generate new ideas.
Benchmarking can be internal to the farm business or external by comparing one farm with another
Internal benchmarkingInternal benchmarking takes place when the performance of the farm business is compared with itself. This is an internal assessment of past results to determine ways to improve. Over time the farm business is analysed, performance is measured, weaknesses and opportunities are identified, and on this basis improvements can be made. Good farm records are of great help with this.
Results of internal benchmarking can often be quite quick. The challenge is to know what farmers can do to improve performance once these lessons have been learned. The solution for farmers, however, often lies beyond the farm boundaries. This leads to external benchmarking.
External benchmarking External benchmarking involves comparing the performance of a farm business with the performance of other farms that have similar farm enterprises. The benchmark may be a competing farmer or simply a successful one who is ready to share his or her good farm management practices with other farmers in the vicinity. Either way, the benchmark farm serves as a demonstration of how things should be done. It can be studied, learned from and copied. (Depending on the farm enterprises and operations that are being examined, there could even be a number of benchmark farms selected for comparison.)
When should benchmarking be conducted?Benchmarking can be conducted at all times and at all stages of the farm decision-making cycle, from diagnosis and planning to implementation.
8 Farm business analysis using benchmarking
Comparative analysis
In developed countries, benchmarking has taken the form of detailed studies of the performance of farms located in the same area. Farms are usually clustered around similarity of the farming system and technology base. Benchmarks are identified by averaging data collected on farm performance from surveys of large groups of farms. The data collected is usually averaged out and standardised data is used for comparison. Sets of data are often calculated for different sub-groups of farms. Benchmarks on farm and enterprise profitability are commonly calculated. High profit benchmarks can be derived by selecting the farms in a group that are most profitable. Similarly other farms can be categorised as “weak” and average” performing.
There are many developing countries that have also institutionalised the tradition of collecting farm management data for comparative analysis. Annual or six-monthly reports are often prepared on a regular basis. The performance measures derived from the data are used at local levels in farm advisory work and at national levels to inform agricultural policy. This form of benchmarking is complex and requires the use of spreadsheets to analyse detailed financial and physical data. Within the farm management discipline this has traditionally been called comparative analysis.
Benchmarking in farm business analysis 9
Using ‘benchmarking’ as a tool for improved farm production and income
A small-scale farmer has a two hectare farm. She grows beans, cassava and millet. Half of her crop is sold at market and the rest is used by her family. She would like to do better and increase her yields and income. It seems that there are a few farmers in her area who do very well. They grow similar crops, produce more food and have higher incomes. She wants to understand how they do it. She contacts the local extension worker for advice.
The local extension worker suggests that together they visit a ‘better’ performing farm to gather information on methods of production, management and marketing practices. With this information they can identify ‘good practices’ as benchmarks for comparison. Using these as a guide she discovers new production practices and begins to experiment with small-scale drip irrigation, the better use of fertilizer and better harvesting practices.
She also knows that she should be making more money at the market. She learned from the ‘successful’ farmer that keeping an eye on the market and understanding market price information better is important. She collects market price data and finds that her main crop is harvested when prices are usually low. She knows from this exercise that the successful farmer either planted early or late in the season in order to avert low prices at harvest time. She learns to take more care about when to plant her crops.
After following these practicesour farmer finds herself with an
increase in production and surplusesto sell in the market at better prices.This she understands will improve
the livelihood of her family.
10 Farm business analysis using benchmarking
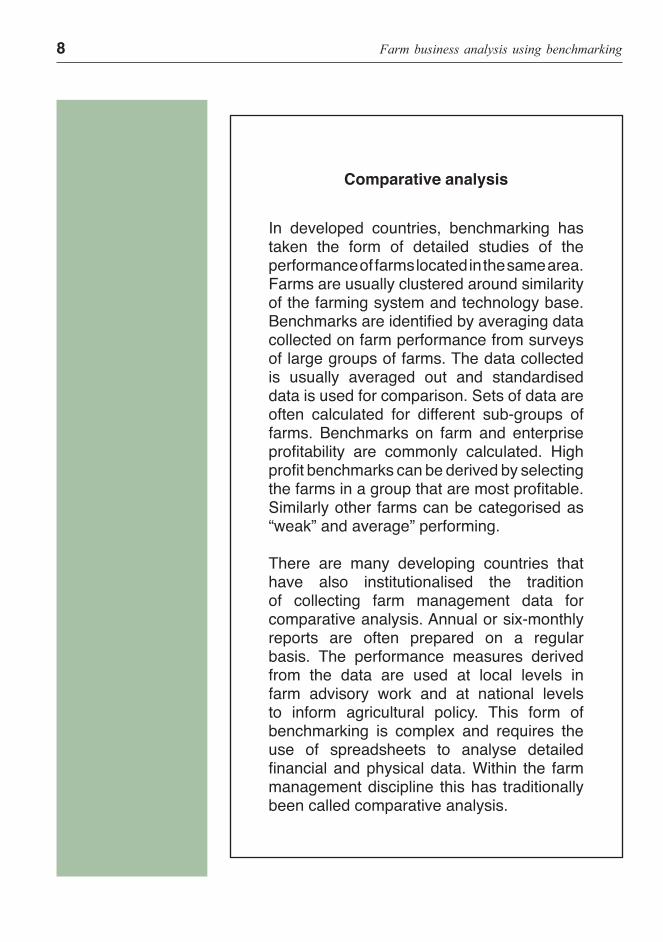
Women in Sierra Leone discussing farm enterprise alternatives
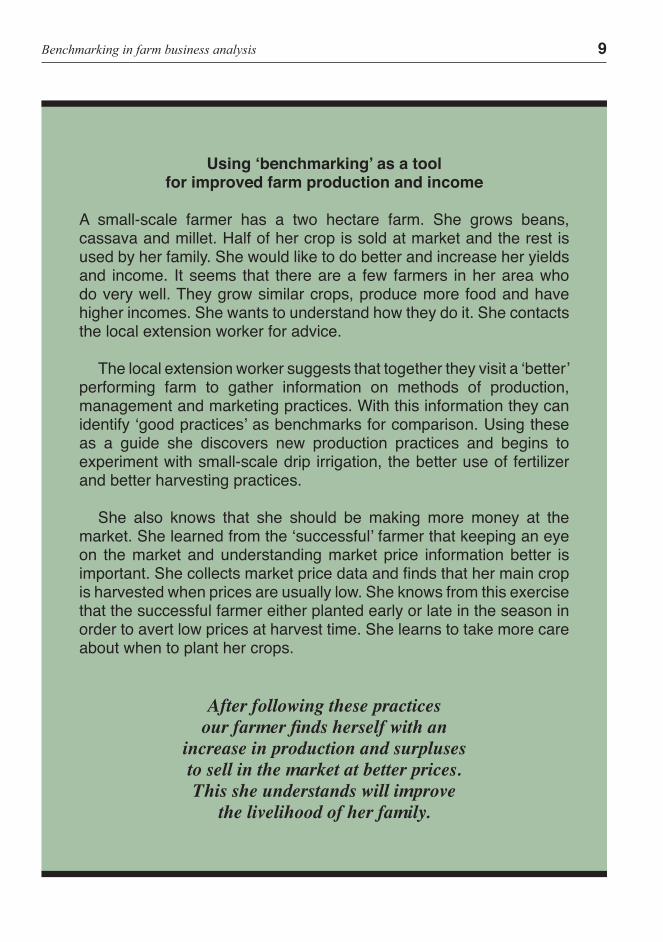
A farmer in South Africa diversifying her enterprises by introducing tomatoes
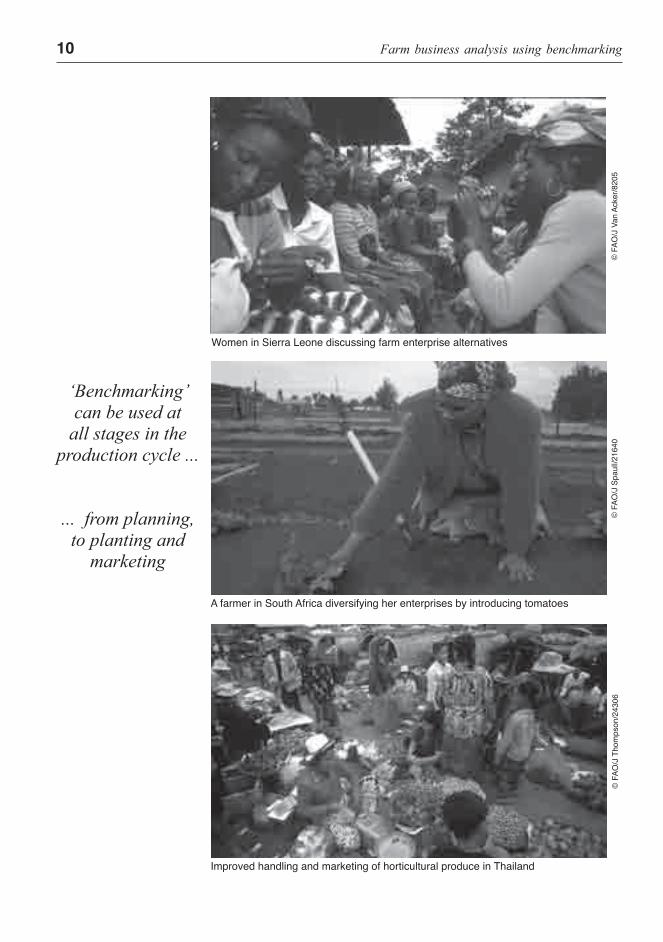
Improved handling and marketing of horticultural produce in Thailand
© F
AO/J
Tho
mps
on/2
4306
© F
AO/J
Spa
ull/2
1640
© F
AO/J
Van
Ack
er/8
205
‘Benchmarking’can be used at
all stages in the production cycle ...
... from planning, to planting and
marketing
11Benchmarking in farm business analysis
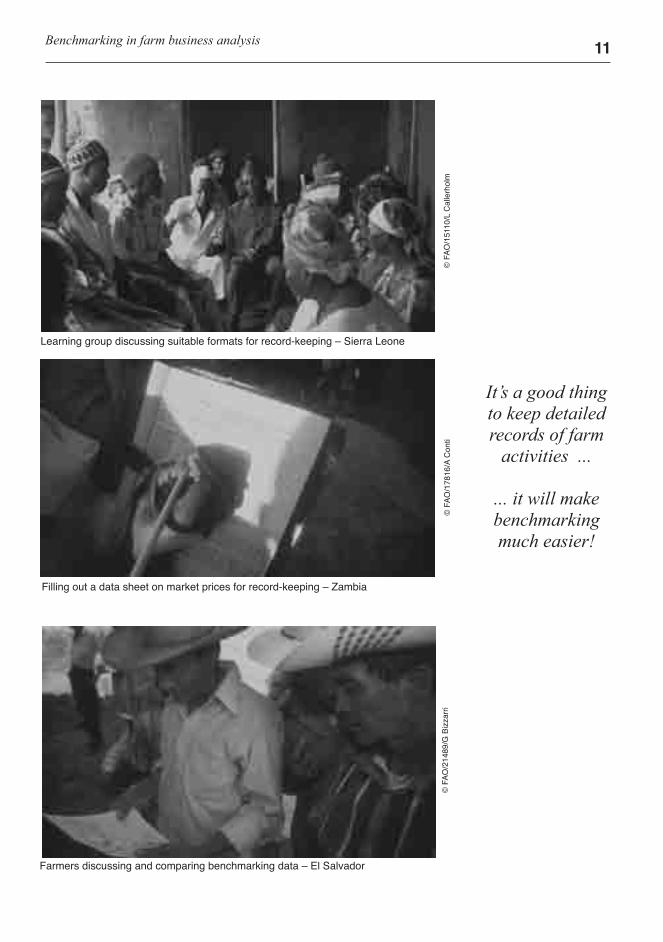
Farmers discussing and comparing benchmarking data – El Salvador
Filling out a data sheet on market prices for record-keeping – Zambia
Learning group discussing suitable formats for record-keeping – Sierra Leone
© F
AO/2
1489
/G B
izza
rri©
FAO
/151
10/L
Cal
lerh
olm
© F
AO/1
7816
/A C
onti
It’s a good thingto keep detailedrecords of farm
activities ...
... it will makebenchmarkingmuch easier!
12 Farm business analysis using benchmarking
FARM BUSINESS ANALYSIS
To use benchmarking effectively, extension workers need to understand and apply the concepts of profitability, technical efficiency and economic efficiency as they relate to the farm business. Further, the relationships between inputs, costs, outputs and income also need to be clearly understood. The key concepts of profit and efficiency are explained below. For more detailed understanding the reader should refer to the Annex on Business Concepts for Benchmarking.
Profit Profit is the difference between the money that comes in to the farm business from the sales of a product and the money that goes out to produce it. The money coming in is expressed as the total value of production. The money spent is expressed as costs.
Profit shows whether it is worthwhile engaging or remaining in the business. A number of reasons follow.
Profit is necessary to keep the farm business going. If inadequate profits are generated the farmer will have to sell equipment, farm implements and other assets in order to find the money to cover everyday costs. If the situation carries on for too long the farmer may end up selling the farm. The farmer would then be out of business.
Profit is necessary for growth of the farm business. A farm business needs money in order to develop and grow. Profit generates this money. The money accumulated from profits can be used to buy new machinery, equipment and implements. It can also be used to rent or buy additional land. In this way, the farm business can grow and expand.
Profit is necessary to ensure the survival and growth of the farm business
Benchmarking in farm business analysis 13
Profit is used to measure the success of the farm as a business. Profit can be used as an indicator showing the success of the business. The more profit the farmer makes the more successful the business is and the more likely it is to survive.
Profit is a reward. Farmers and their families put in their time and effort to work on the farm to earn ‘benefits’. In most cases, the family members are not paid a salary like other workers. Profit represents their ‘wages’. It can also be understood as a reward for their energy, time and effort in managing and working the farm. Profit can be seen as a return for the time and capital invested.
Profit provides money for the farm family. Profit provides the money farmers and their families need to buy additional goods and services and to pay for education and health care. The greater the profit, the more farmers can provide for their families.
Profit is a wage, profit is a reward for effort, and profit is a return on investment.
ProfitabilityProfitability measures how well the farm business uses the resources available to generate income and profit. Profit and profitability are not the same. As mentioned before profit is the amount of money earned after total costs are deducted.
Two farmers may show the same profits but may not be equally profitable. This could be a result of the way farmers use their resources. In order to compare these farms, we need to see exactly how the farmers make use of their resources to generate profits. As an example, if a farmer makes a profit of $1 000 we do not know if this level is high or low. Could the farmer have earned more by using the resources differently?
Using profitability as a basis for comparison instead of profit means that one can compare like with like. A farm of 2 hectares can be compared with a farm of 20 hectares.
Profit is a wage, profit is a reward
for effort, and profit is a return on investment
Profitability is a measure that
attempts to answer the question
“Are we making enough money for
the effort?”
14 Farm business analysis using benchmarking
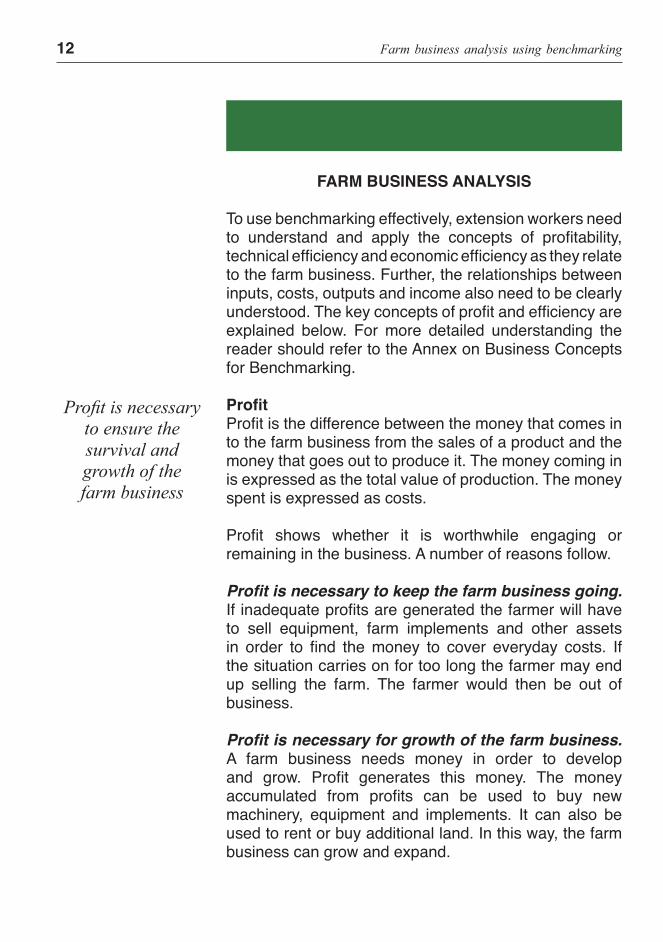
These farmers in Senegal used their profits to invest in a new cucumber enterprise
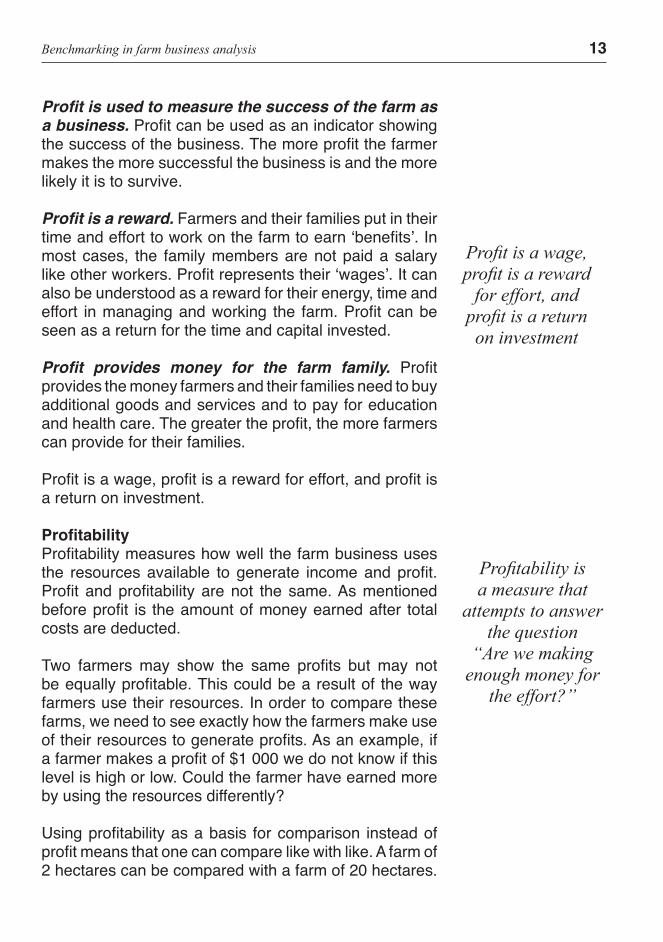
Profits can mean farm families in Bangladesh have more and different foods to eat
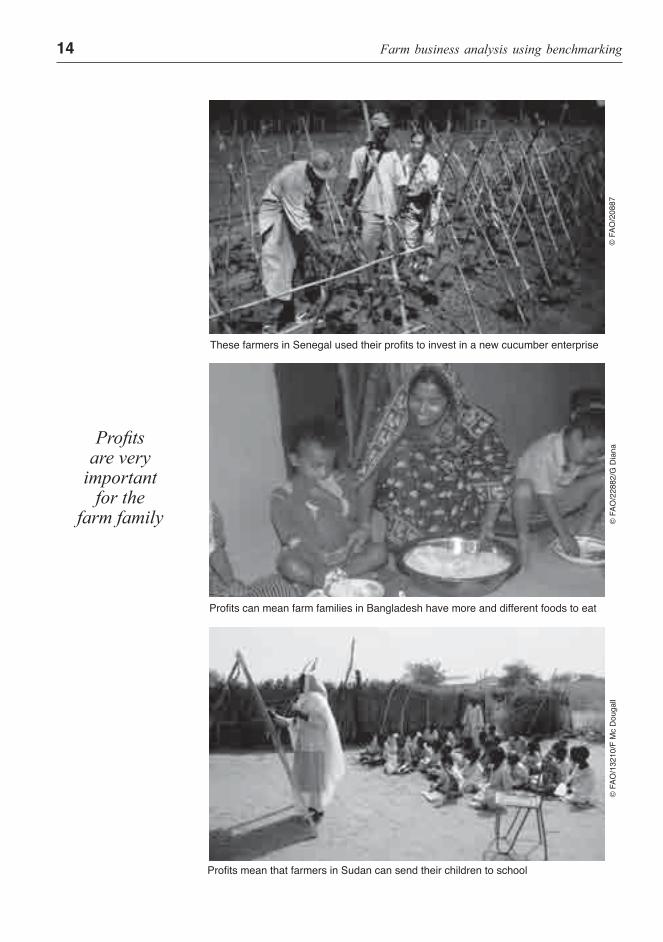
Profits mean that farmers in Sudan can send their children to school
© F
AO/2
0887
© F
AO/2
2882
/G D
iana
© F
AO/1
3210
/F M
c D
ouga
ll
Profitsare very
importantfor the
farm family
Benchmarking in farm business analysis 15
It may well be that while the farm of 2 hectares makes less profit than the farm with 20 hectares; the small-scale farm may be more profitable.
To compare profitability and performance, a farmer can use common measures such a gross margin, enterprise profit and farm profit *.
Efficiency Efficiency is the careful use of the resources available to the farmer. While the farm business may generate profits and be profitable, an important question to ask is whether or not the farm business is efficient. A farm that is efficiently run is more likely to be profitable than a farm that is not. There are two forms of efficiency ...technical and economic
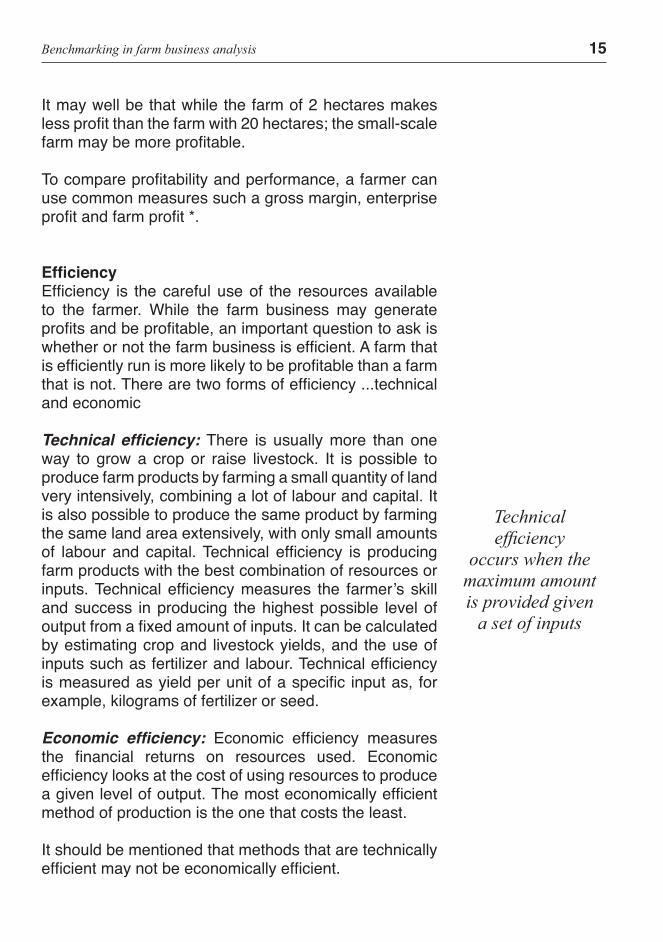
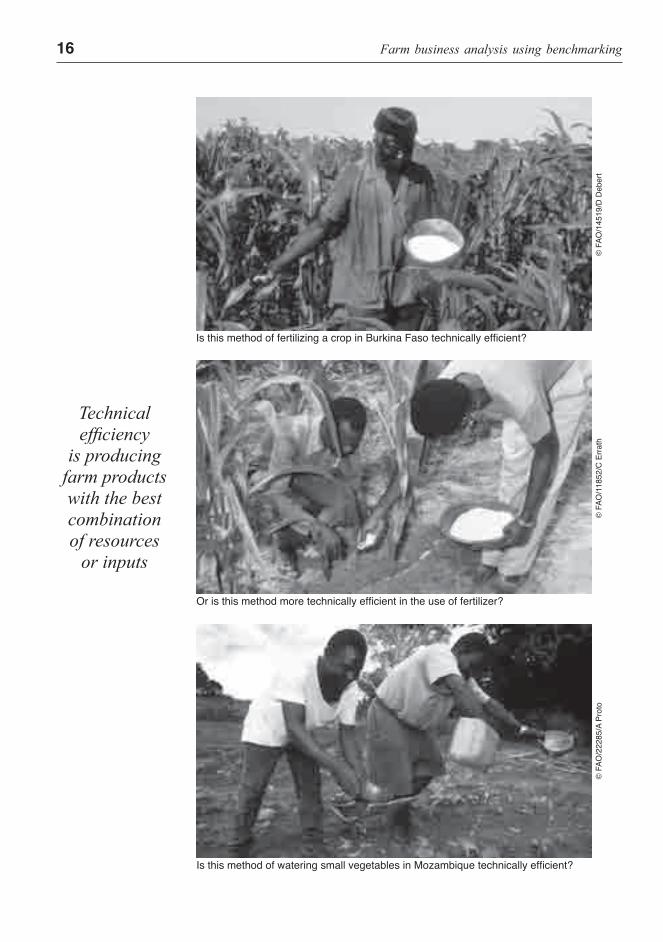
Technical efficiency: There is usually more than one way to grow a crop or raise livestock. It is possible to produce farm products by farming a small quantity of land very intensively, combining a lot of labour and capital. It is also possible to produce the same product by farming the same land area extensively, with only small amounts of labour and capital. Technical efficiency is producing farm products with the best combination of resources or inputs. Technical efficiency measures the farmer’s skill and success in producing the highest possible level of output from a fixed amount of inputs. It can be calculated by estimating crop and livestock yields, and the use of inputs such as fertilizer and labour. Technical efficiency is measured as yield per unit of a specific input as, for example, kilograms of fertilizer or seed.
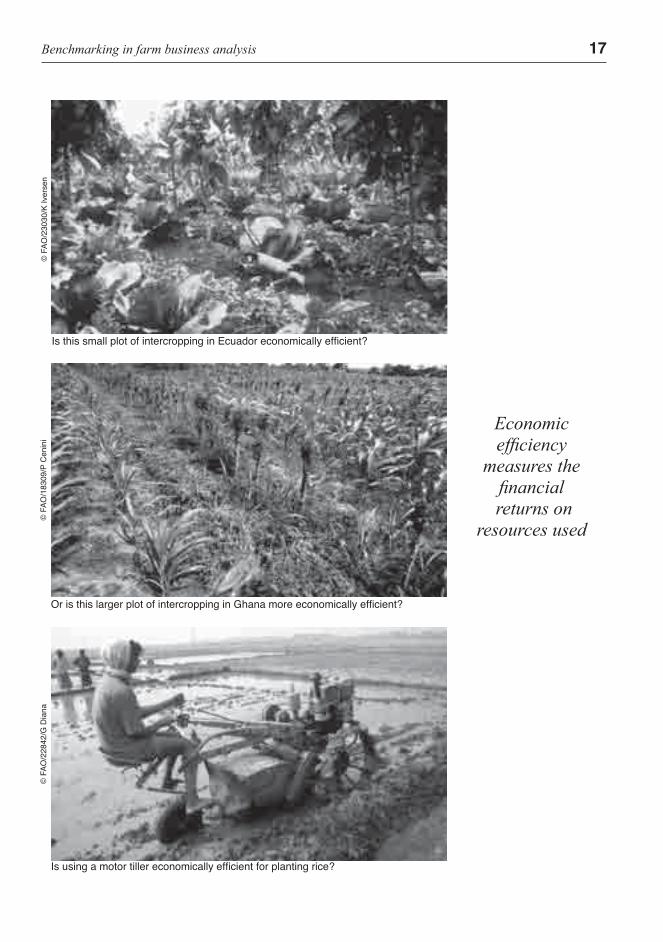
Economic efficiency: Economic efficiency measures the financial returns on resources used. Economic efficiency looks at the cost of using resources to produce a given level of output. The most economically efficient method of production is the one that costs the least.
It should be mentioned that methods that are technically efficient may not be economically efficient.
Technical efficiency
occurs when the maximum amountis provided given
a set of inputs
16 Farm business analysis using benchmarking
Is this method of fertilizing a crop in Burkina Faso technically efficient?
Or is this method more technically efficient in the use of fertilizer?
Is this method of watering small vegetables in Mozambique technically efficient?
© F
AO/1
1852
/C E
rrath
© F
AO/2
2285
/A P
roto
© F
AO/1
4519
/D D
eber
t
Technical efficiency
is producing farm products with the best combination of resources
or inputs
Benchmarking in farm business analysis 17
Is this small plot of intercropping in Ecuador economically efficient?
Or is this larger plot of intercropping in Ghana more economically efficient?
Is using a motor tiller economically efficient for planting rice?
© F
AO/1
8309
/P C
enin
i©
FAO
/228
42/G
Dia
na©
FAO
/230
30/K
Iver
sen
Economicefficiency
measures the financial
returns on resources used
18 Farm business analysis using benchmarking
To use benchmarking effectively,farmers need to understand
and apply the concepts of profitability,technical efficiency and economic efficiency
as they relate to the farm business.
Further, the relationships betweeninputs, costs, outputs and income
also need to be clearly understood.

Chapter 2Steps involved in benchmarking
20 Farm business analysis using benchmarking
MONITOR AND EVALUATEPLAN FOR CHANGE
SHARING
ORGANIZATION
IDENTIFICATION
DATA COLLECTIONCOMPARISON
ANALYSIS
THE BENCHMARKING PROCESS
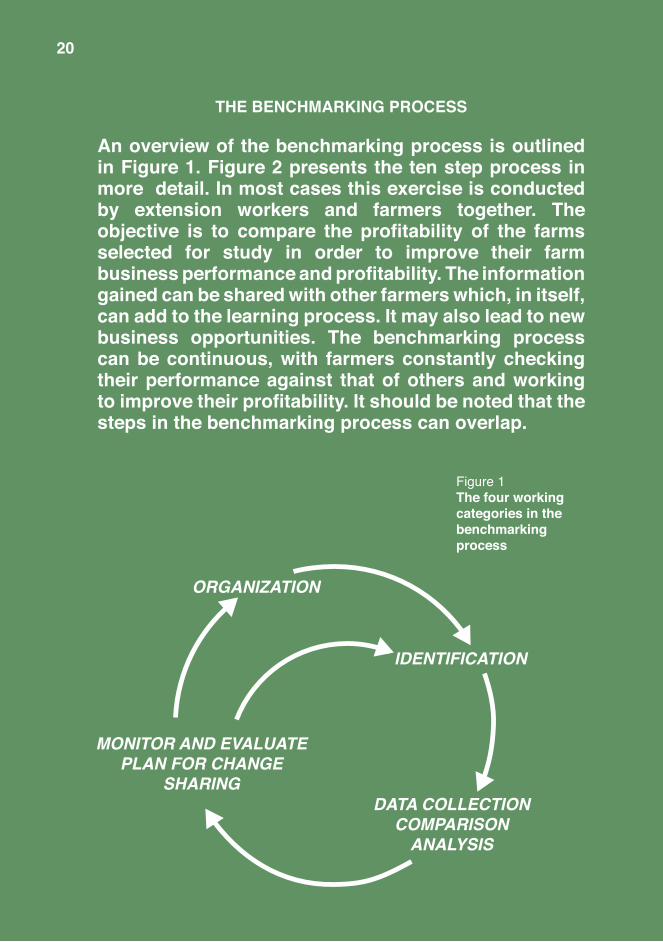
An overview of the benchmarking process is outlined in Figure 1. Figure 2 presents the ten step process in more detail. In most cases this exercise is conducted by extension workers and farmers together. The objective is to compare the profitability of the farms selected for study in order to improve their farm business performance and profitability. The information gained can be shared with other farmers which, in itself, can add to the learning process. It may also lead to new business opportunities. The benchmarking process can be continuous, with farmers constantly checking their performance against that of others and working to improve their profitability. It should be noted that the steps in the benchmarking process can overlap.
20
Figure 1The four workingcategories in thebenchmarking process
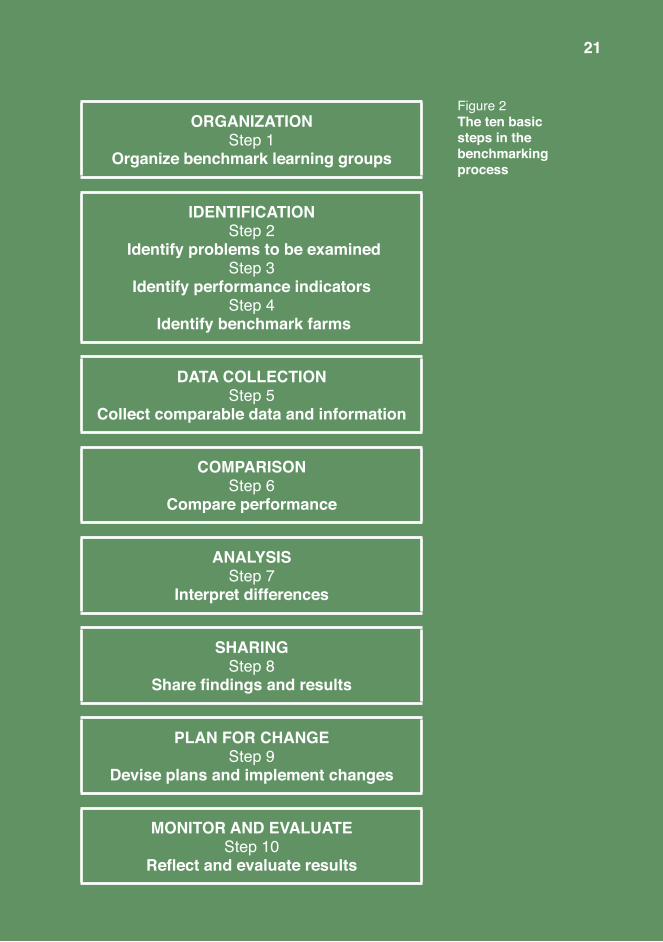
Figure 2 The ten basic steps in the benchmarking process
ORGANIZATIONStep 1
Organize benchmark learning groups
IDENTIFICATIONStep 2
Identify problems to be examinedStep 3
Identify performance indicatorsStep 4
Identify benchmark farms
DATA COLLECTIONStep 5
Collect comparable data and information
COMPARISONStep 6
Compare performance
ANALYSIS Step 7
Interpret differences
SHARINGStep 8
Share findings and results
PLAN FOR CHANGEStep 9
Devise plans and implement changes
MONITOR AND EVALUATEStep 10
Reflect and evaluate results
21
22 Farm business analysis using benchmarking
O R G A N I Z AT I O N
Step 1Organize benchmark
learning groups
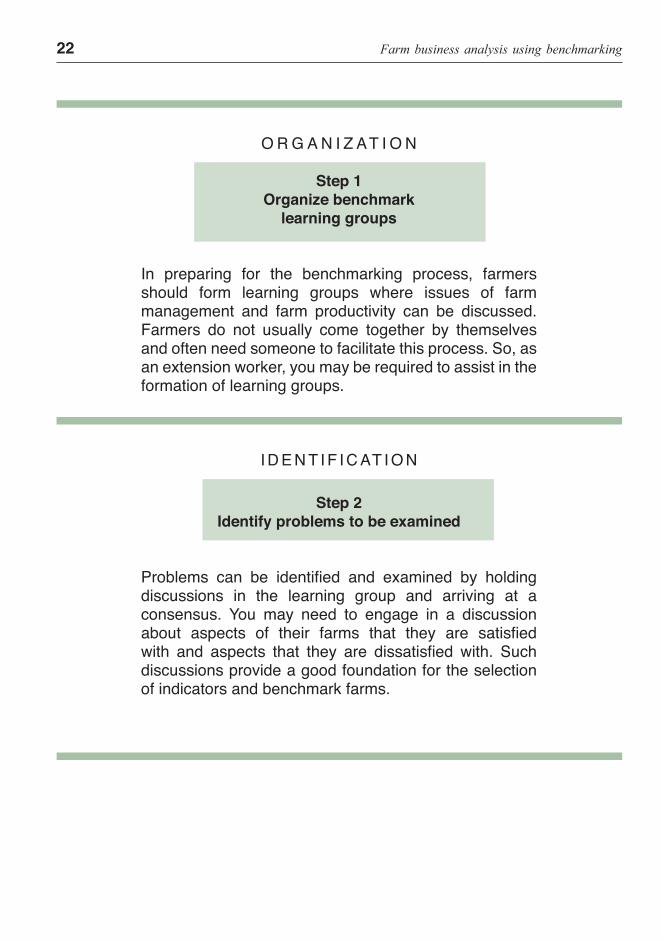
In preparing for the benchmarking process, farmers should form learning groups where issues of farm management and farm productivity can be discussed. Farmers do not usually come together by themselves and often need someone to facilitate this process. So, as an extension worker, you may be required to assist in the formation of learning groups.
I D E N T I F I C AT I O N
Step 2Identify problems to be examined
Problems can be identified and examined by holding discussions in the learning group and arriving at a consensus. You may need to engage in a discussion about aspects of their farms that they are satisfied with and aspects that they are dissatisfied with. Such discussions provide a good foundation for the selection of indicators and benchmark farms.
Steps involved in benchmarking 23
I D E N T I F I C AT I O N
Step 3Identify performance indicators
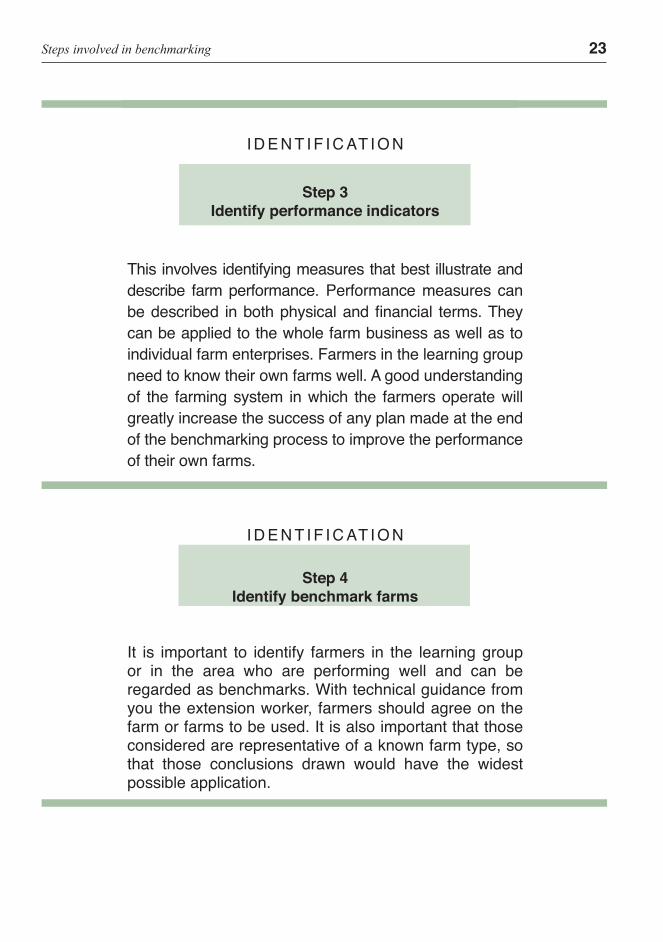
This involves identifying measures that best illustrate and describe farm performance. Performance measures can be described in both physical and financial terms. They can be applied to the whole farm business as well as to individual farm enterprises. Farmers in the learning group need to know their own farms well. A good understanding of the farming system in which the farmers operate will greatly increase the success of any plan made at the end of the benchmarking process to improve the performance of their own farms.
I D E N T I F I C AT I O N
Step 4Identify benchmark farms
It is important to identify farmers in the learning group or in the area who are performing well and can be regarded as benchmarks. With technical guidance from you the extension worker, farmers should agree on the farm or farms to be used. It is also important that those considered are representative of a known farm type, so that those conclusions drawn would have the widest possible application.
24 Farm business analysis using benchmarking
D ATA C O L L E C T I O N
Step 5Collect comparable data
and information
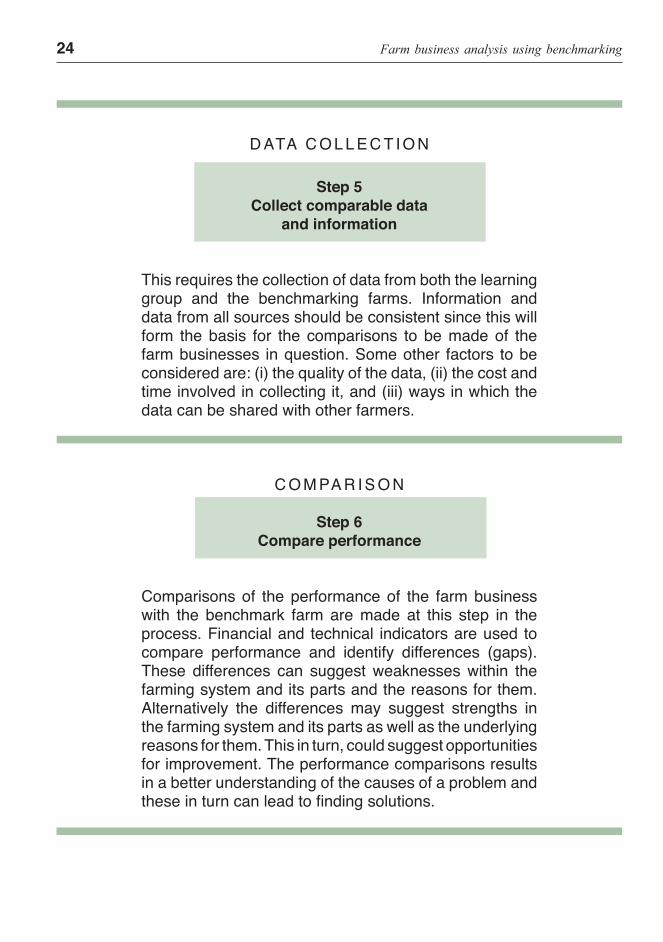
This requires the collection of data from both the learning group and the benchmarking farms. Information and data from all sources should be consistent since this will form the basis for the comparisons to be made of the farm businesses in question. Some other factors to be considered are: (i) the quality of the data, (ii) the cost and time involved in collecting it, and (iii) ways in which the data can be shared with other farmers.
C O M PA R I S O N
Step 6Compare performance
Comparisons of the performance of the farm business with the benchmark farm are made at this step in the process. Financial and technical indicators are used to compare performance and identify differences (gaps). These differences can suggest weaknesses within the farming system and its parts and the reasons for them. Alternatively the differences may suggest strengths in the farming system and its parts as well as the underlying reasons for them. This in turn, could suggest opportunities for improvement. The performance comparisons results in a better understanding of the causes of a problem and these in turn can lead to finding solutions.
Steps involved in benchmarking 25
A N A LY S I S
Step 7Interpret differences
Once areas of improvement have been identified, it is useful to examine the benchmark farms in more detail. Digging beneath the data will help to understand what a particular farmer is doing better than the farmers in the learning group. More importantly, it will help them to understand how it is being done.
S H A R I N G
Step 8Share findings and results
The sharing of findings and results of the benchmarking process is invaluable. Discussions with members of the learning group as well as other farmers located in the vicinity are important to ensure that the information derived from the benchmarking process is put to best use. You may find it difficult to convince farmers to share experiences about their farm business. Again, you will have to help farmers to see the value of sharing with one another. The information collected should provide benefits to all concerned.
26 Farm business analysis using benchmarking
P L A N F O R C H A N G E
Step 9Devise plans and implement changes
The purpose of identifying performance gaps and causes is ultimately to introduce actions and devise plans that the farmers in the learning group can use to improve the performance on their farms. Plans should include realistic targets for each farmer to achieve. You can encourage, and support farmers and guide them in action planning, but the preparation of the plan ultimately rests in the hands of the individual farmer.
M O N I TO R A N D E VA L U AT E
Step 10Reflect and evaluate results
The last step in the process is to reflect on and evaluate the results. This requires that the plan be monitored. The farmers can reflect on the outcome and decide on the next course of action. You can facilitate this learning process and help farmers in the learning group to increase the benefits received from the benchmarking process.
Chapter 3Benchmarking in extension
28 Farm business analysis using benchmarking
EXTENSION ROLES
Benchmarking can take place more or less accidentally, as a consequence of passing by other farmers’ fields, through exchange of labour and/ or by chatting with farmers in a market place. But it is an activity that can be deliberately supported and stimulated by extension workers such as you.
Benchmarking can be easily incorporated into your extension work. If you have good knowledge of the performance of farmers in your area, you will be in a good position to facilitate benchmarking analyses with farmers. If you do not have this knowledge it is advisable that you survey the area under your responsibility to gain an understanding of the farming system, the problems that farmers face and identify well performing farmers.
Some of the indicators that can be used in benchmarking are simple and part of your every day work as front line extension workers. It should be simple to compare crop yields, costs of production and some of the technical processes – time of sowing, time of harvesting, etc. – between farmers. For these benchmark comparisons you do not need to be an expert. Benchmarking, however, can become more complex in particular when making comparisons of farm enterprises and whole farm performance. This could be a task for a Farm Management Extension Specialist with a background in economics or farm business management. A description of the role and tasks of the Farm Management Specialist is the topic of Extension Guide 6.
While most farmers want to improve the productivity and profitability of their farms, they may not know how or where to start. They may not have the discipline or self-assessment needed to objectively analyse the
Benchmarkingcan easily be
incorporated intothe daily routine of
the extension worker
Benchmarking in extension 29
performance of the farm business. Your support as an extension worker is essential to facilitate the process.
As extension workers you should be able to assess the level of complexity of a benchmarking exercise that you will need to conduct and the skills that you will require to do so. FAO has also prepared more specialised training materials that have been developed to improve your skills in conducting more advanced benchmarking exercises looking at the performance of farm enterprises and the farm as a whole. This will require an understanding of the concepts of gross margins, enterprise budgets and whole farm profitability, subjects covered in depth in FAO training materials on farm planning and management1).
Benchmarking, whether conducted by front line extension workers or farm management specialists can be applied by working with farmers individually or with groups of farmers organized into farmer associations, cooperatives or specially formed ‘study groups’. Working with farmer study groups has considerable benefits for learning and sharing of information.
* * * * *
1) Reference materials include Market-oriented Farm Management for trainers of Extension workers in Africa. Farm Planning and Management for Trainers of Extension Workers in Asia.
30 Farm business analysis using benchmarking
BENCHMARKING AND LEARNING
Learning is a process that involves experience, practice and insight and can occur through observing the actions of other farmers and their consequences. Benchmarking is essentially a learning tool, where imitating successful farms or avoiding the actions of unsuccessful ones, can enhance the capacity and speed of learning. Learning, information sharing and the adoption of best practices to improve farm performance are crucial to benchmarking.
Benchmarking has a strong social dimension especially when conducted in ‘learning groups’. Conducting benchmarking exercises in this way has been seen to lead to changes in practices and identifying new ways of reducing costs and increasing profitability. Unsustainable businesses can become economically sustainable. It can drive learning at different levels. Farmers have been seen to start keeping records, whilst developing an understanding of business management concepts and the factors that affect farm profitability. Learning from others often leads to the idea of learning with others through networks of farmers and even farmer organizations.
Farmers who are usually more willing to adopt new ideas and methods are often leaders within their community. They can be a good example for farmers in the community and could assist in forming learning groups and take the lead in facilitating benchmarking. These farmers should be identified and approached first.
In preparing for benchmarking, farmers could form groups where issues of farm management and farm productivity can be discussed. Farmers do not usually come together by themselves and often need someone to facilitate this process. So, as an extension worker, you may be required to assist in the formation of learning groups.
Benchmarking in extension 31
A key to success in small group benchmarking is trust and a sense of collaboration. The willingness of farmers to share data, to keep good records and the social factor of groups meeting on each other’s farms and in social spaces, make learning through these groups worthwhile and enjoyable. They also appeal to the habit that farmers have of ‘peering over their neighbour’s fences’ to judge the performance of their own farm against that of others. Membership of a group can give the confidence to make changes, based on the experience of others, and to experiment with new innovations.
In short, a ‘learning group’ has the potential to: • Create motivation for change; • Provide a vision for what a farm can look like after
change; • Provide data, evidence and success stories for
inspiring change; • Identify best practices for how to manage change; • Create a baseline or yardstick by which to evaluate
the impact of changes.
Notes
32 Farm business analysis using benchmarking
Facilitating learning is the skill of helping farmers increase their ability to assess their circumstances, weigh up options, see the consequences of various possibilities and then to make informed decisions as to the actions they need to take on their farms.
As extension workers you should be aware that in the end, it is the farmer’s choice about what to do or not to do. But it is your responsibility to help the farmer understand the positive and negative outcomes of choices and decisions made. This is a high-level skill for most extension workers because this is where the real learning from benchmarking takes place. So extension workers have to have the skills to know how to facilitate learning.
* * *
BENCHMARKING SKILLS
To be effective, you will need to acquire a range of skills that complement your current technical and extension training. These skills include:
• group formation; • farm diagnosis; • farm business management • technical aspects of farming; • facilitation; • learning.
33Benchmarking in extension
A summary of the knowledge
and skills needed to facilitate
benchmarking ...
Skills required for benchmarking
Group formation and extension, such as: • group development; • group performance; • principles, techniques and tools of group
dynamics; • facilitation.
Agricultural production and technical knowledgefor assessing the technical efficiency of a farm, such as: • the relationship between soil, climate, moisture,
and crops and livestock; • the relationship between inputs (e.g. fertilizer,
pesticide, labour) and yields for crops and livestock;
• the various production processes in growing crops and raising livestock.
Farm management skills for assessing the economic efficiency of a farm, such as: • calculating profit; • calculating gross margins;
• the relationship between market prices and income;
• the relationship between input prices and income.
•Diagnostic skills for identifying key performance measures, and later for identifying gaps and causes.
Facilitation skills for helping farmers to understand the positive and negative outcomes of their choices and decisions. A required skill is knowing how to facilitate learning.
34 Farm business analysis using benchmarking
KEY POINTS IN BENCHMARKING
The key points when conducting benchmarking exercises are that: • Farmers need accurate information on their own
farms in order to compare their farm businesses with others.
• Since their farms are to be compared with farms similar in type and size, benchmarking is usually conducted among farms in the same area
• When conducting benchmarking exercises remember to:o compare like with like;o be methodical about your work; record all of your
findings;o focus on negative gaps; these represent
opportunities for improvement;o try to establish the level of significance of the
differences identified. (Highlight those with high impact on farm performance and profitability); and
o adequately cover all of the agreed measures.
As part of your extension role in working with farmers within a ‘learning group’ is to raise awareness amongst them that:
• There is a need for farmers to have improved business skills to effectively compete in modern farming.
• There is a need for farmers to be more competitive, profitable and efficient in their use of inputs.
• Competition is increasingly beyond the borders of their region and country.
• Benchmarking calls for famers to be open and willing to share their experiences.
Benchmarking in extension 35
Do ...
• Make sure that the enterprise, activity or function selected is the most critical to the farm business.
• Ensure that the problem is well defined and can be taken up quickly, preferably before the next crop or livestock cycle.
• Seek agreement regarding the choice of enterprises and problems to focus on.
• Give notice of the benchmarking exercise to other farmers in the area.
• Keep the exercise simple and match the level of complexity with the interest and skills of the farmers.
Do not ...
• Benchmark topics where learning group performance has been good.
• Benchmark topics or processes that are not important to your farmers.
• Benchmark processes that are so broad in scope and so poorly defined that your learning group cannot agree on the purpose of the exercise and will not focus its efforts.
• Undertake major strategic benchmarking initiatives if your farmers are not committed to change their current practices.
• Record keeping is essential to capture the data necessary for analysis.
• Learning groups are vital to build trust and openness. • Good facilitation is essential to effectively run the
learning group.
Things ‘to do’ and things
‘not to do’ in benchmarking
36 Farm business analysis using benchmarking
BENCHMARKING: SOME CONCERNS
Benchmarking is not without weaknesses that need to be understood. Some of these are discussed here.
Finding comparable benchmarksThe diversity of the farming systems in some areas may make it hard to find comparable benchmarks. Each farm family is unique. Their goals, resources, abilities and Attitudes to risk are unique. No two farms are exactly the same. The differences in the ecology and the resource base of the farms sometimes make it difficult to find a standard of comparison. If farms are grouped by the main farm enterprise, they may come from different areas with different soils and climate. Each farm has different objectives and resources. In all cases the extension worker has an important role to facilitate the process to find the best or most representative benchmark farm possible.
Construction of averages and standardsIn some situations specialists may be employed to construct benchmarks. This requires collecting data from similar farms in the vicinity and calculating standards based on average performance. The averages created provide a theoretical ‘benchmark’. There are, however, limits to the usefulness of constructing averages as a standard for comparison. Averages are artificial and do not always represent reality. There are always some farms in any group that are more profitable and efficient than the average farm. Also, average cost is an average for the whole year. It does not take into account seasonal variations and price variations. It is important for the extension worker to understand these limitations, especially when helping farmers to develop action plans that include projected outcomes. These outcomes will vary, and the variations may discourage farmers.
Benchmarking is not without weaknesses
that need to be understood.
Some of these are discussed here
37Benchmarking in extension
Deficiencies in record-keepingIn many cases farmers do not record data in sufficient detail to allow meaningful comparisons to be made. Extension workers should be aware of this reality when setting up the farmer learning group. Positive results from a benchmarking exercise can alert farmers to the value of keeping records on their farms.
Inadequate diagnosticsBenchmarking may suggest a weakness but it does not determine the cause of the weakness. The weakness is not the cause of the gap in performance. It is merely a symptom of a missing element in farm management. There is often a tendency to stop the diagnosis once the weakness has been identified. The extension worker will need to encourage digging deeper until the root cause is found.
Sharing of information among farmersFarmers are often reluctant to show their financial position as they are afraid of competition. Even where information is recorded there is a lack of willingness to be open and frank about the problems of the business. Poor results tend not to be discussed.
* * *
Differences in performance should be traced
to all parts ofthe enterprise
budget and to the profit of the farm
as a whole
38 Farm business analysis using benchmarking
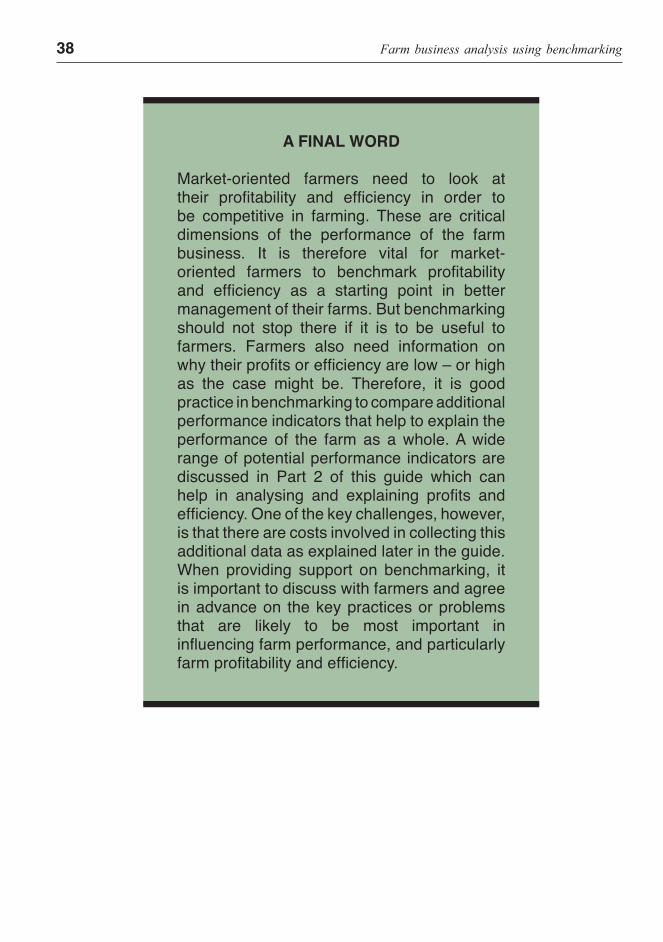
A FINAL WORD
Market-oriented farmers need to look at their profitability and efficiency in order to be competitive in farming. These are critical dimensions of the performance of the farm business. It is therefore vital for market-oriented farmers to benchmark profitability and efficiency as a starting point in better management of their farms. But benchmarking should not stop there if it is to be useful to farmers. Farmers also need information on why their profits or efficiency are low – or high as the case might be. Therefore, it is good practice in benchmarking to compare additional performance indicators that help to explain the performance of the farm as a whole. A wide range of potential performance indicators are discussed in Part 2 of this guide which can help in analysing and explaining profits and efficiency. One of the key challenges, however, is that there are costs involved in collecting this additional data as explained later in the guide. When providing support on benchmarking, it is important to discuss with farmers and agree in advance on the key practices or problems that are likely to be most important in influencing farm performance, and particularly farm profitability and efficiency.

P a r t 2Step-by-step field guide
This part of the guide has been designed to be used in the field when you begin to lead farmers in exercises. Each step provides practical guidance in conducting benchmarking exercises which should be of help to you and farmers alike during the entire process. Of course, and it cannot be stressed too highly, the best way to become proficient is to apply the steps in the field.
40 Farm business analysis using benchmarking
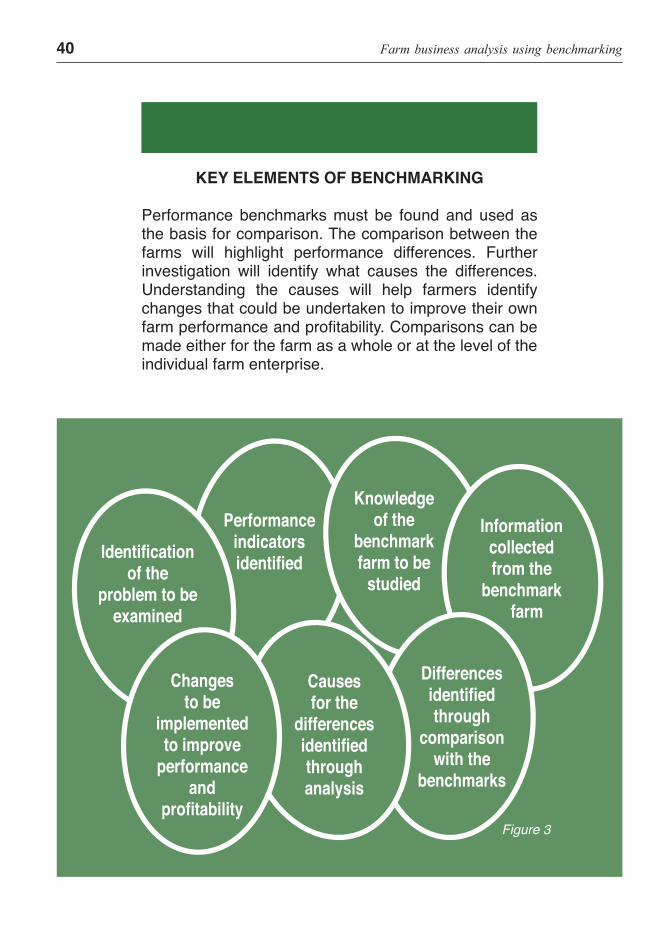
KEY ELEMENTS OF BENCHMARKING
Performance benchmarks must be found and used as the basis for comparison. The comparison between the farms will highlight performance differences. Further investigation will identify what causes the differences. Understanding the causes will help farmers identify changes that could be undertaken to improve their own farm performance and profitability. Comparisons can be made either for the farm as a whole or at the level of theindividual farm enterprise.
Identification of the
problem to be examined
Performance indicators identified
Knowledgeof the
benchmarkfarm to be
studied
Informationcollectedfrom the
benchmarkfarm
Changesto be
implementedto improve
performanceand
profitability
Causesfor the
differencesidentifiedthroughanalysis
Differencesidentifiedthrough
comparisonwith the
benchmarks
Figure 3

Step-by-step field guide 41©
FAO
/196
37/G
Biz
arri
O R G A N I Z AT I O N
42 Farm business analysis using benchmarking
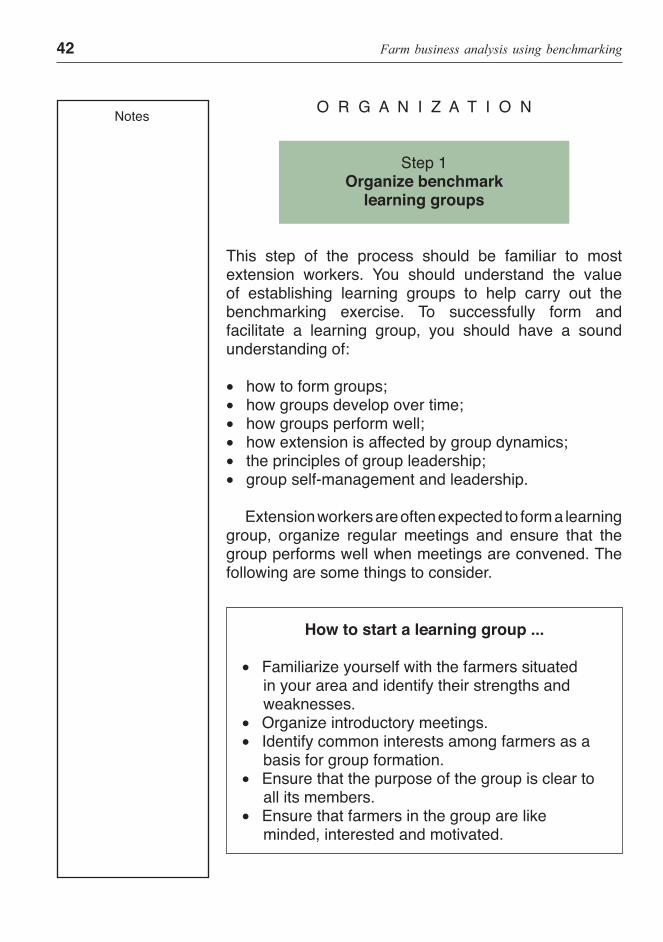
O R G A N I Z A T I O N
Step 1Organize benchmark
learning groups
This step of the process should be familiar to most extension workers. You should understand the value of establishing learning groups to help carry out the benchmarking exercise. To successfully form and facilitate a learning group, you should have a sound understanding of:
• how to form groups; • how groups develop over time; • how groups perform well; • how extension is affected by group dynamics; • the principles of group leadership; • group self-management and leadership.
Extension workers are often expected to form a learning group, organize regular meetings and ensure that the group performs well when meetings are convened. The following are some things to consider.
How to start a learning group ...
• Familiarize yourself with the farmers situated in your area and identify their strengths and weaknesses.
• Organize introductory meetings. • Identify common interests among farmers as a
basis for group formation. • Ensure that the purpose of the group is clear to
all its members. • Ensure that farmers in the group are like
minded, interested and motivated.
Notes
Step-by-step field guide 43
NotesHow to form a group ...
• Organize no more than 20 farmers into a learning group.
• Ensure that all farmers understand the learning objectives.
• Organize a timetable for learning group meetings.
• Gain consensus among farmers on length, duration and frequency of meetings.
• Encourage group motivation, participation and commitment.
• Select an appropriate venue for group meetings. • Develop rules all group members agree to and
will respect.
How to conduct meetings ...
• Plan meetings in advance. • Discuss the topics to be covered. • Make sure that the interests of both men and
women members are addressed. • Make sure that priorities are agreed upon. • Understand what the members expect to learn
from the meeting(s). • Have clear objectives for each meeting. • Encourage members to manage the meetings
themselves. • Make adequate provision for training materials
and resources. • Designate a person to keep meeting minutes. • Periodically check the interest and availability of
farmers to meet regularly.

44 Farm business analysis using benchmarking
For effective group functioning ...
• Make sure that all members are given an opportunity to contribute their ideas.
• Facilitate learning within the group. • Facilitate group discussions and decision
making. • Ensure that communications between members
are clear and timely. • Periodically reflect and assess group
performance. • Try to avoid conflicts among participants. • Develop skills to resolve conflicts when they
occur.
Notes
As a facilitator you should objectively assess your knowledge and skills to see if they match the tips provided on the opposite page. If they do, you are in a good position to lead a learning group. If you do not have all of the knowledge and skills listed, or have them only to a limited degree, then more training in group formation and management will be needed.*
ATTRIBUTES OF A GOOD FACILITATOR
• good listener • open minded • patient and understanding • accepting different views • inclusive • respectful • impartial • dynamic
• good communicator • well prepared • willing to learn from
mistakes • well mannered • composed and confident • in control • time conscious
* For additional information on group promotion published by FAO see FAO. 2000. The group promoter’s resource book, by V. Groverman, Rome

Step-by-step field guide 45
NotesTips for facilitation ...
• Facilitation involves communication. • A good facilitator will consider all modes of
communication. • Communication requires the facilitator to:
– convey information, ideas and emotions to others in such a way that they are received as intended;
– engage in active listening; – develop good questioning skills-the ability to ask for information and opinions in a way that gets relevant, honest and appropriate responses;
– engage in verbal communication; – use and interpret non-verbal communication; – facial expressions, body movements and physical contact;
– provide constructive feedback for the others involved.
• Encourage communication between group members.
• Limit how much you talk in meetings. • Help the participants to listen to each other. • Help them understand and accept that all
opinions have value. • Encourage the participants to discover solutions
for themselves and take responsibility for their own learning.
• Manage conflict - it can be good for ideas to clash. It is not good for participants to clash.
• Be aware and act when someone tries to dominate.
• Be aware and act when a participant is shy.

46 Farm business analysis using benchmarking
Notes
Step-by-step field guide 47©
FAO
/225
88/A
Pro
to
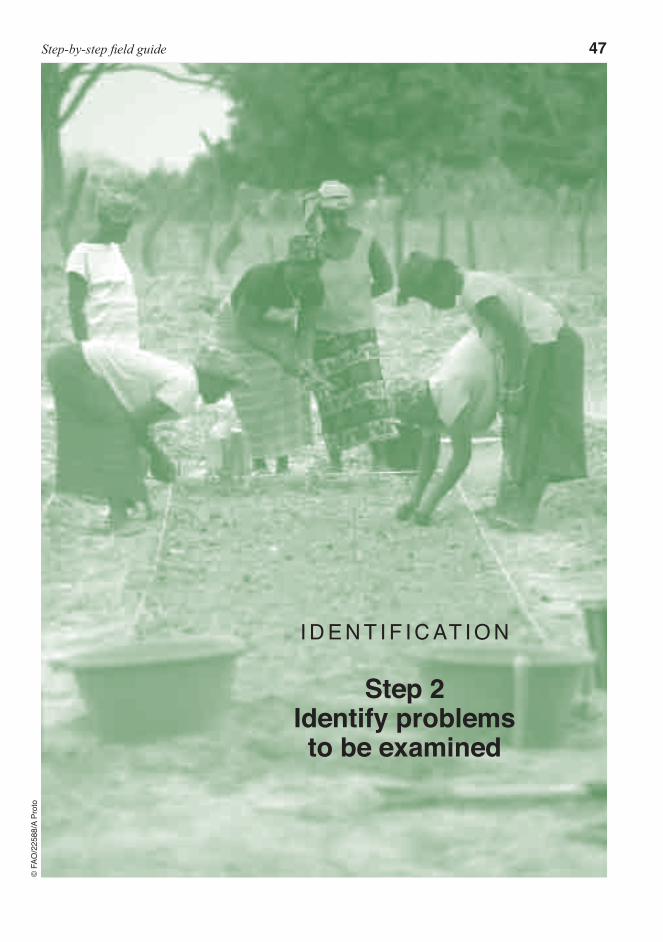
I D E N T I F I C AT I O N
Step 2Identify problems to be examined
48 Farm business analysis using benchmarking
I D E N T I F I C A T I O N
Step 2Identify problems to be examined
Farmers have to understand that the problems that impact on farm business performance need to be well understood and articulated before benchmarking exercises are conducted. As a starting point, they need to have a good understanding of their farm as a business. This is important to ensure that benchmarking exercises are not carried out needlessly and the results do not contribute to farm performance.
Problems need to be defined carefully. “A problem well defined is a problem half solved.” This is far from an easy task and requires some discussion among the members of the learning group. As it is too time consuming to try to analyse every possibility, you should look for those factors that have a critical influence on bottom line profitability. This will often entail collecting data and information on farm and enterprise profitability from your farms and analysing them to define the most critical problems for analysis.
Furthermore, there should be a common interest among some or all of the farmers to address the problems identified. It is your job to ensure that the group members agree on these problems. If the problems have not been well defined and it is not apparent to all members the benchmarking process will be of little value. Understanding, agreement and consensus are required by farmers, before proceeding with the subsequent steps in the benchmarking process.
It is important to note that symptoms of a problem should not be confused with the problem itself. For example, low yields are a symptom of a problem that stems from the method of production and inputs used by the farmer. The real problem might be the inappropriate
Notes
Step-by-step field guide 49
use of fertilizer, the inefficiency of irrigation and poor crop spacing while planting.
You could pose probing questions to engage the group in a discussion on problems and opportunities on their farms. Such discussions could highlight the critical issues for benchmarking analysis.
* * *CONDUCTING GROUP DISCUSSIONS
ON PROBLEM IDENTIFICATION
What are the kind of problems that you are facing that are impacting negatively on your farm performance? Any suggestions?
Some of you have mentioned low profitability of your maize crop and others have identified low yields. A few of you highlighted the problems that you’re experiencing in producing tomatoes. Is this a problem of low yields, high cost of inputs or low prices that you’re getting for sales?
Let’s study this in greater detail and form two groups: one group will analyse the factors that affect the profitability of maize and the other group will look at tomatoes. Do you agree on the topics? If so, we’ll discuss the way forward.
* * *As the leader of a learning group you would be expected to carry out the following:
• Ensure that all farmers have a chance to express their problems openly and that all problems are discussed.
• Facilitate open discussion so that the real problem(s) surface.
• List all the problems and rank them in order of importance.
• Ensure that there is a consensus and that the problems are fully understood.
Notes
50 Farm business analysis using benchmarking
In some situations farmers may be reluctant to talk openly about financial aspects of their farm business. It is important that you recognize this and find ways to build confidence and create an atmosphere of trust.
Notes
Notes
Tips for analysing farm enterprise profitability and performance ...
• Conduct a problem analysis for selected enterprises.
• Assist farmers in understanding market costs and margins in calculating the farmgate price.
• Understand the reasons why prices change in both the short and long term.
• Analyse market information over the season. • Draw up gross margin or enterprise budgets
for different farm enterprises.
Step-by-step field guide 51©
FAO
/215
17/G
Biz
zarri
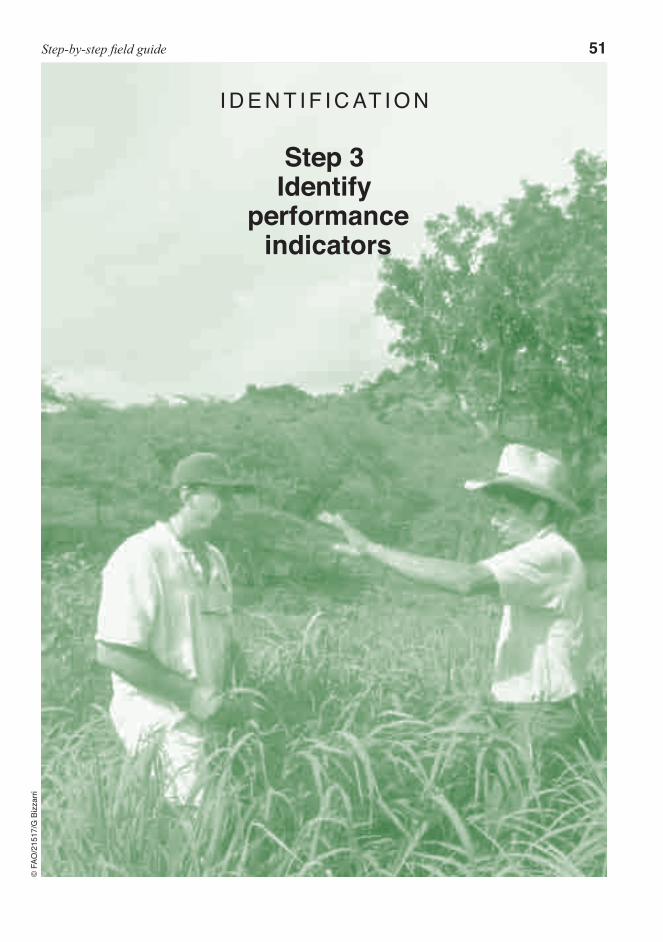
I D E N T I F I C AT I O N
Step 3Identify
performance indicators
52 Farm business analysis using benchmarking
I D E N T I F I C A T I O N
Step 3Identify performance indicators
Establishing accurate measures and indicators is vital to the benchmarking process. Too many indicators will make the comparison difficult and time consuming. Too few indicators will not give sufficient information to help the farmers make decisions about ways to improve their performance. Successful benchmarking relies on selecting indicators that are most appropriate for the comparison being made.
Deciding on indicators is not simple but it is a task of the utmost importance. The indicators should reflect the most critical problem of the farm business that prevents it from performing better. It should be possible to look comprehensively at all aspects of the farm to arrive at indicators that appear to be the most important. Taking a view of the farm business as a whole and examining the complete range of possibilities can without doubt be time consuming. A practical way is to list those aspects of the farm business that have a critical influence on the bottom line – farm profitability.
Participation of farmers in defining indicators is a vital part of the process. They need to select key performance indicators that reflect the problems identified at the beginning of the benchmarking process. This involves identifying those that best illustrate or describe farm performance. The skills needed to identify performance indicators require a basic knowledge of farm business management. The more farmers are involved the more likely they are to understand and make use of indicators for farm management decision-making.
Notes
Step-by-step field guide 53
NotesPrior to this, farmers need to have good knowledge of their farms and in particular their performance. To successfully manage this step, they must understand the farm as a system including the links that extend beyond the boundary of the farm itself. To be able to conduct a meaningful benchmarking exercise, information showing the relationship between inputs used and outputs is needed from the farm or farms being studied by the learning group as well as from the benchmark farm. These relationships are critical factors in analysing farm performance. Extension workers should be familiar with the concepts of profit and efficiency and be in the position to select indicators that reflect all aspects of the performance of the farm and its enterprises. It is important to remember that indicators can be used to measure the performance of the farm as a whole and its individual enterprises. This can be described in both physical and financial terms. Indicators can also be prioritized or ranked according to their contribution to farm and enterprise profitability. A small improvement in the indicators chosen should result in a significant improvement in the profitability of the farm.
Benchmarking, however, is not only concerned with the indicators of performance but also the processes that lie behind the measures. This includes the activities involved in transforming the farm inputs into outputs. The level of inquiry drills below the indicators of farm and enterprise performance down to the actions that farmers undertake and if improved could also result in greater efficiency and profitability. This requires better understanding of the decisions that successful farmers take to improve the performance of their farms. As such it is not only a comparison of economic results and indicators, although these are often used as a starting point, but also an analysis of each step in the production and marketing processes of farm products, identifying what can be done better and improving one’s own farm operations. The measures used for comparison of these processes and activities are often technical and
54 Farm business analysis using benchmarking
qualitative in nature. Examples include the correct timing of field operations, the use of inputs, selection of markets and the quality of supporting services on offer.
Selecting accurate measures and indicators can take time and it must be done with care to ensure that the indicators are reliable. The choice of measures is influenced by:
• what the farmers want to achieve; • the problems that farmers are facing; and • the factors that have the greatest potential for
increasing farm income.
Some indicators fall outside of the control of the farmer’s influence. Thus, it is useful to divide indicators between those that can be affected by better management and those that cannot. It would not be worthwhile to collect data on indicators of which little can be done to improve performance.
Tips on indicators • Select indicators that accurately measure the
problem(s) identified. • Indicate the types of data needed (e.g. land,
labour, capital, production, market, input supply, infrastructure, enterprise and farm profitability).
• Remember that farmers need to have an in-depth understanding of the problems in order to select appropriate indicators.
• Make sure that you identify the main factors that influence farm or enterprise profitability and performance.
• Remember that input-output relationships are critical in analysing farm or enterprise performance.
• Point out that either too many indicators or too few indicators could make comparison difficult.
• Ensure that all farmers understand the indicators and that there is agreement on those to be used.
• Ensure that all farmers in the learning group participate.
Step-by-step field guide 55
Combinations of indicators
It is often of little value to compare a single indicator and take action to improve it. Many other efficiency factors could be derived to suit specific needs. It is also important to realize that many of the indicators in most farm businesses are interrelated. The ability to increase profit, for example, depends on production levels, prices received for produce sold and costs of production. Profitability is linked to efficiency and this in turn depends on the wise management and use of inputs and resources.
Improvements in some or all of these areas can make a considerable difference to farm performance. But which indicators are critical for the farm business? The question to ask is: What needs to be done to improve farm performance? It is often found that farm performance is influenced by combinations of factors that should be looked at as part of a system. Indicators should be considered together when diagnosing the problem.
* * *It is therefore usually wiser to address the
broader problem of low profitability by selecting, for example, a combination of indicators that cover productivity, efficiency and other aspects of farm or enterprise performance. Many other indicators could be derived that reflect the problem to be addressed. Because of the multiple causes of a problem, comprehensive strategies that relate to many aspects of the farming system are often necessary to improve farm and enterprise performance.
Notes
56 Farm business analysis using benchmarking
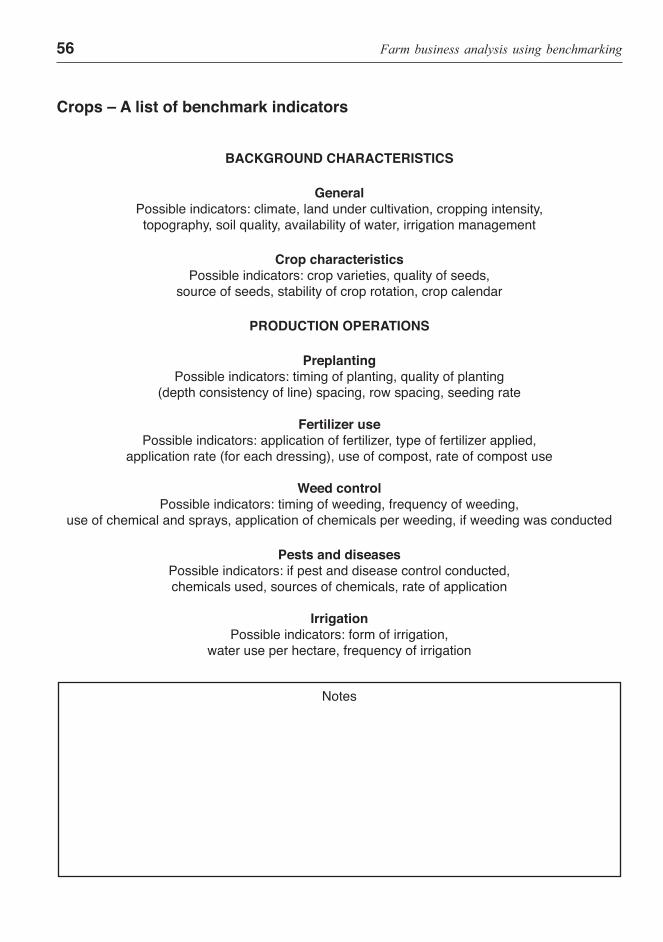
BACKGROUND CHARACTERISTICS
GeneralPossible indicators: climate, land under cultivation, cropping intensity, topography, soil quality, availability of water, irrigation management
Crop characteristicsPossible indicators: crop varieties, quality of seeds,
source of seeds, stability of crop rotation, crop calendar
PRODUCTION OPERATIONS
Preplanting Possible indicators: timing of planting, quality of planting
(depth consistency of line) spacing, row spacing, seeding rate
Fertilizer usePossible indicators: application of fertilizer, type of fertilizer applied,
application rate (for each dressing), use of compost, rate of compost use
Weed controlPossible indicators: timing of weeding, frequency of weeding,
use of chemical and sprays, application of chemicals per weeding, if weeding was conducted
Pests and diseasesPossible indicators: if pest and disease control conducted, chemicals used, sources of chemicals, rate of application
IrrigationPossible indicators: form of irrigation,
water use per hectare, frequency of irrigation
Crops – A list of benchmark indicators
Notes
Step-by-step field guide 57
Notes
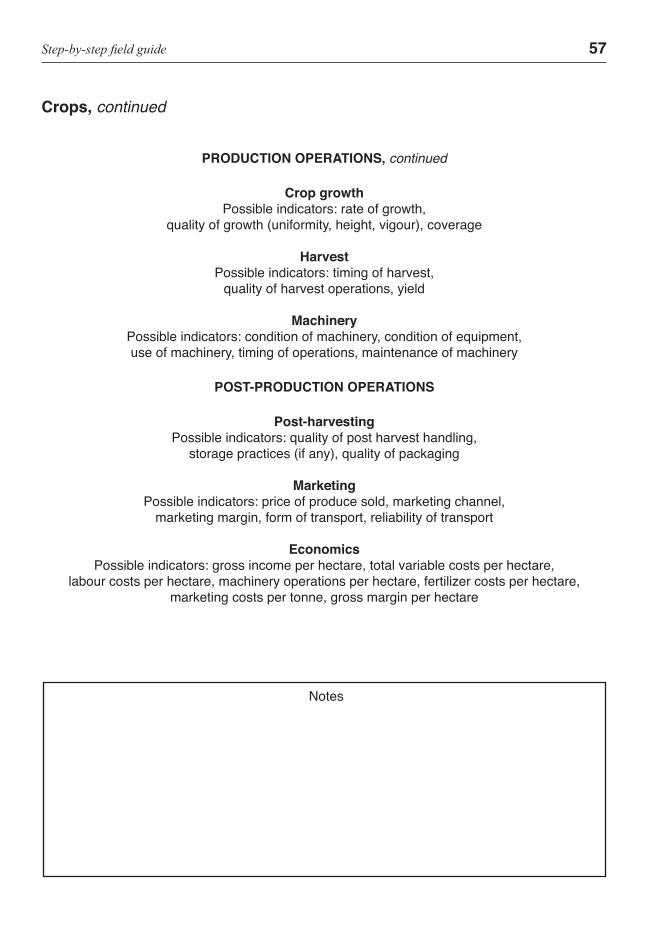
Crops, continued
PRODUCTION OPERATIONS, continued
Crop growthPossible indicators: rate of growth,
quality of growth (uniformity, height, vigour), coverage
HarvestPossible indicators: timing of harvest,
quality of harvest operations, yield
MachineryPossible indicators: condition of machinery, condition of equipment, use of machinery, timing of operations, maintenance of machinery
POST-PRODUCTION OPERATIONS
Post-harvestingPossible indicators: quality of post harvest handling,
storage practices (if any), quality of packaging
MarketingPossible indicators: price of produce sold, marketing channel,
marketing margin, form of transport, reliability of transport
EconomicsPossible indicators: gross income per hectare, total variable costs per hectare,
labour costs per hectare, machinery operations per hectare, fertilizer costs per hectare, marketing costs per tonne, gross margin per hectare
58 Farm business analysis using benchmarking
Livestock (Dairy) – A list of benchmark indicators
BACKGROUND CHARACTERISTICS
Herd performancePossible indicators: general state of herd: average milk yield;
stocking rate; calving rate; culling rate; mortality rate
Pasture managementPossible indicators: pasture type and condition,
type of rotation, fencing, irrigation, quality of pasture
Fodder managementPossible indicators: type of feeds grown, type of fertilizer used,
rate of fertilizer application, frequency of application, timing of fertilizer application, quality of weeding operations,
timing of weeding, quality of pest and disease control, quality of fodder growth, timing of fodder harvesting,
yield of fodder, quality of fodder
Notes
Step-by-step field guide 59
Livestock, continued
HUSBANDRY OPERATIONS
FeedingPossible indicators: production of silage, quality of silage,
feeding cattle rations, quality of purchased feed, quantity of concentrates, quality of feed machinery
BreedingPossible indicators: use of improved breeds, use of artificial insemination
Disease controlPossible indicators: incidence of cattle diseases, type of diseases,
frequency of dipping, frequency of veterinary visits, effectiveness of vaccination programme
MilkingPossible indicators: form of milking (manual or machine),
state of dairy machinery, frequency of milking, quality of milking operations
MarketingPossible indicators: price of produce sold, marketing channel,
marketing margin, form of transport, reliability of transport
EconomicsPossible indicators: gross income per litre, total variable costs per litre, labour costs per litre, marketing costs per litre, gross margin per litre
Notes
60 Farm business analysis using benchmarking
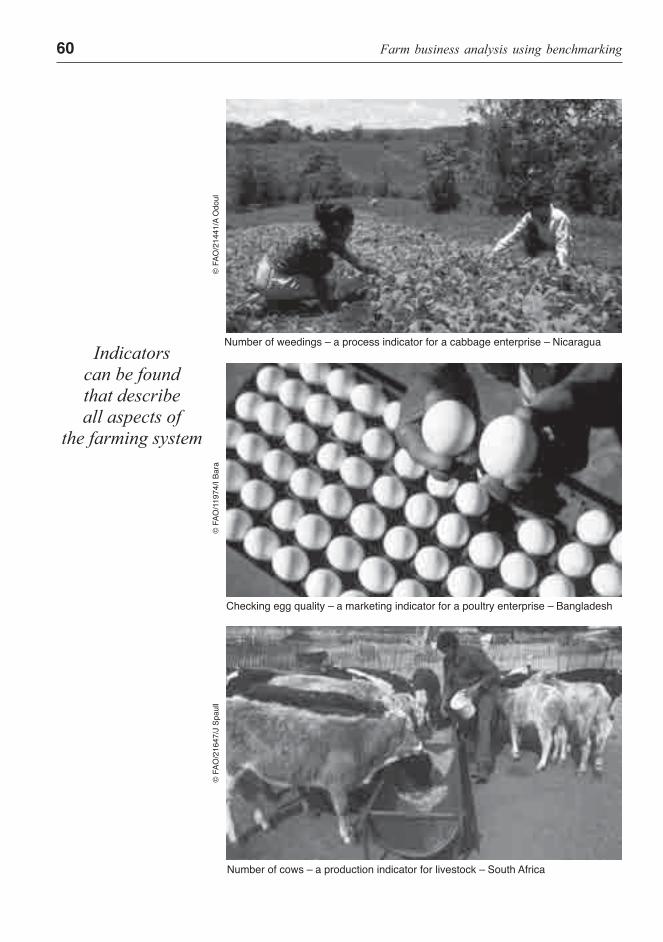
Indicators can be foundthat describeall aspects of
the farming system
Number of weedings – a process indicator for a cabbage enterprise – Nicaragua
Checking egg quality – a marketing indicator for a poultry enterprise – Bangladesh
© F
AO/2
1441
/A O
doul
© F
AO/1
1974
/I Ba
ra
Number of cows – a production indicator for livestock – South Africa
© F
AO/2
1647
/J S
paul
l
Step-by-step field guide 61
Successful benchmarking relies on selecting indicators that are most appropriate for the comparison being made. Too many indicators will make the comparison difficult and time consuming. Too few indicators will not give sufficient information to help the farmers make decisions about ways to improve their performance. Following are two useful guidelines.
Priority indicators. Indicators can be prioritized or ranked according to their contribution to farm and enterprise profitability. A small improvement in the indicators should result in a significant improvement in profitability.
Controllable indicators. Some indicators fall outside of the control of the farmer’s influence. Thus, it is useful to divide indicators between those that can be affected by better management and those that cannot. It would not be worthwhile to collect data on indicators of which little can be done to improve performance.
Deciding on indicators is not simple but it is a task of the utmost importance. The indicators should reflect the most critical problem of the farm business that prevents it from performing better. It should be possible to look comprehensively at all aspects of the farm to arrive at indicators that appear to be the most important. Taking a view of the whole farm and examining the complete range of possibilities without doubt can be time consuming. A more practical way is to list those aspects of the farm business that have a critical influence on the bottom line – farm profitability.
Selecting indicators
62 Farm business analysis using benchmarking
MORE INFORMATION
BENCHMARKING MEASURES AND INDICATORS
Indicators can be found at all levels of the farm system. A full benchmarking analysis could follow a sequence that starts with a diagnosis of the performance of the farm as a whole and from there to move on to an examination of the performance of the individual enterprises of the farm. This breaks down the problem of diagnosis. It initially looks at the ‘big picture’ and moves to more detailed investigation of the individual enterprise and its parts.
A. General indicators
The farm and its environment: These indicators provide the context of the farming system and general indicators of the farm. More specifically indicators could include:
• Climate, topography, soil quality • Roads, communications, energy • Land tenure and methods of land acquisition • Farm area • Plot sizes • Distances from the homestead • Soil quality
Step-by-step field guide 63
• Availability of water • Management of irrigation. • Conditions of buildings, implements, equipment and
machinery. • Use and maintenance of machinery
Household level: Household indicators are also important in that they affect the overall level of farm household income. While household indicators focus largely on non-farm activities they have an impact on the overall performance of the farm as they influence productivity and financial decisions. The indicators include, among others:
• Family size • Number of household members • Age structure of family labour • Division of labour between family and hired labour • Division of labour between gender • Division of labour between age • Social commitments • Family health • Literacy of adults • Debt repayment capacity; • Income per household member;
B. Volume of business, level of production, costs and marketing indicators
The performance of the farm business includes indicators that relate to the volume or scope of the business, the level of production, farm and enterprise profitability and economic and technical efficiency.
Volume of business. The volume of business can be measured by physical and financial indicators. The physical indicators include the area of land under production and the number of livestock kept. The financial volume of business includes indicators that measure the value of capital assets, for example buildings, machinery and equipment which serve the whole farm.
Notes
64 Farm business analysis using benchmarking
Indicators include the following:
Physical indicators:
• Number of enterprises • Number of head of livestock • Area of land • Area of land under cultivation • Area of individual crops or mixtures • Area of land under irrigation • Number of trees and age • Number of draught animals • Number of family labour • Number of hired labour • Total person days • Size, quantity and capacity of capital items
Financial indicators:
• Total fixed capital value • Amount of working capital requirements • Value of fixed capital per hectare • Value of fixed capital per labour unit • Value of irrigation equipment per hectare • Value of field equipment per hectare • Value of storage facilities
Level and costs of production, sales and input supply: The level of production includes the basic data used to measure the agricultural productivity of the farm enterprises. Information about prices, supply, demand, buyers and sellers, sources of suppliers, prices and quality of inputs available to the farmers in the learning group. Farmers have to adapt their production to the demand from the market. As such they are influenced by the prices received for products sold. Some of the indicators that can be used to measure the performance of farm enterprises as they relate to marketing include: Indicators include:
Notes
Notes
Step-by-step field guide 65
Level of production:
• Total level of production • Amount of yield harvested • Amount of spoilage • Amount of production consumed by the family • Amount of production stored • Amount of production used as seed • Amount of production used as livestock feed • Amount of production sold
Marketing and input supply:
• marketing channel selected, • form of transport • reliability of transport • market prices attained; • percentage of post harvest loss • the quality of harvested produce; • level of marketing costs; • marketing costs per ton • price of produce sold,
Cost of production and marketing:
• Cost of fertilizer • Cost of seed • Cost of pesticide • Cost of herbicide • Cost of hired labour • Cost of transport
C. Performance indicators
Profitability: This includes indicators that describe the overall performance of the farm business as a whole as well as individual enterprises that include indicators that describe the individual farm enterprise budgets.
Whole farm profitability:
• Total gross farm income; • Total variable costs;
66 Farm business analysis using benchmarking
• Total fixed costs; • Total farm profit; • Total farm gross margin per hectare;• Total farm gross margin per person day • Total farm gross margin per $000 unit of capital; • Profit per $000 unit of capital.
When using gross margin as an indicator of profitability, a decision should be taken regarding the resource that is most limiting to the development of the farm business. It must be decided whether to use total gross margin per hectare, total gross margin per person-day or total gross margin per $ unit of capital.
Farm enterprise profitability:
The more detailed the budgets are, the more effective the indicators are likely to be in identifying causes of problems. Indicators could include:
• Value of production; • Costs of production; • Gross margin per hectare; • Gross margin per person day; • Gross margin per litre or per kg; • Total variable costs per hectare, or per litre/ kg; • Costs of marketing per litre or per kg. • Costs of production of input items as a percentage of
total costs
Efficiency: Indicators can also be selected to measure the efficiency of the farm enterprise. As mentioned earlier indicators of efficiency can be grouped as technical and economic efficiency measures.
Technical efficiency. There are many different technical efficiency measures that can be used. Crop enterprises usually include:
• Yield per hectare. Most crops can be assessed on the basis of production per unit of land. The most common
Notes
Notes
Step-by-step field guide 67
measures for specific crops are kilograms or tons per hectare.
• Yield per person day • Yield per tree. Tree crops are usually assessed in
terms of average production per tree, for example, tons per tree.
• Fertilizer use per hectare • Crop yield index • Cropping intensity
For livestock enterprises, technical efficiency is usually expressed in physical terms such as:
• Birth and death rates for livestock (%) • Liveweight gain per head • No. of draught cattle per ha. • Litres of milk per cow, • Litres of milk produced per kilogram of feed • Number of eggs per layer • Kilograms per broiler • Number of pigs per litter.
Economic efficiency. Measures of economic efficiency differ from physical measures primarily because they are expressed in monetary terms. Following are some examples of indicators used to measure economic efficiency:
• Feed cost per kilogram of production gain. This is used in livestock production and is calculated by dividing the total feed cost for each enterprise by the total kilograms of production. This measure, which is affected by both feed and livestock values, should be compared only with the same type of livestock.
• Value of crop production per cultivated area. This
value measures the intensity of crop production. It is calculated by dividing the total value of all crops produced during the year by the area under cultivation.
• Rate of capital turnover. This is an indication of how
efficiently capital is being used in production. It is
68 Farm business analysis using benchmarking
determined by dividing the value of farm production by the total capital used in the business. Higher rates of return mean that it takes fewer years to produce products with a value equal to the capital investment. The rate of capital turnover will vary by farm type. It is an indicator that should be compared only with farms of the same type.
• Input costs: These are also efficiency indicators that
cover the input costs of production and marketing. Input costs include the cost of materials; seeds, fertilizer, pesticides as well as operations – machinery and labour. In order to make comparisons the costs are brought down to a common unit – per litre, per kilogramme, per hectare, as examples.
D. Technical Practices
These are concerned with field and post harvest operations. They describe the level of inputs used and outputs produced. In many smallholder farms, processes may be carried out in a certain way simply because it is a long-standing practice. Measuring these objectively can be challenging but very rewarding in terms of farm performance.
Crop management
• Crop varieties, • Type of seeds used • Quality of seeds, • Source of seeds, • Stability of crop rotation • Crop calendar • Rate of growth of crop/ livestock • Quality of growth (uniformity, height, vigour) • Timing of land preparation • Preplanting - timing of planting, quality of planting
(depth consistency of line) spacing, row spacing, seeding rate
• Fertilizer use - application of fertilizer, type of fertilizer applied, application rate (for each dressing), use of compost, rate of compost use
Notes
Notes
Step-by-step field guide 69
• Weed control - timing of weeding, frequency of weeding, use of chemical and sprays, application of chemicals per weeding, if weeding was conducted
• Pests and diseases - if pest and disease control conducted,
• chemicals used, sources of chemicals, rate of application
• Irrigation - form of irrigation, water use per hectare, frequency of irrigation
• Timing of harvest, quality of harvest operations, yield • Post-harvesting - quality of post harvest handling,
storage practices (if any), quality of packaging
Livestock management
• Livestock numbers, the age and condition of livestock, • Herd performance: average milk yield; stocking rate;
calving rate; culling rate; mortality rate • Pasture management: pasture type and condition,
type of rotation, fencing, irrigation, quality of pasture • Fodder management: type of feeds grown, type of
fertilizer used, rate of fertilizer application, frequency of application, timing of fertilizer application, quality of weeding operations, timing of weeding, quality of pest and disease control, quality of fodder growth, timing of fodder harvesting, yield of fodder, quality of fodder
• Feeding: production of silage, quality of silage, feeding cattle rations, quality of purchased feed, quantity of concentrates, quality of feed machinery
• Breeding: use of improved breeds, use of artificial insemination
• Disease control: incidence of cattle diseases, type of diseases, frequency of dipping, frequency of veterinary visits, effectiveness of vaccination programme
• Milking: form of milking (manual or machine), state of dairy machinery, frequency of milking, quality of milking operations
* * *
Participation of farmers in defining indicators is important.
The more farmers are involved the more likely they are to understand
and make use of indicators for farm management decision-making.
Indicators can be used for ...
setting performance targets and assessing progress toward achieving them;
identifying problems to allow corrective action to be taken.
© F
AO P
hoto
/174
09
Step-by-step field guide 71
I D E N T I F I C AT I O N
Step 4Identify
benchmark farms
72 Farm business analysis using benchmarking
Notes I D E N T I F I C A T I O N
Step 4Identify benchmark farms
When selecting a benchmark farm you should consider identifying lead farmers in the vicinity who are considered to be successful by other farmers, extension workers and others involved.
Selection of the benchmark farm should reflect the basic characteristics of farms in the area. Benchmark farms can be selected on the basis of:
• the quantity and quality of available resources, which includes the amount of land of various soil types, amount of labour, capital for variable expenses, the capacity and standard of buildings;
• the level of technology used on the farm, which includes both the resource requirements of the various enterprises involved and the level of outputs that are obtained;
• the level of commercialization and the proportion of produce sold in the market.
Benchmark farms are relatively easy to locate as most people are well aware of how their neighbours are performing – especially if these farmers are more successful than the average farmer in the vicinity. You could get assistance in identifying successful farmers by inquiring with village leaders and others – such as school teachers, local officials, and other extension workers. Information can also be gathered from local business persons. If such sources single out the same person as a benchmark farmer, then you can be sure you are on the right track. Even if a number of successful farmers are identified, once the same name begins to be repeated consensus is more likely to be reliable.
Step-by-step field guide 73
Notes
Sometimes successful benchmark farmers may be reluctant to discuss aspects of their farm business with a fear that others will learn their closely-guarded secrets and compete with them.
To overcome this natural resistance, it is helpful if you inform the successful farmer that he or she has been identified by neighbours as successful in a chosen enterprise. This will often appeal to the farmer’s pride and arouse interest in contributing to the process.
At this point, the benchmark farmer should be informed that they are being identified to assist their neighbours in improving their farm business performance. This introduces the possibility that the successful farmer will be elevated to the role of ‘lead farmer’ in the locality
Once the benchmark farmers have been identified they should be invited to an informal meeting with the learning group. At this meeting mutual topics of interest should be raised for more detailed investigation during the farm visit.
OVERCOMING RESISTANCE
Organised farm visits to the benchmark farm are crucial to enable farmers in the ‘learning group’ to discuss problems and experiences with lead farmers and also among themselves. This is necessary for effective exchange of information.
You may find it difficult to convince farmers to share experiences about their farm business. Again, you will have to help farmers to see the value of sharing with one another. The information collected should provide benefits to all concerned.
74 Farm business analysis using benchmarking
The organization of the visit to the benchmark farm is an important
aspect of the process. Some guidelines are listed on the
following page.
Tips on BenchmarkingSometimes successful benchmark farmers may be reluctant to discuss aspects of their farm business with a fear that others will learn their closely-guarded secrets and compete with them.
To overcome this natural resistance, it is helpful if you inform the successful farmer that he or she has been identified by neighbours as successful in a chosen enterprise. This will often appeal to the farmer’s pride and arouse interest in contributing to the process.
At this point, the benchmark farmer should be informed that they are being identified to assist their neighbours in improving their farm business performance. This introduces the possibility that the successful farmer will be elevated to the role of ‘lead farmer’ in the locality.
Step-by-step field guide 75
Organizing the farm visit
Pre-visit arrangements. Necessary arrangements should be made well before the field visit. Find out before hand the enterprises being grown on the benchmark farm that you intend to visit. Interview the farmer and ensure that he or she has been fully informed of the purpose of the visit and has the time to participate. Discuss the requirements of the exercise with individual farmers to determine how they will cooperate. Finally, ensure that sufficient transportation will be available, that the needed equipment and materials for the visit are ready, and that arrangements are well in hand for lunches, snacks and drinking water during the visit. To avoid last minute problems, double-check all of these items prior to the day of the visit.
Field visit. Divide the participants into teams of three or four according to their interest. Match the team interests to the relevant benchmark farm. Discuss how the visit should be conducted and decide what role each member should play (i.e. who will be the team facilitator, who will record information and take notes, who will be the main interviewer). Suggest to the group that it might be useful to switch roles in the course of the visit so that each member of a team has the chance to lead in the discussion.
Notes
Notes

76 Farm business analysis using benchmarking
Notes
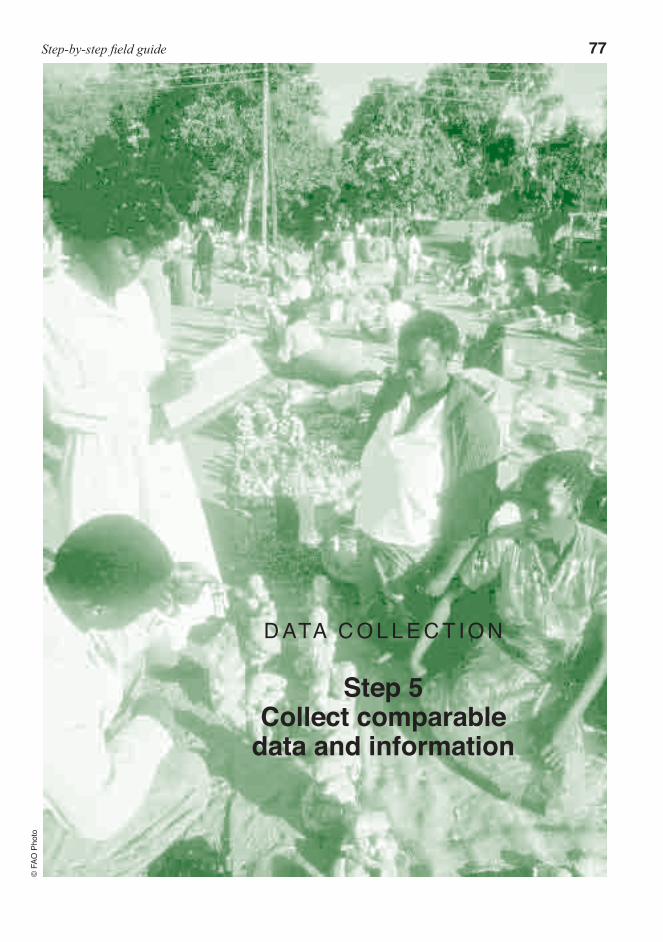
Step-by-step field guide 77©
FAO
Pho
to
D ATA C O L L E C T I O N
Step 5Collect comparable
data and information
78 Farm business analysis using benchmarking
D A T A C O L L E C T I O N
Step 5Collect comparable data and information
Benchmarking is based on data and information. Data and information are needed to help farmer groups identify factors that effect performance. Information is needed on the relationship between the inputs used, the production process and the output. This is the basis for identifying the critical areas of interest and the topics that should be covered by the benchmarking exercise.
Benchmarking requires that data and information be collected from both the learning group members and ‘successful’ farmers. This is needed to construct the indicators. The information collected should cover aspects of input provision, production and marketing.
You can obtain information by collecting data first hand from farmers. Some farmers may keep records and this is a valuable source of data. If records are not available, you will have to collect the information by interviewing the benchmark farmer and discussing selected issues.
First of all you should facilitate discussion among the learning group members and try to arrive at an agreement on the measures chosen. For example, previously you may have identified maize and tomato as priority crops for the learning group to compare and analyse performance.
Data and informationData are raw numbers and facts such as soil type, yields, prices, costs and quantities. Information is data that is processed in a way that makes it useful. Data and information are crucial as they provide the basis for a successful benchmarking process.
Notes
Step-by-step field guide 79
You may have selected gross margin per hectare, yield per hectare, percentage cost of fertilizer from total cost of production and tonnes of fertilizer per hectare as indicators for comparison.
At this step of the benchmarking process data is collected from the farmers in your learning group. Differences between the experiences of different farmers in the group should be discussed to arrive at a common agreement on the results. You will need to help farmers gather data about the performance of their farm and enterprises. Some things to keep in mind are:
• Make sure data collected is reliable and adequate. • Discuss and list the kinds of information required. • Ensure that the participants are familiar with the
items selected before going to the field. • Prepare a suitable form to record data collected. • Participate, encourage and support farmers during
data collection. • Ensure that data is presented in common units to
allow comparisons to be made. • Remember that data provided by those in the
learning group should be similar to that collected from the benchmark farm so that meaningful comparisons can be made.
When working with data collected from the study farm(s) or the benchmark farm, care must be taken to ensure the data is reliable and adequate. It is important to verify that there are no other factors that might hide the real situation and that no mistakes were made in recording the data. The information should be organized and calculated in common units to enable comparison of different size farms.
Notes
80 Farm business analysis using benchmarking
The actual collection of data itself should last about half a day. Make sure the participants are familiar with the list of questions that you have prepared before visiting the benchmark farm. The data collected could be used to calculate gross margins for selected farm enterprises and identify the reasons for low or high performance.
You would be expected to ensure that the members of your learning group have suitable data collection instruments to record what they observe. It is your responsibility as an extension worker to support your farmers in this process and be of help if needed.
* * *A CHECKLIST OF QUESTIONS
TO ASK FARMERS WHOSE FARMS HAVE BEEN SELECTED
Production
⎯ What are the main crops grown and livestock reared, including varieties and breeds? ⎯ When are the crops harvested? ⎯ What are the yields per unit, the prices received and the volume produced? ⎯ What are the advantages of these crops or of livestock over others in terms of yield, quality, price, and seasonality? ⎯ Is your produce graded? If so, into what grades? ⎯ What is the break-even price for each enterprise? ⎯ What are the costs of growing, harvesting and transporting the crops or livestock? ⎯ What new technologies or practices have you introduced? ⎯ Have they been successful? ⎯ What are your main production problems?
* * *
Notes
Step-by-step field guide 81
* * *Input supply and finance
⎯ How readily available are your inputs and where do you buy them? ⎯ Can you receive inputs on credit? ⎯ Are the inputs of good quality? ⎯ Do you receive technical advice from your input suppliers? Is it good advice? ⎯ Do you have the money to pay for these inputs? ⎯ Do you have access to credit for working capital and long-term loans? ⎯ What are your sources of credit? What types of collateral is required?
* * *Marketing
⎯ How do you market your produce? ⎯ Who buys and when? ⎯ What are your main markets for the produce sold? ⎯ Who are your intermediaries or buyers? ⎯ Which buyers have the best reputation? ⎯ What prices are paid? ⎯ Do you transport produce to the market? ⎯ Who provides transport? ⎯ What form of transport should be used to get the produce to the market? Is the transport pooled or is produce sent individually? ⎯ How much contact do you have with the market? ⎯ What is your source of information and how quickly do you get market information on prices, volumes and quality requirements?
* * *
Notes
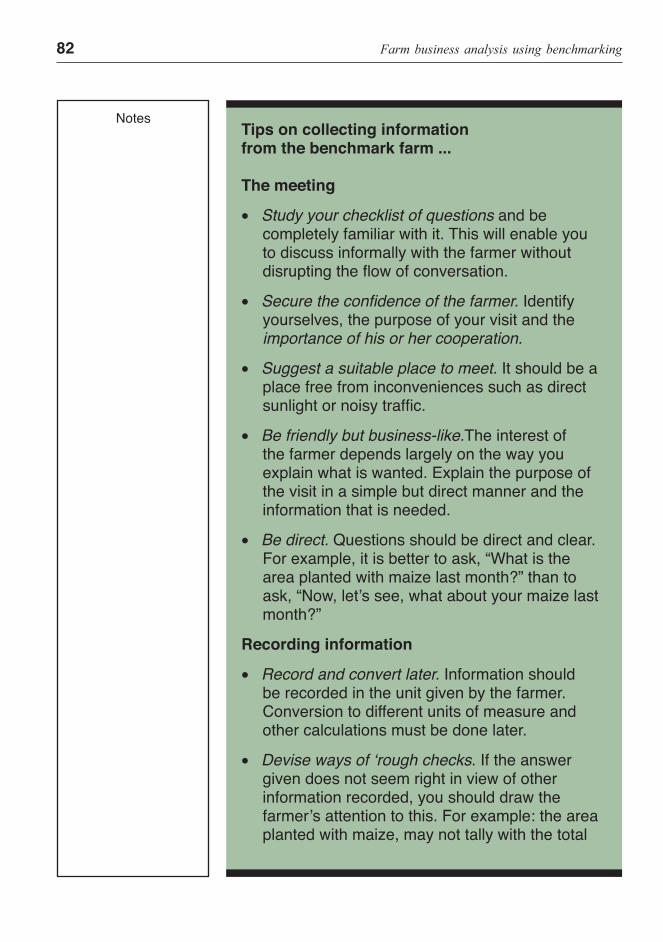
82 Farm business analysis using benchmarking
Tips on collecting information from the benchmark farm ...
The meeting
• Study your checklist of questions and be completely familiar with it. This will enable you to discuss informally with the farmer without disrupting the flow of conversation.
• Secure the confidence of the farmer. Identify yourselves, the purpose of your visit and the importance of his or her cooperation.
• Suggest a suitable place to meet. It should be a place free from inconveniences such as direct sunlight or noisy traffic.
• Be friendly but business-like.The interest of the farmer depends largely on the way you explain what is wanted. Explain the purpose of the visit in a simple but direct manner and the information that is needed.
• Be direct. Questions should be direct and clear. For example, it is better to ask, “What is the area planted with maize last month?” than to ask, “Now, let’s see, what about your maize last month?”
Recording information
• Record and convert later. Information should be recorded in the unit given by the farmer. Conversion to different units of measure and other calculations must be done later.
• Devise ways of ‘rough checks. If the answer given does not seem right in view of other information recorded, you should draw the farmer’s attention to this. For example: the area planted with maize, may not tally with the total
Notes
Step-by-step field guide 83
area reported previously. The quantity sold may exceed the quantity produced. Use common sense.
• Never assume an answer. It is a serious mistake to assume answers without asking them. Just because several cases have been reported uniformly, there is no reason to assume that all cases are the same.
• Be thorough. Record all the information needed. By approaching the problem from different angles, it is possible to find some estimates. Example: An estimate of area planted with a crop may be made by assessing the rate of seeding or the distance of planting.
• Before leaving, go over the data collected and see if all items are covered.
As an extension worker there are a number of things that you can do to facilitate data collection. You can assist your farmers by setting up a record-keeping system, which should be designed to the needs of individual farmers. You should also be ready to train farmers in record-keeping if need be.
You could also assist in collecting data on the profitability of the farm enterprises in your area as well as some of the issues that farmers are facing even before conducting a benchmarking exercise. This data can be collected from discussions with other farmers outside the learning group.
As an extension worker you should also be in the position to collect data and information on marketing. For instance, to identify local buyers for crops and livestock products and find out what prices they are paying while enquiring about the terms and conditions of transactions. You could also gather information about regional or urban markets situated at a distance from your locality.
Notes
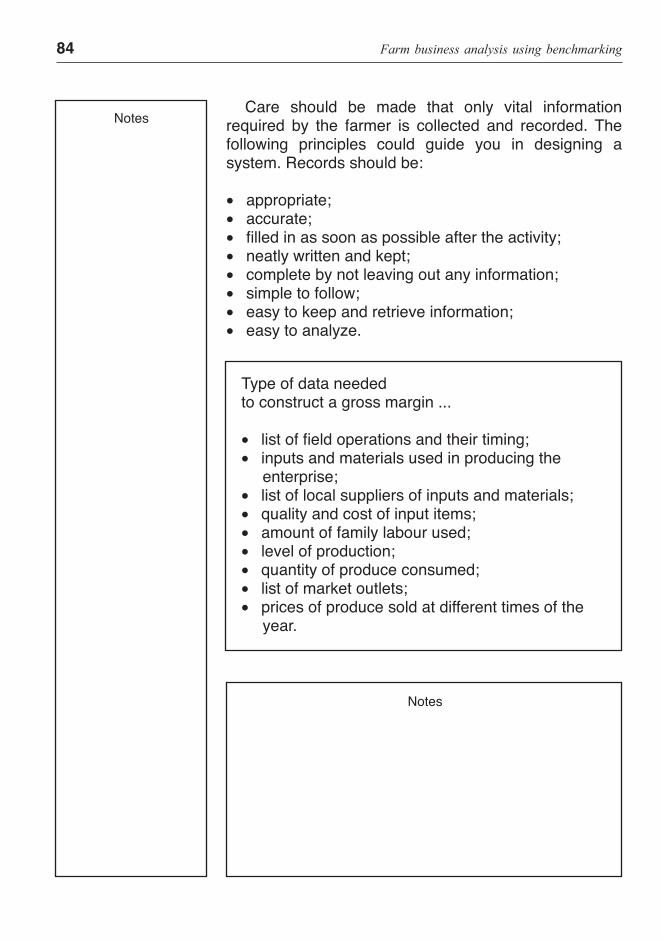
84 Farm business analysis using benchmarking
Care should be made that only vital information required by the farmer is collected and recorded. The following principles could guide you in designing a system. Records should be:
• appropriate; • accurate; • filled in as soon as possible after the activity; • neatly written and kept; • complete by not leaving out any information; • simple to follow; • easy to keep and retrieve information; • easy to analyze.
Type of data needed to construct a gross margin ...
• list of field operations and their timing; • inputs and materials used in producing the
enterprise; • list of local suppliers of inputs and materials; • quality and cost of input items; • amount of family labour used; • level of production; • quantity of produce consumed; • list of market outlets; • prices of produce sold at different times of the
year.
Notes
Notes
Step-by-step field guide 85
Tips for preparing gross margins by consensus
ObjectiveThe intention is to construct a ‘typical’ gross margin budget that reflects those found among the farmers in the learning group. This can be used as a standard for comparison with the benchmark farm.
ProcedureSelect about five farmers as ‘key informants’, chosen on the basis of their experience in growing the same crop on a similar land size and using a similar technology. These farmers should be well informed with good technical knowledge of the crop cultivation practices. Gross margins should be constructed based on consensus between the key informants on production levels, technologies used, inputs and materials, and levels of costs and prices. Consensus should be reached even though individual farmers may vary in the husbandry techniques used. Your role is to facilitate the group discussions, contribute technically and keep discussion on track.
The gross margin could be used as a ‘template’ for comparison against a budget that is prepared from the data collected on the benchmark farm.
Notes
Notes
MORE INFORMATION
Data is needed not only on production issues but on management and marketing as well. One of the challenges of data gathering is that farmers’ circumstances are not static and frequent changes that occur in and around a farm influence farming operations. As an example, price variations and relative price changes might lead to changes in farm enterprise combinations as well as in the use of resources and management practices. Such changes require a review of the farm business.
For inputs, farmers may need to know ...
• What inputs are available and which are the most appropriate to use?
• Who are the reliable suppliers? • Where can credit be obtained? • What is the cost of inputs bought?
For production, farmers may need to know ...
• What resources do they have available and what is their condition?
• What crops or enterprises are best suited to their resources?
• What skills are needed for each productive activity? • What inputs and labour are required for each
productive activity? • What technologies are most appropriate for their
resources?
For marketing, farmers may need to know ...
• What markets exist? • What products are in demand and represent
opportunities to compete? • Where can they sell their products?
86 Farm business analysis using benchmarking
Notes
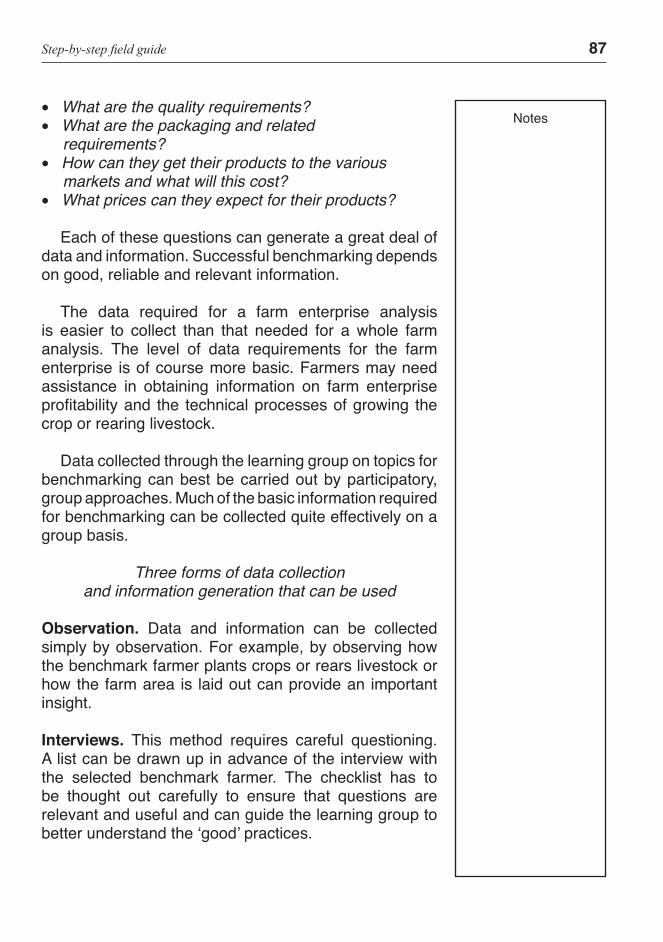
• What are the quality requirements? • What are the packaging and related
requirements? • How can they get their products to the various
markets and what will this cost? • What prices can they expect for their products?
Each of these questions can generate a great deal of data and information. Successful benchmarking depends on good, reliable and relevant information.
The data required for a farm enterprise analysis is easier to collect than that needed for a whole farm analysis. The level of data requirements for the farm enterprise is of course more basic. Farmers may need assistance in obtaining information on farm enterprise profitability and the technical processes of growing the crop or rearing livestock.
Data collected through the learning group on topics for benchmarking can best be carried out by participatory, group approaches. Much of the basic information required for benchmarking can be collected quite effectively on a group basis.
Three forms of data collection and information generation that can be used
Observation. Data and information can be collected simply by observation. For example, by observing how the benchmark farmer plants crops or rears livestock or how the farm area is laid out can provide an important insight.
Interviews. This method requires careful questioning. A list can be drawn up in advance of the interview with the selected benchmark farmer. The checklist has to be thought out carefully to ensure that questions are relevant and useful and can guide the learning group to better understand the ‘good’ practices.
Step-by-step field guide 87
Notes
Key-informant interviews. This method lies at the core of the benchmarking exercise and refers to interviews with benchmark farmers and other knowledgeable persons. Discussing with key-informants provides an excellent opportunity to identify successful farmers in the area.
When working with data collected from the study farm(s) or the benchmark farm, care must be taken to ensure that the data is reliable and adequate. It is important to verify that there are no other factors that might hide the real situation and that no mistakes were made in recording the data.
The information should be organized and calculated in common units to enable comparison of different size farms. Crop yields are usually expressed on a per hectare basis, as are labour and other inputs, which is a convenient way of relating inputs to outputs.
Farm recordsKeeping records is part of good farm management and record-keeping is the process by which this kind of data is systematically collected, organized and saved so that it can be used, put together in different ways and then analysed – thus turning data into information. Well kept and accurate farm records can play an important part in the benchmarking process.
Records are important to capture past production and market information and understand farm performance better. For example crop yields, livestock production and cost information generated from farm records provide an account of what has been achieved by the farm business. Records can also assist farmers in monitoring and evaluating over the course of the year.
Simplicity is the key to record-keeping. It should be practical and easy, so it does not take up too much time. This requires commitment, consistency, self-discipline and regularity. There are many simple methods that have
88 Farm business analysis using benchmarking
Notes
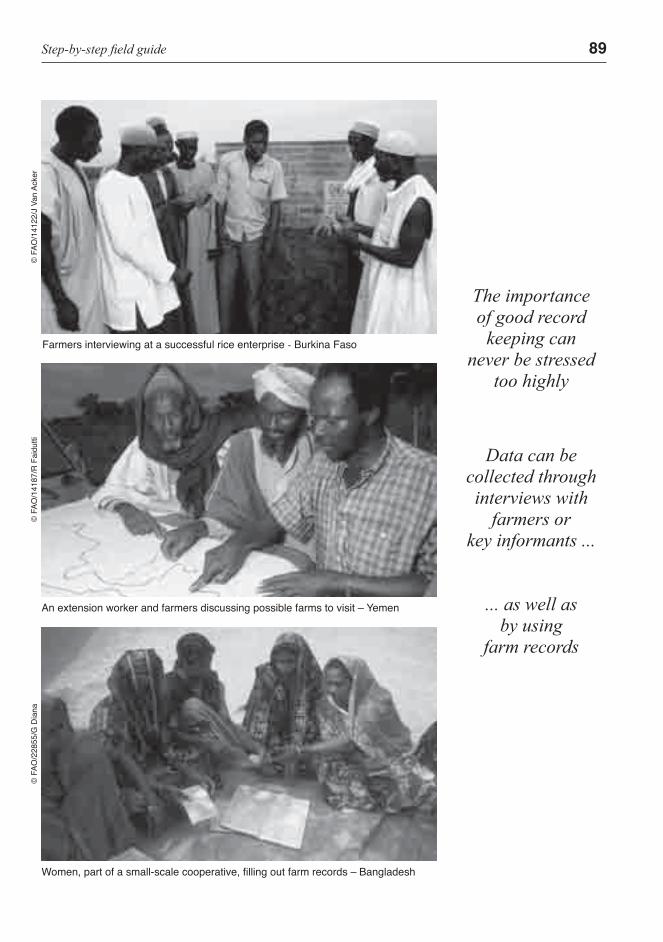
Step-by-step field guide 89
Farmers interviewing at a successful rice enterprise - Burkina Faso
An extension worker and farmers discussing possible farms to visit – Yemen
Women, part of a small-scale cooperative, filling out farm records – Bangladesh
© F
AO/1
4187
/R F
aidu
tti©
FAO
/228
55/G
Dia
na©
FAO
/141
22/J
Van
Ack
er
The importance of good record
keeping can never be stressed
too highly
Data can becollected throughinterviews with
farmers or key informants ...
... as well asby using
farm records
been devised for farmers to keep records even though they may not be literate. Various types of farm records can be introduced for literate, semi-literate and illiterate farmers using pictures and symbols.
Care should be taken that only the really vital information required by the farmer is collected. One of the main purposes of record-keeping is to improve farm performance and so there is no value in spending time on records and calculations of profit and production in individual activities, if no use is made of them. All of the results should be compared with indicators as discussed in the previous chapter.
Farmers need to be given an incentive to keep farm records. Motivation can come from you enabling farmers to understand that by keeping farm records, income and profit improvements can be achieved.
Records can be collected in two forms ... physical and financial
Physical records. These records cover the main farm productive activities: crop, livestock and household based food processing. They are used to produce specific kinds of information that relate to the quantities of inputs used and outputs obtained.
Financial records. These are used to evaluate the financial performance of either an individual productive activity or the whole farm. They are also used for cash flow analysis. Financial records help the farmer to know how well individual activities perform and contribute to overall farm profit at the end of the season or production cycle. Financial records include the main cash transactions on the farm: sales, purchases and money borrowed.
90 Farm business analysis using benchmarking
Notes
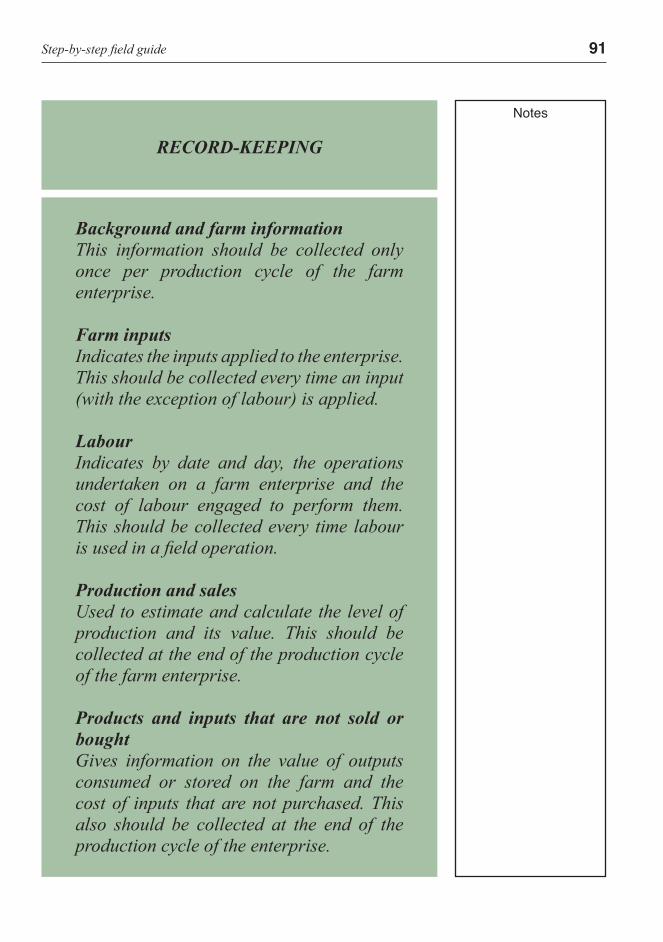
RECORD-KEEPING
Background and farm informationThis information should be collected only once per production cycle of the farm enterprise.
Farm inputs Indicates the inputs applied to the enterprise. This should be collected every time an input (with the exception of labour) is applied.
Labour Indicates by date and day, the operations undertaken on a farm enterprise and the cost of labour engaged to perform them. This should be collected every time labour is used in a field operation.
Production and salesUsed to estimate and calculate the level of production and its value. This should be collected at the end of the production cycle of the farm enterprise.
Products and inputs that are not sold or bought Gives information on the value of outputs consumed or stored on the farm and the cost of inputs that are not purchased. This also should be collected at the end of the production cycle of the enterprise.
Step-by-step field guide 91
Notes

Notes
© F
AO/2
1853
/B R
ossi
Step-by-step field guide 93
C O M PA R I S O N
Step 6Compare performance
94 Farm business analysis using benchmarking
C O M P A R I S O N
Step 6Compare performance
This step requires that the learning group compares their performance against that of the benchmark farm and identifies differences (gaps). These differences can suggest weaknesses within the farming system and its parts and the reasons for them. Performance comparisons lead to a better understanding of the problem and these in turn can lead to finding solutions and opportunities for improvement.
Key areas of comparison are:
• physical and financial performance measures; • gross margin performance of the enterprises; • yields and selling prices; • quantities of variable inputs used; • total fixed costs; • overall profitability of the farm; • technical and management aspects of production
and marketing.
As the facilitator of this process you will be expected to assist the farmers in preparing comparative data and information. As mentioned previously, comparisons can be made of the whole farm business as well as individual enterprises. During this process ensure that there is a good basis for comparisons to be made. In order to do this you may have to calculate the gross margin or enterprise profit of the benchmark farm for comparative purposes. You should encourage the group to share the data that they collected among themselves, facilitate discussion and highlight the gaps and areas where improvements can be made. Cover all aspects and make sure that all farmers understand the comparative results.
Notes
Step-by-step field guide 95
Examples of a format for data comparisons
The two following formats are examples showing how to fill-in a data comparison inventory sheet. The categories and areas listed are taken from the basic indicators outlined earlier in Step 3. The enterprises used here are ‘Cotton’ and ‘Dairy’ for crop and livestock entries. A blank format to be used for data comparisons is also included.
Notes
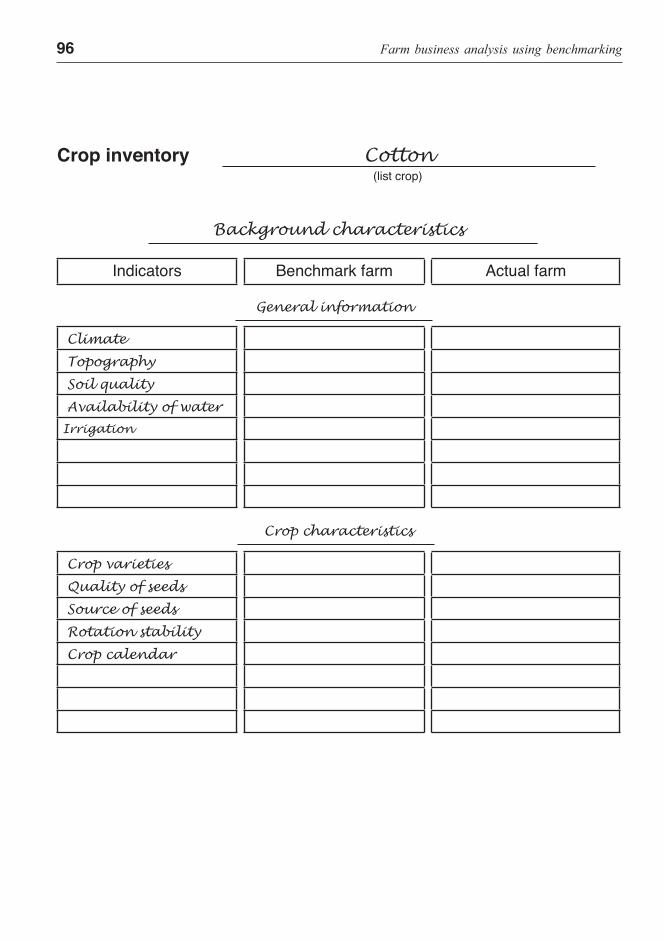
96 Farm business analysis using benchmarking
Background characteristics
Indicators Benchmark farm Actual farm
General information
Climate
Topography
Soil quality
Availability of water
Irrigation
Crop characteristics
Crop varieties
Quality of seeds
Source of seeds
Rotation stability
Crop calendar
Crop inventory Cotton (list crop)
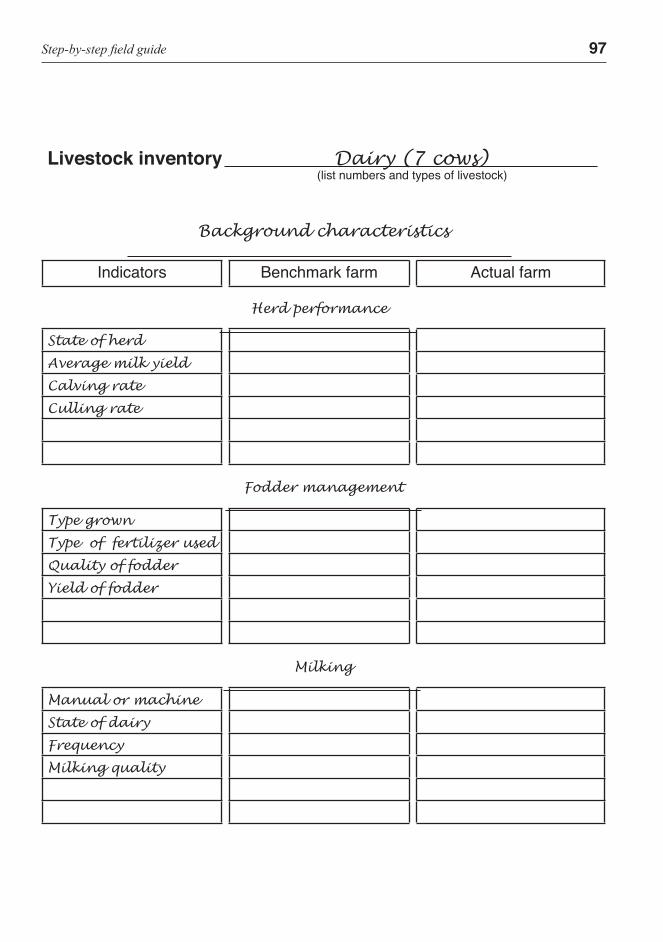
Step-by-step field guide 97
Livestock inventory Dairy (7 cows) (list numbers and types of livestock)
Background characteristics
Indicators Benchmark farm Actual farm
Herd performance
State of herd
Average milk yield
Calving rate
Culling rate
Fodder management
Type grown
Type of fertilizer used
Quality of fodder
Yield of fodder
Milking
Manual or machine
State of dairy
Frequency
Milking quality

98 Farm business analysis using benchmarking
Notes
Step-by-step field guide 99©
FAO
/158
28/J
Mic
aud
A N A LY S I S
Step 7Interpret differences
100 Farm business analysis using benchmarking
A N A L Y S I S
Step 7Interpret differences
Here you should be able to diagnose the difference in performance at the farm level or at the enterprise level. This is the most creative step in the benchmarking process and involves investigation of the root causes of a problem. It requires that you look beyond the obvious and at greater depth, seeing the whole picture.
Together with the group, you should be able to trace the causes of the performance gaps identified. For this you will need diagnostic skills. A creative extension worker could also use participatory methods to help farmers analyse why there are gaps between their farms or enterprises and those of the benchmark farmers.
The process of performance comparison requires that the organized data and information collected from the farms being compared are examined side-by-side. Care must be taken that the data and information being used covers the same performance measures. The two basic comparisons to be made are either the whole farm or the individual enterprise.
In most cases, low performance in comparison to the benchmark will require a combination of actions to be taken. Farming systems are integrated systems – changing one part usually impacts on another. Therefore, farmers must be prepared to implement all necessary actions at the same time. To guard against making too many changes, you will need to identify those measures, gaps, causes and solutions that show the greatest or most significant impact on the performance and profitability of the farm.
Notes
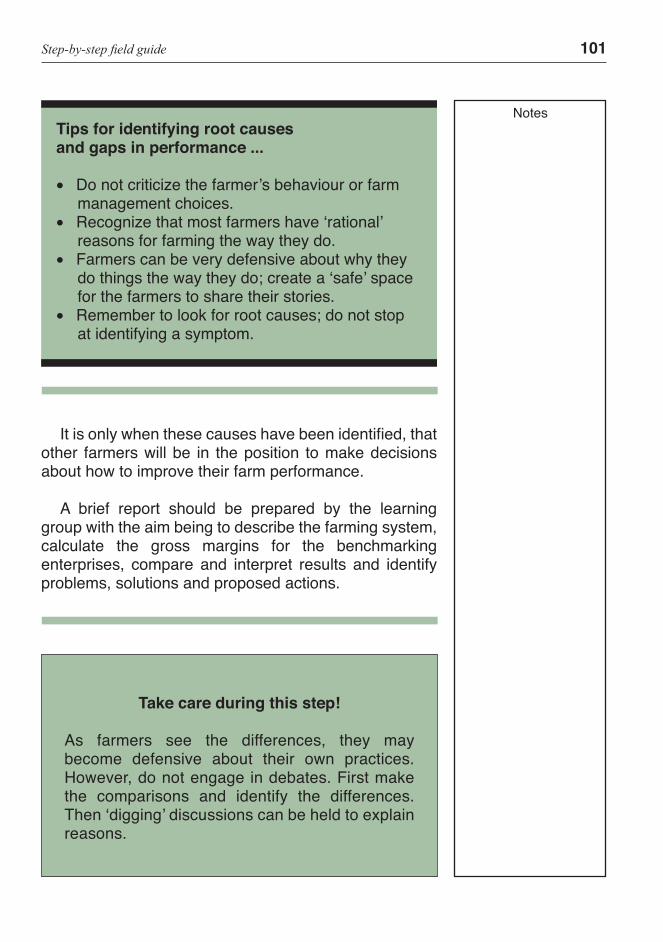
Step-by-step field guide 101
It is only when these causes have been identified, that other farmers will be in the position to make decisions about how to improve their farm performance.
A brief report should be prepared by the learning group with the aim being to describe the farming system, calculate the gross margins for the benchmarking enterprises, compare and interpret results and identify problems, solutions and proposed actions.
Take care during this step!
As farmers see the differences, they may become defensive about their own practices. However, do not engage in debates. First make the comparisons and identify the differences. Then ‘digging’ discussions can be held to explain reasons.
Tips for identifying root causes and gaps in performance ...
• Do not criticize the farmer’s behaviour or farm management choices.
• Recognize that most farmers have ‘rational’ reasons for farming the way they do.
• Farmers can be very defensive about why they do things the way they do; create a ‘safe’ space for the farmers to share their stories.
• Remember to look for root causes; do not stop at identifying a symptom.
Notes
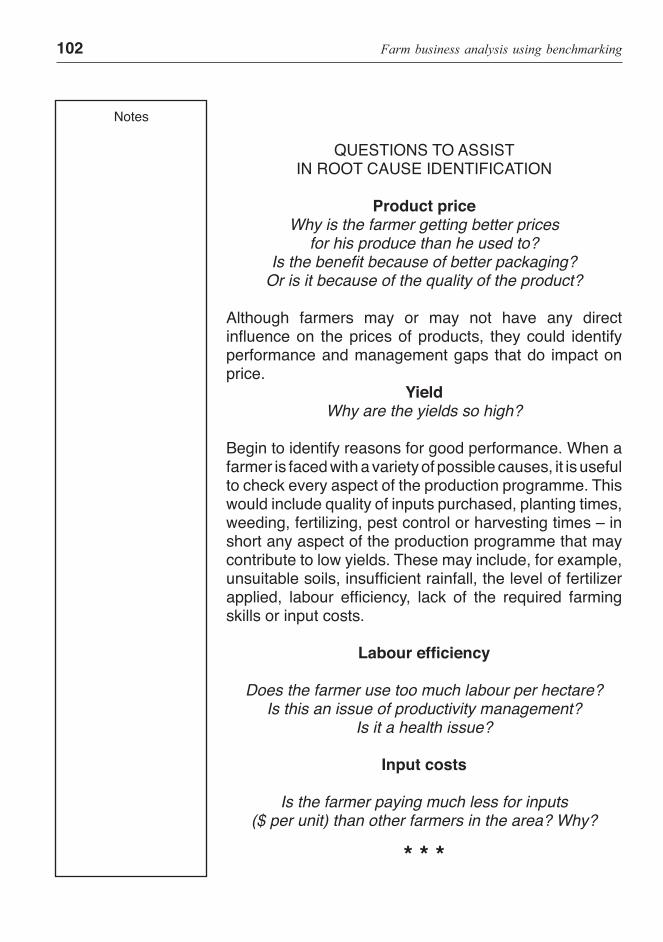
102 Farm business analysis using benchmarking
Notes
QUESTIONS TO ASSIST IN ROOT CAUSE IDENTIFICATION
Product priceWhy is the farmer getting better prices
for his produce than he used to? Is the benefit because of better packaging?
Or is it because of the quality of the product?
Although farmers may or may not have any direct influence on the prices of products, they could identify performance and management gaps that do impact on price.
YieldWhy are the yields so high?
Begin to identify reasons for good performance. When a farmer is faced with a variety of possible causes, it is useful to check every aspect of the production programme. This would include quality of inputs purchased, planting times, weeding, fertilizing, pest control or harvesting times – in short any aspect of the production programme that may contribute to low yields. These may include, for example, unsuitable soils, insufficient rainfall, the level of fertilizer applied, labour efficiency, lack of the required farming skills or input costs.
Labour efficiency
Does the farmer use too much labour per hectare? Is this an issue of productivity management?
Is it a health issue?
Input costs
Is the farmer paying much less for inputs ($ per unit) than other farmers in the area? Why?
* * *

Step-by-step field guide 103
MORE INFORMATION
SIMPLE BENCHMARKING EXAMPLE
Farm Enterprise ComparisonInstead of looking at the whole farm, a benchmark exercise can be conducted on a specific enterprise of the farm. Because it is more focused, performance can be looked at in greater detail. More specific measures can be used to identify the gaps. These will, in turn, lead to very specific actions that can be taken to improve farm performance. This is particularly useful for analysing technical and economic efficiency. It should be pointed out, however, that when conducting a performance benchmark exercise of a farm enterprise, gross margin analysis alone may be insufficient to trace the cause of low profits.
The following is an example showing how performance gaps can be found by comparing the profitability of the same enterprise on two farms: a benchmark farm and an actual farm. In both cases the farmers grow cotton. Similarly to the whole farm comparison, a farm enterprise can be compared at different levels of investigation.
An example of enterprise gross marginThe farmer concerned heard over the radio that the prices of cotton increased from $1.00 per kilogram to $1.20 per kilogram. The farmer contacted the extension worker and asked for help in examining the reasons why he was getting such a low price. The extension worker worked with the farmer to develop a farm enterprise benchmark. Gross margin analysis was used to examine its profitability. The results of the benchmarking comparisons are illustrated in the next table.
The process of investigation was to compare the overall gross margin per hectare. In this example the
Notes
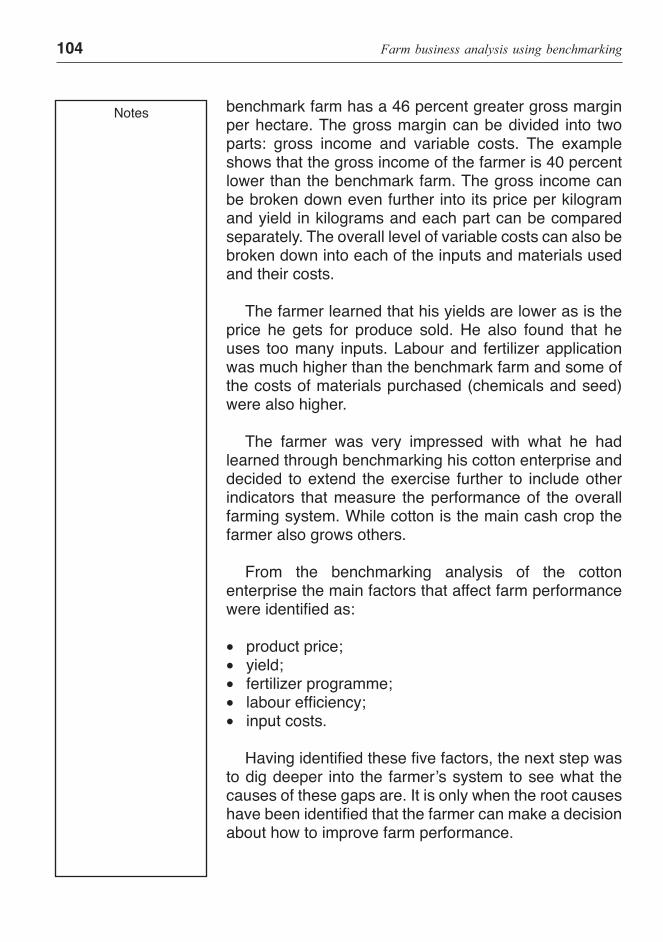
104 Farm business analysis using benchmarking
Notes benchmark farm has a 46 percent greater gross margin per hectare. The gross margin can be divided into two parts: gross income and variable costs. The example shows that the gross income of the farmer is 40 percent lower than the benchmark farm. The gross income can be broken down even further into its price per kilogram and yield in kilograms and each part can be compared separately. The overall level of variable costs can also be broken down into each of the inputs and materials used and their costs.
The farmer learned that his yields are lower as is the price he gets for produce sold. He also found that he uses too many inputs. Labour and fertilizer application was much higher than the benchmark farm and some of the costs of materials purchased (chemicals and seed) were also higher.
The farmer was very impressed with what he had learned through benchmarking his cotton enterprise and decided to extend the exercise further to include other indicators that measure the performance of the overall farming system. While cotton is the main cash crop the farmer also grows others.
From the benchmarking analysis of the cotton enterprise the main factors that affect farm performance were identified as:
• product price; • yield; • fertilizer programme; • labour efficiency; • input costs.
Having identified these five factors, the next step was to dig deeper into the farmer’s system to see what the causes of these gaps are. It is only when the root causes have been identified that the farmer can make a decision about how to improve farm performance.
105
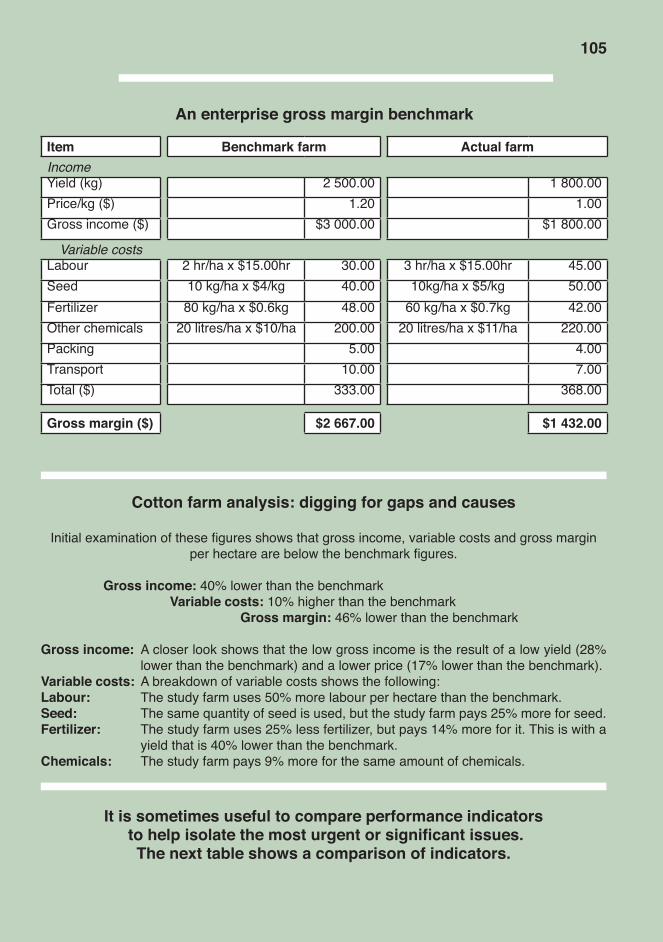
An enterprise gross margin benchmark
Item Benchmark farm Actual farmIncomeYield (kg) 2 500.00 1 800.00Price/kg ($) 1.20 1.00Gross income ($) $3 000.00 $1 800.00
Variable costsLabour 2 hr/ha x $15.00hr 30.00 3 hr/ha x $15.00hr 45.00Seed 10 kg/ha x $4/kg 40.00 10kg/ha x $5/kg 50.00Fertilizer 80 kg/ha x $0.6kg 48.00 60 kg/ha x $0.7kg 42.00Other chemicals 20 litres/ha x $10/ha 200.00 20 litres/ha x $11/ha 220.00Packing 5.00 4.00Transport 10.00 7.00Total ($) 333.00 368.00
Gross margin ($) $2 667.00 $1 432.00
Cotton farm analysis: digging for gaps and causes
Initial examination of these figures shows that gross income, variable costs and gross margin per hectare are below the benchmark figures.
Gross income: 40% lower than the benchmark Variable costs: 10% higher than the benchmark Gross margin: 46% lower than the benchmark
Gross income: A closer look shows that the low gross income is the result of a low yield (28% lower than the benchmark) and a lower price (17% lower than the benchmark).
Variable costs: A breakdown of variable costs shows the following:Labour: The study farm uses 50% more labour per hectare than the benchmark.Seed: The same quantity of seed is used, but the study farm pays 25% more for seed.Fertilizer: The study farm uses 25% less fertilizer, but pays 14% more for it. This is with a
yield that is 40% lower than the benchmark.Chemicals: The study farm pays 9% more for the same amount of chemicals.
It is sometimes useful to compare performance indicators to help isolate the most urgent or significant issues.
The next table shows a comparison of indicators.
105
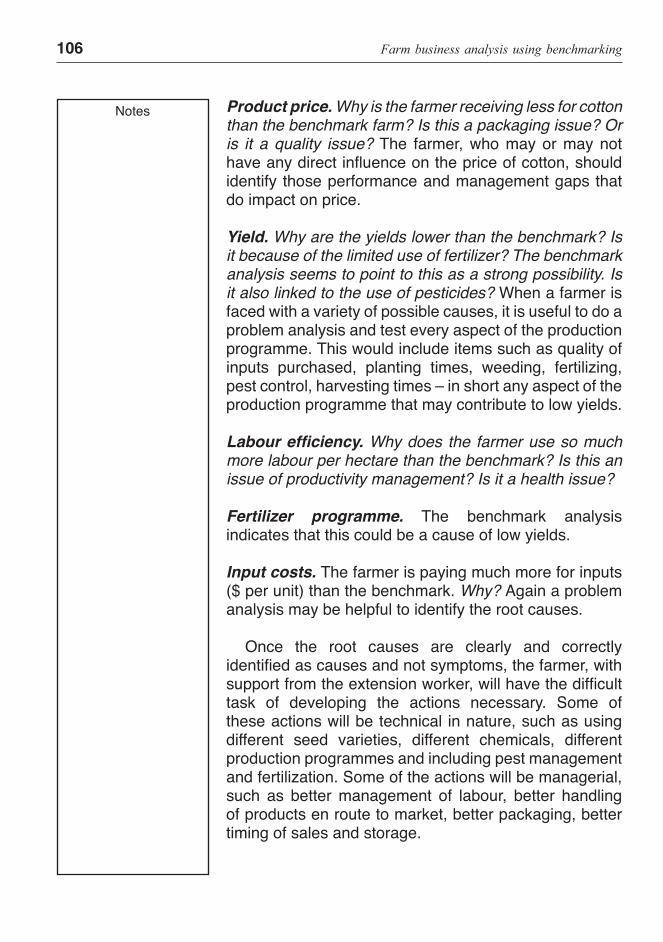
106 Farm business analysis using benchmarking
Product price. Why is the farmer receiving less for cotton than the benchmark farm? Is this a packaging issue? Or is it a quality issue? The farmer, who may or may not have any direct influence on the price of cotton, should identify those performance and management gaps that do impact on price.
Yield. Why are the yields lower than the benchmark? Is it because of the limited use of fertilizer? The benchmark analysis seems to point to this as a strong possibility. Is it also linked to the use of pesticides? When a farmer is faced with a variety of possible causes, it is useful to do a problem analysis and test every aspect of the production programme. This would include items such as quality of inputs purchased, planting times, weeding, fertilizing, pest control, harvesting times – in short any aspect of the production programme that may contribute to low yields.
Labour efficiency. Why does the farmer use so much more labour per hectare than the benchmark? Is this an issue of productivity management? Is it a health issue?
Fertilizer programme. The benchmark analysis indicates that this could be a cause of low yields.
Input costs. The farmer is paying much more for inputs ($ per unit) than the benchmark. Why? Again a problem analysis may be helpful to identify the root causes.
Once the root causes are clearly and correctly identified as causes and not symptoms, the farmer, with support from the extension worker, will have the difficult task of developing the actions necessary. Some of these actions will be technical in nature, such as using different seed varieties, different chemicals, different production programmes and including pest management and fertilization. Some of the actions will be managerial, such as better management of labour, better handling of products en route to market, better packaging, better timing of sales and storage.
Notes
Step-by-step field guide 107
NotesWHOLE FARM COMPARISON EXAMPLE
A comparison of gross margin and profit for the farm as a whole is a useful starting point to understand the performance of the farm business. If it is discovered that profits are low, the diagnosis could point to two possibilities: high fixed costs or low gross margin for the whole farm.
High fixed costs. If data has been gathered regarding the organization of fixed costs on the benchmark farm, some lessons can be learned about alternatives. For example, study farms may be using storage facilities inefficiently when compared with the benchmark farm. Perhaps the benchmark farm has fewer fixed assets burdening the farm. The study farm may want to sell or lease out unused or underutilized assets.
Low gross margin. If the total gross margin of a farm is low, the faults may be traced to one of two causes:
• Low gross margin per hectare or per unit of output of some of the farm enterprises. This may in turn result from low yields or high variable costs. In order to improve gross margins there may be a need to increase yields and reduce costs.
• The farming system may consist of low-value farm enterprises that are too extensive. It may be necessary to introduce high-value crops or livestock.
If a problem of low profitability can be traced to low yields, the farmer can investigate whether this is a result of technical inefficiency, lack of farm resources, or a mismatch of the resources used to grow the crop or raise livestock. If inadequate resources are employed, the farmer would do well to extend the area of land under cultivation or alternatively, increase labour supply, expand livestock, or obtain more capital. If the resource base cannot be increased, then fixed costs should be carefully evaluated. If production levels are satisfactory, low profitability may be traced to low prices attained for produce sold or high costs for purchased inputs used.

108 Farm business analysis using benchmarking
Notes
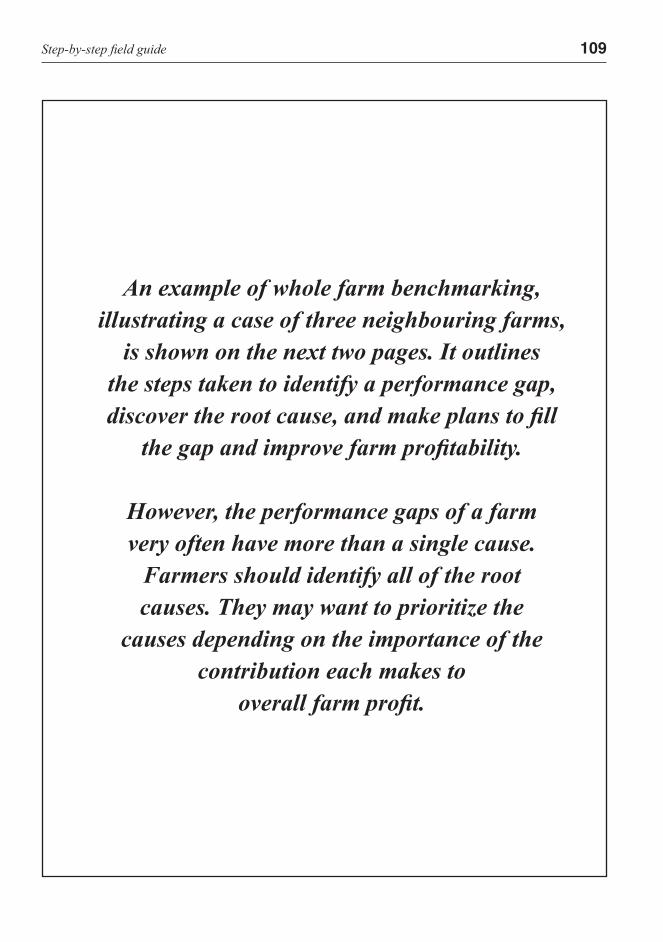
Step-by-step field guide 109
An example of whole farm benchmarking, illustrating a case of three neighbouring farms,
is shown on the next two pages. It outlines the steps taken to identify a performance gap, discover the root cause, and make plans to fill
the gap and improve farm profitability.
However, the performance gaps of a farmvery often have more than a single cause.
Farmers should identify all of the root causes. They may want to prioritize the
causes depending on the importance of the contribution each makes to
overall farm profit.
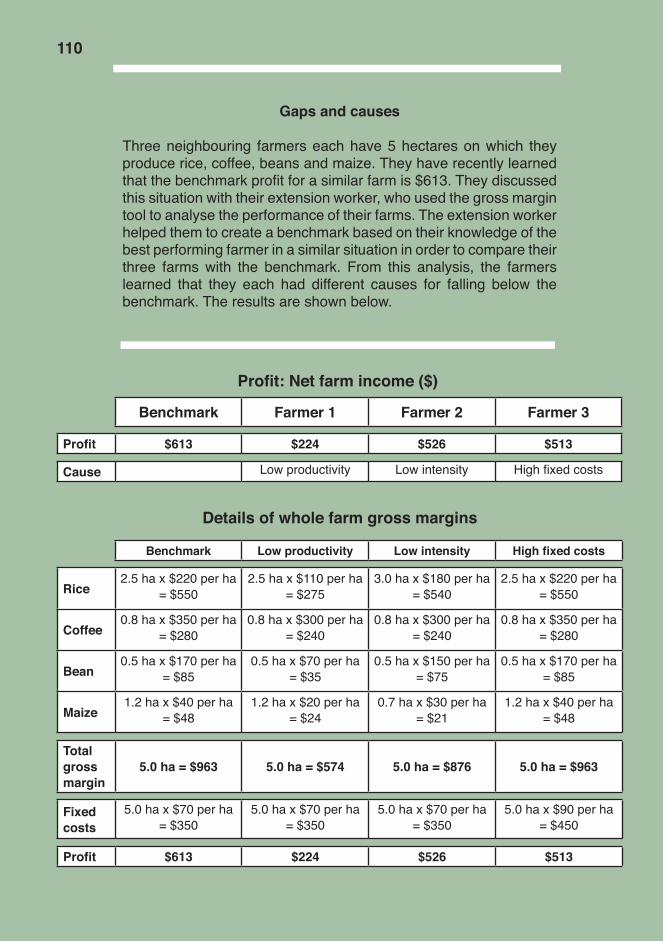
110
Gaps and causes
Three neighbouring farmers each have 5 hectares on which they produce rice, coffee, beans and maize. They have recently learned that the benchmark profit for a similar farm is $613. They discussed this situation with their extension worker, who used the gross margin tool to analyse the performance of their farms. The extension worker helped them to create a benchmark based on their knowledge of the best performing farmer in a similar situation in order to compare their three farms with the benchmark. From this analysis, the farmers learned that they each had different causes for falling below the benchmark. The results are shown below.
Details of whole farm gross margins
Benchmark Low productivity Low intensity High fixed costs
Rice2.5 ha x $220 per ha
= $5502.5 ha x $110 per ha
= $2753.0 ha x $180 per ha
= $5402.5 ha x $220 per ha
= $550
Coffee0.8 ha x $350 per ha
= $2800.8 ha x $300 per ha
= $2400.8 ha x $300 per ha
= $2400.8 ha x $350 per ha
= $280
Bean0.5 ha x $170 per ha
= $850.5 ha x $70 per ha
= $350.5 ha x $150 per ha
= $750.5 ha x $170 per ha
= $85
Maize1.2 ha x $40 per ha
= $481.2 ha x $20 per ha
= $240.7 ha x $30 per ha
= $211.2 ha x $40 per ha
= $48
Total grossmargin
5.0 ha = $963 5.0 ha = $574 5.0 ha = $876 5.0 ha = $963
Fixed costs
5.0 ha x $70 per ha = $350
5.0 ha x $70 per ha = $350
5.0 ha x $70 per ha = $350
5.0 ha x $90 per ha = $450
Profit $613 $224 $526 $513
Benchmark Farmer 1 Farmer 2 Farmer 3
Profit $613 $224 $526 $513
Cause Low productivity Low intensity High fixed costs
Profit: Net farm income ($)
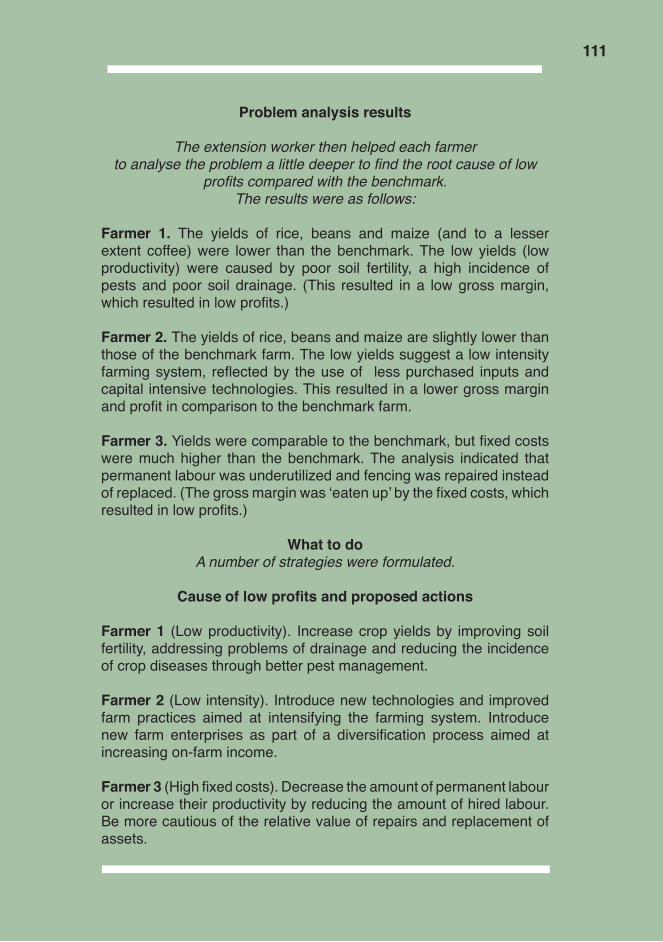
110 111
Problem analysis results
The extension worker then helped each farmer to analyse the problem a little deeper to find the root cause of low
profits compared with the benchmark. The results were as follows:
Farmer 1. The yields of rice, beans and maize (and to a lesser extent coffee) were lower than the benchmark. The low yields (low productivity) were caused by poor soil fertility, a high incidence of pests and poor soil drainage. (This resulted in a low gross margin, which resulted in low profits.)
Farmer 2. The yields of rice, beans and maize are slightly lower than those of the benchmark farm. The low yields suggest a low intensity farming system, reflected by the use of less purchased inputs and capital intensive technologies. This resulted in a lower gross margin and profit in comparison to the benchmark farm.
Farmer 3. Yields were comparable to the benchmark, but fixed costs were much higher than the benchmark. The analysis indicated that permanent labour was underutilized and fencing was repaired instead of replaced. (The gross margin was ‘eaten up’ by the fixed costs, which resulted in low profits.)
What to doA number of strategies were formulated.
Cause of low profits and proposed actions
Farmer 1 (Low productivity). Increase crop yields by improving soil fertility, addressing problems of drainage and reducing the incidence of crop diseases through better pest management.
Farmer 2 (Low intensity). Introduce new technologies and improved farm practices aimed at intensifying the farming system. Introduce new farm enterprises as part of a diversification process aimed at increasing on-farm income.
Farmer 3 (High fixed costs). Decrease the amount of permanent labour or increase their productivity by reducing the amount of hired labour. Be more cautious of the relative value of repairs and replacement of assets.

Notes
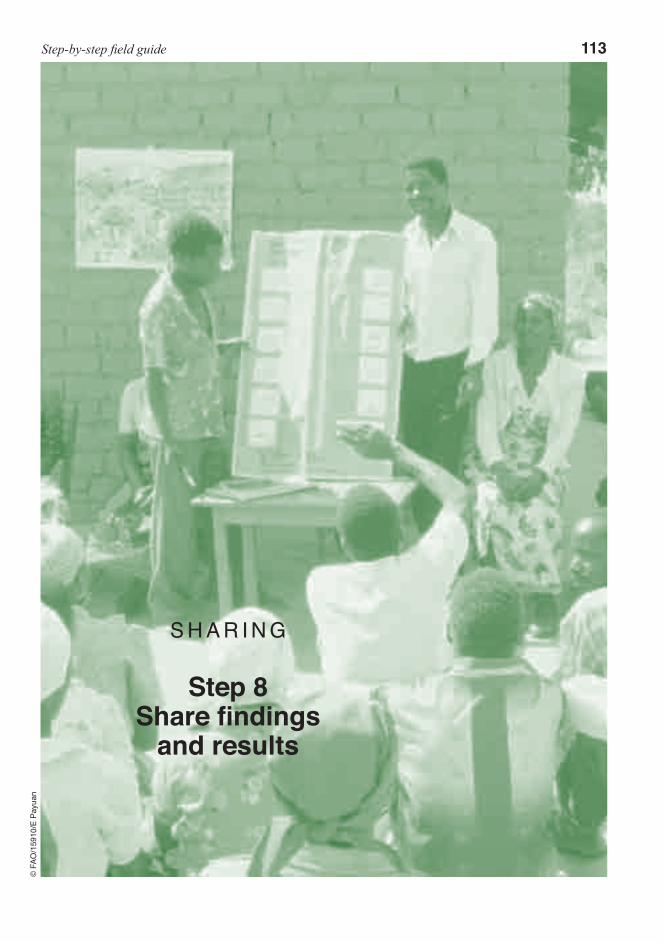
Step-by-step field guide 113©
FAO
/159
10/E
Pay
uan
S H A R I N G
Step 8Share findings
and results
114 Farm business analysis using benchmarking
S H A R I N G
Step 8Share findings and results
A key to learning is sharing findings and results. Information should be fed back to farmers soon after the benchmarking exercise is conducted. The timely feedback of information ensures that the lessons learned are consistent and well understood. The usefulness of the study will be improved if the results can be easily translated into action. Timeliness of communication is an important factor to ensure that the momentum is maintained.
The results should be discussed with members of the learning group as well as other farmers located in the vicinity. Farmers’ group meetings and discussions of results are of great importance in maximizing the use of the data that has been collected and analysed. The results of this analysis should form a vital component of any future learning group meetings.
Special attention should be given to the presentation of the results. Effective communication of benchmark findings is needed for the learning group to appreciate and understand the results. Farmers require information that is brief and clearly presented. As the facilitator you need to know how to communicate the findings of the benchmarking study to group members as well as other farmers in your vicinity in a way that the information can be easily understood. You should have the ability to turn data into information that can be effectively communicated to farmers. You should also encourage the team leaders and group members to share their experiences and present their results. Information should be presented both verbally and visually. Visual presentation of information using bar graphs or pie charts often conveys a message more effectively than the written or spoken word.
Notes
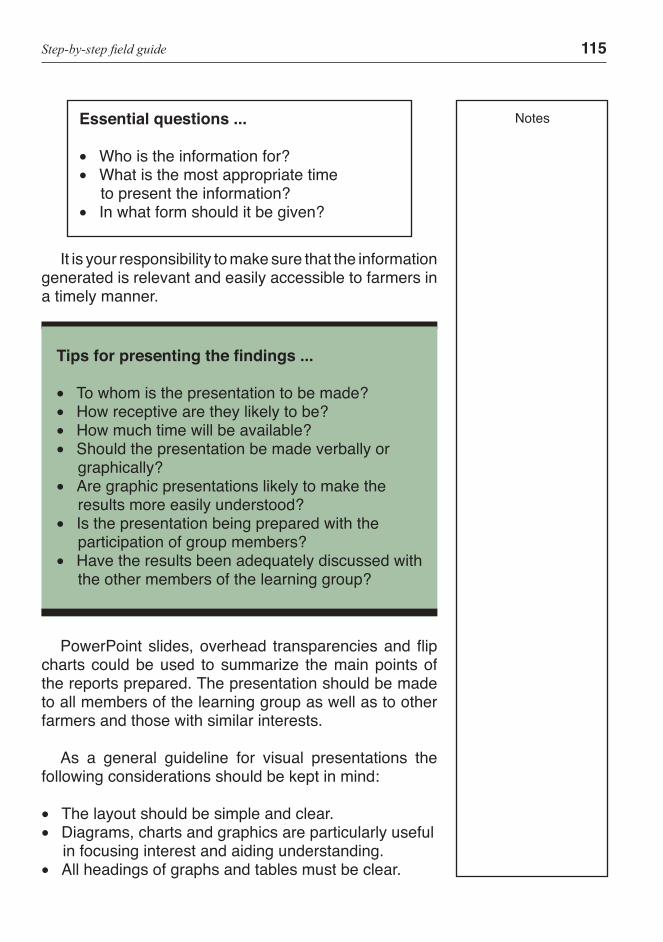
Step-by-step field guide 115
Essential questions ...
• Who is the information for? • What is the most appropriate time
to present the information? • In what form should it be given?
It is your responsibility to make sure that the information generated is relevant and easily accessible to farmers in a timely manner.
Tips for presenting the findings ...
• To whom is the presentation to be made? • How receptive are they likely to be? • How much time will be available? • Should the presentation be made verbally or
graphically? • Are graphic presentations likely to make the
results more easily understood? • Is the presentation being prepared with the
participation of group members? • Have the results been adequately discussed with
the other members of the learning group?
PowerPoint slides, overhead transparencies and flip charts could be used to summarize the main points of the reports prepared. The presentation should be made to all members of the learning group as well as to other farmers and those with similar interests.
As a general guideline for visual presentations the following considerations should be kept in mind:
• The layout should be simple and clear. • Diagrams, charts and graphics are particularly useful
in focusing interest and aiding understanding. • All headings of graphs and tables must be clear.
Notes
116 Farm business analysis using benchmarking
While there is a significant role for you to share and disseminate information, you have an equally important role to foster the practice and skill of open discussion and sharing of information within the learning group. In this way the learning process is complete.
Sharing and communicating results ...Tips for presenting the findings ...
• Ensure that the information is well presented and easily understood.
• Disseminate and share the results with all farmers in the learning group and others.
• Make sure that there is a strong two-way communication.
• Prepare clear practical recommendations for the learning group members.
PRESENTING THE RESULTS
The examples on the following page show the use of both a bar chart and pie charts to illustrate the results of a benchmarking exercise. It is important to remember, however, that many people have difficulty in using charts to compare results. Visuals should only be used when the presenter is confident that it actually enhances the presentation. Graphics that have been prepared by the farmers themselves usually ensure that there is clarity in understanding of the information being presented. The graphics can be made to be more effective if they are printed or presented in colour.
Here both bar and pie charts have been used to compare the difference in costs between the benchmark farm and those of the other two farms. The graphics clearly show that both farmers spend more money on labour to grow beans in comparison to the benchmark farm.
Notes
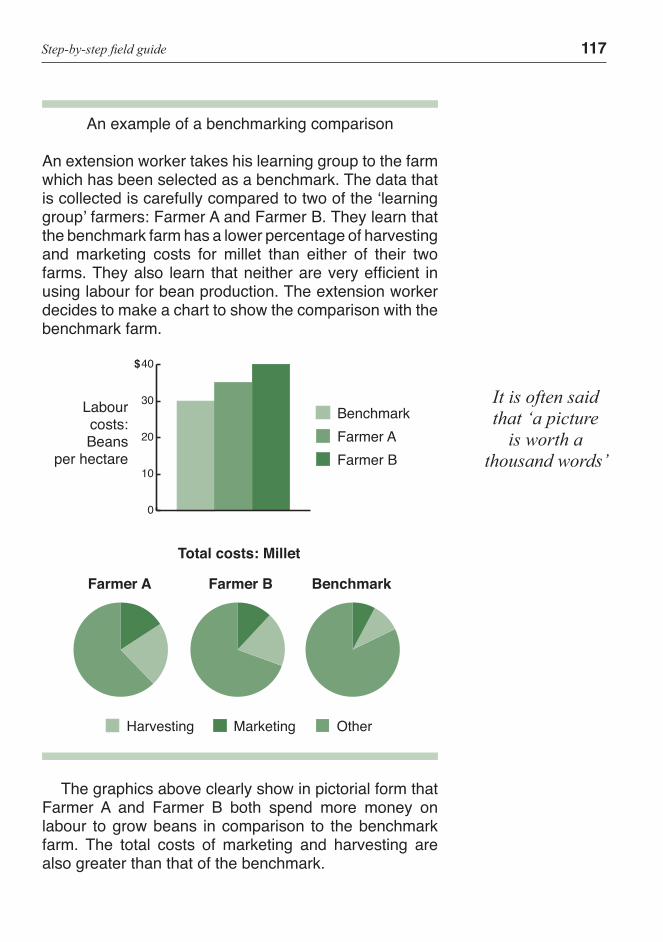
Step-by-step field guide 117
The graphics above clearly show in pictorial form that Farmer A and Farmer B both spend more money on labour to grow beans in comparison to the benchmark farm. The total costs of marketing and harvesting are also greater than that of the benchmark.
An example of a benchmarking comparison
An extension worker takes his learning group to the farm which has been selected as a benchmark. The data that is collected is carefully compared to two of the ‘learning group’ farmers: Farmer A and Farmer B. They learn that the benchmark farm has a lower percentage of harvesting and marketing costs for millet than either of their two farms. They also learn that neither are very efficient in using labour for bean production. The extension worker decides to make a chart to show the comparison with the benchmark farm.
0
10
20
30
40
BenchmarkFarmer AFarmer B
Harvesting OtherMarketing
$Labourcosts:Beans
per hectare
Farmer A
Total costs: Millet
0
10
20
30
40
BenchmarkFarmer AFarmer B
Harvesting OtherMarketing
$
Farmer B Benchmark
It is often said that ‘a picture
is worth a thousand words’

118 Farm business analysis using benchmarking
Notes

Step-by-step field guide 119©
FAO
/221
07/J
Koe
len
P L A N F O R C H A N G E
Step 9Devise plans and
implement changes
120 Farm business analysis using benchmarking
P L A N F O R C H A N G E
Step 9Devise plans and implement changes
The purpose of identifying performance gaps and causes is to introduce actions that improve farm performance and profitability. In many cases, improved farm performance will require a combination of actions to be taken. Those measures (gaps, causes and solutions) that show the greatest or most significant impact on the performance and profitability should be identified.
Some of these actions will be technical, introducing new technologies and practices such as improved seed varieties, integrated pest management and integrated plant nutrition systems. Some of the actions will focus on management and marketing issues, such as the more efficient use of labour, better handling of produce, improved packaging, storage and better timing of sales.
The key elements of this step are:
• understanding the range of decision options; • facilitating learning; • determining outcomes; • preparing action plans; • implementation.
Understanding the range of decision options. This is the stage where farm management decisions must be made. Up to this point, the benchmarking process has been purely analytical. But at this step, farmers must decide whether or not they want to take action to improve the performance and profitability of their farms.
Making and implementing decisions is core to the entire benchmarking process. Once the range of possible decisions has been identified, it is time to take action.
Notes
Step-by-step field guide 121
At this stage you may be tempted to tell farmers what is the best thing for them to do. While in some cases this may be appropriate, generally the most successful decision is the one made by farmers – who, after all is said and done, are going to reap the rewards or suffer the setbacks by whatever decisions are made and implemented.
The analytical approach followed will allow you to make connections between gaps and causes. For planning purposes the gaps should be traced to causes. Some of the causes will lead to simple things like changing the timing of planting or the amount of fertilizer. Some of the causes may lead to very complex decisions or even difficult decisions such as changing from one enterprise to another, replacing family labour, which may be inefficient because of illness, with hired labour, or setting up collective marketing structures.
Facilitating learning. You will need to be alert to the broad range of possibilities, including farm management decisions that may be difficult to make. In the end, it is the farmer’s choice about what to do or what not to do. It is your responsibility to help farmers understand the positive and negative outcomes of their choices and decisions. This is a high-level skill for extension workers because this is where the real learning from benchmarking takes place. You will also need to understand:
• how people learn; • learning styles; • learning by doing.
Facilitating learning is not the same as facilitating behaviour change or even technology transfer. It is the skill of helping farmers to increase their ability to:
• assess their circumstances; • weigh up options; • see the consequences of various possibilities; • make informed decisions as to the actions they will
take regarding their farms.
Notes
122 Farm business analysis using benchmarking
Determining outcomes. It is vital (particularly to the reflection process) that farmers are clear about what outcome they expect as a result of each decision they make. Just as indicators and measures were set to conduct the benchmark analysis, anticipated results for those indicators and measures need to be clearly identified. You should estimate the importance of the improvements and their effect on farm performance and profitability in collaboration with individual farmers. In this way you, as an extension worker, will need to guide farmers on what is reasonable and can be achieved. Be aware that farmers’ expectations are often overly ambitious and as a result be careful not to raise them further. Be sure to point out the likely risks that can arise.
Preparation of action plans. The next task calls for the preparation of an action plan. The plans should address the most urgent problems identified by the farmers. This should be prepared jointly with the farmers concerned, but may also require the support of specialist extension workers. The plan should include a list of activities that are needed to make the changes to the farming system, together with the timing and resource requirements. Obviously the plan needs to meet the individual goals set by the farmer. It should also provide the best solution
Some tips for facilitating learning ...
• The farmer is responsible for his or her own learning.
• You should also be prepared to learn. • Focus on learning in the context of a partnership
as opposed to a teacher-student relationship. • The best learning is by doing. • Try to identify the farmer’s preferred learning
style and adjust the learning situation accordingly.
• Learning is a process of planning, action and reflection.
Notes
Step-by-step field guide 123
that lies within the capacity of a farmer to implement. The plan of work should address those activities that will yield satisfactory results quickly and will encourage farmers to take part in follow-up learning group extension programmes.
A work plan is also needed that provides a detailed breakdown of activities and tasks showing how they will be carried out. A calendar of work should be prepared for the various operations to be carried out in the plan. Careful planning is necessary to prevent a waste of time, money and effort.
Implementation. Plans are not just a list of good ideas gathered from comparison with benchmark farms. They should take into account the resources needed to implement them. They should be developed in the context of the whole farming system. This will go a long way in ensuring that the plans can be implemented and are sustainable.
Planning and implementation of the changes to be made to the farming system as a result of the benchmarking exercise is the responsibility of the farmers. Naturally individual decisions will be implemented by individual farmers. Your role as an extension worker is to make sure that the farmers have supportive advice and access to the resources that they will need to implement their plans.
First, farmers should ensure that the changes they intend to make can, in fact, be implemented. For example, if the decision is to use a different seed variety (as may have been used on the benchmark farm), the farmer should ask questions such as:
• Is the seed variety available? • If so, from where can it be obtained? • Is the seed variety accessible? • Is it affordable? • Do I know how to work with this new seed? • Are there other considerations that I need to take
into account?
Notes
124 Farm business analysis using benchmarking
Tips from the field ...
• Advise farmers on ways of increasing efficiency and profitability.
• Replicate successful technologies and enterprises.
• Advise farmers on the profitability of introducing new enterprises to the farming system. (This may require identification of farmers growing that enterprise and understanding the technical and financial prerequisites needed as well as some of the expected weaknesses.)
• Organize demonstrations to test the profitability of new practices and technologies.
• Ensure that farmers have adequate resources to undertake action plans and are prepared to introduce the best practice findings.
• Disseminate the findings among the farmer group.
It may be the case that some of these questions cannot be answered by the farmer. If so, you can assist the farmer to set up a small trial to test the seed variety and gain experience in growing it.
As an extension worker you have a role to assist farmers in assessing the impact of the change on the farming system and preparing action plans for implementation. As part of the benchmarking exercise, priorities could be set by estimating the ‘potential benefits’ of these changes on farm profitability. This should provide the farmer with valuable information to help prioritize the farm enterprises, technologies and activities needed to upgrade the farming system.
Notes
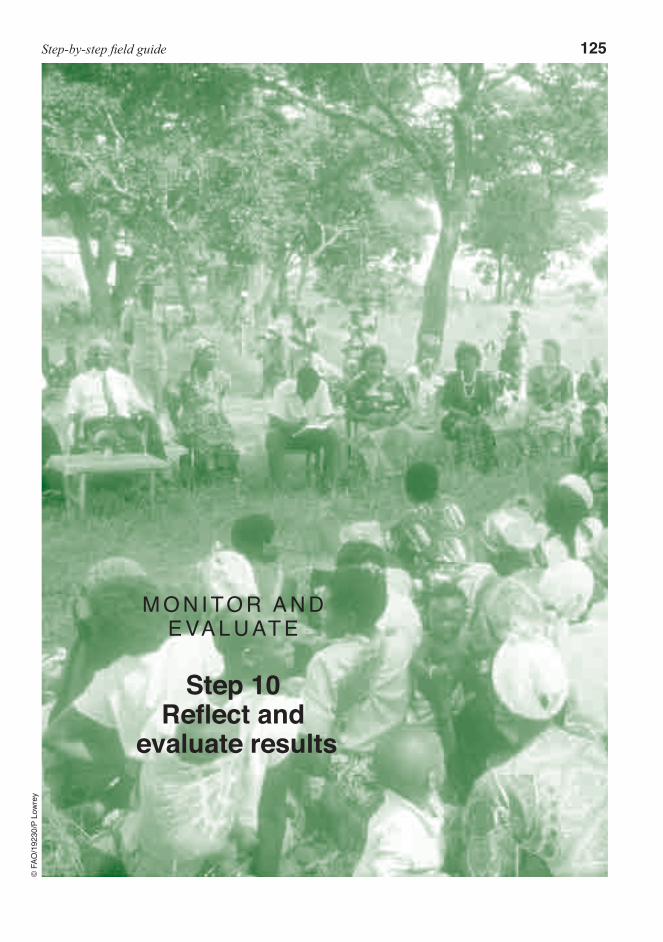
Step-by-step field guide 125©
FAO
/192
30/P
Low
rey
M O N I TO R A N D E VA L U AT E
Step 10Reflect and
evaluate results
126 Farm business analysis using benchmarking
M O N I T O R A N D E V A L U A T E
Step 10
Reflect and evaluate results
Another key to learning is reflection on the results of decisions implemented. While there is a significant role for you, as an extension worker in this process, there is an even larger role for you to facilitate this learning process and help the farmers in the learning group increase the benefit from the benchmarking exercise.
One way in which you can facilitate this is by setting the right context. This would include reminding the farmers of why they chose what they chose and of what they expected to obtain from the decisions they made and implemented. This is critical because without such clear focus and criteria, the outcomes cannot be judged objectively.
As an extension worker, you may need to lead this process. This should be done as systematically as possible. The general pattern for reflection is to follow the questions listed here:
• What was done? What result did it achieve? • How does this compare with what was expected? • What are the reasons for the variations? • What can we learn from these outcomes, variations
and reasons? • What action will be taken next?
The lessons learned in such reflections can be shared with other farmers in the group and beyond it.
While the plan is being implemented it should be regularly monitored to check that everything is going according to plan. It could also mean making adjustments to the plan if needed.
Notes
Step-by-step field guide 127
Following each benchmarking exercise an evaluation should be held on the key lessons learned. Evaluating the outcome allows the farmer to decide whether or not the plan worked and whether or not the goals were achieved. It involves taking a longer look at what has been done and measure it against the expectations. This, again, requires some form of record-keeping so that the farmer will have the data and information to determine if the plan is fulfilling the goals the farmer set out to achieve.
* * *PROS AND CONS OF
MONITORING AND EVALUATION
Advantages
• Provides early feedback about what is or is not working, and why.
• Allows correction of problems as they emerge. • Assists identification of unintended side-effects. • Helps in prioritizing which issues to investigate in
greater depth. • Provides a basis to assess the likely impacts of the
changes.
Disadvantages
• Can easily become overly complex if the scale of activities is large or if an exhaustive list of factors are assembled.
• Farmers might disagree about which of the causes are important and which can be time-consuming to address.
* * *
Notes
128 Farm business analysis using benchmarking
Benchmarking is not a one-off event. It should be an on-going process. Thus one of the key aims for you would be to build the understanding, skill and interest on the part of the farmers in the learning group to continue with benchmarking on their own.
By this stage in the process your learning group will understand the value of benchmarking. They will have seen how the process is conducted and become aware of how it can be used to improve productivity and profitability. Farmers should be urged to continue to meet regularly and conduct further benchmarking exercises on new problems of common interest.
Notes
Notes
ANNEXBUSINESS CONCEPTS FOR
BENCHMARKING
130 Farm business analysis using benchmarking
Profit is the difference between the money that comes in to the farm business from the sales of a product and the money that goes out to produce it. The money coming in is expressed as the total value of production. The money spent is expressed as costs. There are two types of costs: variable and fixed.
The value of production includes the money received
from sales, the value of produce stored and the value of produce consumed by the farm family in the course of a year. The growth of young tree crops and livestock is also a form of production. Trees and animals gain in value as they grow. This is also included. Total production, therefore, includes produce sold, produce consumed on the farm and by the family and the growth of young trees and livestock. The value of production is sometimes called gross income.
There are two types of costs:Variable and Fixed
These change as production increases or decreases. Variable costs apply to specific enterprises and they are no longer required if the enterprise is discontinued. For example, a farmer who decides to keep two cows rather than one would need twice as much feed, and if he or she chooses not to keep any dairy cows no feed would be needed. Variable costs include such things as the purchase of seeds, fertilizers, sprays, animal feed and veterinary medicines used for production.
These do not vary as production changes. Fixed costs apply to the farm as a whole and include such things as the cost of a hand cart, farm tools, a draught animal as well as full-time labour. This is a simple and practical tool for assessing the comparative profitability of different farm activities,
Step-by-step field guide 131
enterprises or technologies. Gross margin is often used by small-scale farmers with few fixed assets and is particularly suitable for those who sell increasing amounts of their farm products in the market place. This can be calculated as follows:
Sara and Sam both grow potatoes.
They want to compare profitability.
Sara grows 1 hectare of potatoes on her farm. She has an income of $400 from sales and variable costs for $200. Her gross margin is $200 ($400 – $200 = $200).
Sam grows 1.5 hectare of potatoes. He gets an income of $600 from sales. His variable costs are $300. The gross margin from potatoes is $300 ($600 – $300 = $300).
Sam appears to be making more money from potatoes than Sara but the area under production differs. In order to make a meaningful comparison the gross margin per unit of land (per hectare) should be calculated. Sam’s gross margin needs to be calculated on a per hectare basis:
$300 ÷ 1.5 hectare = $150
While Sam has a higher overall gross margin, his gross margin per hectare is lower than Sara’s. Potato production on Sara’s plot is more profitable then Sam’s.
* For more on gross margin, enterprise profit and farm profit, refer to Farm management extension guide 1: Economics for market-oriented farming.
Efficiency is the careful use of the resources available to
132 Farm business analysis using benchmarking
the farmer. A farm that is efficiently run is more likely to be profitable than a farm that is not. Efficiency can take two forms; technical and economic. Measuring technical efficiency is important because greater efficiency can generate higher profits. Technical efficiency can be calculated as follows:
An example of technical efficiencyA farmer wants to produce 10 tonnes of tomatoes. Different methods of tomato growing can be used, such
as intercropping, organics, tunnels and in greenhouses. Growing tomatoes, for this example, requires two resources: capital and labour. Some growing methods require more capital while others require more labour (these are said to be capital and labour intensive).
The farmer would like to know ...
What is the most technically efficient wayof producing 10 tonnes of tomatoes?
Which of the four methods listed aboveshould be selected?
The farmer contacts the local extension worker to find out
which method is technically more efficient.
The following table illustrates how each method uses capital and labour to produce 10 tonnes of tomatoes.
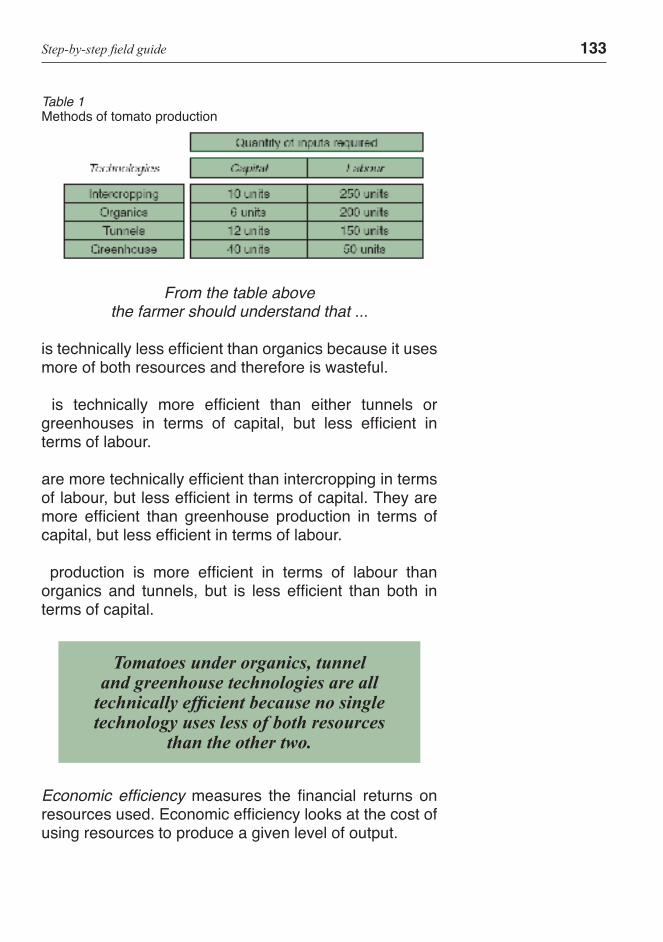
Step-by-step field guide 133
From the table above the farmer should understand that ...
is technically less efficient than organics because it uses more of both resources and therefore is wasteful.
is technically more efficient than either tunnels or greenhouses in terms of capital, but less efficient in terms of labour.
are more technically efficient than intercropping in terms of labour, but less efficient in terms of capital. They are more efficient than greenhouse production in terms of capital, but less efficient in terms of labour.
production is more efficient in terms of labour than organics and tunnels, but is less efficient than both in terms of capital.
Economic efficiency measures the financial returns on resources used. Economic efficiency looks at the cost of using resources to produce a given level of output.
Table 1Methods of tomato production
Tomatoes under organics, tunnel and greenhouse technologies are all
technically efficient because no single technology uses less of both resources
than the other two.
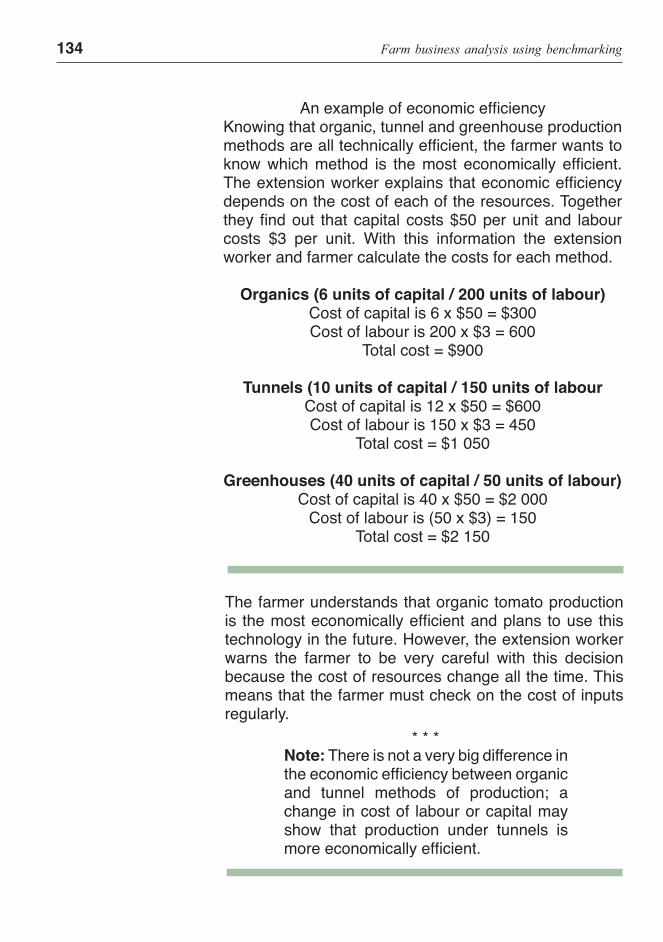
134 Farm business analysis using benchmarking
An example of economic efficiencyKnowing that organic, tunnel and greenhouse production methods are all technically efficient, the farmer wants to know which method is the most economically efficient. The extension worker explains that economic efficiency depends on the cost of each of the resources. Together they find out that capital costs $50 per unit and labour costs $3 per unit. With this information the extension worker and farmer calculate the costs for each method.
Organics (6 units of capital / 200 units of labour) Cost of capital is 6 x $50 = $300Cost of labour is 200 x $3 = 600
Total cost = $900
Tunnels (10 units of capital / 150 units of labour Cost of capital is 12 x $50 = $600Cost of labour is 150 x $3 = 450
Total cost = $1 050
Greenhouses (40 units of capital / 50 units of labour)Cost of capital is 40 x $50 = $2 000
Cost of labour is (50 x $3) = 150 Total cost = $2 150
Note: There is not a very big difference in the economic efficiency between organic and tunnel methods of production; a change in cost of labour or capital may show that production under tunnels is more economically efficient.
The farmer understands that organic tomato production is the most economically efficient and plans to use this technology in the future. However, the extension worker warns the farmer to be very careful with this decision because the cost of resources change all the time. This means that the farmer must check on the cost of inputs regularly.
* * *

Step-by-step field guide 135
Notes

137
Glossary
Benchmarking The practice of comparing the performance of one farm with another. It usually starts by identifying farms that are performing well and farmers who are the best at doing something. It then requires one to understand how they do it in order to learn from them and improve farm performance.
Economic efficiency The measure of financial returns on resources used. Economic efficiency looks at the cost of using resources to produce a given level of output. The most economically efficient method of production is the one that costs the least. (Note: economically efficient methods are usually selected only from technically efficient methods.)
Farm records Data and information files kept by the farmer to monitor and evaluate farm performance and can also be used for farm planning. Farm records can be physical, such as the farm map and production records and financial, such as sales and purchases records.
138 Farm business analysis using benchmarking
Fixed costs Costs that apply to the farm as a whole. These costs do not vary even when large changes are made in the amount, type and size of the farm enterprise.
Gross margin The measure of what the enterprise is adding to farm profits. The gross margin for a crop or livestock product is obtained by subtracting the variable costs from the value of production
Net farm income The money left over after the variable costs and fixed costs are paid. This also considers taking into account the cost of family labour.
Performance Refers to indicators of profitability, efficiency as well as the processes underlying them.
Profit The amount of money earned after covering all costs. It is the difference between the money that comes in from the sales of the product or service and the money that goes out to produce them. Profit is not the same as income. Profit means that there is more money coming in than there is money going out.
Gossary 139
Profitability The measure of how well the farm business uses the resources available to the farmer to generate income and profit.
Technical efficiency The measure of the farms success in producing maximum output from a given set of inputs. It is often measured as the achievement of maximum output with given inputs or a given output with minimum inputs
Value of production The money received from the sales of produce together with the value of produce that is consumed and stored.
Variable costs Costs of production that vary as production changes. Variable costs include purchases of seeds, fertilizers, sprays, animal feed, veterinary medicines and fuel and oil for machinery used to produce crops and raise livestock. Variable costs apply specifically to a particular enterprise. These costs can be avoided if the enterprise is discontinued.

141
1999. Benchmarking supply chain management: finding best practices, Journal of Business and Industrial Marketing, 14 (5/6).
2002. Should we be benchmarking? Sheep and Beef Notes, November 2002, The Scottish Agricultural College.
1994. Benchmarking for bestpractices: Winning through innovative adaptation,Donnelley and Sons Company.
2002. Bare-bones benchmarking: How thesmallest can learn from the best, Lewis College, University of Southern Colorado, Warnock, USA.
2000. Appraisal of farmbusiness performance, Journal of Farm Management, Vol 10, No. 8.
1989. Benchmarking: The search for industry best practices that lead to superior performance, ASQC Quality Press, Milwaukee, USA.
1996. How to improve performance through benchmarking, Kogan Page Ltd, London.
2005. Benchmarkingfarm enterprises, Journal of Farm Management, Vol.12,No.3, pp.143-145
2003. On-farm benchmarking: How to do it and how to do it better, International Farm Management Congress.
2001. Technical Efficiency and
142 Farm business analysis using benchmarking
Benchmarking in Dairy Enterprise, Journal of Farm Management, Vol. 10, No. 12.
1989. ComparativeAnalysis in farm management: How to achieve yourfarm business goals, Yearbook of Agriculture, USDA, Washington DC.
1968. A systematic approach to farmbusiness analysis without accounts data, Study 4,Department of Agriculture, University of Reading, Reading, UK.
143
Notes

144

145

146

147
148
149
150 Farm business analysis using benchmarking
The following is a list of the publications included in the FARM MANAGEMENT ExTENSION GUIDE series:
1MARKET ORIENTED FARMING:An overview2013, 90 pp.
2ECONOMICS forfarm management extension2008, 90 pp.
3MANAGING RISK in farming2008, 107 pp.
4FARM BUSINESS ANALYSISusing benchmarking2010, 142 pp.
5ENREPRENEURSHIPin farming2012, 127 pp.
6The role of theFARM MANAGEMENT SPECIALISTin extension2013, 127 pp.