Embed Size (px)
Citation preview
Farm Bill Background
Bradley D. Lubben, Ph.D.Extension Assistant Professor, Policy Specialist, and Director, North Central Risk Management Education
Center
November 10, 2014
Web information – agecon.unl.edu/agpolicy or farmbill.unl.edu
North Central Risk Management Education Center – ncrme.org
E-mail – [email protected]

Farm Bill Timeline
• 2011• Joint Select Committee on Deficit Reduction (the “Supercommittee”)
• Senate and House Ag. Committees proposed new farm bill language, but the Supercommittee failed to reach an agreement.
• 2012• Senate farm bill adopted and House Agriculture Committee farm bill reported, but no
House consideration • 2008 Farm Bill extended through 2013
• 2013• Senate farm bill passed in June• House farm bill fails June vote
• Farm-only farm bill (minus Nutrition title) passes in July• Nutrition title passes in September
• 2014• Conference report completed in January• Farm Bill became law on February 7

The Farm Bill Setting
• Policy Drivers
• Economics
• Budget
• Trade
• Politics
1970
1971
1972
1973
1974
1975
1976
1977
1978
1979
1980
1981
1982
1983
1984
1985
1986
1987
1988
1989
1990
1991
1992
1993
1994
1995
1996
1997
1998
1999
2000
2001
2002
2003
2004
2005
2006
2007
2008
2009
2010
2011
2012
2013
2014
$0
$20,000,000,000
$40,000,000,000
$60,000,000,000
$80,000,000,000
$100,000,000,000
$120,000,000,000
$140,000,000,000
Net Farm Income (Less Govt Pay) Government Payments
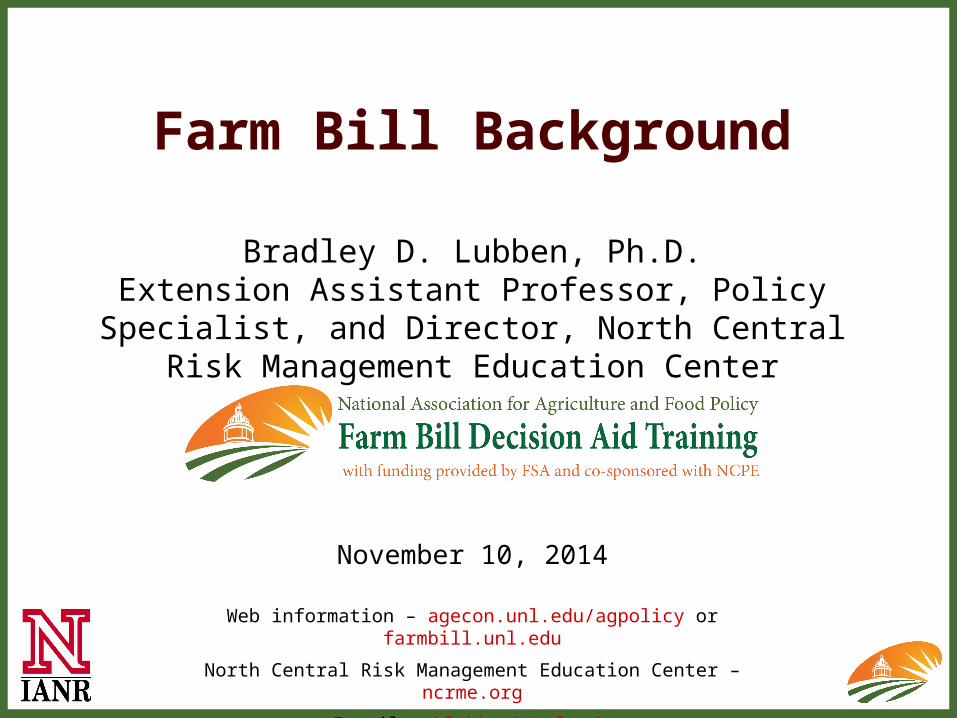
The Economic SettingU.S. Net Farm Incomeand Government Payments
Source: USDA Economic Research Service
1996 Farm Bill 2002
Farm Bill
2008 Farm Bill
1985 Farm Bill
1990 Farm Bill
Data file: ag value added – nebraska and us.xlsx
2014 Farm Bill

FAPRI’s Baseline reports confirmed a general perception we were in a period of high prices
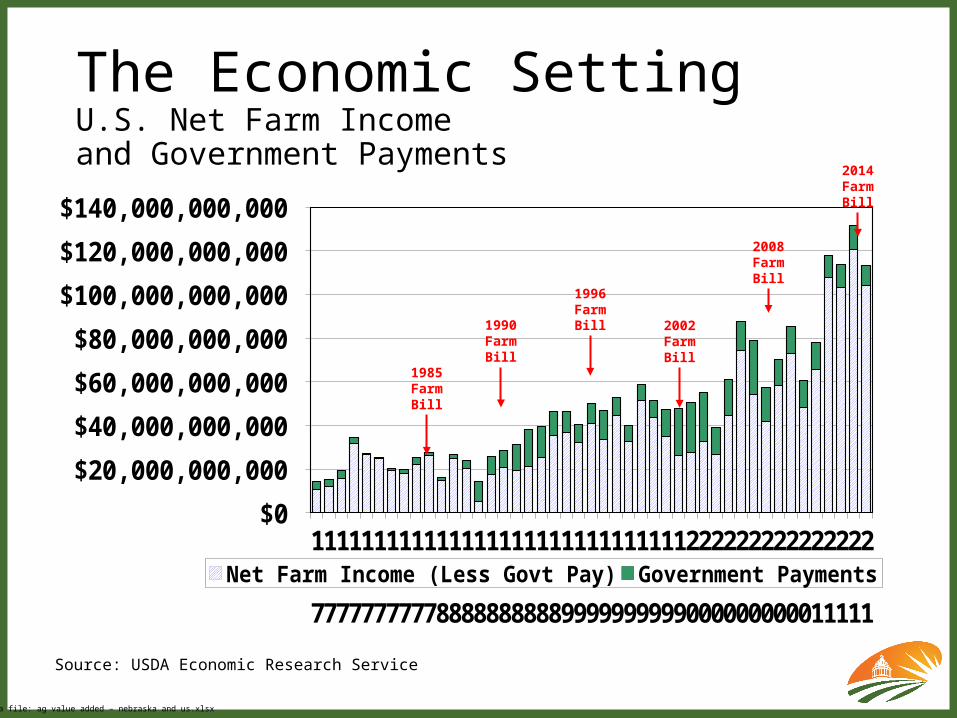
Crop Insurance had grown by five-fold --- apparently supplanted Ad hoc programs--- Insured price risk--- Insured area yield and revenue
19811983
19851987
19891991
19931995
19971999
20012003
20052007
20092012
0.0
50.0
100.0
150.0
200.0
250.0
300.0
U.S. Crop Insured Acres

2013 Soybean Coverage Levels
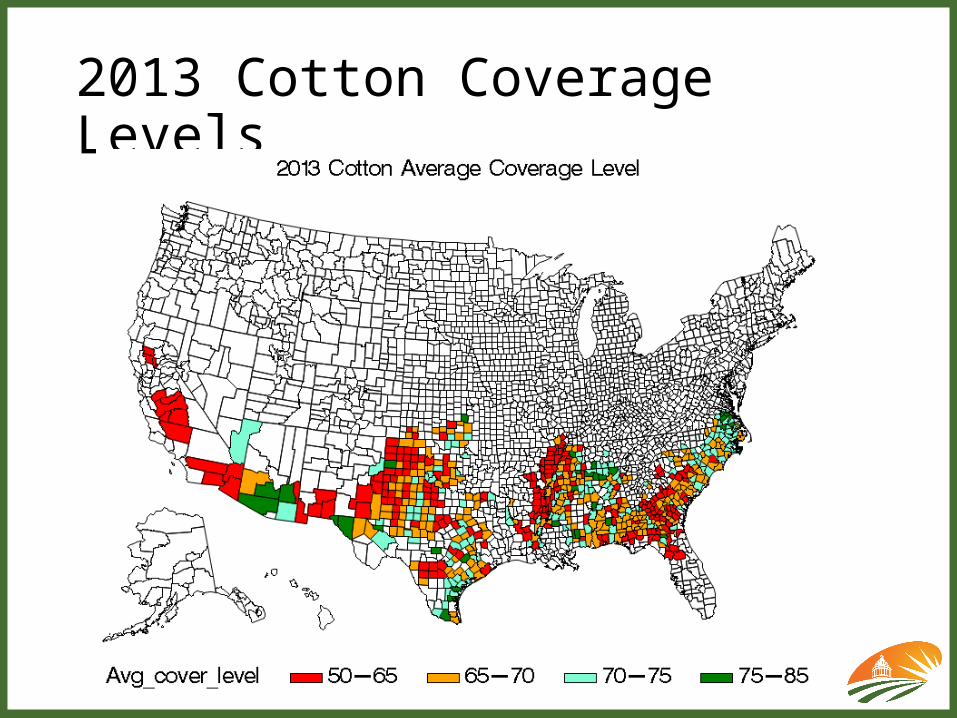
2013 Cotton Coverage Levels

Base Acres Versus Planted Acres-- became a hot button issue-- distortion versus risk protection
Crop
CBO Estimate of Base Acres
millions
CBO Estimate of Planted Acres
millions%
DifferenceCorn 84.1 90.0 7%
Soybeans 50.1 76.7 53%Wheat 73.8 52.5 -29%Cotton 18.1 10.9 -40%Rice 4.4 3.1 -31%
Peanuts 1.5 1.3 -9%
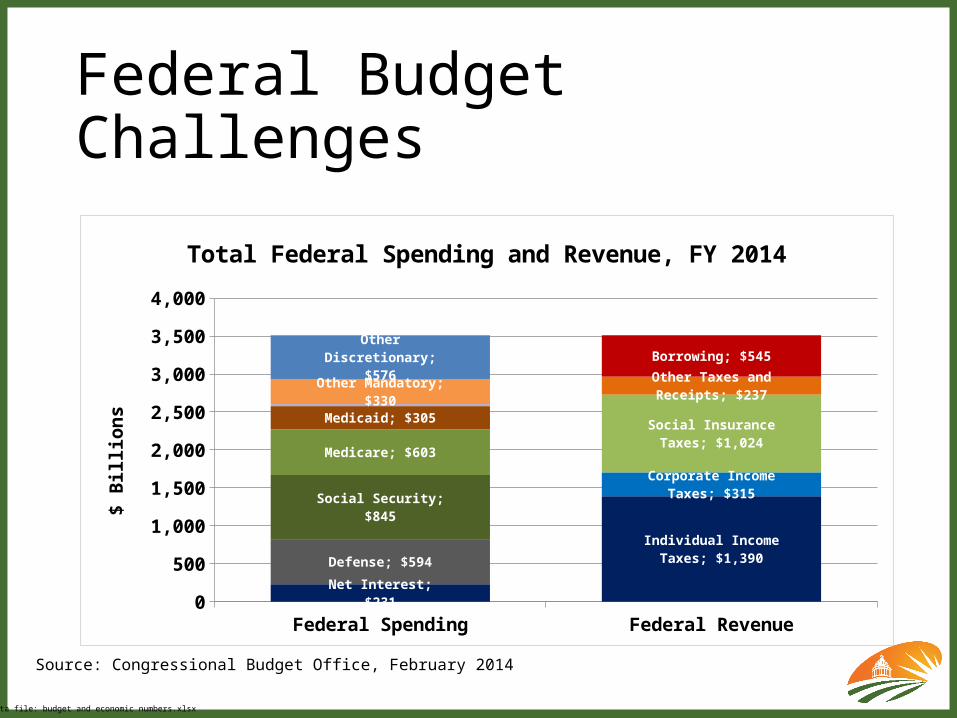
Federal Budget Challenges
Source: Congressional Budget Office, February 2014
Data file: budget and economic numbers.xlsx
Federal Spending Federal Revenue0
500
1,000
1,500
2,000
2,500
3,000
3,500
4,000
Net Interest; $231
Defense; $594
Social Security; $845
Medicare; $603
Medicaid; $305
Other Mandatory; $330
Other Discretionary; $576
Individual Income Taxes; $1,390
Corporate Income Taxes; $315
Social Insurance Taxes; $1,024
Other Taxes and Receipts; $237
Borrowing; $545
Total Federal Spending and Revenue, FY 2014
$ B
illio
ns
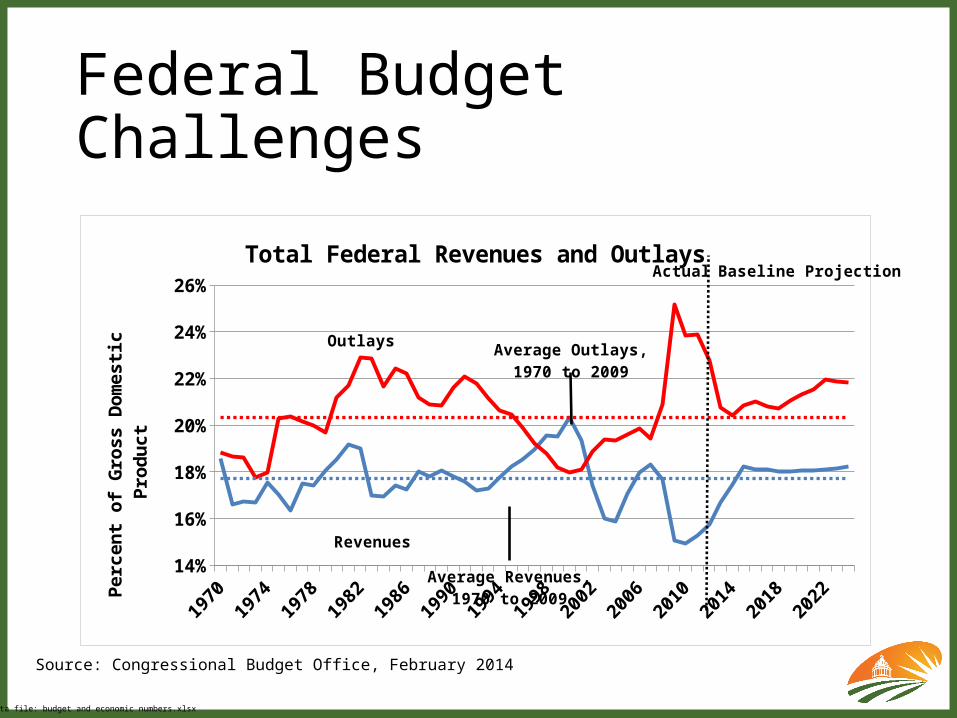
Federal Budget Challenges
Source: Congressional Budget Office, February 2014
Data file: budget and economic numbers.xlsx
19701973
19761979
19821985
19881991
19941997
20002003
20062009
20122015
20182021
202414%
16%
18%
20%
22%
24%
26%
Total Federal Revenues and Outlays
Pe
rce
nt
of
Gro
ss
Do
me
sti
c P
rod
uc
t
Outlays
Revenues
Average Revenues,1970 to 2009
Average Outlays,1970 to 2009
Actual Baseline Projection
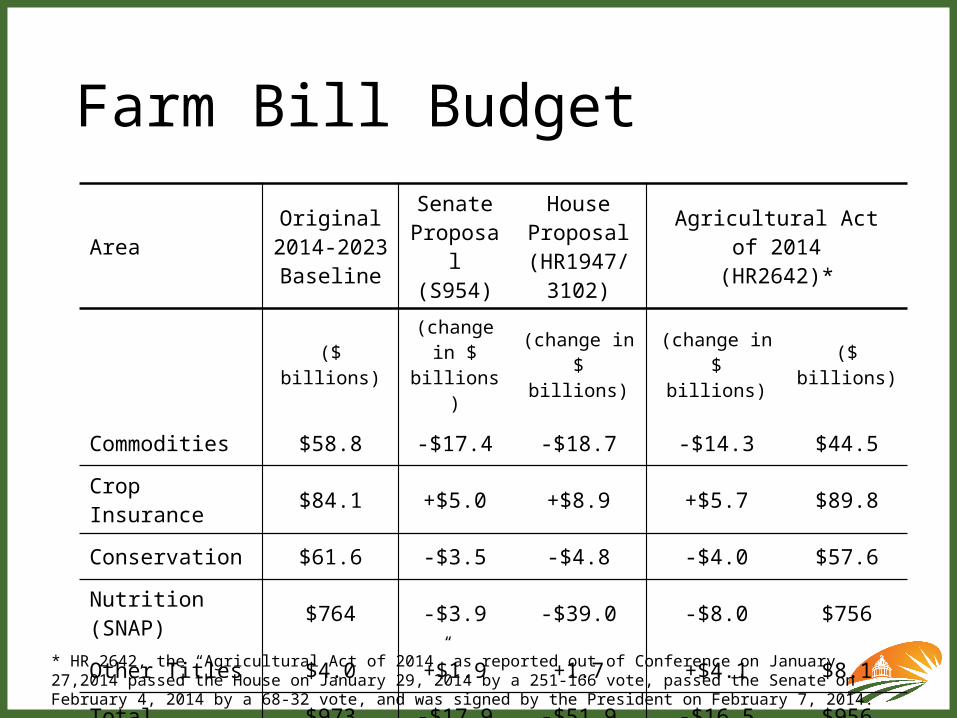
Farm Bill Budget
AreaOriginal
2014-2023 Baseline
Senate Proposal
(S954)
House Proposal(HR1947/
3102)
Agricultural Act of 2014(HR2642)*
($ billions) (change in $ billions)
(change in$ billions)
(change in$ billions) ($ billions)
Commodities $58.8 -$17.4 -$18.7 -$14.3 $44.5
Crop Insurance $84.1 +$5.0 +$8.9 +$5.7 $89.8
Conservation $61.6 -$3.5 -$4.8 -$4.0 $57.6
Nutrition (SNAP) $764 -$3.9 -$39.0 -$8.0 $756
Other Titles $4.0 +$1.9 +1.7 +$4.1 $8.1
Total $973 -$17.9 -$51.9 -$16.5 $956
* HR 2642, the “Agricultural Act of 2014” as reported out of Conference on January 27,2014 passed the House on January 29, 2014 by a 251-166 vote, passed the Senate on February 4, 2014 by a 68-32 vote, and was signed by the President on February 7, 2014.

The Trade SettingWTO or not WTO?• WTO negotiations
• Doha Round• Started in 2001• Negotiations at a
stalemate in 2014
• Domestic supports• Export competition• Market access
• No WTO negotiations
• WTO dispute settlement• Brazil-US cotton case
• Complaint in 2002• Final agreement in 2014
• Canada and Mexico-U.S. COOL Rules
• Complaint in 2008• Noncompliance ruling in
Oct 2014• Action pending
• Bilateral and regional trade negotiations and implementation
• TTIP• TPP
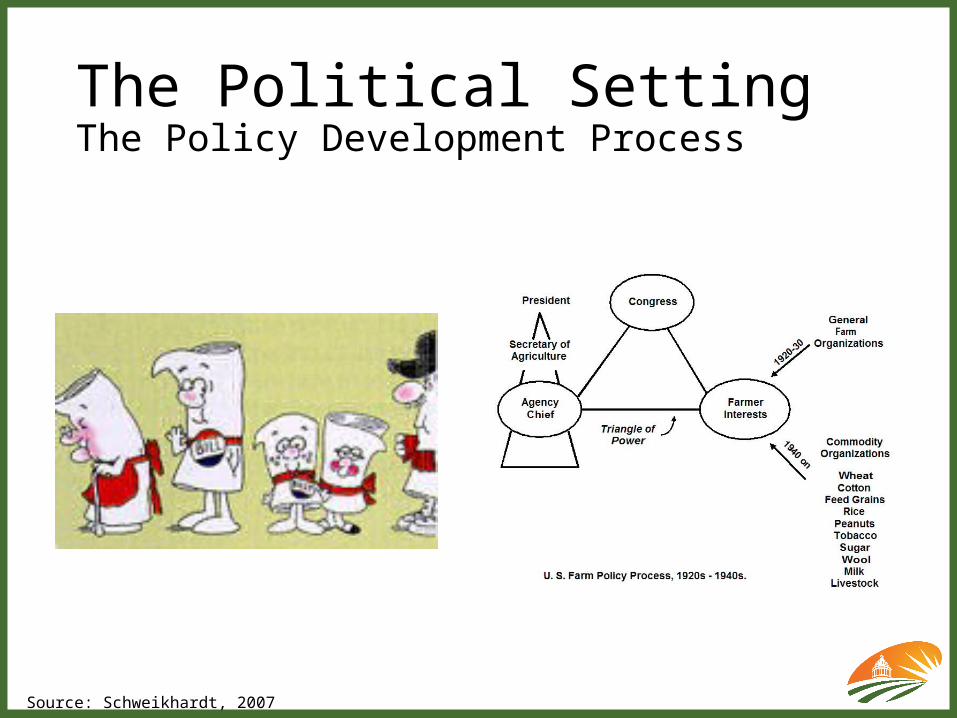
The Political SettingThe Policy Development Process
Source: Schweikhardt, 2007
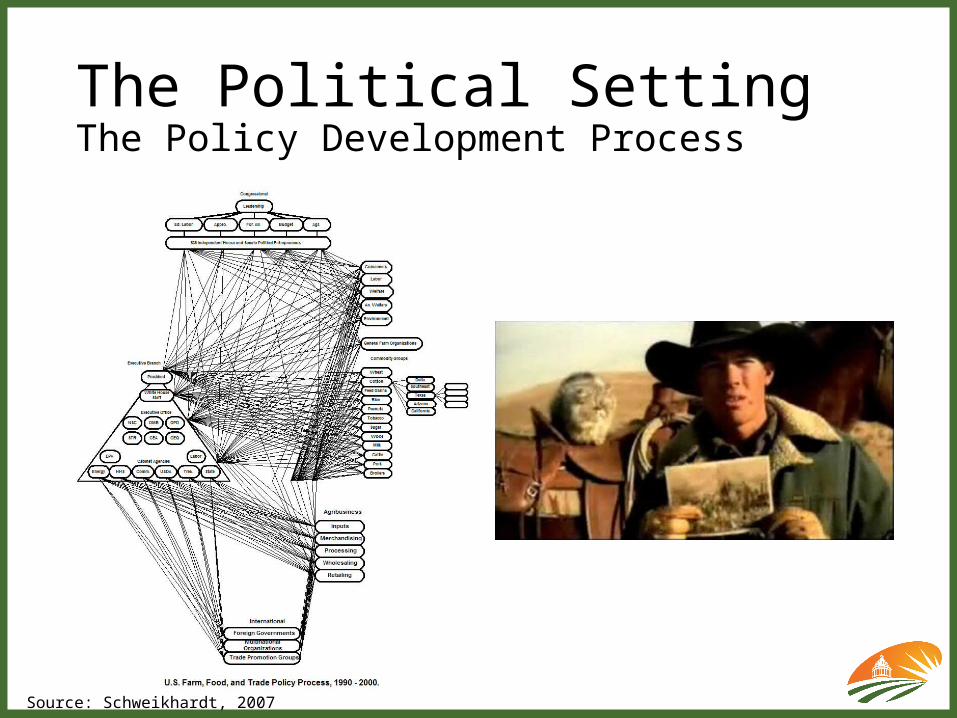
The Political SettingThe Policy Development Process
Source: Schweikhardt, 2007
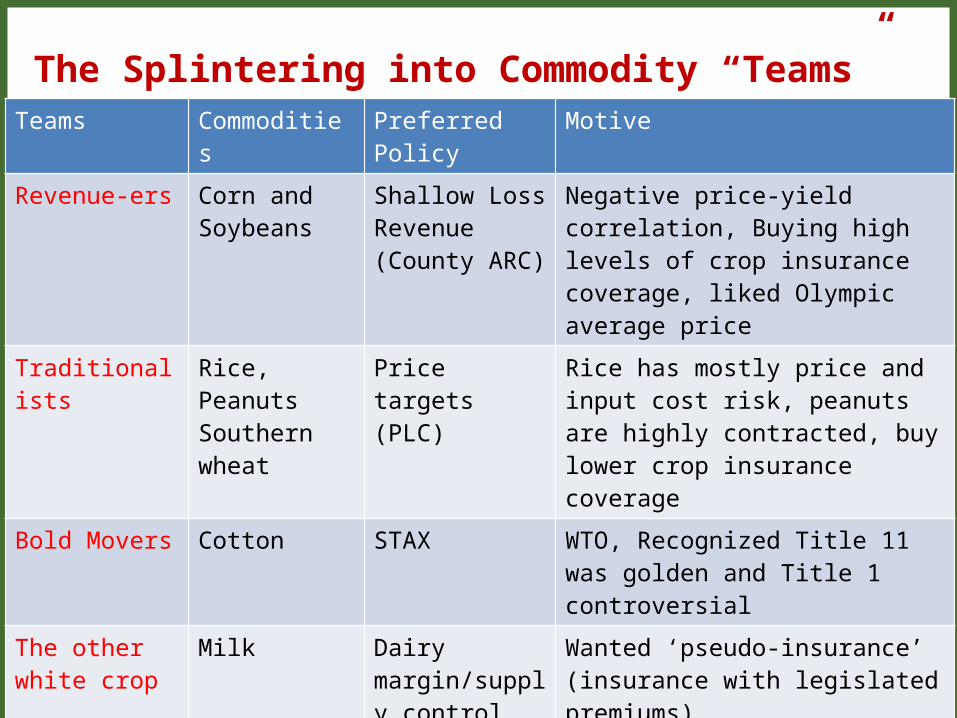
The Splintering into Commodity “Teams”Teams Commodities Preferred Policy Motive
Revenue-ers Corn and Soybeans
Shallow Loss Revenue (County ARC)
Negative price-yield correlation, Buying high levels of crop insurance coverage, liked Olympic average price
Traditionalists Rice, Peanuts Southern wheat
Price targets (PLC)
Rice has mostly price and input cost risk, peanuts are highly contracted, buy lower crop insurance coverage
Bold Movers Cotton STAX WTO, Recognized Title 11 was golden and Title 1 controversial
The other white crop
Milk Dairy margin/supply control
Wanted ‘pseudo-insurance’ (insurance with legislated premiums)
Big County Crowd
Mountain State wheat
Individual ARC Perceived county triggered programs will not work in large counties
Wallflowers Sugar Status quo It is good to not score at CBO

The Non-commodity “Teams”Teams Preferred Policy MotiveEnvironmental Dealers
Conservation compliance
Pragmatic get your foot in the door on insurance
Environmental No-dealers
Reduce Title 1 and 11
Throw a bomb in the room
The Tea Party-Heritage faction
Reduce Title 1 and 11
Throw a bomb in the room
The traditional “Foodie”
Support SNAP, WIC, School Lunch
Assist the poor
The Neo-Foodie Local food, GMOs, specialty crops, animal welfare
Assist the up-scale consumer
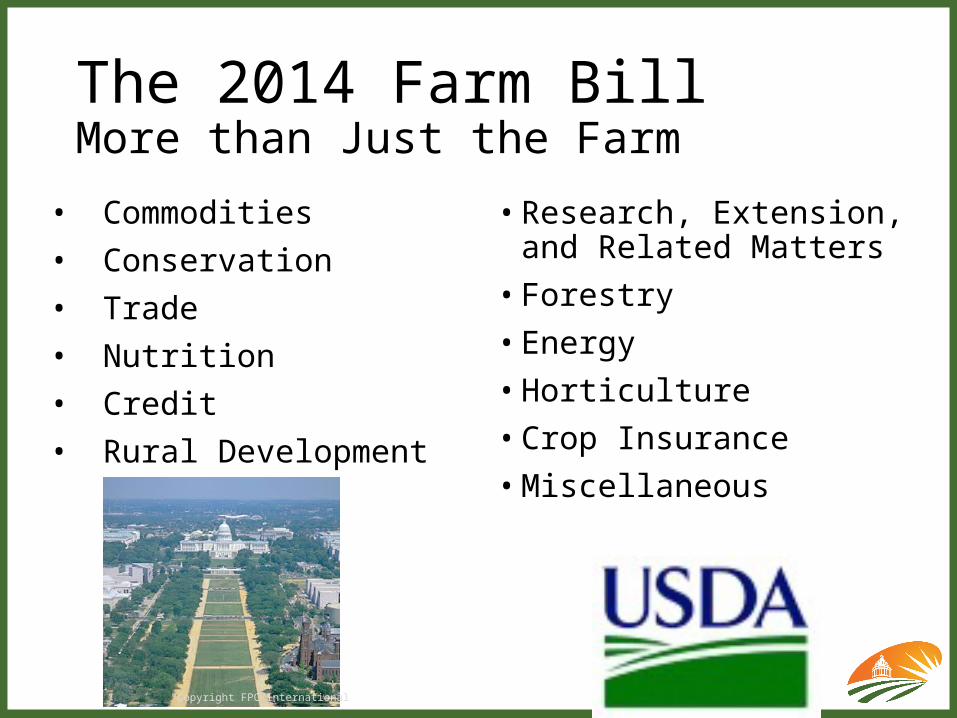
The 2014 Farm BillMore than Just the Farm
• Research, Extension, and Related Matters
• Forestry• Energy• Horticulture• Crop Insurance• Miscellaneous
• Commodities• Conservation• Trade• Nutrition• Credit• Rural Development
Copyright FPC International

Farm Bill Budget
AreaOriginal
2014-2023 Baseline
Senate Proposal
(S954)
House Proposal(HR1947/
3102)
Agricultural Act of 2014(HR2642)*
($ billions) (change in $ billions)
(change in$ billions)
(change in$ billions) ($ billions)
Commodities $58.8 -$17.4 -$18.7 -$14.3 $44.5
Crop Insurance $84.1 +$5.0 +$8.9 +$5.7 $89.8
Conservation $61.6 -$3.5 -$4.8 -$4.0 $57.6
Nutrition (SNAP) $764 -$3.9 -$39.0 -$8.0 $756
Other Titles $4.0 +$1.9 +1.7 +$4.1 $8.1
Total $973 -$17.9 -$51.9 -$16.5 $956
* HR 2642, the “Agricultural Act of 2014” as reported out of Conference on January 27,2014 passed the House on January 29, 2014 by a 251-166 vote, passed the Senate on February 4, 2014 by a 68-32 vote, and was signed by the President on February 7, 2014.
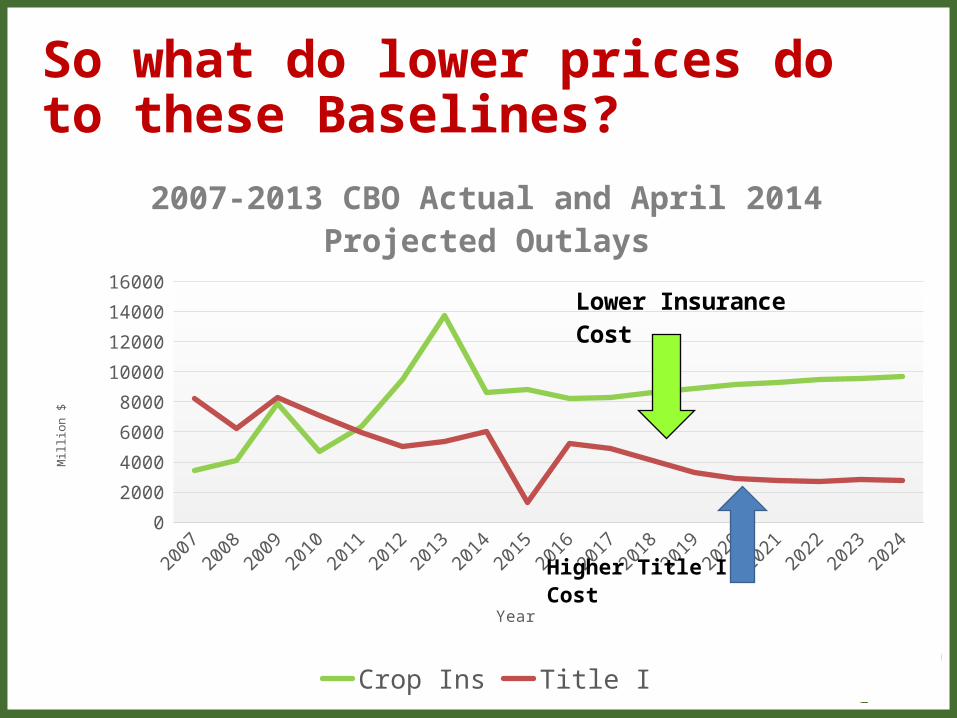
So what do lower prices do to these Baselines?
2007 2008 2009 2010 2011 2012 2013 2014 2015 2016 2017 2018 2019 2020 2021 2022 2023 20240
2000
4000
6000
8000
10000
12000
14000
16000
2007-2013 CBO Actual and April 2014 Projected Out-lays
Crop Ins Title I
Year
Mill
ion
$
Lower Insurance Cost
Higher Title I Cost

Farm Bill Directions
• Farm income safety net has evolved over time• Price support and supply control• Income support tied to price and revenue• Risk management
• Future program components• Crop insurance as the foundation• Revenue safety net or price safety net• Underlying marketing loan• Supplemental crop insurance• Disaster assistance• No direct payments

Farm Bill Details and Decisions• Commodity programs
• ARC-IC vs. ARC-CO vs. PLC
• Base acreage update• Payment yield update• Dairy margin protection
• Crop insurance• SCO• STAX
• Disaster assistance
• Conservation• CRP enrollment/expiration• Voluntary programs• Conservation compliance
for crop insurance• Sodsaver provisions for the
Northern Plains states
• Other programs• Rural development• Horticulture/specialty
crops• Beginning farmer programs