Embed Size (px)
Citation preview

FARM ANTIBIOTIC-USE
DATA IN EUROPE
Cóilín Nunan, Alliance to Save Our Antibiotics

Beginnings of farm antibiotic data
collection in Europe
In 1980, Sweden began publishing annual data on its farm antibiotic use.
In the 1990s, six more European countries (Denmark, Finland, France, Netherlands, Norway and UK) began publishing data on the sales of farm antibiotics.
Even from this small number of countries it was clear that some countries – France, Netherlands and UK –were using far more antibiotics per animal than others –Denmark, Finland, Norway and Sweden.

Limitations of data being collected
1) Most European countries were not collecting any data.
2) Different European countries sometimes used different methodologies for calculating the weight of active ingredient.
3) Most data was sales data, not use data, collected from pharmaceutical companies or veterinary wholesalers. It was not known in which animal species they were being used.
4) In some countries (e.g. UK) the reporting of sales data to the authorities was voluntary and unreliable.
5) Some countries had more pigs, others more cows, others more chickens, etc. How should comparisons be made?

European Surveillance of Veterinary
Antimicrobial Consumption (ESVAC)
In 2011, the European Medicines Agency (EMA) published the first ESVAC report
on the sales of farm antibiotics, using harmonised methodology.
Only 9 countries provided data for first report, but 30 provided data for latest report.

EMA methodology
Sales data are collected in each country, usually from pharmaceutical companies or from veterinary wholesalers. Data is in weight of active ingredient.
Sales-data reporting is now mandatory in 26 of 30 countries, making the data much more reliable.
The EMA introduced a new unit, the “Population Correction Unit” (PCU), for measuring the size of the animal populations.
Same methodology can be used to compare use in veterinary and human medicine.
Human and veterinary antibiotic use and resistance data is now published in Joint Interagency Antimicrobial Consumption and Resistance Analysis (JIACRA) reports.

Population Correction Unit (PCU)
The PCU is a technical unit which estimates the average weight of animals at the time of treatment.
PCU weight is usually less than slaughter weight. The PCU of a chicken is 1kg, whereas weight at slaughter is over 2kg in Europe.
PCU does not cover “minor” species, e.g. goats, ducks, geese, etc.

What does European antibiotic-use
data tell us?
What further data do we need?

Lesson 1
About 65% of antibiotic use in Europe
is in farm animals, not humans!
Varies from just 11-12% in Sweden and Norway,
up to 85-90% in Spain and Cyprus.
(see JIACRA report 2017)

* These five countries have some data missing for human antibiotic use
0
10
20
30
40
50
60
70
80
90
100
Farm antibiotic use as a percentage of total antibiotic use by European country in 2015

Lesson 2
Growth promotion has been banned since 2006,
but group treatments in feed or drinking water still
account for 90% of European farm antibiotic use
There are large differences between countries.
Group treatments in Iceland, Sweden and
Norway are just 5-10% of total use, but about
95% of use in Spain, Cyprus and Hungary.
0
20
40
60
80
100
120
Group treatments as a percentage of total farm antibiotic use by European country, 2016
Data from ESVAC 2018

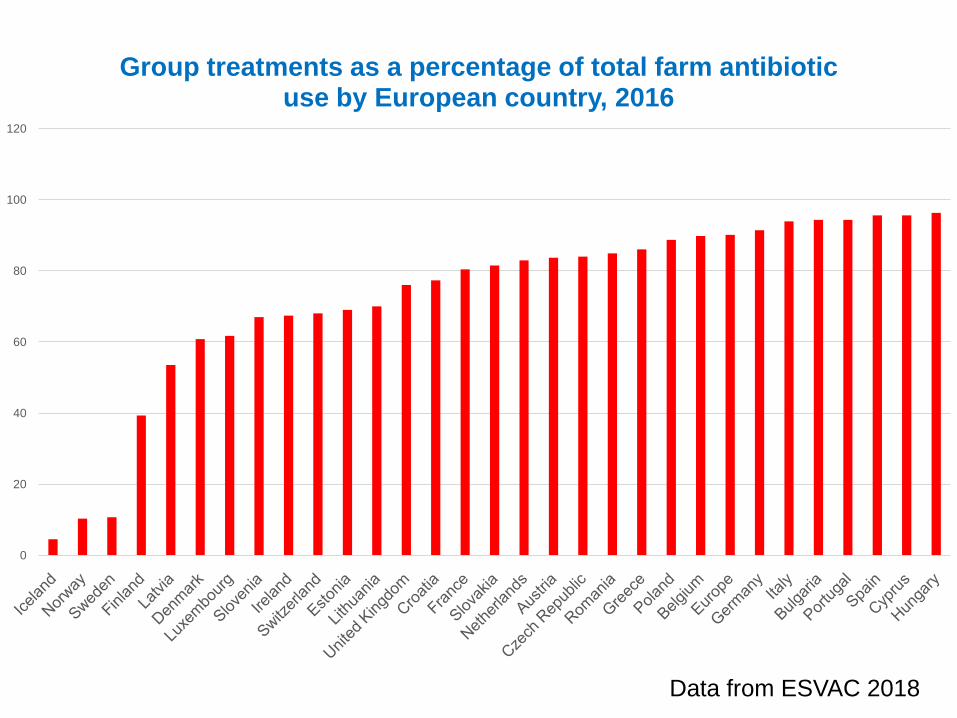
Lesson 3
There are huge differences in usage between
different European countries.
This suggests that some countries are greatly
overusing antibiotics in livestock, and that
there is enormous potential for reducing use.
Countries with stricter regulations and/or less
intensive production have lower use
(e.g. Iceland, Norway and Sweden).

0
20
40
60
80
100
120
140
160
180
200
Human antibiotic use 2014 (mg per kg of biomass)
Median = 118Average = 123.7
Netherlands = 49.9
Romania = 181.7
highest user/lowest user = 3.6
average user/lowest user = 2.5
Data from EU JIACRA report, 2017
0
50
100
150
200
250
300
350
400
450
500
Farm antibiotic sales in Europe 2016 (mg per kg of PCU)
Median = 57
Average = 124.7
average user/lowest users = about 25 – 40
Norway = 2.9
Cyprus = 453.4
highest user/lowest users = about 100 – 150
Data from EU ESVAC report, 2018

Lesson 4
Large differences in antibiotic use between
different European countries have led to large
differences in antibiotic resistance in farm
animals between these countries.

Huge differences in antibiotic resistance of E. coli from pigs 2017
(harmonised Europe-wide testing with 11 antibiotic classes)
ECDC and EFSA 2019

Huge differences in antibiotic resistance of E. coli from chickens
2016 (harmonised Europe-wide testing with 11 antibiotic classes)
ECDC and EFSA 2018

Lesson 5
Resistance to certain antibiotics in some human
infections is statistically significantly related to
farm antibiotic use and not to human antibiotic use.
Example: fluoroquinolone resistance in human
Salmonella and Campylobacter infections.
(see JIACRA report 2017)

European data that is still needed
1) Antibiotic-use data by species.
Denmark, Netherlands, Austria and France have
species data and Sweden and the UK have partial
species data.
EMA wants countries to start collecting species
data, but progress is slow.
2) Antibiotic-use data by farming system,
e.g. intensive, free-range and organic.
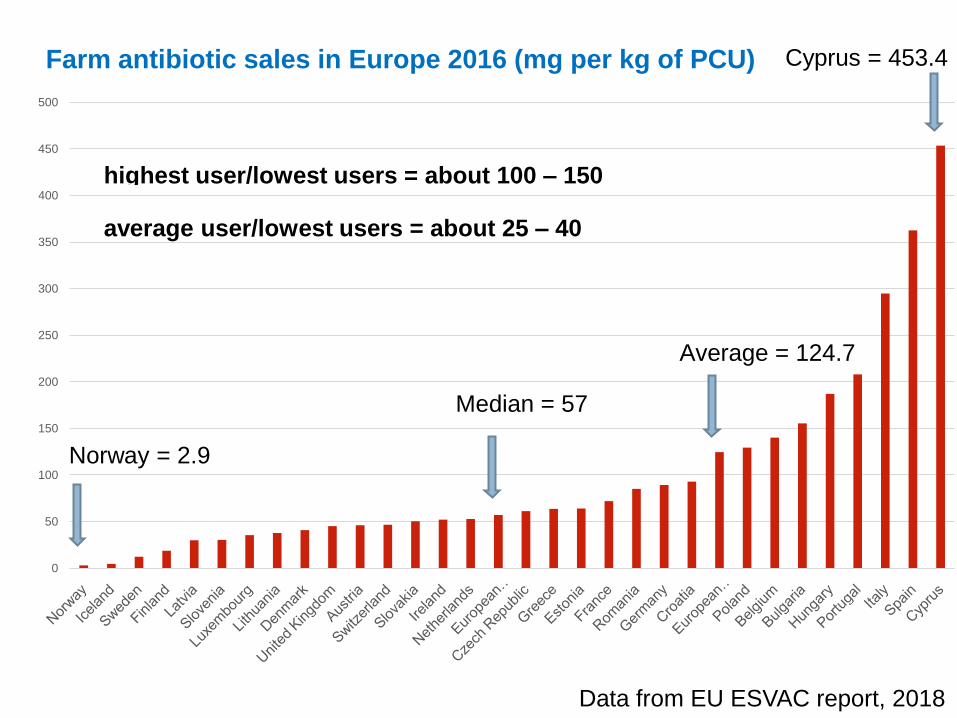
Organic and non-organic pig farms in Denmark
Organic pigs Non-organic pigs Non-organic/organic
ratio
Number of doses per 1,000 animal days
in 2013
Sows and piglets 4.1 23.5 5.7
Weaning piglets 4.6 94.4 20
Slaughter pigs 5.1 18 3.5
All pigs 4.8 51 10.5
Minimum weaning age is much later in organic farming in Europe:
• 21 days minimum for non-organic piglets
• 40 days minimum for organic piglets.

Slower-growing chickens need fewer antibiotics
Growth rate of broilers has quadrupled since 1950s.
Standard broilers are now slaughtered aged 32-40 days.
Most of welfare problems in broilers are caused by genetic factors linked to fast growth (EFSA).
Slower-growing breeds are used for free-range (min 56 days) and organic production (min 81 days).
These breeds are used outdoors because they are less susceptible to disease.
Antibiotic use
Standard broilers 13
Slower-growing broilers
(45-49 days)
4.5
Antibiotic use in Dutch boilers 2017
(daily doses per animal year)
Dutch Animal Health Service data
Slower-growing birds in Netherlands
are also kept with lower stocking density

Antibiotic-use data is helping to cut
European farm antibiotic use
Has exposed large differences in usage between countries, creating pressure on high-using countries to cut their use.
Antibiotic-use data, and particularly species data, enables countries to set targets for reducing use, by sector or even by farm –see e.g. Norway, Netherlands, Denmark, France, UK and Belgium.
More precise data, by species or farming system, can show where use is highest (e.g. after piglets are weaned) and how management can be improved to reduce use.
Antibiotic-use data has shown that banning growth promotion in 2006 did not result in large reductions in use. This is because routine preventative use is still permitted in most of Europe.

New EU legislation
Voted for by over 97% of European Parliament and will come
into force on 28 January 2022.
Will ban purely preventative antibiotic group treatments.
Will restrict all antibiotic treatments, including
metaphylaxis, to non-routine treatments.
Will allow European Commission to establish list of antibiotics
that cannot be used in farming at all.

Some recent cuts in farm antibiotic use in Europe
Europe -20% (2014-16)
Netherlands -68% (2007-17)
Switzerland -64% (2008-17)
France -62% (2007-17)
Germany -57% (2011-17)
UK -40% (2014-17)
Czech Republic -39% (2010-16)
Italy -37% (2010-16)
Farm antibiotic use in Europe is now falling

Animal biomass: an estimate of liveweight of animals slaughtered
plus weight of breeding animals.
OIE Animal Biomass gives larger value than European PCU, which
reduces usage statistics in terms of mg/kg.OIE 2019

Usefulness of OIE data?
OIE does not publish data by country, only regional averages.
European experience shows a regional average can hide
huge differences by country.
Data collection may be very unreliable if carried out on a
voluntary basis. Data collection in most of Europe is now
mandatory and less prone to revisions.
Data is needed by different sectors, so that we can
understand where and why antibiotics are being overused.

Conclusions
Good farm-antibiotic use data helps understand where and why antibiotics are being used in livestock. This can help reduce unnecessary use.
Better data on use by species and by production system is urgently needed.
Less intensive, outdoor production generally has much lower use, but more and better data is needed to show this.
OIE should publish sales data by country.
Countries that have data on their own farm antibiotic use/sales should publish it.