Embed Size (px)
Citation preview
Provided to Sound Transit Board of Directors, July 23, 2015
FARE REVENUE REPORT
Fare Revenue Report 2014
2 | P a g e
Table of Contents
Overview 3
Sound Transit Key Operational Milestones 4
Fare Structure 5
ST Express 5
Sounder 5
Link 6
Tacoma Link 6
Farebox Recovery 7
ST Express 7
Sounder 8
Link 9
Passenger Fare Revenue by Mode 11
ST Express 14
Sounder 19
Link 22
Special Rates of Fare 24
APPENDIX A- Fares by Station 31
Sounder South-Tacoma- Seattle 31
Sounder North-Everett- Seattle 32
Link 32
Fare Revenue Report 2014
3 | P a g e
Overview
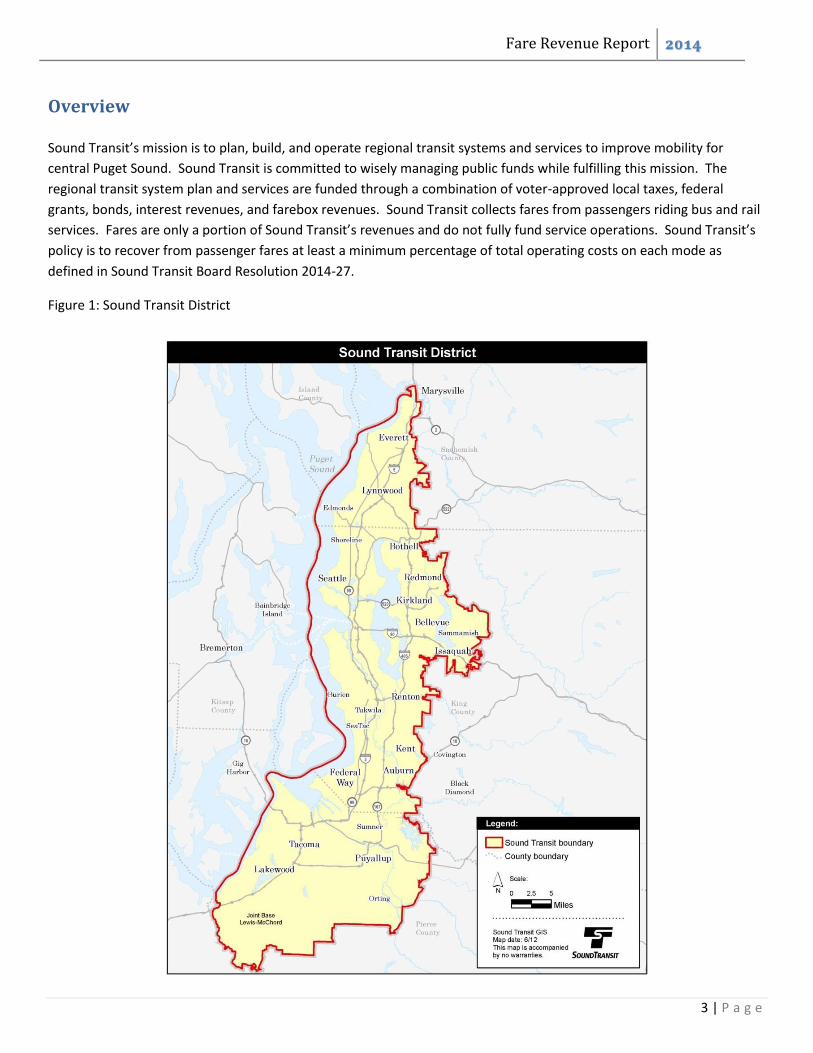
Sound Transit’s mission is to plan, build, and operate regional transit systems and services to improve mobility for
central Puget Sound. Sound Transit is committed to wisely managing public funds while fulfilling this mission. The
regional transit system plan and services are funded through a combination of voter-approved local taxes, federal
grants, bonds, interest revenues, and farebox revenues. Sound Transit collects fares from passengers riding bus and rail
services. Fares are only a portion of Sound Transit’s revenues and do not fully fund service operations. Sound Transit’s
policy is to recover from passenger fares at least a minimum percentage of total operating costs on each mode as
defined in Sound Transit Board Resolution 2014-27.
Figure 1: Sound Transit District
Fare Revenue Report 2014
4 | P a g e
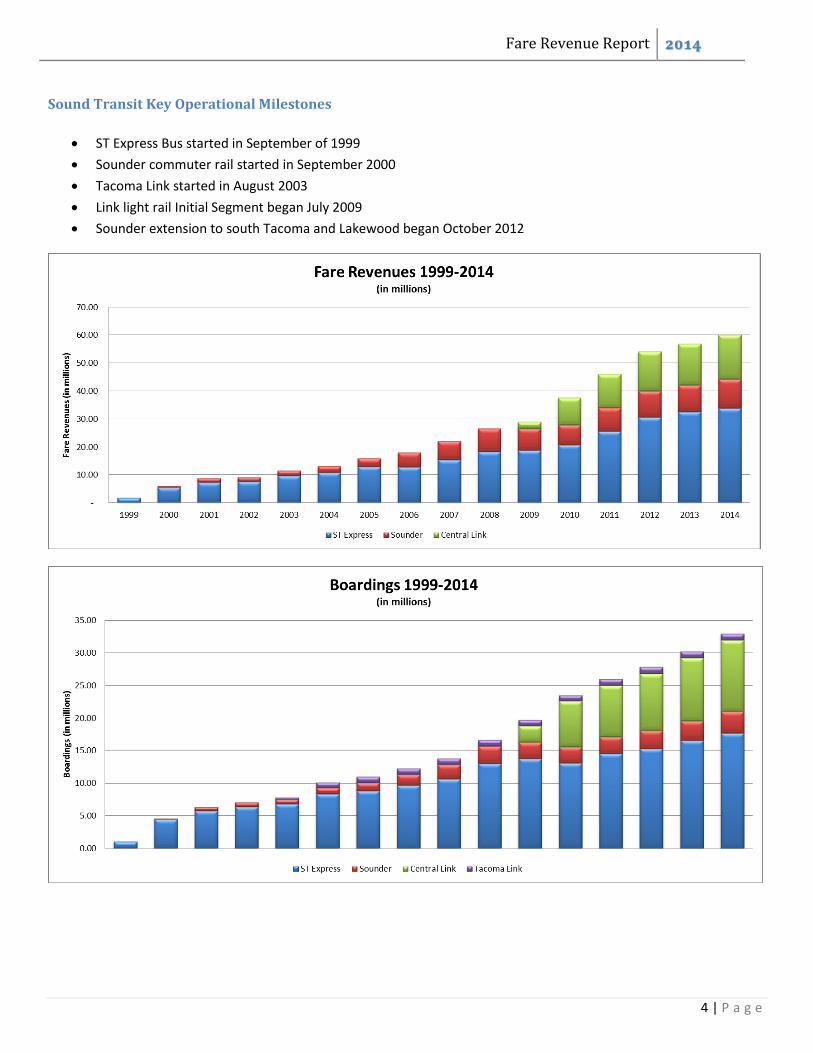
Sound Transit Key Operational Milestones
ST Express Bus started in September of 1999
Sounder commuter rail started in September 2000
Tacoma Link started in August 2003
Link light rail Initial Segment began July 2009
Sounder extension to south Tacoma and Lakewood began October 2012
Fare Revenue Report 2014
5 | P a g e
Fare Structure
Sound Transit’s fare structure varies based on mode of service used, distance travelled and fare category of the rider.
Sound Transit currently supports the following fare categories:
Adult: Customers from 19 to 64 years old Youth: Children 5 years and younger ride for free Children 6 to 18 years old or with a valid high school ID
Reduced Fare: Seniors 65 years or older or persons with disabilities, requires a valid Regional Reduced Fare permit or valid Medicare card as proof of eligibility
In 2014, through Resolution R2014-27 the Sound Transit Board established a new fare “Low Income Adult” category. In Resolution R2014-28, the Board approved a fare change effective March 1, 2015, introducing a low income adult fare to Link light rail while increasing fares for other riders by $0.25
ST Express
ST Express bus provides transportation services throughout Snohomish County, North King County, East King County, South King County, and Pierce County. In Resolution R2010-11, the Sound Transit Board approved a two-part fare rate change and simplification for ST Express service. On June 1, 2010 ST Express bus fares were changed to increase net revenue and to establish a consistent rate for trips crossing a county line with two-zone fares applying only within King County. On June 1, 2011, the second part of the fare change was implemented, simplifying the fare structure to only in-county vs. inter-county trips, increasing the adult multi-county fare by $0.50 and standardizing the one-zone youth and reduced fare to improve consistency with partner agencies. Sound Transit does not incorporate a time of day (peak/off-peak) differential on any service.
ST Express bus fares prior to June 1, 2011:
One-zone Two-zone Inter-county
Adult $2.00 $2.50 $3.00
Youth $1.00 $1.75 $2.50
Reduced Fare $0.75 $1.25 $1.50
ST Express bus fares June 1, 2011- Present:
One-county Multi-county fare (within one county) (across county line)
Adult $2.50 $3.50
Youth $1.25 $2.50
Reduced Fare $0.75 $1.50
Sounder
Sounder commuter rail provides weekday transportation services from Seattle via two service lines. The South Line extends 47.6 miles from Seattle to Lakewood, servicing eight stations in Pierce and South King Counties. The North Line extends 34.2 miles from Seattle to Everett, servicing three stations in Snohomish County. Fares on Sounder are established as a base (minimum) fare of $2.55 plus a distance surcharge of 5.5 cents per mile from King Street Station, rounded to the nearest $0.25. Please see Appendix A for fare charts per station.
Fare Revenue Report 2014
6 | P a g e
North Line South Line
Fare Range Fare Range
Adult $2.75 - $4.50 $2.75 - $5.25
Youth $2.00 - $3.25 $2.00 - $3.75
Reduced Fare $1.25 - $2.25 $1.25 - $2.50
Link
Link light rail currently provides transportation services on a 15.8 mile line between downtown Seattle and the Seattle-Tacoma International Airport, in King County. Fares on Link are established as a base (minimum) fare plus a distance surcharge, rounded to the nearest $0.25. Effective June 1, 2011, Board Resolution R2010-11, approved an adult base fare increase of $0.25 to $2.00 and simplified both youth and reduced fares to a single one-way rate. Please see Appendix A for fares charts per station.
Fare Range
Effective
June 2011
Adult $2.00 - $2.75
Youth $1.25
Reduced Fare $0.75
Tacoma Link
Tacoma Link light rail provides transportation services on a 1.6 mile line in downtown Tacoma between the Tacoma Dome and the Theater District/9th Street. Tacoma Link has operated as a fare free service since the line was completed in 2003 as the cost to collect fares exceeded the projected fare revenue. In September 2013, under resolution R2013-14, the Sound Transit Board established a fare structure on Tacoma Link to be implemented in September 2014. The fare structure included a two part implementation:
September 2014-
August 2016 September 2016
Adult $1.00 $1.50
Youth $0.75 $0.75
Reduced Fare $0.50 $0.75
In May 2014, the Board authorized Motion 2014-36 to delay the September 2014 implementation of fares for two years in lieu of the Tacoma Business Improvement Area providing for the compensation of the net fare revenue of $29,000 for each of the two years. In September 2016, a fare of $1.50 will be implemented on the Tacoma Link service.
Fare Revenue Report 2014
7 | P a g e
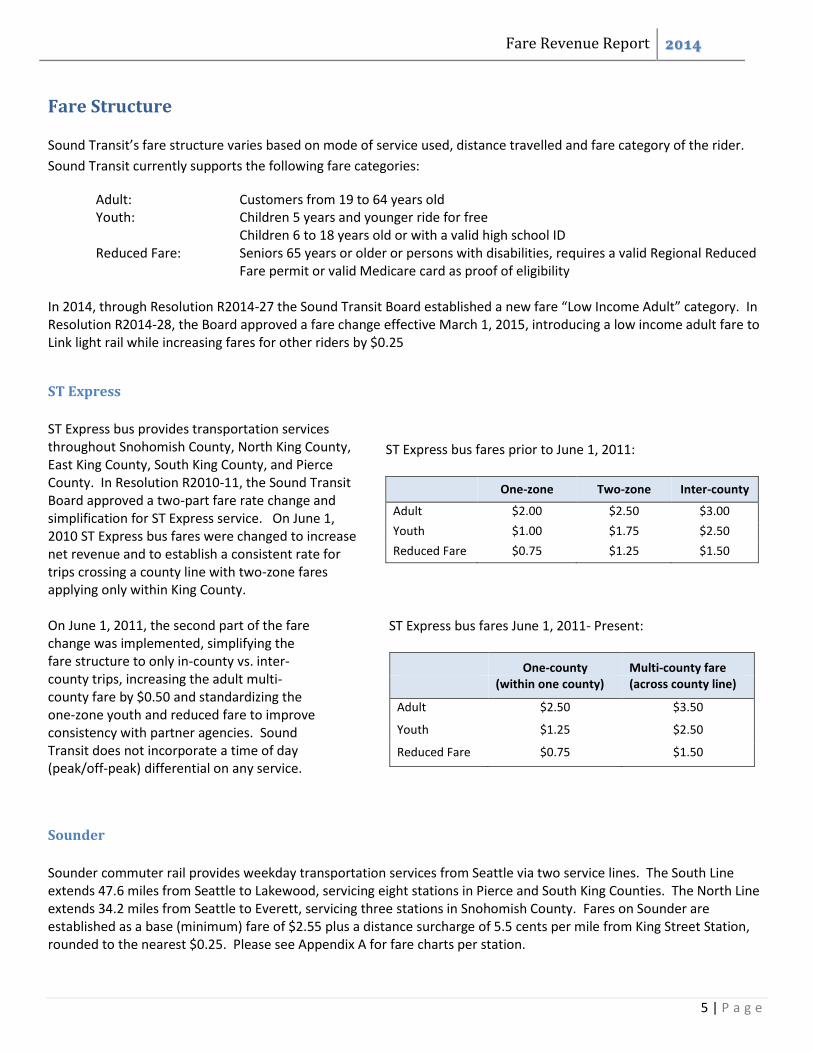
Farebox Recovery
Sound Transit’s policy is to recover from passenger fares at least a minimum percentage of total operating costs on each
mode. Farebox recovery ratios are calculated by dividing fare revenues by direct and indirect service operating costs. It
is the goal of Sound Transit to continuously seek the highest possible farebox recovery ratio while maintaining fares at
levels consistent with fare policy. Consistent with the agency’s financial plan, minimum farebox recovery ratio
thresholds are established as follows:
• ST Express Bus: 20%
• Sounder commuter rail: 23%
• Link light rail: 40%
ST Express
Farebox Operating Farebox
Farebox Recovery Revenues Expenses Recovery
2014 Actuals $ 33,838,556 $ 107,949,541 31.3%
2015 Forecast1 $ 34,719,300 $ 116,785,000 29.7%
2016 Forecast $ 35,796,600 $ 123,272,000 29.0%
Based on the current and forecasted figures for ST Express bus service, a fare change proposal is not required to
maintain minimum farebox recovery ratio for 2015 or 2016.
1 Forecasted revenues based on ridership projections for the proposed 2016 Service Implementation Plan , forecasted operating
expenses based on 2015 Transit Improvement Plan
Fare Revenue Report 2014
8 | P a g e
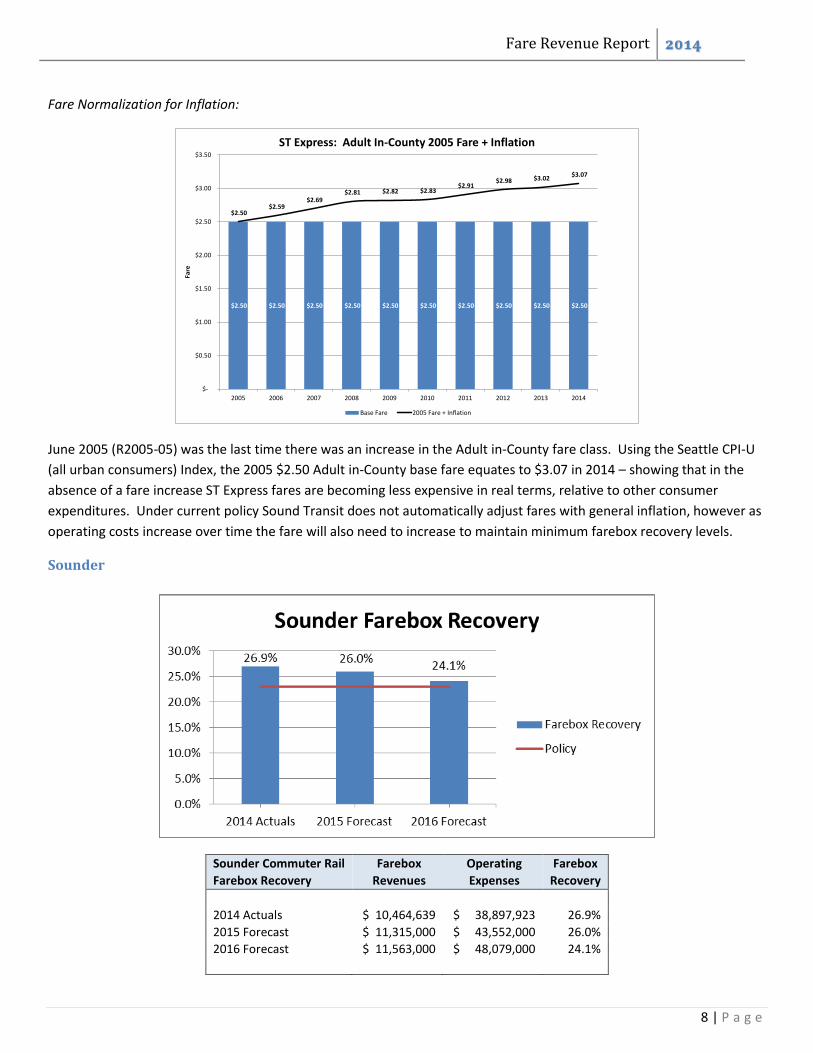
Fare Normalization for Inflation:
June 2005 (R2005-05) was the last time there was an increase in the Adult in-County fare class. Using the Seattle CPI-U
(all urban consumers) Index, the 2005 $2.50 Adult in-County base fare equates to $3.07 in 2014 – showing that in the
absence of a fare increase ST Express fares are becoming less expensive in real terms, relative to other consumer
expenditures. Under current policy Sound Transit does not automatically adjust fares with general inflation, however as
operating costs increase over time the fare will also need to increase to maintain minimum farebox recovery levels.
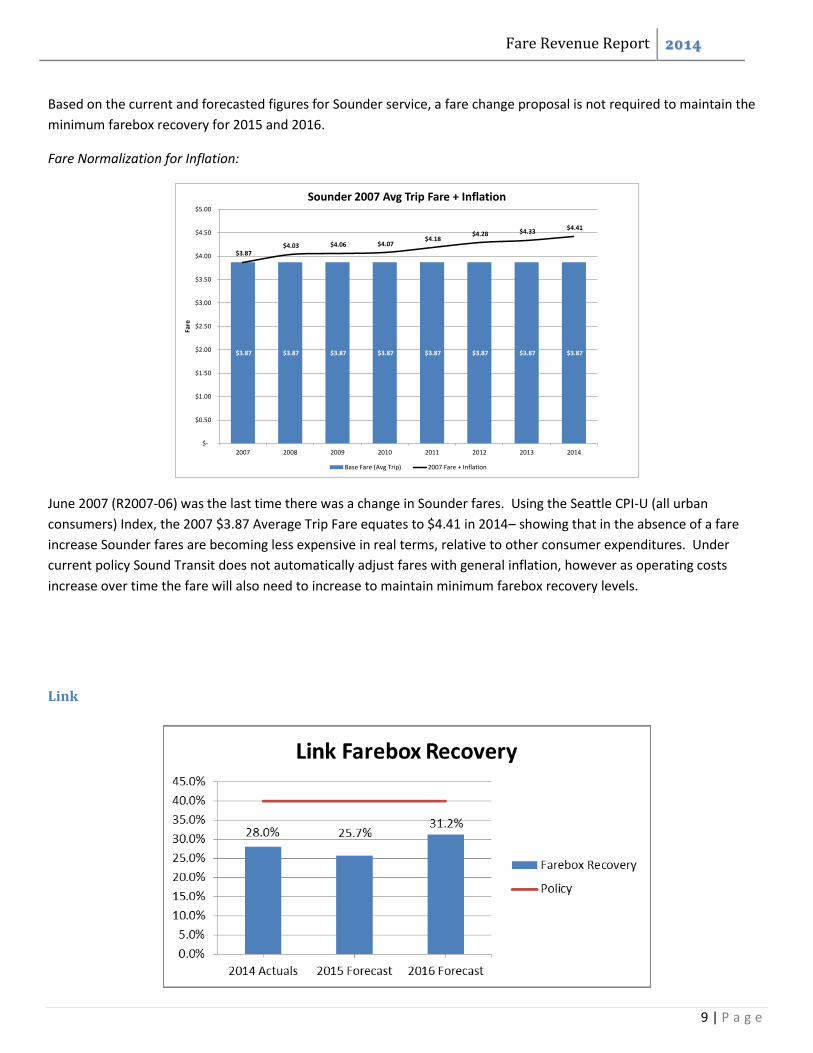
Sounder
Sounder Commuter Rail Farebox Operating Farebox
Farebox Recovery Revenues Expenses Recovery
2014 Actuals $ 10,464,639 $ 38,897,923 26.9%
2015 Forecast $ 11,315,000 $ 43,552,000 26.0%
2016 Forecast $ 11,563,000 $ 48,079,000 24.1%
$2.50 $2.50 $2.50 $2.50 $2.50 $2.50 $2.50 $2.50 $2.50 $2.50
$2.50 $2.59
$2.69 $2.81 $2.82 $2.83
$2.91 $2.98 $3.02
$3.07
$-
$0.50
$1.00
$1.50
$2.00
$2.50
$3.00
$3.50
2005 2006 2007 2008 2009 2010 2011 2012 2013 2014
Fare
ST Express: Adult In-County 2005 Fare + Inflation
Base Fare 2005 Fare + Inflation
Fare Revenue Report 2014
9 | P a g e
Based on the current and forecasted figures for Sounder service, a fare change proposal is not required to maintain the
minimum farebox recovery for 2015 and 2016.
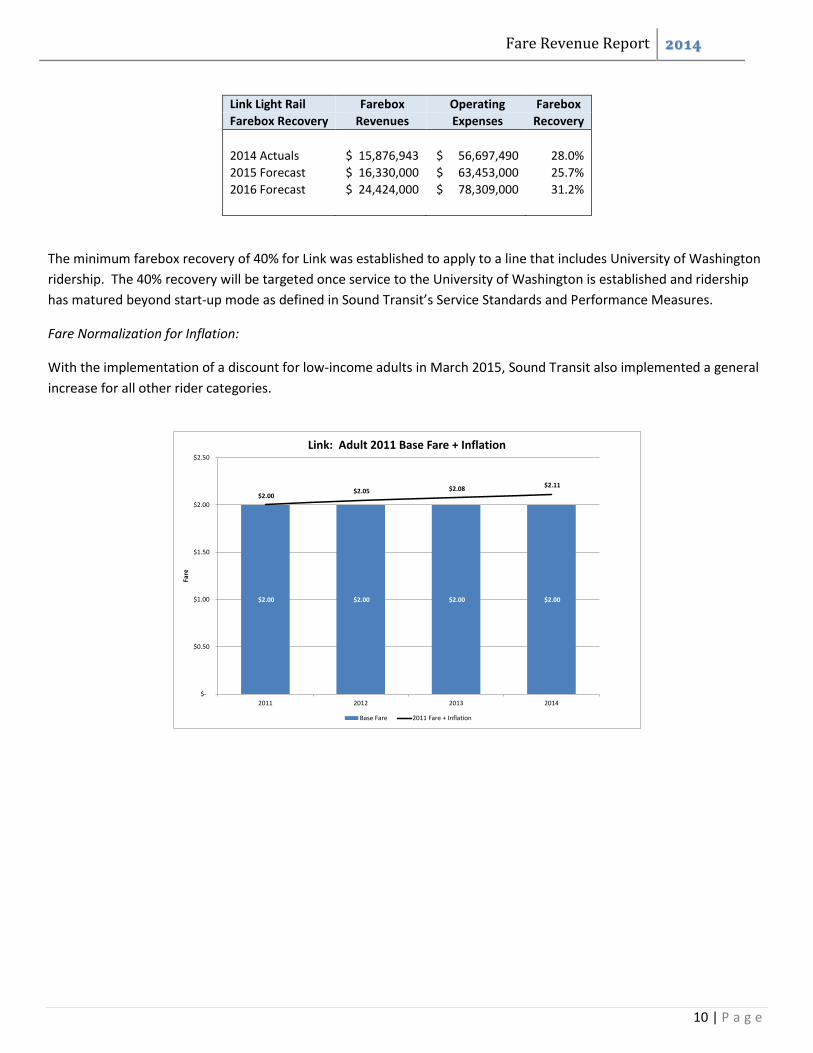
Fare Normalization for Inflation:
June 2007 (R2007-06) was the last time there was a change in Sounder fares. Using the Seattle CPI-U (all urban
consumers) Index, the 2007 $3.87 Average Trip Fare equates to $4.41 in 2014– showing that in the absence of a fare
increase Sounder fares are becoming less expensive in real terms, relative to other consumer expenditures. Under
current policy Sound Transit does not automatically adjust fares with general inflation, however as operating costs
increase over time the fare will also need to increase to maintain minimum farebox recovery levels.
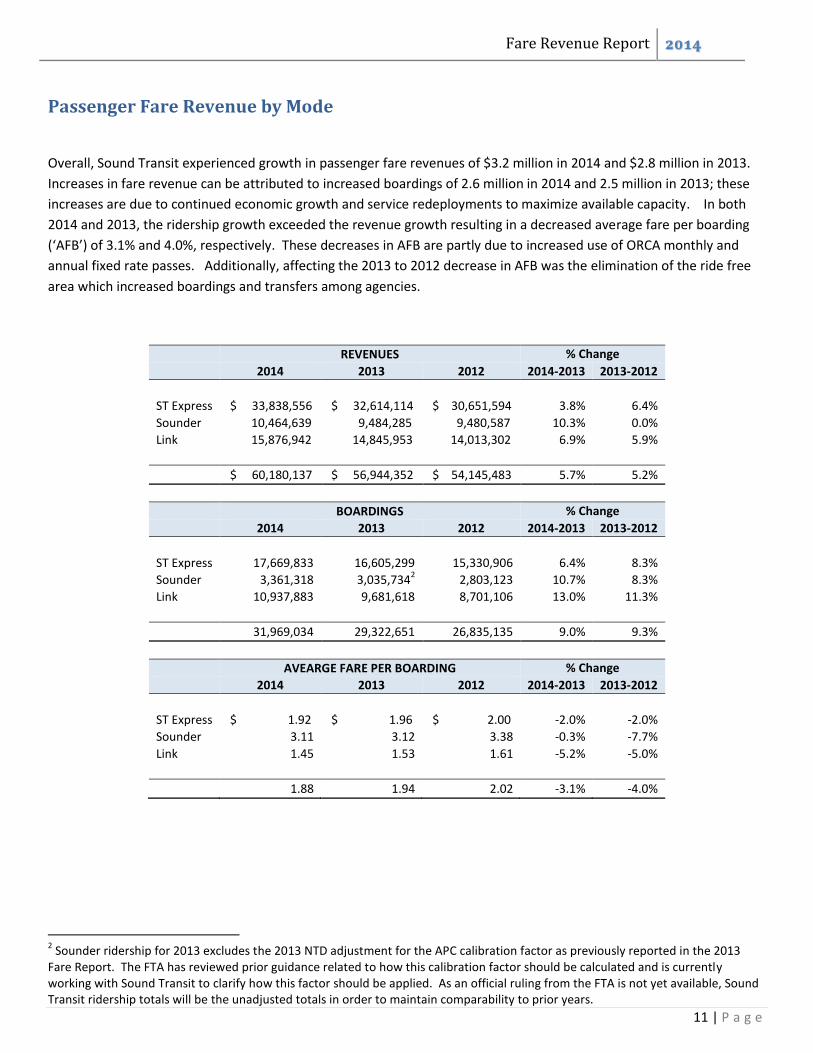
Link
$3.87 $3.87 $3.87 $3.87 $3.87 $3.87 $3.87 $3.87
$3.87 $4.03 $4.06 $4.07
$4.18 $4.28 $4.33
$4.41
$-
$0.50
$1.00
$1.50
$2.00
$2.50
$3.00
$3.50
$4.00
$4.50
$5.00
2007 2008 2009 2010 2011 2012 2013 2014
Fare
Sounder 2007 Avg Trip Fare + Inflation
Base Fare (Avg Trip) 2007 Fare + Inflation
Fare Revenue Report 2014
10 | P a g e
Link Light Rail Farebox Operating Farebox
Farebox Recovery Revenues Expenses Recovery
2014 Actuals $ 15,876,943 $ 56,697,490 28.0%
2015 Forecast $ 16,330,000 $ 63,453,000 25.7%
2016 Forecast $ 24,424,000 $ 78,309,000 31.2%
The minimum farebox recovery of 40% for Link was established to apply to a line that includes University of Washington
ridership. The 40% recovery will be targeted once service to the University of Washington is established and ridership
has matured beyond start-up mode as defined in Sound Transit’s Service Standards and Performance Measures.
Fare Normalization for Inflation:
With the implementation of a discount for low-income adults in March 2015, Sound Transit also implemented a general
increase for all other rider categories.
$2.00 $2.00 $2.00 $2.00
$2.00 $2.05 $2.08
$2.11
$-
$0.50
$1.00
$1.50
$2.00
$2.50
2011 2012 2013 2014
Fare
Link: Adult 2011 Base Fare + Inflation
Base Fare 2011 Fare + Inflation
Fare Revenue Report 2014
11 | P a g e
Passenger Fare Revenue by Mode
Overall, Sound Transit experienced growth in passenger fare revenues of $3.2 million in 2014 and $2.8 million in 2013.
Increases in fare revenue can be attributed to increased boardings of 2.6 million in 2014 and 2.5 million in 2013; these
increases are due to continued economic growth and service redeployments to maximize available capacity. In both
2014 and 2013, the ridership growth exceeded the revenue growth resulting in a decreased average fare per boarding
(‘AFB’) of 3.1% and 4.0%, respectively. These decreases in AFB are partly due to increased use of ORCA monthly and
annual fixed rate passes. Additionally, affecting the 2013 to 2012 decrease in AFB was the elimination of the ride free
area which increased boardings and transfers among agencies.
REVENUES % Change
2014 2013 2012 2014-2013 2013-2012
ST Express $ 33,838,556 $ 32,614,114 $ 30,651,594 3.8% 6.4%
Sounder 10,464,639 9,484,285 9,480,587 10.3% 0.0%
Link 15,876,942 14,845,953 14,013,302 6.9% 5.9%
$ 60,180,137 $ 56,944,352 $ 54,145,483 5.7% 5.2%
BOARDINGS % Change
2014 2013 2012 2014-2013 2013-2012
ST Express 17,669,833 16,605,299 15,330,906 6.4% 8.3%
Sounder 3,361,318 3,035,7342 2,803,123 10.7% 8.3%
Link 10,937,883 9,681,618 8,701,106 13.0% 11.3%
31,969,034 29,322,651 26,835,135 9.0% 9.3%
AVEARGE FARE PER BOARDING % Change
2014 2013 2012 2014-2013 2013-2012
ST Express $ 1.92 $ 1.96 $ 2.00 -2.0% -2.0%
Sounder 3.11 3.12 3.38 -0.3% -7.7%
Link 1.45 1.53 1.61 -5.2% -5.0%
1.88 1.94 2.02 -3.1% -4.0%
2 Sounder ridership for 2013 excludes the 2013 NTD adjustment for the APC calibration factor as previously reported in the 2013
Fare Report. The FTA has reviewed prior guidance related to how this calibration factor should be calculated and is currently working with Sound Transit to clarify how this factor should be applied. As an official ruling from the FTA is not yet available, Sound Transit ridership totals will be the unadjusted totals in order to maintain comparability to prior years.
Fare Revenue Report 2014
12 | P a g e
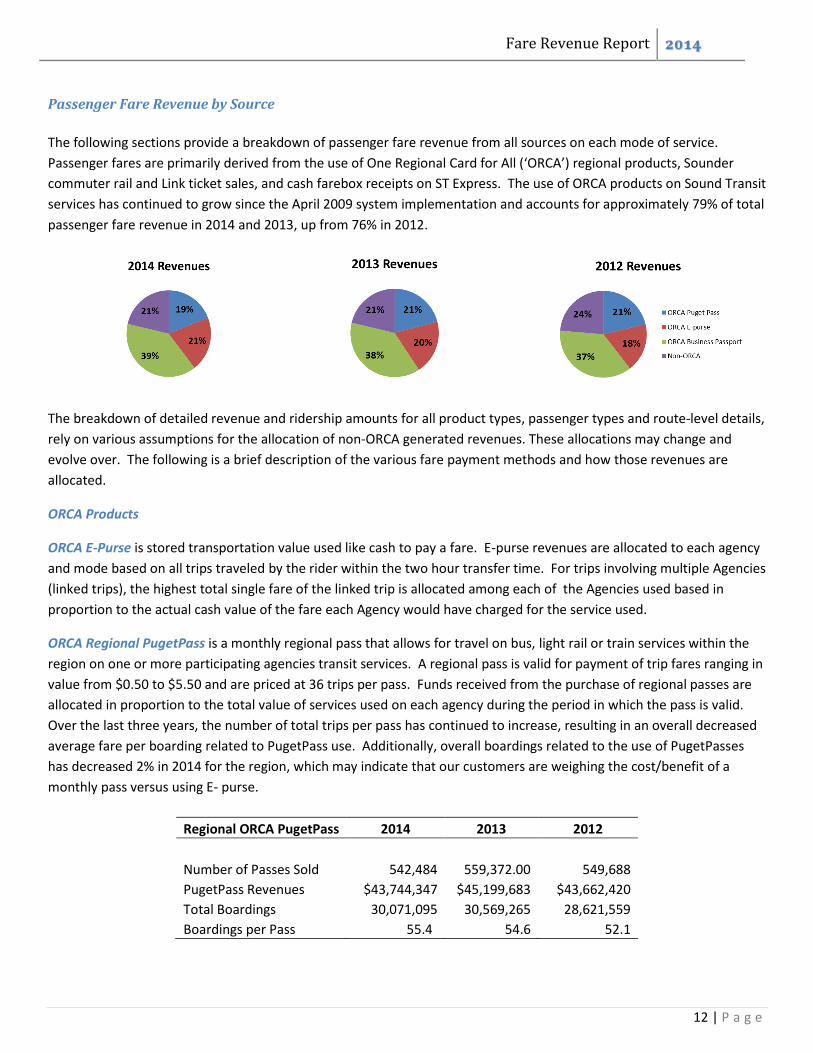
Passenger Fare Revenue by Source
The following sections provide a breakdown of passenger fare revenue from all sources on each mode of service.
Passenger fares are primarily derived from the use of One Regional Card for All (‘ORCA’) regional products, Sounder
commuter rail and Link ticket sales, and cash farebox receipts on ST Express. The use of ORCA products on Sound Transit
services has continued to grow since the April 2009 system implementation and accounts for approximately 79% of total
passenger fare revenue in 2014 and 2013, up from 76% in 2012.
The breakdown of detailed revenue and ridership amounts for all product types, passenger types and route-level details,
rely on various assumptions for the allocation of non-ORCA generated revenues. These allocations may change and
evolve over. The following is a brief description of the various fare payment methods and how those revenues are
allocated.
ORCA Products
ORCA E-Purse is stored transportation value used like cash to pay a fare. E-purse revenues are allocated to each agency
and mode based on all trips traveled by the rider within the two hour transfer time. For trips involving multiple Agencies
(linked trips), the highest total single fare of the linked trip is allocated among each of the Agencies used based in
proportion to the actual cash value of the fare each Agency would have charged for the service used.
ORCA Regional PugetPass is a monthly regional pass that allows for travel on bus, light rail or train services within the
region on one or more participating agencies transit services. A regional pass is valid for payment of trip fares ranging in
value from $0.50 to $5.50 and are priced at 36 trips per pass. Funds received from the purchase of regional passes are
allocated in proportion to the total value of services used on each agency during the period in which the pass is valid.
Over the last three years, the number of total trips per pass has continued to increase, resulting in an overall decreased
average fare per boarding related to PugetPass use. Additionally, overall boardings related to the use of PugetPasses
has decreased 2% in 2014 for the region, which may indicate that our customers are weighing the cost/benefit of a
monthly pass versus using E- purse.
Regional ORCA PugetPass 2014 2013 2012
Number of Passes Sold 542,484 559,372.00 549,688
PugetPass Revenues $43,744,347 $45,199,683 $43,662,420
Total Boardings 30,071,095 30,569,265 28,621,559
Boardings per Pass 55.4 54.6 52.1
Fare Revenue Report 2014
13 | P a g e
ORCA Business Account Program includes either an annual regional pass program, the ORCA “Passport”, or a Business
“Choice” Agreement subject to established program requirements. The Business Choice program offers businesses the
ability to order standard retail products in bulk; these revenues have been allocated in accordance with the rules for e-
purse and regional pass products above. Business Passport programs are annual fixed rate agreements based on the
actual transit usage for a company or a geographical area and are allocated to each Agency based on the annual rate
specific to each agency. Transitioning the annual pre-ORCA employer Flexpass agreements to ORCA products began in
July 2009 and continued through mid-2012 as annual contracts expired. Prior to transitioning to ORCA all revenues and
boardings related to any Flexpass agreement is categorized as ‘Other’.
Per Sound Transit Board policy, Business Passport agreements need to be “priced according to the actual or estimated
use at a level no lower than the fare revenue that would be expected from the pass users as a group if bulk
purchase/distribution program were not in place”. The “fare revenue that would be expected” is established as the
amount of fare revenue historically collected from the group of program participants, based on their transit use before
the Passport program is put into place. This amount is established as the introductory price for the initial Passport
agreement. Since the introduction of Passport programs result in significant increases in transit ridership, the revenues
also increase upon renewal of the Passport contracts, which are priced based on actual recorded ridership during the
prior contract period.
Non-ORCA Products
TVM Tickets are paper tickets sold as a one-way ticket or a round trip/day pass via ticket vending machines (‘TVM’)
located at each of the Link light rail or Sounder commuter rail stations and are good for only the origin and destination
for which the ticket is purchased.
Farebox includes cash and tickets deposited into fareboxes and are specific to ST Express.
Other generally consists of revenues and boardings from non-ORCA fare media such as:
• Flexpasses (pre-ORCA employer pass program) through 2012 only • U-passes (pre-ORCA University of Washington pass program) through 2012 only • Paper tickets such as human services tickets
Other boardings also include unpaid rides including youth age 5 and under, free ride tickets, police officers or estimated fare evasion
With the introduction of ORCA in 2009, the revenues and boardings in this category decreased as the Flexpass and U-
Pass agreements have transitioned to ORCA fare media. In 2013, there are no Flexpass or U-pass revenues included in
Non-ORCA products as all accounts have transitioned to the Business Passport Program.
Fare Revenue Report 2014
14 | P a g e
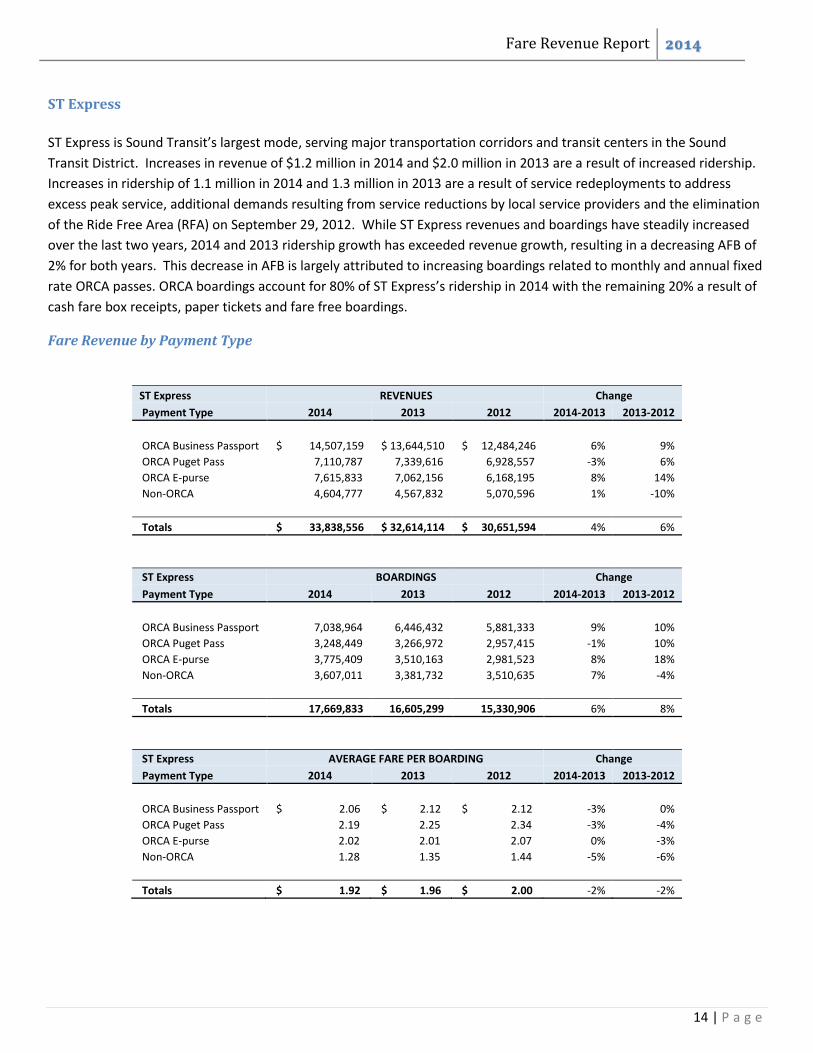
ST Express
ST Express is Sound Transit’s largest mode, serving major transportation corridors and transit centers in the Sound
Transit District. Increases in revenue of $1.2 million in 2014 and $2.0 million in 2013 are a result of increased ridership.
Increases in ridership of 1.1 million in 2014 and 1.3 million in 2013 are a result of service redeployments to address
excess peak service, additional demands resulting from service reductions by local service providers and the elimination
of the Ride Free Area (RFA) on September 29, 2012. While ST Express revenues and boardings have steadily increased
over the last two years, 2014 and 2013 ridership growth has exceeded revenue growth, resulting in a decreasing AFB of
2% for both years. This decrease in AFB is largely attributed to increasing boardings related to monthly and annual fixed
rate ORCA passes. ORCA boardings account for 80% of ST Express’s ridership in 2014 with the remaining 20% a result of
cash fare box receipts, paper tickets and fare free boardings.
Fare Revenue by Payment Type
ST Express REVENUES Change
Payment Type 2014 2013 2012 2014-2013 2013-2012
ORCA Business Passport $ 14,507,159 $ 13,644,510 $ 12,484,246 6% 9%
ORCA Puget Pass 7,110,787 7,339,616 6,928,557 -3% 6%
ORCA E-purse 7,615,833 7,062,156 6,168,195 8% 14%
Non-ORCA 4,604,777 4,567,832 5,070,596 1% -10%
Totals $ 33,838,556 $ 32,614,114 $ 30,651,594 4% 6%
ST Express BOARDINGS Change
Payment Type 2014 2013 2012 2014-2013 2013-2012
ORCA Business Passport 7,038,964 6,446,432 5,881,333 9% 10%
ORCA Puget Pass 3,248,449 3,266,972 2,957,415 -1% 10%
ORCA E-purse 3,775,409 3,510,163 2,981,523 8% 18%
Non-ORCA 3,607,011 3,381,732 3,510,635 7% -4%
Totals 17,669,833 16,605,299 15,330,906 6% 8%
ST Express AVERAGE FARE PER BOARDING Change
Payment Type 2014 2013 2012 2014-2013 2013-2012
ORCA Business Passport $ 2.06 $ 2.12 $ 2.12 -3% 0%
ORCA Puget Pass 2.19 2.25 2.34 -3% -4%
ORCA E-purse 2.02 2.01 2.07 0% -3%
Non-ORCA 1.28 1.35 1.44 -5% -6%
Totals $ 1.92 $ 1.96 $ 2.00 -2% -2%
Fare Revenue Report 2014
15 | P a g e
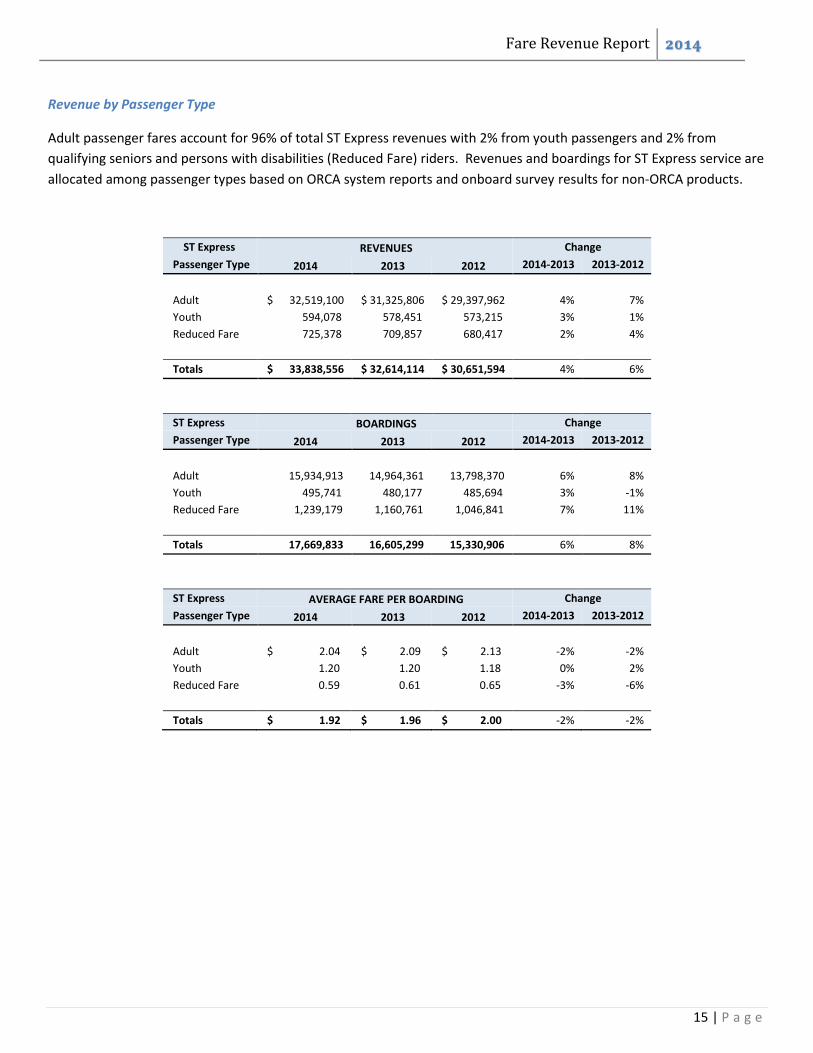
Revenue by Passenger Type
Adult passenger fares account for 96% of total ST Express revenues with 2% from youth passengers and 2% from
qualifying seniors and persons with disabilities (Reduced Fare) riders. Revenues and boardings for ST Express service are
allocated among passenger types based on ORCA system reports and onboard survey results for non-ORCA products.
ST Express REVENUES Change
Passenger Type 2014 2013 2012 2014-2013 2013-2012
Adult $ 32,519,100 $ 31,325,806 $ 29,397,962 4% 7%
Youth 594,078 578,451 573,215 3% 1%
Reduced Fare 725,378 709,857 680,417 2% 4%
Totals $ 33,838,556 $ 32,614,114 $ 30,651,594 4% 6%
ST Express BOARDINGS Change
Passenger Type 2014 2013 2012 2014-2013 2013-2012
Adult 15,934,913 14,964,361 13,798,370 6% 8%
Youth 495,741 480,177 485,694 3% -1%
Reduced Fare 1,239,179 1,160,761 1,046,841 7% 11%
Totals 17,669,833 16,605,299 15,330,906 6% 8%
ST Express AVERAGE FARE PER BOARDING Change
Passenger Type 2014 2013 2012 2014-2013 2013-2012
Adult $ 2.04 $ 2.09 $ 2.13 -2% -2%
Youth 1.20 1.20 1.18 0% 2%
Reduced Fare 0.59 0.61 0.65 -3% -6%
Totals $ 1.92 $ 1.96 $ 2.00 -2% -2%
Fare Revenue Report 2014
16 | P a g e
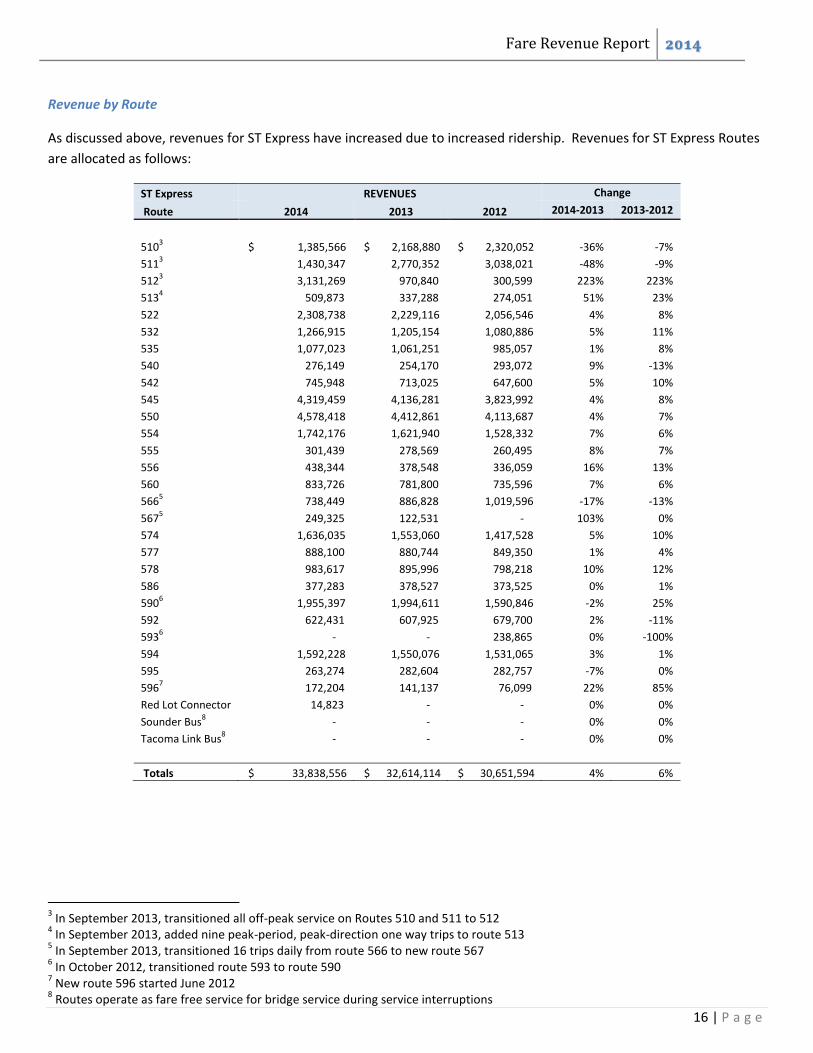
Revenue by Route
As discussed above, revenues for ST Express have increased due to increased ridership. Revenues for ST Express Routes
are allocated as follows:
ST Express REVENUES Change
Route 2014 2013 2012 2014-2013 2013-2012
5103 $ 1,385,566 $ 2,168,880 $ 2,320,052 -36% -7%
5113 1,430,347 2,770,352 3,038,021 -48% -9%
5123 3,131,269 970,840 300,599 223% 223%
5134 509,873 337,288 274,051 51% 23%
522 2,308,738 2,229,116 2,056,546 4% 8%
532 1,266,915 1,205,154 1,080,886 5% 11%
535 1,077,023 1,061,251 985,057 1% 8%
540 276,149 254,170 293,072 9% -13%
542 745,948 713,025 647,600 5% 10%
545 4,319,459 4,136,281 3,823,992 4% 8%
550 4,578,418 4,412,861 4,113,687 4% 7%
554 1,742,176 1,621,940 1,528,332 7% 6%
555 301,439 278,569 260,495 8% 7%
556 438,344 378,548 336,059 16% 13%
560 833,726 781,800 735,596 7% 6%
5665 738,449 886,828 1,019,596 -17% -13%
5675 249,325 122,531 - 103% 0%
574 1,636,035 1,553,060 1,417,528 5% 10%
577 888,100 880,744 849,350 1% 4%
578 983,617 895,996 798,218 10% 12%
586 377,283 378,527 373,525 0% 1%
5906 1,955,397 1,994,611 1,590,846 -2% 25%
592 622,431 607,925 679,700 2% -11%
5936 - - 238,865 0% -100%
594 1,592,228 1,550,076 1,531,065 3% 1%
595 263,274 282,604 282,757 -7% 0%
5967 172,204 141,137 76,099 22% 85%
Red Lot Connector 14,823 - - 0% 0%
Sounder Bus8 - - - 0% 0%
Tacoma Link Bus8 - - - 0% 0%
Totals $ 33,838,556 $ 32,614,114 $ 30,651,594 4% 6%
3 In September 2013, transitioned all off-peak service on Routes 510 and 511 to 512
4 In September 2013, added nine peak-period, peak-direction one way trips to route 513
5 In September 2013, transitioned 16 trips daily from route 566 to new route 567
6 In October 2012, transitioned route 593 to route 590
7 New route 596 started June 2012
8 Routes operate as fare free service for bridge service during service interruptions
Fare Revenue Report 2014
17 | P a g e
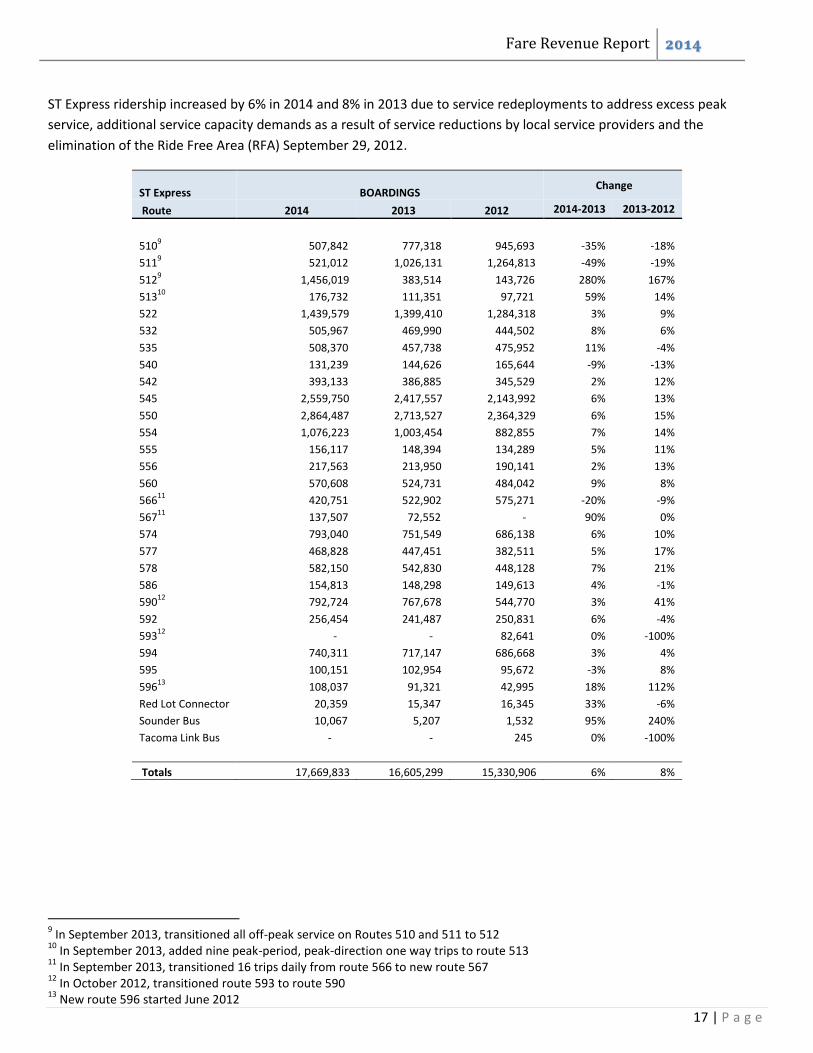
ST Express ridership increased by 6% in 2014 and 8% in 2013 due to service redeployments to address excess peak
service, additional service capacity demands as a result of service reductions by local service providers and the
elimination of the Ride Free Area (RFA) September 29, 2012.
ST Express BOARDINGS
Change
Route 2014 2013 2012 2014-2013 2013-2012
5109 507,842 777,318 945,693 -35% -18%
5119 521,012 1,026,131 1,264,813 -49% -19%
5129 1,456,019 383,514 143,726 280% 167%
51310
176,732 111,351 97,721 59% 14%
522 1,439,579 1,399,410 1,284,318 3% 9%
532 505,967 469,990 444,502 8% 6%
535 508,370 457,738 475,952 11% -4%
540 131,239 144,626 165,644 -9% -13%
542 393,133 386,885 345,529 2% 12%
545 2,559,750 2,417,557 2,143,992 6% 13%
550 2,864,487 2,713,527 2,364,329 6% 15%
554 1,076,223 1,003,454 882,855 7% 14%
555 156,117 148,394 134,289 5% 11%
556 217,563 213,950 190,141 2% 13%
560 570,608 524,731 484,042 9% 8%
56611
420,751 522,902 575,271 -20% -9%
56711
137,507 72,552 - 90% 0%
574 793,040 751,549 686,138 6% 10%
577 468,828 447,451 382,511 5% 17%
578 582,150 542,830 448,128 7% 21%
586 154,813 148,298 149,613 4% -1%
59012
792,724 767,678 544,770 3% 41%
592 256,454 241,487 250,831 6% -4%
59312
- - 82,641 0% -100%
594 740,311 717,147 686,668 3% 4%
595 100,151 102,954 95,672 -3% 8%
59613
108,037 91,321 42,995 18% 112%
Red Lot Connector 20,359 15,347 16,345 33% -6%
Sounder Bus 10,067 5,207 1,532 95% 240%
Tacoma Link Bus - - 245 0% -100%
Totals 17,669,833 16,605,299 15,330,906 6% 8%
9 In September 2013, transitioned all off-peak service on Routes 510 and 511 to 512
10 In September 2013, added nine peak-period, peak-direction one way trips to route 513
11 In September 2013, transitioned 16 trips daily from route 566 to new route 567
12 In October 2012, transitioned route 593 to route 590
13 New route 596 started June 2012
Fare Revenue Report 2014
18 | P a g e
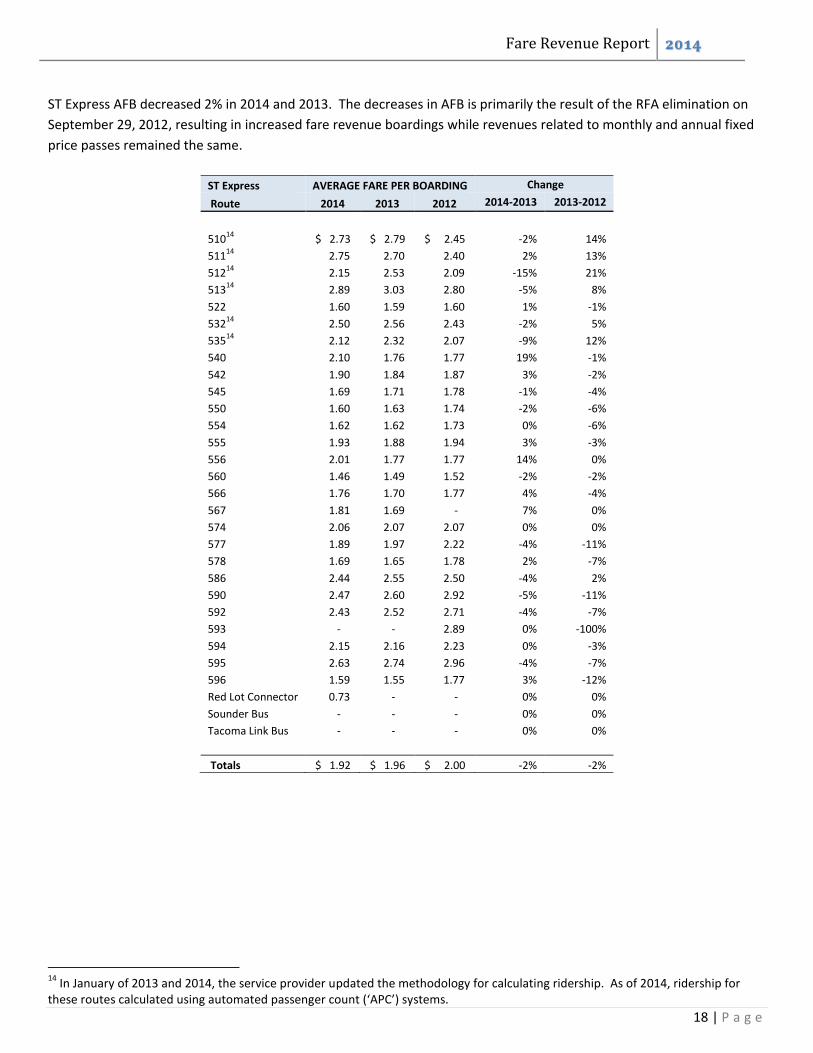
ST Express AFB decreased 2% in 2014 and 2013. The decreases in AFB is primarily the result of the RFA elimination on
September 29, 2012, resulting in increased fare revenue boardings while revenues related to monthly and annual fixed
price passes remained the same.
ST Express AVERAGE FARE PER BOARDING Change
Route 2014 2013 2012 2014-2013 2013-2012
51014
$ 2.73 $ 2.79 $ 2.45 -2% 14%
51114
2.75 2.70 2.40 2% 13%
51214
2.15 2.53 2.09 -15% 21%
51314
2.89 3.03 2.80 -5% 8%
522 1.60 1.59 1.60 1% -1%
53214
2.50 2.56 2.43 -2% 5%
53514
2.12 2.32 2.07 -9% 12%
540 2.10 1.76 1.77 19% -1%
542 1.90 1.84 1.87 3% -2%
545 1.69 1.71 1.78 -1% -4%
550 1.60 1.63 1.74 -2% -6%
554 1.62 1.62 1.73 0% -6%
555 1.93 1.88 1.94 3% -3%
556 2.01 1.77 1.77 14% 0%
560 1.46 1.49 1.52 -2% -2%
566 1.76 1.70 1.77 4% -4%
567 1.81 1.69 - 7% 0%
574 2.06 2.07 2.07 0% 0%
577 1.89 1.97 2.22 -4% -11%
578 1.69 1.65 1.78 2% -7%
586 2.44 2.55 2.50 -4% 2%
590 2.47 2.60 2.92 -5% -11%
592 2.43 2.52 2.71 -4% -7%
593 - - 2.89 0% -100%
594 2.15 2.16 2.23 0% -3%
595 2.63 2.74 2.96 -4% -7%
596 1.59 1.55 1.77 3% -12%
Red Lot Connector 0.73 - - 0% 0%
Sounder Bus - - - 0% 0%
Tacoma Link Bus - - - 0% 0%
Totals $ 1.92 $ 1.96 $ 2.00 -2% -2%
14
In January of 2013 and 2014, the service provider updated the methodology for calculating ridership. As of 2014, ridership for these routes calculated using automated passenger count (‘APC’) systems.
Fare Revenue Report 2014
19 | P a g e
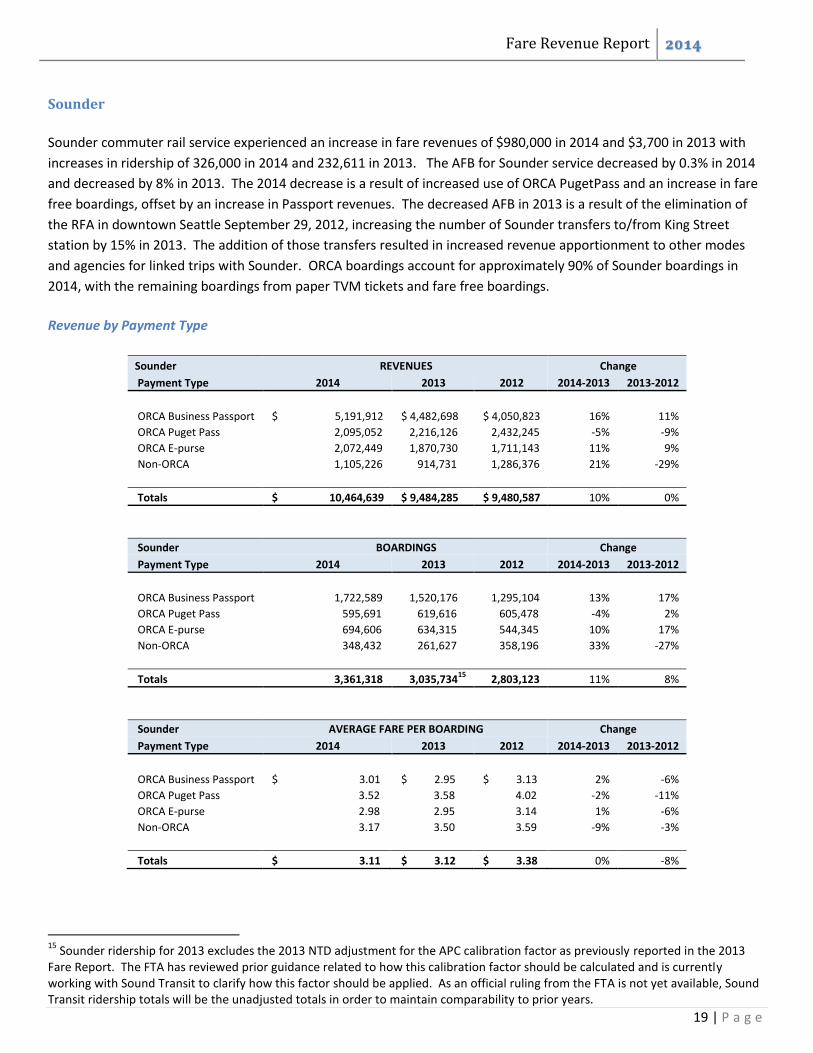
Sounder
Sounder commuter rail service experienced an increase in fare revenues of $980,000 in 2014 and $3,700 in 2013 with
increases in ridership of 326,000 in 2014 and 232,611 in 2013. The AFB for Sounder service decreased by 0.3% in 2014
and decreased by 8% in 2013. The 2014 decrease is a result of increased use of ORCA PugetPass and an increase in fare
free boardings, offset by an increase in Passport revenues. The decreased AFB in 2013 is a result of the elimination of
the RFA in downtown Seattle September 29, 2012, increasing the number of Sounder transfers to/from King Street
station by 15% in 2013. The addition of those transfers resulted in increased revenue apportionment to other modes
and agencies for linked trips with Sounder. ORCA boardings account for approximately 90% of Sounder boardings in
2014, with the remaining boardings from paper TVM tickets and fare free boardings.
Revenue by Payment Type
Sounder REVENUES Change
Payment Type 2014 2013 2012 2014-2013 2013-2012
ORCA Business Passport $ 5,191,912 $ 4,482,698 $ 4,050,823 16% 11%
ORCA Puget Pass 2,095,052 2,216,126 2,432,245 -5% -9%
ORCA E-purse 2,072,449 1,870,730 1,711,143 11% 9%
Non-ORCA 1,105,226 914,731 1,286,376 21% -29%
Totals $ 10,464,639 $ 9,484,285 $ 9,480,587 10% 0%
Sounder BOARDINGS Change
Payment Type 2014 2013 2012 2014-2013 2013-2012
ORCA Business Passport 1,722,589 1,520,176 1,295,104 13% 17%
ORCA Puget Pass 595,691 619,616 605,478 -4% 2%
ORCA E-purse 694,606 634,315 544,345 10% 17%
Non-ORCA 348,432 261,627 358,196 33% -27%
Totals 3,361,318 3,035,73415
2,803,123 11% 8%
Sounder AVERAGE FARE PER BOARDING Change
Payment Type 2014 2013 2012 2014-2013 2013-2012
ORCA Business Passport $ 3.01 $ 2.95 $ 3.13 2% -6%
ORCA Puget Pass 3.52 3.58 4.02 -2% -11%
ORCA E-purse 2.98 2.95 3.14 1% -6%
Non-ORCA 3.17 3.50 3.59 -9% -3%
Totals $ 3.11 $ 3.12 $ 3.38 0% -8%
15
Sounder ridership for 2013 excludes the 2013 NTD adjustment for the APC calibration factor as previously reported in the 2013 Fare Report. The FTA has reviewed prior guidance related to how this calibration factor should be calculated and is currently working with Sound Transit to clarify how this factor should be applied. As an official ruling from the FTA is not yet available, Sound Transit ridership totals will be the unadjusted totals in order to maintain comparability to prior years.
Fare Revenue Report 2014
20 | P a g e
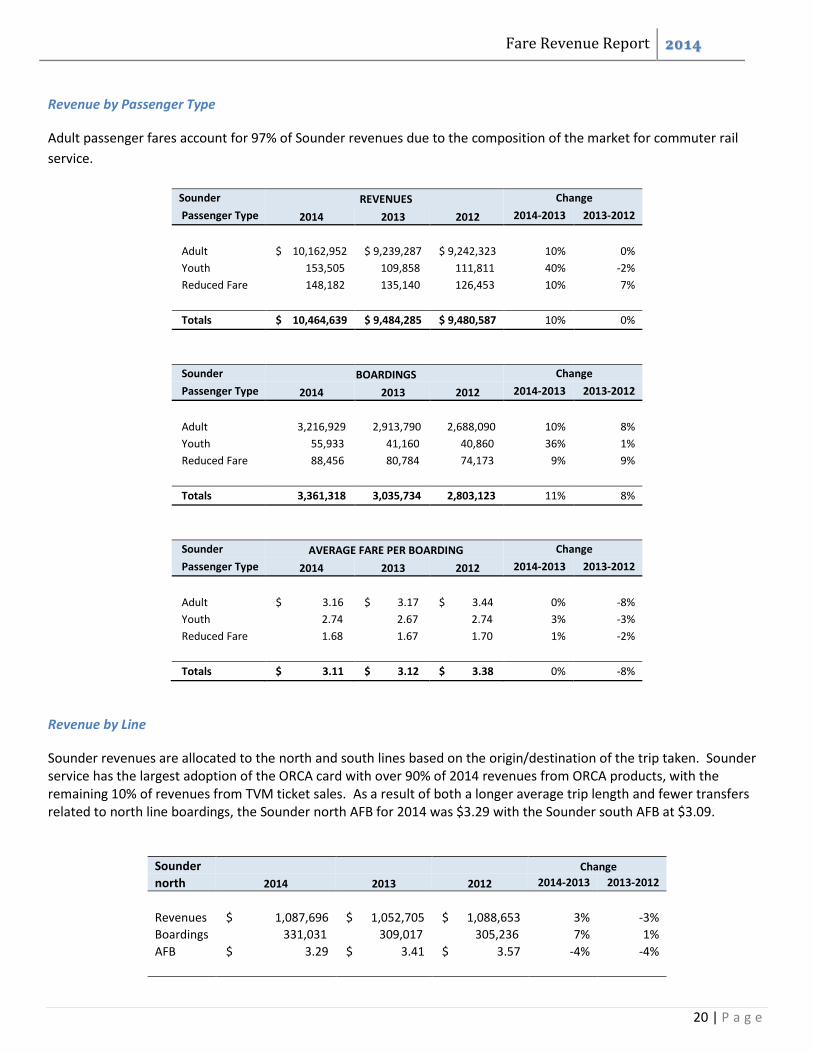
Revenue by Passenger Type
Adult passenger fares account for 97% of Sounder revenues due to the composition of the market for commuter rail
service.
Sounder REVENUES Change
Passenger Type 2014 2013 2012 2014-2013 2013-2012
Adult $ 10,162,952 $ 9,239,287 $ 9,242,323 10% 0%
Youth 153,505 109,858 111,811 40% -2%
Reduced Fare 148,182 135,140 126,453 10% 7%
Totals $ 10,464,639 $ 9,484,285 $ 9,480,587 10% 0%
Sounder BOARDINGS Change
Passenger Type 2014 2013 2012 2014-2013 2013-2012
Adult 3,216,929 2,913,790 2,688,090 10% 8%
Youth 55,933 41,160 40,860 36% 1%
Reduced Fare 88,456 80,784 74,173 9% 9%
Totals 3,361,318 3,035,734 2,803,123 11% 8%
Sounder AVERAGE FARE PER BOARDING Change
Passenger Type 2014 2013 2012 2014-2013 2013-2012
Adult $ 3.16 $ 3.17 $ 3.44 0% -8%
Youth 2.74 2.67 2.74 3% -3%
Reduced Fare 1.68 1.67 1.70 1% -2%
Totals $ 3.11 $ 3.12 $ 3.38 0% -8%
Revenue by Line
Sounder revenues are allocated to the north and south lines based on the origin/destination of the trip taken. Sounder service has the largest adoption of the ORCA card with over 90% of 2014 revenues from ORCA products, with the remaining 10% of revenues from TVM ticket sales. As a result of both a longer average trip length and fewer transfers related to north line boardings, the Sounder north AFB for 2014 was $3.29 with the Sounder south AFB at $3.09.
Sounder Change
north 2014 2013 2012 2014-2013 2013-2012
Revenues $ 1,087,696 $ 1,052,705 $ 1,088,653 3% -3%
Boardings 331,031 309,017 305,236 7% 1%
AFB $ 3.29 $ 3.41 $ 3.57 -4% -4%
Fare Revenue Report 2014
21 | P a g e
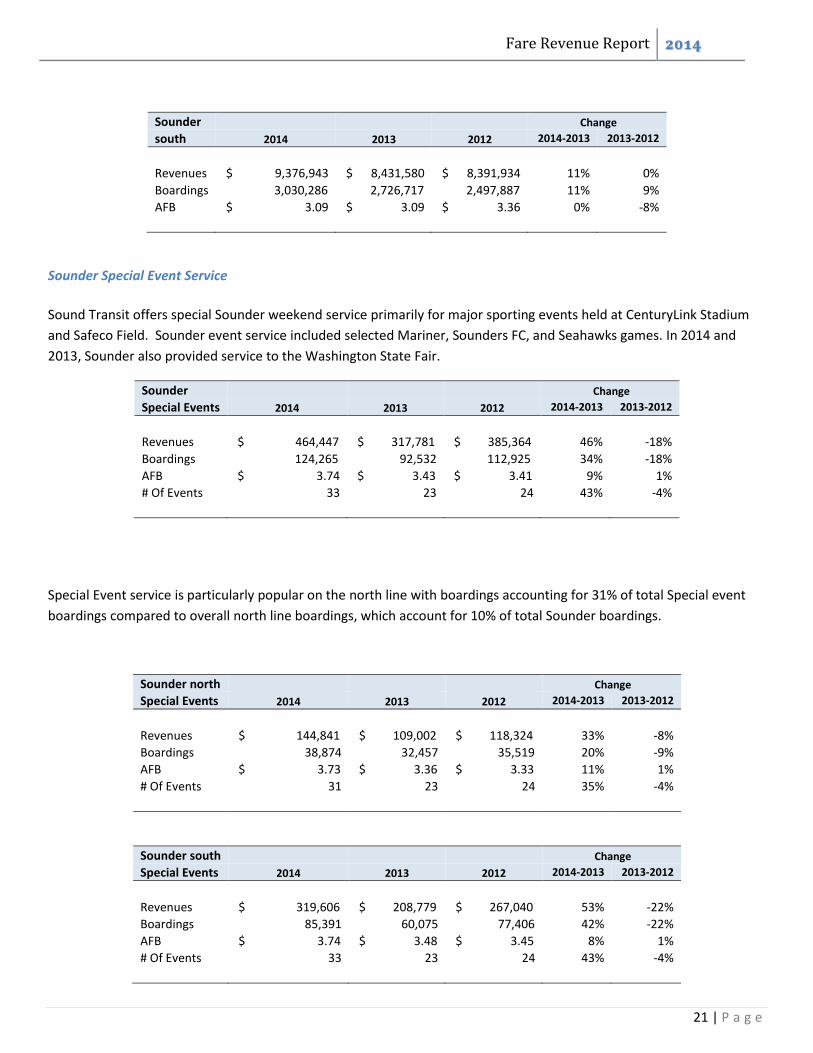
Sounder Change
south 2014 2013 2012 2014-2013 2013-2012
Revenues $ 9,376,943 $ 8,431,580 $ 8,391,934 11% 0%
Boardings 3,030,286 2,726,717 2,497,887 11% 9%
AFB $ 3.09 $ 3.09 $ 3.36 0% -8%
Sounder Special Event Service
Sound Transit offers special Sounder weekend service primarily for major sporting events held at CenturyLink Stadium
and Safeco Field. Sounder event service included selected Mariner, Sounders FC, and Seahawks games. In 2014 and
2013, Sounder also provided service to the Washington State Fair.
Sounder Change
Special Events 2014 2013 2012 2014-2013 2013-2012
Revenues $ 464,447 $ 317,781 $ 385,364 46% -18%
Boardings 124,265 92,532 112,925 34% -18%
AFB $ 3.74 $ 3.43 $ 3.41 9% 1%
# Of Events 33 23 24 43% -4%
Special Event service is particularly popular on the north line with boardings accounting for 31% of total Special event
boardings compared to overall north line boardings, which account for 10% of total Sounder boardings.
Sounder north Change
Special Events 2014 2013 2012 2014-2013 2013-2012
Revenues $ 144,841 $ 109,002 $ 118,324 33% -8%
Boardings 38,874 32,457 35,519 20% -9%
AFB $ 3.73 $ 3.36 $ 3.33 11% 1%
# Of Events 31 23 24 35% -4%
Sounder south Change
Special Events 2014 2013 2012 2014-2013 2013-2012
Revenues $ 319,606 $ 208,779 $ 267,040 53% -22%
Boardings 85,391 60,075 77,406 42% -22%
AFB $ 3.74 $ 3.48 $ 3.45 8% 1%
# Of Events 33 23 24 43% -4%
Fare Revenue Report 2014
22 | P a g e
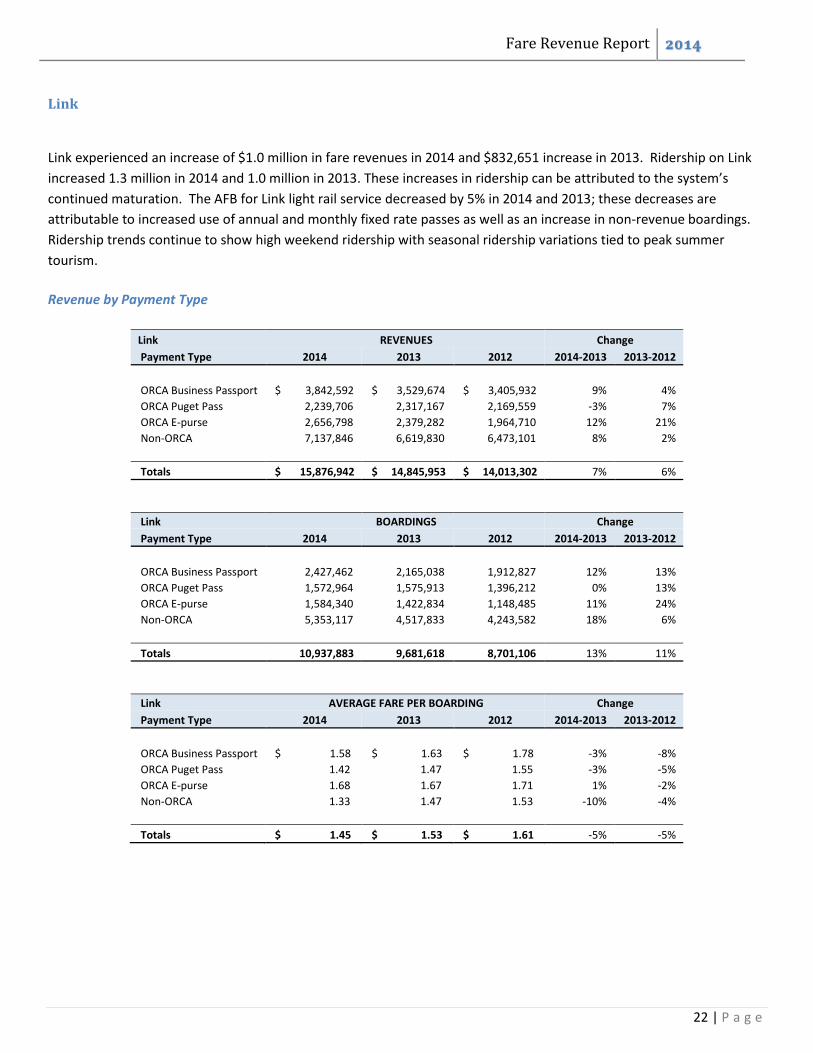
Link
Link experienced an increase of $1.0 million in fare revenues in 2014 and $832,651 increase in 2013. Ridership on Link
increased 1.3 million in 2014 and 1.0 million in 2013. These increases in ridership can be attributed to the system’s
continued maturation. The AFB for Link light rail service decreased by 5% in 2014 and 2013; these decreases are
attributable to increased use of annual and monthly fixed rate passes as well as an increase in non-revenue boardings.
Ridership trends continue to show high weekend ridership with seasonal ridership variations tied to peak summer
tourism.
Revenue by Payment Type
Link REVENUES Change
Payment Type 2014 2013 2012 2014-2013 2013-2012
ORCA Business Passport $ 3,842,592 $ 3,529,674 $ 3,405,932 9% 4%
ORCA Puget Pass 2,239,706 2,317,167 2,169,559 -3% 7%
ORCA E-purse 2,656,798 2,379,282 1,964,710 12% 21%
Non-ORCA 7,137,846 6,619,830 6,473,101 8% 2%
Totals $ 15,876,942 $ 14,845,953 $ 14,013,302 7% 6%
Link BOARDINGS Change
Payment Type 2014 2013 2012 2014-2013 2013-2012
ORCA Business Passport 2,427,462 2,165,038 1,912,827 12% 13%
ORCA Puget Pass 1,572,964 1,575,913 1,396,212 0% 13%
ORCA E-purse 1,584,340 1,422,834 1,148,485 11% 24%
Non-ORCA 5,353,117 4,517,833 4,243,582 18% 6%
Totals 10,937,883 9,681,618 8,701,106 13% 11%
Link AVERAGE FARE PER BOARDING Change
Payment Type 2014 2013 2012 2014-2013 2013-2012
ORCA Business Passport $ 1.58 $ 1.63 $ 1.78 -3% -8%
ORCA Puget Pass 1.42 1.47 1.55 -3% -5%
ORCA E-purse 1.68 1.67 1.71 1% -2%
Non-ORCA 1.33 1.47 1.53 -10% -4%
Totals $ 1.45 $ 1.53 $ 1.61 -5% -5%
Fare Revenue Report 2014
23 | P a g e
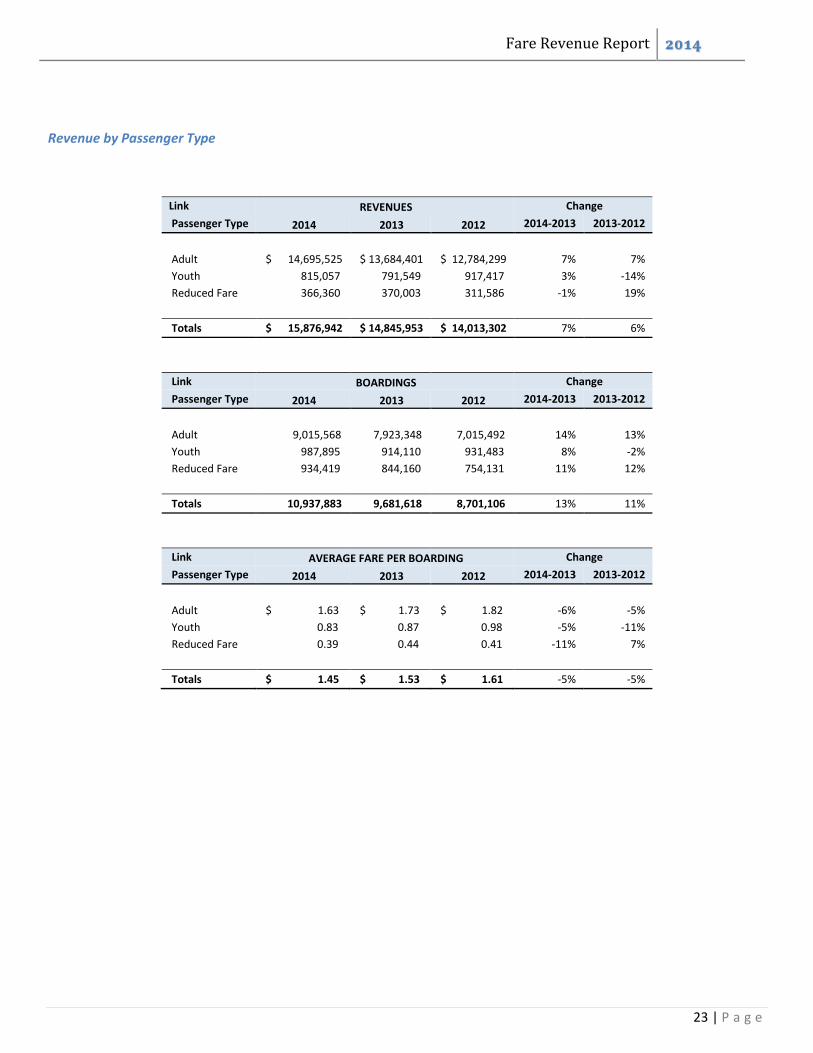
Revenue by Passenger Type
Link REVENUES Change
Passenger Type 2014 2013 2012 2014-2013 2013-2012
Adult $ 14,695,525 $ 13,684,401 $ 12,784,299 7% 7%
Youth 815,057 791,549 917,417 3% -14%
Reduced Fare 366,360 370,003 311,586 -1% 19%
Totals $ 15,876,942 $ 14,845,953 $ 14,013,302 7% 6%
Link BOARDINGS Change
Passenger Type 2014 2013 2012 2014-2013 2013-2012
Adult 9,015,568 7,923,348 7,015,492 14% 13%
Youth 987,895 914,110 931,483 8% -2%
Reduced Fare 934,419 844,160 754,131 11% 12%
Totals 10,937,883 9,681,618 8,701,106 13% 11%
Link AVERAGE FARE PER BOARDING Change
Passenger Type 2014 2013 2012 2014-2013 2013-2012
Adult $ 1.63 $ 1.73 $ 1.82 -6% -5%
Youth 0.83 0.87 0.98 -5% -11%
Reduced Fare 0.39 0.44 0.41 -11% 7%
Totals $ 1.45 $ 1.53 $ 1.61 -5% -5%
Fare Revenue Report 2014
24 | P a g e
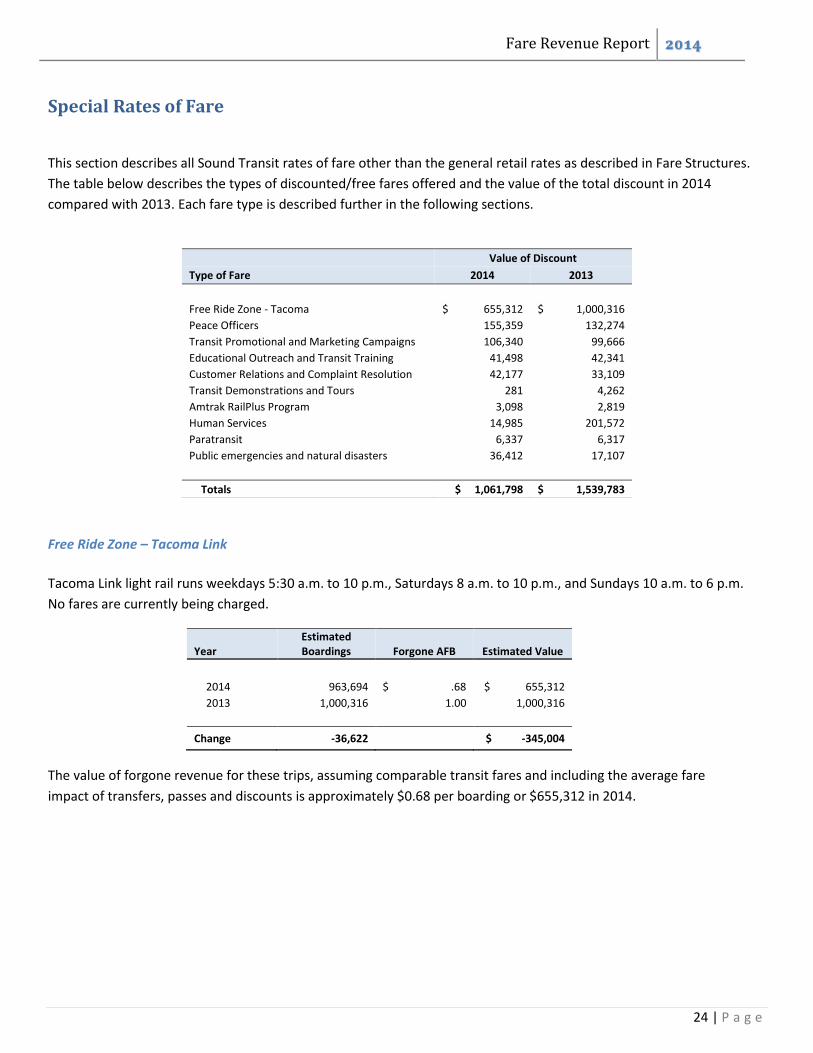
Special Rates of Fare
This section describes all Sound Transit rates of fare other than the general retail rates as described in Fare Structures.
The table below describes the types of discounted/free fares offered and the value of the total discount in 2014
compared with 2013. Each fare type is described further in the following sections.
Free Ride Zone – Tacoma Link
Tacoma Link light rail runs weekdays 5:30 a.m. to 10 p.m., Saturdays 8 a.m. to 10 p.m., and Sundays 10 a.m. to 6 p.m.
No fares are currently being charged.
Year Estimated Boardings Forgone AFB Estimated Value
2014 963,694 $ .68 $ 655,312
2013 1,000,316 1.00 1,000,316
Change -36,622
$ -345,004
The value of forgone revenue for these trips, assuming comparable transit fares and including the average fare
impact of transfers, passes and discounts is approximately $0.68 per boarding or $655,312 in 2014.
Value of Discount
Type of Fare 2014 2013
Free Ride Zone - Tacoma $ 655,312 $ 1,000,316
Peace Officers 155,359 132,274
Transit Promotional and Marketing Campaigns 106,340 99,666
Educational Outreach and Transit Training 41,498 42,341
Customer Relations and Complaint Resolution 42,177 33,109
Transit Demonstrations and Tours 281 4,262
Amtrak RailPlus Program 3,098 2,819
Human Services 14,985 201,572
Paratransit 6,337 6,317
Public emergencies and natural disasters 36,412 17,107
Totals $ 1,061,798 $ 1,539,783
Fare Revenue Report 2014
25 | P a g e
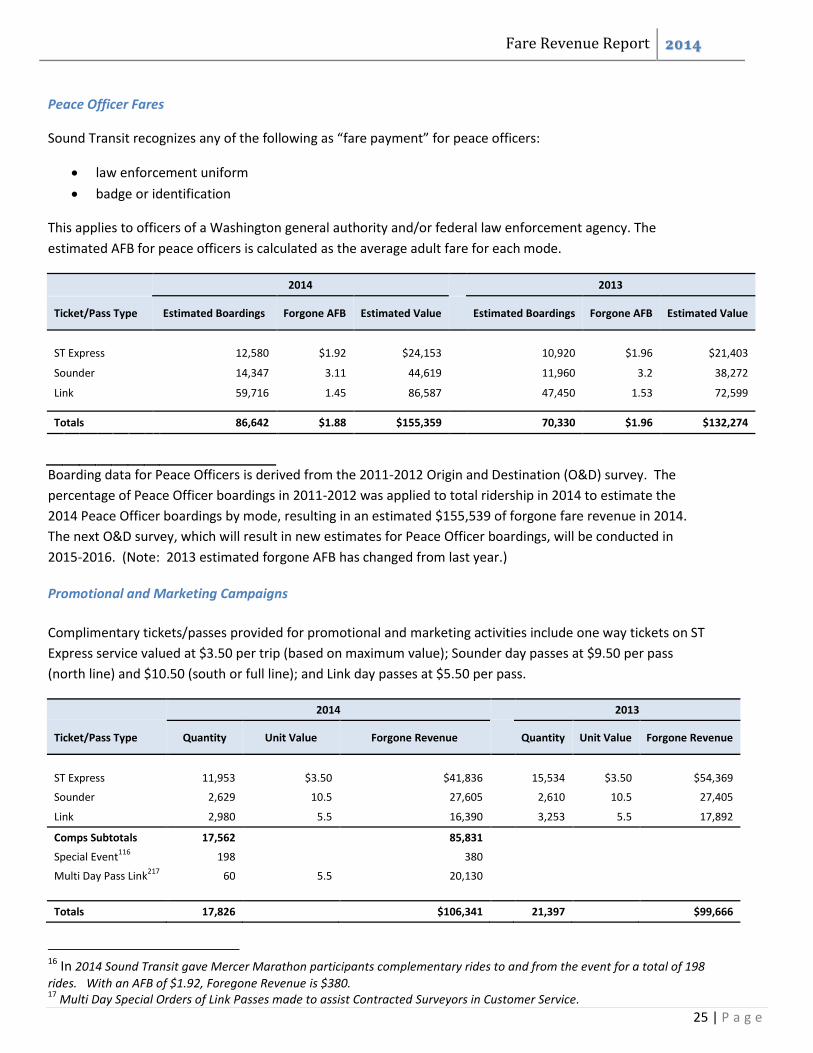
Peace Officer Fares
Sound Transit recognizes any of the following as “fare payment” for peace officers:
law enforcement uniform
badge or identification
This applies to officers of a Washington general authority and/or federal law enforcement agency. The
estimated AFB for peace officers is calculated as the average adult fare for each mode.
2014 2013
Ticket/Pass Type Estimated Boardings Forgone AFB Estimated Value Estimated Boardings Forgone AFB Estimated Value
ST Express 12,580 $1.92 $24,153
10,920 $1.96 $21,403
Sounder 14,347 3.11 44,619
11,960 3.2 38,272
Link 59,716 1.45 86,587
47,450 1.53 72,599
Totals 86,642 $1.88 $155,359 70,330 $1.96 $132,274
Boarding data for Peace Officers is derived from the 2011-2012 Origin and Destination (O&D) survey. The
percentage of Peace Officer boardings in 2011-2012 was applied to total ridership in 2014 to estimate the
2014 Peace Officer boardings by mode, resulting in an estimated $155,539 of forgone fare revenue in 2014.
The next O&D survey, which will result in new estimates for Peace Officer boardings, will be conducted in
2015-2016. (Note: 2013 estimated forgone AFB has changed from last year.)
Promotional and Marketing Campaigns
Complimentary tickets/passes provided for promotional and marketing activities include one way tickets on ST
Express service valued at $3.50 per trip (based on maximum value); Sounder day passes at $9.50 per pass
(north line) and $10.50 (south or full line); and Link day passes at $5.50 per pass.
2014 2013
Ticket/Pass Type Quantity Unit Value Forgone Revenue Quantity Unit Value Forgone Revenue
ST Express 11,953 $3.50 $41,836
15,534 $3.50 $54,369
Sounder 2,629 10.5 27,605
2,610 10.5 27,405
Link 2,980 5.5 16,390 3,253 5.5 17,892
Comps Subtotals 17,562
85,831
Special Event116
198
380
Multi Day Pass Link217
60 5.5 20,130
Totals 17,826 $106,341 21,397 $99,666
16 In 2014 Sound Transit gave Mercer Marathon participants complementary rides to and from the event for a total of 198
rides. With an AFB of $1.92, Foregone Revenue is $380. 17
Multi Day Special Orders of Link Passes made to assist Contracted Surveyors in Customer Service.
Fare Revenue Report 2014
26 | P a g e
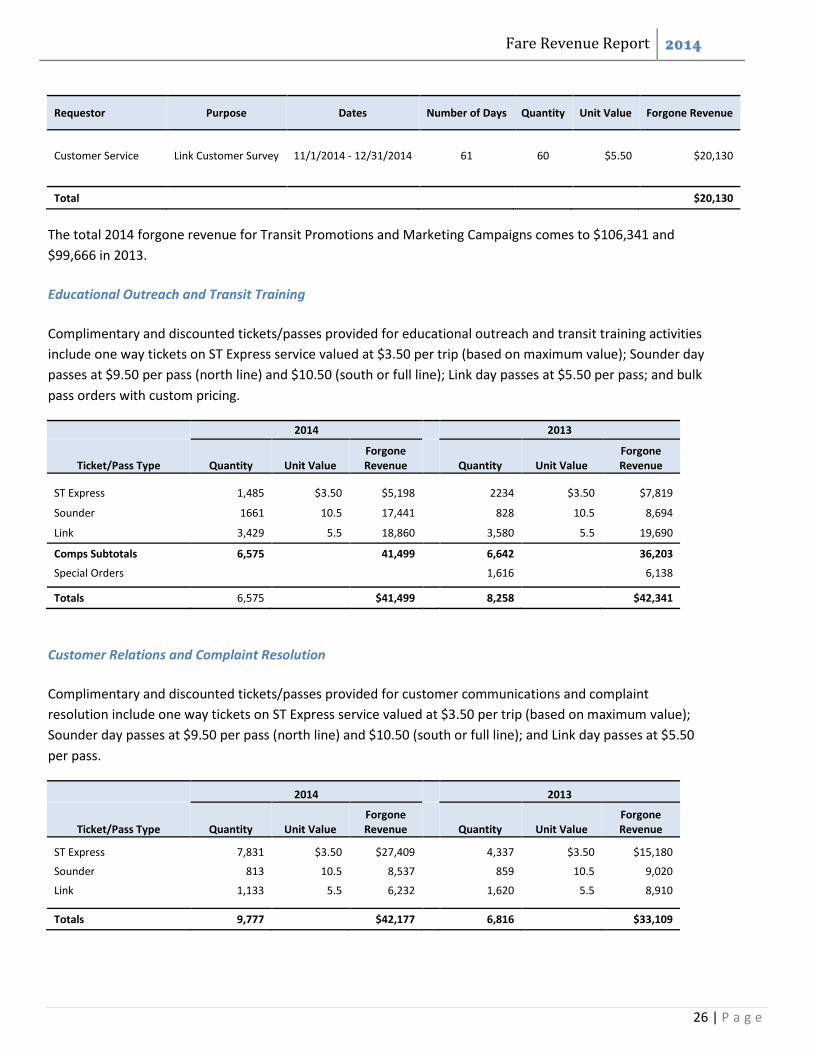
Requestor Purpose Dates Number of Days Quantity Unit Value Forgone Revenue
Customer Service Link Customer Survey 11/1/2014 - 12/31/2014 61 60 $5.50 $20,130
Total $20,130
The total 2014 forgone revenue for Transit Promotions and Marketing Campaigns comes to $106,341 and
$99,666 in 2013.
Educational Outreach and Transit Training
Complimentary and discounted tickets/passes provided for educational outreach and transit training activities
include one way tickets on ST Express service valued at $3.50 per trip (based on maximum value); Sounder day
passes at $9.50 per pass (north line) and $10.50 (south or full line); Link day passes at $5.50 per pass; and bulk
pass orders with custom pricing.
2014 2013
Ticket/Pass Type Quantity Unit Value Forgone Revenue
Quantity Unit Value
Forgone Revenue
ST Express 1,485 $3.50 $5,198
2234 $3.50 $7,819
Sounder 1661 10.5 17,441
828 10.5 8,694
Link 3,429 5.5 18,860 3,580 5.5 19,690
Comps Subtotals 6,575
41,499
6,642
36,203
Special Orders
1,616
6,138
Totals 6,575 $41,499 8,258 $42,341
Customer Relations and Complaint Resolution
Complimentary and discounted tickets/passes provided for customer communications and complaint
resolution include one way tickets on ST Express service valued at $3.50 per trip (based on maximum value);
Sounder day passes at $9.50 per pass (north line) and $10.50 (south or full line); and Link day passes at $5.50
per pass.
2014 2013
Ticket/Pass Type Quantity Unit Value Forgone Revenue Quantity Unit Value
Forgone Revenue
ST Express 7,831 $3.50 $27,409
4,337 $3.50 $15,180
Sounder 813 10.5 8,537
859 10.5 9,020
Link 1,133 5.5 6,232
1,620 5.5 8,910
Totals 9,777 $42,177 6,816 $33,109
Fare Revenue Report 2014
27 | P a g e
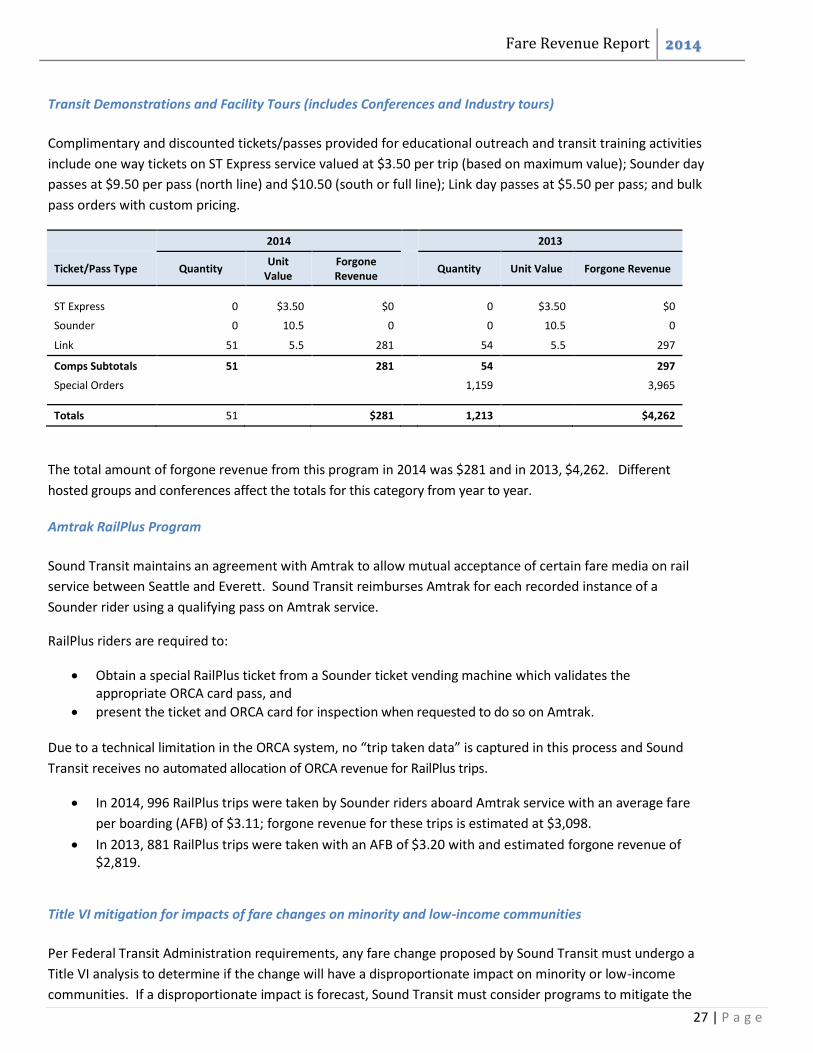
Transit Demonstrations and Facility Tours (includes Conferences and Industry tours)
Complimentary and discounted tickets/passes provided for educational outreach and transit training activities
include one way tickets on ST Express service valued at $3.50 per trip (based on maximum value); Sounder day
passes at $9.50 per pass (north line) and $10.50 (south or full line); Link day passes at $5.50 per pass; and bulk
pass orders with custom pricing.
2014 2013
Ticket/Pass Type Quantity Unit
Value Forgone Revenue
Quantity Unit Value Forgone Revenue
ST Express 0 $3.50 $0
0 $3.50 $0
Sounder 0 10.5 0
0 10.5 0
Link 51 5.5 281 54 5.5 297
Comps Subtotals 51
281
54
297
Special Orders
1,159
3,965
Totals 51 $281 1,213 $4,262
The total amount of forgone revenue from this program in 2014 was $281 and in 2013, $4,262. Different
hosted groups and conferences affect the totals for this category from year to year.
Amtrak RailPlus Program
Sound Transit maintains an agreement with Amtrak to allow mutual acceptance of certain fare media on rail
service between Seattle and Everett. Sound Transit reimburses Amtrak for each recorded instance of a
Sounder rider using a qualifying pass on Amtrak service.
RailPlus riders are required to:
Obtain a special RailPlus ticket from a Sounder ticket vending machine which validates the appropriate ORCA card pass, and
present the ticket and ORCA card for inspection when requested to do so on Amtrak.
Due to a technical limitation in the ORCA system, no “trip taken data” is captured in this process and Sound
Transit receives no automated allocation of ORCA revenue for RailPlus trips.
In 2014, 996 RailPlus trips were taken by Sounder riders aboard Amtrak service with an average fare
per boarding (AFB) of $3.11; forgone revenue for these trips is estimated at $3,098.
In 2013, 881 RailPlus trips were taken with an AFB of $3.20 with and estimated forgone revenue of $2,819.
Title VI mitigation for impacts of fare changes on minority and low-income communities
Per Federal Transit Administration requirements, any fare change proposed by Sound Transit must undergo a
Title VI analysis to determine if the change will have a disproportionate impact on minority or low-income
communities. If a disproportionate impact is forecast, Sound Transit must consider programs to mitigate the
Fare Revenue Report 2014
28 | P a g e
effect. In 2012 Sound Transit changed its policy of offering free ST Express bus service in downtown Seattle,
in coordination with the discontinuation of the Ride Free Area (RFA) administered by King County Metro. In
an analysis of the demographics of riders benefiting from the RFA before the change, ST determined that the
proportion of both minority and low-income riders among those using the RFA was greater than that for ST
ridership or the ST district as a whole.
Because of this disproportionate impact on Title VI populations, the Sound Transit Board provided as part of
its action to eliminate the free ride policy an expansion of the Human Services Ticket program to fulfill any
additional need for discounted fare media created by the policy change. Because this Title VI mitigation
represents an unknown proportion of the growth of the overall Human Service Ticket program, it is captured
in the report on that program (below) rather than as a separate program in this document.
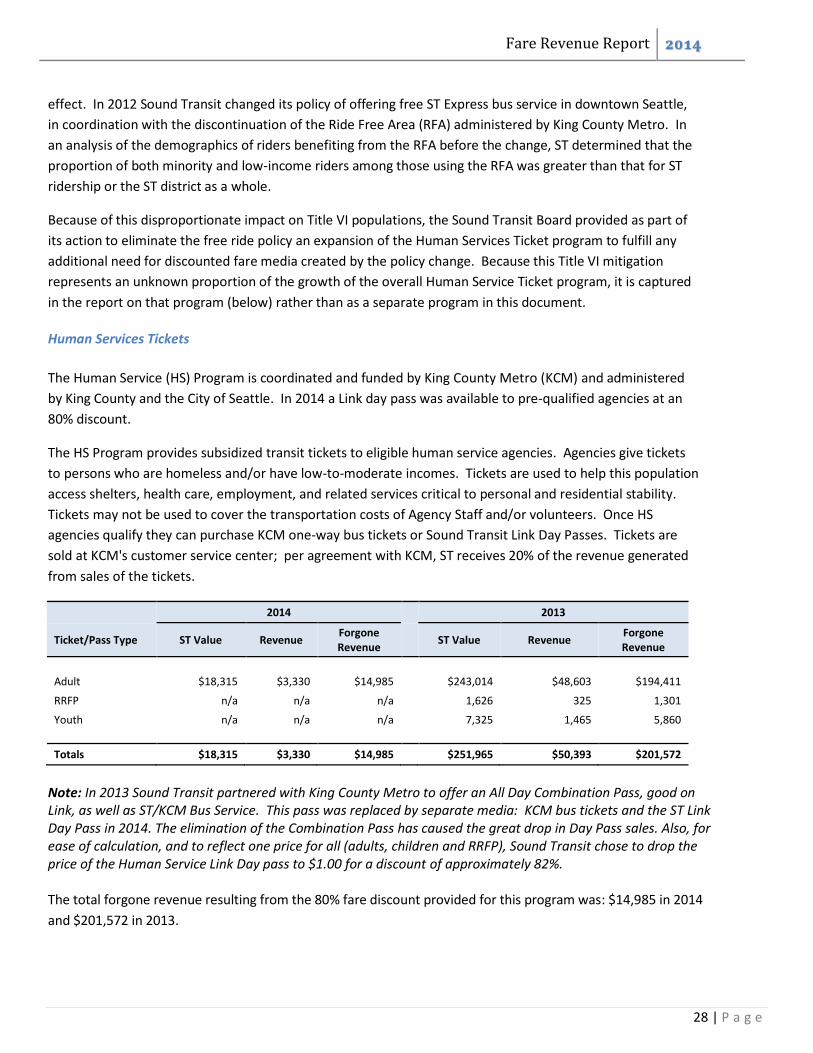
Human Services Tickets
The Human Service (HS) Program is coordinated and funded by King County Metro (KCM) and administered
by King County and the City of Seattle. In 2014 a Link day pass was available to pre-qualified agencies at an
80% discount.
The HS Program provides subsidized transit tickets to eligible human service agencies. Agencies give tickets
to persons who are homeless and/or have low-to-moderate incomes. Tickets are used to help this population
access shelters, health care, employment, and related services critical to personal and residential stability.
Tickets may not be used to cover the transportation costs of Agency Staff and/or volunteers. Once HS
agencies qualify they can purchase KCM one-way bus tickets or Sound Transit Link Day Passes. Tickets are
sold at KCM's customer service center; per agreement with KCM, ST receives 20% of the revenue generated
from sales of the tickets.
2014 2013
Ticket/Pass Type ST Value Revenue Forgone Revenue
ST Value Revenue Forgone Revenue
Adult $18,315 $3,330 $14,985
$243,014 $48,603 $194,411
RRFP n/a n/a n/a
1,626 325 1,301
Youth n/a n/a n/a
7,325 1,465 5,860
Totals $18,315 $3,330 $14,985 $251,965 $50,393 $201,572
Note: In 2013 Sound Transit partnered with King County Metro to offer an All Day Combination Pass, good on Link, as well as ST/KCM Bus Service. This pass was replaced by separate media: KCM bus tickets and the ST Link Day Pass in 2014. The elimination of the Combination Pass has caused the great drop in Day Pass sales. Also, for ease of calculation, and to reflect one price for all (adults, children and RRFP), Sound Transit chose to drop the price of the Human Service Link Day pass to $1.00 for a discount of approximately 82%. The total forgone revenue resulting from the 80% fare discount provided for this program was: $14,985 in 2014
and $201,572 in 2013.
Fare Revenue Report 2014
29 | P a g e
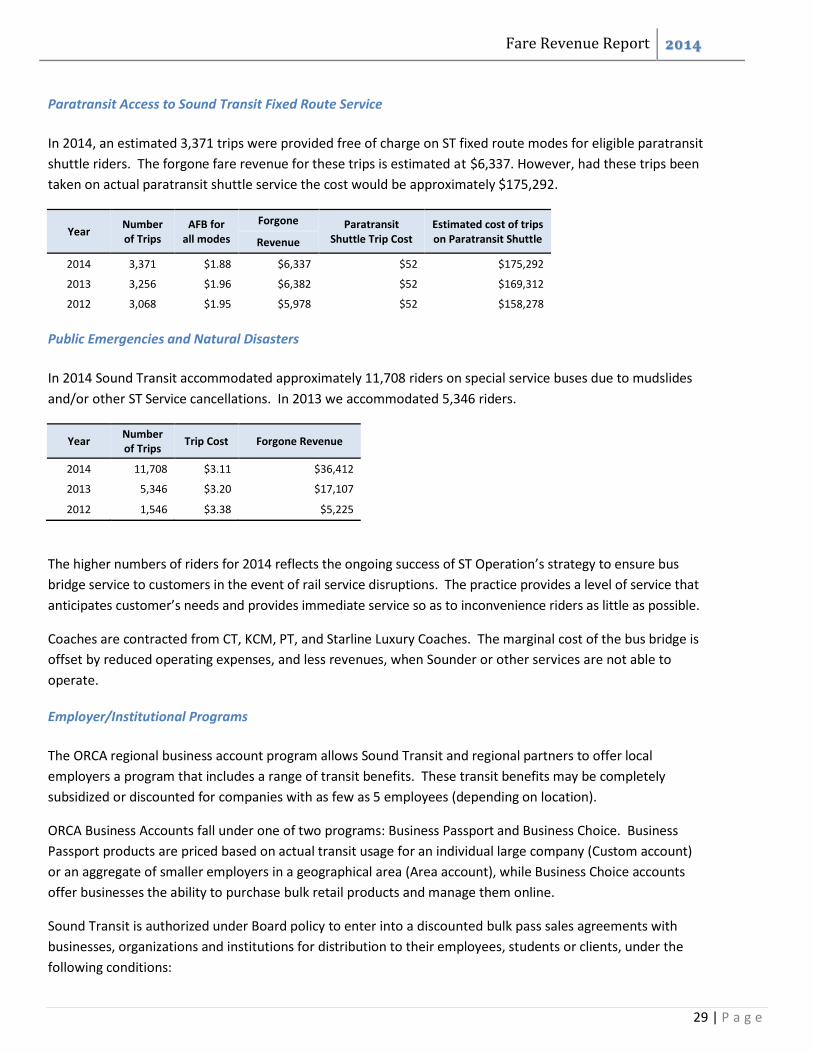
Paratransit Access to Sound Transit Fixed Route Service
In 2014, an estimated 3,371 trips were provided free of charge on ST fixed route modes for eligible paratransit
shuttle riders. The forgone fare revenue for these trips is estimated at $6,337. However, had these trips been
taken on actual paratransit shuttle service the cost would be approximately $175,292.
Year Number of Trips
AFB for all modes
Forgone Paratransit Shuttle Trip Cost
Estimated cost of trips on Paratransit Shuttle Revenue
2014 3,371 $1.88 $6,337 $52 $175,292
2013 3,256 $1.96 $6,382 $52 $169,312
2012 3,068 $1.95 $5,978 $52 $158,278
Public Emergencies and Natural Disasters
In 2014 Sound Transit accommodated approximately 11,708 riders on special service buses due to mudslides
and/or other ST Service cancellations. In 2013 we accommodated 5,346 riders.
Year Number of Trips
Trip Cost Forgone Revenue
2014 11,708 $3.11 $36,412
2013 5,346 $3.20 $17,107
2012 1,546 $3.38 $5,225
The higher numbers of riders for 2014 reflects the ongoing success of ST Operation’s strategy to ensure bus
bridge service to customers in the event of rail service disruptions. The practice provides a level of service that
anticipates customer’s needs and provides immediate service so as to inconvenience riders as little as possible.
Coaches are contracted from CT, KCM, PT, and Starline Luxury Coaches. The marginal cost of the bus bridge is
offset by reduced operating expenses, and less revenues, when Sounder or other services are not able to
operate.
Employer/Institutional Programs
The ORCA regional business account program allows Sound Transit and regional partners to offer local
employers a program that includes a range of transit benefits. These transit benefits may be completely
subsidized or discounted for companies with as few as 5 employees (depending on location).
ORCA Business Accounts fall under one of two programs: Business Passport and Business Choice. Business
Passport products are priced based on actual transit usage for an individual large company (Custom account)
or an aggregate of smaller employers in a geographical area (Area account), while Business Choice accounts
offer businesses the ability to purchase bulk retail products and manage them online.
Sound Transit is authorized under Board policy to enter into a discounted bulk pass sales agreements with
businesses, organizations and institutions for distribution to their employees, students or clients, under the
following conditions:
Fare Revenue Report 2014
30 | P a g e
It is in the best interest of Sound Transit,
Passes are priced according to the actual or estimated use at a level no lower than the fare revenue
that would be expected from the pass users as a group if bulk purchase/distribution program were not
in place, or
To pursue market development and/or customer retention.
A discount of no more than 20% may be granted provided that the bulk purchaser of the pass offers subsidy of
a least 50 percent of the per pass purchase price to the individual pass recipients.
No discounts were given to Business Accounts in 2014.
Fare Revenue Report 2014
31 | P a g e
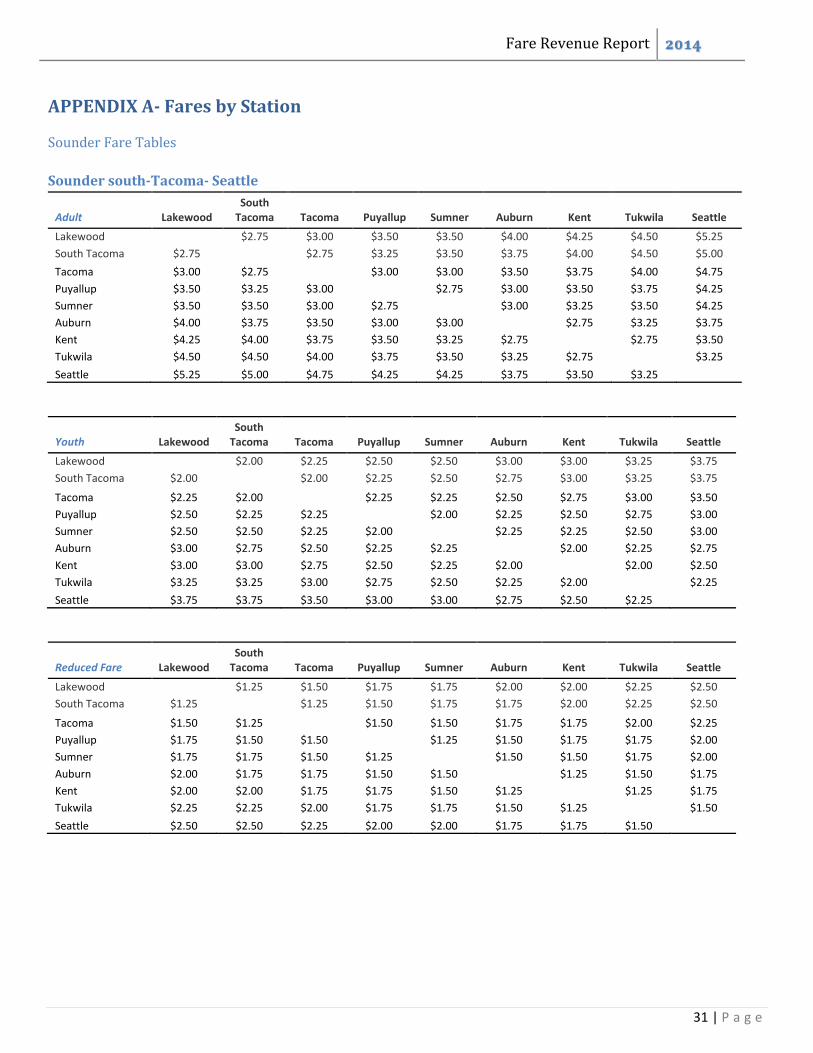
APPENDIX A- Fares by Station
Sounder Fare Tables
Sounder south-Tacoma- Seattle
South Adult Lakewood Tacoma Tacoma Puyallup Sumner Auburn Kent Tukwila Seattle
Lakewood $2.75 $3.00 $3.50 $3.50 $4.00 $4.25 $4.50 $5.25
South Tacoma $2.75 $2.75 $3.25 $3.50 $3.75 $4.00 $4.50 $5.00
Tacoma $3.00 $2.75 $3.00 $3.00 $3.50 $3.75 $4.00 $4.75
Puyallup $3.50 $3.25 $3.00 $2.75 $3.00 $3.50 $3.75 $4.25
Sumner $3.50 $3.50 $3.00 $2.75 $3.00 $3.25 $3.50 $4.25
Auburn $4.00 $3.75 $3.50 $3.00 $3.00 $2.75 $3.25 $3.75
Kent $4.25 $4.00 $3.75 $3.50 $3.25 $2.75 $2.75 $3.50
Tukwila $4.50 $4.50 $4.00 $3.75 $3.50 $3.25 $2.75 $3.25
Seattle $5.25 $5.00 $4.75 $4.25 $4.25 $3.75 $3.50 $3.25
South
Youth Lakewood Tacoma Tacoma Puyallup Sumner Auburn Kent Tukwila Seattle
Lakewood $2.00 $2.25 $2.50 $2.50 $3.00 $3.00 $3.25 $3.75
South Tacoma $2.00 $2.00 $2.25 $2.50 $2.75 $3.00 $3.25 $3.75
Tacoma $2.25 $2.00 $2.25 $2.25 $2.50 $2.75 $3.00 $3.50
Puyallup $2.50 $2.25 $2.25 $2.00 $2.25 $2.50 $2.75 $3.00
Sumner $2.50 $2.50 $2.25 $2.00 $2.25 $2.25 $2.50 $3.00
Auburn $3.00 $2.75 $2.50 $2.25 $2.25 $2.00 $2.25 $2.75
Kent $3.00 $3.00 $2.75 $2.50 $2.25 $2.00 $2.00 $2.50
Tukwila $3.25 $3.25 $3.00 $2.75 $2.50 $2.25 $2.00 $2.25
Seattle $3.75 $3.75 $3.50 $3.00 $3.00 $2.75 $2.50 $2.25
South Reduced Fare Lakewood Tacoma Tacoma Puyallup Sumner Auburn Kent Tukwila Seattle
Lakewood $1.25 $1.50 $1.75 $1.75 $2.00 $2.00 $2.25 $2.50
South Tacoma $1.25 $1.25 $1.50 $1.75 $1.75 $2.00 $2.25 $2.50
Tacoma $1.50 $1.25 $1.50 $1.50 $1.75 $1.75 $2.00 $2.25
Puyallup $1.75 $1.50 $1.50 $1.25 $1.50 $1.75 $1.75 $2.00
Sumner $1.75 $1.75 $1.50 $1.25 $1.50 $1.50 $1.75 $2.00
Auburn $2.00 $1.75 $1.75 $1.50 $1.50 $1.25 $1.50 $1.75
Kent $2.00 $2.00 $1.75 $1.75 $1.50 $1.25 $1.25 $1.75
Tukwila $2.25 $2.25 $2.00 $1.75 $1.75 $1.50 $1.25 $1.50
Seattle $2.50 $2.50 $2.25 $2.00 $2.00 $1.75 $1.75 $1.50
Fare Revenue Report 2014
32 | P a g e
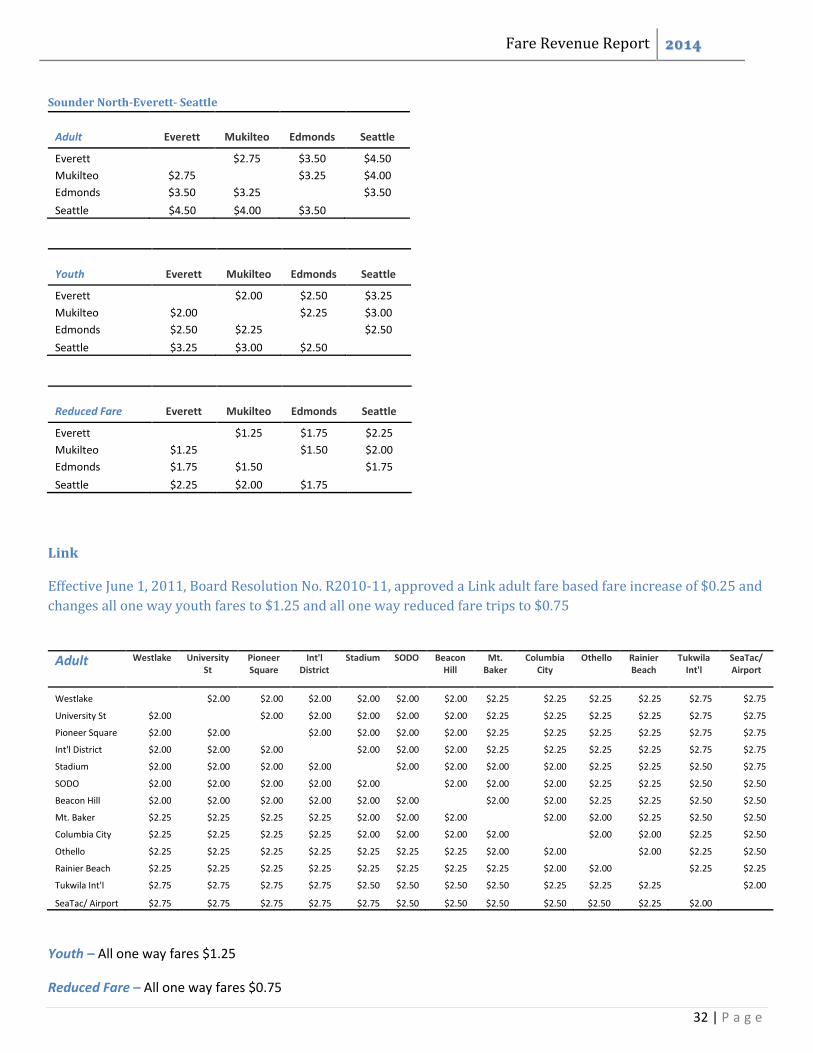
Sounder North-Everett- Seattle
Adult Everett Mukilteo Edmonds Seattle
Everett $2.75 $3.50 $4.50
Mukilteo $2.75 $3.25 $4.00
Edmonds $3.50 $3.25 $3.50
Seattle $4.50 $4.00 $3.50
Youth Everett Mukilteo Edmonds Seattle
Everett $2.00 $2.50 $3.25
Mukilteo $2.00 $2.25 $3.00
Edmonds $2.50 $2.25 $2.50
Seattle $3.25 $3.00 $2.50
Reduced Fare Everett Mukilteo Edmonds Seattle
Everett $1.25 $1.75 $2.25
Mukilteo $1.25 $1.50 $2.00
Edmonds $1.75 $1.50 $1.75
Seattle $2.25 $2.00 $1.75
Link
Effective June 1, 2011, Board Resolution No. R2010-11, approved a Link adult fare based fare increase of $0.25 and
changes all one way youth fares to $1.25 and all one way reduced fare trips to $0.75
Adult Westlake University St
Pioneer Square
Int'l District
Stadium SODO Beacon Hill
Mt. Baker
Columbia City
Othello Rainier Beach
Tukwila Int'l
SeaTac/ Airport
Westlake
$2.00 $2.00 $2.00 $2.00 $2.00 $2.00 $2.25 $2.25 $2.25 $2.25 $2.75 $2.75
University St $2.00 $2.00 $2.00 $2.00 $2.00 $2.00 $2.25 $2.25 $2.25 $2.25 $2.75 $2.75
Pioneer Square $2.00 $2.00 $2.00 $2.00 $2.00 $2.00 $2.25 $2.25 $2.25 $2.25 $2.75 $2.75
Int'l District $2.00 $2.00 $2.00 $2.00 $2.00 $2.00 $2.25 $2.25 $2.25 $2.25 $2.75 $2.75
Stadium $2.00 $2.00 $2.00 $2.00 $2.00 $2.00 $2.00 $2.00 $2.25 $2.25 $2.50 $2.75
SODO $2.00 $2.00 $2.00 $2.00 $2.00 $2.00 $2.00 $2.00 $2.25 $2.25 $2.50 $2.50
Beacon Hill $2.00 $2.00 $2.00 $2.00 $2.00 $2.00 $2.00 $2.00 $2.25 $2.25 $2.50 $2.50
Mt. Baker $2.25 $2.25 $2.25 $2.25 $2.00 $2.00 $2.00 $2.00 $2.00 $2.25 $2.50 $2.50
Columbia City $2.25 $2.25 $2.25 $2.25 $2.00 $2.00 $2.00 $2.00 $2.00 $2.00 $2.25 $2.50
Othello $2.25 $2.25 $2.25 $2.25 $2.25 $2.25 $2.25 $2.00 $2.00 $2.00 $2.25 $2.50
Rainier Beach $2.25 $2.25 $2.25 $2.25 $2.25 $2.25 $2.25 $2.25 $2.00 $2.00 $2.25 $2.25
Tukwila Int'l $2.75 $2.75 $2.75 $2.75 $2.50 $2.50 $2.50 $2.50 $2.25 $2.25 $2.25 $2.00
SeaTac/ Airport $2.75 $2.75 $2.75 $2.75 $2.75 $2.50 $2.50 $2.50 $2.50 $2.50 $2.25 $2.00
Youth – All one way fares $1.25
Reduced Fare – All one way fares $0.75