Embed Size (px)
Citation preview

Farabi Sustainability Drivefor
Stakeholder Engagements

2
Please note this publication is intended for general information and awareness purposes only and the company will not be legally responsible for use or misuse of its contents by any party. Reproduction is not authorized without obtaining a written consent from the company
Legal Disclaimer
“Farabi Petrochemicals Company 2015. All Rights Reserved”

3
Contents Summary:
S. No. Chapter # Items Page #
1Chapter – 1
(Introduction of Farabi Sustainability Drive)
Introduction of Farabi Sustainability Drive 4-6
2 Farabi Sustainability Team 7
3 Farabi Sustainability Team – Area of Focus 8
5
Chapter – 2(Farabi Sustainability
System)
Definition – Sustainability Terminology 9-10
6 Sustainability Foot Print Scope for Farabi 11
7 Emission Scopes Definition 12
8 Farabi Sustainability Goals 13
9 Road Maps for Farabi Sustainability Development 14
10 Farabi Sustainability Strategies – 5 years plan 15-18
11Chapter – 3
(Sustainability Performances)
Farabi Sustainability Performances 19-20
12 Farabi Sustainability Performance - Analysis 21
13 Farabi Sustainability Initiatives 22
14
Chapter – 4(Participation in Global
Reporting)
Introduction for GRI 23-24
15 GRI Framework 25
16 Farabi Application Level 26
17 CDP Sustainability Reportings 27
18 ACI Sustainability Reportings 28
19 GPCA performance Metrics and Sustainability Reportings 29
20Chapter – 5
(Other Business Aspects & References)
EHSS Significant Aspects/Impacts 30-33
21 MSDS – Farabi Products 34
22 Farabi Publication & Newsletter References 35
Expectations & Feedback 36
4
Sustainability Steering Committee, SSC
Chapter – 1Introduction of Farabi Sustainability Drive
5
Introduction – Sustainability & Sustainable Development
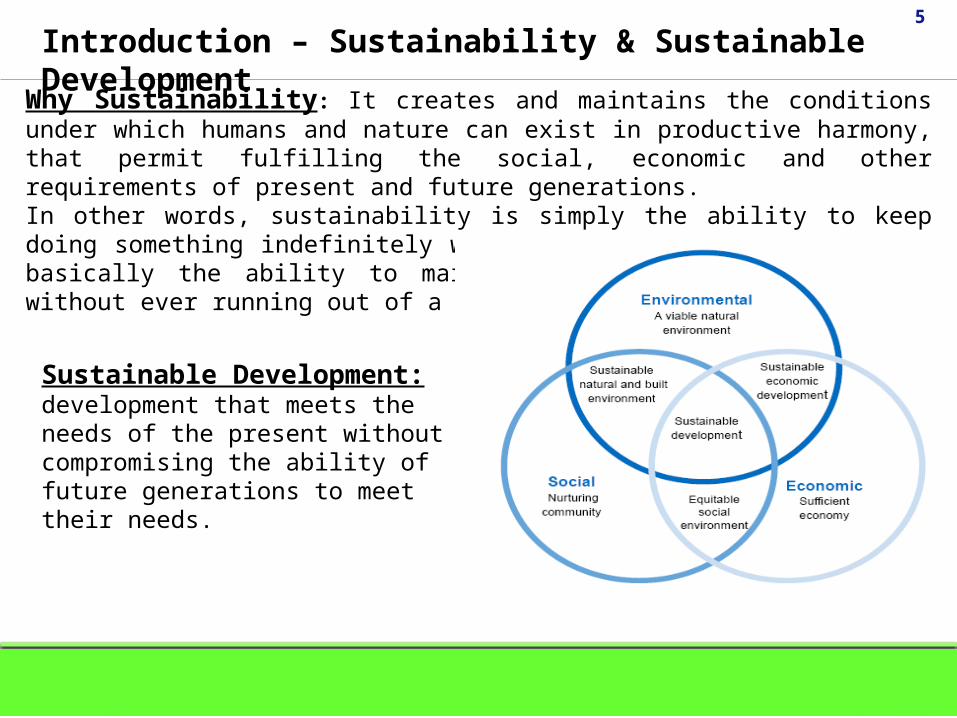
Why Sustainability: It creates and maintains the conditions under which humans and nature can exist in productive harmony, that permit fulfilling the social, economic and other requirements of present and future generations. In other words, sustainability is simply the ability to keep doing something indefinitely without depleting your resources; basically the ability to maintain a process of consumption without ever running out of a resource.
Sustainable Development: development that meets the needs of the present without compromising the ability of future generations to meet their needs.

6
Introduction – Farabi Sustainability Drive
Farabi’s vision for Sustainability is to protect the natural capitals in our sustainable journey without compromising in benefiting of all stakeholders by creating economic values with ensuring safe and reliable products.
Environment: To reduce the green house gas emission intensity from all scopes of the Farabi Operation.In 2013, we announced a long term sustainability target for our Company that establishes 20% reduction of CO2-e emission intensity reduction from the baseline emission for the time period of 10 years by 2023.
EconomicTo provide sustainable returns to key economic stakeholders.
Social: To eliminate or manage hazards & practices in our business that could cause accidents, injury or illness to people, damage to property or unacceptable impacts on Environment.We (Farabi) are committed to social responsibility through our sustainability programs for Children Development, People Reach Out and Promoting Green Environment by growing trees.
7
Farabi Sustainability Team
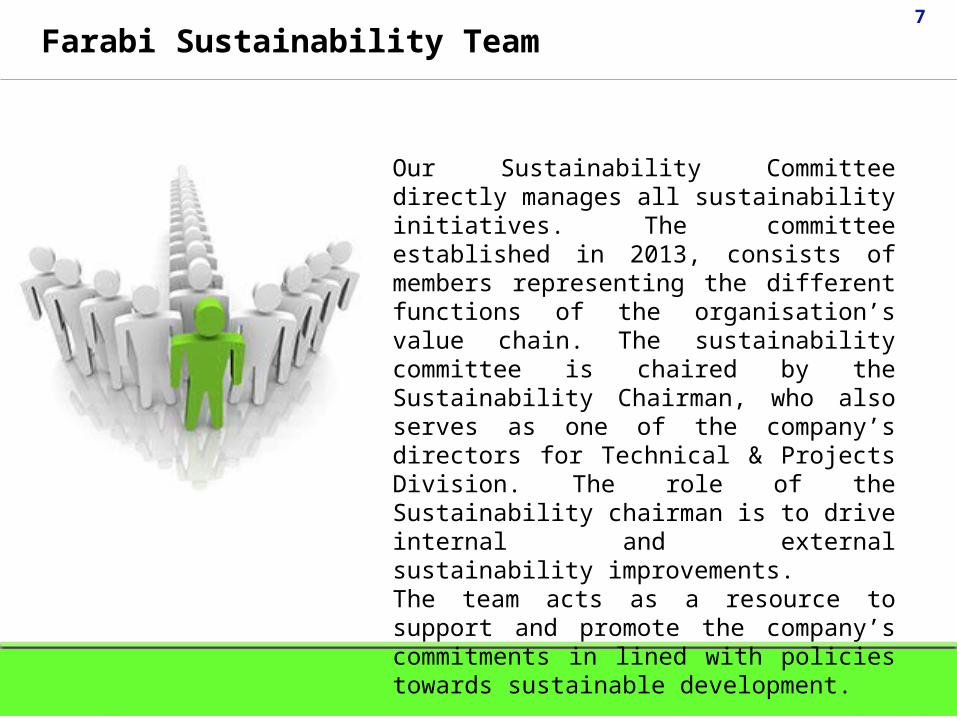
Our Sustainability Committee directly manages all sustainability initiatives. The committee established in 2013, consists of members representing the different functions of the organisation’s value chain. The sustainability committee is chaired by the Sustainability Chairman, who also serves as one of the company’s directors for Technical & Projects Division. The role of the Sustainability chairman is to drive internal and external sustainability improvements.The team acts as a resource to support and promote the company’s commitments in lined with policies towards sustainable development.

8
Farabi Sustainability Team – Area of Focus
Sustainability Steering Committee, SSC
• Conduct Awareness Programs on Sustainability.• Develop long term plan for sustainability• Define Sustainability Metrics.• Nurture Initiatives and steer for implementation.• Review and adopt GRI frame work for sustainability reporting.• Review and ensure timely CDP Reporting.• Review and ensure for other sustainability reporting (e.g; ACI, GPCA etc..)• Promote Environmental Care aspects.• Ensure regulatory requirements are complied with.• Farabi’s Annual Sustainability Report• Sustainability improvements, opportunities and initiatives• Sustainability Roadmap and Improvement Action Plan• Engagement of stakeholders
9
Sustainability Steering Committee, SSC
Chapter – 2Farabi Sustainability System

10
Definition – Sustainability Terminologies
‘Carbon footprint’ has become a widely used term and concept in the public debate on responsibility and abatement action against the threat of global climate change. It had a tremendous increase in public appearance over the last few months and years and is now a buzzword widely used across the media, the government and in the business world.
"The carbon footprint is a measure of the exclusive total amount of carbon dioxide emissions that is directly and indirectly caused by a person, family, building, organization, or company over the life stages of a product.“
In most cases 'carbon footprint' is used as a generic synonym for emissions of carbon dioxide or greenhouse gases (GHG) expressed in “CO2 equivalents”
Designation or Name Chemical formula
GWP
Carbon dioxide CO2 1.00 Methane CH4 25.00
Nitrous oxide N2O 298.00 CFC-11 CCl3F 4,750.00
CFC-12 CCl2F2 10,900.00
Sulphur hexafluoride SF6 22,800.00
Global Warming Potentials (GWP) are a quantified measure of the globally averaged relative radiative forcing impacts of a particular greenhouse gas. It is defined as the cumulative radiative force. Carbon dioxide (CO2) was chosen by the IPCC as this reference gas and its GWP is set equal to one (1).

11
Calculating and Reducing Green House Gases originating from our site based on international standards of 3 scopes:
Scope-1: Footprint calculated from fuels gas consumption, fuel oil consumption, and company owned vehicles.
Scope-2: Footprint calculated from total electricity consumption Scope-3: Footprint calculated from waste disposal, Employee Air travels,
Quantifying and Reducing Energy Foot print intensity in terms of CO2-equivalent emissions.
Reduction of Water intensity. Material effectiveness by reducing/upgrading wastes and by-products.
FPC Sustainability Foot Print includes

12
Emission Scopes Details

13
FPC Sustainability Goals
Proposed Sustainability Goals
Goals 2023 vs Benchmark
CO2-e Emission Intensity - 20%
Sustainability Goals Break Down
Goals 2018 vs benchmark
CO2 - eq. Intensity
Energy Intensity
Water Intensity
Haz. Waste IntensityNon Haz. Waste Intensity
-14%
-25%
-21%
-50%-50%
Employee Health & Safety
Social Responsibility
0% Recordable IR
Community Reach Out
14
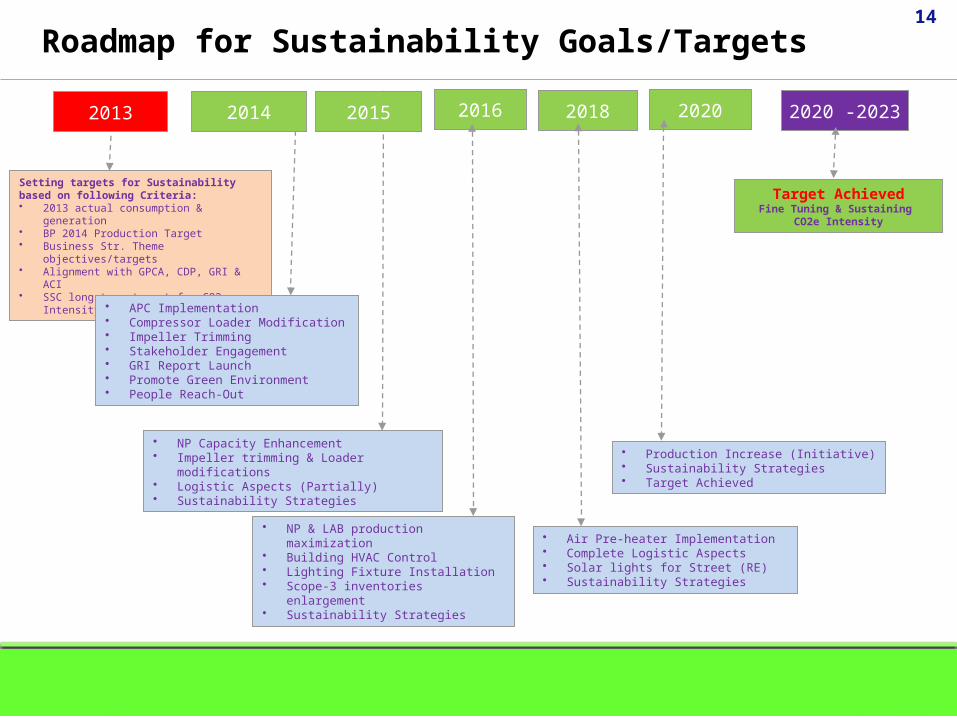
Roadmap for Sustainability Goals/Targets
Setting targets for Sustainability based on following Criteria: • 2013 actual consumption & generation • BP 2014 Production Target• Business Str. Theme objectives/targets• Alignment with GPCA, CDP, GRI & ACI• SSC long term target for CO2e Intensity
2013 2014 2016 20182015
• APC Implementation• Compressor Loader Modification• Impeller Trimming• Stakeholder Engagement• GRI Report Launch• Promote Green Environment• People Reach-Out
• Air Pre-heater Implementation• Complete Logistic Aspects• Solar lights for Street (RE)• Sustainability Strategies
• Production Increase (Initiative)• Sustainability Strategies• Target Achieved
• NP & LAB production maximization• Building HVAC Control• Lighting Fixture Installation• Scope-3 inventories enlargement• Sustainability Strategies
• NP Capacity Enhancement• Impeller trimming & Loader modifications• Logistic Aspects (Partially)• Sustainability Strategies
2020 -2023
Target AchievedFine Tuning & Sustaining
CO2e Intensity
2020
15
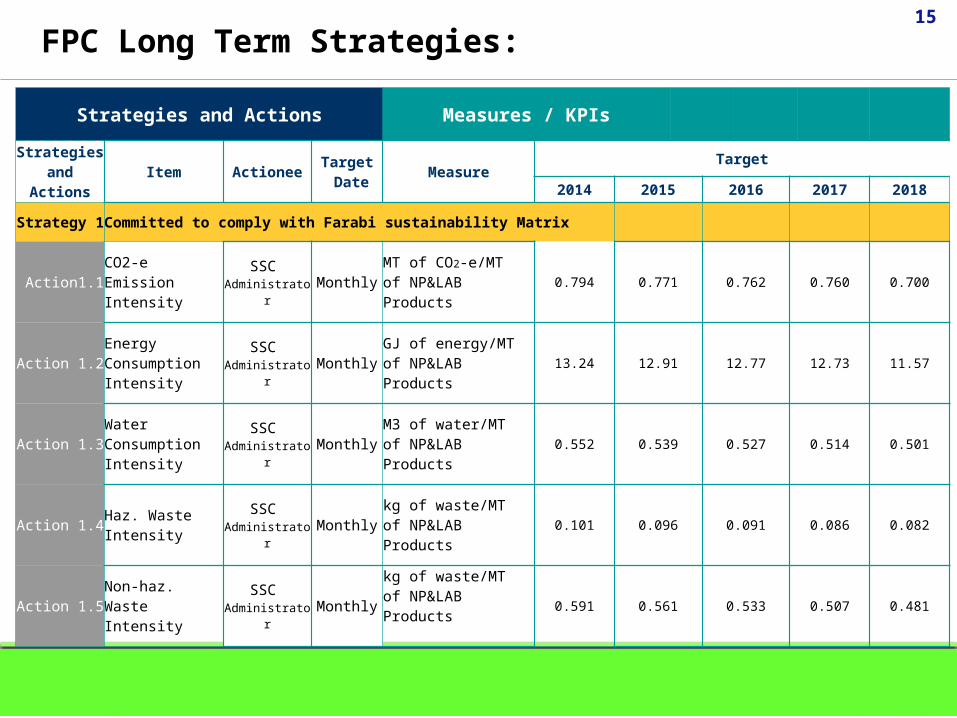
Strategies and Actions Measures / KPIs
Strategies and
ActionsItem Actionee
Target Date Measure
Target
2014 2015 2016 2017 2018
Strategy 1Committed to comply with Farabi sustainability Matrix
Action1.1CO2-e Emission Intensity
SSC Administrator
MonthlyMT of CO2-e/MT of NP&LAB Products
0.794 0.771 0.762 0.760 0.700
Action 1.2Energy Consumption Intensity
SSC Administrator
MonthlyGJ of energy/MT of NP&LAB Products
13.24 12.91 12.77 12.73 11.57
Action 1.3 Water
Consumption Intensity
SSC Administrator
MonthlyM3 of water/MT of NP&LAB Products
0.552 0.539 0.527 0.514 0.501
Action 1.4Haz. Waste Intensity
SSC Administrator
Monthlykg of waste/MT of NP&LAB Products
0.101 0.096 0.091 0.086 0.082
Action 1.5Non-haz. Waste Intensity
SSC Administrator
Monthlykg of waste/MT of NP&LAB Products 0.591 0.561 0.533 0.507 0.481
FPC Long Term Strategies:
16
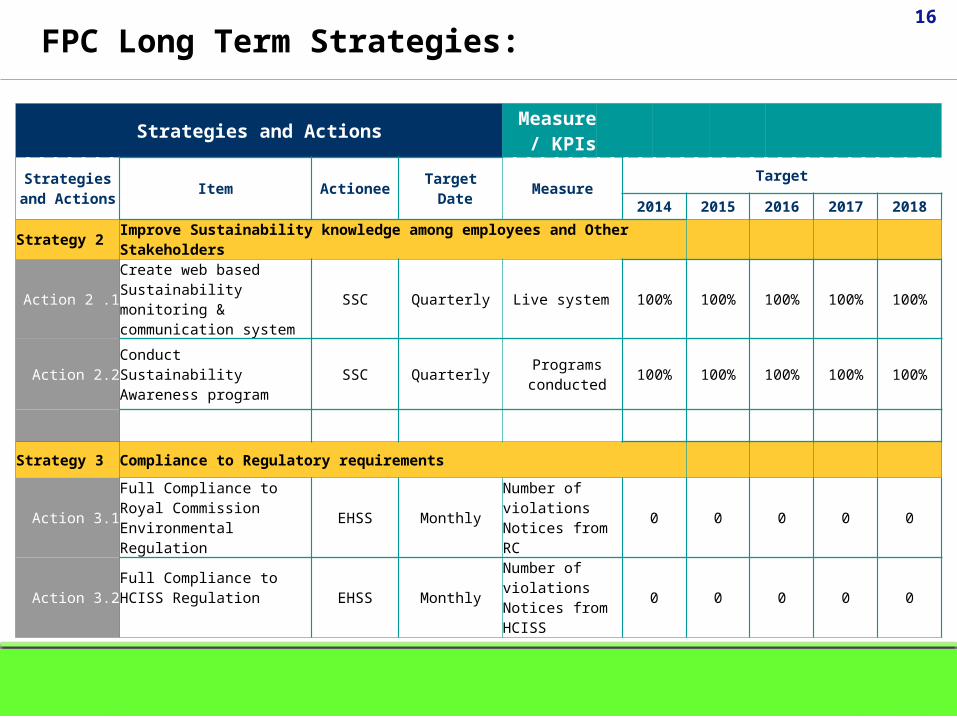
Strategies and ActionsMeasure
/ KPIs
Strategies and Actions
Item Actionee Target Date MeasureTarget
2014 2015 2016 2017 2018
Strategy 2Improve Sustainability knowledge among employees and Other Stakeholders
Action 2 .1
Create web based Sustainability monitoring & communication system
SSC Quarterly Live system 100% 100% 100% 100% 100%
Action 2.2Conduct Sustainability Awareness program
SSC QuarterlyPrograms conducted
100% 100% 100% 100% 100%
Strategy 3 Compliance to Regulatory requirements
Action 3.1
Full Compliance to Royal Commission Environmental Regulation
EHSS Monthly
Number of violations Notices from RC
0 0 0 0 0
Action 3.2Full Compliance to HCISS Regulation EHSS Monthly
Number of violations Notices from HCISS
0 0 0 0 0
FPC Long Term Strategies:
17
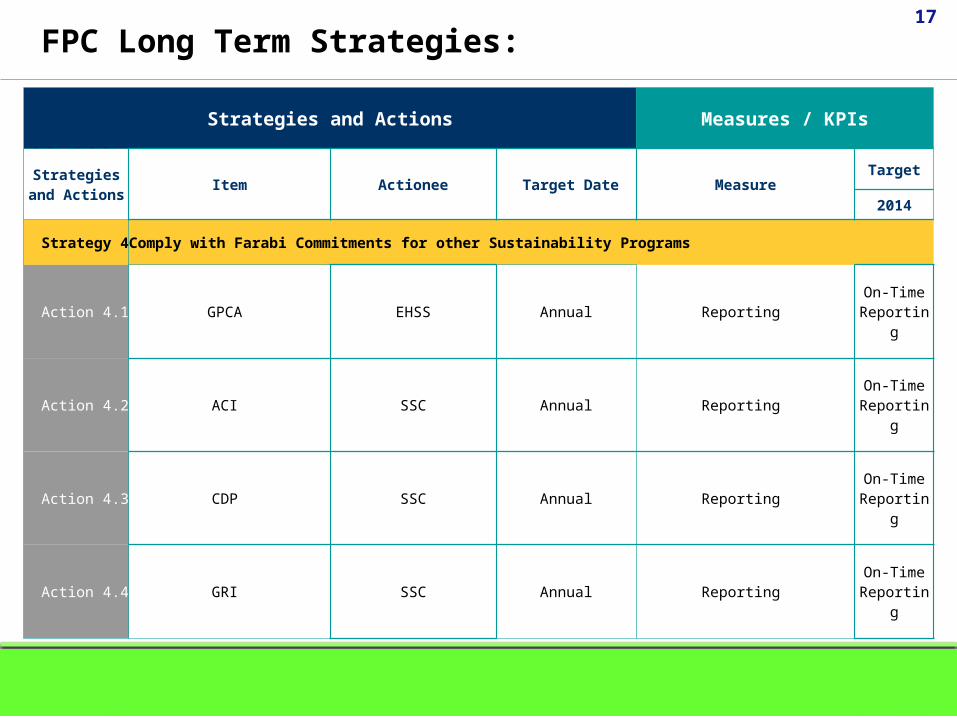
Strategies and Actions Measures / KPIs
Strategies and Actions
Item Actionee Target Date MeasureTarget
2014
Strategy 4 Comply with Farabi Commitments for other Sustainability Programs
Action 4.1 GPCA EHSS Annual ReportingOn-Time
Reporting
Action 4.2 ACI SSC Annual ReportingOn-Time
Reporting
Action 4.3 CDP SSC Annual ReportingOn-Time
Reporting
Action 4.4 GRI SSC Annual ReportingOn-Time
Reporting
FPC Long Term Strategies:
18
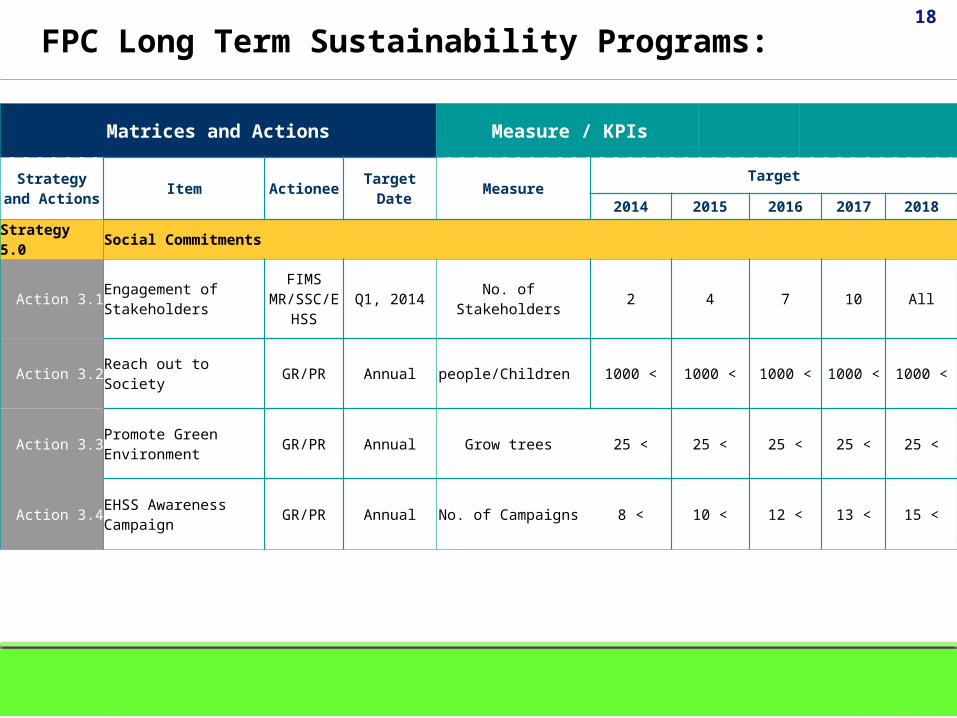
Matrices and Actions Measure / KPIs
Strategy and Actions
Item ActioneeTarget Date Measure
Target
2014 2015 2016 2017 2018
Strategy 5.0Social Commitments
Action 3.1Engagement of Stakeholders
FIMS MR/SSC/E
HSSQ1, 2014 No. of Stakeholders 2 4 7 10 All
Action 3.2Reach out to Society GR/PR Annual people/Children >1000 >1000 >1000 >1000 >1000
Action 3.3Promote Green Environment
GR/PR Annual Grow trees >25 >25 >25 >25 >25
Action 3.4EHSS Awareness Campaign
GR/PR Annual No. of Campaigns >8 >10 >12 >13 >15
FPC Long Term Sustainability Programs:

19
Sustainability Steering Committee, SSC
Chapter - 3Farabi Sustainability Performance

20
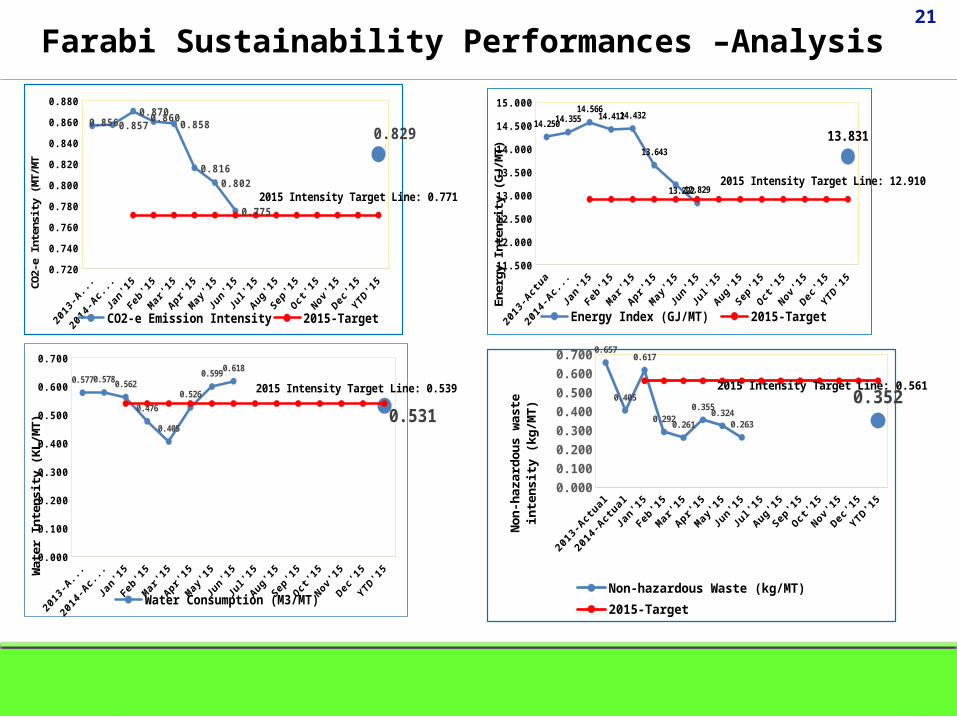
Performances - Farabi Sustainability Metrics
Measures 2013 Actual
2014 Actual
YTD 2015
Target 2015
Green House Gas Emission (CO2-eq. emission Intensity MT/MT of NP&LAB) 0.856 0.857 0.829 0.771
Energy Footprint GJ/MT of NP&LAB) 14.25 14.35 13.83 12.91
Water Consumption (M3/MT of NP&LAB ) 0.577 0.578 0.531 0.539
Hazardous Waste (Kg/MT of NP+LAB) 0.112 0.099 0.167 0.096
Non-hazardous Waste (Kg/MT of NP&LAB) 0.657 0.405 0.352 0.561
21
Farabi Sustainability Performances –Analysis
2013-Actu
a
2014-Actu
al
Jan'15
Feb'15
Mar'
15
Apr'15
May
'15
Jun'15
Jul'1
5
Aug'15
Sep'15
Oct'15
Nov'15
Dec'15
YTD'15
0.720
0.740
0.760
0.780
0.800
0.820
0.840
0.860
0.880
0.856 0.8570.8700.860
0.858
0.8160.802
0.775
0.829
CO2-e Emission Intensity 2015-Target
CO2-
e In
tens
ity (M
T/M
T
2015 Intensity Target Line: 0.771
2013-Actu
a
2014-Actu
al
Jan'15
Feb'15
Mar'
15
Apr'15
May
'15
Jun'15
Jul'1
5
Aug'15
Sep'15
Oct'15
Nov'15
Dec'15
YTD'15
11.500
12.000
12.500
13.000
13.500
14.000
14.500
15.000
14.25014.35514.566
14.41214.432
13.643
13.22212.829
13.831
Energy Index (GJ/MT) 2015-Target
Ener
gy In
tens
ity (G
J/M
T)
2015 Intensity Target Line: 12.910
0.000
0.100
0.200
0.300
0.400
0.500
0.600
0.700
0.577 0.578 0.562
0.476
0.405
0.526
0.599 0.618
0.531
Water Consumption (M3/MT) 2015-Target
Wat
er In
tens
ity (K
L/M
T)
2015 Intensity Target Line: 0.539
2013-Actu
al
2014-Actu
al
Jan'15
Feb'15
Mar'
15
Apr'15
May
'15
Jun'15
Jul'1
5
Aug'15
Sep'15
Oct'15
Nov'15
Dec'15
YTD'15
0.000
0.100
0.200
0.300
0.400
0.500
0.600
0.700 0.657
0.405
0.617
0.2920.261
0.3550.324
0.263
0.352
Non-hazardous Waste (kg/MT) 2015-Target
Non
-haz
ardo
us w
aste
inte
nsity
(kg/
MT)
2015 Intensity Target Line: 0.561
22
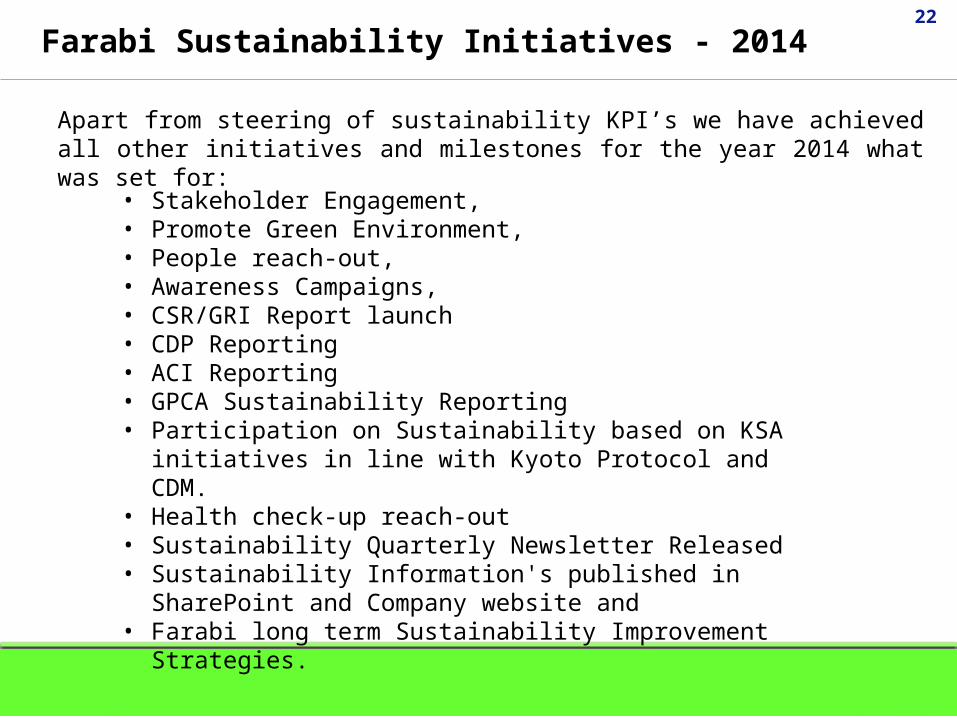
Farabi Sustainability Initiatives - 2014
• Stakeholder Engagement, • Promote Green Environment, • People reach-out, • Awareness Campaigns,• CSR/GRI Report launch• CDP Reporting• ACI Reporting• GPCA Sustainability Reporting• Participation on Sustainability based on KSA initiatives in line with
Kyoto Protocol and CDM. • Health check-up reach-out• Sustainability Quarterly Newsletter Released• Sustainability Information's published in SharePoint and Company
website and • Farabi long term Sustainability Improvement Strategies.
Apart from steering of sustainability KPI’s we have achieved all other initiatives and milestones for the year 2014 what was set for:
23
Sustainability Steering Committee, SSC
Chapter - 4Participation in Global Reporting

24
What is GRI ?
The Global Reporting Initiative (GRI) is a non-profit organization that works towards a sustainable global economy by providing sustainability reporting guidance.
GRI has pioneered and developed a comprehensive sustainability reporting framework that is widely used around the world. The Framework enables all organizations to measure and report their economic, environmental, social and governance performance – the four key areas of sustainability.
The GRI is independent, it remains a collaborating centre of United Nations Environmental Programs UNEP and works in cooperation with the United Nations Global Compact.

25
GRI Framework for Sustainability Report – G3.1 Guidelines
GRI Guidelines(G3.1)
Principles
Content
Quality
Boundary
Standard Disclosures
Disclosure Items
Strategy & Analysis
Organizational Profile
Report Parameters
Governance, Commitments & Engagements
DMA & Performan
ce Indicators
Economic
Environmental
Social

26
Farabi Application Level – Going for “B”
Report Application Level C C+ B B+ A A+
Standard Disclosures
Profile Disclosures
Report On:
Report Externally Assured
Report on all criteria listed for level C+
Report
Externally Assured
Same as requirement for Level B
Report
Externall
y Assured
1.1 1.22.1 - 2.10
3.1 - 3.8 ,3.10 - 3.12 3.9 ,3.134.1 - 4.4 ,4.14 - 4.15 4.5 - 4.13 ,4.16 - 4.17
Disclosures on Management
Approach (DMA's)Not Required Management Approach
Disclosures for each Indicator Category
Management Approach disclosed for each Indicator Category
Performance Indicators
Report fully on a minimum of any 10
Performance Indicators, including at least one from each of: social, economic, and
environment**.
Report fully on a minimum of any 20 Performance
Indicators, at least one from each of: economic,
environment, human rights, labor, society, product
responsibility***.
Respond on each core and Sector Supplement* indicator with due regard to the materiality Principle by either: a) reporting on the indicator or b) explaining the reason for its omission
** Performance Indicators may be selected from any finalized Sector Supplement, but 7 of the 10 must be from the original GRI Guidelines
*** Performance Indicators may be selected from any finalized Sector Supplement, but 14 of the 20 must be from the original GRI Guidelines
27
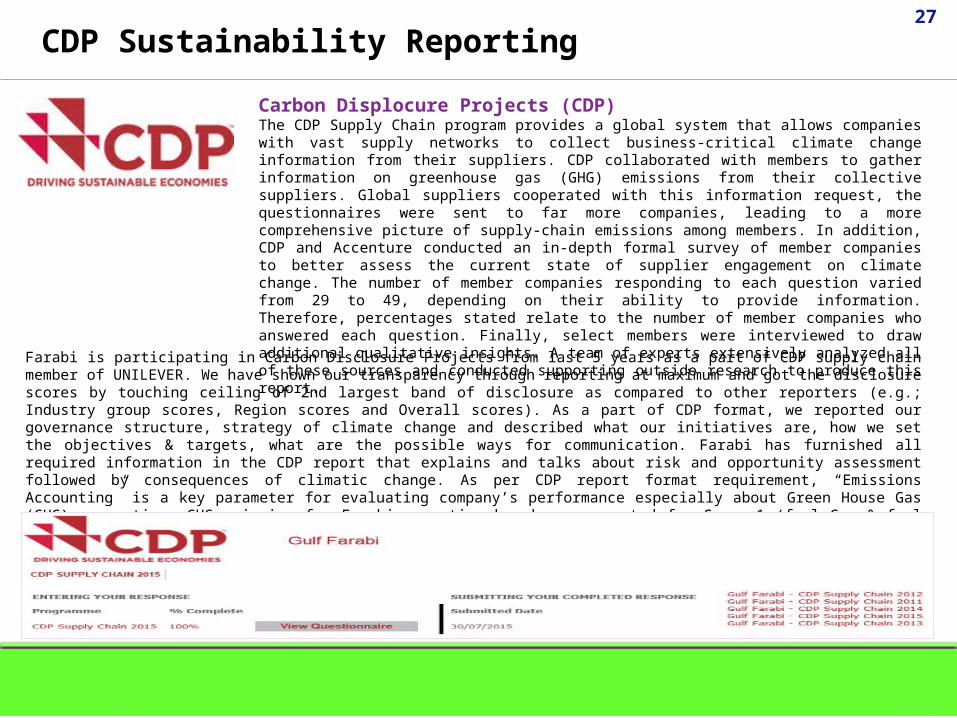
CDP Sustainability Reporting
Carbon Displocure Projects (CDP)The CDP Supply Chain program provides a global system that allows companies with vast supply networks to collect business-critical climate change information from their suppliers. CDP collaborated with members to gather information on greenhouse gas (GHG) emissions from their collective suppliers. Global suppliers cooperated with this information request, the questionnaires were sent to far more companies, leading to a more comprehensive picture of supply-chain emissions among members. In addition, CDP and Accenture conducted an in-depth formal survey of member companies to better assess the current state of supplier engagement on climate change. The number of member companies responding to each question varied from 29 to 49, depending on their ability to provide information. Therefore, percentages stated relate to the number of member companies who answered each question. Finally, select members were interviewed to draw additional qualitative insights. A team of experts extensively analyzed all of these sources and conducted supporting outside research to produce this report.Farabi is participating in Carbon Disclosure Projects from last 5 years as a part of CDP supply chain member of UNILEVER.
We have shown our transparency through reporting at maximum and got the disclosure scores by touching ceiling of 2nd largest band of disclosure as compared to other reporters (e.g.; Industry group scores, Region scores and Overall scores). As a part of CDP format, we reported our governance structure, strategy of climate change and described what our initiatives are, how we set the objectives & targets, what are the possible ways for communication. Farabi has furnished all required information in the CDP report that explains and talks about risk and opportunity assessment followed by consequences of climatic change. As per CDP report format requirement, “Emissions Accounting” is a key parameter for evaluating company’s performance especially about Green House Gas (GHG) accounting. GHG emission for Farabi operation has been accounted for Scope-1 (fuel Gas & fuel oil consumption & Company Owned vehicles mileage), scope-2 (Purchased Electricity) and scope-3 (Waste disposal, air travels). Report submittal evidence in CDP as shown below (print screen):

28
ACI Sustainability Reporting
American Cleaning Institute (ACI)
Farabi is a signatory and member Company for American Cleaning Institute (ACI) since 2013 and we have committed to participate in their ACI annual metric program. As part of ACI’s Sustainability Metrics Project, member companies track and report environmental sustainability metrics. Tracking these metrics provides a baseline and indicators by which we can measure sustainability-related performance for ACI member operations in the United States associated with cleaning products. Metrics are collected in four categories:
• Energy Use (electricity, steam, and fuel)• Greenhouse Gas Emissions (CO2 equivalents)• Water Use• Waste Generation
The data reported by the individual companies was compared with U.S. production rates associated with cleaning products for each company to produce a normalized value, which represents performance per unit of production.
ACI Member Companies: Demonstrating Sustainability
ACI member companies are committed to increasing sustainability and demonstrating corporate social responsibility. As an extension of the work being done at ACI, the Sustainability Report also features a gateway to more than 30 profiles of how ACI member companies demonstrate sustainability throughout their companies. Farabi is one of the active ACI member company which can be verified in following link at ACI website: http://www.cleaninginstitute.org/sustainability2013/

29
GPCA performance Metrics and Sustainability Reporting
Responsible Care @ GPCAGulf Petrochemicals and Chemicals Association (GPCA) adopted the Responsible Care Initiative in 2009, thereby, bringing this important initiative to the Gulf and Middle East Region. GPCA’s Responsible Care Program is aligned with the initiatives of the international entities like UNEP, UNDP, and International Council of Chemical Association (ICCA). GPCA has designed its Responsible Care Program, keeping in view the experience gained by international associations in their journey towards responsible care issues. GPCA has forged alliance with American Chemistry Council (ACC), the European Chemistry Council (CEFIC), and the Canadian Chemical Producers Association (CCPA) to address the global issues in a concerted manner.
GPCA adopted Responsible Care in 2009 and since then the majority of its members have embedded the initiative in their daily operations, with 35 percent of GPCA’s full members having obtained certification for the Responsible Care Management System Standard or RC 14001. The International Council of Chemical Associations (ICCA), which addresses the Responsible Care initiative on a global level, ranked GPCA as the top performing association amongst 57 associations, for the implementation of the Responsible Care initiative two years in a row.
Farabi is actively participating in all kind of reporting, initiatives and management programs conducted and governed by GPCA; recently we have been participated in GPCA waste free environment campaign which was conducted in Feb’15. As one of the full member we are consistently reporting on GPCA performance metrics template and also participate in sustainability survey questionnaires and enthusiastically join hands for sustainable development.
30
Sustainability Steering Committee, SSC
Chapter – 5Other Business Aspects & References

31
EHSS Significant Aspects - Environment
• Storage & Handling of Hazardous Waste• Disposal of Solid waste• Control of waste generation• Emissions of pollutants to air• Control of spills / leaks• Conservation of Resources (Energy, water etc)• Management of non-hazardous waste• Fugitive Emissions• Inadequate assessment of supplier• Inadequate training of tank car drivers• Tank-overflow of hazardous chemicals

32
EHSS Significant Aspects - Safety• Fire• Loss of Containment• Electric Shock• Confined Space Entry• Working at Heights• Risk Assessment• PSSR• Communication of HSE Requirements• Emergency Preparedness & Reponse• Mechanical Integrity of SHE Critical Equipment• Control of Work Permit• Storage & Handling of Chemicals• Hazard Communication• Control of Defeat• Training & Qualification of Plant Personnel• Control of Records• Critical Lifting / Rigging Operations• Incident Investigation & Root Cause Analysis• Competency of ER Team• Control of Contractor activities• Process Safety Information• Effective training & refreshers of SHE systems• Management of Change

33
EHSS Significant Aspects - Health
• Exposure to Carcinogens (Benzene)• Exposure to Toxic Chemicals• Exposure to Noise• Exposure to NARF• Food Poisoning• Exposure to Radiation• Contact with Hot Surfaces• Working under Heat Stress• Expired Medicine• Inadequate Ventilation• Eye Staring / illumination• Fatigue due to over-working
Please note that a complete aspects/impact registered has also been uploaded in the website under sustainability web page which could be accessible for reference.
34
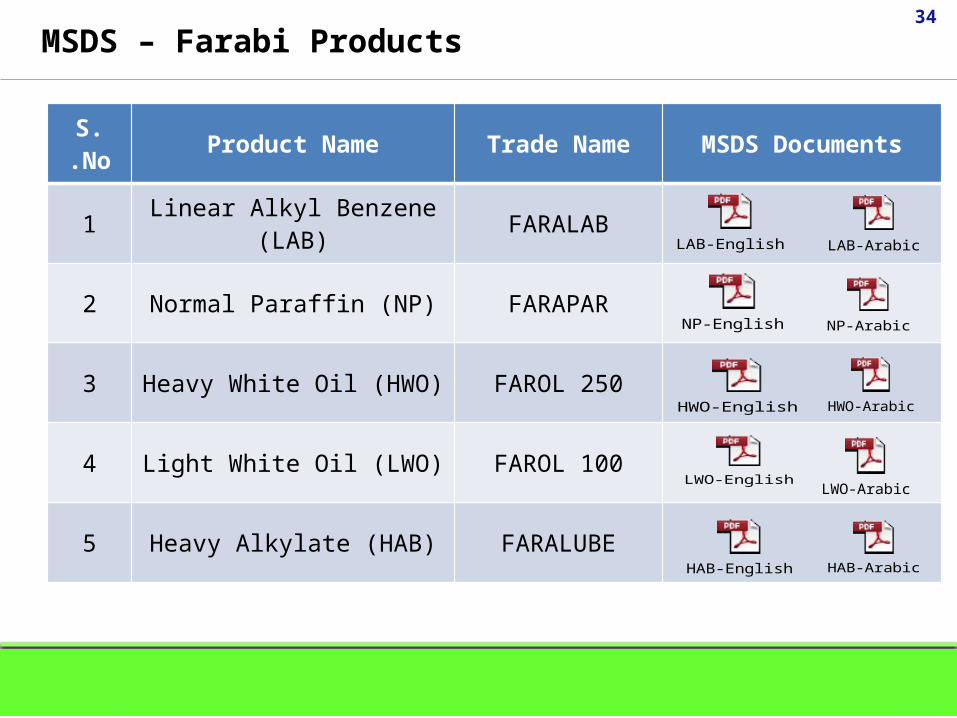
MSDS – Farabi Products
S. No. Product Name Trade Name MSDS Documents
1 Linear Alkyl Benzene (LAB) FARALAB
2 Normal Paraffin (NP) FARAPAR
3 Heavy White Oil (HWO) FAROL 250
4 Light White Oil (LWO) FAROL 100
5 Heavy Alkylate (HAB) FARALUBE
LAB-English LAB-Arabic
NP-English NP-Arabic
HWO-English HWO-Arabic
LWO-EnglishLWO-Arabic
HAB-English HAB-Arabic
35
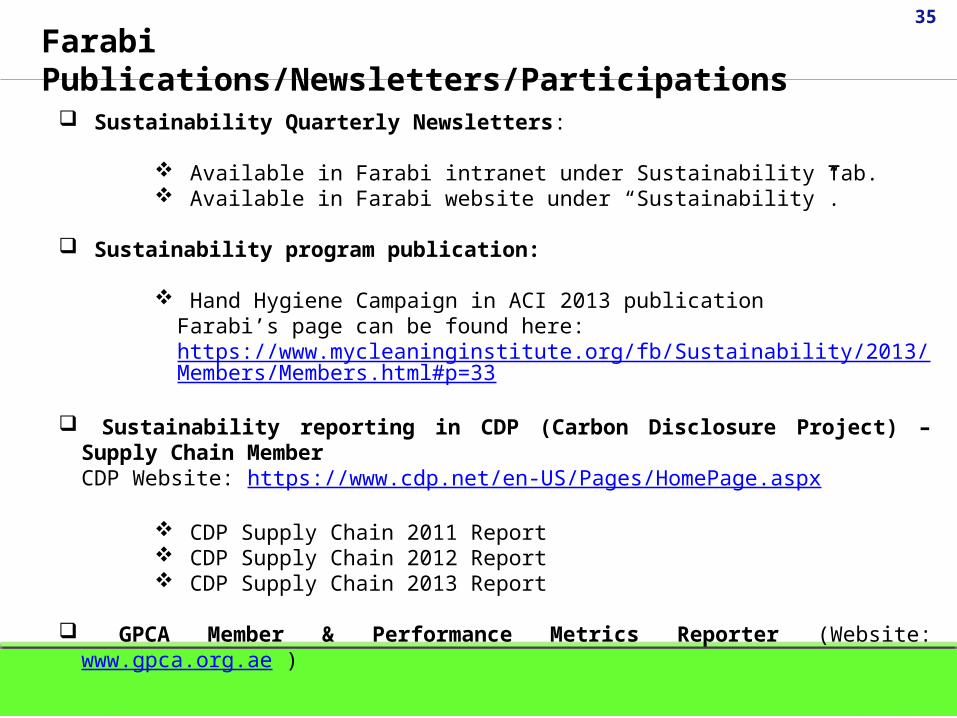
Sustainability Quarterly Newsletters:
Available in Farabi intranet under Sustainability Tab. Available in Farabi website under “Sustainability”.
Sustainability program publication:
Hand Hygiene Campaign in ACI 2013 publicationFarabi’s page can be found here: https://www.mycleaninginstitute.org/fb/Sustainability/2013/Members/Members.html#p=33
Sustainability reporting in CDP (Carbon Disclosure Project) – Supply Chain MemberCDP Website: https://www.cdp.net/en-US/Pages/HomePage.aspx
CDP Supply Chain 2011 Report CDP Supply Chain 2012 Report CDP Supply Chain 2013 Report
GPCA Member & Performance Metrics Reporter (Website: www.gpca.org.ae )
Farabi Publications/Newsletters/Participations
36
Requested for Feedback & Expectations for Questionnaire which would be sent to you very soon.
Your feedback will play a role to improvised our sustainability drive as well as aspects materiality for GRI sustainability report.
Appreciate for your participation towards Farabi Sustainable Development Journey..
“Farabi Petrochemicals Company 2014. All Rights Reserved”
End of the presentation.


![Al farabi principles of the beings [hyman]](https://img.pdfslide.us/doc/110x75/579057071a28ab900c9ba9e5/al-farabi-principles-of-the-beings-hyman.jpg)
![Al-Farabi - Summary of Plato's Laws [Tr.mahdi]](https://img.pdfslide.us/doc/110x75/55cf9d2d550346d033ac8dc2/al-farabi-summary-of-platos-laws-trmahdi.jpg)