Embed Size (px)
Citation preview
Far Horizons Pemberton Associates
1
Managing the Future
The automotive world to 2100
Far Horizons Pemberton Associates
2
Contents
........................................................................................................................................ 1
Far Horizons - 2010 to 2100 – The World and the Automotive Market in Perspective4
Preamble ........................................................................................................................ 4
Key points regarding human and social development: ............................................. 5
Key points regarding automotive development: ....................................................... 6
Conclusion .................................................................................................................. 7
Objective ........................................................................................................................ 9
Purpose .......................................................................................................................... 9
Method .......................................................................................................................... 9
The automotive environment .................................................................................. 10
Operating environment ....................................................................................... 10
Operating conditions ........................................................................................... 10
Operating regions ................................................................................................ 11
The product .............................................................................................................. 11
The industry ............................................................................................................. 12
Drive train options ................................................................................................... 13
Summary ...................................................................................................................... 14
World population evolution and forecast ............................................................... 14
Some major factors governing global and automotive development ..................... 15
The market ............................................................................................................... 18
Vehicle sales ............................................................................................................. 20
The vehicle parc ....................................................................................................... 25
Global automotive forecasting process and dependencies .................................... 28
Major factors governing the technical development of the global automotive industry ................................................................................................................ 28
The spread of motorisation - the current situation in 2010 .................................... 32
Vehicle Ownership Compared with Income in 2010 – Selected Countries ............. 33
Technology and the motor vehicle .......................................................................... 37
Adding complexity to vehicle specifications ........................................................ 37
Appendix .................................................................................................................. 41
Automotive drive train options ............................................................................... 44
Internal combustion engine using gasoline and diesel........................................ 44
Internal combustion engine using additives e.g. biofuels ................................... 44
Internal combustion engine using LPG or CNG.................................................... 45
Hybrid vehicles ..................................................................................................... 45
Far Horizons Pemberton Associates
3
Plug-in Hybrids ..................................................................................................... 46
Pure electric vehicles ........................................................................................... 47
Range extender EVs ............................................................................................. 47
Fuel cell (Hydrogen) ............................................................................................. 48
Chart 7. Population per Sq Km in selected countries in 2050 and 2100 compared with 2010 ............................................................................................................. 49
Chart 8. Vehicle density per Sq KM in selected countries in 2050 and 2100 compared with 2010 ............................................................................................ 50
Regional Definitions ............................................................................................. 51
Far Horizons Pemberton Associates
4
Far Horizons - 2010 to 2100 – The World and the Automotive Market in Perspective Preamble About 20 years’ ago, Professor Fukuyama, a prominent American academic and advisor to the American Government famously announced the “End of History”, which he describes as “a single, coherent, evolutionary process when taking into account the experience of all people at all times”. It is hard to reconcile this comment with what is happening to the world as the global population continues to grow at a remarkable rate and the need to transport goods and services expands to meet the diversity of challenges that an unprecedented new world structure demands. It could be argued that seldom before has the world faced a greater accumulation of challenges, which range from current concerns about recession and the potential for a further downturn, the dire poverty and malnutrition afflicting billions of people, concern about climate change, global warming and air pollution, whether there will be continued availability of fossil fuel with which to generate energy and to power our transport, the potential for the spread of conflict and – by no means least - how to feed and nurture the extra human beings that will be born in coming years, mainly in some of the poorest and most deprived countries on the planet. The evolution of transport has been one of the most potent drivers of change, and that of the motor vehicle the mode that has most influenced the development of global mobility and international trade. It is literally impossible to imagine now how the world and society would operate without the motor vehicle and other forms of personal and commercial transport. Major events are occurring never before experienced in the history of humanity. The greatest change, and the biggest challenge, is the continuing explosion in the number of people in the world, which shows little sign of abating, at least in the near future. The world is effectively only 60 years into the massive explosion in humanity and has been, and continues to be, operating in uncharted territory. Further, the extant global centre of gravity is tilting very rapidly from the developed West to the emerging East. The Developing Countries (DVCs) are growing at a remarkable rate, with some countries, including the BRICs (Brazil, Russia, India and China) exerting greater and greater influence on the future shape and structure of human society. At the same time, urbanisation, that is, the movement of people from the countryside to town and cities, is gathering pace and Mega Cities are being formed. This drains the countryside of people and hinders the production of food, and at the same time, increases the need for transport to get the food that is produced to the new population centres. This paper has been produced to outline some of the
Far Horizons Pemberton Associates
5
consequences of the changes that are happening in the world and the automotive developments that are necessary to facilitate progress. The year 2100 seems a long time in the future. Many things can change over such a period. Not least, the size and shape of the population can vary, possibly dramatically. This document uses the Medium, or most likely, variant of the United Nations Population Division – the 2010 revision. The appendix provides a brief analysis of the variations predicted by the High and Low variants in this prediction. If the high variant comes to be, the volumes of vehicles shown in the forecast in this document will need to be considerably higher. If the Low variant is achieved, there will be a diminution in volume, but of modest proportions. For many it seems as though the planet is already awash with vehicles and that there is no room left for an increase in the size of the vehicle fleet. Indeed, some groups call for a reduction in the number of vehicles in use around the world. Yet motorisation remains a phenomenon mainly of the developed world. As recently as the year 2000, just three countries, the USA, Japan and Germany, accounted for 50% of global automotive activity and the More Developed Countries (MDC’s), accounted for 75% of activity even though they were home to only 16% of the global population. A major increase in the number of vehicles in use seems inevitable if the population of the future is to be fed and nurtured. The data in the forecasts contained within this document will not sit well with many members of extant society, but not to face the challenge will mean ignoring the legitimate desires of the populations of all nations to thrive and prosper. It is not difficult to imagine the outcome of attempting to deny a majority of the world’s population the fundamental rights and aspirations of those now alive and yet to be born.
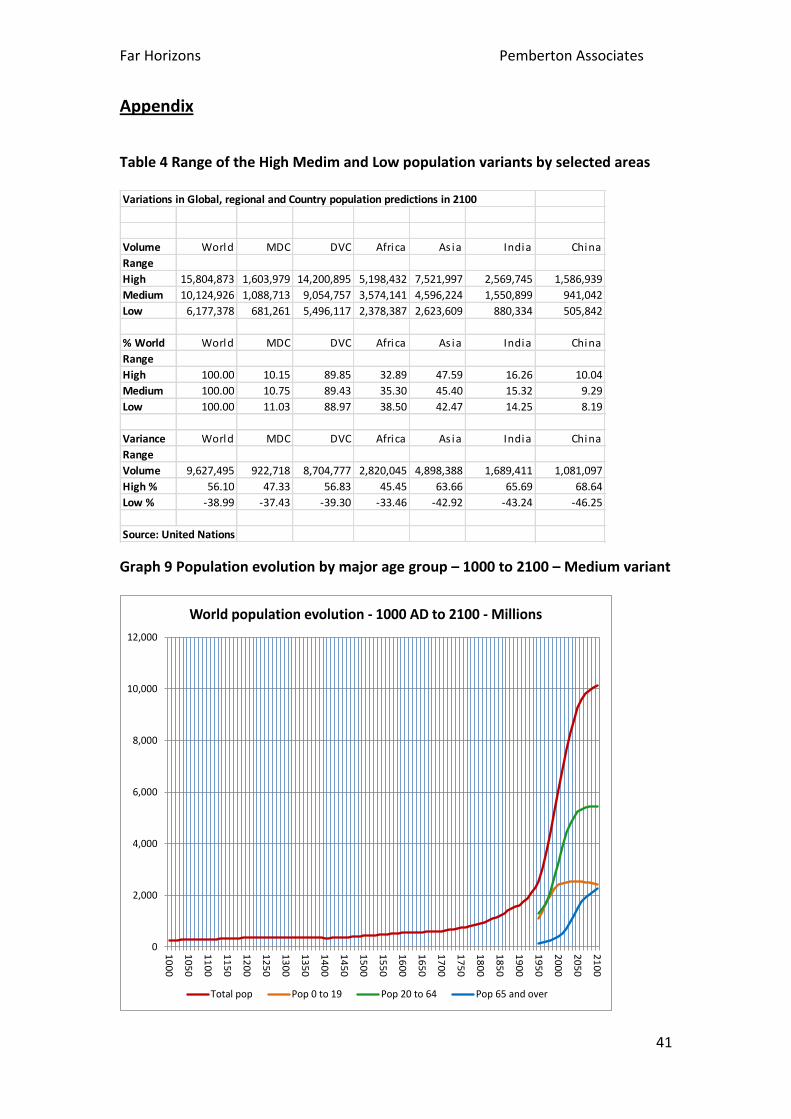
Key points regarding human and social development: The population is growing at a remarkable rate. Global population, assessed as 2.5 billion in 1950, more than doubled in the 40 years to 1990 to 5.3 billion. The twenty years to 2010 added a further 1.6 billion, raising the world total to 6.9 billion. The 40 years to 2050 are expected to add a further 2.4 billion, lifting the total to 9.3 billion, but a slowing of the rate of growth suggests that the global population will be 10.1 billion by 2100. There has been a continuous move from rural to urban living. In 1960 the urban population was assessed at 34% of the total population. By the year 2000, the proportion had risen to 47%, with the rate of migration increase rising to 54% by 2010. Current forecasts suggest that urban living will rise to 66% by 2050 and 74% by 2100. Even allowing for this mass movement to towns and cities, the numbers suggest that 3.2 billion still live in a rural environment in 2010 and that there will still be 3.1 rural dwellers by 2050 and 2.6 billion by 2100.
Far Horizons Pemberton Associates
6
The rapid rise in population combined with the move from rural to urban life has seen a reduction in the number of people in a household. This trend in the reduction is household size is expected to continue. The corollary of these moves is that the number of dwellings required to house the additional families increases at afar faster rate than raw population growth. There were an assessed 637 million dwellings in 1960, and more than trebling to 1.86 billion by 2010, assuming that each family was adequately housed. The prediction is that the total number of dwellings will need to increase to 3.4 billion by 2050 and 4.5 billion by 2100. It is clear that concerted action on a global scale will be required if these billions of new human beings are to be adequately housed fed and nurtured. One of the main facilitators of progress has been and is likely to remain the motor vehicle. The key automotive points that follow provide a picture of the size and scale of the increase in motorisation necessary to manage the future.
Key points regarding automotive development: The forecast, on a business as usual scenario, is that the number of vehicles on the roads of the world will need to rise from the 2010 level of 1.02 billion to 2.28 billion in 2050 and 3.06 billion in 2100, meaning a doubling in the size of the parc by 2050 and a tripling in size by 2100. The number of vehicles produced and sold from the inception of the industry to 2010 is assessed as 2.46 billion units. Future demand is forecast to dwarf this volume, with a predicted volume of 5.9 billion units being produced between 2011 and 2050, and a further 13.1 billion units between 2051 and 2100. As vehicles have an average weight of 1.3 tonnes, slowly reducing, with 76% ferrous and non-ferrous metal content, the vehicles produced will continue to consume large volumes of natural resources. Although the average vehicle weight – passenger cars and commercial vehicles combined - is currently 1.3 tonnes, higher specifications are adding weight to vehicles even though attempts are being made to take weight out of the product to improve performance. This weight increase is being partially mitigated by moves to smaller segment vehicles. It is considered appropriate to use the weight of 1.25 tonnes for products of the future in terms of this document. Consequently the weight of material to be used in the production and sales of vehicles is assessed at 7.4 billion tonnes for the period 2101 to 2050 and 15.8 billion tonnes for the period 2051 to 2100, with the weight of metal for the two periods being 5.6 billion tonnes and 12 billion tonnes respectively. These are huge numbers and will impact powerfully on the conservation of natural resources. Much of the metal content is theoretically recoverable through the scrapping process as described in point three, following. The production/sales forecast means that the number of vehicles needing to be scrapped rises dramatically. Vehicles currently have an average life, on a global
Far Horizons Pemberton Associates
7
basis, of circa 14 years, although this is reducing. Consequently, 4.6 billion units will need to be scrapped between 2011 and 2050 and 12.3 billion between 2051 and 2100. Ideally, to avoid contamination, each of these units should be de-polluted, reprocessed and recycled to ensure maximum reuse of the invaluable components they contain, and to minimize the need for the consumption of additional scarce resources. These numbers mean that the weight arising from the scrappage of vehicles calculates out at a cumulative 5.8 billion tonnes, of which 4.4 billion tonnes will be ferrous/non-ferrous, for the period 2011 to 2050 inclusive and 14.8 billion tonnes, of which 11.3 billion tonnes will be ferrous/non-ferrous for the period 2051 to 2100. These are huge numbers and will impact powerfully on the conservation of natural resources. In theory, therefore, the automotive industry should be almost self-sustaining through the re-use of extant materials. In practice, this will require a major effort of will by the governments and global authorities to be achieved. It is abundantly clear that – over time - automotive propulsion systems must move away from the current reliance on internal combustion engines powered by fluids i.e. gasoline and diesel. Much work is being done on alternative fuels, but a suitable method that manages to cover all the operating requirements in all countries, for the future spread of motorisation is still elusive.
Conclusion The concerns of the present surrounding increasing motorisation and its contribution to climate change will not change the need for further expansion to meet the needs of future generations in an expanding population. It could be that a breakthrough in technology is achievable and low cost mass production of fuel cells, for example, will occur not too far in the future, that will satisfy the needs of both the developed and developing worlds, without the need for massive new power generation projects and distribution grids. In the meantime, the need to minimise the use of fossil fuels such as oil and coal will need to be minimised, with potentially shale gas, for example, used to extend the life of natural resources including development for use in automotive power systems. There is no clear or obvious route through the quandary of a rapidly expanding population and the need to work towards a low carbon economy. Further, it is inevitable that billions of the people born in decades to come will be born into poverty but will still need to be nourished. Calculations suggest that almost 50% of the world’s population could be living in poverty by 2050 unless current policies are changed, and as the majority of people yet to be born live in the developing and least developed countries, it is hard, at present, to imagine this proportion reducing in the years from 2050 to 2100.

Far Horizons Pemberton Associates
8
The lead times necessary for changes in personal income, brought about by growth levels of GDP that are faster than the growth rates of population, plus the reallocation of income from the heavily skewed distributions that currently exist, which are necessary to allow nations and their people to lift themselves to even a relative level of development, are too extended for “normal” solutions to operate. Given the foregoing, it seems inevitable that the world will meet the equivalent of an immovable object meeting an irresistible force in the not too distant future. The twin objectives of creating a low carbon world will meet the need to feed and nurture future generations of humanity, potentially leading to conflict between low emissions, climate change and global warming and the basic welfare of mankind.
Far Horizons Pemberton Associates
9
Objective of Far Horizons The aim of this document is to create an objective, non-judgemental and robust long-term prediction of the likely shape and structure of global society in the years leading up to 2100, the rate of its transition and the response required from governments, industry and society. The central theme is the automotive industry and its importance to all aspects of development.
Purpose
Global structure and society is changing rapidly. The pace of change in population growth, technology, communications, governance, and society is struggling to keep up. Motorisation will need to expand dramatically as part of the equation if the needs of humanity are to be met in the future. Although motorisation, a fundamental part of the development of society, seems ubiquitous and it is impossible to imagine life and progress without it, in reality, motorisation remains at present concentrated in a small proportion of the population. This document attempts to set out a “core” prediction for the size, shape and structure of the automotive industry by the year 2100, its relationship to the needs of the world from now to that time and infers the actions required by society to meet the demands of the future. As stated previously, the forecast has been developed on a “business as usual” basis, but this approach is essential to allow views to be taken as to alternatives.
Method Some of the key drivers of development of all aspects of society, including motorisation, are population, income and the stage of development reached by each nation. Accurate and robust information is available for several variables for the 50 year period from 1960 to 2010. Less detailed information is available prior to that. Hard forecasts are available on the main determinants of the future, the size, gender and age structure of the population, by country as provided by the United Nations. Historic GDP data is from the World Bank series using the Constant (inflation adjusted) metric, denominated in $US, to provide a consistent, internationally comparable time-series for each nation. Actual data is used for the period 1960 to 2010, with all forecasts from Pemberton Associates. All automotive data is from the Pemberton Associates’ database, and shows actual data for the metrics for the period 1960 to 2010. Information prior to 1960 is sourced wherever possible from actual industry information, or inferred through partial information through regression and smoothing techniques.
Far Horizons Pemberton Associates
10
Data on urbanisation, the number of households and household size is based on World Bank and United Nations data, but longer term forecasts are provided by Pemberton Associates. All automotive forecasts have been prepared using the Pemberton Associates in-house forecasting and modelling programme.
The automotive environment
Operating environment A substantial spread and increase in motorisation seems inevitable, as is described in the “core” forecast contained in this document. The sheer volume of vehicles predicted for the future demand that all existing and potential means of motive power need to be considered in parallel with the increase in demand to ensure that in the future, vehicles will be able to operate in the environment obtaining in each market, and globally, and that rapidly expanding populations have access to the motorisation that will become essential to their progress. Concerns over climate change and global warming suggest that a “low carbon” solution to further motorisation should be the default position, but this will mean different things for different parts of the world. Considerations over the low carbon solution, combined with the varying levels of social, economic and technical progress that will obtain in the markets of the future, lead to the need to examine a number of scenarios, including: Is the supply of oil running out, and if so, how fast and when will supplies be inadequate to meet demand? Will oil eventually become too expensive for use in motor vehicles, aircraft, shipping and power generation? Can LPG/CNG be used to replace oil, either partly or completely, at least in the medium term? The IEA suggests that 250 years’ worth of supply have already been discovered, with the potential for significant new discoveries still to be made. Should the use of fluids (gasoline/diesel) be reserved for those areas of the world where alternative forms of motive power will be unsuitable or unavailable?
Operating conditions Motor vehicles currently operate just about everywhere around the world and extant automotive technology caters reasonably well for most operating conditions, contending with different levels of operating requirements, for example:
Sub-zero temperatures to desert heat (50 C)
Variable fuel quality (octane/compression ratios)
Far Horizons Pemberton Associates
11
Roads varying from motorways to tracks
Dense traffic to negligible traffic (stop-start)
High availability of service stations to scarcity
Mega-cities to rural
High levels of income to poverty levels of subsistence
Saturation levels of motorisation to negligible levels of ownership
Operating regions Advances in technology show that there will be four distinct regions around the world, each needing to be served by appropriate product:
More Developed Countries(MDCs) and other Economically Developed Countries (EDCs)
Countries in transition from the Developing Countries (DVCs) category to the MDC/EDC stage
Developing Countries (DVCs)
Least Developed Countries (LDCs). It should be noted that the population in countries in this category is growing rapidly. They represented 8% of the global population in 1960, had increased to 12% by 2000, are forecast at 18% by 2050 and 26% by 2100, should their economic condition not improve relative to the rest of the world. It should also be noted that the majority of LDC nations/populations are in Africa.
The product The current world wide vehicle parc of more than one billion vehicles is composed almost exclusively of internal combustion engined vehicles. The forecast shows that the global vehicle parc will increase by an additional 181 million vehicles by 2015 and a further 186 million vehicles by 2020, after allowing for vehicle scrappage to be taken into account, taking the parc size from 1.02 billion in 2010 to 1.41 billion in 2020, an increase of 400 million vehicles. Even allowing for a significant growth rate for Hybrid, Plug-in Hybrid, Range Extended Hybrid and Battery Electric vehicles, it is probable that more than 98% of the world wide fleet will still contain fluid based drive trains by 2020, but the following needs to be considered:
Far Horizons Pemberton Associates
12
The increasing price of oil continues to affect the choice of fuel type and vehicle segment, with the popularity of diesel engines rising and a move to more efficient, smaller segment cars apparent, including in the developed world
Further development of the internal combustion engine, drive trains and advanced vehicle engineering will continue to improve fuel economy and reduce emissions
Technical developments are constantly improving vehicle efficiencies and carbon emissions, not least through the use of lighter weight materials and improved rolling resistance
It may well be necessary for the industry to design and produce vehicles for use in developing nations that are suitable for the operating conditions there, as well as being affordable. This will include vehicles with long range fuel capacity
It may well be necessary to design vehicles that are adaptable to various propulsion systems
The industry Even though the industry has undergone fundamental change in recent years, including extensive closure of older, uneconomic capacity in W Europe, N America and Japan, there is still more to come. As the automotive market swings rapidly to the developing world, so also will production. This transfer is already well under way. The MDC region produced in excess of 80% of all vehicles until 1992, and more than 75% until 2001. Since then, the decline in the MDC share has been rapid, falling to 42% by 2011 Vehicles in the future will be produced increasingly in the new markets and suitable for the new markets, which means smaller products with lower profit margins Increasing numbers of vehicles will be produced for export in the developing markets, with these vehicles being targeted at the developed world, as has been the case in the past with Japanese and Korean vehicles. There will be some modest recovery of sales in MDC region, but the markets of W Europe, Japan and the USA are largely mature and saturated. It is probable that manufacturers in these areas will come under intense pressure from new, imported products, with “Western” manufacturers forced to depend on the production of “Premium” products in their domestic markets The number of production facilities around, based on a double-shift capacity of 300,000 units a year and with an 8% down-time, will need to increase from 270
Far Horizons Pemberton Associates
13
factories in 2010 to 744 by 2050 and to 1,172 by 2100, each with their own support, supply and distribution infrastructure
Drive train options The drive trains that need to be considered, including their geographical and economic relevance are:
ICG – Internal Combustion, Gasoline
ICD – Internal Combustion, Diesel
ICLPG – Internal Combustion, Liquid Petroleum Gas
ICCNG - Internal Combustion, Compressed Natural Gas
ICBH – Internal Combustion, Battery Hybrid
ICPBH – Internal Combustion, Plug in Battery Hybrid
REICPBH – Range Extended, Internal Combustion, Plug in Battery Hybrid
BEVNM – Battery Electric Vehicle – Nickel Metal
BEVLI – Battery Electric Vehicle – Lithium
ELFC – Electric Vehicle – Fuel Cell Some of the pro’s and con’s of these options are shown in the appendix.
Far Horizons Pemberton Associates
14
Summary
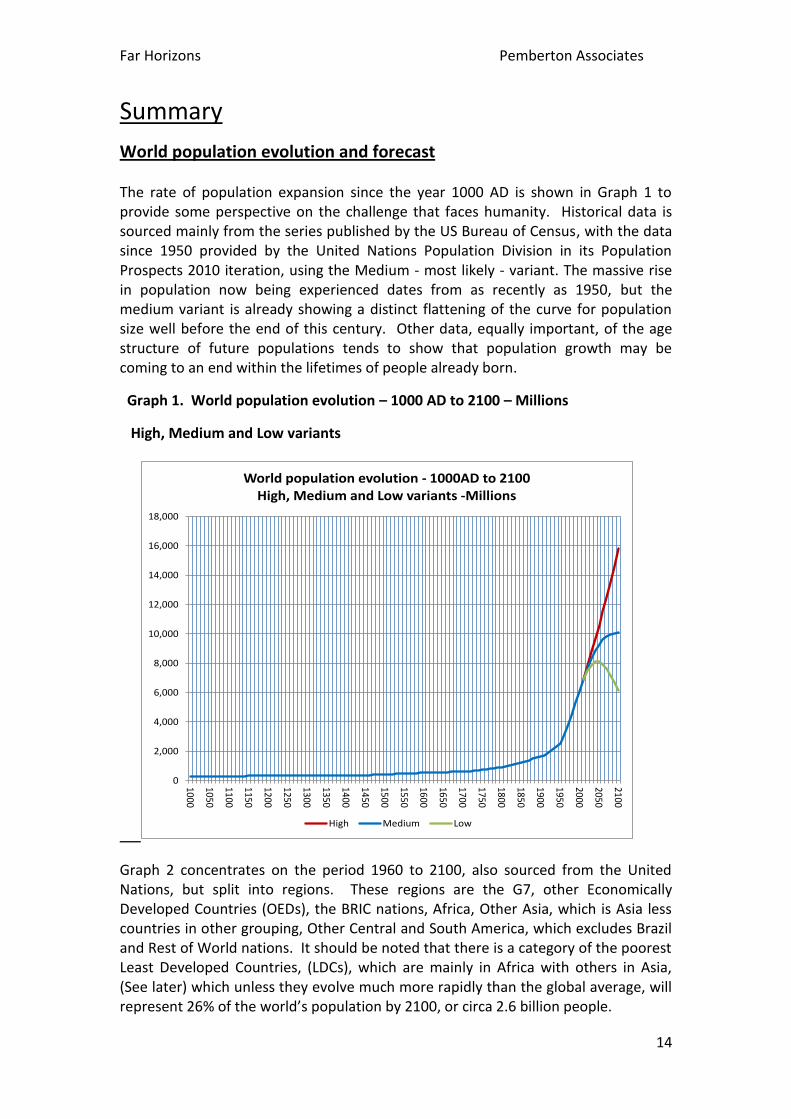
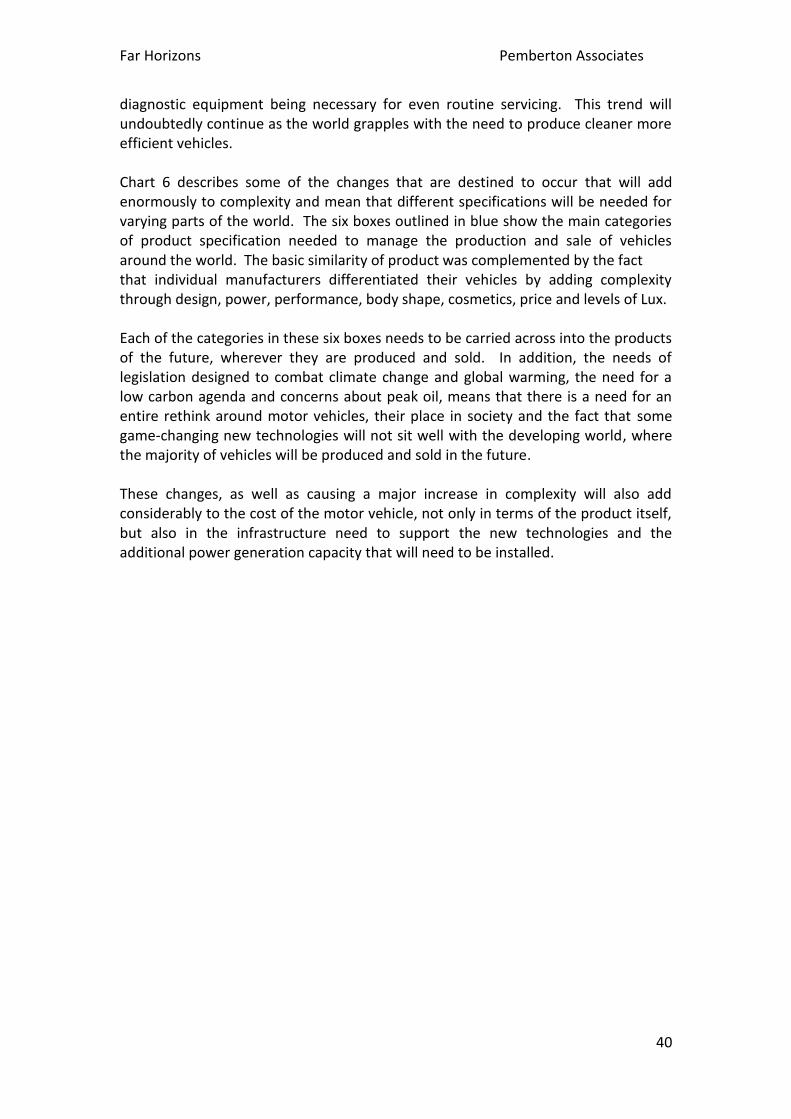
World population evolution and forecast The rate of population expansion since the year 1000 AD is shown in Graph 1 to provide some perspective on the challenge that faces humanity. Historical data is sourced mainly from the series published by the US Bureau of Census, with the data since 1950 provided by the United Nations Population Division in its Population Prospects 2010 iteration, using the Medium - most likely - variant. The massive rise in population now being experienced dates from as recently as 1950, but the medium variant is already showing a distinct flattening of the curve for population size well before the end of this century. Other data, equally important, of the age structure of future populations tends to show that population growth may be coming to an end within the lifetimes of people already born.
Graph 1. World population evolution – 1000 AD to 2100 – Millions
High, Medium and Low variants
Graph 2 concentrates on the period 1960 to 2100, also sourced from the United Nations, but split into regions. These regions are the G7, other Economically Developed Countries (OEDs), the BRIC nations, Africa, Other Asia, which is Asia less countries in other grouping, Other Central and South America, which excludes Brazil and Rest of World nations. It should be noted that there is a category of the poorest Least Developed Countries, (LDCs), which are mainly in Africa with others in Asia, (See later) which unless they evolve much more rapidly than the global average, will represent 26% of the world’s population by 2100, or circa 2.6 billion people.
0
2,000
4,000
6,000
8,000
10,000
12,000
14,000
16,000
18,000
1000
1050
1100
1150
1200
1250
1300
1350
1400
1450
1500
1550
1600
1650
1700
1750
1800
1850
1900
1950
2000
2050
2100
World population evolution - 1000AD to 2100 High, Medium and Low variants -Millions
High Medium Low
Far Horizons Pemberton Associates
15
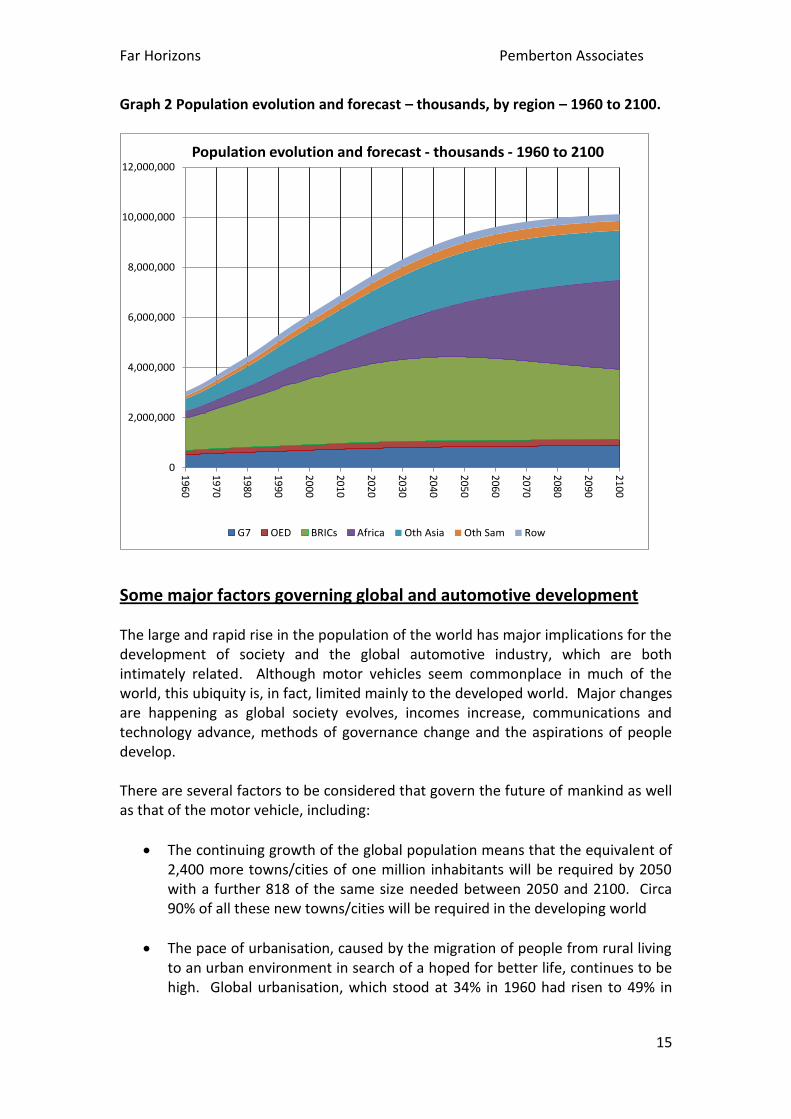
Graph 2 Population evolution and forecast – thousands, by region – 1960 to 2100.
Some major factors governing global and automotive development The large and rapid rise in the population of the world has major implications for the development of society and the global automotive industry, which are both intimately related. Although motor vehicles seem commonplace in much of the world, this ubiquity is, in fact, limited mainly to the developed world. Major changes are happening as global society evolves, incomes increase, communications and technology advance, methods of governance change and the aspirations of people develop. There are several factors to be considered that govern the future of mankind as well as that of the motor vehicle, including:
The continuing growth of the global population means that the equivalent of 2,400 more towns/cities of one million inhabitants will be required by 2050 with a further 818 of the same size needed between 2050 and 2100. Circa 90% of all these new towns/cities will be required in the developing world
The pace of urbanisation, caused by the migration of people from rural living to an urban environment in search of a hoped for better life, continues to be high. Global urbanisation, which stood at 34% in 1960 had risen to 49% in
0
2,000,000
4,000,000
6,000,000
8,000,000
10,000,000
12,000,000
1960
1970
1980
1990
2000
2010
2020
2030
2040
2050
2060
2070
2080
2090
2100
Population evolution and forecast - thousands - 1960 to 2100
G7 OED BRICs Africa Oth Asia Oth Sam Row
Far Horizons Pemberton Associates
16
the year 2000, to 54% by 2010, and is forecast to reach 66% by 2050 and 74% by 2100
The number of households in existence is expected to increase at a faster rate than overall population growth due to a decline in the number of people in a household. Average household size was assessed at 4.8 people per household in 1960, falling to 4.0 in 2000 and at 3.7 per household in 2010. Household size is predicted at 2.8 by 2050 and 2.2 by 2100. For purposes of comparison, household size in W Europe has already reduced to 2.3 and to 2.4 in the USA
The mix of population increase, the move to urban living and a decrease in the number of people constituting a household will lead to a dramatic increase in the total number of households. This leads to an increase in the number of dwellings that will be needed in the future. The forecast suggests that an additional 1.5 billion dwellings will be needed by 2050, with a further 1.16 billion needed by 2100. Circa 85% of these additional dwellings will be required in the developing world, with the majority needing to be constructed in an urban environment, proving to be a factor in the rise of Mega-Cities. These numbers are almost certainly understated as they assume that each household is adequately sheltered at present
The incremental transport needs to service the new population and the ageing existing population means that ever more passenger cars and commercial vehicles will be required, as well as new railways, aircraft and shipping fleets, plus their associated supply, maintenance and distribution networks
The growth in motorisation necessary to support the increase in all forms of human activity demand that a major programme of infrastructure development is needed, not least the provision of new roads and all support activities
Quarrying activities will need to be developed and expanded to meet the needs of the infrastructure that must be installed, first for the major change required by 2050, then the need to cope with the additional demands of continued growth to 2100
The conservation of natural resources will be a major feature of the expansion of motorisation and other activities, requiring the global development of all forms of recycling and reprocessing of scrapped materials
Adequate supplies of water, water storage and cleansing facilities and an efficient sewage system will need to be installed in advance of the increase in population
Far Horizons Pemberton Associates
17
New capital plant and infrastructure for power generation will be required, with their associated distribution grids and power plants will need to supplied with fuel
The need to feed and nurture the expanding population means that food production, including livestock, will need to double by 2100 and will require large new areas of land to be utilized
Hospitals, schools, colleges and universities need to be built to serve the medical and educational needs of the additional billions of people
The nature of the need to feed, nurture, educate and develop the social systems required, along with their distribution networks means that road transport will bear the burden of virtually all these activities in the future. Two and three wheel transport may well play a major role in poorer economies, in both urban and rural environments
The fastest growing populations in the world are generally in the poorest countries, making the challenge of supporting their populations even more difficult. This is particularly true of the Least Developed Countries, the majority of which are in Africa
Africa, for example, has one of the fastest growing populations. The continent was home to 282 million people in 1960. The population had almost quadrupled, to 1.03 billion by 2010, is expected to reach two billion by 2050 and 3.57 billion by 2100, when it will be home to circa 35% of the world total, more than the entire population of the BRIC countries at their peak. The challenges in providing the basic necessities alone in Africa are, and will be, daunting
Income distribution is unequal across the nations of the world with access to GDP heavily skewed to the top 20% of the population, particularly in the developing world. Modification of income distribution would lead to a major reduction in the level of poverty forecast, which cannot be achieved by economic growth alone. The dichotomy is that by reducing poverty, the number of people that can afford motorisation at some level will increase, driving up the number of vehicles on the roads of the world even further
The wide variations between countries in the ability of populations to afford motorisation means that differing levels of technology will need to be employed to ensure that products are affordable
A low-carbon future should be the default position for the advancement of motorisation, but the differing levels of technological development obtaining across nation states suggest that fossil fuels should be retained for the poorest nations to ensure that basic levels of motorisation remain available
Far Horizons Pemberton Associates
18
Development in the automotive industry requires the continued application of new materials, technologies, production techniques and the design of vehicles with disposal in mind. However, the level of technological development currently achieved varies country by country and no single technology will be suitable for all nations in the future
The number of new facilities for the production/assembly of motor vehicles needs to increase to keep pace with demand. Virtually all the new capacity will need be erected in the developing world to ensure employment and the need to keep costs at a level affordable by local populations. By extension, this means that entire supply chains will need to be located locally as well.
There is a distinct possibility that the new production sites will provide a continuous supply of well made, advanced and inexpensive vehicles for export that prove attractive to the developed world. This will place ever more pressure on the manufacturers in high cost economies and could well lead to the position were only premium vehicles are produced in the developed world and would increase the pace at which the production of vehicles in the future moves away from its current pattern
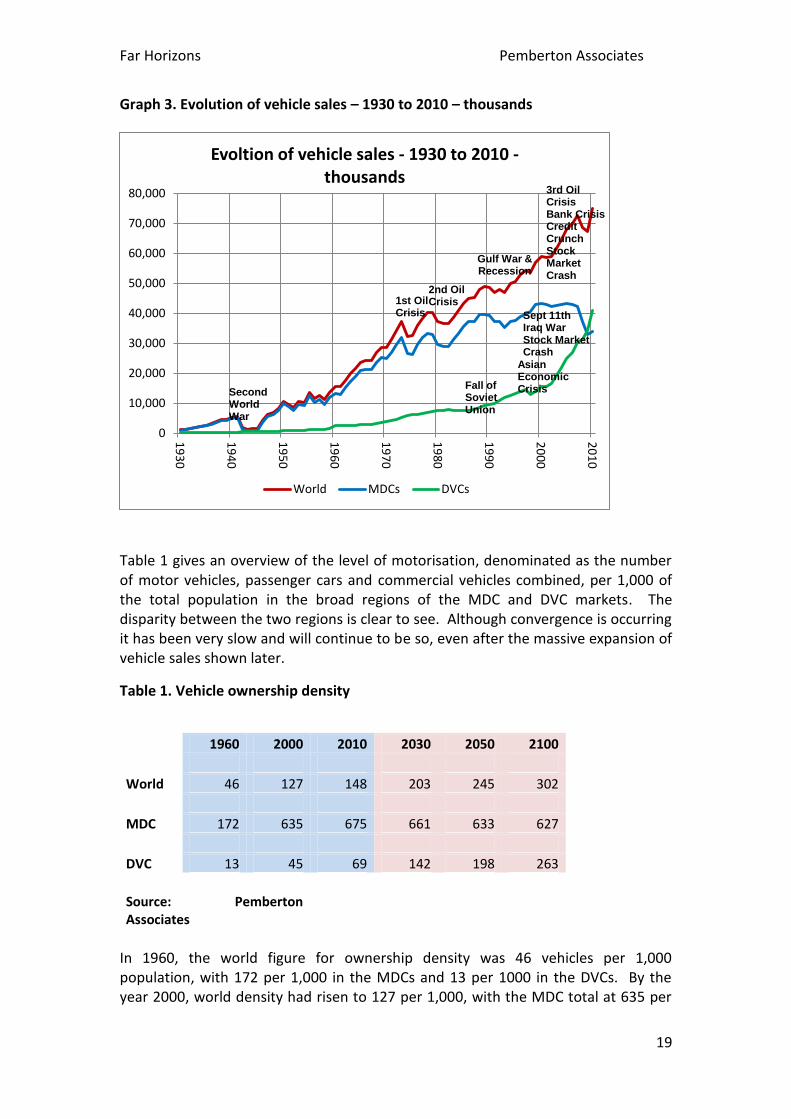
The market There are many who believe that there are already too many vehicles on the roads of the world and that future demand should be curtailed or even reduced. The likelihood of reducing the level of motorisation however is negligible, due to its fundamental role in allowing the human race to progress and develop. Although the industry has been actively producing vehicles for more than a hundred years, it is still in its infancy. The major expansion in sales and production effectively began in 1960, 70 years or so after its genesis. Graph 3 provides a simple outline of the progress of the industry in terms of the volume of vehicles produced and sold for the 80 year period from 1930 to 2010, including some of the major shocks and events that afflicted the world over that time. It shows that these “shocks” slowed but did not halt the progress of the industry. It also shows how the MDC countries dominated the evolution of the market through to 1990 before stabilizing as the region approached saturation levels of motorisation. This situation is now changing, with the core of automotive activity moving rapidly from the “traditional” triad core areas of W Europe, Japan and the USA to the developing world, and in particular Asia. Although the nations in the MDC countries have high levels of motorisation the picture is very different in the DVC region, where ownership levels in many nations are negligible.
Far Horizons Pemberton Associates
19
Graph 3. Evolution of vehicle sales – 1930 to 2010 – thousands
Table 1 gives an overview of the level of motorisation, denominated as the number of motor vehicles, passenger cars and commercial vehicles combined, per 1,000 of the total population in the broad regions of the MDC and DVC markets. The disparity between the two regions is clear to see. Although convergence is occurring it has been very slow and will continue to be so, even after the massive expansion of vehicle sales shown later.
Table 1. Vehicle ownership density
1960 2000 2010 2030 2050 2100
World 46 127 148 203 245 302
MDC 172 635 675 661 633 627
DVC 13 45 69 142 198 263
Source: Pemberton Associates
In 1960, the world figure for ownership density was 46 vehicles per 1,000 population, with 172 per 1,000 in the MDCs and 13 per 1000 in the DVCs. By the year 2000, world density had risen to 127 per 1,000, with the MDC total at 635 per
0
10,000
20,000
30,000
40,000
50,000
60,000
70,000
80,000
19
30
19
40
19
50
19
60
19
70
19
80
19
90
20
00
20
10
Evoltion of vehicle sales - 1930 to 2010 - thousands
World MDCs DVCs
1st Oil Crisis
2nd Oil Crisis
Gulf War & Recession
Sept 11th Iraq War Stock Market Crash
3rd Oil Crisis Bank Crisis Credit Crunch Stock Market Crash
Second World War
Asian Economic Crisis Fall of
Soviet Union
Far Horizons Pemberton Associates
20
1,000 and the DVCs at 45 per 1,000. Further increases in motorisation have occurred, with the world data in 2010 at 148 per 1,000, the MDCs at 675 per 1,000 and the DVCs at 69 per 1000. The MDC density is considered to represent maturity, with saturation levels of ownership, and little scope for additional motorisation. The forecast data for the MDCs shows slightly reducing ownership densities, due to changes in the age structure of the population. Ownership density in the DVC region will continue to expand but is unlikely ever to approach MDC levels. The forecast shows that, despite the major increase in the volume of vehicles produced and sold and the increase in the number of vehicles in circulation in 2100, resultant ownership densities reach only 263 vehicles per 1,000 in the DVCs due to the continued increase in the size of the DVC population. In fact, the level of 263 in 2100 is only equal to that obtained in the MDC region 135 years earlier, in 1965.
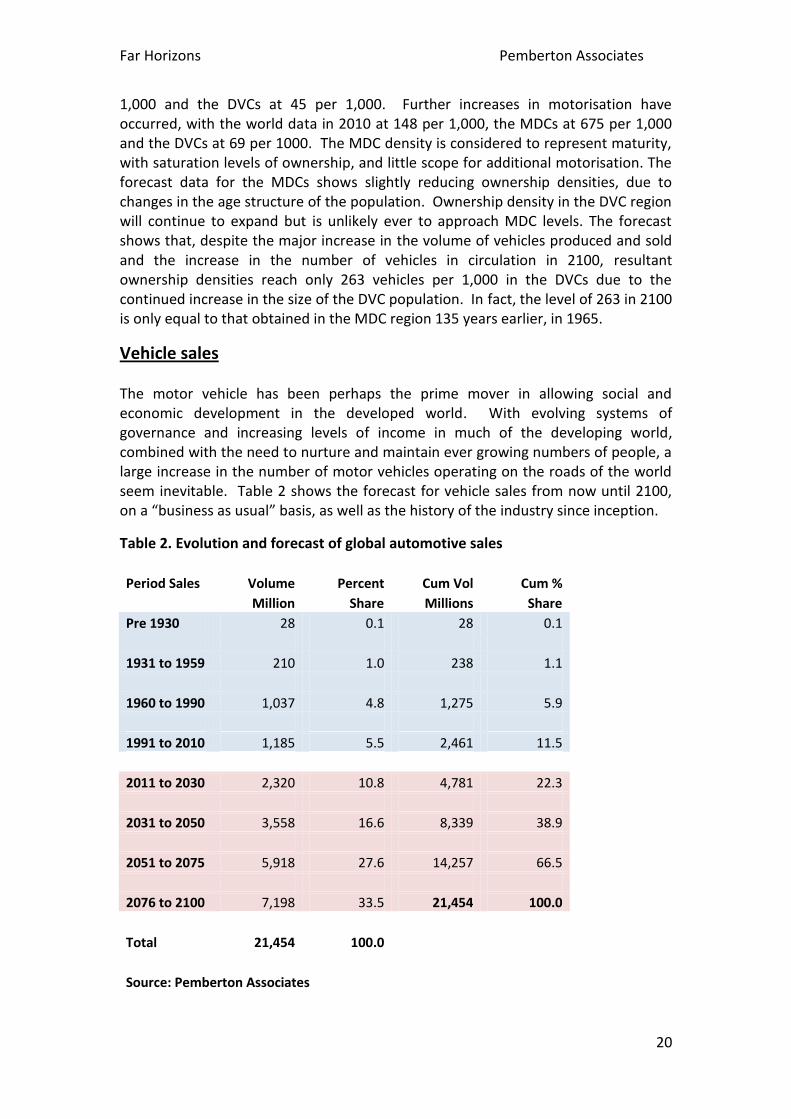
Vehicle sales The motor vehicle has been perhaps the prime mover in allowing social and economic development in the developed world. With evolving systems of governance and increasing levels of income in much of the developing world, combined with the need to nurture and maintain ever growing numbers of people, a large increase in the number of motor vehicles operating on the roads of the world seem inevitable. Table 2 shows the forecast for vehicle sales from now until 2100, on a “business as usual” basis, as well as the history of the industry since inception.
Table 2. Evolution and forecast of global automotive sales
Period Sales Volume Percent Cum Vol Cum %
Million Share Millions Share
Pre 1930 28 0.1 28 0.1
1931 to 1959 210 1.0 238 1.1
1960 to 1990 1,037 4.8 1,275 5.9
1991 to 2010 1,185 5.5 2,461 11.5
2011 to 2030 2,320 10.8 4,781 22.3
2031 to 2050 3,558 16.6 8,339 38.9
2051 to 2075 5,918 27.6 14,257 66.5
2076 to 2100 7,198 33.5 21,454 100.0
Total 21,454 100.0
Source: Pemberton Associates
Far Horizons Pemberton Associates
21
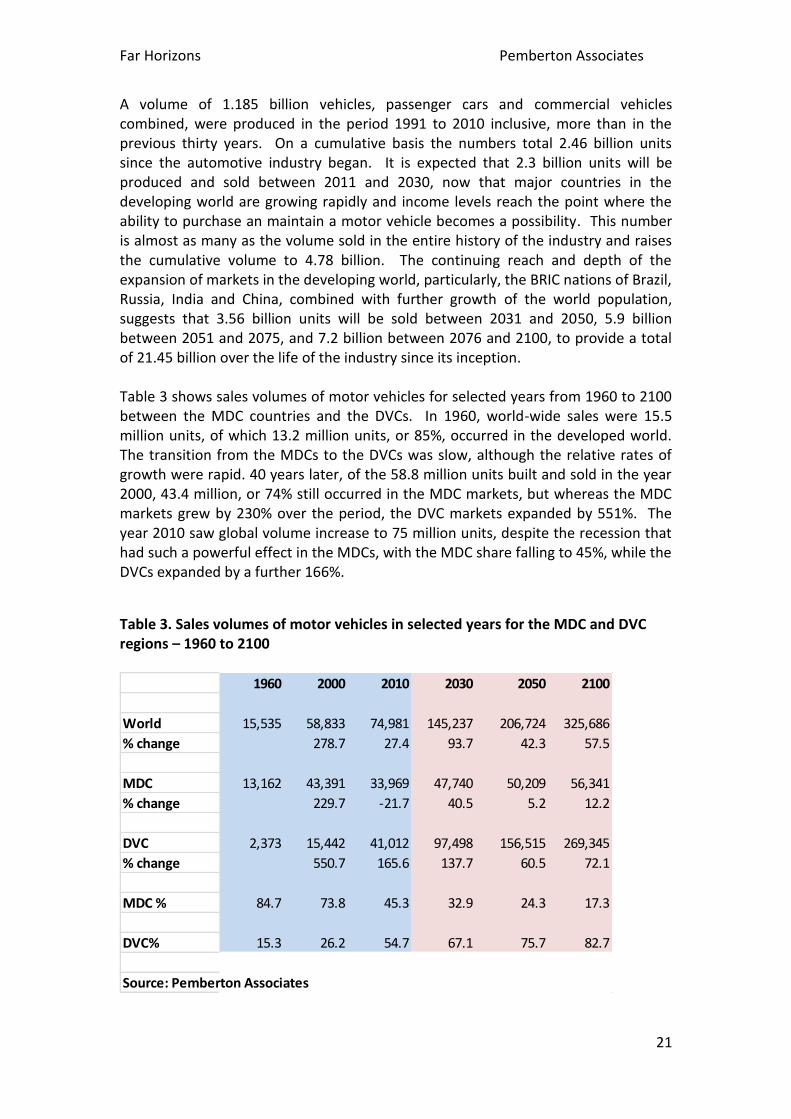
A volume of 1.185 billion vehicles, passenger cars and commercial vehicles combined, were produced in the period 1991 to 2010 inclusive, more than in the previous thirty years. On a cumulative basis the numbers total 2.46 billion units since the automotive industry began. It is expected that 2.3 billion units will be produced and sold between 2011 and 2030, now that major countries in the developing world are growing rapidly and income levels reach the point where the ability to purchase an maintain a motor vehicle becomes a possibility. This number is almost as many as the volume sold in the entire history of the industry and raises the cumulative volume to 4.78 billion. The continuing reach and depth of the expansion of markets in the developing world, particularly, the BRIC nations of Brazil, Russia, India and China, combined with further growth of the world population, suggests that 3.56 billion units will be sold between 2031 and 2050, 5.9 billion between 2051 and 2075, and 7.2 billion between 2076 and 2100, to provide a total of 21.45 billion over the life of the industry since its inception. Table 3 shows sales volumes of motor vehicles for selected years from 1960 to 2100 between the MDC countries and the DVCs. In 1960, world-wide sales were 15.5 million units, of which 13.2 million units, or 85%, occurred in the developed world. The transition from the MDCs to the DVCs was slow, although the relative rates of growth were rapid. 40 years later, of the 58.8 million units built and sold in the year 2000, 43.4 million, or 74% still occurred in the MDC markets, but whereas the MDC markets grew by 230% over the period, the DVC markets expanded by 551%. The year 2010 saw global volume increase to 75 million units, despite the recession that had such a powerful effect in the MDCs, with the MDC share falling to 45%, while the DVCs expanded by a further 166%.
Table 3. Sales volumes of motor vehicles in selected years for the MDC and DVC regions – 1960 to 2100
1960 2000 2010 2030 2050 2100
World 15,535 58,833 74,981 145,237 206,724 325,686
% change 278.7 27.4 93.7 42.3 57.5
MDC 13,162 43,391 33,969 47,740 50,209 56,341
% change 229.7 -21.7 40.5 5.2 12.2
DVC 2,373 15,442 41,012 97,498 156,515 269,345
% change 550.7 165.6 137.7 60.5 72.1
MDC % 84.7 73.8 45.3 32.9 24.3 17.3
DVC% 15.3 26.2 54.7 67.1 75.7 82.7
Source: Pemberton Associates
Far Horizons Pemberton Associates
22
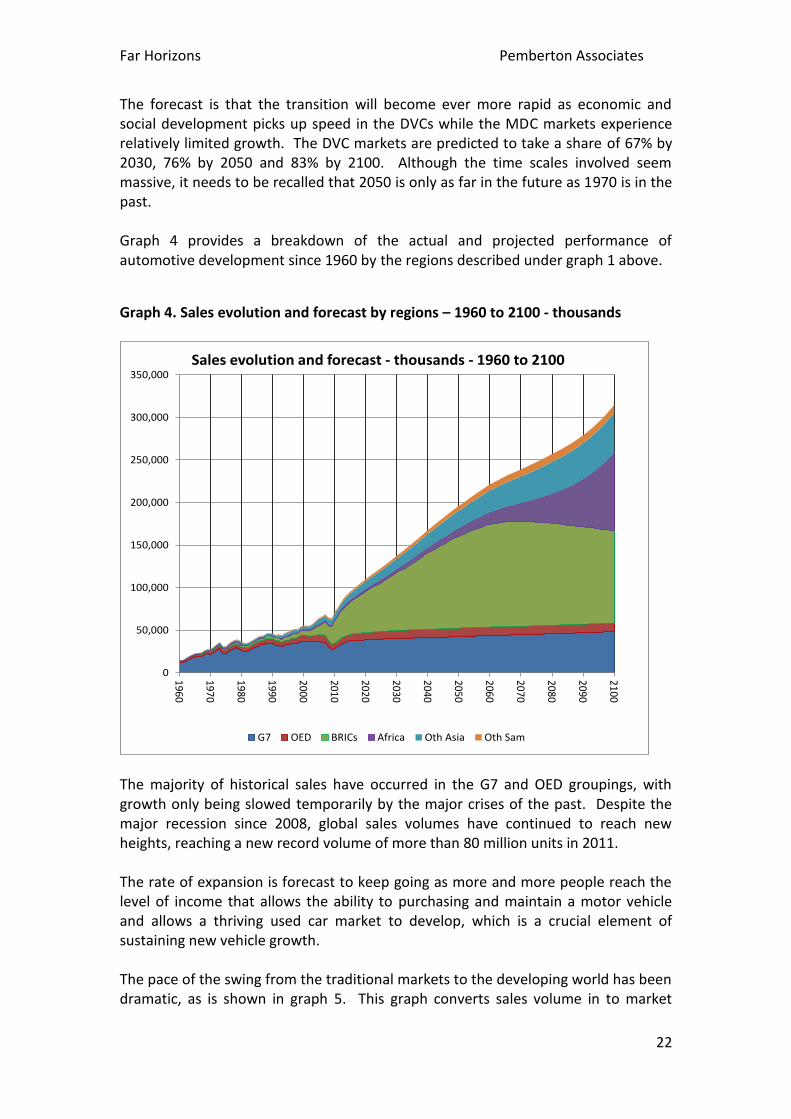
The forecast is that the transition will become ever more rapid as economic and social development picks up speed in the DVCs while the MDC markets experience relatively limited growth. The DVC markets are predicted to take a share of 67% by 2030, 76% by 2050 and 83% by 2100. Although the time scales involved seem massive, it needs to be recalled that 2050 is only as far in the future as 1970 is in the past. Graph 4 provides a breakdown of the actual and projected performance of automotive development since 1960 by the regions described under graph 1 above.
Graph 4. Sales evolution and forecast by regions – 1960 to 2100 - thousands
The majority of historical sales have occurred in the G7 and OED groupings, with growth only being slowed temporarily by the major crises of the past. Despite the major recession since 2008, global sales volumes have continued to reach new heights, reaching a new record volume of more than 80 million units in 2011. The rate of expansion is forecast to keep going as more and more people reach the level of income that allows the ability to purchasing and maintain a motor vehicle and allows a thriving used car market to develop, which is a crucial element of sustaining new vehicle growth. The pace of the swing from the traditional markets to the developing world has been dramatic, as is shown in graph 5. This graph converts sales volume in to market
0
50,000
100,000
150,000
200,000
250,000
300,000
350,000
1960
1970
1980
1990
2000
2010
2020
2030
2040
2050
2060
2070
2080
2090
2100
Sales evolution and forecast - thousands - 1960 to 2100
G7 OED BRICs Africa Oth Asia Oth Sam
Far Horizons Pemberton Associates
23
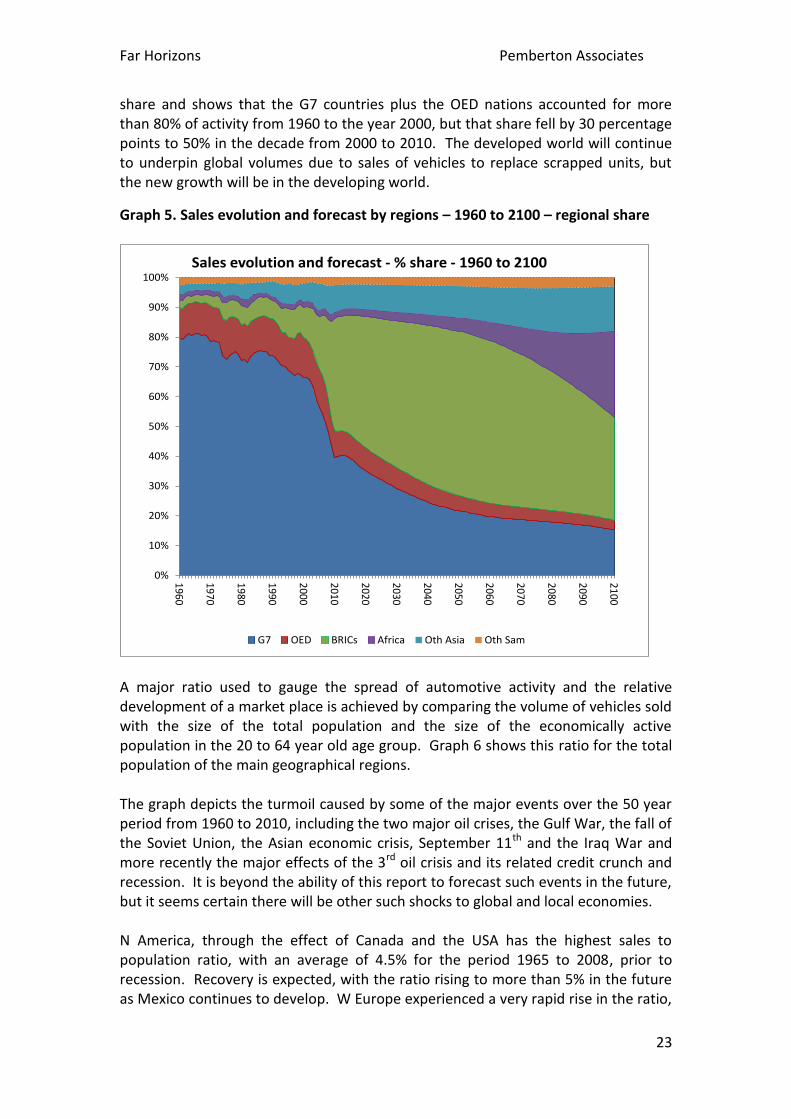
share and shows that the G7 countries plus the OED nations accounted for more than 80% of activity from 1960 to the year 2000, but that share fell by 30 percentage points to 50% in the decade from 2000 to 2010. The developed world will continue to underpin global volumes due to sales of vehicles to replace scrapped units, but the new growth will be in the developing world.
Graph 5. Sales evolution and forecast by regions – 1960 to 2100 – regional share
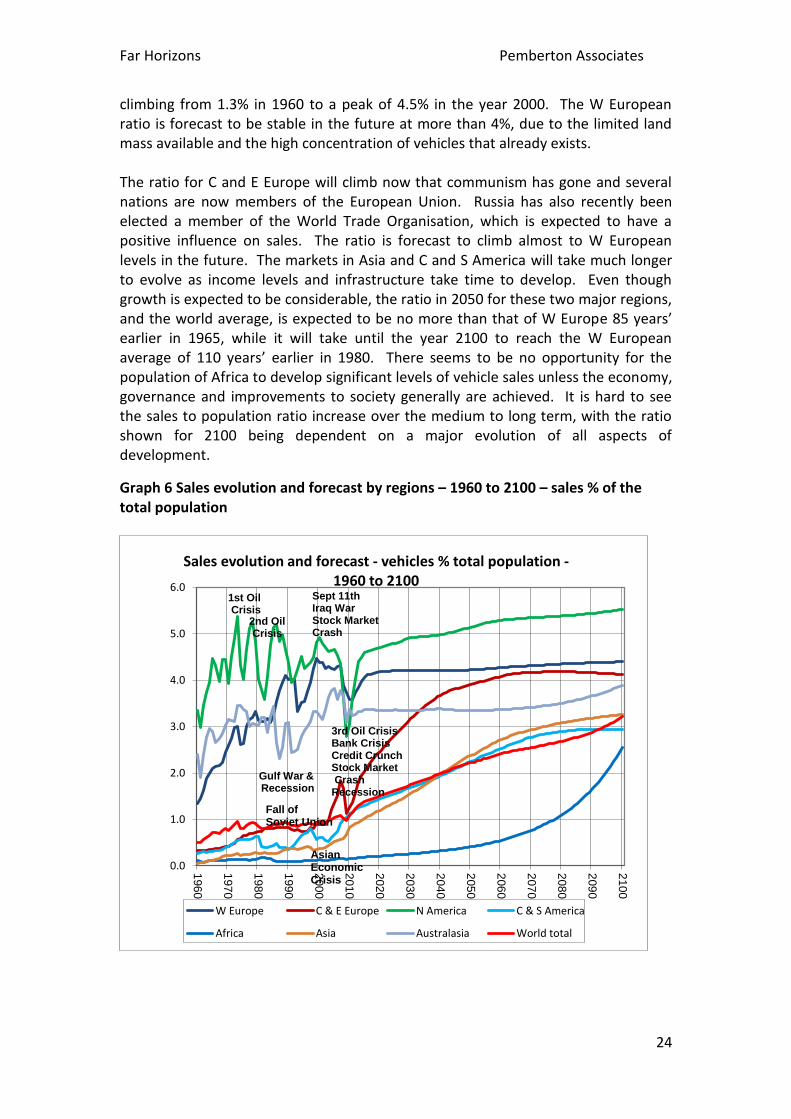
A major ratio used to gauge the spread of automotive activity and the relative development of a market place is achieved by comparing the volume of vehicles sold with the size of the total population and the size of the economically active population in the 20 to 64 year old age group. Graph 6 shows this ratio for the total population of the main geographical regions. The graph depicts the turmoil caused by some of the major events over the 50 year period from 1960 to 2010, including the two major oil crises, the Gulf War, the fall of the Soviet Union, the Asian economic crisis, September 11th and the Iraq War and more recently the major effects of the 3rd oil crisis and its related credit crunch and recession. It is beyond the ability of this report to forecast such events in the future, but it seems certain there will be other such shocks to global and local economies. N America, through the effect of Canada and the USA has the highest sales to population ratio, with an average of 4.5% for the period 1965 to 2008, prior to recession. Recovery is expected, with the ratio rising to more than 5% in the future as Mexico continues to develop. W Europe experienced a very rapid rise in the ratio,
0%
10%
20%
30%
40%
50%
60%
70%
80%
90%
100%
1960
1970
1980
1990
2000
2010
2020
2030
2040
2050
2060
2070
2080
2090
2100
Sales evolution and forecast - % share - 1960 to 2100
G7 OED BRICs Africa Oth Asia Oth Sam
Far Horizons Pemberton Associates
24
climbing from 1.3% in 1960 to a peak of 4.5% in the year 2000. The W European ratio is forecast to be stable in the future at more than 4%, due to the limited land mass available and the high concentration of vehicles that already exists. The ratio for C and E Europe will climb now that communism has gone and several nations are now members of the European Union. Russia has also recently been elected a member of the World Trade Organisation, which is expected to have a positive influence on sales. The ratio is forecast to climb almost to W European levels in the future. The markets in Asia and C and S America will take much longer to evolve as income levels and infrastructure take time to develop. Even though growth is expected to be considerable, the ratio in 2050 for these two major regions, and the world average, is expected to be no more than that of W Europe 85 years’ earlier in 1965, while it will take until the year 2100 to reach the W European average of 110 years’ earlier in 1980. There seems to be no opportunity for the population of Africa to develop significant levels of vehicle sales unless the economy, governance and improvements to society generally are achieved. It is hard to see the sales to population ratio increase over the medium to long term, with the ratio shown for 2100 being dependent on a major evolution of all aspects of development.
Graph 6 Sales evolution and forecast by regions – 1960 to 2100 – sales % of the total population
0.0
1.0
2.0
3.0
4.0
5.0
6.01
96
0
197
0
198
0
199
0
200
0
201
0
202
0
203
0
204
0
205
0
206
0
207
0
208
0
209
0
210
0
Sales evolution and forecast - vehicles % total population - 1960 to 2100
W Europe C & E Europe N America C & S America
Africa Asia Australasia World total
1st Oil Crisis
2nd Oil Crisis
Gulf War & Recession
Sept 11th Iraq War Stock Market Crash
Asian Economic Crisis
Fall of Soviet Union
3rd Oil Crisis Bank Crisis Credit Crunch Stock Market Crash Recession
Far Horizons Pemberton Associates
25
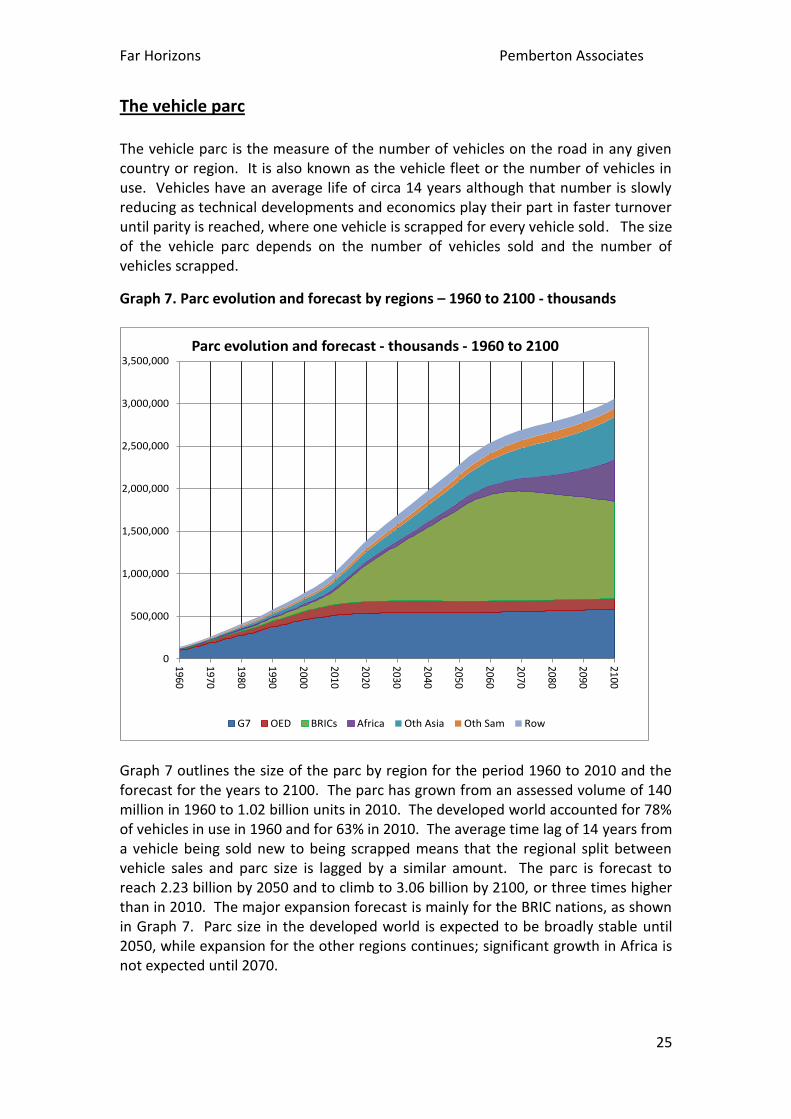
The vehicle parc The vehicle parc is the measure of the number of vehicles on the road in any given country or region. It is also known as the vehicle fleet or the number of vehicles in use. Vehicles have an average life of circa 14 years although that number is slowly reducing as technical developments and economics play their part in faster turnover until parity is reached, where one vehicle is scrapped for every vehicle sold. The size of the vehicle parc depends on the number of vehicles sold and the number of vehicles scrapped.
Graph 7. Parc evolution and forecast by regions – 1960 to 2100 - thousands
Graph 7 outlines the size of the parc by region for the period 1960 to 2010 and the forecast for the years to 2100. The parc has grown from an assessed volume of 140 million in 1960 to 1.02 billion units in 2010. The developed world accounted for 78% of vehicles in use in 1960 and for 63% in 2010. The average time lag of 14 years from a vehicle being sold new to being scrapped means that the regional split between vehicle sales and parc size is lagged by a similar amount. The parc is forecast to reach 2.23 billion by 2050 and to climb to 3.06 billion by 2100, or three times higher than in 2010. The major expansion forecast is mainly for the BRIC nations, as shown in Graph 7. Parc size in the developed world is expected to be broadly stable until 2050, while expansion for the other regions continues; significant growth in Africa is not expected until 2070.
0
500,000
1,000,000
1,500,000
2,000,000
2,500,000
3,000,000
3,500,000
1960
1970
1980
1990
2000
2010
2020
2030
2040
2050
2060
2070
2080
2090
2100
Parc evolution and forecast - thousands - 1960 to 2100
G7 OED BRICs Africa Oth Asia Oth Sam Row
Far Horizons Pemberton Associates
26
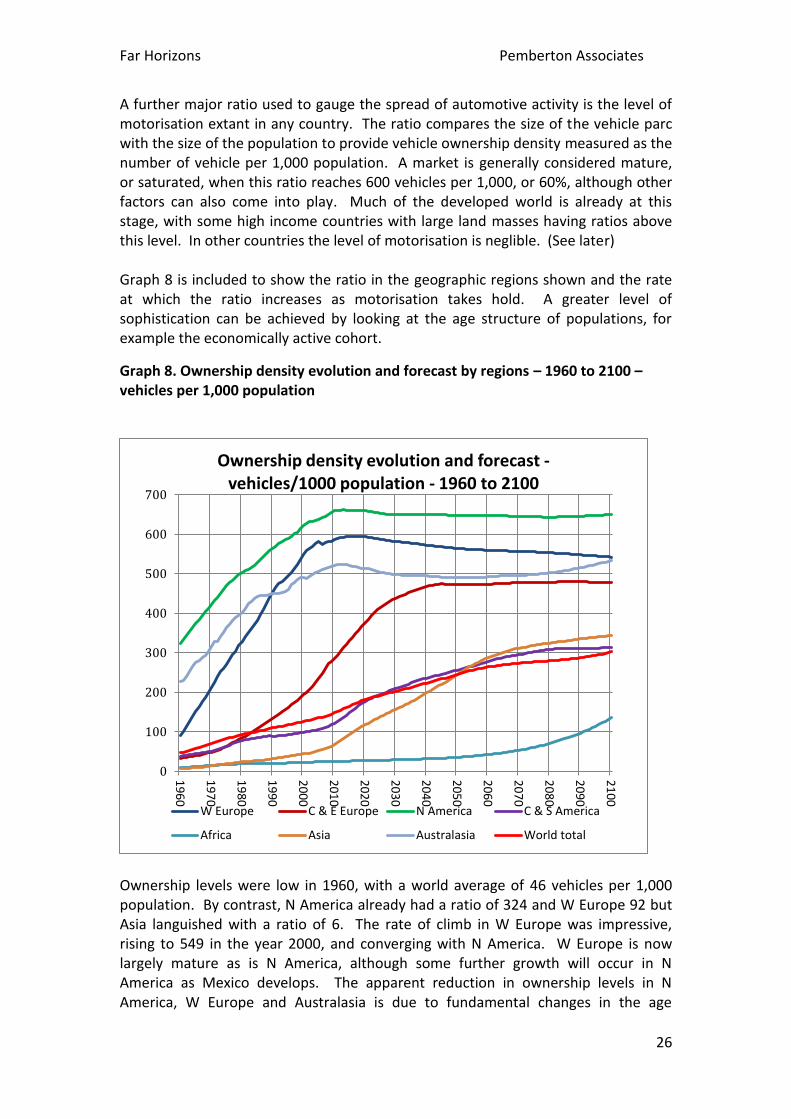
A further major ratio used to gauge the spread of automotive activity is the level of motorisation extant in any country. The ratio compares the size of the vehicle parc with the size of the population to provide vehicle ownership density measured as the number of vehicle per 1,000 population. A market is generally considered mature, or saturated, when this ratio reaches 600 vehicles per 1,000, or 60%, although other factors can also come into play. Much of the developed world is already at this stage, with some high income countries with large land masses having ratios above this level. In other countries the level of motorisation is neglible. (See later) Graph 8 is included to show the ratio in the geographic regions shown and the rate at which the ratio increases as motorisation takes hold. A greater level of sophistication can be achieved by looking at the age structure of populations, for example the economically active cohort.
Graph 8. Ownership density evolution and forecast by regions – 1960 to 2100 – vehicles per 1,000 population
Ownership levels were low in 1960, with a world average of 46 vehicles per 1,000 population. By contrast, N America already had a ratio of 324 and W Europe 92 but Asia languished with a ratio of 6. The rate of climb in W Europe was impressive, rising to 549 in the year 2000, and converging with N America. W Europe is now largely mature as is N America, although some further growth will occur in N America as Mexico develops. The apparent reduction in ownership levels in N America, W Europe and Australasia is due to fundamental changes in the age
0
100
200
300
400
500
600
700
19
60
19
70
19
80
19
90
20
00
20
10
20
20
20
30
20
40
20
50
20
60
20
70
20
80
20
90
21
00
Ownership density evolution and forecast - vehicles/1000 population - 1960 to 2100
W Europe C & E Europe N America C & S America
Africa Asia Australasia World total
Far Horizons Pemberton Associates
27
structure of the populations in those regions. By 2010, the world average had risen to 148 per 1,000, C and S America had a much higher ratio of 122, but Asia, despite the growth in China and India and other nations, still has a ratio of only 68. Motorisation in Africa, which is home to several of the world’s Least Developed Countries, had a ratio of 25. This graphic puts into perspective the huge gap in levels of motorisation around the world, and that although the ratio stabilizes in much of the developed world, the world average will still be at just 300 by 2100, while Asia, with high levels of sales growth forecast, will be at 345, approximately the same level as W Europe 120 years earlier in 1980, or N America 140 years earlier in 1960. This leaves Africa, which, even allowing for the growth forecast, is still expected to have a ratio of 137 of 1,000 by 2100, broadly the same as W Europe 135 years earlier.
Far Horizons Pemberton Associates
28
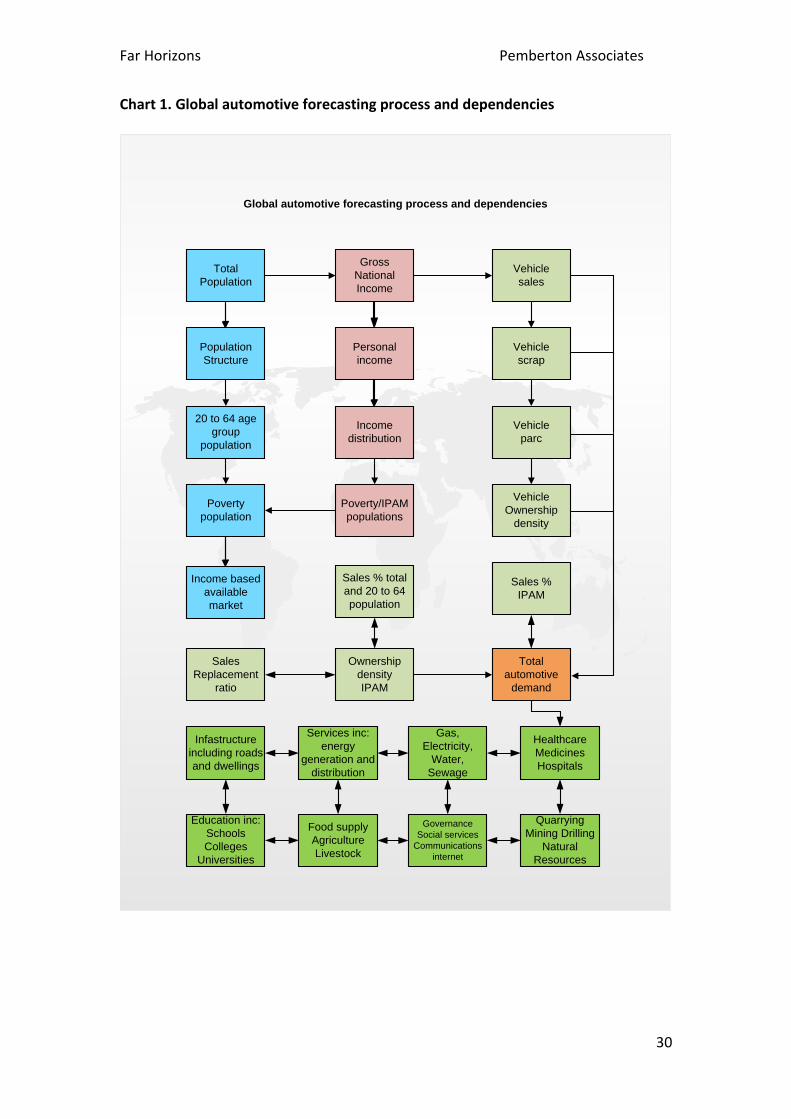
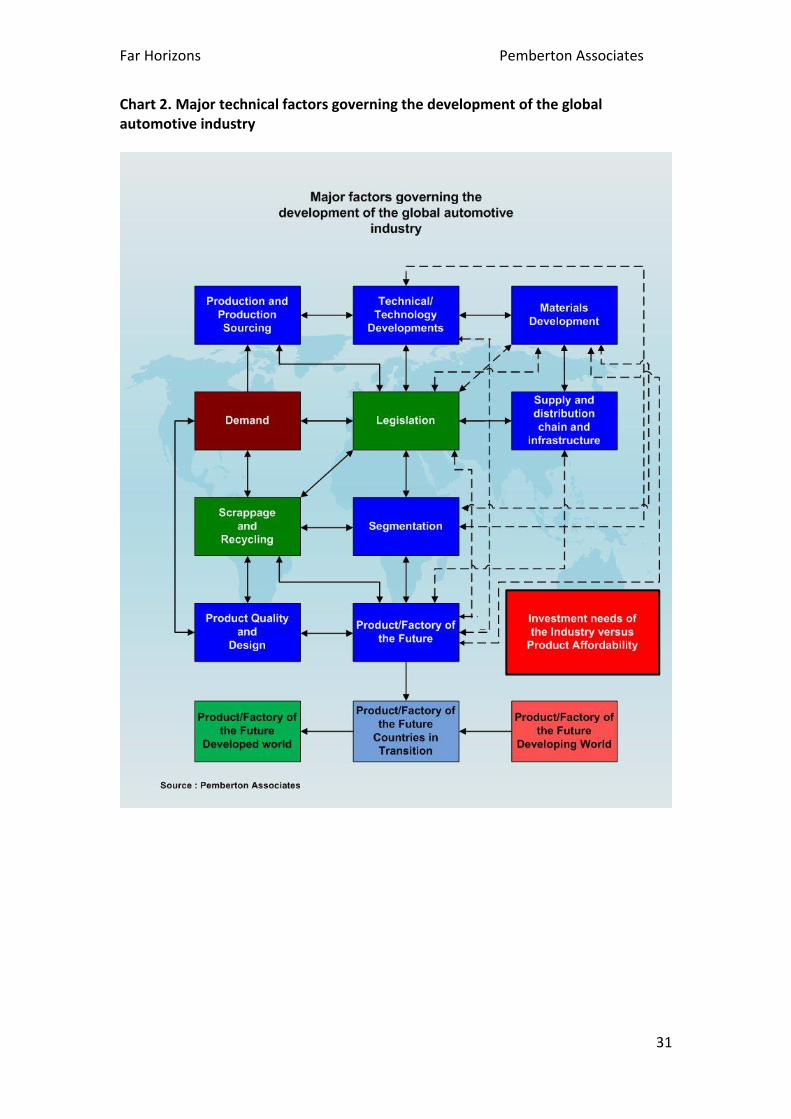
Global automotive forecasting process and dependencies The process involved in predicating the size and structure of the automotive industry so far in the future is complex and covers several variables. Due to this complexity the forecast described in this document is created on a “business as usual” basis as there are so many unknowns and social and technological changes could well be significant if not game changing. Chart 1. shows some of the major considerations involved in creating the forecast of future sales, production and the size of the vehicle parc. The most important are the size, shape and age structure of the population, levels of income, and the distribution of that income and the proportion of the population living in poverty. These data allow the calculation of the Potential Available Market (PAM) and thereby place a limit on the scale of motorisation in the future. This information, in turn, can be used to assess the resources necessary to allow motorisation to proceed. A crucial element in enabling motorisation to spread has been, and will continue to be “affordability” of the product. Motor vehicles in the developed world are becoming ever more sophisticated and complex and potentially beyond the ability of the technology available in the developing world. Chart 2 shows the major technical factors governing the development of the motor industry, which need to be considered in parallel with the socio-economic factors in Chart 1.
Major factors governing the technical development of the global automotive industry It is becoming ever more clear that the level of demand, when calculated, is only one of the ingredients of the new world model that will flow across all disciplines involved in the production, sale, maintenance, repair, scrappage and recycling of economical, technically advanced motor vehicles at affordable prices. This is outlined in Chart 2, which shows that raw levels of demand, once calculated, are subject to overview by many other factors. These include:
where vehicles will be produced/assembled, to ensure they are affordable in the new market place
technical and technological developments, which may well employ new production techniques
the development of new materials
Far Horizons Pemberton Associates
29
local and global legislation, which needs to run in tandem with most of the other elements shown here, rather than in advance or trailing behind any new developments
the need to examine new drive train mechanisms to combat global warming and climate change concerns, while still addressing the concerns of the countries with limited economic and technical ability
vehicle segmentation, as most new volume vehicles for the new markets are likely to be in the A and B sectors and suitable for local conditions, which normally means lower prices and tighter margins
product quality and design, which will affect how vehicles are produced, repaired, maintained, warranted, scrapped and recycled
the factory of the future, which may well be jointly owned, with even more developed flexible manufacturing systems and will need to vary depending on the level of technology able to be employed in each country
the supply chain, as it moves to meet demand all across the world, whether in supplier parks, as module suppliers or as assembly kits, complete with distribution systems
The increasing disconnect between the developed, developing and transitional countries as new technical developments and techniques move beyond the ability of the developing world in the short to medium term
The ability of nations to develop sufficient generating capacity and infrastructure to service an expanding fluids, hybrids, fuel cell and electric vehicle market
The effect on the export of used vehicles, which sustain many developing countries, as the level of technology employed in the developed world move beyond the ability of the developing world to repair and maintain
Far Horizons Pemberton Associates
30
Chart 1. Global automotive forecasting process and dependencies
Total
Population
Gross
National
Income
Vehicle
sales
Vehicle
scrap
Population
Structure
20 to 64 age
group
population
Vehicle
parc
Vehicle
Ownership
density
Poverty
population
Global automotive forecasting process and dependencies
Personal
income
Income
distribution
Income based
available
market
Ownership
density
IPAM
Sales % total
and 20 to 64
population
Sales
Replacement
ratio
Sales %
IPAM
Total
automotive
demand
Healthcare
Medicines
Hospitals
Education inc:
Schools
Colleges
Universities
Food supply
Agriculture
Livestock
Gas,
Electricity,
Water,
Sewage
Infastructure
including roads
and dwellings
Services inc:
energy
generation and
distribution
Poverty/IPAM
populations
Governance
Social services
Communications
internet
Quarrying
Mining Drilling
Natural
Resources
Far Horizons Pemberton Associates
31
Chart 2. Major technical factors governing the development of the global automotive industry
Far Horizons Pemberton Associates
32
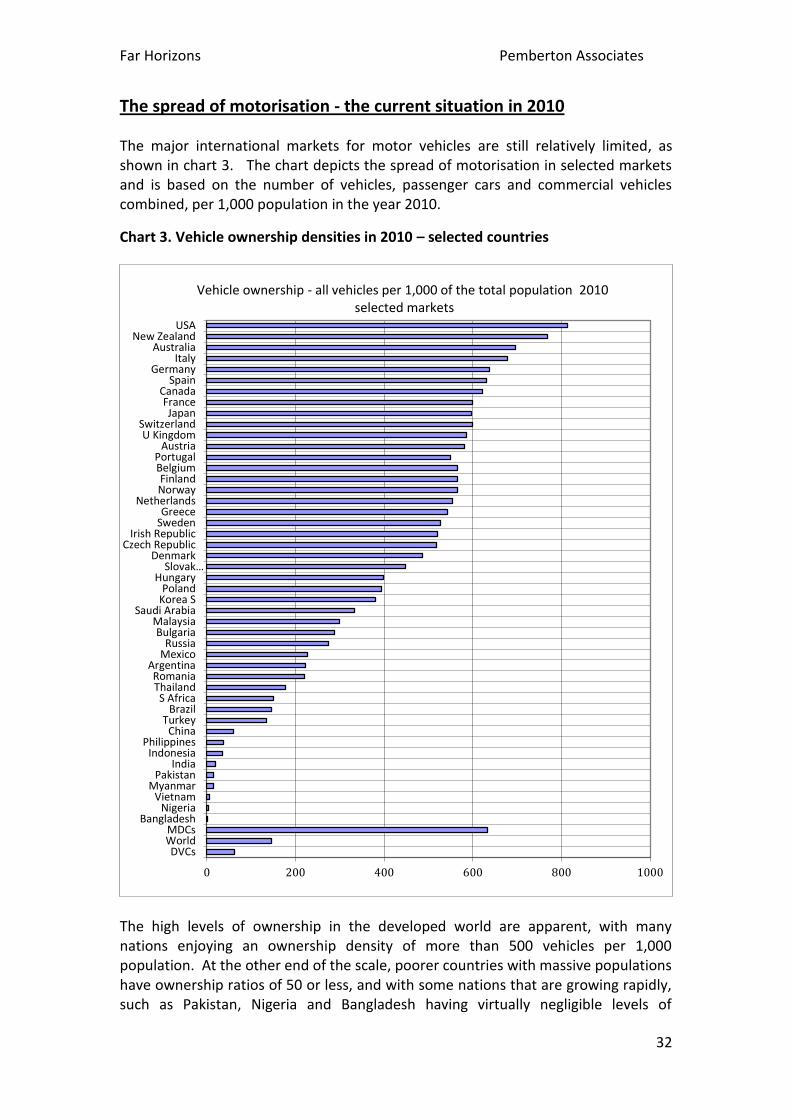
The spread of motorisation - the current situation in 2010 The major international markets for motor vehicles are still relatively limited, as shown in chart 3. The chart depicts the spread of motorisation in selected markets and is based on the number of vehicles, passenger cars and commercial vehicles combined, per 1,000 population in the year 2010.
Chart 3. Vehicle ownership densities in 2010 – selected countries
The high levels of ownership in the developed world are apparent, with many nations enjoying an ownership density of more than 500 vehicles per 1,000 population. At the other end of the scale, poorer countries with massive populations have ownership ratios of 50 or less, and with some nations that are growing rapidly, such as Pakistan, Nigeria and Bangladesh having virtually negligible levels of
0 200 400 600 800 1000
DVCsWorldMDCs
BangladeshNigeria
VietnamMyanmar
PakistanIndia
IndonesiaPhilippines
ChinaTurkey
BrazilS Africa
ThailandRomania
ArgentinaMexicoRussia
BulgariaMalaysia
Saudi ArabiaKorea SPoland
HungarySlovak…
DenmarkCzech Republic
Irish RepublicSwedenGreece
NetherlandsNorwayFinland
BelgiumPortugal
AustriaU Kingdom
SwitzerlandJapan
FranceCanada
SpainGermany
ItalyAustralia
New ZealandUSA
Vehicle ownership - all vehicles per 1,000 of the total population 2010 selected markets
Far Horizons Pemberton Associates
33
motorisation. It is in many countries that are at the lower end of this table where the greatest increases in motorisation will occur, not least in Brazil, China and India, each of which has large populations eager to become motorised.
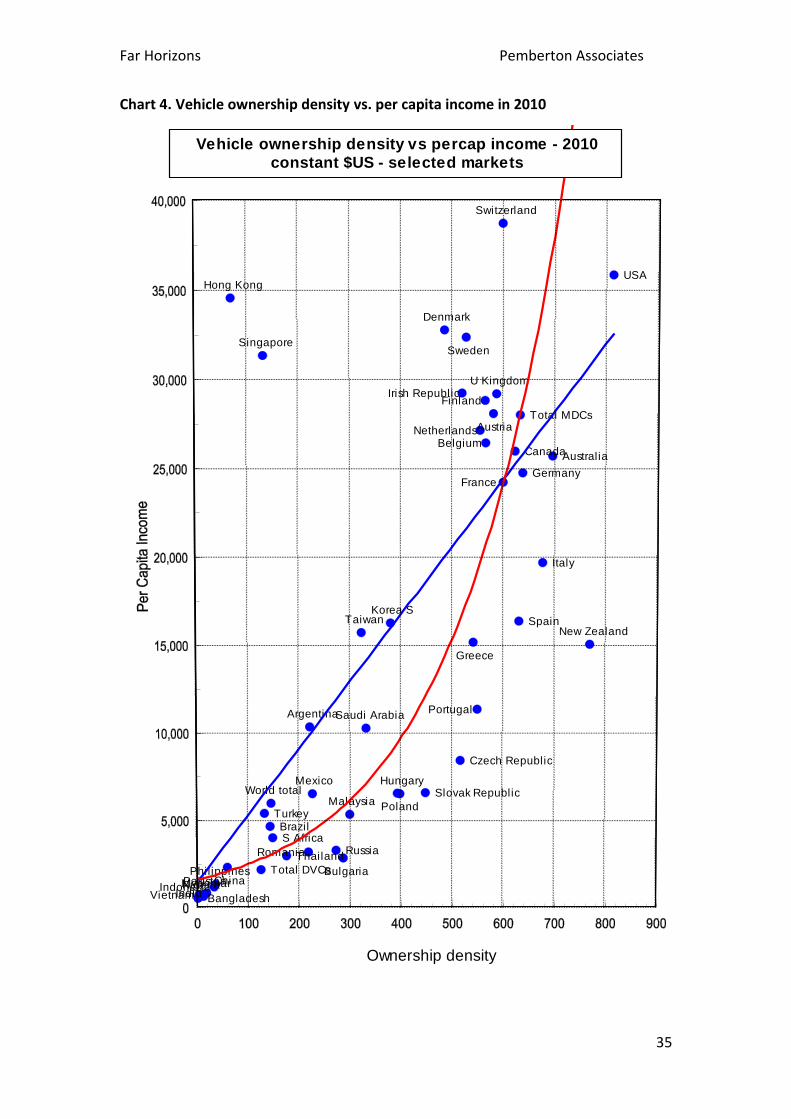
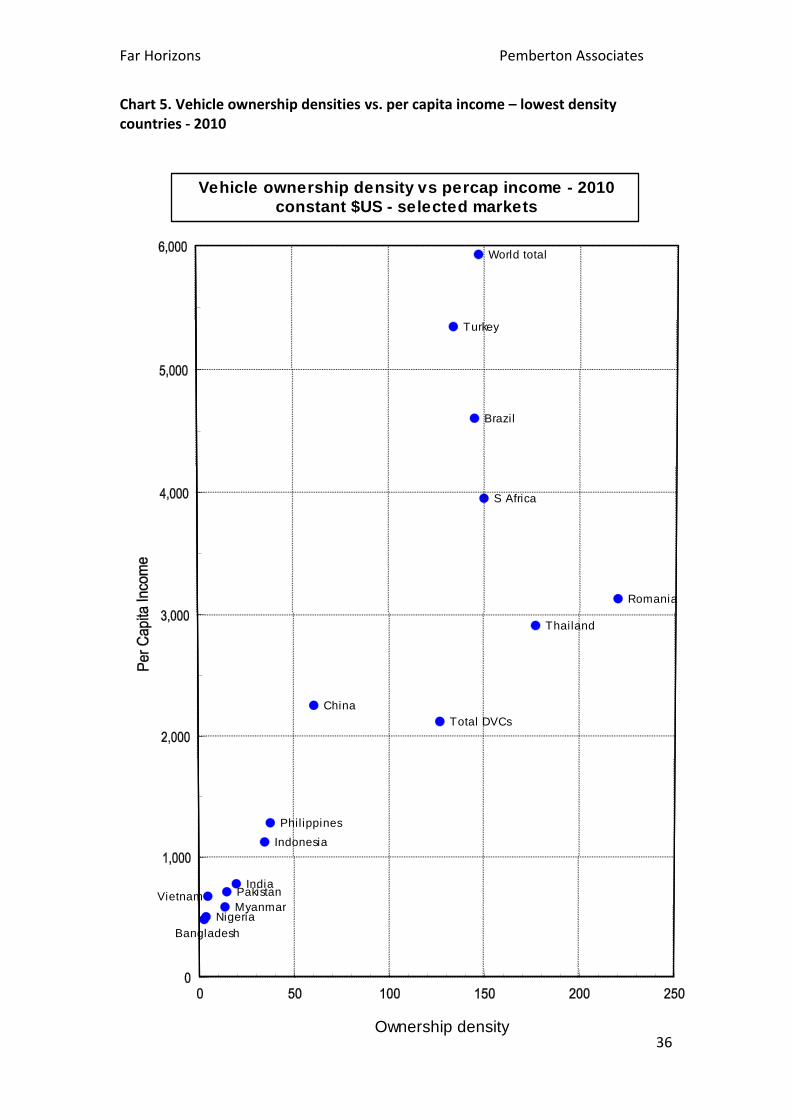
Vehicle Ownership Compared with Income in 2010 – Selected Countries A further refinement to the analysis of vehicle ownership by country is to compare vehicle ownership densities with income per capita base on the Constant $US (inflation adjusted) series, as shown in charts 4 and 5 that follow. This provides a simple — but dramatic — comparison of the two main factors that will govern the development of the auto industry for several of its most important markets. The graph incorporates several levels of refinement, the results of which indicate the massive potential still existing for motor vehicles on a global basis. The purpose of using per capita income in this manner is to reflect more accurately conditions prevailing in each country. The graph depicts clearly the gulf between ownership levels in the DVCs — particularly India and China — compared with the MDCs. It also shows a clear limit on ownership levels, of between 500 and 600 vehicles per 1,000 population in the majority of the countries in the developed world, with the notable exception of the USA and, to a lesser extent, New Zealand. As can be seen, ownership density has a distinct but limited connection to per capita income once an individual vehicle market reaches maturity and saturation levels of ownership, as the relative locations of Hong Kong and Singapore show. Both countries have high levels of income, but low ownership ratios, due to the fact that both are small, island states, with no room for further increase in ownership. The major factors governing ownership levels in the European countries are the relationships between vehicle parc size, landmass, the density of the road network and the availability of high efficiency, locally available, mass transport systems. The very high ownership density in the USA relates to the vast landmass available, a huge road network and the distances between major cities as well as high levels of income. Mass transit systems in the USA are generally localised. But it is the comparison between the developed and developing world that has the greatest bearing on the future of the industry.
World average ownership versus GDP in 2010 locates at 148 vehicles per 1,000 population, and US$ 6,200. India and China are well below this level, with Brazil and Mexico below the world average on the linear trend line although above the exponential trend line. As the developing nations start to move up the trend lines, the rate of growth currently existing in global vehicle demand will become even greater, although the economic climate since the recent global recession and banking crisis may well have delayed recovery and growth increases in some parts of the world for four or five years or even longer. A simple calculation will suffice to place some perspective in growth potential: to allow just China and India to increase their ownership densities to the current world
Far Horizons Pemberton Associates
34
average of 148 vehicles per 1,000 population, which itself is less than a quarter of the MDC average, would require a vehicle parc of more than 451 million vehicles for these two countries alone. The graph has been repeated in Chart 5, but on a more concentrated scale, to highlight the relative position of the dense cluster of developing markets in the bottom left portion of graph. These nations alone, which already have a combined population of 3.54 billion in 2010, will see a rise to 4.53 billion by 2050, an increase of almost a billion people.
Far Horizons Pemberton Associates
35
Chart 4. Vehicle ownership density vs. per capita income in 2010
Austria
Belgium
Denmark
Finland
FranceGermany
Greece
Irish Republic
Italy
Netherlands
Portugal
Spain
Sweden
Switzerland
U Kingdom
Bulgaria
Czech Republic
Hungary
Poland
Romania Russia
Slovak Republic
Canada
Mexico
USA
Argentina
BrazilS Africa
Nigeria
Bangladesh
China
Hong Kong
IndiaIndonesia
Korea S
Malaysia
MyanmarPakistanPhilippines
Saudi Arabia
Singapore
Taiwan
Thailand
Turkey
Vietnam
Australia
New Zealand
World total
Total MDCs
Total DVCs
Vehicle ownership density vs percap income - 2010
constant $US - selected markets
Ownership density
Far Horizons Pemberton Associates
36
Chart 5. Vehicle ownership densities vs. per capita income – lowest density countries - 2010
Romania
Thailand
S Africa
Brazil
Turkey
China
Philippines
Indonesia
IndiaPakistan
MyanmarVietnam
Nigeria
Bangladesh
World total
Total DVCs
Vehicle ownership density vs percap income - 2010
constant $US - selected markets
Ownership density
Far Horizons Pemberton Associates
37
Technology and the motor vehicle The basic design of motor vehicles has changed very little over the decades, although they have become more sophisticated, technically advanced, safer and more efficient. The USA dominated the global auto market in 1960, when 49% of all vehicles produced were sold there and Japan was just beginning its meteoric rise as an automotive phenomenon. The USA was famous for its “gas guzzlers” which were very heavy and fuel inefficient. American vehicle were much heavier than their European counterparts, and the arrival of Japan on the scene caused a major change in vehicle design, weight and efficiency. It was, as much as anything, this sharp decline in the USA market share that brought about the dilution of the effect of USA vehicles on the global automotive arena and was the major initial driver of the reduction in the global average weight of motor vehicles. Design features also had a major impact, as the ability to seat four people in a much smaller space meant that vehicles became more compact. This was followed by the move to lighter gauge metals for body construction as computerised design and the availability of “crumple zones” allowed safety to go hand in hand with lighter bodies, the introduction of plastics, which replaced many steel components and panels, the move from cast iron to aluminium for major engine and drive train components and the introduction of front wheel drive, which made all drive train components linking the engine to the driven rear wheels redundant for the majority of vehicles. More recently increases in the price of fuel, major pushes by governments and pressure groups concerned about global warming and climate change plus concerns about “peak oil” have extended the need for lightweighting, downsizing and improved fuel efficiency and emissions. This, plus the ever increasing need for vehicle to be affordable, has resulted in a powerful trend to sales of lower segment vehicles, which have very good performance, comfort, quality and reliability in a much smaller package. Further, as the mass vehicle market moves to the developing world, purchasers demand smaller, cheaper, more economical vehicles, with the new Nano in India as well as the latest economy version of the Suzuki Alto developed to compete with the Nano proving just what can be packaged in a small vehicle and still meet the conflicting demand of efficiency, economy, comfort and performance with low cost. The challenge for the future lies in developing vehicles for widely differing operating environments, levels of sophistication and affordability. Put simply, it is no use building expensive and complex vehicles that suit the markets of the developed world to be sold in the developing world if only a very limited section of the community can afford them.
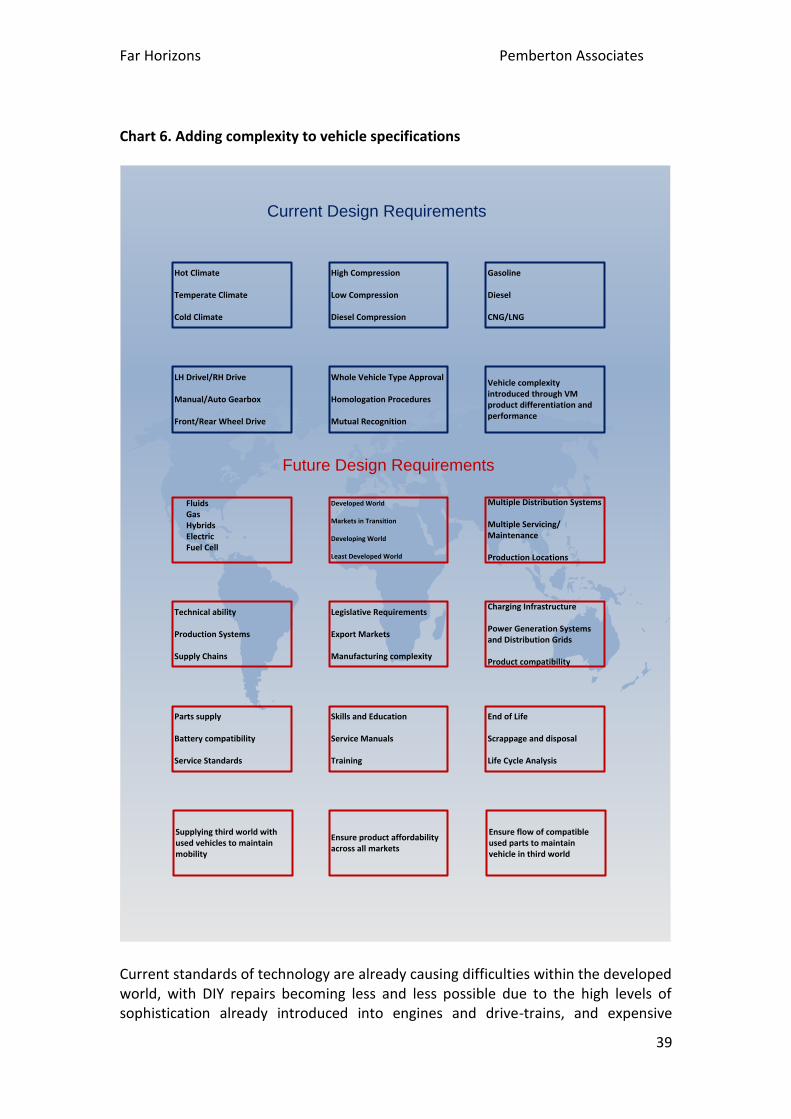
Adding complexity to vehicle specifications Historically, the world-wide motor industry, although complex, has been relatively easy to handle, despite the current disarray brought about by recession and the collapse and rescue of major companies, particularly in the USA.
Far Horizons Pemberton Associates
38
The product, the automobile, has been broadly homogenous across the markets of the world, with the changes manufacturers have needed to make to satisfy international demand confined to specification changes, such as Right Hand Drive or Left Hand Drive, Hot Climate, Temperate Climate or Cold Climate and engines tuned for operating conditions and fuel octane availability. The advent of regional/global legislation such as Whole Vehicle Type Approval, Mutual Recognition and Homologation procedures, removed several barriers to previously difficult acceptance of international technical complexity and differentiation. But in one major respect, all the vehicles were similar. Their drive-trains were internal combustion engine based, using fluids, either gasoline or diesel, with the occasional foray into LPG/CNG, and differentiated between front or rear wheel drive or manual and automatic gearboxes. International systems have evolved, stabilised and become established for the refining and distribution of fuel, the sales and distribution of vehicles, the supply and distribution of parts to allow the servicing, maintenance and repair of vehicles, and people have been trained and educated to carry out all the tasks involved in keeping the existing global system operating. Almost as important, flows of used vehicles have been established to countries where populations cannot afford to purchase new vehicles, other than for small, elite groups. These flows of vehicles have assisted in allowing large numbers of people to achieve and enabled some level of economic and social development to occur, while at the same time maintaining the flow of new vehicles in the developed world. The current rate of change in the global industry, with increasing divergence in technical standards, and with the developed world rapidly being overtaken by the developing world in production, sales and technology, combined with concerns about global warming and climate change, have wrought a game changing environment the like of which has never been seen before in the history of the industry. New methods of propulsion are being examined, tested and funded in a way that must surely see a gradual move to motive power including an element of electric power in the medium to long term as concerns about the continued availability of fossil fuels. When these changes are paired with the explosion in demand occurring in the developing world, industry and governments are faced with a challenge that must be met. It is probable that almost as many vehicles will be produced and sold around the world over the next 20 years than in the entire history of the industry and with even higher volumes over the next two decades to 2050 and then to 2100 as shown in the forecast. The majority of these vehicles will be produced and sold outside the “traditional” triad of N America, W Europe and Japan.
Far Horizons Pemberton Associates
39
Chart 6. Adding complexity to vehicle specifications
Current standards of technology are already causing difficulties within the developed world, with DIY repairs becoming less and less possible due to the high levels of sophistication already introduced into engines and drive-trains, and expensive
Hot Climate
Temperate Climate
Cold Climate
High Compression
Low Compression
Diesel Compression
Gasoline
Diesel
CNG/LNG
LH Drivel/RH Drive
Manual/Auto Gearbox
Front/Rear Wheel Drive
Whole Vehicle Type Approval
Homologation Procedures
Mutual Recognition
Vehicle complexity introduced through VM product differentiation and performance
Developed World
Markets in Transition
Developing World
Least Developed World
Multiple Distribution Systems
Multiple Servicing/Maintenance
Production Locations
Technical ability
Production Systems
Supply Chains
Legislative Requirements
Export Markets
Manufacturing complexity
Charging Infrastructure
Power Generation Systems and Distribution Grids
Product compatibility
Parts supply
Battery compatibility
Service Standards
Skills and Education
Service Manuals
Training
End of Life
Scrappage and disposal
Life Cycle Analysis
Supplying third world with used vehicles to maintain mobility
Ensure product affordability across all markets
Ensure flow of compatible used parts to maintain vehicle in third world
Current Design Requirements
Future Design Requirements
FluidsGasHybridsElectricFuel Cell
Far Horizons Pemberton Associates
40
diagnostic equipment being necessary for even routine servicing. This trend will undoubtedly continue as the world grapples with the need to produce cleaner more efficient vehicles. Chart 6 describes some of the changes that are destined to occur that will add enormously to complexity and mean that different specifications will be needed for varying parts of the world. The six boxes outlined in blue show the main categories of product specification needed to manage the production and sale of vehicles around the world. The basic similarity of product was complemented by the fact that individual manufacturers differentiated their vehicles by adding complexity through design, power, performance, body shape, cosmetics, price and levels of Lux. Each of the categories in these six boxes needs to be carried across into the products of the future, wherever they are produced and sold. In addition, the needs of legislation designed to combat climate change and global warming, the need for a low carbon agenda and concerns about peak oil, means that there is a need for an entire rethink around motor vehicles, their place in society and the fact that some game-changing new technologies will not sit well with the developing world, where the majority of vehicles will be produced and sold in the future. These changes, as well as causing a major increase in complexity will also add considerably to the cost of the motor vehicle, not only in terms of the product itself, but also in the infrastructure need to support the new technologies and the additional power generation capacity that will need to be installed.
Far Horizons Pemberton Associates
41
Appendix
Table 4 Range of the High Medim and Low population variants by selected areas
Graph 9 Population evolution by major age group – 1000 to 2100 – Medium variant
Variations in Global, regional and Country population predictions in 2100
Volume World MDC DVC Africa As ia India China
Range
High 15,804,873 1,603,979 14,200,895 5,198,432 7,521,997 2,569,745 1,586,939
Medium 10,124,926 1,088,713 9,054,757 3,574,141 4,596,224 1,550,899 941,042
Low 6,177,378 681,261 5,496,117 2,378,387 2,623,609 880,334 505,842
% World World MDC DVC Africa As ia India China
Range
High 100.00 10.15 89.85 32.89 47.59 16.26 10.04
Medium 100.00 10.75 89.43 35.30 45.40 15.32 9.29
Low 100.00 11.03 88.97 38.50 42.47 14.25 8.19
Variance World MDC DVC Africa As ia India China
Range
Volume 9,627,495 922,718 8,704,777 2,820,045 4,898,388 1,689,411 1,081,097
High % 56.10 47.33 56.83 45.45 63.66 65.69 68.64
Low % -38.99 -37.43 -39.30 -33.46 -42.92 -43.24 -46.25
Source: United Nations
0
2,000
4,000
6,000
8,000
10,000
12,000
10
00
10
50
11
00
11
50
12
00
12
50
13
00
13
50
14
00
14
50
15
00
15
50
16
00
16
50
17
00
17
50
18
00
18
50
19
00
19
50
20
00
20
50
21
00
World population evolution - 1000 AD to 2100 - Millions
Total pop Pop 0 to 19 Pop 20 to 64 Pop 65 and over
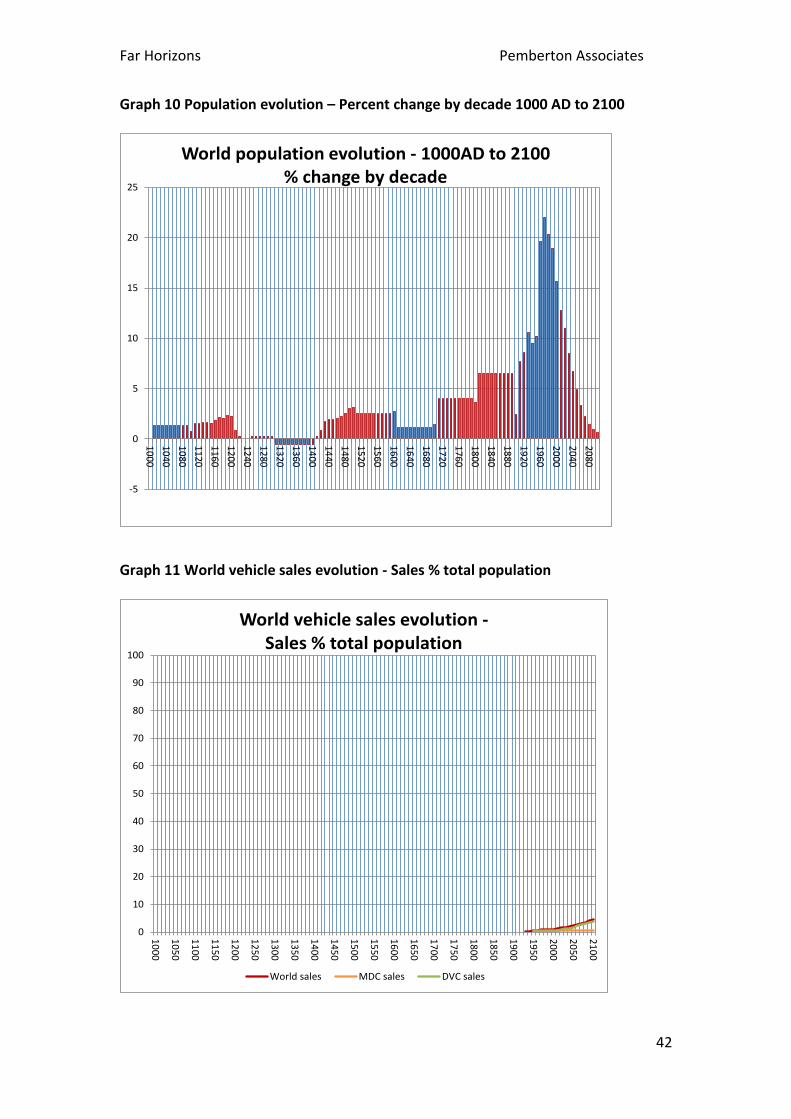
Far Horizons Pemberton Associates
42
Graph 10 Population evolution – Percent change by decade 1000 AD to 2100
Graph 11 World vehicle sales evolution - Sales % total population
-5
0
5
10
15
20
25
1000
1040
1080
1120
1160
1200
1240
1280
1320
1360
1400
1440
1480
1520
1560
1600
1640
1680
1720
1760
1800
1840
1880
1920
1960
2000
2040
2080
World population evolution - 1000AD to 2100% change by decade
0
10
20
30
40
50
60
70
80
90
100
1000
1050
1100
1150
1200
1250
1300
1350
1400
1450
1500
1550
1600
1650
1700
1750
1800
1850
1900
1950
2000
2050
2100
World vehicle sales evolution -Sales % total population
World sales MDC sales DVC sales
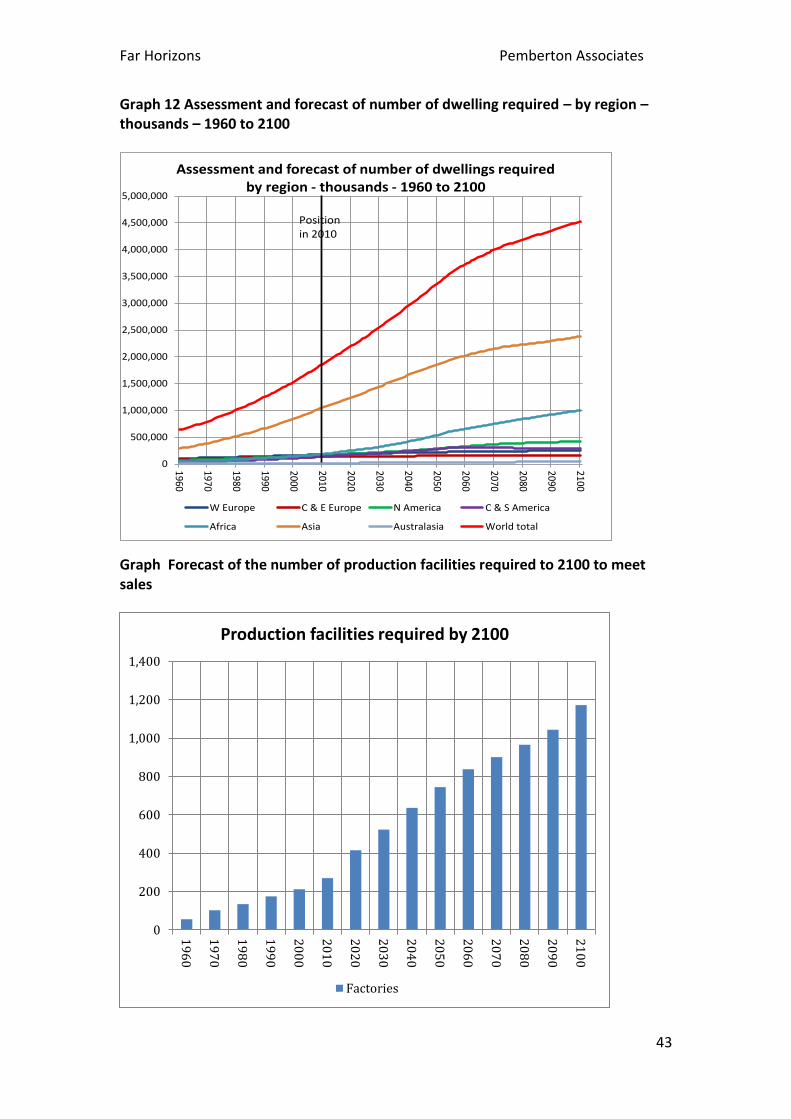
Far Horizons Pemberton Associates
43
Graph 12 Assessment and forecast of number of dwelling required – by region – thousands – 1960 to 2100
Graph Forecast of the number of production facilities required to 2100 to meet sales
0
500,000
1,000,000
1,500,000
2,000,000
2,500,000
3,000,000
3,500,000
4,000,000
4,500,000
5,000,000
1960
1970
1980
1990
2000
2010
2020
2030
2040
2050
2060
2070
2080
2090
2100
Assessment and forecast of number of dwellings requiredby region - thousands - 1960 to 2100
W Europe C & E Europe N America C & S America
Africa Asia Australasia World total
Position in 2010
0
200
400
600
800
1,000
1,200
1,400
19
60
19
70
19
80
19
90
20
00
20
10
20
20
20
30
20
40
20
50
20
60
20
70
20
80
20
90
21
00
Production facilities required by 2100
Factories
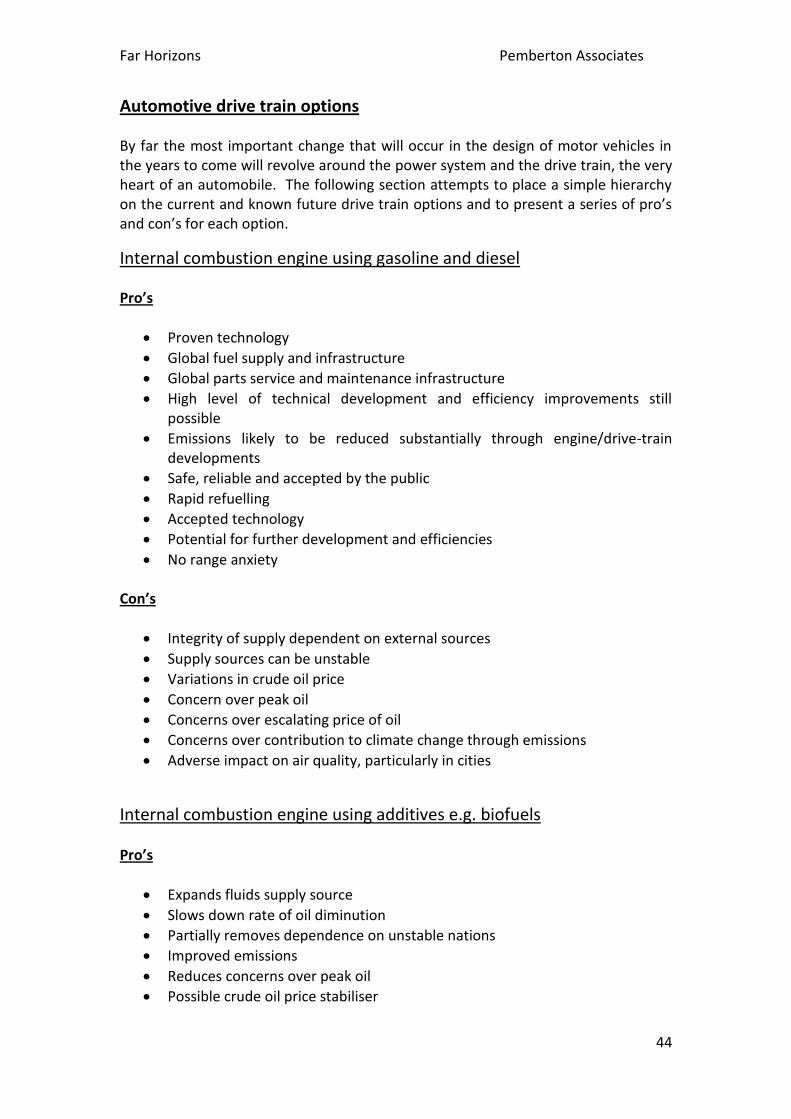
Far Horizons Pemberton Associates
44
Automotive drive train options By far the most important change that will occur in the design of motor vehicles in the years to come will revolve around the power system and the drive train, the very heart of an automobile. The following section attempts to place a simple hierarchy on the current and known future drive train options and to present a series of pro’s and con’s for each option.
Internal combustion engine using gasoline and diesel Pro’s
Proven technology
Global fuel supply and infrastructure
Global parts service and maintenance infrastructure
High level of technical development and efficiency improvements still possible
Emissions likely to be reduced substantially through engine/drive-train developments
Safe, reliable and accepted by the public
Rapid refuelling
Accepted technology
Potential for further development and efficiencies
No range anxiety Con’s
Integrity of supply dependent on external sources
Supply sources can be unstable
Variations in crude oil price
Concern over peak oil
Concerns over escalating price of oil
Concerns over contribution to climate change through emissions
Adverse impact on air quality, particularly in cities
Internal combustion engine using additives e.g. biofuels Pro’s
Expands fluids supply source
Slows down rate of oil diminution
Partially removes dependence on unstable nations
Improved emissions
Reduces concerns over peak oil
Possible crude oil price stabiliser
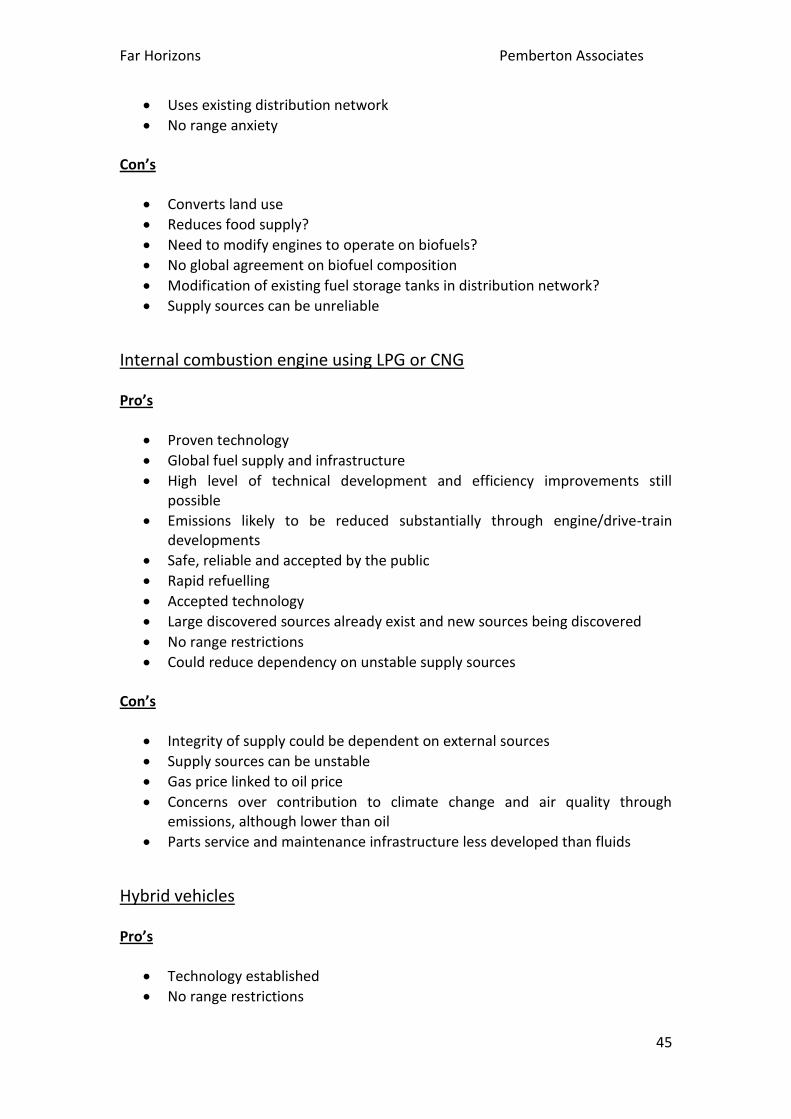
Far Horizons Pemberton Associates
45
Uses existing distribution network
No range anxiety Con’s
Converts land use
Reduces food supply?
Need to modify engines to operate on biofuels?
No global agreement on biofuel composition
Modification of existing fuel storage tanks in distribution network?
Supply sources can be unreliable
Internal combustion engine using LPG or CNG Pro’s
Proven technology
Global fuel supply and infrastructure
High level of technical development and efficiency improvements still possible
Emissions likely to be reduced substantially through engine/drive-train developments
Safe, reliable and accepted by the public
Rapid refuelling
Accepted technology
Large discovered sources already exist and new sources being discovered
No range restrictions
Could reduce dependency on unstable supply sources Con’s
Integrity of supply could be dependent on external sources
Supply sources can be unstable
Gas price linked to oil price
Concerns over contribution to climate change and air quality through emissions, although lower than oil
Parts service and maintenance infrastructure less developed than fluids
Hybrid vehicles Pro’s
Technology established
No range restrictions
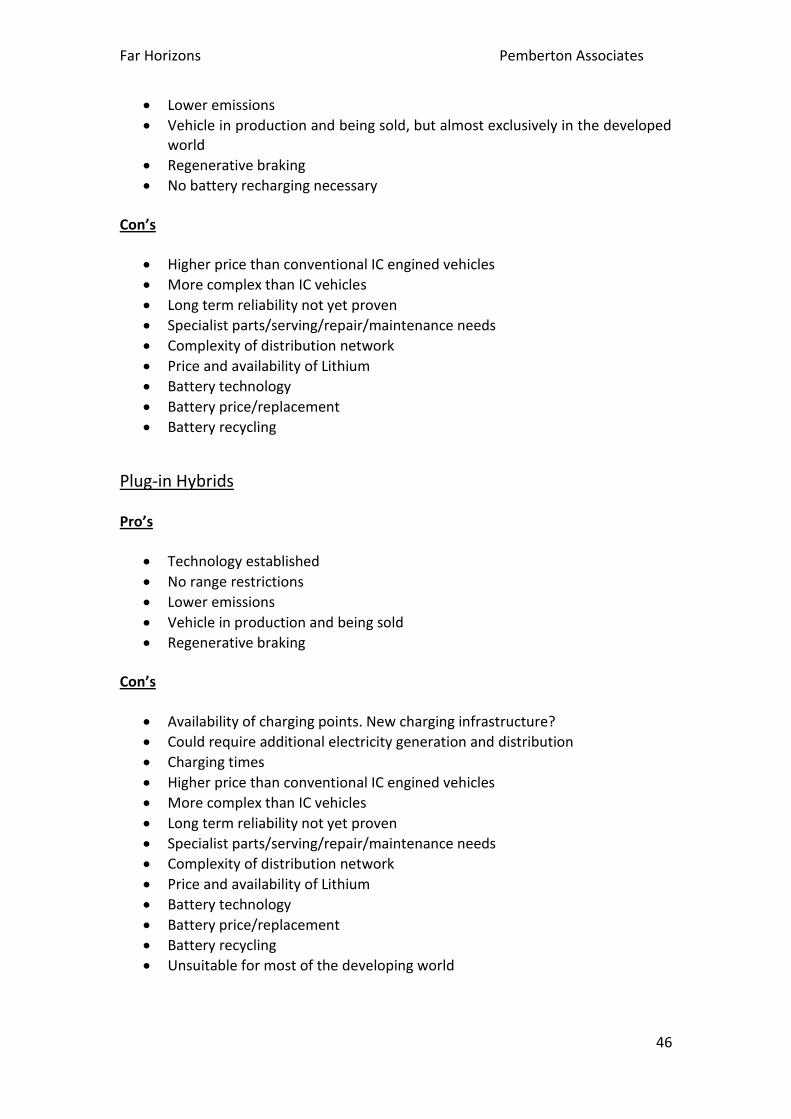
Far Horizons Pemberton Associates
46
Lower emissions
Vehicle in production and being sold, but almost exclusively in the developed world
Regenerative braking
No battery recharging necessary Con’s
Higher price than conventional IC engined vehicles
More complex than IC vehicles
Long term reliability not yet proven
Specialist parts/serving/repair/maintenance needs
Complexity of distribution network
Price and availability of Lithium
Battery technology
Battery price/replacement
Battery recycling
Plug-in Hybrids Pro’s
Technology established
No range restrictions
Lower emissions
Vehicle in production and being sold
Regenerative braking Con’s
Availability of charging points. New charging infrastructure?
Could require additional electricity generation and distribution
Charging times
Higher price than conventional IC engined vehicles
More complex than IC vehicles
Long term reliability not yet proven
Specialist parts/serving/repair/maintenance needs
Complexity of distribution network
Price and availability of Lithium
Battery technology
Battery price/replacement
Battery recycling
Unsuitable for most of the developing world
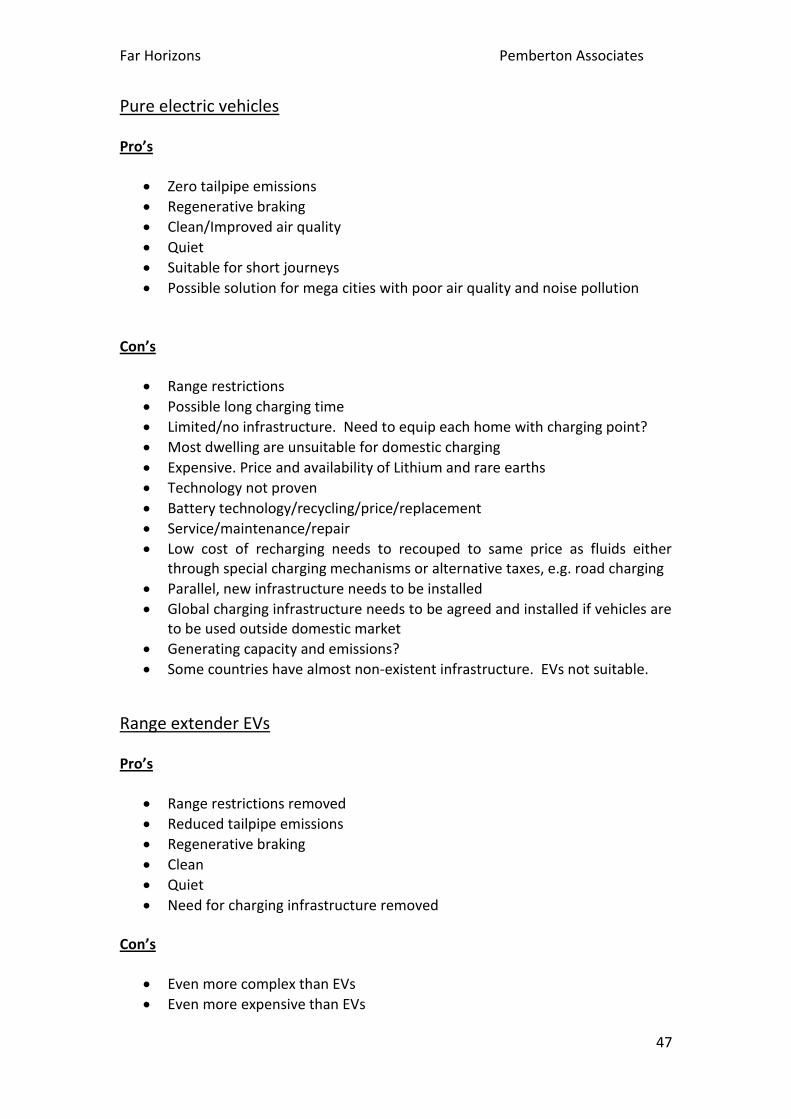
Far Horizons Pemberton Associates
47
Pure electric vehicles Pro’s
Zero tailpipe emissions
Regenerative braking
Clean/Improved air quality
Quiet
Suitable for short journeys
Possible solution for mega cities with poor air quality and noise pollution
Con’s
Range restrictions
Possible long charging time
Limited/no infrastructure. Need to equip each home with charging point?
Most dwelling are unsuitable for domestic charging
Expensive. Price and availability of Lithium and rare earths
Technology not proven
Battery technology/recycling/price/replacement
Service/maintenance/repair
Low cost of recharging needs to recouped to same price as fluids either through special charging mechanisms or alternative taxes, e.g. road charging
Parallel, new infrastructure needs to be installed
Global charging infrastructure needs to be agreed and installed if vehicles are to be used outside domestic market
Generating capacity and emissions?
Some countries have almost non-existent infrastructure. EVs not suitable.
Range extender EVs Pro’s
Range restrictions removed
Reduced tailpipe emissions
Regenerative braking
Clean
Quiet
Need for charging infrastructure removed Con’s
Even more complex than EVs
Even more expensive than EVs
Far Horizons Pemberton Associates
48
Need IC engine, battery and generator
Technology not proven
Price and availability of Lithium
Battery technology/recycling/price/replacement
Service/maintenance/repair
Global infrastructure needs to be agreed and installed if vehicles are to be used outside domestic market
Fuel cell (Hydrogen) Pro’s
Zero emissions
Abundance of hydrogen
Rapid refuelling
Existing fuel station infrastructure could be used
Stable fuel supply
No range restrictions Con’s
Expensive
Complex
Manufacture of hydrogen
High pressure containment
Refuelling infrastructure would need to be modified/replaced
Safety concerns
No cheap and simple way to produce and store hydrogen for either the supply chain or the vehicle
Service/maintenance/repair
Global infrastructure needs to be agreed and installed if vehicles are to be used outside domestic market
Technology not proven
Price of hydrogen for vehicles would need to recoup revenue lost from taxes on fluids, either directly through the pump, or alternatives such as road pricing
Unsuitable for most of the developing world
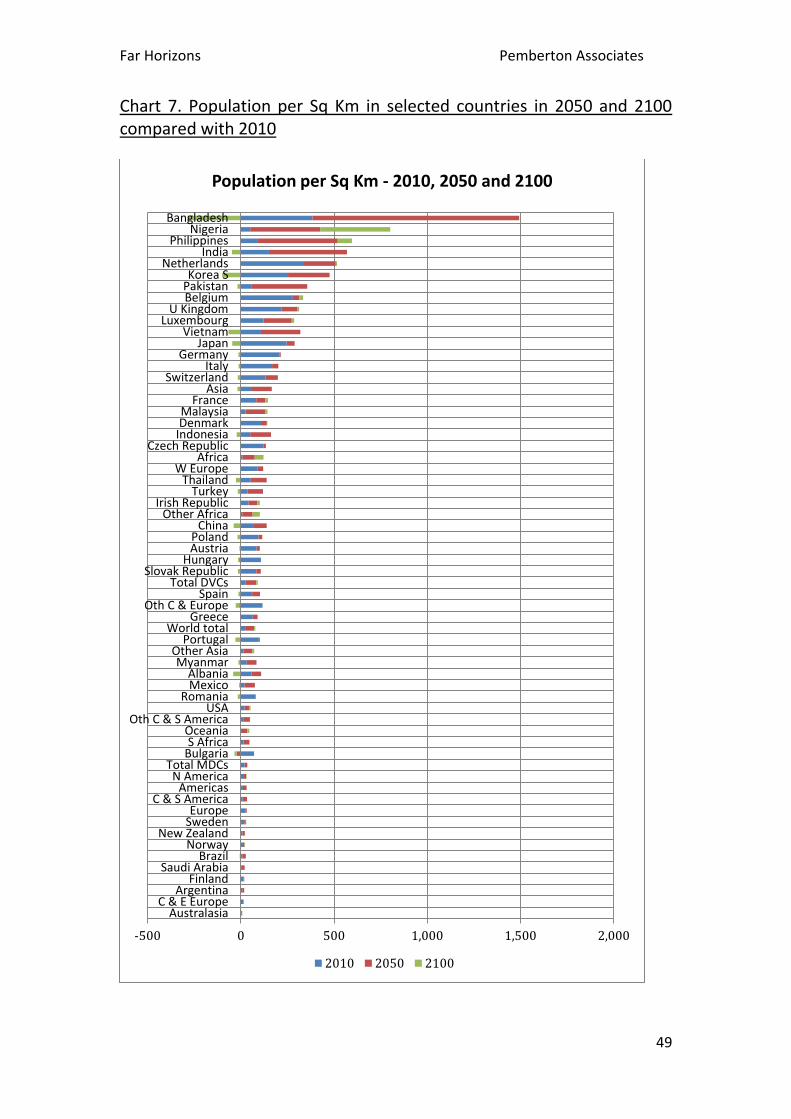
Far Horizons Pemberton Associates
49
Chart 7. Population per Sq Km in selected countries in 2050 and 2100 compared with 2010
-500 0 500 1,000 1,500 2,000
AustralasiaC & E Europe
ArgentinaFinland
Saudi ArabiaBrazil
NorwayNew Zealand
SwedenEurope
C & S AmericaAmericas
N AmericaTotal MDCs
BulgariaS Africa
OceaniaOth C & S America
USARomania
MexicoAlbania
MyanmarOther Asia
PortugalWorld total
GreeceOth C & Europe
SpainTotal DVCs
Slovak RepublicHungary
AustriaPoland
ChinaOther Africa
Irish RepublicTurkey
ThailandW Europe
AfricaCzech Republic
IndonesiaDenmarkMalaysia
FranceAsia
SwitzerlandItaly
GermanyJapan
VietnamLuxembourg
U KingdomBelgiumPakistanKorea S
NetherlandsIndia
PhilippinesNigeria
Bangladesh
Population per Sq Km - 2010, 2050 and 2100
2010 2050 2100
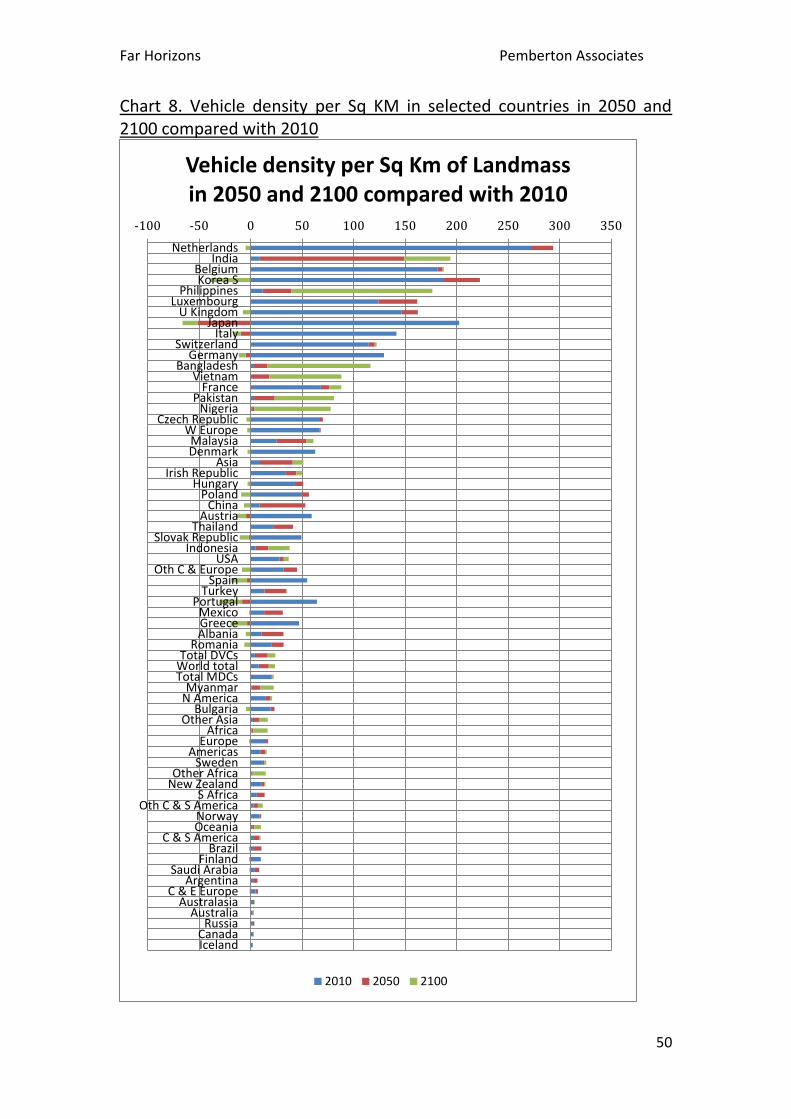
Far Horizons Pemberton Associates
50
Chart 8. Vehicle density per Sq KM in selected countries in 2050 and 2100 compared with 2010
-100 -50 0 50 100 150 200 250 300 350
NetherlandsIndia
BelgiumKorea S
PhilippinesLuxembourg
U KingdomJapan
ItalySwitzerland
GermanyBangladesh
VietnamFrance
PakistanNigeria
Czech RepublicW EuropeMalaysiaDenmark
AsiaIrish Republic
HungaryPoland
ChinaAustria
ThailandSlovak Republic
IndonesiaUSA
Oth C & EuropeSpain
TurkeyPortugal
MexicoGreeceAlbania
RomaniaTotal DVCs
World totalTotal MDCs
MyanmarN America
BulgariaOther Asia
AfricaEurope
AmericasSweden
Other AfricaNew Zealand
S AfricaOth C & S America
NorwayOceania
C & S AmericaBrazil
FinlandSaudi Arabia
ArgentinaC & E Europe
AustralasiaAustralia
RussiaCanadaIceland
Vehicle density per Sq Km of Landmass in 2050 and 2100 compared with 2010
2010 2050 2100
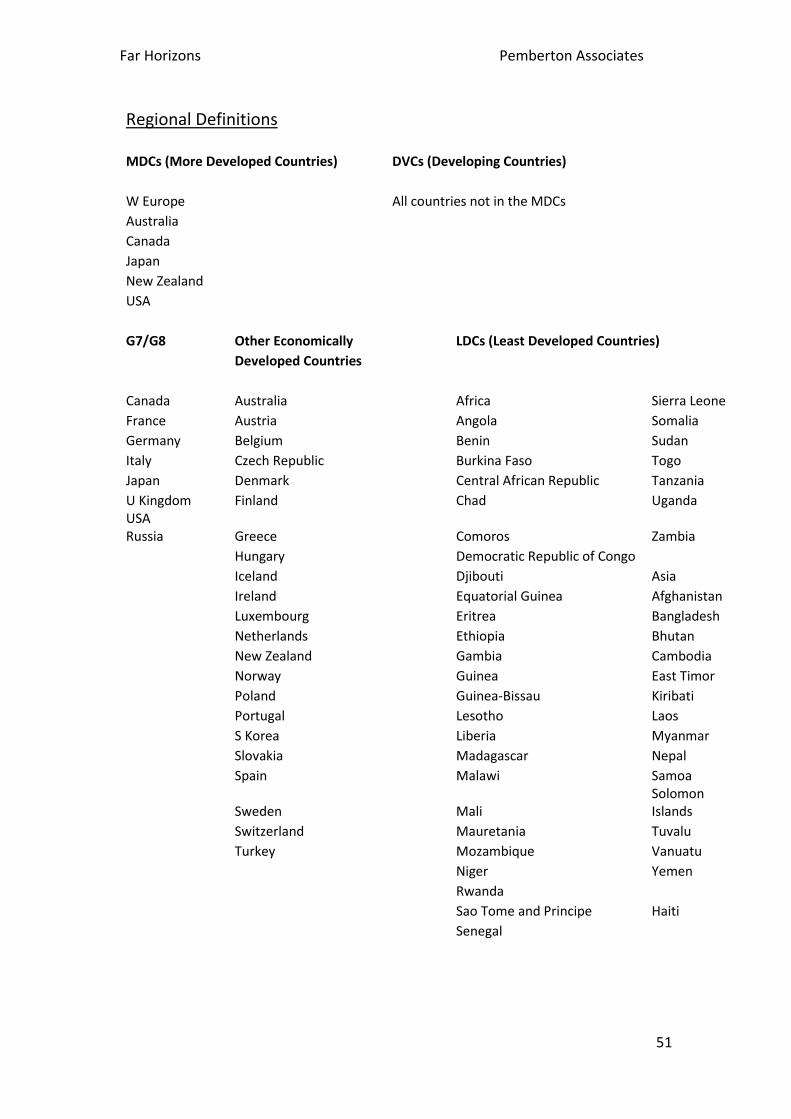
Far Horizons Pemberton Associates
51
Regional Definitions
MDCs (More Developed Countries) DVCs (Developing Countries)
W Europe
All countries not in the MDCs Australia
Canada Japan New Zealand
USA
G7/G8
Other Economically
LDCs (Least Developed Countries)
Developed Countries
Canada
Australia
Africa
Sierra Leone
France
Austria
Angola
Somalia
Germany
Belgium
Benin
Sudan
Italy
Czech Republic
Burkina Faso
Togo
Japan
Denmark
Central African Republic Tanzania
U Kingdom Finland
Chad
Uganda USA Russia
Greece
Comoros
Zambia
Hungary
Democratic Republic of Congo
Iceland
Djibouti
Asia
Ireland
Equatorial Guinea
Afghanistan
Luxembourg
Eritrea
Bangladesh
Netherlands
Ethiopia
Bhutan
New Zealand
Gambia
Cambodia
Norway
Guinea
East Timor
Poland
Guinea-Bissau
Kiribati
Portugal
Lesotho
Laos
S Korea
Liberia
Myanmar
Slovakia
Madagascar
Nepal
Spain
Malawi
Samoa
Sweden
Mali
Solomon Islands
Switzerland
Mauretania
Tuvalu
Turkey
Mozambique
Vanuatu
Niger
Yemen
Rwanda
Sao Tome and Principe Haiti
Senegal
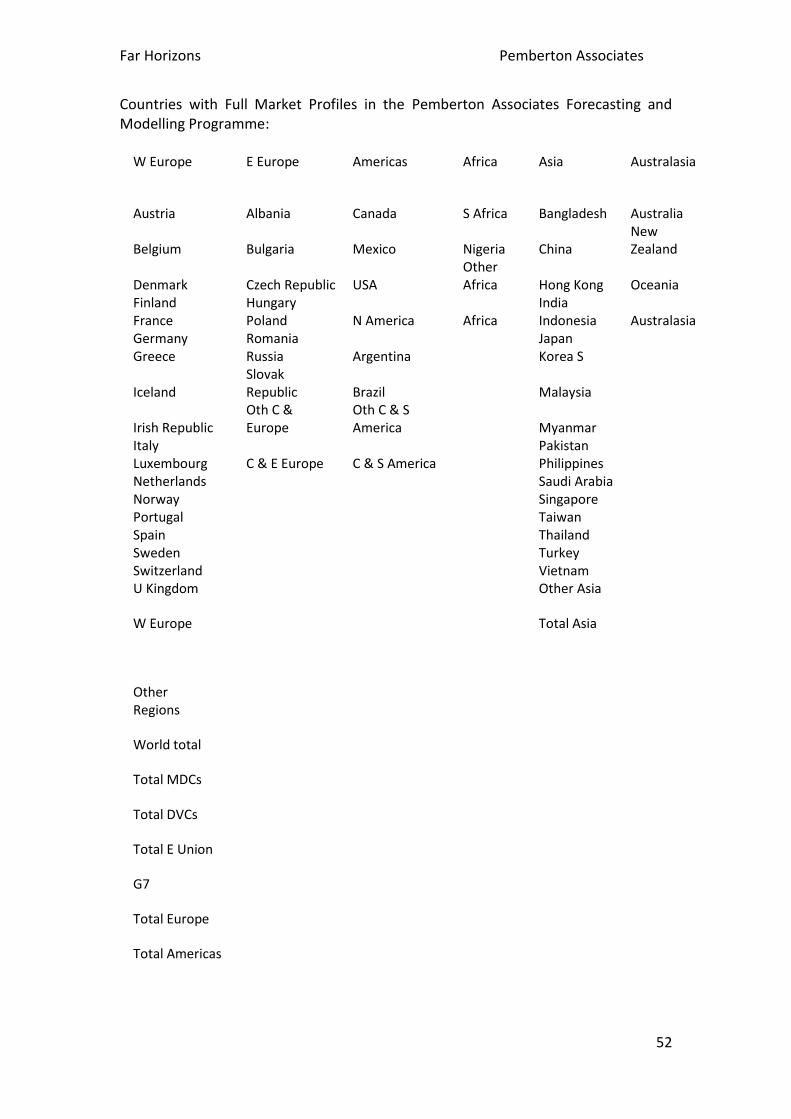
Far Horizons Pemberton Associates
52
Countries with Full Market Profiles in the Pemberton Associates Forecasting and Modelling Programme:
W Europe E Europe Americas Africa Asia Australasia
Austria Albania Canada S Africa Bangladesh Australia
Belgium Bulgaria Mexico Nigeria China New Zealand
Denmark Czech Republic USA Other Africa Hong Kong Oceania
Finland Hungary
India France Poland N America Africa Indonesia Australasia
Germany Romania
Japan Greece Russia Argentina
Korea S
Iceland Slovak Republic Brazil
Malaysia
Irish Republic Oth C & Europe
Oth C & S America
Myanmar
Italy
Pakistan Luxembourg C & E Europe C & S America
Philippines
Netherlands
Saudi Arabia Norway
Singapore
Portugal
Taiwan Spain
Thailand
Sweden
Turkey Switzerland
Vietnam
U Kingdom
Other Asia
W Europe
Total Asia
Other Regions
World total
Total MDCs
Total DVCs
Total E Union
G7
Total Europe
Total Americas

Far Horizons Pemberton Associates
53