Embed Size (px)
Citation preview

FANTA 2F O O D A N D N U T R I T I O NT E C H N I C A L A S S I S TA N C E
Food and Nutrition Technical Assistance II Project (FANTA-2)Academy for Educational Development 1825 Connecticut Ave., NW Washington, DC 20009-5721Tel: 202-884-8000 Fax: 202-884-8432 E-mail: [email protected] Website: www.fanta-2.org
A New Method to Estimate Mortality in Crisis-Affected Populations: Validation and Feasibility Study
Principal Investigators: Francesco Checchi, Bayard Roberts, and Oliver Morgan
January 2009

Food and Nutrition Technical Assistance II Project (FANTA-2) Academy for Educational Development 1825 Connecticut Ave., NW Washington, DC 20009-5721 Tel: 202-884-8000 Fax: 202-884-8432 E-mail: [email protected] Website: www.fanta-2.org
A New Method to Estimate Mortality in Crisis-Affected Populations: Validation and Feasibility Study Principal Investigators: Francesco Checchi, Bayard Roberts, and Oliver Morgan January 2009

This report is made possible by the generous support of the American people through the support of the Office of Health, Infectious Disease, and Nutrition, Bureau for Global Health, United States Agency for International Development (USAID), through both the FANTA-2 Project under the terms of Cooperative Agreement Number GHN-A-00-08-00001-00, and the FANTA Project (1998-2008) under the terms of Cooperative Agreement Number HRN-A-00-98-00046-00, managed by the Academy for Educational Development (AED). The contents are the responsibility of AED and do not necessarily reflect the views of USAID or the United States Government. Published January 2009
Recommended citation: Francesco Checchi, Bayard Roberts, and Oliver Morgan. A New Method to Estimate Mortality in Crisis-Affected Populations: Validation and Feasibility Study. Washington, DC: Food and Nutrition Technical Assistance II Project, Academy for Educational Development, 2009. Copies of the publication can be obtained from: Food and Nutrition Technical Assistance II Project (FANTA-2) Academy for Educational Development 1825 Connecticut Avenue, NW Washington, D.C. 20009-5721 Tel: 202-884-8000 Fax: 202-884-8432 Email: [email protected] Website: www.fanta-2.org

A New Method to Estimate Mortality in Crisis-Affected Populations: Validation and Feasibility Study
Table of Contents Acknowledgments ................................................................................................................................. i Acronyms and Abbreviations .............................................................................................................. ii Executive Summary............................................................................................................................. iv 1. Background .......................................................................................................................................1 2. Rationale and Objectives .................................................................................................................3
2.1. Overview of the Proposed New Method ......................................................................................3 2.2. Potential Advantages ...................................................................................................................3 2.3. Study Justification and Objectives ...............................................................................................4
2.3.1. Need for Field Validation and Feasibility Study..................................................................4 2.3.2. Need for Mathematical Simulation to Guide Sampling Requirements for EM Method
Implementation ...................................................................................................................4 2.3.3. Specific Objectives .............................................................................................................5
3. Validation and Feasibility Study Methods......................................................................................7 3.1. Study Sites ...................................................................................................................................7
3.1.1. District 1, Kabul, Afghanistan .............................................................................................7 3.1.2. Mae La Refugee Camp, Thailand.......................................................................................7 3.1.3. Chiradzulu District, Malawi .................................................................................................7 3.1.4. Lugufu and Mtabila Refugee Camps, Western Tanzania...................................................7
3.2. Sampling Design ..........................................................................................................................8 3.2.1. Recall Period ......................................................................................................................8 3.2.2. Population Investigated ......................................................................................................8
3.3. Implementation of the EM Method ...............................................................................................8 3.3.1. Preparatory Activities..........................................................................................................8 3.3.2. Composition and Training of Study Team ..........................................................................9 3.3.3. Focus Group Discussions...................................................................................................9 3.3.4. Exhaustive Search for Recent Deaths..............................................................................10 3.3.5. Verbal Autopsy Questionnaires ........................................................................................11 3.3.6. Data Collection for Population Estimation ........................................................................12 3.3.7. Estimation of Population Size and Mortality Rates...........................................................13
3.4. Validation ...................................................................................................................................15 3.4.1. Choice of Gold Standard Method .....................................................................................15 3.4.2. Collection of Additional Lists of Deaths ............................................................................16 3.4.3. Capture-Recapture Analysis.............................................................................................17 3.4.4. Corollary Qualitative Data Collection................................................................................19
3.5. Feasibility of the EM Method......................................................................................................20 3.5.1. Economic Feasibility .........................................................................................................20 3.5.2. Assessment of Ethical Implications ..................................................................................20 3.5.3. Verbal Autopsy Feasibility ................................................................................................20
3.6. Data Management......................................................................................................................21 3.7. Ethical Considerations ...............................................................................................................21
4. EM Validation and Feasibility Results ..........................................................................................22 4.1. Focus Group Discussion Findings .............................................................................................22
4.1.1. District 1, Kabul.................................................................................................................22 4.1.2. Mae La Camp ...................................................................................................................23 4.1.3. Chiradzulu District.............................................................................................................24 4.1.4. Lugufu and Mtabila Camps...............................................................................................25
4.2. Exhaustive Search for Recent Deaths .......................................................................................28 4.2.1. Choice of Key Informants .................................................................................................28 4.2.2. Timeframe, Coverage and Study Attrition ........................................................................28 4.2.3. Deaths Captured by the EM Method ................................................................................29 4.2.4. Profile of Deaths Captured by the EM Method.................................................................30
4.3. Population estimation.................................................................................................................31 4.3.1. District 1, Kabul.................................................................................................................31 4.3.2. Mae La Camp ...................................................................................................................31 4.3.3. Chiradzulu District.............................................................................................................31

A New Method to Estimate Mortality in Crisis-Affected Populations: Validation and Feasibility Study
4.3.4. Lugufu and Mtabila Camps...............................................................................................31 4.4. Validity........................................................................................................................................31
4.4.1. Comparison of Deaths Identified by the EM Method and Alternative Data Sources........31 4.4.2. Overlap of Deaths Among Different Lists .........................................................................33 4.4.3. Capture-Recapture Analysis.............................................................................................36 4.4.4. Estimated Sensitivity of the EM Method and Other Sources ...........................................39 4.4.5. Estimated Mortality Rates.................................................................................................41
4.5. Feasibility ...................................................................................................................................41 4.5.1. Economic Feasibility .........................................................................................................41 4.5.2. Ethical Implications of the EM Method .............................................................................45 4.5.3. Feasibility of Adding Verbal Autopsy to EM Method ........................................................46
5. Mathematical Simulation................................................................................................................47 5.1. Distribution of Death Counts in the Time Dimension .................................................................47 5.2. Simulation to Determine Person-Time Requirements for the EM Method.................................48
5.2.1. Scenarios for Implementation of the EM Method .............................................................48 5.2.2. Classification Tests...........................................................................................................48 5.2.3. Expression of Person-Time Requirements.......................................................................49 5.2.4. Parameter Values for Simulation......................................................................................49 5.2.5. Simulation Results: Exhaustive Scenario.........................................................................51 5.2.6. Simulation Results: Sampling Scenario ...........................................................................51
5.3. Calculators to Guide Inference Decisions Based on the Method ..............................................60 6. Discussion .......................................................................................................................................61
6.1. Overall Importance of Study ......................................................................................................61 6.2. Validity........................................................................................................................................61 6.3. Feasibility ...................................................................................................................................63 6.4. Study Limitations........................................................................................................................64
6.4.1. Implementation of the EM Method....................................................................................64 6.4.2. Choice of the Gold Standard Measurement Tool .............................................................64 6.4.3. Study Generalisability.......................................................................................................66
6.5. Routine Application of the EM Method.......................................................................................66 6.6. Further Research and Development..........................................................................................68
6.6.1. Future Development of the EM Method ...........................................................................68 6.6.2. The Potential Applicability of Capture-Recapture Analysis ..............................................68
6.7. Conclusions................................................................................................................................68 7. References.......................................................................................................................................70 8. Report Annexes...............................................................................................................................72
8.1 Focus Group Discussion Topic Guide ........................................................................................72 8.2. Household Register....................................................................................................................76 8.3. Household Visit Procedures.......................................................................................................77 8.4. Consent Forms and Participant Information Sheets ..................................................................78 8.5. Mortality Questionnaire ..............................................................................................................82 8.6. Visual Calendar Aid....................................................................................................................84 8.7. Register for Additional Capture-Recapture Sources..................................................................85 8.8 Residential Structure Tally Sheet................................................................................................86 8.9. International Form of Medical Certificate of Death ....................................................................87 8.10. Bootstrapping Programs for Mortality Estimation ....................................................................88 8.11. Economic Feasibility Costing ...................................................................................................98 8.12. Program for Capture-Recapture Analysis ..............................................................................100 8.13. Verification of the Poisson Assumption on the Distribution of Death Counts Over Time ......106 8.14. Summary Results of Mathematical Simulations ....................................................................108

A New Method to Estimate Mortality in Crisis-Affected Populations: Validation and Feasibility Study
LIST OF TABLES Table 1. Details of FGD Participants, by Study Site .............................................................................10 Table 2. Details of Lists Used for Capture-Recapture Analysis, by Site...............................................16 Table 3. Sources of Information on Deaths Identified During the FGD in District 1, Kabul ..................22 Table 4. Sources of Information on Deaths Identified During the FGD in Mae La Camp.....................23 Table 5. Sources of Information on Deaths Identified During the FGD in Chiradzulu District ..............24 Table 6. Sources of Information on Deaths Identified During the FGD in Lugufu camp, Tanzania......26 Table 7. Sources of Information on Deaths Identified During the FGD in Mtabila Camp, Tanzania ....27 Table 8. Primary and Secondary Key Informants, by Study Site..........................................................28 Table 9. Timeframe, Population Covered by the Exhaustive Search, and Attrition of Key Informants,
by Study Site ............................................................................................................................29 Table 10. Number (Percentage) of Deaths Captured Using the EM Method, by Informant Type, Recall
Period, and Study Site .............................................................................................................29 Table 11. Profile of Deaths Captured by the EM Method, by Recall Period and Study Site ................30 Table 12. Demographic Profile of Deaths Captured by the EM Method and Alternative Lists, by Recall
Period and Study Site ..............................................................................................................32 Table 13. Log-Linear Models and Possible Capture-Recapture Estimates of Uncaptured Deaths in
District 1, Kabul, By Recall Period ...........................................................................................36 Table 14. Log-Linear Models and Possible Capture-Recapture Estimates of Uncaptured Deaths in
Mae La Camp, by Recall Period ..............................................................................................37 Table 15. Log-Linear Models and Possible Capture-Recapture Estimates of Uncaptured Deaths in
Chiradzulu District, by Recall Period........................................................................................38 Table 16. Log-Linear Models and Possible Capture-Recapture Estimates of Uncaptured Deaths in
Lugufu and Mtabila Camps, by Recall Period..........................................................................39 Table 17. Estimated Sensitivity of the EM Method, Other Sources and All Lists Combined, by Study
Site and Recall Period..............................................................................................................40 Table 18. Estimated Crude and Under 5 Years Mortality Rates (as Deaths per 10,000 Person-Days)
Based on the EM Method, All Lists Combined and the Capture-Recapture Estimate, by Study Site and Recall Period..............................................................................................................41
Table 19. Comparison between EM Method and Retrospective Survey in Terms of Time Inputs (Person-Hours), by Activity ......................................................................................................42
Table 20. Time Inputs into the EM Method, by Staff Type and Site, and Comparison with Surveys ...43 Table 21. Comparison between EM Method and Retrospective Survey in Terms of Monetary Inputs
(USD), by Activity and Study Site ............................................................................................44 Table 22. Cost Inputs (USD) into the EM Method, by Staff Type and Site, and Comparison with
Surveys ....................................................................................................................................45 Table 23. Comparison between the Four Study Sites for the Time and Cost per Death Recorded.....45 Table 24. Details of Six Mortality Surveillance Datasets Used to Study the Distribution of Death
Counts Over Time....................................................................................................................47 Table 25. Goodness of Fit of a Poisson Model Applied to Six Mortality Surveillance Datasets ...........48 Table 26. Parameter Values for the Exhaustive and Sampling Scenario Simulations .........................50 Table 27. Recent Survey-Based Estimates of Mortality (as Deaths per 10,000 Person-Days) from
Regions Surrounding the Four Study Sites, by Year(s) Covered by the Survey.....................65 Table 28. Summary of Scenarios in Which the EM Method Could be Applied.....................................67 Table 29. Costing by Study Site............................................................................................................98 Table 30. Assumptions for Time Inputs for a Retrospective Survey, by Study Site .............................98

A New Method to Estimate Mortality in Crisis-Affected Populations: Validation and Feasibility Study
LIST OF FIGURES Figure 1. Sample Size Requirements for a Retrospective Mortality Survey Targeting Different Recall
Periods .......................................................................................................................................2 Figure 2. Venn Diagram Representing the Overlap Among the Three Different Lists .........................18 Figure 3. Reported Timing of Deaths Captured in Kabul, by Source ...................................................33 Figure 4. Overlap Among the Three Mortality Lists in District 1, Kabul, by Recall Period....................34 Figure 5. Overlap Among the Three Mortality Lists in Mae La Camp, by Recall Period ......................34 Figure 6. Overlap Among the Three Mortality Lists in Chiradzulu District, by Recall Period................35 Figure 7. Overlap Among the Three Mortality Lists in Lugufu and Mtabila Camps, by Recall Period..35 Figure 8. Simulation Results for the Exhaustive Scenario (Threshold: 0.5 per 10,000 Person-Days) .52 Figure 9. Simulation Results for the Exhaustive Scenario (Threshold: 1 per 10,000 Person-Days) ....53 Figure 10. Simulation Results for the Exhaustive Scenario (Threshold: 2 per 10,000 Person-Days) ..54 Figure 11. Simulation Results for the Exhaustive Scenario (Threshold: 4 per 10,000 Person-Days) ..55 Figure 12. Simulation Results for the Exhaustive Scenario (Threshold: 8 per 10,000 Person-Days) ..56 Figure 13. Simulation Results for the Sampling Scenario (Threshold: 0.5 per 10,000 Person-Days)..57 Figure 14. Simulation Results for the Sampling Scenario (Threshold: 1 per 10,000 Person-Days).....57 Figure 15. Simulation Results for the Sampling Scenario (Threshold: 2 per 10,000 Person-Days).....58 Figure 16. Simulation results for the Sampling Scenario (Threshold: 4 per 10,000 Person-Days) ......58 Figure 17. Simulation Results for the Sampling Scenario (Threshold: 8 per 10,000 Person-Days).....59

A New Method to Estimate Mortality in Crisis-Affected Populations: Validation and Feasibility Study
i
Acknowledgments This study was carried out by the London School of Hygiene and Tropical Medicine (LSHTM). Principal investigators were Francesco Checchi (LSHTM), Bayard Roberts (LSHTM), and Oliver Morgan (United States Centers for Disease Control and Prevention [CDC]). Study co-investigators were Daniel Chandramohan (LSHTM), Mohammed Ghaus Sultani (LSHTM, Kabul, Afghanistan), Mark Myatt (Brixton Health), Peter Nyasulu (Médecins Sans Frontières France [MSF-F], Malawi programme), Sunday Rwebangila (United Nations High Commissioner for Refugees [UNHCR], Tanzania office), and Egbert Sondorp (LSHTM). This project was funded by the United Stated Agency for International Development (USAID). The work was completed under the Food and Nutrition Technical Assistance II Project (FANTA-2)'s predecessor, the Food and Nutrition Technical Assistance Project (FANTA), which ran from 1998 through 2008, at the Academy for Educational Development (AED). The authors are extremely appreciative of their support. They would particularly like to thank Megan Deitchler (FANTA and FANTA-2) for input and advice. The authors thank the residents of all the field sites for their kind participation in the study, and the staff in Afghanistan, Thailand, Malawi, Tanzania and elsewhere, too numerous to list, who facilitated our work. In particular, the authors would like to recognize the following individuals and agencies who contributed to the study in the respective field sites: Afghanistan Drs. Arya, Murzia, Nuzhat, Fahim, Jowheed and Waheed collected data from study participants, and Dr. Faridullah Atiqzai led focus group discussions. The authors are grateful for the cooperation received from the Ministry of Public Health and from Dr. Wassima Qarizada in particular. The authors also thank the Wakils and Municipality office of District 1 in Kabul for their kind assistance. They are extremely grateful for the support of Annemarie ter Veen, Koko and Naveed Yusuf, and the late Koko Sidique at the LSHTM office in Kabul, as well as Drs. Zabihullah Maroof and Ayub from the Agha Khan Health Services. Thailand They authors are grateful for the hospitality offered by Aide Médicale Internationale (AMI), in particular by Aurore Debellut, AMI Project Manager. Many individuals supported this study, including Phathu, AMI Home Visitors Supervisor for Mae La camp, Htun Htun and Cecilia from the Mae La Camp Committee, Dr. Matthias Sachse Aguilera, AMI Umphang Project Manager, and Skoda, AMI Hospital Director at Umpiem camp. The authors are also grateful to have worked with translators Ay Tway in Mae La and Emulha in Umpiem. They thank Dr. Susan Maloney and Dr. Sonja Olsen from the Centers for Disease Control and Prevention for their support. Malawi Grey Zachariah, Deborah Namatika, Luciano Mambo and Agnes Mogha collected data, with driving support by Vincent and Sheikh Barakass. The authors are grateful for the efficient support provided by Médecins Sans Frontières-France, in particular Megan McGuire, Dr. Ayub Said, Mickael le Paih, Sandy Althomsons, Dr. Reynaldo, and Dr. Siamak Malek for analysis of verbal autopsy questionnaires. The authors would also like to thank the Chiradzulu District Health Officer Dr. James Mpunga, the District Environmental Health department of Chiradzulu hospital, the District Commissioner’s office, the Traditional Authorities, and Health Centers in Chiradzulu district. We would also like to thank Sara Hersey for her assistance. Tanzania Data collectors included Thomas Matambi, Mariam Sabura, David Losekelo, Beatrice Samizi, Victor Charles, and Said Sukwa. The authors are very grateful for the support offered by the UNHCR, in particular Herman Tirwosha and Dr. Kevin Tsatsiyo in Tanzania, and Heiko Hering and Paul Spiegel in Geneva. The authors would also like to thank the Tanzanian Red Cross Society (TRCS) for their

A New Method to Estimate Mortality in Crisis-Affected Populations: Validation and Feasibility Study
ii
assistance, in particularly Dr. Ernest Athuman and Dr. Tumaini, and World Vision and International Rescue Committee (IRC) staff who provided mortality data. The authors would also like to thank Rebecca Freeman Grais (Epicentre), Evelyn Depoortere (European Centre for Disease Control), Colleen Hardy (IRC) and Heiko Hering (UNHCR) for sharing data on past mortality surveillance systems, and Patrick Ball and colleagues (Benetech Initiative) for advice and sharing of programming codes for capture-recapture analysis.

A New Method to Estimate Mortality in Crisis-Affected Populations: Validation and Feasibility Study
iii
Acronyms and Abbreviations AED Academy for Educational Development AIDS Acquired immune deficiency syndrome AMI Aide Médicale Internationale BIC Bayesian Information Criterion BMA Bayesian Model Averaging CDC United States Centers for Disease Control and Prevention CHW Community health worker CI Confidence interval CMR Crude mortality rate CSAS Centric Systematic Area Sample d Day Deff Design effect DHO District Health Office EM Exhaustive measurement EPI Expanded Program of Immunization FANTA Food and Nutrition Technical Assistance Project FGD Focus group discussion GPS Global positioning system h Hour HIV Human immunodeficiency virus HSA Health Surveillance Assistant HTML HyperText Markup Language ICD-10 International Classification of Diseases, version 10 IDP Internally displaced persons IRC International Rescue Committee LSHTM London School of Hygiene and Tropical Medicine MSF-F Médecins Sans Frontières – France NGO Nongovernmental organization OC Operating characteristic OLS Ordinary least squares PPS Probability proportional to size PSU Primary sampling unit SMART Standardised Monitoring and Assessment in Relief and Transition SMRI Shoklo Medical Research Institute SMRU Shoklo Malarial Research Unit STI Sexually transmitted infection TBA Traditional birth attendant TRCS Tanzanian Red Cross Society U5MR Under 5 mortality rate UNHCR United Nations High Commissioner for Refugees USD United States Dollars WHO World Health Organization

A New Method to Estimate Mortality in Crisis-Affected Populations: Validation and Feasibility Study
iv
Executive Summary BACKGROUND Data on mortality rates and the causes and circumstances of death are crucial to guide health interventions in crisis-affected populations, and monitor their effectiveness. The two methods currently available to collect mortality data are prospective surveillance and retrospective surveys. However, these methods require substantial resources and feature important methodological limitations. RATIONALE AND OBJECTIVES We evaluated an alternative method for rapidly quantifying mortality through exhaustive measurement (henceforth referred to as the EM method). The EM method captures deaths through an exhaustive search for all deaths occurring in the community over a defined and very short recall period. Unlike retrospective surveys, it provides nearly real-time mortality estimates, which are most useful for operational purposes in relief settings. The search process mainly depends on key community informants, selected after rapid qualitative work, who lead data collectors to households whom they recall as having experienced a recent death; next-of-kin of decedents can also act as informants leading the data collectors to other recently bereaved households. The process continues until informants can no longer identify households with recent deaths. The main study objectives were to evaluate the validity and feasibility of the EM method. In terms of validity, we sought to investigate whether the EM method would capture recent deaths in the selected communities with sufficient sensitivity. In terms of feasibility, we sought to record the time and cost required for data collection and analysis, explore the ethical implications of using the EM method, and assess the inclusion of verbal autopsy interviews within the EM method to increase the reliability of reported cause of death. An additional study objective was to determine study design requirements and guide inference decisions for routine implementation of the EM method, with particular attention to the effect of stochastic fluctuation of mortality in small populations and/or over short recall periods. VALIDATION AND FEASIBILITY STUDY METHODS Implementation of the EM Method Between July and October 2008, we evaluated the EM method using a common protocol in four sites worldwide, reflecting different types of human settlement. The sites were (i) District 1 of Kabul city, Afghanistan (population 76,500); (ii) Mae La camp for Karen refugees on the Thai-Burma border (43,800); (iii) rural Chiradzulu District, Malawi (54,400); (iv) Lugufu and Mtabila refugee camps, Tanzania (80,100). Data collection instruments were developed for the study and translated into local languages. In each site we hired and trained local study team members. We used focus group discussions with community members to inform the quantitative data collection, particularly to identify the key community informants on which the EM method relies. With the assistance of the selected community informants, we implemented the EM method to capture deaths over a two month recall period (with the most recent 30 days being the focus of analysis). We needed to estimate total population in two sites. In Chiradzulu district, we also used the most recent standardized World Health Organization verbal autopsy questionnaires. Validation and Feasibility We used capture-recapture analysis as the gold standard measurement method to establish the sensitivity of the EM method. Capture-recapture analysis uses several lists of recent deaths from different sources and applies log-linear statistical regression to model the total number of estimated deaths. A modeling approach was used to compare the observed time and cost inputs for the EM method and a retrospective mortality survey. Ethical implications of the EM method were assessed through data review and discussions with data collectors. The feasibility of using verbal autopsy questionnaires with the EM method was assessed by recording the time required for completing verbal autopsy interviews and analysis.

A New Method to Estimate Mortality in Crisis-Affected Populations: Validation and Feasibility Study
v
Validation and Feasibility Results The EM method showed moderate sensitivity, ranging from 55% to 68% over a 30 day period. Sensitivity was consistently lower among children under 5 years:
Recall Period District 1, Kabul Mae La Camp Chiradzulu
District Tanzania Camps
60 days 67 (20) 27 (2) 93 (26) 44 (22) Total deaths (<5 years) captured by the EM method 30 days 11 (1) 16 (0) 36 (12) 21 (8)
60 days 107 (38) 60 (≥16) 143 (39) 83 (41) Total deaths (<5 years) estimated by gold-standard method 30 days 20 (≥5) 25 (≥4) 53 (≥15) 31 (17)
60 days 62.6 (39.9-72.8) 45.0 (37.0-48.2) 65.0 (47.9-75.6) 53.0 (36.4-62.9) Estimated % sensitivity of the EM method among all age groups (95%CI) 30 days 55.0 (37.9-61.1) 64.0 (50.0-69.6) 67.9 (37.1-81.8) 67.7 (51.2-72.4)
60 days 0.15 (0.12-0.19) 0.10 (0.09-0.11) 0.30 (0.23-0.39) 0.09 (0.09-0.10) Crude mortality rate * (95%CI) estimated by the EM method 30 days 0.05 (0.04-0.06) 0.12 (0.11-0.13) 0.26 (0.17-0.38) 0.09 (0.08-0.09)
60 days 0.24 (0.19-0.34) 0.23 (0.20-0.28) 0.51 (0.38-0.67) 0.18 (0.15-0.24) Crude mortality rate * (95%CI) estimated by the gold-standard method 30 days 0.09 (0.08-0.12) 0.19 (0.17-0.23) 0.39 (0.25-0.71) 0.13 (0.12-0.15)
* Deaths per 10 000 person-days.
The EM method required fewer time and monetary inputs than a retrospective survey method:
The EM method required an average of 163 (90%) fewer respondent-hours than retrospective surveys. In the one site where verbal autopsy questionnaires were administered, this constituted only 3% of total person-time for the method’s implementation. MATHEMATICAL SIMULATION After verifying the classical Poisson assumption about the probability distribution of mortality on six time series datasets from past surveillance systems, we implemented probabilistic simulations of the EM method assuming two modes of implementation: (i) an exhaustive scenario in which the entire population is investigated, appropriate for small and/or concentrated communities; (ii) a sampling scenario in which the EM method is implemented in a representative sample of population sampling units (PSUs). We evaluated the performance of the EM method in the above two scenarios, under a range of assumptions about person-time investigated, underlying mortality rate, and threshold of interest, and applying three alternative classification tests: (i) a Poisson test (found to be most conservative), (ii) a sequential test, and (iii) an exact confidence interval (CI) test. Freely available HTML calculators performing the above tests were also developed. We found that the EM method reached acceptable sensitivity and specificity (i.e. correctly classified mortality as either above or below a threshold of interest) when at least 1,000,000 person-days were investigated in the exhaustive scenario, and at least 30 PSUs and 20,000 person-days in the sampling scenario.
District 1, Kabul Mae La Camp Chiradzulu District Tanzania Camps Inputs
EM Survey EM Survey EM Survey EM Survey
Total estimated person-hours 1,482 2,138 168 600 2,295 1,734 444 674
Total estimated costs (USD) 11,933 13,052 1,066 4,390 15,646 15,804 2,610 4,428

A New Method to Estimate Mortality in Crisis-Affected Populations: Validation and Feasibility Study
vi
DISCUSSION This study suggests that a new method to estimate mortality in crisis-affected populations based on information provided by community informants, detects a disappointingly low proportion of all deaths in a range of settings. Sensitivity is particularly disappointing among children under 5 years. However, the method’s performance is comparable to that of existing surveillance systems. In terms of feasibility, the EM method appears superior to the main alternative, namely retrospective surveys, in terms of time and financial inputs, as well as ethical provisions. Addition of verbal autopsy questionnaires is also feasible and efficient. We believe the method shows sufficient promise to warrant further development, and that achieving acceptable sensitivity (e.g., >85%) is an achievable aim. A strong existing knowledge of the study community combined with effective implementation of the initial qualitative work is essential if the EM method is to be applied routinely. Further development should thus be focused on improving sensitivity through selection of appropriate key informants, and should be primarily be grounded in social science and qualitative research.

A New Method to Estimate Mortality in Crisis-Affected Populations: Validation and Feasibility Study
1
1. Background Crude and under 5 years mortality rates are key indicators for assessing the health status of a population, and monitoring its evolution.[1] Data on mortality rates and the causes and circumstances of death are crucial to guide the deployment of relief interventions, and to monitor their effectiveness.[2] While mortality data can be used for advocacy and quantification of international humanitarian law violations, most relief agencies on the ground are interested in mortality data to address more operational, immediately relevant questions, namely:
What is the magnitude of mortality at the present moment? In which sub-sections or sub-groups of the community is mortality highest? What are the main causes and circumstances of death?
The two methods currently available to answer these questions are prospective surveillance and retrospective surveys. Prospective surveillance (also known as vital events registration) involves exhaustive collection of birth and death events through household visits on a daily or weekly basis. The method furnishes real-time estimates of mortality, which help to guide a quick and appropriate public health response to any observed fluctuations. Data are not subject to sampling errors and can often be broken down by sub-area within a target community. Investigating causes and circumstances of death is theoretically possible within surveillance systems, but requires considerable skill in administration of verbal autopsy questionnaires (see below). Despite these benefits, prospective surveillance is seldom used in the emergency phase of a crisis, and indeed in most developing country settings, mainly because it requires ongoing human resource inputs and close expert supervision. It is also difficult to set up and monitor in scattered populations. [2] Surveillance systems often decay rapidly, resulting in underreporting of vital events and increasingly unreliable data. Because of the feasibility constraints associated with the surveillance method, relief agencies often resort carrying out retrospective mortality surveys, whereby a representative sample of households is interviewed using a standardized questionnaire about demographic changes (births, deaths, in- and out-migrations) in the household over a specified period in the past (recall period). However, retrospective mortality surveys have serious limitations:
They are subject to bias (non-sampling error) and imprecision (sampling error) around the point estimate of mortality. Potential forms of bias include household selection, household size reporting, event recall, event reporting, and survival. Imprecision in sample-based surveys can result from inadequate sample sizes, insufficient length of the recall period, an unexpected magnitude of mortality, non self-weighting sampling, and the design effect, a phenomenon inherent in cluster sampling designs. To reduce bias and imprecision, expert input is required in the design, implementation and analysis of these surveys.[3-5]
They require significant time and resources to carry out because of the large sample sizes required. A typical 30 cluster x 30 households survey covering a small territory may cost about 10-30,000 United States dollars (USD), and require at least one month for obtaining authorizations, preparation, data collection, analysis and reporting. These delays further reduce the timeliness and thus the relevance of the findings for public health decision making and programming.
Critically, they cannot provide sufficiently precise estimates for very recent periods (i.e. data about current mortality), as this would require extremely large sample sizes. Figure 1 demonstrates the sample size (number of households to be interviewed: y axis) required to estimate various magnitudes of mortality rate with precision no worse than ± 30% (assuming a design effect of 2 and mean household size of 5), according to the desired recall period.
Most data collection time during retrospective surveys is spent collecting data on living people (death is a comparatively rare event), which leaves little time for in-depth investigation of

A New Method to Estimate Mortality in Crisis-Affected Populations: Validation and Feasibility Study
2
causes and circumstances of death. Most often, next of kin respondents are asked to provide a cause of death, or choose one from among a pre-defined list. Such data may have very limited validity.
Because of the above, surveys also entail considerable data management requirements (see below).
Retrospective surveys usually rely on a cluster sampling design, which means the results cannot be broken down by sub-area within the surveyed community, i.e. no estimates for individual clusters can be obtained, unless the sampling design is stratified.
Cluster sampling in very unstable settings may sometimes result in very high design effects, which results in exceedingly large CIs, hampering interpretation of the estimates; in crises, there is usually no way to accurately predict the observed design effect a priori, and adjust sample size accordingly.
In summary, retrospective surveys, while often the only currently available method to measure mortality in crises, do not provide very satisfying answers to the key operational questions faced by agencies wishing to assess a population’s health status, and implement and monitor appropriate public health interventions accordingly. Figure 1. Sample Size Requirements for a Retrospective Mortality Survey Targeting Different Recall Periods
0
2000
4000
6000
8000
10000
12000
14000
91 84 77 70 63 56 49 42 35 28 21 14 7
days in recall period
requ
ired
sam
ple
size
(hou
seho
lds)
0.5 per 10 000 per day1.0 per 10 000 per day2.0 per 10 000 per day5.0 per 10 000 per day

A New Method to Estimate Mortality in Crisis-Affected Populations: Validation and Feasibility Study
3
2. Rationale and Objectives 2.1. OVERVIEW OF THE PROPOSED NEW METHOD In response to the limitations of prospective surveillance and retrospective surveys for estimating mortality, we evaluated an alternative method, mainly reliant on the knowledge of key community informants, for rapidly quantifying mortality over a very recent period through the EM method. Estimation of a mortality rate whether by prospective surveillance, retrospective survey, or the EM method, requires a numerator (deaths during a given period) and a denominator (person-time at risk during the period). In carrying out the EM method, deaths are captured through an exhaustive search for all deaths occurring in the community over a defined recall period. The search process is mainly dependent on key community informants, selected after rapid qualitative work, who lead data collectors to households that they recalled as having experienced a recent death; next-of-kin of decedents can also acted as informants leading the data collectors to other recently bereaved households. The process continues until informants can no longer identify households with recent deaths. If the period is short (i.e. weeks or months, rather than years) and there has been no major population in- and out-migration, one can safely assume that (i) each individual in the population contributes an equal amount of person-time, and (ii) the population at the end of the period is roughly equal to that at the beginning, i.e. the denominator can be more simply expressed as population at the end of the period x duration of the period. Population figures for calculation of person-time at risk can be obtained either from available registration systems or by rapid estimation (further information on the population estimation methods used in the study are described in Sections 3.3.6 and Section 3.3.7). 2.2. POTENTIAL ADVANTAGES We considered that the EM method would potentially feature numerous benefits compared to current methods for estimating mortality. The following potential advantages over prospective surveillance were initially identified:
The EM method would be a one-off effort (which can be repeated regularly) rather than an ongoing activity as is required for surveillance. As a result, financial, human resource and material inputs would be much lower.
It would entail lower requirements for supervision as it would only require a small team of data collectors, and supervisors could potentially be present in most households from which data are collected.
It would potentially be more efficient for scattered populations and large geographic areas than prospective surveillance, since data collectors would only visit households with recent deaths, minimizing travel and transport requirements.
Similarly, the following potential advantages over retrospective surveys appeared evident:
The EM method would provide real-time mortality estimates, since it would be able to investigate considerably more recent person-time than a standard survey.
Only data on events (deaths) would be required, reducing data collection and entry time and requirements. For example, in a community of 100,000 people with a CMR of 2 deaths per 10,000 person-days over a 14 day recall period, the EM method would yield a database of 280 records, compared to 4,000-6,000 for a standard 30x30 cluster survey.
Data analysis would be simplified in most scenarios by removing the need for weighting and design effect adjustment inherent in sample surveys, or individual person-time calculation when the recall period is long and the cohort very dynamic. The method could therefore be used by program staff with limited research skills.

A New Method to Estimate Mortality in Crisis-Affected Populations: Validation and Feasibility Study
4
The reduced data collection time for the EM method would allow more time to collect detailed data on individual deaths. This could include using verbal autopsy questionnaires to more reliably classify causes of death.
In contrast to a retrospective mortality survey, findings from the EM method could be broken down by sub-area, and deaths could be mapped using global positioning system (GPS) software to identify areas with high need mortality or assist outbreak investigations.
2.3. STUDY JUSTIFICATION AND OBJECTIVES 2.3.1. Need for Field Validation and Feasibility Study The above advantages would only be realized if the method were valid and feasible. In terms of validity, the main unknown was whether key community informants selected through rapid qualitative research would capture recent deaths in their communities with sufficient sensitivity. Feasibility questions, related to the EM method, include the time and cost required for data collection and analysis, ease of use, the possibility of including verbal autopsy data collection within the EM method, and ethical implications. 2.3.2. Need for Mathematical Simulation to Guide Sampling Requirements for EM Method Implementation As there is as yet no documented field experience with the proposed EM method, its statistical properties and robustness, including sample size and inference issues, need to be explored in addition to its validity and feasibility. While an approach, such as the EM method, which directly targets households with recent deaths, might lead to more precise estimates of mortality than a standard retrospective survey, inferences based on the method’s findings would nonetheless have to take into account random effects due to the stochastic fluctuation of mortality over time. In practice, observed mortality is the reflection both of secular trends due to bona fide changes in health determinants (in engineering terms this could be termed the signal) and of one of the many possible chance realizations of a distribution of possible mortality levels (equivalent to random noise). Instinctively, it is obvious that random noise becomes more influential as the amount of person-time investigated decreases, warranting greater and greater inferential caution. Guidance for potential users of the EM method should thus include recommendations for investigating an amount of person-time (population x time period) sufficient to reduce the effect of random noise to an acceptable level, and for interpreting results while taking this issue into account. In addition, the EM method is subject to potentially considerable imprecision in the denominator, especially if the population size is unknown and a rapid estimation method is used to measure it. Clearly, this uncertainty needs to be explicitly accounted for when analyzing data. Finally, in a community with very large population and/or very scattered settlements (e.g., a rural district comprised of hundreds of villages), users of the EM method might consider it unfeasible to survey the entire population (long transport times would probably be the main limiting factor), and instead wish to sample a representative fraction of it. Clearly, such sampling of communities would entail a different set of recommendations. These operational-related issues are amenable to mathematical simulation, which can efficiently consider a large range of potential scenarios for the EM method’s implementation. In light of the above validity, feasibility and operational questions, we considered that the EM method was deserving of a rigorous validation and feasibility study, coupled with desk-based mathematical simulation to explore minimum person-time requirements and guide inference based on the method’s findings. Recognizing that the validity and feasibility of a data collection method can vary considerably according to the local culture and type of human settlement being investigated (e.g., a camp, an urban slum, a rural district), the evaluation of the EM method was designed to be multi-centric.

A New Method to Estimate Mortality in Crisis-Affected Populations: Validation and Feasibility Study
5
2.3.3. Specific Objectives The study had the following objectives: 1. Establish the validity of the EM method for identifying deaths and causes of death in the
community, by comparing it against a gold standard measure (capture-recapture analysis of multiple lists) in up to four field sites: 1.1. Gain a qualitative understanding of (i) which key community informants may be most
effective in sharing and collecting information about recent deaths, (ii) patterns whereby information on recent deaths is shared among community members, (iii) potential bias of collecting information on recent deaths through the EM method or gold standard method, and (iv) local concepts of causes of illness and death.
1.2. Implement the EM method to measure crude mortality rates (CMR) and under 5 mortality rates (U5MR) during a one month recall period in up to four different populations ranging approximately from 50,000 to 100,000, and encompassing a variety of settings, including at least one camp, one urban neighborhood and one rural district.
1.3. Compare the above results to the CMR and U5MR in the same population and over the same period as estimated by capture-recapture, to estimate the method’s sensitivity.
1.4. Explore any observed under- or over-reporting of mortality through the EM method by comparing the profile of decedents captured by the EM and gold standard methods, and corollary qualitative information.
2. Document the field feasibility of the EM method: 2.1. Document the financial costs of the EM method in terms of human resources, material and
time inputs.
2.2. Compare the above costs to typical costs incurred by a standard retrospective survey in a similar setting.
2.3. Predict the feasibility of the EM method in communities of large population size and/or low population density (i.e. scattered in a wide geographical area).
2.4. Compare the ethical implications, in terms of risks and burden to the community and individual respondents, of the EM method, standard retrospective surveys and the gold standard death registry method.
2.5. Explore the feasibility of adding World Health Organization (WHO) standard verbal autopsy questionnaires to the EM method to quantify the contribution of different causes of death to overall mortality.
3. Predict statistical requirements, in terms of minimum person-time to be investigated, for routine implementation of the EM method, subject to the indicator of interest (CMR or U5MR), size of the community targeted, and the underlying mortality rate, and quantify resulting uncertainty to guide inference: 3.1. Parameterize the most appropriate statistical distribution describing the random fluctuation of
mortality over time, at least in resource-constrained, developing country settings;
3.2. Adopting the above distribution, predict mathematically the degree of uncertainty (as a CI or p-value) to be expected if the EM method is applied in different population sizes, time periods and under varying death rates;
3.3. Based on the above predictions, determine minimum requirements for population size and period (i.e. person-time) to be investigated via the EM method;

A New Method to Estimate Mortality in Crisis-Affected Populations: Validation and Feasibility Study
6
3.4. Incorporate imprecision in population estimates into the mortality rate estimates obtained through the EM method.
For clarity’s sake, the field validation and feasibility study is presented first, and the methods and results section of the mathematical simulation work are presented jointly thereafter. We conclude with an overall discussion of the method’s applicability and recommendations for further development.

A New Method to Estimate Mortality in Crisis-Affected Populations: Validation and Feasibility Study
7
3. Validation and Feasibility Study Methods 3.1. STUDY SITES The EM method was evaluated using a common protocol in four sites worldwide, including (i) District 1 of Kabul, Afghanistan, a chaotic urban community within a fragile state; (ii) Mae La camp for Karen refugees, on the Thai-Burma border; (iii) Chiradzulu District, Malawi, a rural, remote community with poor health status and a typical pre-transition epidemiological profile heavily impacted by the HIV epidemic; (iv) Lugufu and Mtabila refugee camps, Tanzania, housing persons forcibly displaced by armed conflict in the Great Lakes region. A description of each site follows. 3.1.1. District 1, Kabul, Afghanistan Work in Kabul was led in July 2008 by investigators from the London School of Hygiene and Tropical Medicine (LSHTM); the collaborating partner was the Afghanistan Ministry of Public Health. District (or nahia) 1 lies close to the centre of Kabul and is one of the poorest of the 18 districts of Kabul. Much of the District lies on one of the hills of Kabul so transport, water and electricity are more limited than elsewhere in Kabul. The population are ethnically diverse and there are reportedly quite high rates of migration in and out of the district. The population of District 1 was estimated by this study to be 76,476 in July 2008 (see Section 3.3.6 for population estimation method). There are a small number of public and private health centers in District 1. It is also served by a number of hospitals, the closest of which is Maiwand hospital. 3.1.2. Mae La Refugee Camp, Thailand Work in Mae La camp was led in July 2008 by the principal investigator from the United States Centers for Disease Control and Prevention (CDC) in collaboration with the non-governmental organization (NGO) Aide Médicale Internationale (AMI). Mae La camp is in Tak Province, northern Thailand and was established in 1984. The camp residents are persons displaced from Myanmar, and almost all are ethnic Karen. In June 2008, the population of Mae La camp was approximately 44,000. AMI coordinate medical services in the camp, and AMI provides inpatient and outpatient clinical services. Public health and community activities are conducted by AMI’s Home Visitors. Maternity care is provided by the Shoklo Medical Research Institute (SMRI) and tuberculosis treatment is provided by Médicines San Frontières (MSF). 3.1.3. Chiradzulu District, Malawi Work in Chiradzulu was led in August-September 2008 by the principal investigators from LSHTM in collaboration with MSF – France (MSF-France). The District Health Office (DHO) provided written approval and support for the EM validation study. Chiradzulu district is located in the Southern Region of Malawi and was selected because it provided a resource-poor rural setting in which to validate the EM method. The estimated population of Chiradzulu district in mid 2008 was 314,200. MSF-F have been providing health services in Chiradzulu district since 1997, including a very large HIV antiretroviral treatment program now serving more than five thousand patients. The district contains 10 government health centers, a district hospital, and a privately funded hospital. 3.1.4. Lugufu and Mtabila Refugee Camps, Western Tanzania Work in Lugufu and Mtabila camps in September-October 2008 was led by one of the principal investigators from LSHTM in collaboration with the United Nations High Commissioner for Refugees (UNHCR), with the support of the Tanzanian Red Cross Society (TRCS). Lugufu refugee camp and Mtabila refugee camps in Tanzania were selected as sites to test the EM method in situations of forced displacement. Lugufu and Mtabila camps are located in Kigoma district in the north west of Tanzania. Lugufu camp was established in 1997 and almost all of the camp residents are refugees from the Democratic Republic of Congo. Mtabila camp was established in 1994 and almost all of the camp residents are refugees from Burundi. The populations of Lugufu and Mtabila camp were estimated at 38,363 and 41,773 respectively at the time of the study. There is currently a repatriation process for returning camp residents to their counties of origin and so the camp populations are reducing in size. UNHCR have a long history of coordinating protection and support services in

A New Method to Estimate Mortality in Crisis-Affected Populations: Validation and Feasibility Study
8
Lugufu and Kigoma camps. TRCS has been responsible for all medical and public health activities in the camps since the camps were established. 3.2. SAMPLING DESIGN 3.2.1. Recall Period In each site, the main recall period of interest was set at one month (30 days). This was selected as it would typically be of interest to agencies potentially using the EM method in humanitarian crisis situations. However, in order to minimize underreporting due to recall bias, search criteria were expanded to all deaths occurring over the previous two months (60 days) within the sampled communities. Results will be shown for both 30 day and 60 day recall periods, as the latter time points also provides interesting information about the method’s performance and about mortality in the populations investigated (see Discussion). 3.2.2. Population Investigated We surveyed the populations of District 1, Kabul, Mae La camp on the Thai-Burma border, and Lugufu and Mtabila camps in Tanzania exhaustively (Lugufu and Mtabila are considered as one site for the purposes of this study). Assuming a minimum CMR of 0.2 deaths per 10,000 person-days within each of the above sites, we calculated that the method’s sensitivity (i.e. proportion of all deaths that are detected by the method, namely our main outcome of interest for validation purposes) would be estimated among ≥26 deaths in each site. Assuming that sensitivity would have been >80%, this number of deaths would have provided a precision within ±20%. It was considered operationally unrealistic and statistically inefficient to visit all villages comprising Chiradzulu district (approximately 700). Therefore, in this rural setting we adopted a spatial sampling approach, consisting of a modified Centric Systematic Area Sample (CSAS). We overlaid a 5 Km x 5 Km grid on a map of the district: quadrants falling mostly within the district were retained, whilst those falling mostly outside were excluded, leaving 32 quadrants for spatial sampling. The three villages closest to the geographic centre of each quadrant were then selected with the aid of high-resolution maps provided by the Malawi National Statistical Office and used for a recent (June 2008) census exercise, and an updated administrative list of villages provided by the District Commissioner’s office. Thus, 96 villages (32 quadrants x 3 villages) were sampled throughout the district. Within each sampled village the search for recent deaths was exhaustive. Assuming an average population per village of 500 (350,000 people / 700 villages), nearly 50,000 people would have been sampled, yielding a minimum precision comparable to that of the other sites. 3.3. IMPLEMENTATION OF THE EM METHOD 3.3.1. Preparatory Activities Ahead of data collection, we visited with the administrative authorities in each site and sought their approval for the study. Within each site, the community was divided into “sectors”, corresponding to pre-existing administrative areas: guzar in Kabul (n=24), each presided over by and known by the name of a male wakil, or community leader); sections in Mae La camp (n=22); villages in Chiradzulu District (n=96); and zones in Lugufu and Mtabila camp in Tanzania (n=?). All data collection instruments were translated into local languages (Dari in Kabul, Karen in Mae La, Chichewa in Chiradzulu, and Ki-Swahili in Tanzania). The translation process included independent back-translation and extensive group review by the study team to address any discrepancies. English versions used in Chiradzulu are provided in Section 8, the Report Annexes; elsewhere, minor adaptations were made to questions not pertaining to the fundamentals of the method (questionnaires for each site are available from the investigators upon request).

A New Method to Estimate Mortality in Crisis-Affected Populations: Validation and Feasibility Study
9
3.3.2. Composition and Training of Study Team In each site we hired and trained local study team members, all highly literate and fluent in English and the local languages. In Kabul six data collectors were recruited (three women and three men, due to cultural requirements of potentially requiring the data collectors to be the same sex as the survey respondents) to form three interview teams. In Mae La only one data collector was employed. In Malawi four data collectors (two women and two men) were employed, as well as one clinical officer who both supervised data collection and conducted verbal autopsy interviews (see Section 3.3.5). In Lugufu camp, three data collectors (two men and one woman) were employed. In Mtabila camp, another three data collectors (two men and one woman) were employed. All the data collectors worked with TRCS and were experienced in providing health care in the camps. Data collectors were trained on: (i) background and justification for the study; (ii) the mortality questionnaire; (iii) the exhaustive search process, including use of primary and secondary community informants; (iv) recording information on the household register; (v) standard household visit procedures; (vi) use of the visual calendar aid; (vi) systematic probing; (vii) ethical issues and consent administration; and (viii) identification and removal of multiple records. The training involved informal presentations/discussions by investigators and role-plays. Details on the length of training are provided in Section 4.5.1. In Mae La, all interviews were overseen by a study investigator. In the other study sites, investigators supervised all interviews during the first two days of data collection, after which supervision was relaxed, though investigators accompanied the team on all sector visits and continued to supervise a portion of the interviews, and generally coordinated data collection. 3.3.3. Focus Group Discussions (FGDs) One FGD was conducted in each study site before data collection. The objectives of the FGD were to: (i) identify a set of primary and a set of secondary key informants on which the exhaustive search for recent deaths would mainly rely; (ii) explore the sharing of information about recent deaths in the community; (iii) explore the degree to which different kinds of deaths might be reported or hidden; (iv) explore local concepts of the main causes of mortality; (v) identify potential alternative sources of mortality information that would provide additional lists for capture-recapture analysis; and (vi) identify locally salient events to help develop a calendar to aid the exhaustive search. FGD participants were selected based upon their strong knowledge of the community in which the study took place. Local study team members, collaborators and administrative authorities were asked to help identify participants (Table 1). In Kabul, for cultural reasons separate FGDs were held simultaneously for men and women. In Mae La camp, more participants attended the FGD than were invited. In Chiradzulu, the FGD was held in a village, to avoid costs and time lost for transport of participants: although persons from two neighboring villages also attended, it was considered unfeasible to seek representation from the entire District, and the village was instead chosen on the recommendation of data collectors because it had proved cooperative with past surveys. In Tanzania, separate FGDs were held in Lugufu and Mtabila camps. Both FGDs were held in meeting halls in the main health centers of the two camps. The FGDs were entirely held in the local languages, and moderated by local study team members who received one to two days of training on (i) the background and aims of the overall study; (ii) the key aims and questions of the FGD; (iii) techniques for facilitating effective FGDs; and (iv) consent procedures. In Mae La, due to the absence of the appointed moderator, the investigator led the discussion through a translator. A topic guide (Annex 8.1), including possible prompts, was used to guide the FGD.

A New Method to Estimate Mortality in Crisis-Affected Populations: Validation and Feasibility Study
10
Table 1. Details of FGD Participants, by Study Site
District 1, Kabul Mae La Camp Chiradzulu District Lugufu and Mtabila Camps
Men’s FGD (eight participants): five wakil-e-guzar (sector leaders), one mullah, two education officers Women’s FGD (four participants): four school teachers
33 participants: Vice Chairman of the Camp Committee, the Camp Committee Health Leader, Mae La Hospital Director, Section Leaders, Religious Leaders, Section Health Workers, AMI Home Visitors, SMRU Home Visitors
Nine participants: village headmen (two males), headman assistant (female), graveyard chairman (male), church elder (one male, one female), Muslim representative (male), teacher (male), member of village health committee (female)
Lugufu camp: 14 participants: Camp chairman (male), seven zone leaders (six male, one female), five village leaders (four male, one female), one radio reporter. Mtabila camp: 22 participants: Camp chairman (male), eight zone leaders (six male, two female), 10 street leaders (six male, four female), two pastors (male), one community security officer (male), one health information team member (male, also one of above pastors).
During the FGD, data collectors took notes on a structured document (available from the investigators upon request). These notes were consolidated, translated and analyzed by the entire study team during a group debriefing session held immediately after the FGD, to inform the quantitative data collection, particularly the selection of key informants. The FGDs were also recorded using digital recorders, transcribed verbatim and translated (in Mae La, staff took notes on the discussion that were then translated into English by an independent translator). The translators were briefed on the importance of accuracy in the translation and transcription. The English versions were reviewed upon completion by the study authors and clarifications sought for any unclear passages. After data collection, more in-depth analysis of the FGDs was completed using NVivo (version 7) software. An inductive approach was applied which suited the exploratory nature of the FGDs [6]. The transcripts were reviewed and themes and sub-themes were developed to give coherent categories for the data, based upon the aims of the FGDs [7, 8]. The data were then coded based upon the themes and sub-themes. An iterative process was applied, with the themes and sub-themes revisited, altered and additional themes/sub-themes added during the coding process. The coding was then reviewed and adjusted accordingly. This allowed complete familiarity with the data in its entirety and with individual interviews and helped to ensure a reliable, systematic and representative analysis of the data [8-12]. Observations and interpretations were drawn from a selection of observed themes, including similarities and differences between the study sites. Only abridged findings of the FGDs are presented in this report. A more detailed analysis will be presented in a separate paper. 3.3.4. Exhaustive Search for Recent Deaths In each study site, data collection proceeded sector by sector. Sector leaders were informed about the study team’s upcoming visit by telephone in Kabul, letter in Chiradzulu, and in person in Thailand and Tanzania. Primary informants and secondary informants were identified (Table 8; see Results for Details and Justification of the Choice of Informants), and efforts were made to revisit the sector as often as necessary to contact any informants found absent during the first visit. After providing a brief introduction to the study and answering any questions, both sets of informants were asked to recall all deaths occurring within the sector during the previous two months, and refer the study team to the households in which those deaths had occurred. We did not actively seek information from any other respondents; however, key informants’ recall process often involved consulting family members or assistants: any referral from these was also accepted, as was casual information provided by eavesdroppers or passers-by. Any reported death was listed on a register (Annex 8.2). Each new reported death was registered, even if already referred by another informant. Households on the register were then approached according to a template of household visit procedures (Annex 8.3). After confirming that a death had indeed taken place and identifying one or more close next of kin of the decedent aged 18 years or older, data collectors provided information about the study, answered questions, and asked for verbal

A New Method to Estimate Mortality in Crisis-Affected Populations: Validation and Feasibility Study
11
consent (Annex 8.4), leaving a participant information sheet in the local language (Annex 8.4) with the respondents. In Mae La, written consent was sought. Differences in consent procedures reflected local advice and literacy levels. Consenting respondents were then interviewed according to a short structured questionnaire (Annex 8.5), designed mainly to establish the basic facts about the decedent: age (under 5 years, older), sex, date and place of death, name and name of father (or of the household in Chiradzulu and camps in Tanzania), the latter variables were included to provide more unique identifiers for the gold standard capture-recapture analysis (Section 3.4.2). Several apparently redundant questions were used to establish whether the person was breathing at birth, in case of death of a neonate (stillbirths are not counted as deaths in standard mortality studies); whether the person was indeed a member of the household (defined as people sleeping and/or eating together) or of a household within the surveyed population; when the death occurred, for which a visual calendar (Annex 8.6) was used: the calendar was meant to help both interviewers and respondents place deaths unequivocally within or outside the recall period of interest, and within approximately one week of the true date of death; and to estimate weather the person was aged under or over 5 years to assist with classification for the age-specific mortality (under 5 years, older). At the end of the interview, respondents were asked to recall other deaths in their household or in their community within a two month period: any such referrals were entered onto the register. The community informant or a local guide then took the interview team to the household and interview was conducted as above. If there was no referral from the household respondent, the interview team went to the next household on the register list from the primary and secondary informants. Once no more deaths could be identified, we considered the sector as exhausted and moved on to the next sector. In cases where key informants referred us to households from other sectors, these would be visited when the study team canvassed that sector. Households were not visited if they were outside of the population of interest, for example a household outside of District 1 in Kabul or a village not sampled in Chiradzulu district. 3.3.5. Verbal Autopsy Questionnaires The verbal autopsy component of the study was only performed in Chiradzulu. The most recent, standardized WHO verbal autopsy questionnaires were adopted [13, 14] (http://www.who.int/whosis/mort/verbalautopsystandards/en/index.html): these consist of three different questionnaires according to the age categories of the decedent (less than four weeks; four weeks to 14 years; older than 14 years) which are required for the cause of death data (note that these categories are separate to the age classification for mortality estimation of under 5 years, older); and contain several sub-modules (e.g., on neonatal conditions, injuries, and maternal mortality) depending on the signs and symptoms reported by the respondent. The questionnaires were translated into Chichewa by a clinical officer, and translations were reviewed by another clinician as well as other members of the study team. During the exhaustive search process, data collectors were instructed to invite the next-of-kin of any decedent who had passed away in the last month (based on the EM questionnaire responses) to undertake a verbal autopsy questionnaire.1 All verbal autopsies were conducted by a clinical officer who systematically administered the list of questions, with conditional skips, in the order specified on the questionnaire. Occasionally, a different respondent was chosen if it became clear that (s)he could provide more reliable information on the signs, symptoms and medical history of the deceased (e.g., an effort was made to systematically interview the mother of a dead child, even if for the mortality questionnaire a different member of the household had been interviewed). A study investigator supervised the first few verbal autopsy questionnaires. Analysis followed WHO guidelines. The clinical officer and a medical doctor working for MSF-France independently reviewed each completed questionnaire and, where available, additional medical records for the patients, and filled out a WHO standard ‘International form of medical certificate of death’ for each decedent. Disagreements on the causes of death were resolved by a third, medically qualified independent reviewer. Investigators then coded the cause of each death based on the final certificate, using the International Classification of Diseases, version 10 (ICD-10), and based on WHO guidelines. For brevity’s sake, only findings on the feasibility of verbal autopsies will be presented in this report.
1 Verbal autopsy data was not collected for a 2 month recall period since this component of the study is to assess feasibility not validity, and 1 month was the defined recall period of interest for all measures.

A New Method to Estimate Mortality in Crisis-Affected Populations: Validation and Feasibility Study
12
3.3.6. Data Collection for Population Estimation In Mae La and the Tanzanian refugee camps, we did not perform any population estimation, but rather used existing data, including the number of children under 5 years, from well-established prospective demographic surveillance systems managed by AMI and the UNHCR, respectively. As data were updated on a weekly basis, we used the average population over the weeks covered by the study as a best estimate of the mid-period population. Elsewhere, no recent, reliable population figures were available (a pre-census exercise was carried out in Afghanistan in 2005, but data by nahia or city district were not considered reliable; a national census was performed in Malawi in June 2008 but data will only be released in 2009). Thus, we performed our own population estimation, as follows. District 1, Kabul The district was composed of (i) a dense, low-lying area mainly featuring narrow streets and multi-storey buildings each with one main door facing the street, and each occupied by several households; and (ii) a more sparsely populated hillside area featuring smaller, well demarcated structures (practically all residential) built on a steep incline. To reduce statistical heterogeneity and thereby improve precision, we divided the District into a low-lying and a hill stratum, within which we estimated population using different methods:
In the low-lying stratum, we collected population data in a selection of quadrants and then multiplied the average population density by the total number of quadrants in the area. We created a spatial sampling frame by overlaying a grid of approximately 35 m x 35 m resolution onto a recent map produced by the Aga Khan Cultural Foundation and based on satellite imagery. The map indicated areas containing only non-residential structures (this information appeared very accurate after repeat site visits): we excluded from the sampling frame all quadrants falling within these areas, within streets and/or mostly outside of the district boundaries. This left 894 quadrants, from which 30 were selected using simple random sampling (without replacement). After locating the four corners of each sampled quadrant by using zoomed-in maps, data collectors visited each residential building door falling within the quadrant, and, following a short oral consent procedure, asked a consenting respondent aged 18 years or above about the number of households residing within, and the number of people of all ages and children under 5 years who had slept within each household on the previous night.
In the hill stratum, we counted structures and estimated the number of people per structure. After dividing the stratum into approximately equal sized and geographically distinct sub-areas, two or three independent tallies of all residential structures within each sub-area were performed from vantage viewpoints, and averaged. A grid was then overlaid on the stratum as above, forming 467 quadrants, out of which 20 were selected randomly for population data collection. The residential structure approximately closest the centre of each sampled quadrant was visited, and the number of people of all ages and under 5 years who had spent the previous night within it were counted as above, yielding an average number of people per residential structure.
Finally, data from both strata were analyzed through bootstrapping methods (Section 3.3.7) to give a total estimate for District 1. Chiradzulu District We estimated the population of the 96 sampled villages to provide the denominator for the mortality rate estimation (estimating the population of all villages in the District was not necessary as the sample was assumed to be representative, allowing for District-wide projections) as follows: Within each village, we asked the village headman to identify two counters (one female, one
male); we provided them with a tally sheet (Annex 8.8), and instructed them to walk through the entire village, counting all residential structures (roofs under which people spend the night). We then averaged the two counts. Upon presenting their completed forms, the

A New Method to Estimate Mortality in Crisis-Affected Populations: Validation and Feasibility Study
13
counters were paid a nominal honorarium proportional to the size of the village. In four villages that were geographically close to one another, data collectors were accused by some community members of being bloodsuckers, and structure counts, though complete, were not handed over. In these villages, we imputed the number of structures through linear prediction based on an ordinary least squares (OLS) model applied to the data collected in the other 92 villages, in which structure count was treated as a function of number of households (see Section 3.3.7).
Within one of the three villages in each quadrant, selected at random, we used standard Expanded Program of Immunization (EPI) sampling [15] to select two structures, the first being one of the structures along an imaginary line drawn from the centre to the edge of the village in a direction determined by spinning a pen, and the second being two structures removed from the first based on a rule of proximity: this yielded a spatial cluster sample of 64 structures (32 clusters x 2 structures per cluster). Within each structure, we inquired about occupancy during the previous night, as above. The estimated mean number of people and children under 5 years per structure resulting from this sample was weighted for unequal sampling probabilities within each quadrant (see Section 3.3.7).
Finally, we multiplied the mean number of people (or children under 5 years) per structure by the total number of structures in the 96 villages to obtain the estimated population of the 96 villages, with 95%CIs accounting for variance in the number of people per structure provided through bootstrapping (see Section 3.3.7). Population estimation was done at the same time as the mortality data collection for efficiency reasons (it would have been impractical to revisit villages). 3.3.7. Estimation of Population Size and Mortality Rates We excluded from the analysis any deaths that met one or more of the following criteria: (i) stillbirth (the baby died on the same day of birth and was not breathing at birth); (ii) reported date of death more than 60 days before the EM survey date; (iii) resident outside of the community (or sampled villages in Chiradzulu) during most or all of the month before death, as determined through answers to the mortality questionnaire and notes taken by data collectors. We expressed CMR (and U5MR) as deaths (among children under 5 years) per 10,000 person-days (under 5 years). We estimated mortality rates as ascertained by the EM method alone, by all sources combined, and by all source plus estimates of deaths not captured by any source obtained through capture-recapture analysis (see Section 3.4.3). We computed point estimates and 95%CIs through bootstrapping programs written in R language (Annex 8.10) and specific to each field site. Bootstrapping is an approach that computes best estimates and CIs for a measure of interest by drawing a large number of samples (with replacement) from distributions of the parameters that make up that measure. In our case, bootstrapping programs were designed to simultaneously account for uncertainty in the numerator (number of ascertained deaths plus estimated number of deaths not captured: see Section 3.4) and denominator (population estimate). Because samples were not self-weighting in both Kabul (population estimate) and Chiradzulu (EM survey and population estimate), bootstrapping was used to calculate the point estimate as well as the CIs in these two sites. Overall for each site, 1,000 iterations of the survey were simulated, and the median, 2.5th and 97.5th percentiles of the iteration distribution were then adopted as point estimate and 95%CI respectively. Site-specific details on the remainder of the estimation process are provided below. We note here that 95%CIs do not reflect random variation in the numerator (deaths) due to stochastic effects occurring in the time dimension (Section 2.3.2). A separate calculator for estimating mortality rates based on the EM method was also developed for more routine application (see Section 5.3). District 1, Kabul As previously stated (Section 3.3.6), different sampling designs were used in the two strata of District 1 (low-lying and hill) for population estimation. Due to the low number of quadrants and structures sampled, we considered it imprudent to impose parametric assumptions on the population estimation. Instead, we used the empirical (i.e. observed) distributions of (i) number of people (children under 5) per quadrant (low-lying stratum) and (ii) number of people (children under 5) per sampled structure (hill stratum).
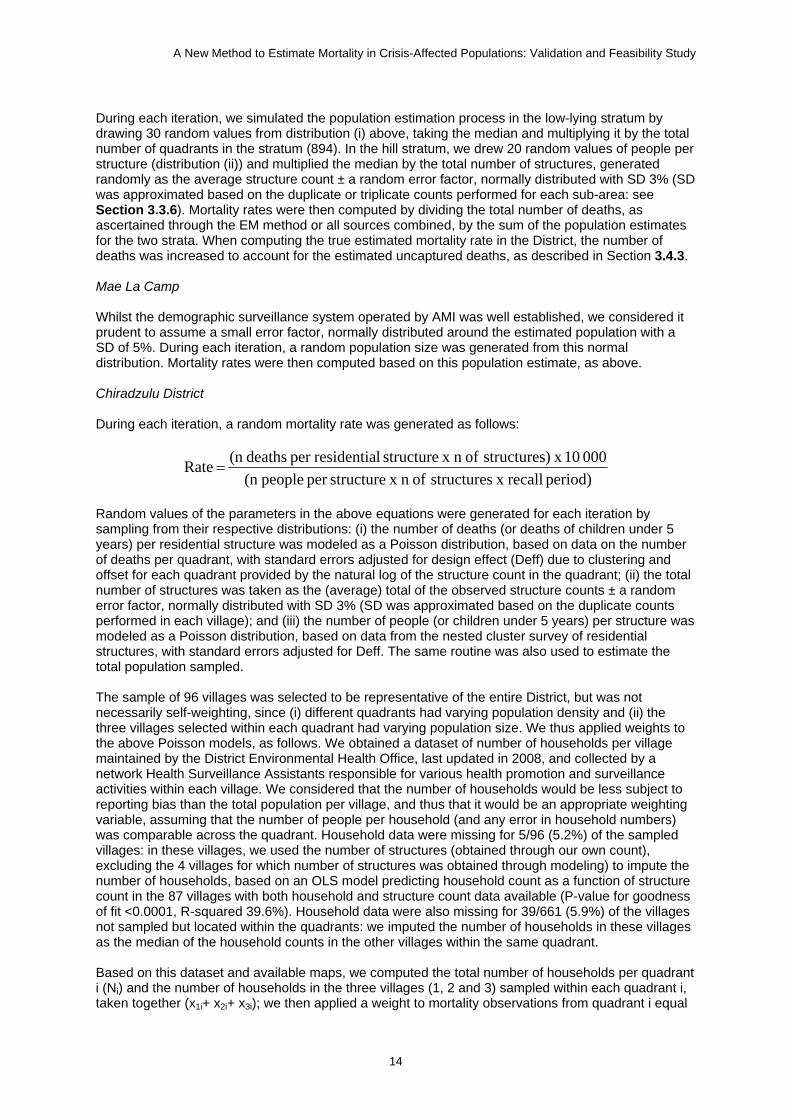
A New Method to Estimate Mortality in Crisis-Affected Populations: Validation and Feasibility Study
14
During each iteration, we simulated the population estimation process in the low-lying stratum by drawing 30 random values from distribution (i) above, taking the median and multiplying it by the total number of quadrants in the stratum (894). In the hill stratum, we drew 20 random values of people per structure (distribution (ii)) and multiplied the median by the total number of structures, generated randomly as the average structure count ± a random error factor, normally distributed with SD 3% (SD was approximated based on the duplicate or triplicate counts performed for each sub-area: see Section 3.3.6). Mortality rates were then computed by dividing the total number of deaths, as ascertained through the EM method or all sources combined, by the sum of the population estimates for the two strata. When computing the true estimated mortality rate in the District, the number of deaths was increased to account for the estimated uncaptured deaths, as described in Section 3.4.3. Mae La Camp Whilst the demographic surveillance system operated by AMI was well established, we considered it prudent to assume a small error factor, normally distributed around the estimated population with a SD of 5%. During each iteration, a random population size was generated from this normal distribution. Mortality rates were then computed based on this population estimate, as above. Chiradzulu District During each iteration, a random mortality rate was generated as follows:
period) recall x structures ofn x structureper people(n
000 10 x )structures ofn x structure lresidentiaper deaths(n Rate
Random values of the parameters in the above equations were generated for each iteration by sampling from their respective distributions: (i) the number of deaths (or deaths of children under 5 years) per residential structure was modeled as a Poisson distribution, based on data on the number of deaths per quadrant, with standard errors adjusted for design effect (Deff) due to clustering and offset for each quadrant provided by the natural log of the structure count in the quadrant; (ii) the total number of structures was taken as the (average) total of the observed structure counts ± a random error factor, normally distributed with SD 3% (SD was approximated based on the duplicate counts performed in each village); and (iii) the number of people (or children under 5 years) per structure was modeled as a Poisson distribution, based on data from the nested cluster survey of residential structures, with standard errors adjusted for Deff. The same routine was also used to estimate the total population sampled. The sample of 96 villages was selected to be representative of the entire District, but was not necessarily self-weighting, since (i) different quadrants had varying population density and (ii) the three villages selected within each quadrant had varying population size. We thus applied weights to the above Poisson models, as follows. We obtained a dataset of number of households per village maintained by the District Environmental Health Office, last updated in 2008, and collected by a network Health Surveillance Assistants responsible for various health promotion and surveillance activities within each village. We considered that the number of households would be less subject to reporting bias than the total population per village, and thus that it would be an appropriate weighting variable, assuming that the number of people per household (and any error in household numbers) was comparable across the quadrant. Household data were missing for 5/96 (5.2%) of the sampled villages: in these villages, we used the number of structures (obtained through our own count), excluding the 4 villages for which number of structures was obtained through modeling) to impute the number of households, based on an OLS model predicting household count as a function of structure count in the 87 villages with both household and structure count data available (P-value for goodness of fit <0.0001, R-squared 39.6%). Household data were also missing for 39/661 (5.9%) of the villages not sampled but located within the quadrants: we imputed the number of households in these villages as the median of the household counts in the other villages within the same quadrant. Based on this dataset and available maps, we computed the total number of households per quadrant i (Ni) and the number of households in the three villages (1, 2 and 3) sampled within each quadrant i, taken together (x1i+ x2i+ x3i); we then applied a weight to mortality observations from quadrant i equal

A New Method to Estimate Mortality in Crisis-Affected Populations: Validation and Feasibility Study
15
to Ni/(x1i+ x2i+ x3i), namely the amount of quadrant person-time that each cluster of villages was representative of: this attributed a greater weight to populous quadrants, and vice versa. When analyzing the 32 cluster x 2 structures nested survey to estimate structure size, we applied a weight inversely proportional to each structure’s probability of selection, namely Vi(sji/2), where V is the total number of villages in quadrant i and s is the number of structures in village j sampled within quadrant i. Tanzania During each iteration, we generated a random population size for both Lugufu and Mtabila camps, as done for Mae La (see above), and divided the total number of deaths by the sum of the two random values to compute mortality rates. 3.4. VALIDATION 3.4.1. Choice of Gold Standard Method We used capture-recapture analysis as the gold standard measurement method to establish the sensitivity of the EM method, i.e. the proportion of the total number of deaths that are detected by the new method. This technique, also known as multiple lists analysis or multiple system estimation, was developed by ecologists originally, but since the 1970s has been applied extensively to various epidemiological problems, as the choice method to estimate the completeness of reporting for a given disease or health event, and thereby derive the true number of disease cases or events [16, 17]. Examples of capture-recapture use in epidemiology include research on birth defects, cancer, drug use, infectious disease, injuries, the size of homeless populations, validation of census data, and mortality (including rigorous studies recently commissioned by international bodies in Guatemala, Kosovo and Timor Leste [18-20]). Epidemiological applications of capture-recapture methods rely on establishing several lists of events being studied (in our case, recent deaths) from different sources. While it is recognized that each list is likely to be incomplete, the method exploits information about the overlap (or lack thereof) of different lists, and, through this, estimates the proportion and absolute number of deaths that do not appear on any lists, which is then added to the “known” or ascertained deaths (i.e. those that are found on one or more lists) to provide the gold standard total. When using capture-recapture analysis to evaluate the sensitivity of a data source, it is common to include the data source as one of the lists analyzed [16, 17]. Capture-recapture analysis is subject to two important assumptions: (i) that the probability of appearing on one list does not affect the probability of appearing on the other(s); and (ii) that the probability of a dead person appearing on any given list is equal. In practice these assumptions are almost always violated. To adjust for this, capture-recapture analysis employs hierarchical log-linear statistical regression to model the number of deaths. Dependencies among lists (violation of assumption (i) above) are modeled as statistical interactions among two lists (e.g., list B with list D) as well as among groups of lists (e.g., lists A, B and C). Different probability of capture (violation of assumption [ii]) is modeled by including heterogeneity terms or by stratifying the analysis according to age, gender, or any other variable that is suspected to be associated with a higher or lower probability of appearing on lists (this generally becomes obvious through descriptive analysis of the lists, e.g., if the age or gender breakdown is significantly different across different lists). Stratification removes most of this heterogeneity, and results for the different strata can then be added together to give the total. However, stratification can only be applied if a sufficient number of deaths are recorded. If there are many lists, one can include in the model various combinations of interactions between lists, and thus many different models are possible: the choice of the best model (and thus of the best estimate of total deaths) is made using standard goodness of fit criteria, or a selection of models are averaged using Bayesian methods (see Section 3.4.3). In this study, we performed capture-recapture analysis on three different lists of deaths collected within each field site, one of those being the list compiled from implementation of the EM method.

A New Method to Estimate Mortality in Crisis-Affected Populations: Validation and Feasibility Study
16
3.4.2. Collection of Additional Lists of Deaths Within each site, in addition to the exhaustive search, we collected two additional lists of recent deaths from two sources separate from the key informants. Table 2 details the different lists of deaths used for capture-recapture. We used the calendar aid to help with recall of dates, and collected basic details for each death (date of death, sex, approximate age, place of residence including house number in Mae La, name of the deceased and name of his/her household in Chiradzulu or of his/her father elsewhere) on a special register (Annex 8.7). Table 2. Details of Lists Used for Capture-Recapture Analysis, by Site
List District 1, Kabul Mae La Camp Chiradzulu District Tanzania Camps
1 Exhaustive search led by key informants (wakils, mullahs)
Exhaustive search led by key informants (section leaders, Karen Women’s Organization members)
Exhaustive search led by key informants (village headmen, fumukazi)
Exhaustive search led by key informants (community leaders)
2 Convenience stores (small one room shops selling food, drinks and basic household items) and bakeries (community ovens where households bring their flour to be baked; separate female and male bakeries exist)
All Buddhist, Christian and Muslim religious leaders, in charge of funeral rites
Chairmen of village graveyard committees (azukuru), in charge of organizing burials
Deaths recorded in the camp register compiled by the camp management agency (World Vision in Lugufu camp, International Rescue Committee [IRC] in Mtabila camp)
3 Inpatient departments of all hospitals within the catchment area of District 1, including Maiwand Hospital, Ibna Sina Hospital, Indira Gandhi Hospital, Rab-e-Balkhi Maternity Hospital, the French Hospital, and the Tuberculosis Hospital
AMI mortality surveillance system, including data from the Mae La hospital inpatient department; Shoklo Malaria Research Unit [SMRU] maternal clinic
Stabilization and maternity wards of all public health centers in Chiradzulu District (n=10); inpatient departments of Chiradzulu District Hospital (including morgue) and St. Joseph’s Nguludi Hospital; Health Surveillance Assistants deputized to each of the 96 villages
Mortality surveillance data collected by TRCS in Lugufu and Mtabila camp
Sources for First Additional List We selected the sources for the first additional list based on the FGD conducted in each site. The source was selected based on criteria of feasibility (i.e. how easy it would be to contact informants), sensitivity as judged by FGD participants, and independence from the key informants used to collect data for the exhaustive search (i.e. we sought to avoid sources that would themselves obtain their knowledge from the EM method key informants, or vice versa). Data collection within each sector occurred on the same day or the following two days as the exhaustive search to ensure comparability of the recall periods. However, it was done after or in parallel to the exhaustive search, to minimize investigator bias. We provided the same information to these sources as to key informants for the exhaustive search, and used the same search criteria (deaths in the last two months within the sector). The following site-specific procedures were followed: In Kabul, after seeking permission from the wakil, we approached each open convenience
store and/or bakery within each sector, identified by systematically walking through the entire sector. In each store we approached the attendant(s) only, though in practice bystanders were also involved in the conversation.
In Mae La, we met with religious leaders, including Buddhists, Christians and Muslims, and asked them to draw up a list of persons whose funeral ceremony they had officiated, which we collected on a separate day; we verified any unclear information on each religious leader’s list through supplementary household visits.

A New Method to Estimate Mortality in Crisis-Affected Populations: Validation and Feasibility Study
17
In Chiradzulu District, we asked the village headman to refer us to the chairman of the graveyard committee (always a male), though whenever possible we interviewed him separately to minimize any possible reporting bias caused by the headman’s presence. In the committee chairman’s absence, we interviewed his deputy.
In Lugufu and Mtabila camps, we consulted the camp register of deaths compiled by the camp management agency (World Vision in Lugufu camp, International Rescue Committee [IRC] in Mtabila camp).
Sources for Second Additional List The second source was selected a priori. It consisted of existing surveillance systems in Mae La and Tanzania, and hospital inpatient records in Kabul (Table 2). In Chiradzulu, hospitals and health centers yielded a low number of deaths, and we decided to supplement the list by contacting Health Surveillance Assistants (HSAs; also known as community health workers [CHWs]) seconded to each village: we asked HSAs to spend a day in their village and, relying on their usual information network, report deaths since the June-July 2008 census on a standardized form, including identifier variables as above, whether the person was resident in the village, and who provided the information on the death; we excluded deaths reported by the village headman, fumukazi and graveyard chairman so as maximize the independence of the list from the others. HSAs received a nominal payment for this work. Sources for the second list were accessed at the very end of fieldwork; however, the recall period was extended to the first day of data collection in the exhaustive search, to capture comparable periods. Deaths reported as occurring after the day on which the sector was visited were excluded from analysis. At the end of data collection, we thus had three lists of deaths covering the period and population sampled within each site: one list from the key informants, one from an additional source selected through the FGD, and one from curative and/or health surveillance sources. 3.4.3. Capture-Recapture Analysis After routine data cleaning based on range and consistency checks, we excluded deaths on any lists based on the same criteria as in Section 3.3.7 (also see Section 6.4 for potential limitations). When a death was reported on more than one list but dates of death were discrepant, we adopted the date of death from list 3 (medical sources) if available, and the date from list 1 (EM survey) otherwise. We matched deaths on different lists manually. Due to the small number of deaths in the three lists and the range of uniquely identifying variables, this process was straightforward and no cases of doubtful identity were encountered. Based on this we determined the number of analyzable deaths that fell within each xijk category (Figure 2), where i, j and k are dummy variables denoting the presence (1) or absence (0) of a death within lists 1, 2 and 3 respectively (thus, x110 in Mae La camp is the number of deaths captured by the EM method and religious leaders but not the AMI surveillance system; x000 in any site is the unknown number of deaths not captured by any source). For the sake of clarity these are represented as a Venn diagram.

A New Method to Estimate Mortality in Crisis-Affected Populations: Validation and Feasibility Study
18
Figure 2. Venn Diagram Representing the Overlap Among the Three Different Lists
Log-Linear Modeling We fit log-linear Poisson models to the contingency table formed by each xijk category, as described by Fienberg et al.[21] All eight possible models were fit, including without any interactions, with one interaction among two lists (list 1 x list 2, list 1 x list 3, list 2 x list 3), two interactions (list 1 x list 2 + list 1 x list 3; list 1 x list 2 + list 2 x list 3; list 1 x list 3 + list 2 x list 3) and three interactions (list 1 x list 2 x list 3, known as the saturated model). Note that a fundamental (and unverifiable) assumption of three-list capture-recapture analysis is that there is no three-way interaction (i.e. list 1 x list 2 x list 3). Each model can be used to predict m000, i.e. the estimated x000, as follows:
011101110
001010100111000 mmm
mmmmm
For each model, we computed goodness of fit statistics including the Chi-square p-value based on the residual model deviance (i.e. how well the model fits, compared to the saturated or “full” model), the Bayesian Information Criterion (BIC; low values denote better fit), and the Pearson-adjusted Chi-square (=Chi-square/degrees of freedom; useful to privilege parsimonious models, i.e. with fewer co-variates). We also computed the point estimate of m000 for each model, and its 95%CIs as the 2.5th and 97.5th percentile of the likelihood profile. Instead of selecting one of the models as the most likely, we used Bayesian Model Averaging (BMA), as recommended for capture-recapture problems [21], and as reviewed by Hoeting et al [22]. We first excluded any of the eight models that yielded implausible estimates of m000 (>four times the total number of ascertained deaths), or that displayed probable overfitting (P-value >0.60; Ball et al. [20] use a 0.30 cutoff); models that fit known data exceedingly well may in fact predict unknown data points very poorly. In practice, models with severe overfitting often also did not converge to a solution. Among remaining models, we fit Bayesian log-linear models with uninformative priors, and computed the posterior probability of each model (i.e. how likely it is that the model reflects the truth; note that posterior probabilities among competing models sum to one). We then computed m000 (either point
estimates or CIs) as
ki
iiimm
1,000000 Pr , where k is the total number of models averaged over, i is
one of these models and Pr is the posterior probability of that model.
x111 x110
x100
x101 x001
x010
x011
List 1 (EM survey)
List 3
List 2

A New Method to Estimate Mortality in Crisis-Affected Populations: Validation and Feasibility Study
19
Model fitting, selection and averaging were done using a programming code written in R (Annex 8.12). To minimize the possibility of mistakes due to faulty programming, results were compared with a freely available Stata code written by Matthias an der Heiden (http://ideas.repec.org/c/boc/bocode/s456859.html), which yielded the same point estimates and only slightly wider 95%CIs: results from this Stata program are not reported for brevity’s sake. Because of the low number of deaths in the lists, we were unable to stratify the analysis to reduce heterogeneity. Wherever possible, we estimated the number of uncaptured deaths among children under 5 years, as above: however, this was not feasible in many instances due to the very low number of deaths detected. Alternative Capture-Recapture Analysis Approaches As an alternative to the log-linear approach, we also used the method of Marks, Seltzer and Krotki [23], which estimates m000 by combining information from pairs of lists, as follows:
011101110
001010001100010100000 xxx
xxxxxxm
This approach is less satisfactory as it does not account well for list interactions, but may be more robust when log-linear models are hindered by the low number of observations in one or more of the lists. We also applied the simple method of comparing pairs of lists, whereby m00=(x10x01/x11) (note that estimates from this method almost always violate capture-recapture assumptions). Results from these alternative approaches are reported to compare with and corroborate choices of the optimal log-linear model, but are not used for estimating the EM method’s sensitivity. Sensitivity of the EM Method and Other Sources The estimated total number of deaths D occurring within the recall period and community surveyed was calculated as the total number of ascertained deaths (i.e. captured by any source) plus m000 as estimated by BMA. The sensitivity of the EM method or of any other source is thus the total number of deaths captured by the method/source, divided by D. Adjustment of Mortality Rates to Account for Uncaptured Deaths The approach to incorporate capture-recapture estimates of undetected deaths into mortality rate estimates was the same for all sites. The estimated number of undetected deaths was based on the selected log-linear model, and its probability distribution was provided by the profile log-likelihood of the model. During each bootstrapping iteration, a random value was sampled from this distribution, and added to the total ascertained deaths to provide the estimated true number of deaths, which was then divided by the population estimate and recall period, as described in Section 3.3.7. 3.4.4. Corollary Qualitative Data Collection An informal FGD, with the data collectors themselves as participants, took place after the quantitative data collection in Kabul, Chiradzulu District and Tanzania. In Mae La, informal discussions were held with key members of the first FGD. The aims of this second FGD were to explore: (i) potential explanations for discrepancies between the EM method and alternative sources on deaths; (ii) observed patterns of chain referral during the data collection; (iii) ethical and confidentiality implications, and burden to respondents and data collectors, of the EM method. No formal analysis of this FGD was done, but notes were used to aid the overall assessment of the method.

A New Method to Estimate Mortality in Crisis-Affected Populations: Validation and Feasibility Study
20
3.5. FEASIBILITY OF THE EM METHOD 3.5.1. Economic Feasibility A modeling approach was used to document the economic feasibility of method. This compared the observed time input into the EM method with that which would be expected for the closest alternative method, namely a retrospective mortality survey, in the four sites. This approach was used because it avoids the challenges associated with using actual monetary costs (mainly obtaining accurate financial data from retrospective mortality surveys conducted in the same/similar location and time-period as the EM method). This approach excluded non-time-based parameters such as materials and supplies as most major inputs were time-based. Estimated monetary costs were then attached to time inputs to also produce a monetary outcome for the model to enable a cost-based comparison between the EM method and retrospective mortality surveys. We assumed that a retrospective survey would be conducted in each of the four sites broadly in line with guidelines set forth by the Standardized Monitoring and Assessment in Relief and Transition (SMART) initiative (www.smartindicators.org). Taking into account the layout and organization of the four communities, we assumed that cluster sampling with probability proportional to size (PPS) allocation of cluster starting points would be used in Kabul and Chiradzulu, and simple random sampling in the Mae La and Tanzania camps, where household lists are available. We assumed typical sample sizes of 30 clusters of 32 households in Kabul and Chiradzulu (i.e. 960 households in total, based on a design effect of 2.0), and 480 households (i.e. the same effective sample size, but with a design effect of 1.0) in Mae La and Tanzania. Other assumptions are listed in Annex 8.11. The activities included in the feasibility study were those which related to the implementation of the EM method (Section 3.3), but not those relating to validation or feasibility evaluation. These included: preparation, training, FGDs (including field-based analysis), population estimation, mortality data collection as part of the exhaustive search, data entry and cleaning, data analysis (estimation of mortality rates) and production of a short field report. Time inputs (both paid staff time and opportunity costs incurred by the study population) were systematically recorded by the study investigators for the following types of individuals involved in the study: study investigators; other study staff; drivers; collaborators (individuals working with the collaborating agency or others indirectly involved such as community administrative or public health officers); data collectors; and respondents. Monetary costs were estimated based on discussions with local informants about prices and salary costs in each of the four locations. The calculations for these monetary costs for the EM method and retrospective mortality surveys are provided in Annex 8.11. Two types of analysis were conducted on the economic feasibility data: i) comparison of the time and monetary cost inputs between the EM method and retrospective mortality surveys for each of the four study sites; and ii) time input per death recorded for the EM method. 3.5.2. Assessment of Ethical Implications This sub-objective sought to compare the ethical implications of the EM method in terms of risks and burden to the community and individual respondents. Findings from discussions with data collectors and personal perspectives of study investigators (based upon their observations and past experience with surveys and prospective surveillance systems) and data review were used to explore issues such as confidentiality arrangements, possible fallout from sharing data with investigators, and burden to respondents (such as the amount of data collected, number of respondents involved in data collection). 3.5.3. Verbal Autopsy Feasibility Each verbal autopsy interview was timed separately to collect data on the feasibility of adding verbal autopsy to the EM method. The time for verbal autopsy questionnaire analysis and coding was also recorded.

A New Method to Estimate Mortality in Crisis-Affected Populations: Validation and Feasibility Study
21
3.6. DATA MANAGEMENT All mortality data (from the exhaustive search or consultation of additional sources for capture-recapture) were double-entered on EpiData version 3.0 software (EpiData Association, Odense, Denmark). Any discrepancies between the two data entries were verified using the source questionnaires. The dataset was cleaned based on range and consistency checks (e.g., age within plausible range), and multiple reports of deaths were eliminated based on uniquely identifying variables. Population estimation data were single-entered onto Microsoft Excel and hand-verified. All analyses were done using freeshare R software. 3.7. ETHICAL CONSIDERATIONS Ethical approval for this study was provided by the Ethics Committee of the LSHTM and all the national research ethical review boards where required. These were the Institutional Review Board of the Ministry of Public Health of Afghanistan; the National Health Sciences Research Committee in Malawi; and the National Institute for Medical Research and also the Commission for Science and Technology in Tanzania (approval letters available from the investigators upon request). Data collectors, translators and key informants were briefed on the principles of confidentiality and informed consent. Investigators were also present during the data collection to help ensure adherence to these principles. The principle of confidentiality was adhered to as closely as possible in the study. Interviews were conducted as far as possible in a private space chosen by the respondent. The movement of all questionnaires was closely controlled and questionnaires are securely stored. The data from the FGDs was stored electronically. Only the investigators have access to electronic and paper data.

A New Method to Estimate Mortality in Crisis-Affected Populations: Validation and Feasibility Study
22
4. EM Validation and Feasibility Results 4.1. FOCUS GROUP DISCUSSION FINDINGS 4.1.1. District 1, Kabul The separate FGDs for women and men were held in District 1 on 12 July 2008. There were four participants in the women’s FGD and four in the men’s FGD (see Table 1). There were no marked differences in the findings of the women’s FGD and the men’s FGD. As a result, they are presented together. The different sources of mortality information identified by the participants are summarized in Table 3. Table 3. Sources of Information on Deaths Identified During the FGD in District 1, Kabul
Source Advantages Disadvantages Notes
Wakil-e-guzars (sector leaders)
Official role as community leaders means they know about key events, including deaths. Informed either directly by family of deceased or neighborhood informants. Often invited for funeral prayers for deceased.
May not immediately know of deaths because of large population size in their guzar. Population change means it is difficult for Wakil-e-guzars to be fully informed of all events.
Wakil-e-guzars are all male, and nominated by election. Each controls a population of several thousand There are 24 guzars in District 1, each headed by a wakil.
Mullahs Offer prayers for funeral of deceased and so know quickly about a death in the community.
May be new to District 1 and so not familiar with all events.
Mullahs are male, and usually affiliated to Ministry of Islamic Affairs. Each gazar contains at least one and typically up to five mosques, both Shi’a and Sunni.
Shopkeepers (kondora) and bakers
Meeting places where community members share news about recent/future events such as deaths and funerals
Knowledge mainly limited to few streets surrounding shop/bakery.
The small commodity shops (kondora) serve the surrounding streets and so number several hundred in total. There are separate men’s and women’s bakeries. Each guzar has at least one of each.
School teachers Good knowledge of deaths of their school pupils and also some knowledge of the deaths of families of the pupils.
Knowledge limited to mainly deaths of pupils and their families.
There are a total of 47 public and private schools in District 1 (all ages). The teachers are from inside and outside of District 1.
Hospitals Critically ill residents from District 1 would attend the main hospitals serving the district. Hospital records of deaths from District 1 should be available.
The main hospitals serving District 1 include Maiwand Hospital, Ibna Sina Hospital, Indira Gandhi Hospital, Rab-e-Balkhi Maternity Hospital, the French Hospital, and the Tuberculosis Hospital
FGD participants were asked about the ways in which information on deaths in the community is shared in District 1. Participants noted that relatives of the deceased would directly inform the wakil-e-guzars and mullahs. They also noted how information is spread about the death and the funeral through household visits and phone calls by family members of the deceased, and loudspeakers at the mosque. The small commodity shops (kondora) and bakeries were also noted as meeting places where people exchange news on events in the community. The participants felt that households

A New Method to Estimate Mortality in Crisis-Affected Populations: Validation and Feasibility Study
23
would also be willing to share information on deaths within the household and also refer data collectors to other households. FGD participants noted a number of potential challenges to obtaining information on deaths. The population change in District 1 (departures of old residents, and arrivals of many new immigrants, including short-term renters) meant that knowledge about deaths in the community may be weakened which could affect the method, particularly in terms of referrals from other households. In addition, a wakil participant noted that it was difficult for them to immediately know of deaths because of the large population size in their guzars (up to 4,000 people). The deaths of certain community members may also be less well known about. A cited example was information on the deaths of children, particularly very young children, because knowledge of the community and potential key-informants was less due to their young age and that funerals for children were smaller events more limited to the immediate family. Certain causes of death may also affect knowledge of the deaths. Participants noted that deaths caused by illegal activities such as violence and illicit drugs would not be widely disseminated because of the sense of shame on the family. As a result, the death may not be so well known by community members and potential key-informants and also the true cause of death may be concealed by family members. 4.1.2. Mae La Camp The FGD was held on 10 July 2008. There were 33 participants (many more attended than were invited; see Table 1). The different sources of mortality information identified by the participants are summarized in Table 4. Table 4. Sources of Information on Deaths Identified During the FGD in Mae La Camp
Source Advantages Disadvantages Notes
Section Leaders
Official source of mortality information. Comprehensively cover the whole camp.Are able to report deaths due to infectious diseases directly to health workers, potentially informing prevention or intervention measures.
Not everybody reports to them. Gives an incomplete picture of the population. Often do not know the cause of death (which limits ability to identify outbreaks). Leaders not trained and may not understand causes of death, even if explained to them.
There are 22 sections in Mae La camp. Each one has a leader who is democratically elected. They are key contributors to official statistics about the population in their sector (births, deaths, in- and out-migration).
Section Health Workers
Section Health Workers (as a group) cover the whole camp population.
Have no training and may not understand causes of death.
Are in effect ‘public health administrators’ who are mostly involved in distribution of some items among the camp population and assist Section Leaders to track population data.
Religious Leaders
They know about deaths not reported to Section Leaders/Section Health Workers.Almost everybody in the camp belongs to a church, temple, or mosque. They are informed about deaths almost as soon as they happen (i.e. very timely data). They know exactly in which household the deaths occur.
They do not report deaths to camp officials. Churches make an annual list, but no written records are kept by the mosques or temples. There are lots of churches/mosques/temples (i.e. fragmented data source). A small number of people practice Animism, for which there is no formal religious authority involved in burials/cremations.
There are no Hindus in Mae La.
Home Visitors
More likely to report deaths to camp officials. Have training in health matters and are more likely to have some knowledge about cause of death.
Seen as quite strict (enforcers of public health practices). Households may not report deaths to them.
Home Visitors are employed by AMI.

A New Method to Estimate Mortality in Crisis-Affected Populations: Validation and Feasibility Study
24
SMRU Has good records from maternity clinic in camp.
Not sure what death data are collected.
Runs a maternity clinic in the camp where the majority of women receive antenatal and postnatal care.
Karen Women’s Organization
May be more aware of issues among women and children.
Probably does not have any additional information about deaths.
Members are female. Responsible for certain women and child issues.
Ways in which information on deaths in Mae La camp is shared included religious leaders who conduct wakes and burial ceremonies; via family and friends; people gossiping; and people buying flowers in the morning market for the deceased. Participants felt that households would be willing to agree to participate in the survey, even if the death was very recent. The potential challenges noted by the FGD participants in trying to collect information on deaths from community members included households being unwilling to respond to a survey about death unless is has the support of the Section Leaders and Camp Committee. The type of death may also affect willingness to share information, particularly if deaths were due to murder or if the deceased was part of an armed group. There may also be embarrassment about deaths due to sexually transmitted infections (STIs)/HIV which could lead to misreporting of the cause of death (although they would probably report that a death had occurred). It was also noted that it may be difficult to identify deaths of new arrivals or individuals not registered. The FGD participants observed that households may not respond if they thought the study team was conducting a census or if the study was perceived to be related to food rations or distributions. Some camp residents may also have Thai identification cards and may be reluctant to report these deaths as they may result in their refugee status being questioned. FGD participants felt some respondents may not know the name of particular diseases and so could not accurately identify causes of death. 4.1.3. Chiradzulu District The FGD was held in Khongozo village in Chiradzulu district on 23 August 2008. There were 9 participants (see Table 1). The different sources of mortality information identified by the participants are summarized in Table 5. Table 5. Sources of Information on Deaths Identified During the FGD in Chiradzulu District
Source Advantages Disadvantages Notes
Village headman
Expected to attend all funeral ceremonies in the village. Role of informing people about deaths, including those in charge of graveyard. Some headmen keep a register of births and deaths. Responsibility as headman and so will tell truth. Major events are reported to headman.
May exclude information on families if unfriendly with them, or if families have not paid him a contribution. May be drunk. Could be away from village. Headman may not know about stillborn babies. May forget. May be new and so less knowledgeable.
Each village has a headman who is nominated by village elders; may be a male or female. Has overall responsibility for the running of the village, dealing with village disputes, and referring matters to the next administrative level (the Traditional Authority). Also responsible for allocating land in graveyards for burial.
Fumukazi (see Notes)
Informed about newborn deaths very quickly Good knowledge on deaths of children and newborns (responsible for burying 2-3 day old children). Expected to be present at all village funerals. Knows many women in the community. Works closely with headman so may also know of deaths from him. Trustworthy.
May forget about deaths in the village. May be drunk. May not know about all deaths if there is not unity in the village. Long procedure for reporting deaths to headman (may take several days).
The fumukazi is the village headwoman, sometimes deputy to the headman, and can also fill the role of village headman. The fumukazi is responsible for women’s activities, specifically marriage, burying young babies, following-up of pregnancy, and cooking for funerals.
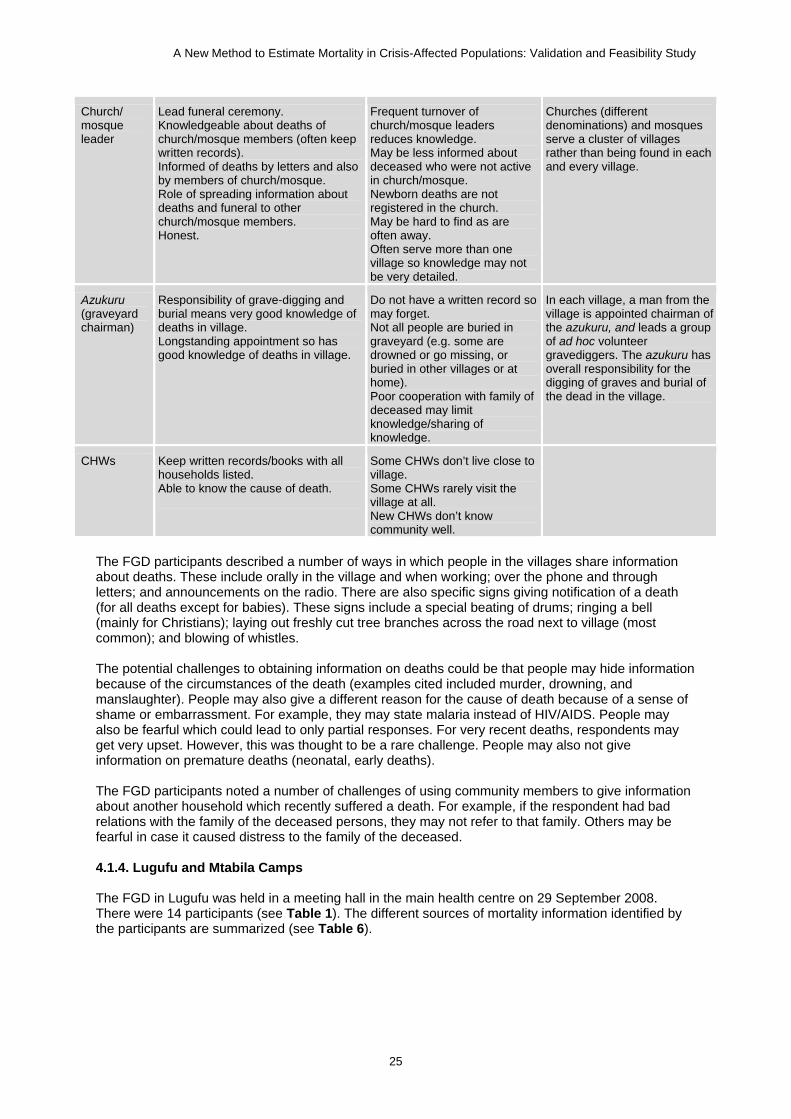
A New Method to Estimate Mortality in Crisis-Affected Populations: Validation and Feasibility Study
25
Church/ mosque leader
Lead funeral ceremony. Knowledgeable about deaths of church/mosque members (often keep written records). Informed of deaths by letters and also by members of church/mosque. Role of spreading information about deaths and funeral to other church/mosque members. Honest.
Frequent turnover of church/mosque leaders reduces knowledge. May be less informed about deceased who were not active in church/mosque. Newborn deaths are not registered in the church. May be hard to find as are often away. Often serve more than one village so knowledge may not be very detailed.
Churches (different denominations) and mosques serve a cluster of villages rather than being found in each and every village.
Azukuru (graveyard chairman)
Responsibility of grave-digging and burial means very good knowledge of deaths in village. Longstanding appointment so has good knowledge of deaths in village.
Do not have a written record so may forget. Not all people are buried in graveyard (e.g. some are drowned or go missing, or buried in other villages or at home). Poor cooperation with family of deceased may limit knowledge/sharing of knowledge.
In each village, a man from the village is appointed chairman of the azukuru, and leads a group of ad hoc volunteer gravediggers. The azukuru has overall responsibility for the digging of graves and burial of the dead in the village.
CHWs Keep written records/books with all households listed. Able to know the cause of death.
Some CHWs don’t live close to village. Some CHWs rarely visit the village at all. New CHWs don’t know community well.
The FGD participants described a number of ways in which people in the villages share information about deaths. These include orally in the village and when working; over the phone and through letters; and announcements on the radio. There are also specific signs giving notification of a death (for all deaths except for babies). These signs include a special beating of drums; ringing a bell (mainly for Christians); laying out freshly cut tree branches across the road next to village (most common); and blowing of whistles. The potential challenges to obtaining information on deaths could be that people may hide information because of the circumstances of the death (examples cited included murder, drowning, and manslaughter). People may also give a different reason for the cause of death because of a sense of shame or embarrassment. For example, they may state malaria instead of HIV/AIDS. People may also be fearful which could lead to only partial responses. For very recent deaths, respondents may get very upset. However, this was thought to be a rare challenge. People may also not give information on premature deaths (neonatal, early deaths). The FGD participants noted a number of challenges of using community members to give information about another household which recently suffered a death. For example, if the respondent had bad relations with the family of the deceased persons, they may not refer to that family. Others may be fearful in case it caused distress to the family of the deceased. 4.1.4. Lugufu and Mtabila Camps The FGD in Lugufu was held in a meeting hall in the main health centre on 29 September 2008. There were 14 participants (see Table 1). The different sources of mortality information identified by the participants are summarized (see Table 6).

A New Method to Estimate Mortality in Crisis-Affected Populations: Validation and Feasibility Study
26
Table 6. Sources of Information on Deaths Identified During the FGD in Lugufu camp, Tanzania
Source Advantages Disadvantages Notes
Community Leaders
Know of major events, including deaths (all causes, all ages). Prompt knowledge as help coordinate support for relatives of deceased (e.g., funds for burial, food etc). Often attend burial of deceased. Systematically informed by other community leaders (e.g., block leaders) and also informed by regular community members.
May want payment for providing information. May fear that information will be given to police and police will want to question them. May not always record because of low literacy or lack of materials. Families may ask them not to report deaths (because of food rations and repatriation).
Leaders are camp residents selected by other residents. Include block leaders (up to 30 per village) who report to village leaders (32 villages) who report to zone leaders (eight zones) who report to the camp chairman.
CHWs Good knowledge of general health situation in their area, including deaths. Refer sick residents to camp hospital. Sometimes keep written records, including of deaths.
People may not admit death to CHW (especially if had ignored CHW advice).Know less about home deaths as not always reported to CHW. Use of traditional medical practices means CHW may not be aware of illnesses/deaths. Don’t keep systematic records. May not report a death if they feel they themselves failed to adequately treat/refer deceased.
CHWs are volunteer camp residents who provide very basic health information, prevention and referral services for TRCS.
Religious Leaders
Involved in burials (all ages). Routinely visit community members so have knowledge of key events. Information on deaths is spread by them/to them in the church/mosque.
May only know about deaths of regular members of their congregation. Relatives of deceased who used traditional medical practices may not report to religious leader. May not keep accurate records. There are many religious leaders.
There are over one hundred Christian and Muslim religious leaders. The majority are Christian and represent many denominations.
Graveyard Keepers
Keep very good records as used to inform deaths for World Vision’s camp registration system. Not possible to hold burial in graveyard without informing graveyard keepers. All ages are buried (including the newborns). Hold details about the deceased (name, address, age, cause of death). Involved in issuing the burial shroud for the deceased.
Deaths outside the camp may be buried elsewhere (but rare). A keeper may be away and burial takes place without him (although someone will probably act as an assistant and pass on information to the keeper upon his return).
There are three graveyards and each is attended by a graveyard keeper. They are supported by World Vision (camp management agency) and their reports of death are used for the camp register maintained by World Vision.
Traditional Birth Attendants (TBAs)
Knowledgeable on deaths of babies and mothers. Involved in burials of babies.
Knowledge mainly limited to deaths of babies/mothers. Most don’t keep a written record. May not be told about deaths if relatives of deceased ignored their advice. May not report deaths if they feel they gave poor advice.
Camp residents providing voluntary services to pregnant mothers and newborns. Receive basic training from TRCS and NGOs.
The FGD participants in Lugufu camp described a number of ways in which people in the camp share information about deaths. These included through religious leaders who spread information on deaths to their congregations; village/block leaders; camp radio stations; word of mouth; mobile phones; visits to other households; using children to pass message and letters to other households; and public gathering points such as food distribution and water points.

A New Method to Estimate Mortality in Crisis-Affected Populations: Validation and Feasibility Study
27
A number of potential challenges to obtaining information on deaths in Lugufu camp were noted by the FGD participants. These included respondents being too sad to want to be interviewed or to give accurate information; households’ perception that the research is tied to food aid or repatriation, leading them to deny that a death occurred; reluctance/shame by relatives of the deceased to admit to the death if they had ignored medical advice or used traditional medicine, or because of the cause of death (e.g., suicide or crime-related). The FGD in Mtabila camp was held in a meeting hall in the main health centre on 6 October 2008. There were 22 participants (see Table 1). The different sources of mortality information identified by the participants are summarized in Table 7. Table 7. Sources of Information on Deaths Identified During the FGD in Mtabila Camp, Tanzania
Source Advantages Disadvantages Notes
Community Leaders
Street leaders very confident they knew about all deaths. Involved in coordinating support for relatives of deceased (e.g., funds for burial, food etc). Often attend burial of deceased. Often visit households in area and so know of key-events. If someone is very ill the relatives will inform the street leaders. Community members expected to inform street leaders of a death. Know about deaths of all ages. Well established reporting system of events from block leaders to village leaders and to the chairman. Expected to report deaths from unnatural causes to camp authorities.
May want payment for providing information. May not always write down information.
Community leaders are camp residents selected by other residents. These consist of street leaders (around 50 for each of the 10 zones in the camp) who report to zone leaders (1 man and 1 woman for each of the 10 zones) who report to the camp chairman.
Security Guards Based in all zones. Some may keep records. Report to camp authorities major events, including deaths.
May not record all deaths (more likely to know about unnatural causes). Do not have as extensive knowledge of whole of the zone (compared with street leaders).
Camp residents who act as voluntary police in each of the zones (there can be up to 23 in each zone)
Religious Leaders
Involved in burials (all ages). Good contacts with community members so know about events.
Will only know about deaths of regular members of their congregation. There are many religious leaders in the camps (apparently there are nearly 40 denominations in the camp and hundreds of leaders).
There are over one hundred religious leaders, predominantly Christian. They represent many denominations.
Graveyard Keepers
Keep very good records about deceased (name, address, age). Not possible to hold burial in graveyard without informing graveyard keepers to have comprehensive knowledge. All ages are buried (including the newborns). Involved in issuing the burial shroud for the deceased. Employed by camp management and report to them so keep good records.
Won’t know about deaths outside of the camp.
There are 3 graveyards and each is attended by a graveyard keeper. They are supported by IRC and their reports of death are used in the camp register compiled by the IRC.

A New Method to Estimate Mortality in Crisis-Affected Populations: Validation and Feasibility Study
28
A number of potential challenges to obtaining information on deaths were noted by the FGD participants. These included that informants may not know about deaths of refugees from the camp but who died outside of the camp. Participants also noted that households where a death occurred may have repatriated back to Burundi. 4.2. EXHAUSTIVE SEARCH FOR RECENT DEATHS 4.2.1. Choice of Key Informants The selection of primary and secondary informants was made based upon the analysis of FGD findings. Table 8 presents the key-informants selected, along with a summary explanation for their selection. Further information on these informants can be found in Section 4.1. Table 8. Primary and Secondary Key Informants, by Study Site
Informant District 1, Kabul Mae La Camp Chiradzulu District Tanzania Camps
Primary Wakil-e-guzars: Principal source of information on deaths in community as officially responsible for guzar and so should be informed about deaths. Attend many funerals in the district. All wakils were interviewed to give information on deaths in their guzar.
Section leaders: Responsible for official reporting of vital statistics Comprehensive coverage of entire camp.
Village headman: Responsible for allocating land in graveyards for burial of individual decedents. Expected to be present at all village funerals. Informed of key events in village. Role of sharing information on key events.
Community leaders: Camp residents selected by other residents. These consist of street leaders (around 50 for each of the 10 zones in the camp) who report to zone leaders (1 man and 1 woman for each of the 10 zones) who report to the camp chairman. The camp chairman and zone leaders were the main community leaders used.
Secondary Mullah: Theoretically responsible for funeral prayers after any death. Give notification of death and funeral at the mosque. Each wakil sector contains at least one and typically up to five mosques, both Shi’a and Sunni; all mosques were visited.
Karen Women’s Organization members: Members are female. Strong knowledge of deaths of women and children.
Fumukazi: Good knowledge on deaths of children and newborns. Expected to be present at all village funerals. Village elder and so informed of key events in the village. Works closely with village headman so informed of events.
Secondary informants were not used as available reliable sources were either not feasible (e.g., religious leaders as there are well over one hundred religious leaders in each camp) or because they were already being relied upon for information by the sources used for the capture-recapture analysis (e.g., graveyard diggers as they provided information on deaths to the management agencies in both camps).
4.2.2. Timeframe, Coverage and Study Attrition Details on the population size (all ages and under five years) investigated, the data collection period and study attrition for the 4 study sites are given in Table 9. The exhaustive search was carried out over 11 working days in Kabul, five days in Mae La, 17 days in Chiradzulu and seven days in Tanzania (results for both camps combined). All community informants who were found agreed to provide information. In Chiradzulu District, two households delayed their consent after consulting with family members or the headman. In Tanzania, one household refused to give consent.
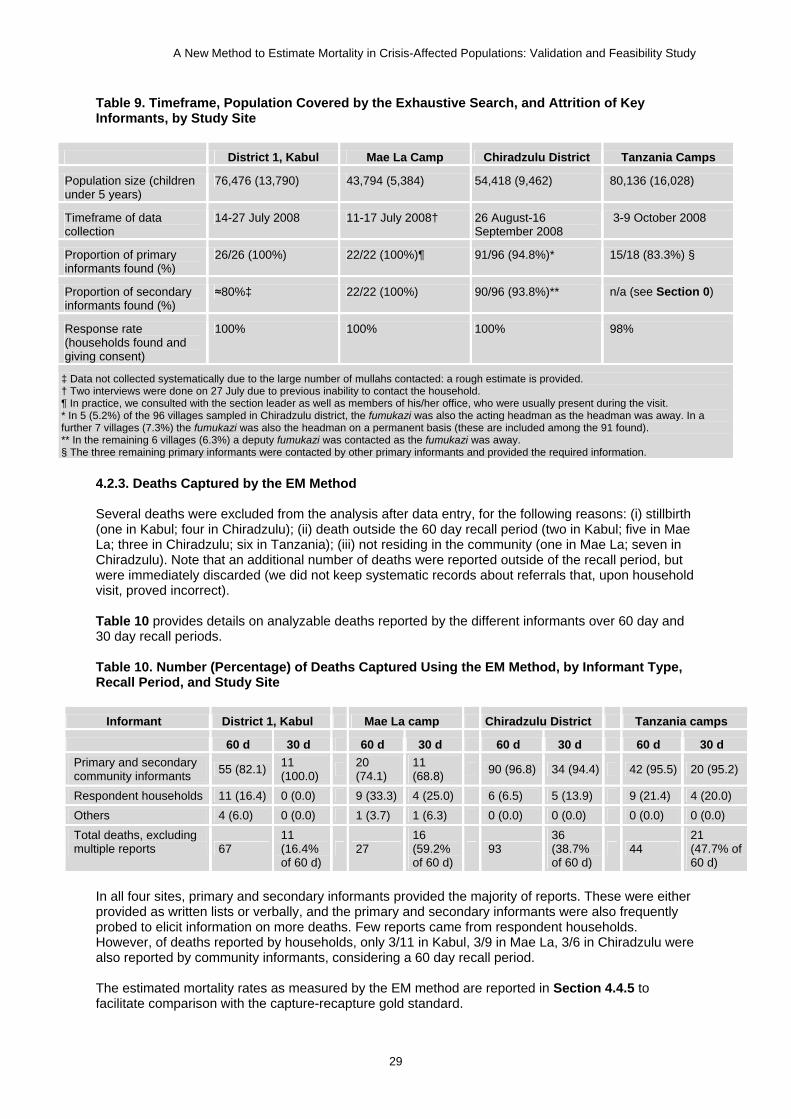
A New Method to Estimate Mortality in Crisis-Affected Populations: Validation and Feasibility Study
29
Table 9. Timeframe, Population Covered by the Exhaustive Search, and Attrition of Key Informants, by Study Site
District 1, Kabul Mae La Camp Chiradzulu District Tanzania Camps
Population size (children under 5 years)
76,476 (13,790) 43,794 (5,384) 54,418 (9,462) 80,136 (16,028)
Timeframe of data collection
14-27 July 2008 11-17 July 2008† 26 August-16 September 2008
3-9 October 2008
Proportion of primary informants found (%)
26/26 (100%) 22/22 (100%)¶ 91/96 (94.8%)* 15/18 (83.3%) §
Proportion of secondary informants found (%)
≈80%‡ 22/22 (100%) 90/96 (93.8%)** n/a (see Section 0)
Response rate (households found and giving consent)
100% 100% 100% 98%
‡ Data not collected systematically due to the large number of mullahs contacted: a rough estimate is provided. † Two interviews were done on 27 July due to previous inability to contact the household. ¶ In practice, we consulted with the section leader as well as members of his/her office, who were usually present during the visit. * In 5 (5.2%) of the 96 villages sampled in Chiradzulu district, the fumukazi was also the acting headman as the headman was away. In a further 7 villages (7.3%) the fumukazi was also the headman on a permanent basis (these are included among the 91 found). ** In the remaining 6 villages (6.3%) a deputy fumukazi was contacted as the fumukazi was away. § The three remaining primary informants were contacted by other primary informants and provided the required information.
4.2.3. Deaths Captured by the EM Method Several deaths were excluded from the analysis after data entry, for the following reasons: (i) stillbirth (one in Kabul; four in Chiradzulu); (ii) death outside the 60 day recall period (two in Kabul; five in Mae La; three in Chiradzulu; six in Tanzania); (iii) not residing in the community (one in Mae La; seven in Chiradzulu). Note that an additional number of deaths were reported outside of the recall period, but were immediately discarded (we did not keep systematic records about referrals that, upon household visit, proved incorrect). Table 10 provides details on analyzable deaths reported by the different informants over 60 day and 30 day recall periods. Table 10. Number (Percentage) of Deaths Captured Using the EM Method, by Informant Type, Recall Period, and Study Site
Informant District 1, Kabul Mae La camp Chiradzulu District Tanzania camps
60 d 30 d 60 d 30 d 60 d 30 d 60 d 30 d Primary and secondary community informants 55 (82.1) 11
(100.0) 20 (74.1)
11 (68.8) 90 (96.8) 34 (94.4) 42 (95.5) 20 (95.2)
Respondent households 11 (16.4) 0 (0.0) 9 (33.3) 4 (25.0) 6 (6.5) 5 (13.9) 9 (21.4) 4 (20.0) Others 4 (6.0) 0 (0.0) 1 (3.7) 1 (6.3) 0 (0.0) 0 (0.0) 0 (0.0) 0 (0.0) Total deaths, excluding multiple reports 67
11 (16.4% of 60 d)
27 16 (59.2% of 60 d)
93 36 (38.7% of 60 d)
44 21 (47.7% of 60 d)
In all four sites, primary and secondary informants provided the majority of reports. These were either provided as written lists or verbally, and the primary and secondary informants were also frequently probed to elicit information on more deaths. Few reports came from respondent households. However, of deaths reported by households, only 3/11 in Kabul, 3/9 in Mae La, 3/6 in Chiradzulu were also reported by community informants, considering a 60 day recall period. The estimated mortality rates as measured by the EM method are reported in Section 4.4.5 to facilitate comparison with the capture-recapture gold standard.

A New Method to Estimate Mortality in Crisis-Affected Populations: Validation and Feasibility Study
30
4.2.4. Profile of Deaths Captured by the EM Method Key characteristics of deaths captured by the method are reported in Table 11. The sex ratio appeared balanced in all sites. About one third of deaths were among children under 5 years in Kabul and Chiradzulu. Most decedents received some medical treatment before death. However, the majority died at home, especially in Kabul. The breakdown of causes of death revealed expected patterns, with a predominance of infectious and/or neonatal conditions in Chiradzulu and proportionately more chronic disease elsewhere, with a higher contribution of injuries in Kabul, the urban site. There was no obvious difference in the profile of decedents according to recall period. Table 11. Profile of Deaths Captured by the EM Method, by Recall Period and Study Site
District 1, Kabul Mae La Camp Chiradzulu District Tanzania Camps
60 d (n=67)
30 d (n=11)
60 d (n=27)
30 d (n=16)
60 d (n=93)
30 d (n=36)
60 d (n=44)
30 d (n=21)
Demographic characteristics (%)
Median age in years (range) 35 (0-99)
50 (0-99) 55
(1-87) 63 (21-87) 35
(0-96) 36 (0-85) 4
(0-98) 25 (0-98)
Age below 5 years 20 (29.9) 1 (9.1) 2 (7.4) 0 (0.0) 26 (28.0) 12 (33.3) 22 (50.0) 8 (38.1)
Male sex 32 (47.8) 4 (36.4) 15 (55.6) 6 (37.5) 47 (50.5) 16 (44.4) 22 (50.0) 10 (47.6)
Place of death (%)
In person’s household 50 (74.6) 9 (81.8) 15 (55.6) 10 (62.5) 51 (54.8) 22 (61.1) 9 (20.5) 4 (19.0)
In a different household 1 (1.5) 0 (0.0) 2 (7.4) 5 (31.3) 2 (2.2) 0 (0.0) 3 (6.8) 2 (9.5)
In a health structure 12 (17.9) 2 (18.2) 8 (29.6) 1(6.3) 39 (41.9) 13 (36.1) 29 (65.9) 13 (61.9)
Elsewhere 4 (6.0) 0 (0.0) 2 (7.4) 0 (0.0) 1 (1.1) 1 (2.8) 3 (6.8) 2 (9.5)
Received any medical treatment before death (%)
Yes 51 (76.1) 8 (72.7) 18 (66.7) 10 (62.5) 79 (84.9) 31 (86.1) 37 (84.1) 20 (95.2)
No / Don’t know 16 (23.9) 3 (27.3) 9 (33.3) 6 (37.5) 14 (15.1) 5 (13.9) 7 (15.9) 1 (4.8)
Cause of death according to respondent (%)
Neonatal (first month) 6 (9.0) 1 (9.1) 0 (0.0) 0 (0.0) 12 (12.9) 4 (11.1) 2 (4.5) 0 (0)
Probably infectious 10 (14.9) 0 (0.0) 4 (14.8) 3 (18.8) 33 (34.5) 10 (27.8) 18 (40.9) 8 (38.1)
Probably chronic 36 (53.7) 8 (72.7) 17 (63.0) 9 (56.3) 20 (21.5) 8 (22.2) 17 (38.6) 9 (42.9)
Probably injury-related 12 (17.9) 1 (9.1) 2 (7.4) 1 (6.3) 4 (4.3) 3 (8.3) 1 (2.3) 1 (4.8)
Unclear 3 (4.5) 1 (9.1) 4 (14.8) 3 (18.8) 24 (25.8) 11 (30.6) 6 (13.6) 3 (14.3)
Death recorded in writing by any organization, according to respondent (%)
Yes 11 (16.4) 2 (18.2) 24 (88.9) 14 (87.5) 51 (54.8) 22 (61.1) 39 (88.6) 19 (90.5)
No / Don’t know 56 (83.6) 9 (81.8) 3 (11.1) 2 (12.5) 42 (45.2) 14 (38.9) 5 (11.4) 2 (9.5) The majority of deaths in Mae La and Chiradzulu, but not Kabul, were reported by respondents to have been recorded by one or more organizations. In Kabul, 7/67 (10.4%) deaths were reportedly recorded by hospitals and 4/67 (6.0%) by various administrative offices. In Mae La, according to respondents 21/27 (77.7%) of deaths were reported to the camp section leader, 12/27 (44.4%) to the AMI surveillance system home visitors and 2/27 (7.4%) to a church, mosque or temple. In Chiradzulu, 5/93 (5.4%) of deaths were reported to have been recorded by the District administration, 22/93 (23.7%) by religious leaders and 31/93 (33.3%) by health centers or hospitals. In Tanzania, according to respondents 32/44 (72.7%) of deaths were reported to have been recorded by health centre or hospital staff, 8/44 (18.2%) by community leaders, and 7/44 (15.9%) by religious officials.

A New Method to Estimate Mortality in Crisis-Affected Populations: Validation and Feasibility Study
31
4.3. POPULATION ESTIMATION 4.3.1. District 1, Kabul Population estimation took place over two days, and all respondents consented to participate. Attrition was 0%. In the low-lying quadrant, 3/30 (10.0%) of quadrants sampled had in fact no residential structures; they were however retained in the analysis as zero values. Stratum-specific population estimates were 48,723 (95%CI 39,783-56,780) in the low-lying stratum and 29,788 (95%CI 13,990-39,170) in the hill stratum considering all age groups; for children under 5 years, they were 9,387 (95%CI 6,705-13,410) and 4,112 (95%CI 2,404-8,180) respectively. Altogether, 76,476 (95%CI 58,494-89,523) people were estimated to live in District 1 at the time of the survey, of whom 13,790 (95%CI 10,224-19,004) or 18.0% were estimated to be children under 5 years. Further data on occupancy per household or residential structure are available upon request from the investigators. 4.3.2. Mae La Camp The mid-period total population for Mae La camp was 43,794, of whom 5,384 (12.3%) were recorded as children under 5 years. This refers to the July 2008 update of population figures conducted by the AMI surveillance system. 4.3.3. Chiradzulu District In three villages, only one structure count was performed. Structure counts in four neighboring villages were not handed over by the community, and had to be imputed (see Section 3.3.6). Overall, we estimated that the 96 villages sampled comprised 15,744 structures. Residents of all structures selected for the survey of structure size consented and provided information: attrition was thus 0%. The estimated number of people per structure was 3.46 (95%CI 3.19-3.71, Deff=1.28), with 0.60 being children under 5 years (17.3%) (95%CI 0.49-0.73, Deff=1.44). We estimated the population of the 96 sampled villages as 54,418 (95%CI 46,717-62,694), of whom 9,462 (95%CI 6,419-13,642) or 17.7% were estimated to be children under 5 years. 4.3.4. Lugufu and Mtabila Camps We used population estimates at the mid-point of the recall period, based upon population data used by UNHCR. The mid-period population estimate for Lugufu camp was recorded as 38,363 for all ages and 7,673 (20.0%) for children below 5 years. The mid-period population estimate for Mtabila camp was recorded as 41,773 for all ages and 8,355 (20.0%) for children below 5 years. The combined population estimation was therefore 80,136 for all ages and 16,028 (20.0%) for children below 5 years. 4.4. VALIDITY 4.4.1. Comparison of Deaths Identified by the EM Method and Alternative Data Sources A summary of the number, age and sex profile of the deaths captured by the three lists in each of the study sites is shown in Table 12. The EM method had the highest yield among the three lists in all sites except for Mae La, where surveillance identified more deaths.

A New Method to Estimate Mortality in Crisis-Affected Populations: Validation and Feasibility Study
32
Table 12. Demographic Profile of Deaths Captured by the EM Method and Alternative Lists, by Recall Period and Study Site
List 1 List 2 List 3 All Lists Combined Site 60 d 30 d 60 d 30 d 60 d 30 d 60 d 30 d
District 1, Kabul EM Method Convenience Stores, Bakeries Hospital Records Total
Number of deaths 67
11 (16.4% of 60 d)
33 12 (36.3% of 60 d)
8 6 (75.0% of 60 d)
82 18 (22.0% of 60 d)
Median age in years (range)
35 (0-99)
50 (0-99) 50
(0-99) 48 (0-99) 3
(0-36) 1 (0-6) 35
(0-99) 40 (0-99)
Age below 5 years (%) 20 (29.9) 1 (9.1) 9 (27.3) 2 (16.7) 5 (62.5) 4 (66.7) 26
(31.7) 5 (27.8)
Male sex (%) 32 (47.8) 4 (36.4) 16 (48.5) 6 (50.0) 8
(100.0) 6 (100.0) 43
(52.4) 10 (55.6)
Mae La Camp EM Method Religious Leaders Surveillance System Total
Number of deaths (%) 27 16 23 15 (65.2) 41 18 (43.9) 52 23 (44.2)
Median age in years (range)
55 (1-87)
63 (21-87) 55
(1-85) 63 (45-85) 47
(0-87) 54 (0-87) 49
(0-87) 63 (0-87)
Age below 5 years (%) 2 (7.4) 0 (0.0) 2 (8.7) 0 (0.0) 15 (36.6) 4 (22.2) 16
(30.8) 4 (17.4)
Male sex (%) 15 (55.6) 6 (37.5) 14 (60.9) 8 (53.3) 27
(65.9) 11 (61.1) 33
(63.4) 13 (56.5)
Chiradzulu District EM Method Graveyard Chairmen Health Structure Records, HSAs Total
Number of deaths (%) 93 36 (38.7) 72 27 (37.5) 44 17 (38.6) 110 42 (38.2)
Median age in years (range)
35 (0-96)
36 (0-85) 34
(0-96) 34 (0-85) 35
(0-96) 32 (0-85) 35
(0-96) 34 (0-85)
Age below 5 years (%) 26 (28.0) 12 (33.3) 20 (27.8) 9 (33.3) 11
(25.0) 7 (41.2) 30 (27.3) 15 (35.7)
Male sex (%) 47 (50.5) 16 (44.4) 34 (47.2) 9 (33.3) 25
(56.8) 9 (52.9) 55 (50.0) 19 (45.2)
Tanzania Camps EM Method Camp Register TRCS Surveillance Total
Number of deaths (%) 44 21 35 16 (45.7) 29 13 (44.8) 63 28 (44.3)
Median age in years (range)
4 (0-98)
25 (0-98) 2
(0-87) 22 (0-87) 2
(0-78) 27 (0-78) 4
(0-98) 15 (0-98)
Age below 5 years (%) 22 (50.0) 8 (38.1) 17 (48.6) 6 (37.5) 17
(58.6) 4 (30.8) 33 (52.4) 12 (42.9)
Male sex (%) 22 (50.0) 10 (47.6) 22 (62.9) 11 (68.8) 16
(55.2) 9 (69.2) 34 (54.0) 16 (57.1)

A New Method to Estimate Mortality in Crisis-Affected Populations: Validation and Feasibility Study
33
The age composition of the three different lists was mostly similar in Chiradzulu and Tanzania; in Kabul, most of the deaths reported by hospitals were among children; in Mae La, children were much more prominent in the surveillance list than in lists provided by the EM method or religious leaders. Gender ratios were mostly balanced, with the exception of hospital records in Kabul (only male deaths reported); Surveillance systems in Mae La and the Tanzanian camps may also have over-reported males, although this may also reflect gender-specific mortality differentials. In Kabul, 78% of deaths were reported to have occurred between 30 and 60 days before the survey, contradicting expectations (conventional theory suggests “telescoping” of traumatic events, whereby people report them as having occurred more recently than they actually do; furthermore, recall would be expected to be better in the most recent period). As shown in Figure 3, deaths reported by the EM method’s informants are particularly skewed towards earlier dates. Reported deaths peak around 40-45 days before the survey date: in Islamic-majority countries, the 40-day mark is important as it marks the completion of the mourning period; however, in repeated conversations with numerous key informants about this odd timing pattern, no qualitative association between the mourning period and death reporting was mentioned. Some digit preference may also have occurred (deaths appear to be clustered around the 7-, 14- and 30-day mark). Figure 3. Reported Timing of Deaths Captured in Kabul, by Source
0
1
2
3
4
5
6
7
8
9
10
1 4 7 10 13 16 19 22 25 28 31 34 37 40 43 46 49 52 55 58days before survey
frequ
ency
HospitalsShopkeepersEM method
4.4.2. Overlap of Deaths Among Different Lists Venn diagrams showing the overlap among the three lists, over 60 days and 30 days recall periods, are shown below for each site (Figure 4, Figure 5, Figure 6 and Figure 7).

A New Method to Estimate Mortality in Crisis-Affected Populations: Validation and Feasibility Study
34
Figure 4. Overlap Among the Three Mortality Lists in District 1, Kabul, by Recall Period
Figure 5. Overlap Among the Three Mortality Lists in Mae La Camp, by Recall Period
60 day period (n=82)
30 day period (n=18)
60 day period (n=52)
30 day period (n=23)
3
8
3 13
18
5
2
EM survey (n=27)
Surveillance system(n=41)
Religious leaders (n=23)
1
3
2 10
5
2
0
EM survey (n=16)
Religious leaders (n=15)
Surveillance system(n=18)
45
1
20 1
3
9
3
EM survey (n=67)
Hospital records (n=8)
Shopkeepers and bakers (n=33)
3
1
7 0
2
2
3
EM survey (n=11)
Shopkeepers and bakers (n=12)
Hospital records (n=6)

A New Method to Estimate Mortality in Crisis-Affected Populations: Validation and Feasibility Study
35
Figure 6. Overlap Among the Three Mortality Lists in Chiradzulu District, by Recall Period
Figure 7. Overlap Among the Three Mortality Lists in Lugufu and Mtabila Camps, by Recall Period
60 day period (n=63)
30 day period (n=28)
TRCS surveillance (n=29)
60 day period (n=110)
30 day period (n=42)
Health structure records, HSAs
(n=44)
Health structure records, HSAs
(n=17)
21
5
40 27
12
5
0
EM survey (n=93)
Graveyard chairmen (n=72)
7
3
17 9
5
1
0
EM survey (n=36)
Graveyard chairmen (n=27)
17
6
6 15
5
11
3
EM survey (n=44)
Camp register (n=35)
8
3
3 7
1
4
2
EM survey (n=21)
Camp register (n=16)
TRCS surveillance (n=13)

A New Method to Estimate Mortality in Crisis-Affected Populations: Validation and Feasibility Study
36
4.4.3. Capture-Recapture Analysis District 1, Kabul Table 13 shows various results for possible log-linear models fit to the Kabul data considering a 60 and 30 day recall period. Considering the 60 day period, models 7 and 8 showed evidence of over-fitting and were thus excluded from BMA. The BMA estimated of uncaptured deaths was 25 (95%CI 10-86). Models for the 30 day period suggested a consistently low number of uncaptured deaths. Table 13. Log-Linear Models and Possible Capture-Recapture Estimates of Uncaptured Deaths in District 1, Kabul, By Recall Period
Model Model parameters
Posterior Probability
Uncaptured Deaths (95%CI)
Degrees of
Freedom
Chi-2 P-
Value BIC
Pearson Adjusted
Chi-2
60 days recall period
1. No interactions 0.290 28 (13-55) 3 0.086 -6.62 2.20
2. [EM x shops] 0.041 44 (9-184) 2 0.047 -2.71 3.05
3. [EM x hospitals] 0.494 18 (8-40) 2 0.568 -7.68 0.57
4. [shops x hospitals] 0.070 31 (15-62) 2 0.080 -3.77 2.52
5. [EM x shops] + [EM x hospitals] 0.082 9 (1-54) 1 0.578 -4.10 0.31
6. [EM x shops] + [shops x hospitals] 0.023 135 (17-2761) 1 0.092 -1.57 2.84
7. [EM x hospitals] + [shops x hospitals] Excluded 20 (8-46) 1 0.999 -4.41 0.00
8. [EM x shops] + [EM x hospitals] + [shops x hospitals] (saturated) Excluded 10 (1-758) 0 1.000 0.00 Infinite
Bayesian model average 25 (10-86)
30 days recall period
1. No interactions 0.143 3 (1-10) 3 0.056 -1.11 2.52
2. [EM x shops] 0.050 6 (1-34) 2 0.034 0.99 3.38
3. [EM x hospitals] 0.486 1 (0-6) 2 0.329 -3.56 1.11
4. [shops x hospitals] 0.037 3 (0-11) 2 0.025 1.59 3.69
5. [EM x shops] + [EM x hospitals] 0.116 1 (0-12) 1 0.138 -0.69 2.20
6. [EM x shops] + [shops x hospitals] 0.012 6 (0-149) 1 0.009 3.88 6.77
7. [EM x hospitals] + [shops x hospitals] 0.157 1 (0-5) 1 0.208 -1.30 1.59
8. [EM x shops] + [EM x hospitals] + [shops x hospitals] (saturated) Excluded (no
convergence) 0 1.000 0.00 Infinite
Bayesian model average 2 (0-11) Alternative approaches (see Section 3.4.3) yielded estimates of 24 uncaptured deaths (combination of the three lists), 26 (EM method vs. shopkeepers), 195 (EM method vs. hospitals) and 29 (shopkeepers vs. hospitals) over a 60 day period. Over a 30 day period, these estimates were 1, 3, 50 and 9 respectively. Over a 60 day period, most estimates yield around 20-30 uncaptured deaths, comforting the BMA estimates. Over a 30 day period, uncaptured deaths are below 10 in all models with the exception of the simple comparison of the EM method and hospital records (see Discussion, Sections 6.2 and 6.4).

A New Method to Estimate Mortality in Crisis-Affected Populations: Validation and Feasibility Study
37
Among children under 5 years and over a 60 day period, BMA estimated 12 (95%CI 2-91) uncaptured deaths. The low number of child deaths precluded analysis over a 30 day period. Mae La camp Over a 60 day period, we estimated 8 uncaptured deaths (Table 14) based on BMA. Alternative approaches yielded 12 (all lists combined), 5 (EM method vs. religious leaders), 6 (EM method vs. surveillance) and 14 (religious leaders vs. surveillance) uncaptured deaths. Over a 30 day period, models were consistent, and alternative approach estimates were 3, 1, 1 and 3 respectively. Estimates for children under 5 years could not be computed due to the low number of child deaths. Table 14. Log-Linear Models and Possible Capture-Recapture Estimates of Uncaptured Deaths in Mae La Camp, by Recall Period
Model Model parameters
Posterior Probability
Uncaptured Deaths (95%CI)
Degrees of
Freedom
Chi-2 P-
Value BIC
Pearson Adjusted
Chi-2
60 days recall period
1. No interactions 0.076 5 (2-11) 3 0.002 2.81 4.89
2. [EM x religious] 0.764 9 (4-20) 2 0.047 -1.81 3.05
3. [EM x surveillance] 0.021 8 (3-22) 2 0.001 5.42 6.66
4. [religious x surveillance] 0.019 3 (1-10) 2 0.001 5.54 6.72
5. [EM x religious] + [EM x surveillance] Excluded 45 (9-328) 1 0.603 -3.68 0.27
6. [EM x religious] + [religious x surv.] 0.117 7 (1-25) 1 0.015 1.95 5.90
7. [EM x surv.] + [religious x surv.] 0.003 5 (1-32) 1 <0.001 8.99 12.94
8. [EM x religious] + [EM x surveillance] + [religious x surveillance] (saturated) Excluded 73 (6-1035) 0 1.000 0.00 Infinite
Bayesian model average 8 (4-21)
30 days recall period
1. No interactions 0.155 1 (0-3) 3 0.008 2.43 3.95
2. [EM x religious] 0.611 2 (0-7) 2 0.051 -0.31 2.58
3. [EM x surveillance] 0.054 1 (0-6) 2 0.004 4.55 5.41
4. [religious x surveillance] 0.040 0 (0-3) 2 0.003 5.12 5.70
5. [EM x religious] + [EM x surveillance] Excluded (no convergence) 1 0.718 -3.01 0.13
6. [EM x religious] + [religious x surv.] 0.129 2 (0-15) 1 0.015 2.80 5.94
7. [EM x surv.] + [religious x surv.] 0.012 1 (0-14) 1 0.001 7.55 10.69
8. [EM x religious] + [EM x surveillance] + [religious x surveillance] (saturated) Excluded (no
convergence) 0 1.000 0.00 Infinite
Bayesian model average 2 (0-9)

A New Method to Estimate Mortality in Crisis-Affected Populations: Validation and Feasibility Study
38
Chiradzulu District In Chiradzulu District, two families of models were apparent, some supporting an estimate of very few uncaptured deaths, and others, more supported by the data, a considerable higher figure (Table 15). Non-model approaches yielded estimates of 9 (all lists combined), 2 (EM method vs. graveyards), 23 (EM method vs. health structures and HSAs) and 28 (graveyards vs. health structures and HSAs) considering the 60-day period, and 2, 0, 10 and 16 considering 30 days. Table 15. Log-Linear Models and Possible Capture-Recapture Estimates of Uncaptured Deaths in Chiradzulu District, by Recall Period
Model Model parameters
Posterior Probability
Uncaptured Deaths (95%CI)
Degrees of
Freedom
Chi-2 P-
Value BIC
Pearson Adjusted
Chi-2
60 days recall period
1. No interactions 0.000 5 (3-9) 3 <0.001 20.76 11.62
2. [EM x graveyards] 0.691 25 (12-49) 2 0.018 -1.39 4.01
3. [EM x health sources] 0.000 3 (1-7) 2 <0.001 21.76 15.58
4. [graveyards x health sources] 0.000 5 (2-10) 2 <0.001 25.42 17.41
5. [EM x graveyards] + [EM x health] Excluded (no convergence) 1 0.047 -0.77 3.93
6. [EM x graveyards] + [grave. x health] 0.309 50 (17-169) 1 0.027 0.22 4.92
7. [EM x hospitals] + [grave. x health] 0.000 3 (1-7) 1 <0.001 26.27 30.97
8. [EM x graveyards] + [EM x health] + [graveyards x health] (saturated) Excluded (no
convergence) 0 1.000 0.00 Infinite
Bayesian model average 33 (13-84)
30 days recall period
1. No interactions 0.037 2 (1-5) 3 0.002 3.48 4.90
2. [EM x graveyards] Excluded 10 (3-30) 2 0.648 -6.61 0.43
3. [EM x health sources] 0.030 1 (0-3) 2 0.003 3.90 5.69
4. [graveyards x health sources] 0.009 1 (0-4) 2 0.001 6.29 6.88
5. [EM x graveyards] + [EM x health] Excluded (no convergence) 1 0.791 -3.67 0.07
6. [EM x graveyards] + [grave. x health] 0.914 12 (2-65) 1 0.362 -2.91 0.83
7. [EM x hospitals] + [grave. x health] 0.009 0 (0-2) 1 0.002 6.27 10.01
8. [EM x graveyards] + [EM x health] + [graveyards x health] (saturated) Excluded (no
convergence) 0 1.000 0.00 Infinite
Bayesian model average 11 (2-55) Among children under 5, 9 (95%CI 2-66) uncaptured deaths were estimated by BMA over 60 days. No such estimate could be obtained for a 30 day period due to small numbers.

A New Method to Estimate Mortality in Crisis-Affected Populations: Validation and Feasibility Study
39
Lugufu and Mtabila Camps Over 60 days, 20 uncaptured deaths were estimated in Lugufu and Mtabila camps combined, and only 3 over 30 days (Table 16). Non-model approaches yielded roughly comparable estimates of 22 (all lists combined), 15 (EM method vs. camp register), 9 (EM method vs. surveillance) and 10 (camp register vs. surveillance) over 60 days, and 6, 7, 3 and 3 over 30 days. Table 16. Log-Linear Models and Possible Capture-Recapture Estimates of Uncaptured Deaths in Lugufu and Mtabila Camps, by Recall Period
Model Model parameters
Posterior Probability
Uncaptured Deaths (95%CI)
Degrees of
Freedom
Chi-2 P-
Value BIC
Pearson Adjusted
Chi-2
60 days recall period
1. No interactions 0.197 8 (4-16) 3 0.005 0.31 4.25
2. [EM x register] 0.027 7 (2-18) 2 0.002 4.31 6.30
3. [EM x surveillance] 0.116 13 (6-28) 2 0.008 1.38 4.83
4. [register x surveillance] 0.168 12 (5-25) 2 0.012 0.63 4.46
5. [EM x register] + [EM x surveillance] 0.017 18 (4-98) 1 0.002 5.23 9.38
6. [EM x register] + [register x surveil.] 0.022 14 (4-51) 1 0.003 4.67 8.82
7. [EM x surveil.] + [register x surveil.] 0.454 31 (11-99) 1 0.095 -1.36 2.78
8. [EM x register] + [EM x surveil.] + [register x surveillance] (saturated) Excluded 130 (18-1099) 0 1.000 0.00 Infinite
Bayesian model average 20 (7-58)
30 days recall period
1. No interactions 0.368 3 (1-7) 3 0.150 -4.68 1.77
2. [EM x register] 0.113 1 (0-7) 2 0.114 -2.31 2.17
3. [EM x surveillance] 0.113 4 (1-13) 2 0.114 -2.32 2.17
4. [register x surveillance] 0.314 4 (1-13) 2 0.316 -4.36 1.15
5. [EM x register] + [EM x surveillance] 0.026 2 (0-25) 1 0.047 0.62 3.96
6. [EM x register] + [register x surveil.] 0.066 3 (0-23) 1 0.150 -1.26 2.07
7. [EM x surveil.] + [register x surveil.] Excluded 11 (2-61) 1 0.913 -3.32 0.01
8. [EM x register] + [EM x surveil.] + [register x surveillance] (saturated) Excluded 12 (0-303) 0 1.000 0.00 -Infinite
Bayesian model average 3 (1-13) Among children under 5, BMA estimated 8 (95%CI 3-28) uncaptured deaths over 60 days, and 5 (95%CI 1-39) over 30 days (note that the latter estimate is higher than that for all deaths over the same period; note also that the estimation in any stratum, such as children, is unconstrained from that in the entire sample and can thus yield discordant results depending on model fit). 4.4.4. Estimated Sensitivity of the EM Method and Other Sources Sensitivities of the EM method and other sources are presented in Table 17, with gold standard provided by the total number of ascertained deaths, plus the estimated number of uncaptured deaths, as computed through BMA.

A New Method to Estimate Mortality in Crisis-Affected Populations: Validation and Feasibility Study
40
The EM method showed a consistently modest sensitivity, though in Mae La it was roughly comparable to that of a long-standing active surveillance system over the 30 day period, and higher than both surveillance and camp register sources in Tanzania. While sensitivity over 60 days was expected to be lower due to date misclassification, it was not appreciably higher when considering the main period of interest of 30 days. Interestingly, the combination of all three sources appeared to achieve good sensitivity in all sites. Table 17. Estimated Sensitivity of the EM Method, Other Sources and All Lists Combined, by Study Site and Recall Period
List 1 List 2 List 3 All lists Combined
Total Estimated
Deaths
n % (95%CI) n % (95%CI)
n % (95%CI)
n % (95%CI) N (95%CI)
District 1, Kabul EM Method Shopkeepers and Bakers Hospital
Records
60 days recall 67 62.6 (39.9-72.8)
33 30.8 (19.6-35.9)
8 7.5 (4.8-8.7)
82 76.6 (48.8-89.1)
107 (92-168)
30 days recall 11 55.0 (37.9-61.1)
12 60.0 (41.4-66.7)
6 30.0 (20.7-33.3)
18 90.0 (62.1-100.0)
20 (18-29)
Mae La Camp EM Method Religious Leaders Surveillance
System
60 days recall 27 45.0 (37.0-48.2)
23 38.3 (31.5-41.1)
41 68.3 (56.2-73.2)
52 86.7 (71.2-92.9)
60 (56-73)
30 days recall 16 64.0 (50.0-69.6)
14 56.0 (43.8-60.9)
18 72.0 (56.2-78.3)
23 92.0 (71.9-100.0)
25 (23-32)
Chiradzulu District
EM Method Graveyard Chairmen
Health Structure
Records, HSAs
60 days recall 93 65.0 (47.9-75.6)
72 50.3 (37.1-58.5)
44 30.8 (22.7-35.8)
110
76.9 (56.7-89.4)
143 (123-194)
30 days recall 36 67.9 (37.1-81.8)
27 50.9 (27.8-61.4)
17 32.1 (17.5-38.6)
42 79.2 (43.3-95.5)
53 (44-97)
Tanzania Camps EM Method Camp Register Surveillance
System
60 days recall 44 53.0 (36.4-62.9)
35 42.2 (28.9-50.0)
29 34.9 (24.0-41.4)
63 75.9 (52.1-90.0)
83 (70-121)
30 days recall 21 67.7 (51.2-72.4)
16 51.6 (39.0-55.2)
13 41.9 (31.7-44.8)
28 90.3 (68.3-96.6)
31 (29-41)
Among children under 5, the EM method’s estimated sensitivity was 20/38 (52.6%, 95%CI 17.1-71.4) in Kabul (60 days period), 26/39 (66.7%, 95%CI 27.1-81.2) in Chiradzulu (60 days), and, in Tanzania, 22/41 (53.7%, 95%CI 36.1-61.1) over 60 days and 8/17 (47.1%, 95%CI 15.7-61.5) over 30 days. Other sensitivity estimates could not be computed due to the low number of child deaths, precluding capture-recapture analysis. However, even considering the total number of ascertained deaths as the

A New Method to Estimate Mortality in Crisis-Affected Populations: Validation and Feasibility Study
41
minimum denominator, sensitivity was no better than 1/5 (20.0%) in Kabul (30 days), 2/16 (12.5%) and 0/4 (0.0%) in Mae La (60 and 30 days respectively), and 12/15 (80.0%) in Chiradzulu (30 days). 4.4.5. Estimated Mortality Rates Mortality rates were consistent with non-emergency situations in all sites, and reflected expected patterns given the underlying epidemiological and demographic profile (Table 18). Mortality rates among children under 5 were approximately double the all-age CMR, as typically observed in developing country settings. Table 18. Estimated Crude and Under 5 Years Mortality Rates (as Deaths per 10,000 Person-Days) Based on the EM Method, All Lists Combined and the Capture-Recapture Estimate, by Study Site and Recall Period
Crude mortality rate (95%CI) Under 5 years mortality rate (95%CI)
EM Method All Lists
Combined Capture-
Recapture EM Method All Lists Combined
Capture-Recapture
District 1, Kabul
60 days recall 0.15 (0.12-0.19) 0.18 (0.15-0.23) 0.24 (0.19-0.34) 0.24 (0.17-0.33) 0.31 (0.22-0.43) 0.49 (0.29-1.30)
30 days recall 0.05 (0.04-0.06) 0.08 (0.07-0.10) 0.09 (0.08-0.12) 0.02 (0.02-0.03) 0.12 (0.09-0.17) n/a
Mae La Camp
60 days recall 0.10 (0.09-0.11) 0.20 (0.18-0.22) 0.23 (0.20-0.28) 0.06 (0.06-0.07) 0.49 (0.45-0.55) n/a
30 days recall 0.12 (0.11-0.13) 0.18 (0.16-0.19) 0.19 (0.17-0.23) 0.00 (0.00-0.00) 0.25 (0.22-0.28) n/a
Chiradzulu Dist.
60 days recall 0.30 (0.23-0.39) 0.39 (0.29-0.52) 0.51 (0.38-0.67) 0.54 (0.30-0.93) 0.61 (0.36-1.06) 0.84 (0.48-1.64)
30 days recall 0.26 (0.17-0.38) 0.31 (0.22-0.46) 0.39 (0.25-0.71) 0.55 (0.25-1.31) 0.69 (0.34-1.37) n/a
Tanzania Camps
60 days recall 0.09 (0.09-0.10) 0.13 (0.12-0.14) 0.18 (0.15-0.24) 0.23 (0.21-0.24) 0.34 (0.32-0.37) 0.43 (0.38-0.54)
30 days recall 0.09 (0.08-0.09) 0.12 (0.11-0.13) 0.13 (0.12-0.15) 0.17 (0.15-0.18) 0.25 (0.23-0.27) 0.39 (0.30-0.71)
4.5. FEASIBILITY 4.5.1. Economic Feasibility There was significant variance in the time-inputs among the study sites (Table 19). For example, the study in Mae La camp required only 168 person-hours to be completed compared to 2,295 in Chiradzulu District. This variance reflects the different situations in which the study took place. Comparisons of time-inputs with retrospective surveys are provided in Table 19. The EM method appeared to require less time than retrospective surveys in three of the four study sites. The EM method was estimated to require 656 (31%) fewer person-hours in Kabul, 432 (72%) in Mae La camp, and 230 (34%) in the Tanzania camps. These time savings reflect the reduced training, data

A New Method to Estimate Mortality in Crisis-Affected Populations: Validation and Feasibility Study
42
collection and analysis time required for the EM method in comparison with retrospective surveys. However, in Chiradzulu district, the EM method was estimated to require 561 (32%) more person-hours than a survey method. This was mainly due to collecting data for the population estimation, an activity that accounted for 1,003 person-hours. Respondent time should be treated with caution: opportunity costs for respondents may not be very substantial, as they are unlikely to have had to leave work to participate in the two methods being compared (it should be noted, however, that some survey teams request the population to remain at home during the time when the survey team is due to visit: this is probably unsound from an ethical perspective). Table 19. Comparison between EM Method and Retrospective Survey in Terms of Time Inputs (Person-Hours), by Activity
District 1, Kabul Mae La Camp Chiradzulu District Tanzania Camps Activity/Staff Type EM Survey EM Survey EM Survey EM Survey
Preparation
Study investigators 90 90 8 8 45 45 24 24
Data collectors 25 25 4 4 62 62 6 6
Drivers 59 59 0 0 50 50 0 0
Collaborators 25 25 4 4 28 28 29 29
Sub-total 199 199 16 16 185 185 59 59
Population estimation †
Study investigators 36 0 0 0 27 0 0 0
Other study staff 6 0 0 0 849 0 0 0
Data collectors 63 0 0 0 68 0 0 0
Respondents 2 0 0 0 1 0 0 0
Drivers 0 0 0 0 58 0 0 0
Sub-total 105 0 0 0 1,003 0 0 0
Focus Group Discussion *
Study investigators 34 0 9 0 8 0 5 0
Other study staff 22 0 9 0 0 0 10 0
Participants 24 0 67 0 33 0 83 0
Data collectors 87 0 3 0 21 0 15 0
Collaborators 6 0 0 0 0 0 5 0
Drivers 6 0 0 0 5 0 0 0
Sub-total 179 0 88 0 67 0 118 0
Training
Study investigators 27 32 2 32 29 32 18 32
Data collectors 146 384 2 192 131 192 53 192
Other study staff 0 2 0 14 0 0 0
Sub-total 171 416 6 224 174 224 71 224
(continued)
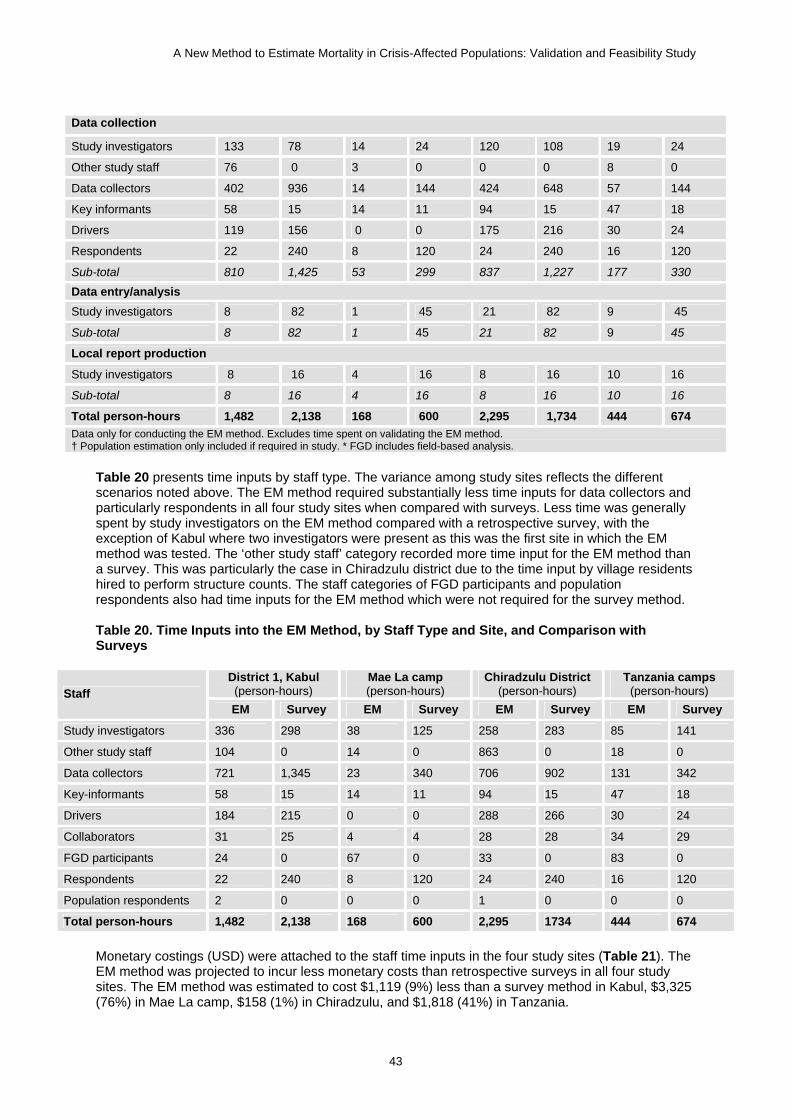
A New Method to Estimate Mortality in Crisis-Affected Populations: Validation and Feasibility Study
43
Data collection
Study investigators 133 78 14 24 120 108 19 24
Other study staff 76 0 3 0 0 0 8 0
Data collectors 402 936 14 144 424 648 57 144
Key informants 58 15 14 11 94 15 47 18
Drivers 119 156 0 0 175 216 30 24
Respondents 22 240 8 120 24 240 16 120
Sub-total 810 1,425 53 299 837 1,227 177 330
Data entry/analysis Study investigators 8 82 1 45 21 82 9 45
Sub-total 8 82 1 45 21 82 9 45
Local report production
Study investigators 8 16 4 16 8 16 10 16
Sub-total 8 16 4 16 8 16 10 16
Total person-hours 1,482 2,138 168 600 2,295 1,734 444 674 Data only for conducting the EM method. Excludes time spent on validating the EM method. † Population estimation only included if required in study. * FGD includes field-based analysis.
Table 20 presents time inputs by staff type. The variance among study sites reflects the different scenarios noted above. The EM method required substantially less time inputs for data collectors and particularly respondents in all four study sites when compared with surveys. Less time was generally spent by study investigators on the EM method compared with a retrospective survey, with the exception of Kabul where two investigators were present as this was the first site in which the EM method was tested. The ‘other study staff’ category recorded more time input for the EM method than a survey. This was particularly the case in Chiradzulu district due to the time input by village residents hired to perform structure counts. The staff categories of FGD participants and population respondents also had time inputs for the EM method which were not required for the survey method. Table 20. Time Inputs into the EM Method, by Staff Type and Site, and Comparison with Surveys
District 1, Kabul (person-hours)
Mae La camp (person-hours)
Chiradzulu District (person-hours)
Tanzania camps (person-hours) Staff
EM Survey EM Survey EM Survey EM Survey
Study investigators 336 298 38 125 258 283 85 141
Other study staff 104 0 14 0 863 0 18 0
Data collectors 721 1,345 23 340 706 902 131 342
Key-informants 58 15 14 11 94 15 47 18
Drivers 184 215 0 0 288 266 30 24
Collaborators 31 25 4 4 28 28 34 29
FGD participants 24 0 67 0 33 0 83 0
Respondents 22 240 8 120 24 240 16 120
Population respondents 2 0 0 0 1 0 0 0
Total person-hours 1,482 2,138 168 600 2,295 1734 444 674 Monetary costings (USD) were attached to the staff time inputs in the four study sites (Table 21). The EM method was projected to incur less monetary costs than retrospective surveys in all four study sites. The EM method was estimated to cost $1,119 (9%) less than a survey method in Kabul, $3,325 (76%) in Mae La camp, $158 (1%) in Chiradzulu, and $1,818 (41%) in Tanzania.

A New Method to Estimate Mortality in Crisis-Affected Populations: Validation and Feasibility Study
44
Table 21. Comparison between EM Method and Retrospective Survey in Terms of Monetary Inputs (USD), by Activity and Study Site
District 1, Kabul Mae La Camp Chiradzulu District Tanzania Camps Activity/Staff Type EM Survey EM Survey EM Survey EM Survey
Preparation
Study investigators 2,034 2,034 181 181 1,017 1,017 542 542
Data collectors 94 94 18 18 143 143 19 19
Drivers † 275 275 0 0 1348 1348 0 0
Collaborators 135 135 40 40 160 160 102 102
Sub-total 2,538 2,538 239 239 2,668 2,668 663 663 Population estimation
Study investigators 802 0 0 0 610 0 0 0
Other study staff 32 0 0 0 264 0 0 0
Data collectors 243 0 0 0 156 0 0 0
Drivers † 0 0 0 0 1,564 0 0 0
Sub-total 1,077 0 0 0 2,594 0 0 0 Focus Group Discussion
Study investigators 768 0 203 0 181 0 113 0
Other study staff 116 0 41 0 0 0 33 0
Data collectors 335 0 14 0 48 0 47 0
Collaborators 32 0 0 0 0 0 18 0
Drivers † 28 0 0 0 135 0 0 0
Sub-total 1,279 0 258 0 364 0 211 0 Training
Study investigators 610 723 45 723 655 723 407 723
Data collectors 554 1,478 9 864 301 442 164 595
Other study staff 0 0 9 0 0 0 0 0
Sub-total 1,164 2,201 63 1,587 956 1,165 571 1,318 EM data collection
Study investigators 3,006 1,763 316 542 2,712 2,441 429 542
Other study staff 399 0 14 0 0 0 26 0
Data collectors 1,548 3,604 63 648 975 1,490 177 446
Drivers † 560 735 0 0 4720 5832 105 84
Sub-total 5,513 6,102 393 1,190 8,407 9,763 737 1,072 EM data entry/analysis
Study investigators 181 1,844 23 1,012 475 1,844 203 1,012
Sub-total 181 1,844 23 1,012 475 1,844 203 1,012 Local report production
Study investigators 181 362 90 362 181 362 226 362
Sub-total 181 362 90 362 181 362 226 362
Total cost (USD) 11,933 13,047 1,066 4,390 15,646 15,802 2,610 4,428 Details on costing calculations provided in Annex 8.11. Excludes time spent on validating the EM method. † Includes costs of vehicles hire, driver fees, petrol.

A New Method to Estimate Mortality in Crisis-Affected Populations: Validation and Feasibility Study
45
Table 22 presents cost inputs by staff type. These reflect the findings from the time-inputs in Table 20. Table 22. Cost Inputs (USD) into the EM Method, by Staff Type and Site, and Comparison with Surveys
District 1, Kabul (USD)
Mae La Camp (USD)
Chiradzulu District (USD)
Tanzania Camps (USD) Staff Type
EM Survey EM Survey EM Survey EM Survey
Study investigators 7,582 6,726 859 2,820 5,831 6,387 1,921 3,182
Other study staff 546 0 63 0 264 0 59 0
Data collectors 2,774 5,178 104 1,530 1,624 2,075 406 1,060
Drivers † 864 1,013 0 0 7,767 7,182 105 84
Collaborators 167 135 40 40 160 160 119 102
Total 11,933 13,052 1,066 4,390 15,646 15,804 2,610 4,428
Details on costing calculations provided in Annex 8.11. The number of hours worked by each staff type is provided in Table 20. † Includes costs of vehicles hire, driver fees, petrol.
Table 23 presents the time and cost inputs per death recorded for the four study sites. The time required per death recorded using the EM method varied between 5 hours in the Tanzania camps and 25 hours in Chiradzulu district. This time per death in Chiradzulu district reflects the large distances covered to collect the data, including population estimation data. Time per death is much lower in the densely populated camps in Mae La and Tanzania where existing population data were available. The cost per death using the EM method again reflected the different scenarios of the sites. Table 23. Comparison between the Four Study Sites for the Time and Cost per Death Recorded
District 1, Kabul Mae La Camp Chiradzulu District Tanzania Camps
Number of deaths recorded 67 27 93 44
Time (person-hours) 1,482 168 2,295 444
Cost (USD) 11,933 1,065 15,645 2,610
Time per death (hours) 22 6 25 5
Cost per death (USD) 178 39 168 28 4.5.2. Ethical Implications of the EM Method The ethical issue of burden to respondent can be explored by comparing the time input by respondents between the EM method and a retrospective survey. The type of information requested from households is similar for the EM and survey method. However, the time input by respondents was considerably less in all four study sites for the EM method than estimated for a survey. In Kabul, the EM method was estimated to require 218 (91%) fewer respondent-hours than a survey method; corresponding figures were 112 (93% fewer) in Mae La camp, 104 (87% fewer) in Chiradzulu, and 216 (90% fewer) in the Tanzania camps. Other key ethical issues include confidentiality arrangements. Both the EM method and survey involve household collection of data and so face the same challenge of ensuring confidentiality. However, the EM method’s reliance on key informants means that other members of the community (the key informants as well as any bystanders who may be involved in the data search) will be aware of interviews taking place in the identified households. We found that it was often difficult to persuade the key informant to not be present during the interview, and thus ensure full confidentiality (on the other hand, the EM method would not result in involuntary disclosure of deaths, since it by definition relies on existing community knowledge). In routine application of the method, the information requested of the household could be very limited (e.g., age, sex), and thus not exceed that already

A New Method to Estimate Mortality in Crisis-Affected Populations: Validation and Feasibility Study
46
known to the key informant, reducing the risk of disclosure of confidential information to persons other than the study team. However, there is a separate risk that one household could have told another household about a death in confidence, and when the latter household refers interviewers to the former household, the former could feel like their information had been disclosed against their will. A potential risk of the EM method concerns willingness to take part in the study. The method exploits hierarchical social structures, the dynamics of which may be poorly comprehensible to a naïve investigator. Deference towards and/or fear of authorities may mean that households might be unable to refuse participation in the study, or to decide which information about the decedent they wish to disclose (while introducing bias into estimation, deliberately false answers may be a justifiable way for the household to protect itself against the consequences of sharing certain information with strangers). For example: (i) in a community where leaders must be politically aligned to a given warring faction, key informants relied upon by the EM method might force households to disclose certain kinds of deaths, such as killings perpetrated by an opposing faction; (ii) households who have experienced a stigmatizing HIV/AIDS death might prefer to report the cause of death as malaria, but would be prevented from doing so from fear that their information will be cross-checked with a community authority. During our site validation we did not observe or hear of incidents suggesting any of these dynamics, although we recognize that such delicate issues are difficult to gauge in the short amount of time we spent in each study location. To some extent these issues also arise in standard retrospective surveys, although in the latter the relationship between investigators and respondents is more direct, with less mediation by community authorities. 4.5.3. Feasibility of Adding Verbal Autopsy to EM Method Verbal autopsy interviews were conducted in the Chiradzulu district site. If a death was recorded by the EM questionnaire interview as taking place within the 30 day recall period, the respondent was asked to also participate in a separate interview for the verbal autopsy questionnaire. This verbal autopsy interview took place in the same location immediately after the EM questionnaire was completed and was conducted by the interviewer trained in administering verbal autopsy questionnaires. Respondents rarely had to wait long to be interviewed for the verbal autopsy questionnaire. The verbal autopsy interviews also did not impede the data collection for the EM method. Each interview for the verbal autopsy questionnaire took an average of 38 minutes, and 45 verbal autopsy questionnaires were completed. The analysis was conducted after the data collection exercise by the verbal autopsy interviewer and the MSF-F doctor. Each verbal autopsy questionnaire took an average of 44 minutes to analyze (includes time input by both questionnaire reviewers and in them reaching agreement). The total time to conduct the verbal autopsy component was therefore 61.5 person-hours. The results from this study suggest that the additional time required for the verbal autopsy was feasible given the reduced time required for conducting the EM method when compared to a retrospective survey.

A New Method to Estimate Mortality in Crisis-Affected Populations: Validation and Feasibility Study
47
5. Mathematical Simulation The following simulation results apply only to the routine application of the EM method (however, measuring mortality based on sources other than the EM exhaustive search would be expected to entail similar statistical requirements). Simulations were performed mainly to (i) recommend an amount of person-time investigated sufficient to minimize the influence of stochastic error, under various assumptions about the method’s implementation and the underlying mortality levels; and (ii) guide inference based on the method’s findings. A fundamental assumption about the properties of the typical distribution of deaths over any discrete time unit underpins both of the above: we first sought to verify this assumption. 5.1. DISTRIBUTION OF DEATH COUNTS IN THE TIME DIMENSION To guide further simulation work, we first sought to verify whether mortality is distributed over time according to the classical Poisson assumption (Poisson distributions are generally very appropriate for rare events such as deaths). We obtained six existing datasets of death counts from emergency prospective mortality surveillance systems implemented among camp-residing displaced populations by Epicentre and Médecins Sans Frontières France in Murnei, Niertiti, and Zalingei (West Darfur, 2004), and by the UNHCR in Lugufu and Mtabila (Tanzania, 2008) and Fugnido (Ethiopia, 2007-2008). Details of the datasets are provided in Table 24. Table 24. Details of Six Mortality Surveillance Datasets Used to Study the Distribution of Death Counts Over Time
Dataset Implementing Agency
Time Unit Time Span (Duration) Average Population Under Surveillance
Fugnido, Ethiopia UNHCR month January 2007-May 2008 (17 months)
21,700
Lugufu, Tanzania UNHCR month January 2006-May 2008 (29 months)
50,300
Mtabila, Tanzania UNHCR month January 2006-May 2008 (29 months)
20,600
Murnei, West Darfur Epicentre / MSF-F week January-August 2004 (30 weeks)
65,800
Niertiti, West Darfur Epicentre / MSF-F week May-September 2004 (16 weeks)
16,600
Zalingei, West Darfur Epicentre / MSF-F week April-October 2004 (27 weeks)
52,300
We first standardized counts to deaths per 10,000 person-weeks (Darfur) or person-months (Tanzania, Ethiopia) by dividing them by the population reported under surveillance. We then de-trended each time series by considering only the residuals from a simple ordinary least-squares model (i.e., after fitting a straight line to the time series, we worked only with the errors between observations and fitted values). Finally, we tested by maximum likelihood the goodness of fit of a Poisson distribution applied to each time series of residuals. The goodness of fit was moderate, probably due to short duration of the time series (Table 25). On balance, however, there was little evidence to reject the Poisson assumption, and this was further evidenced graphically (see Annex 8.13).2 Based on this analysis, we retained the Poisson assumption for further simulation work aiming to guide determination of minimum person-time to be investigated and inference decisions for the method.
2 The smaller the p-value, the smaller the chance that the Poisson distribution fits the observed data by chance alone, i.e. the better the fit of the Poisson distribution.

A New Method to Estimate Mortality in Crisis-Affected Populations: Validation and Feasibility Study
48
Table 25. Goodness of Fit of a Poisson Model Applied to Six Mortality Surveillance Datasets
Dataset Likelihood Ratio Degrees of Freedom P-Value †
Fugnido, Ethiopia 2.089 1 0.148
Lugufu, Tanzania 4.162 2 0.125
Mtabila, Tanzania 3.055 4 0.549
Murnei, West Darfur 10.290 5 0.067
Niertiti, West Darfur 7.274 4 0.122
Zalingei, West Darfur 8.565 4 0.073 † The smaller the p-value, the smaller the chance that the Poisson distribution fits the observed data by chance alone, i.e. the better the fit of the Poisson distribution. 5.2. SIMULATION TO DETERMINE PERSON-TIME REQUIREMENTS FOR THE EM METHOD We used R freeshare software to implement mathematical simulations designed to inform minimum person-time requirements for the EM method. The simulations assumed a true mortality rate, and computed the probability of classifying the mortality as being equal to or above a threshold of interest set by the investigator, given the true mortality rate and various assumptions about the amount of person-time investigated. 5.2.1. Scenarios for Implementation of the EM Method We considered two scenarios in which the EM method might be implemented routinely:
An exhaustive scenario in which the entire population is surveyed: this would occur when the population is relatively small (e.g., less than 100,000) and/or regimented, thus reducing travel distances and times, as in Mae La, Kabul, Lugufu and Mtabila;
A sampling scenario in which a representative sample of the entire population is selected, and the method is applied therein, with projection of the findings to the entire sampling universe; this would be the expected choice for a large and/or very scattered population, as in Chiradzulu District, where it would have been unfeasible to survey the more than 500 villages comprising the district’s population.
5.2.2. Classification Tests We considered that a user of the method would wish to classify mortality in the surveyed population as equal to or above a given threshold of interest (e.g., ≥1 per 10,000 person-days) with high sensitivity (i.e. high probability of classifying true crisis situations as crises) and acceptable specificity (i.e. relatively low probability of misclassifying non-crisis situations as crises and thereby spending resources on a partially unnecessary relief operation). Accordingly, we defined the null hypothesis as “the true mortality rate is lower than the threshold of interest”, and applied to this hypothesis the following three alternative tests:
A Poisson test, whereby the probability of finding less than the observed number of deaths was computed based on a Poisson probability distribution; this distribution was centered around the expected number of deaths given the threshold rate of interest and the investigated person-time (population x recall period). If the test probability is lower than the specified alpha level, the null hypothesis is rejected and mortality is classified as equal to or greater than the threshold;
A sequential sampling test, consisting of a slight modification of the above; here, the minimum number of observed deaths that would lead to a rejection of the null hypothesis at the specified alpha level is computed ahead of data collection. If this minimum is exceeded, mortality is classified as equal to or greater than the threshold. Note that this approach allows

A New Method to Estimate Mortality in Crisis-Affected Populations: Validation and Feasibility Study
49
for early survey stopping and thus potential resource and time savings (This option was not explored further);
A CI test, whereby the mortality rate point estimate and CI at the specified alpha level are
computed using exact methods: if the point estimate is higher than the threshold and the CI also does not include the threshold, mortality is classified as equal to or greater than the threshold.
In practice, rejecting the null hypothesis would lead to a recommendation to deploy health interventions appropriate for a crisis situation as defined by the threshold of interest (e.g. if the test classifies mortality as being ≥5 deaths per 10,000 person-days, one would conclude conditions are catastrophic, warranting exceptional and urgent intervention). Failure to reject the null hypothesis merely indicates that the threshold of interest is not exceeded. 5.2.3. Expression of Person-Time Requirements Throughout this document, we express mortality as deaths per 10,000 person-days. Person-time sample size for a mortality survey is composed of the number of people being investigated, and the recall period over which deaths are ascertained; it varies according to whether the indicator of interest is CMR or U5MR. U5MR is sometimes recommended as a more sensitive and timely crisis indicator, but there are equally compelling reasons to monitor CMR. Simulating different population sizes, recall periods and choices of threshold mortality rates under two scenarios (exhaustive and sampling) whilst also considering two possible indicators (CMR or U5MR) would have entailed a large amount of partly redundant simulations, difficult to summarize graphically. Instead, we merely considered minimum person-time requirements in terms of (i) person-time to be investigated and (ii) the threshold of interest. For example, a recommendation to survey at least 500,000 person-days if one wishes to accurately classify mortality according to a threshold of 1 death per 10,000 person-days would mean that the user of the method could choose to survey 50,000 people over a 10 day recall period, 10,000 people over 50 days, 100,000 people over 5 days, etc. If the survey primarily aims to measure U5MR, the threshold would usually be doubled (see Sphere Project guidelines[1]), and a sufficiently large population and/or recall period should be sampled to capture the minimum recommended person-time under 5 years. 5.2.4. Parameter Values for Simulation Table 26 lists the chosen values for the simulation’s parameters. In general, we decided to privilege sensitivity (probability that the survey will correctly classify mortality as being equal to or above the threshold of interest when indeed it is) over specificity (probability that the survey will correctly classify mortality as being below the threshold when indeed it is), i.e. minimize the risk of overlooking a true crisis rather than the risk of needlessly expending resources. To this end, after preliminary simulations (results omitted for brevity’s sake) we settled upon an unconventionally large alpha level of 0.40 (Table 26), meaning an inherent acceptance of up to 40% risk that the survey’s classification of mortality as being equal to or greater than the threshold of interest might be the result of chance alone. Exhaustive Scenario In the exhaustive scenario, we kept population size constant at 100,000, and evaluated different amounts of person-time investigated by varying the recall period. We assumed that the population size would ordinarily be subject to error (being the sum of sampling and non-sampling errors), normally distributed around the true population. Sampling Scenario In the sampling scenario, we assumed that the population would be divided into PSUs such as villages, and that a spatial sampling design would be adopted, such as the CSAS (see sampling design for the Chiradzulu District survey). Further, we assumed that the total population size of the sampled PSUs would be estimated using the following method: (i) residential structure count within

A New Method to Estimate Mortality in Crisis-Affected Populations: Validation and Feasibility Study
50
each PSU (featuring an error of ±3.5%), combined with (ii) systematic sampling of every nth structure counted to estimate the number of people per structure (error ±7.5%). Because of long computation times, we were restricted to only a few simulations: (i) we assumed that the sampling universe would consist of approximately 100,000 people split among 300 villages; (ii) we evaluated three possible numbers of PSUs sampled, 30 being the minimum considered statistically robust; and (iii) we looked at a single recall period of 30 days. We performed multiple iterations of each simulation to incorporate uncertainty in the population estimates and, in the sampling scenario, random selection of PSUs and variability in PSU population size. In each iteration, we sampled randomly from each uncertainty distribution to compute the three test statistics. Results presented below are the median of 5,000 iteration results. Table 26. Parameter Values for the Exhaustive and Sampling Scenario Simulations
Parameter Value(s) Notes / Assumptions
Parameters specific to the exhaustive scenario
Population 100 000
Error in population estimate Standard deviation = ±7.5% Normally distributed around the true population; based on expert consensus about typical magnitude of error†
Recall period 1, 5, 10, 20, 30, 50, 100 days
Parameters specific to the sampling scenario
Number of PSUs (villages) in sampling universe
300
Number of PSUs sampled 30, 45, 60
PSU population Sampled randomly from a log-normal distribution with median = 300; minimum = 150; maximum = 5000; ln(standard deviation) = 3
Yields a population of about 100 000, given 300 villages
Error in estimation of mean residential structure size
±3.5% Systematic error; applies to all sampled PSUs combined; normally distributed
Error in estimation of number of residential structures
±7.5% Random error; applies to each PSU individually; normally distributed
Recall period 28 days
Parameters common to both scenarios
Threshold mortality rate of interest
0.5, 1, 2, 4, 8 per 10 000 person-days
True mortality rate Range = [threshold rate/2, threshold rate x 2] Unit increment = range/20
Unit increment chosen to provide sufficient resolution
Alpha 0.40 (i.e. 60%CI) See text
Number of iterations for each simulation (combination of recall period, threshold and true mortality rates)
5000 Only median of distribution of iterations is reported
† http://documents.wfp.org/stellent/groups/public/documents/ena/wfp111670.pdf

A New Method to Estimate Mortality in Crisis-Affected Populations: Validation and Feasibility Study
51
5.2.5. Simulation Results: Exhaustive Scenario Figure 8, Figure 9, Figure 10, Figure 11 and Figure 12 show operating characteristic (OC) curves summarizing the performance of the three alternative tests over increasing person-time sampled (as person-days) for different threshold mortality rates of interest. Summary sensitivity and specificity results are shown in Annex 14. The OC curves show the probability that an EM survey will classify mortality as equal to or above the threshold (y axis), as a function of the true underlying mortality rate (x axis), for a given amount of person-days sampled and threshold of interest. The steeper the curve, the smaller the probability of both false negatives and false positives, and thus the higher both sensitivity and specificity. As expected, OC curves become steeper as person-time and/or the underlying mortality rate increase. For any mortality threshold, OC curves became appreciably steep around 1,000,000 person-days sampled: this amount of person-time investigated is associated with sensitivity no worse than 90%, with consistently high specificity (>95%). Sensitivity deteriorates rapidly below about 500,000 person-days. The three alternative tests behave in a similar fashion. However, the Poisson test is consistently more conservative than the others. On balance, this simulation suggests that the EM method, if implemented according to the exhaustive scenario, should attempt to survey no less than 1,000,000 person-days: this is equivalent to 100,000 people with a 10 day recall period, 50,000 with 20 days, or 25,000 with 40 days. 5.2.6. Simulation Results: Sampling Scenario Figure 13, Figure 14, Figure 15, Figure 16 and Figure 17 show OC curves for increasing amounts of person-time (number of PSUs) sampled and different mortality thresholds of interest, under the sampling scenario. All three choices of person-time perform reasonably, though the amount of classification error at low mortality rates is probably unacceptable. For this reason, we recommend a simple rule of sampling at least 30 PSUs (this is also advisable on statistical robustness grounds), and that the PSUs sampled comprise a total minimum population of at least 20,000 people. Clearly, sampling more PSUs would be preferable, given the same number of people surveyed, as it would reduce design effects. In our simulation we did not explore the effect of high design effect, as one might expect after an epidemic or acts of war.

A New Method to Estimate Mortality in Crisis-Affected Populations: Validation and Feasibility Study
52
Figure 8. Simulation Results for the Exhaustive Scenario (Threshold: 0.5 per 10,000 Person-Days)

A New Method to Estimate Mortality in Crisis-Affected Populations: Validation and Feasibility Study
53
Figure 9. Simulation Results for the Exhaustive Scenario (Threshold: 1 per 10,000 Person-Days)

A New Method to Estimate Mortality in Crisis-Affected Populations: Validation and Feasibility Study
54
Figure 10. Simulation Results for the Exhaustive Scenario (Threshold: 2 per 10,000 Person-Days)

A New Method to Estimate Mortality in Crisis-Affected Populations: Validation and Feasibility Study
55
Figure 11. Simulation Results for the Exhaustive Scenario (Threshold: 4 per 10,000 Person-Days)
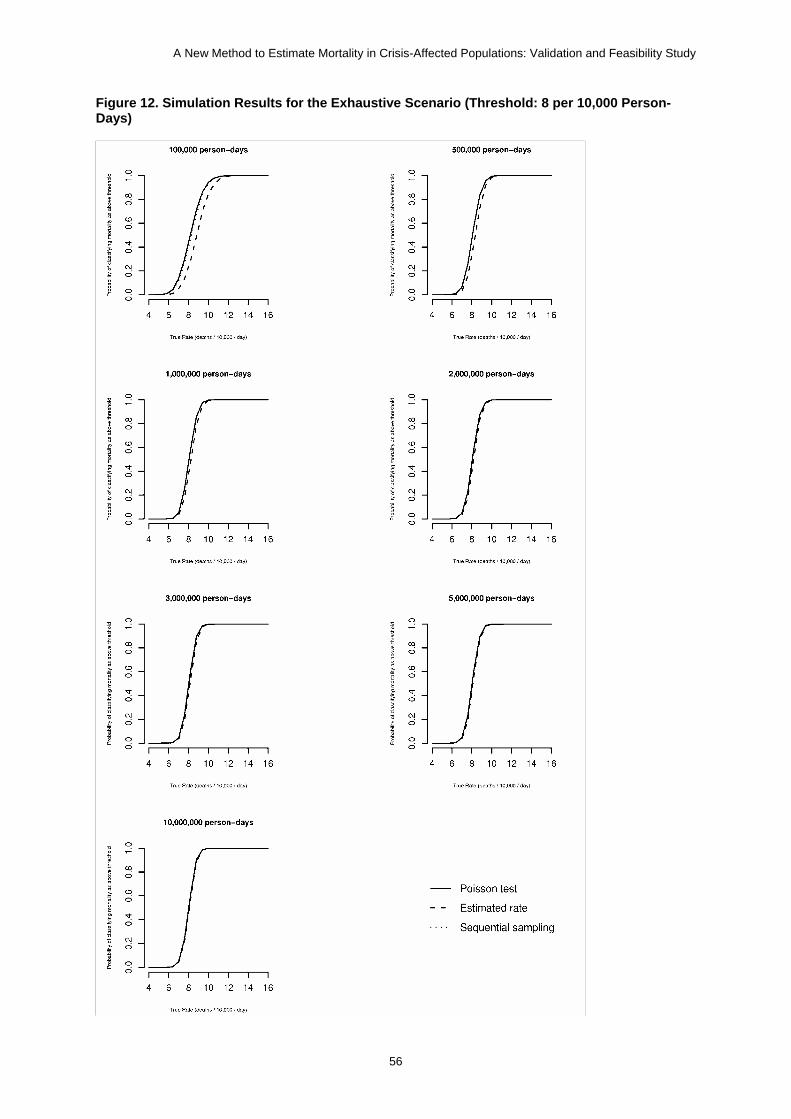
A New Method to Estimate Mortality in Crisis-Affected Populations: Validation and Feasibility Study
56
Figure 12. Simulation Results for the Exhaustive Scenario (Threshold: 8 per 10,000 Person-Days)
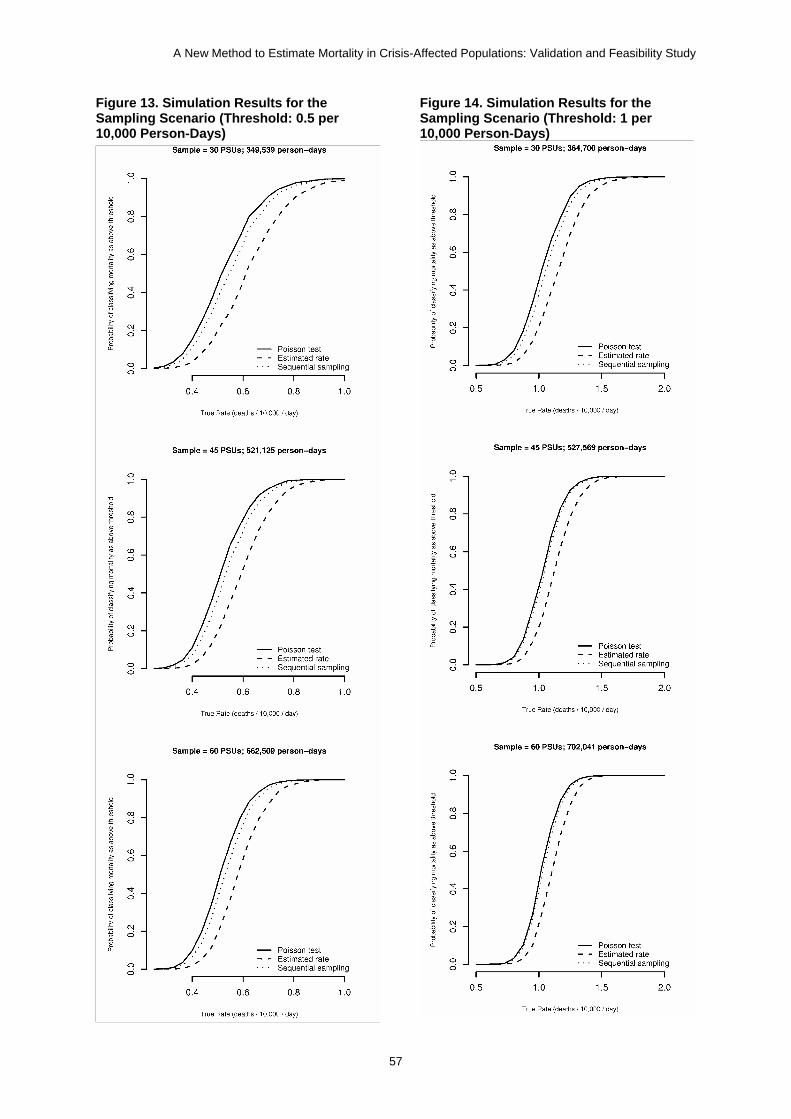
A New Method to Estimate Mortality in Crisis-Affected Populations: Validation and Feasibility Study
57
Figure 13. Simulation Results for the Sampling Scenario (Threshold: 0.5 per 10,000 Person-Days)
Figure 14. Simulation Results for the Sampling Scenario (Threshold: 1 per 10,000 Person-Days)

A New Method to Estimate Mortality in Crisis-Affected Populations: Validation and Feasibility Study
58
Figure 15. Simulation Results for the Sampling Scenario (Threshold: 2 per 10,000 Person-Days)
Figure 16. Simulation results for the Sampling Scenario (Threshold: 4 per 10,000 Person-Days)

A New Method to Estimate Mortality in Crisis-Affected Populations: Validation and Feasibility Study
59
Figure 17. Simulation Results for the Sampling Scenario (Threshold: 8 per 10,000 Person-Days)
A New Method to Estimate Mortality in Crisis-Affected Populations: Validation and Feasibility Study
60
5.3. CALCULATORS TO GUIDE INFERENCE DECISIONS BASED ON THE METHOD Because the Poisson test proved to be the most conservative (i.e. maximized sensitivity), we adopted it for inference decisions. Accordingly, we developed an open-access HTML calculator, applicable to the exhaustive scenario detailed above, that classifies mortality according to a set threshold of interest, given the population size and recall period investigated. The calculator is available at http://www.fantaproject.org/publications/EM_method.shtml, and attached to the electronic version of this report as an offline HTML page. Users are given the option to specify an alpha level, depending on whether they would like the classification to privilege sensitivity or specificity. We also developed a calculator that computes the 95%CI for the mortality rate estimated by the EM method. The CI is based on a Poisson assumption, to provide users with a somewhat more familiar estimation result (http://www.fantaproject.org/publications/EM_method.shtml). Note that this CI is not a reflection of error arising from sampling a portion of the population (in the exhaustive scenario, the entire population is surveyed). Rather, it indicates the degree to which chance could have affected the observed mortality rate: as person-time investigated decreases, the CI widens. Due to time constraints we did not develop similar calculators for the sampling scenario: it should be noted that the analysis of EM surveys done in a sample of PSUs will depend heavily on the sampling design (e.g., a different number of PSUs may be sampled; weights may be needed if the sample is not self-weighting, as in CSAS; standard errors may need adjustment for design effect), and that, given that the numerator and denominator arise from different sampling processes, a bootstrapping method (see analysis of Chiradzulu survey: Section 3.3.7) is probably best. These complexities are difficult to incorporate in a single calculator. However, we believe that, in the majority of scenarios, failure to adjust for non-self-weighting samples and possible clustering of deaths will result in only mild error (sampling designs requiring heavy weighting or surveys with high design effects are on the whole infrequent, with most measured design effects in mortality surveys being relatively small, i.e. <2 [24]). Thus, the calculators above should perform reasonably even if applied to the sampling scenario.

A New Method to Estimate Mortality in Crisis-Affected Populations: Validation and Feasibility Study
61
6. Discussion 6.1. OVERALL IMPORTANCE OF STUDY This study presents findings on the validity and feasibility of a new method to estimate mortality in crisis-affected populations. To our knowledge this is the only recent study that aimed to develop a new mortality estimation method based on primary data collection, and targeted to field users with limited epidemiological and statistical skills. Importantly, our study evaluated the proposed EM method in different settings and populations, enhancing the generalizability of our findings. We sought to identify and implement a rigorous gold standard measure (capture-recapture analysis) for the validation. Corollary mathematical simulation work explored the statistical foundations of the method, and developed recommendations and online calculators for study design and inference. Below we discuss validity and feasibility findings, appraise the limitations of this study, and suggest future steps for the development of the method. 6.2. VALIDITY The EM method showed consistently modest sensitivity in the four study sites. While sensitivity over 60 days was expected to be lower due to date misclassification, it was not appreciably higher when considering the main period of interest of 30 days, and below 70% in all sites. The method compared favorably with existing surveillance systems in Tanzania, but was slightly less sensitive than surveillance in Mae La. Sensitivity was particularly disappointing among children under 5 years, with the partial exception of Chiradzulu. In Mae La, the method captured no more than 13% of child deaths (in this camp, the surveillance system is favored over other methods as it includes all health centers, where nearly all child deaths are reported to take place). This poor performance clearly precludes utilization of the method, as currently devised, for measurement of mortality under 5 years. Comparisons cannot easily be made with retrospective household surveys, as none were performed in the study populations during a comparable period; furthermore, surprisingly little is known about the validity of standard survey methods as put forth by the SMART initiative and similar agency guidelines. While the EM method appears to miss a considerable proportion of deaths, it is difficult to say whether it misses more than a standard survey would, if performed in the same population. What explains the moderate sensitivity of the EM method? Qualitative observations as well as theoretical reasoning suggest the following main explanations: The choice of key informants was sub-optimal:
o The FGDs were consistently attended by community leaders, who were the majority of
participants in Mae La, Kabul, and Tanzania camps. This unequal representation was difficult to avoid, as organizing the FGDs themselves would have been difficult without the leaders’ facilitation. However, participants may not have reflected the diversity of opinions in the community, and the presence of community leaders, due to their seniority, may have stifled other participants from expressing their views, resulting in over-reliance on the knowledge of community leaders by the study team and a lack of awareness of the potential limitations of community leaders as community informants.
o We arbitrarily settled on only two key informants (primary and secondary), judging this a priori to be sufficient. However, more (and more diverse) sources may have been warranted. Furthermore, in both Kabul and Chiradzulu key informants were mutually dependent for information on deaths (mullahs and wakils informed each other about recent deaths, as did village headmen and fumukazi).

A New Method to Estimate Mortality in Crisis-Affected Populations: Validation and Feasibility Study
62
Key informants had limited knowledge about deaths in their sectors. In addition to mere forgetfulness, this may have been due to the following:
o Key informants were unable to learn about all deaths:
They covered far too large a population. In Kabul, this was in the order of 3,000
people per wakil-e-guzar; section leaders controlled about 2,000 people each in Mae La, and 4,500 in Tanzania.
Most informants were community leaders who had considerable knowledge of the community, and whose involvement generally helped to gain the trust of respondents. However, the degree of trust between a community leader and community members clearly varied and could have affected his/her knowledge of deaths, willingness to support the study team, and willingness of households to share information with the community leader. For example, relations between community members and some of the wakil-e-guzars in District 1 of Kabul appeared strained; it should be noted that wakils requested that we delay our study by a few days due to community dissatisfaction about an insufficient food distribution: this may have further reduced reporting of recent deaths to some of the wakil-e-guzars, or their ability to solicit information.
Other contextual factors. In Kabul, old age appeared to impair some wakils’ ability to interact with community members. Although prayers are said over each decedent before burial, some mullahs in Kabul (secondary informants) reported that in certain households prayers were performed by literate family members or by Shi’a minority leaders within the sector. Both wakils and mullahs reported difficulty in learning about deaths of small children. In Mae La, section leaders had only been elected about one month before our survey and may not have had good knowledge of deaths during a 60-day period, while members of the Karen Woman’s Organization, our secondary informants, had only recently started recording information about deaths in the community.
o Key informants deliberately did not mention certain deaths, or households deliberately did not report certain deaths to key informants:
Household food rations in Mae La and the Tanzania camps are reduced after a household member dies, which may lead households to under-report deaths (note however that we systematically informed households that the survey was not connected to a registration or distribution process). In Tanzania, reporting a death may also affect the amount of repatriation assistance. Some refugees in Mae La are in possession of Thai identification cards and may not wish to invite attention. Note that these issues would probably also affect alternative mortality measurement methods such as surveys and surveillance.
Cases of suicide or addiction-related death may be cultural taboos and may thus not be reported. This issue would probably also affect alternative mortality measurement methods.
Household respondents contributed relatively little to the exhaustive search process, providing only a minority of all referrals (we had originally expected that households would primarily lead the search through a snowball process used successfully for other epidemiological studies performed on hard-to-find sub-groups [25, 26]). Possible reasons include:
o Limited knowledge of other households’ circumstances:
Given the relatively low mortality in the study sites where we tested the method, it may be inherently difficult for households to know about events in a sufficient number of other families: for example, in the Tanzania camps, over 60 days a death occurred for about every 200 households, meaning a household would

A New Method to Estimate Mortality in Crisis-Affected Populations: Validation and Feasibility Study
63
have to routinely hear about happenings in at least 200 households in order to not interrupt the process of snowball chain referral.
Population movement and ethnic segregation within the communities may mean households may know little about their neighbors. In Kabul, many inhabitants were short-term renters or recent immigrants from rural areas; in Mae La, during the year before our study almost a third of the refugees in the camp had been resettled to other countries and many households had recently arrived in the camp. However, household referrals were infrequent even in more stable settings such as Chiradzulu.
o Unwillingness to refer the study team to other bereaved households:
Households may have been reticent to share such information with strangers, fearing to upset the community leaders or the bereaved families themselves, and/or preferring not to override the information already provided by the key informants.
Cultural and/or religious barriers to speaking about deaths in other households.
o Unwillingness by the interviewers to probe about other deaths in the community. In Kabul and Chiradzulu, during many interviews we attended this seemed apparent, and we preferred not to interfere.
In all four sites, most deaths captured by the EM method were reported as having occurred 60 to 30 days before the survey date, rather than in the last 30 days. This may be a spurious finding, a reflection of seasonal patterns (e.g., in Tanzania and Chiradzulu, the dry season may have corresponded with a lower incidence of malaria, a major contributor to mortality), or an artefact due to systematically mistaken recall of dates (we attempted to minimize this through use of a detailed calendar). The pattern was most striking in Kabul, where only 16% of deaths took place in the last 30 days, suggesting some form of bias. Potential explanations for low sensitivity in Kabul have been mentioned above: furthermore, study team members felt that some wakils were receiving information from the community with a considerable delay, thus explaining these observations. 6.3. FEASIBILITY There was significant variance in the time-inputs among the study sites, reflecting their different conditions. The studies in Mae La camp in Thailand and Lugufu and Mtabila camps in Tanzania required only 168 person-hours and 444 person-hours respectively (i.e. about three person-weeks). This was because very little travel and data collection time was required due to the low number of deaths recorded and high population density of these camp settings. They also did not require population estimation to be conducted. The study in Tanzania required greater time inputs than Mae La camp principally because two camps were included. By contrast, the study in Chiradzulu District recorded 93 deaths in 96 villages covering an area of approximately 875 km2, and required population estimation, which contributed about 40% of total person-hours (most of which recorded by villagers hired to count structures). The Kabul site also entailed high person-time inputs: this was partially attributable to requiring additional data collection staff to ensure same-sex interviews and FGDs, and also having to conduct population estimation. Comparisons between the EM method and retrospective surveys suggest that the EM method could offer considerable economic benefits over surveys. The EM method required less time than retrospective surveys in three of the four study sites, with person-time savings of up to 72%. It also showed considerable monetary savings, with costs estimates in all four study sites lower for the EM method than for a survey. Generally, we believe that the EM method would be most feasible in camps and concentrated populations, though not appreciably less feasible than surveys in scattered populations. In chaotic situations where no population estimates are available, feasibility would be considerably lessened; however, in post-emergency camps or other communities where population size is being monitored, feasibility results from Mae La and the Tanzania camps represent what might be expected routinely.

A New Method to Estimate Mortality in Crisis-Affected Populations: Validation and Feasibility Study
64
The EM method has potentially considerable ethical benefits over surveys. The time input by respondents was approximately 90% less in all four study sites for the EM method when compared with a survey, representing a substantial reduction in burden to respondents. However, the referral by key informants who are also community leaders may entail a risk that households will not be able to decline participating in the study. The study also explored the feasibility of including verbal autopsy questionnaires as part of the routine application of the EM method. In the Chiradzulu District site, this took a total additional time of 62 hours, less than 3% of the total person-time input in that site. This suggests that verbal autopsy questionnaires could be used alongside the EM method routinely. The addition of verbal autopsy questionnaires when measuring mortality rates provides an extremely important way of increasing the accuracy of recording the causes of mortality and so helping to inform appropriate health interventions and responses. 6.4. STUDY LIMITATIONS 6.4.1. Implementation of the EM Method The main limitation when implementing the EM method concerned establishing the correct date of death, crucial to the validation effort as well as the routine implementation of the method. Qualitatively, it was apparent that many household respondents and informants had difficulties pinpointing the actual date of death: a gold standard for this was not available, and we attempted to minimize error through a series of questions and a detailed calendar containing local salient events; indeed, most of the interview time was spent establishing the date of death. Systematic reporting of dates as having occurred more recently than in reality would have biased our findings by making the EM method seem more sensitive than it actually is. Likewise, systematic reporting of dates as having occurred less recently than in reality would have biased our findings by making the EM method seem less sensitive than it is. There were no instances in which a household was empty, or had no next of kin 18 years of age or older available to be interviewed. Therefore, although absenteeism is a potential risk for the EM method (as with retrospective surveys), it did not affect the results of the EM study in any of the study sites. 6.4.2. Choice of the Gold Standard Measurement Tool The mortality rates we estimated after adjustment for uncaptured deaths were consistent with non-emergency situations in all sites, and reflected expected patterns given the underlying epidemiological and demographic profile. Mortality rates among children under 5 were approximately double the all-age CMR, as typically observed in developing country settings. In Table 27 we compare our estimated mortality rates over a 60-day recall period with rates from broadly comparable regions and time periods: these mostly corroborate our gold-standard measurements. It should be noted that both camp-based populations we investigated enjoy long-standing humanitarian assistance and comparatively good health services, which may explain their low mortality (a typical developing country population not experiencing a crisis would have a CMR of about 0.3 to 0.6 deaths per 10,000 person-days).
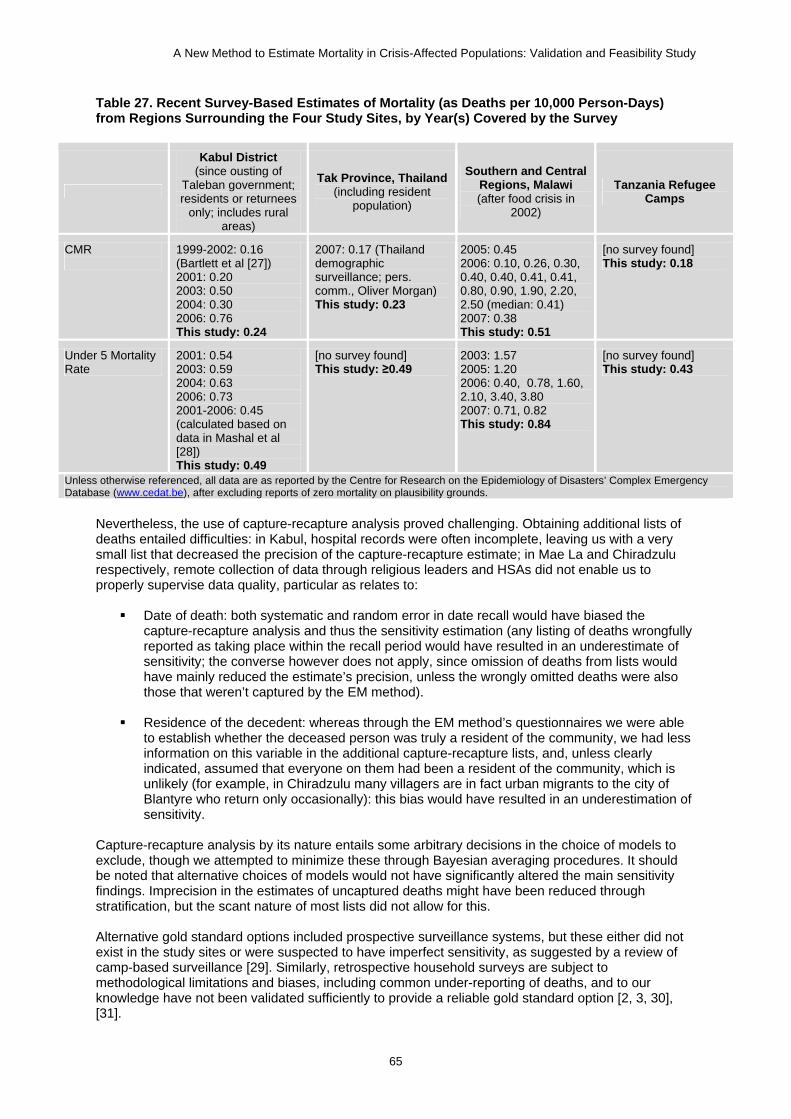
A New Method to Estimate Mortality in Crisis-Affected Populations: Validation and Feasibility Study
65
Table 27. Recent Survey-Based Estimates of Mortality (as Deaths per 10,000 Person-Days) from Regions Surrounding the Four Study Sites, by Year(s) Covered by the Survey
Kabul District (since ousting of
Taleban government; residents or returnees
only; includes rural areas)
Tak Province, Thailand (including resident
population)
Southern and Central Regions, Malawi (after food crisis in
2002)
Tanzania Refugee Camps
CMR
1999-2002: 0.16 (Bartlett et al [27]) 2001: 0.20 2003: 0.50 2004: 0.30 2006: 0.76 This study: 0.24
2007: 0.17 (Thailand demographic surveillance; pers. comm., Oliver Morgan) This study: 0.23
2005: 0.45 2006: 0.10, 0.26, 0.30, 0.40, 0.40, 0.41, 0.41, 0.80, 0.90, 1.90, 2.20, 2.50 (median: 0.41) 2007: 0.38 This study: 0.51
[no survey found] This study: 0.18
Under 5 Mortality Rate
2001: 0.54 2003: 0.59 2004: 0.63 2006: 0.73 2001-2006: 0.45 (calculated based on data in Mashal et al [28]) This study: 0.49
[no survey found] This study: ≥0.49
2003: 1.57 2005: 1.20 2006: 0.40, 0.78, 1.60, 2.10, 3.40, 3.80 2007: 0.71, 0.82 This study: 0.84
[no survey found] This study: 0.43
Unless otherwise referenced, all data are as reported by the Centre for Research on the Epidemiology of Disasters’ Complex Emergency Database (www.cedat.be), after excluding reports of zero mortality on plausibility grounds.
Nevertheless, the use of capture-recapture analysis proved challenging. Obtaining additional lists of deaths entailed difficulties: in Kabul, hospital records were often incomplete, leaving us with a very small list that decreased the precision of the capture-recapture estimate; in Mae La and Chiradzulu respectively, remote collection of data through religious leaders and HSAs did not enable us to properly supervise data quality, particular as relates to:
Date of death: both systematic and random error in date recall would have biased the capture-recapture analysis and thus the sensitivity estimation (any listing of deaths wrongfully reported as taking place within the recall period would have resulted in an underestimate of sensitivity; the converse however does not apply, since omission of deaths from lists would have mainly reduced the estimate’s precision, unless the wrongly omitted deaths were also those that weren’t captured by the EM method).
Residence of the decedent: whereas through the EM method’s questionnaires we were able to establish whether the deceased person was truly a resident of the community, we had less information on this variable in the additional capture-recapture lists, and, unless clearly indicated, assumed that everyone on them had been a resident of the community, which is unlikely (for example, in Chiradzulu many villagers are in fact urban migrants to the city of Blantyre who return only occasionally): this bias would have resulted in an underestimation of sensitivity.
Capture-recapture analysis by its nature entails some arbitrary decisions in the choice of models to exclude, though we attempted to minimize these through Bayesian averaging procedures. It should be noted that alternative choices of models would not have significantly altered the main sensitivity findings. Imprecision in the estimates of uncaptured deaths might have been reduced through stratification, but the scant nature of most lists did not allow for this. Alternative gold standard options included prospective surveillance systems, but these either did not exist in the study sites or were suspected to have imperfect sensitivity, as suggested by a review of camp-based surveillance [29]. Similarly, retrospective household surveys are subject to methodological limitations and biases, including common under-reporting of deaths, and to our knowledge have not been validated sufficiently to provide a reliable gold standard option [2, 3, 30], [31].

A New Method to Estimate Mortality in Crisis-Affected Populations: Validation and Feasibility Study
66
6.4.3. Study Generalizability Clearly, evidence from four sites only is not optimal to draw recommendations about the usefulness of the EM method, although we believe it is sufficient to conclude that the method requires further development to improve its sensitivity (see below). Most importantly, due to the short duration of this project and the difficulty to organize proper field research in unstable settings, we were unable to test the method in settings of high mortality, most consistent with the conditions for which we believe the method would be most useful. We do not know whether the method would have proven more or less valid and feasible in such settings. In terms of sensitivity, a chaotic, high mortality setting might favor the EM method, as respondent households might feel less constrained to refer deaths due to a less structured political hierarchy, and/or might have better knowledge of other deaths simply due to their sheer number; alternatively, the method might not perform as well due to population movement and difficulty to find adequate key informants. 6.5. ROUTINE APPLICATION OF THE EM METHOD Notwithstanding its limited sensitivity, we believe the EM method could be a useful and sometimes superior alternative to both retrospective surveys and surveillance. At this stage, we believe that its routine application depends on increasing sensitivity to an acceptable level (e.g. >85%) are found (see Section 6.6.1). However, based on the present study we can already recommend a number of procedures that should accompany any implementation of the method in the future:
At least 1,000,000 person-days should be investigated: in practice, the recall period could consist of one month in a population of 50,000 and two weeks in a population of 100,000.
If the population is very large and/or scattered, sampling of at least 30 PSUs is appropriate; the total population in the PSUs should be at least 20,000.
Recall periods longer than about 30 days are probably inappropriate, although the exhaustive search should target a period longer than the actual recall period of interest to maximize sensitivity (e.g., if the recall period of interest is 20 days, the team could ask about deaths occurring in the last 40 days, and then restrict the analysis to 20 days: in Islamic majority countries this would correspond well with the religious mourning period; elsewhere, a salient event could be identified).
Error in date recall, especially if systematic, is a major potential limitation of the EM method, and should be pre-empted through questionnaires that cross-check information on dates through different probing questions and rely on detailed calendars including salient events.
Household referrals may not yield a large number of deaths, but should remain a feature of the method, as they take little extra time and appear to capture mostly deaths not reported by community informants.
Population estimation should be performed when population figures are either unavailable or unreliable. In camps or concentrated populations, we believe the easiest method is to (i) perform two independent counts of all residential structures, and average the two; (ii) in at least 50 structures, sampled systematically (i.e. every nth structure), count the number of people and children under 5 years who spent the previous night in the structure; (iii) multiply the number of structures by the mean number of people (children under 5) per structure to estimate the total population size.
For the purposes of this first validation study, we wished to calculate mortality rates very precisely, partly to maximize the benefit of our study to populations in the study sites; further complexity was introduced by the capture-recapture validation process and the difficult sampling conditions in Kabul. However, for the routine application of the method, we envisage much simplified data management and analysis: (i) records can be single-entered, with double entry and validation of the most important variables (e.g., age, sex, date of death); (ii) if population estimation is done, only the point estimate of population size need be computed, provided appropriate sample sizes are used for the estimation; (iii) inference can be based on
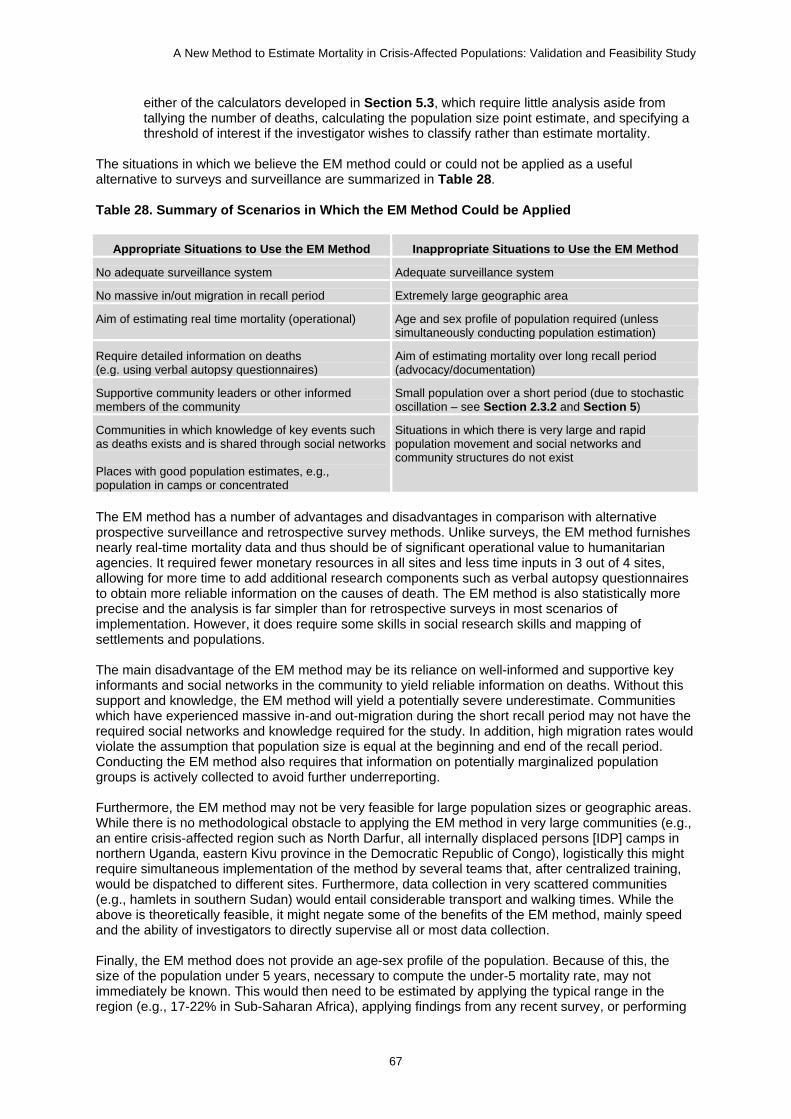
A New Method to Estimate Mortality in Crisis-Affected Populations: Validation and Feasibility Study
67
either of the calculators developed in Section 5.3, which require little analysis aside from tallying the number of deaths, calculating the population size point estimate, and specifying a threshold of interest if the investigator wishes to classify rather than estimate mortality.
The situations in which we believe the EM method could or could not be applied as a useful alternative to surveys and surveillance are summarized in Table 28. Table 28. Summary of Scenarios in Which the EM Method Could be Applied
Appropriate Situations to Use the EM Method Inappropriate Situations to Use the EM Method
No adequate surveillance system Adequate surveillance system
No massive in/out migration in recall period Extremely large geographic area
Aim of estimating real time mortality (operational) Age and sex profile of population required (unless simultaneously conducting population estimation)
Require detailed information on deaths (e.g. using verbal autopsy questionnaires)
Aim of estimating mortality over long recall period (advocacy/documentation)
Supportive community leaders or other informed members of the community
Small population over a short period (due to stochastic oscillation – see Section 2.3.2 and Section 5)
Communities in which knowledge of key events such as deaths exists and is shared through social networks Places with good population estimates, e.g., population in camps or concentrated
Situations in which there is very large and rapid population movement and social networks and community structures do not exist
The EM method has a number of advantages and disadvantages in comparison with alternative prospective surveillance and retrospective survey methods. Unlike surveys, the EM method furnishes nearly real-time mortality data and thus should be of significant operational value to humanitarian agencies. It required fewer monetary resources in all sites and less time inputs in 3 out of 4 sites, allowing for more time to add additional research components such as verbal autopsy questionnaires to obtain more reliable information on the causes of death. The EM method is also statistically more precise and the analysis is far simpler than for retrospective surveys in most scenarios of implementation. However, it does require some skills in social research skills and mapping of settlements and populations. The main disadvantage of the EM method may be its reliance on well-informed and supportive key informants and social networks in the community to yield reliable information on deaths. Without this support and knowledge, the EM method will yield a potentially severe underestimate. Communities which have experienced massive in-and out-migration during the short recall period may not have the required social networks and knowledge required for the study. In addition, high migration rates would violate the assumption that population size is equal at the beginning and end of the recall period. Conducting the EM method also requires that information on potentially marginalized population groups is actively collected to avoid further underreporting. Furthermore, the EM method may not be very feasible for large population sizes or geographic areas. While there is no methodological obstacle to applying the EM method in very large communities (e.g., an entire crisis-affected region such as North Darfur, all internally displaced persons [IDP] camps in northern Uganda, eastern Kivu province in the Democratic Republic of Congo), logistically this might require simultaneous implementation of the method by several teams that, after centralized training, would be dispatched to different sites. Furthermore, data collection in very scattered communities (e.g., hamlets in southern Sudan) would entail considerable transport and walking times. While the above is theoretically feasible, it might negate some of the benefits of the EM method, mainly speed and the ability of investigators to directly supervise all or most data collection. Finally, the EM method does not provide an age-sex profile of the population. Because of this, the size of the population under 5 years, necessary to compute the under-5 mortality rate, may not immediately be known. This would then need to be estimated by applying the typical range in the region (e.g., 17-22% in Sub-Saharan Africa), applying findings from any recent survey, or performing

A New Method to Estimate Mortality in Crisis-Affected Populations: Validation and Feasibility Study
68
an ad hoc mini-survey (e.g., 60 households) to estimate the proportion of the population aged less than 5 years (this could easily be nested with population estimation). 6.6. FURTHER RESEARCH AND DEVELOPMENT 6.6.1. Future Development of the EM Method While sensitivity of the EM method as implemented in this study was unsatisfactory, it was not far from acceptable levels: improvements of about 15-30% would result in sensitivity >85%. This seems like an achievable aim, warranting further development of the method. Future steps should focus on improving the method’s validity (we believe this study shows that it compares very favorably with surveys in terms of feasibility), and could include the following:
Ensuring that the FGD participants represent a mix of men and women, ages, occupations and economic and social hierarchies. Using additional qualitative methods to complement the FGD could also be considered, such as informal individual discussions with a diverse range of community members.
Using more than two types of key informant. This appears very feasible, judging by the ease with which we collected additional lists of deaths (e.g., from shopkeepers in Kabul, from religious leaders in Mae La, from graveyard chairmen in Chiradzulu). It is thus conceivable that application of the EM method with four or five different sources would take only marginally more time, but offer the improvements in sensitivity needed to make this a viable method.
Relying on less formal types of informant. For example, instead of identifying community leaders or “figures” as the only informants, the method could rely on questioning people at gathering points (e.g., boreholes where people stand in line; shops and bakeries, as done in Kabul; traditional gatherings).
A further point concerns ethics: although we did not observe or hear of any incidents involving breach of confidentiality or forced participation of households in the study, follow-up work could be conducted to explore any untoward effects of the referral system that underpins the EM method, and find ways to strengthen the confidentiality and consent arrangements. Much of the above work is clearly in the remit of social science and anthropology, not epidemiology and demography: we thus recommend that future development of the EM method be spearheaded by researchers trained in qualitative and ethnographic techniques. 6.6.2. The Potential Applicability of Capture-Recapture Analysis Despite its moderate sensitivity, the EM method was consistently able to identify deaths that were not found on either of the other two lists, and especially on those derived from existing registers or surveillance systems. This suggests an inherent value of the EM method whether used alone or as part of a capture-recapture approach. Indeed, we found that capture-recapture analysis may have a value in routine measurement of mortality and/or evaluation of ongoing surveillance systems. Clearly, this approach is too complex for its routine use by investigators without adequate statistical training. However, we believe that it could have a place in studies implemented by experienced epidemiologists; for example, the EM method could be used in parallel to a survey or surveillance, and the lists obtained from these alternative methods could be combined through capture-recapture analysis to yield realistic mortality estimates. 6.7. CONCLUSIONS This study suggests that a new method to estimate mortality in crisis-affected populations (the EM method), based on information provided by community informants, may have moderate sensitivity, i.e. detect a disappointingly low proportion of all deaths. Sensitivity appears particularly low among children under 5 years. However, the method’s performance is comparable to that of existing surveillance systems.

A New Method to Estimate Mortality in Crisis-Affected Populations: Validation and Feasibility Study
69
The EM method appears more feasible in terms of time and financial inputs, as well as ethics, than the main alternative, namely retrospective surveys. Addition of verbal autopsy questionnaires is cost- and time-efficient. On balance, we believe the method shows sufficient promise to warrant further development, particularly given the paramount importance of mortality measurement in crisis-affected populations, the current paucity of methods to measure mortality, and the advantages of the EM method over both surveys and surveillance, including its ability to monitor mortality on a real-time basis. The main outstanding issue is how to improve sensitivity through selection of appropriate key informants: this should be the focus of future research and development.

A New Method to Estimate Mortality in Crisis-Affected Populations: Validation and Feasibility Study
70
7. References 1. Sphere Project: Sphere Handbook: Humanitarian Charter for and Minimum Standards in
Disaster Response. Geneva: Sphere Project; 2004.
2. Checchi F, Roberts L: HPN Network Paper 52: Interpreting and using mortality data in humanitarian emergencies: a primer for non-epidemiologists. In. London: Overseas Development Institute; 2005.
3. Working Group for Mortality Estimation in Emergencies: Wanted: studies on mortality estimation methods for humanitarian emergencies, suggestions for future research. Emerging Themes in Epidemiology 2007, 4(1):9.
4. Prudhon C, Spiegel P: A review of methodology and analysis of nutrition and mortality surveys conducted in humanitarian emergencies from October 1993 to April 2004. Emerging Themes in Epidemiology 2007, 4:10.
5. Spiegel PB: Who should be undertaking population-based surveys in humanitarian
emergencies? Emerging Themes in Epidemiology 2007, 4:12. 6. Bradley EH, Curry LA, Devers KJ: Qualitative data analysis for health services research:
developing taxonomy, themes, and theory. Health Serv Res 2007, 42(4):1758-1772. 7. Green J, J B (eds.): Principles of Social Research. Maidenhead: Open University Press;
2005. 8. Silverman D: Doing Qualitative Research: A Practical Handbook. London: Sage; 2000. 9. Seale C, Silverman D: Ensuring rigour in qualitative research. Eur J Public Health 1997,
7(4):379-384. 10. Silverman D: The Quality of Qualitative Health Research: the Open-ended Interview and
its Alternatives. Social Science in Health 1998, 4(2):104-118. 11. Mays N, Pope C: Rigour and qualitative research. BMJ 1995, 311(6997):109-112. 12. Patton MQ: Enhancing the quality and credibility of qualitative analysis. Health Serv Res
1999, 34(5 Pt 2):1189-1208. 13. Baiden F, Bawah A, Biai S, Binka F, Boerma T, Byass P, Chandramohan D, Chatterji S,
Engmann C, Greet D et al: Setting international standards for verbal autopsy. Bulletin of the World Health Organization 2007, 85(8):570-571.
14. World Health Organization: Verbal Autopsy Standards: Ascertaining and attributing
causes of death. In. Geneva: WHO; 2007. 15. World Health Organization: Training for Mid-level Managers: The EPI Coverage Survey.
In. Geneva: WHO Expanded Program on Immunization; 1991. 16. Capture-recapture and multiple-record systems estimation II: Applications in human
diseases. International Working Group for Disease Monitoring and Forecasting. Am J Epidemiol 1995, 142(10):1059-1068.
17. Capture-recapture and multiple-record systems estimation I: History and theoretical
development. International Working Group for Disease Monitoring and Forecasting. Am J Epidemiol 1995, 142(10):1047-1058.
18. Silva R, Ball P: The Profile of Human Rights Violations in Timor-Leste, 1974-1999: A
Report by the Benetech Human Rights Data Analysis Group to the Commission on

A New Method to Estimate Mortality in Crisis-Affected Populations: Validation and Feasibility Study
71
Reception, Truth and Reconciliation of Timor-Leste. In. Palo Alto, California: Benetech; 2006.
19. Comisión para el Esclarecimiento Histórico: Guatemala: Memoria del Silencio. In.
Guatemala City: United Nations Office of Project Services; 1999. 20. Ball P, Betts W, Scheuren F, Dudukovich J, Asher J: Killings and refugee flow in Kosovo,
March–June 1999: A report to the International Criminal Tribunal for the Former Yugoslavia. Available: http://shr.aaas.org/kosovo/icty_report.pdf. In. Washington DC: American Association for the Advancement of Science; 2002.
21. Fienberg SE, Johnson MS, Junker BW: Classical multilevel and Bayesian approaches to
population size estimation using multiple lists. Journal of the Royal Statistical Society 1999, Series A 162:383-405.
22. Hoeting JA, Madigan D, Raftery AE, Volinsky CT: Bayesian Model Averaging: A tutorial.
Statistical Science 1999, 14(4):382-417. 23. Marks E, Seltzer W, Krótki K: Population Growth Estimation: A Handbook of Vital
Statistics Measurement. New York: The Population Council; 1974. 24. Kaiser R, Woodruff BA, Bilukha O, Spiegel PB, Salama P: Using design effects from
previous cluster surveys to guide sample size calculation in emergency settings. Disasters 2006, 30(2):199-211.
25. Aggarwal A, Pandey A, Bhattacharya B: Risk factors for maternal mortality in Delhi
slums: A community-based case-control study. Indian Journal of Medical Sciences 2007, 61(9):517-526.
26. Singh P, Pandey A, Aggarwal A: House-to-house survey vs. snowball technique for
capturing maternal deaths in India: a search for a cost-effective method. Indian Journal of Medical Research 2007, 125(4):550-556.
27. Bartlett LA, Mawji S, Whitehead S, Crouse C, Dalil S, Ionete D, Salama P: Where giving
birth is a forecast of death: maternal mortality in four districts of Afghanistan, 1999-2002. Lancet 2005, 365(9462):864-870.
28. Mashal T, Takano T, Nakamura K, Kizuki M, Hemat S, Watanabe M, Seino K: Factors
associated with the health and nutritional status of children under 5 years of age in Afghanistan: family behaviour related to women and past experience of war-related hardships. BMC Public Health 2008, 8:301.
29. Spiegel PB, Sheik M, Woodruff BA, Burnham G: The accuracy of mortality reporting in
displaced persons camps during the post-emergency phase. Disasters 2001, 25(2):172-180.
30. Zeger SL, Johnson E: Estimating excess deaths in Iraq since the US-British-led
invasion. Significance 2007, 4(2):54-59. 31. Alkhuzai AH, Ahmad IJ, Hweel MJ, Ismail TW, Hasan HH, Younis AR, Shawani O, Al-Jaf VM,
Al-Alak MM, Rasheed LH et al: Violence-related mortality in Iraq from 2002 to 2006. N Engl J Med 2008, 358(5):484-493.

A New Method to Estimate Mortality in Crisis-Affected Populations: Validation and Feasibility Study
72
8. Report Annexes 8.1 FOCUS GROUP DISCUSSION TOPIC GUIDE
CHIRADZULU: FIRST FOCUS GROUP DISCUSSION TOPIC GUIDE
Agenda
Introduction Agreement to participate Questions and discussion – should take a bit less than an hour and half
Introduction We are here to have a discussion on how information is shared on deaths in the community. This discussion seeks to share knowledge and exchange different opinions. We very much hope you will speak as open and freely as possible. The meeting is expected to last between around one and a half hours. Most of the time will be spent having a discussion. Now we can give you some background on what we are doing here in Chiradzulu district. We are undertaking a study of deaths in the community. The study is run by the University of London in the United Kingdom, in conjunction with the DHO. The main purpose of the study is to try out a new method of measuring the number of deaths in a community. The new method we want to try out uses key persons in the community who have a good knowledge of deaths that have occurred within the past few weeks in that community. These ‘key-informants’ will lead us, the researchers, to households in the community that have been recently suffered a death. We will then briefly interview someone in the household about the death. We will then ask the person in the household we interviewed to identify another household in the community that has also recently experienced a death. We would then find that household and conduct another interview. The process will continue until we think we have identified all the households in the community that have experienced a recent death. The primary community informants would help us throughout this process. [Prompt: offer to repeat if method is not clear to group.] This study we are doing here will help us to decide whether this method works, and whether we can use it in the future in other places to help have a better understanding of the number of deaths occurring in those communities. The study will also provide information about the health conditions here, and the main health problems people face. We have asked you to come today because we would like to have a group discussion on how information on deaths is shared on deaths in the community in order to help us conduct the study as well as possible. We have selected you because of your knowledge of the community. Before we carry on, it would be helpful for us to get to know each other [Introduce yourself, and then ask one participant to give their name and role continue with all participants/study staff.] [Write down name on seating plan]

A New Method to Estimate Mortality in Crisis-Affected Populations: Validation and Feasibility Study
73
Outputs and Confidentiality The findings from this discussion will be included in public reports. To make sure we accurately reflect the discussion, we will be recording it. The discussion will then be typed up and analyzed. The recording will be securely kept by project staff and will not be shared with anyone. We want to keep this discussion private and confidential so your names will not appear in any documents. Instead, any statements you make will be written as “one of the respondents stated that…” Informed Consent We have given you an information sheet for this discussion. This information sheet outlines key points:
Who we are and why we are here Why you have been selected to come The topics we would like to discuss The voluntary nature of your participation
[Make sure all participants have information sheet.] You will now be asked if I can mark a consent form that you agree to participate in this discussion. A witness will also sign each of these forms to mark an information sheet to show that you agree to participate in this discussion. Ground Rules There are a number of ground rules we would like us all to respect to make this discussion as effective and agreeable as possible.
Please feel like you can speak freely and don’t feel embarrassed about what other people may think. There are no right or wrong answers. All your opinions are important and valuable to us and we ask you to participate as fully as possible.
We are here to share knowledge and exchange opinions. Please respect the views and opinions of other participants and allow them to speak freely.
The discussion is private and confidential. Please do not share the content of this discussion with anyone outside of this group.
Before we begin, does anyone have questions about the arrangements for the discussion? Discussion Questions [Try and preface each participant’s comment’s by saying “please, [name], what would you like to say?”. Although there is a risk of stifling the discussion, it will aid the transcription and analysis by making clear who says what... If necessary, repeat that the names will not be used in the final report.] 1. If someone from Chiradzulu district left for 6 months and then came back to Chiradzulu district,
and wanted to know about things that had happened here in the district, like babies being born and people who had died, where do you think he or she would go to obtain the best information on these births and deaths in the district in the past six months?
[Prompt: Focus on deaths.] [Prompt: e.g., religious leader, community leader, health worker etc]. [Prompt: Why do you think he would choose these people? e.g., comprehensive knowledge; accuracy; trust in community; community contacts; professional knowledge; experience; wide geographic coverage; etc.] [Prompt: why did you think they would be effective at sharing their knowledge? E.g., duty; job; experience; trust etc.]

A New Method to Estimate Mortality in Crisis-Affected Populations: Validation and Feasibility Study
74
2. Do you think there are any particular advantages or disadvantages of relying on any of these people that have been mentioned?
[Prompt: e.g., unable to access information on certain types of deaths; not willing or able to share information on all deaths; limited geographic coverage; timing of deaths (e.g., recent deaths not reported); age of deceased (e.g., newborns); lack of trust by community members in these people; these people not being helpful in providing information to study team] [Prompt: probe for disadvantages] 3. How would the selection of these people as sources of knowledge change if deaths were of
children rather than adults? [Prompt: why would it change/not change?] 4. As our survey method also relies on community members who have experienced a recent death
in the family sharing information on other households in the community that have experienced a death, we are keen to understand how information on death is shared and spread in the community by other community members. What are the ways in which information on recent deaths is shared among community members?
[Prompt: e.g., with relatives, friends and neighbors, at a place of work, worship, or at the market?] [Prompt: How does information on a death spread in the community? e.g., networks of friends or relatives; fellow worshipers.] [Prompt: How willing do you think households would be to share information about deaths in other households in the community? Explore why.] 5. What challenges do you think may exist in trying to collect information on recent deaths from
community members? [Prompt: e.g., Mourning; wariness of outside researchers; some deaths may be hidden/stigma; key-informants may not be helpful to study team.] [Prompt: How could these challenges affect the sharing of knowledge about the death? e.g., alter cause of death; adjust timing of death.] [Prompt: Are documents given out for deaths (e.g. death certificate)? How widely used are these? What are the challenges of using these documents (e.g., only given for certain causes of death/population types/locations of deaths etc.?] 6. If the household and key-persons could not identify any more deaths in the community, what
other sources in the community could be useful to help identify a household that had recently suffered a death?
[Prompt: e.g., market place (where/who in particular), water point etc.; shops; why would they be useful?] [Prompt: What advantages and disadvantages do these other sources have?] 7. I would now like to ask you a broader question about how community members view the causes
of death and illness in the community here. What do you think a typical community members would list as the main causes of death in the community?
[Prompt: we are keen to understand community perceptions, so encourage participants not to introduce their own, perhaps more biomedical explanations.] [Prompt (only use if really necessary): e.g., fever, diarrhea, cough, bad water or food, spirits, etc.]

A New Method to Estimate Mortality in Crisis-Affected Populations: Validation and Feasibility Study
75
[Prompt: How could these views change between different types of community members? E.g., older, younger, different ethnic groups, women and men.] 8. If someone was seriously ill in the community, apart from the hospital where do you think they
would go? [Prompt: where would a child go, where would an elderly person go, etc.] 9. Finally, to help us make sure that the deaths we record in our study are accurate, we need to
know some key events that have taken place within the 2 months, as it may help the community members we will be interviewing to more accurately record when the deceased died.
[Prompt: either an event that virtually everyone in Malawi was aware of; or specific to the district which virtually everyone in the district was aware of] [Prompt: e.g., religious day; community event.] Concluding Statement [Conclude by briefly summarizing the key-points from the discussion.] Does anyone else have anything else they would like to add? The discussion has given us very useful information to help ensure our study is as effective as possible. We thank you for giving your time and expertise. We are extremely grateful. If you have any questions about the discussion today or our work, please feel free to ask them afterwards. You can also contact us using the details given on your information sheet. [End] * * * Facilitator Role
Mediation between participants Ensure participation of all participants Prevent single participants/groups of participants dominating conversation Encourage reserved members to become involved and share views Encourage space for discussion/conversation on the topics Maintain balance between steering the group and moderating it Active listening Being non-judgmental Not-interrupting Developing rapport
Tips
Use research assistants to take notes, check recording, provide an on-going oral translation to study investigators.
Names could be given by participants before they speak to help the transcriber separate out comments. These names will obviously be omitted from the final transcription documents and all project outputs.
Ensure comfortable, private and quiet location for discussion. Ensure refreshments are available for all participants. Could sketch out the seating plan to help recall who sat where and who said what. Address issue of local hierarchies/encouraging everyone to feel free to speak.

A New Method to Estimate Mortality in Crisis-Affected Populations: Validation and Feasibility Study
76
8.2. HOUSEHOLD REGISTER

A New Method to Estimate Mortality in Crisis-Affected Populations: Validation and Feasibility Study
77
8.3. HOUSEHOLD VISIT PROCEDURES

A New Method to Estimate Mortality in Crisis-Affected Populations: Validation and Feasibility Study
78
8.4. CONSENT FORMS AND PARTICIPANT INFORMATION SHEETS

A New Method to Estimate Mortality in Crisis-Affected Populations: Validation and Feasibility Study
79

A New Method to Estimate Mortality in Crisis-Affected Populations: Validation and Feasibility Study
80

A New Method to Estimate Mortality in Crisis-Affected Populations: Validation and Feasibility Study
81

A New Method to Estimate Mortality in Crisis-Affected Populations: Validation and Feasibility Study
82
8.5. MORTALITY QUESTIONNAIRE

A New Method to Estimate Mortality in Crisis-Affected Populations: Validation and Feasibility Study
83

A New Method to Estimate Mortality in Crisis-Affected Populations: Validation and Feasibility Study
84
8.6. VISUAL CALENDAR AID

A New Method to Estimate Mortality in Crisis-Affected Populations: Validation and Feasibility Study
85
8.7. REGISTER FOR ADDITIONAL CAPTURE-RECAPTURE SOURCES

A New Method to Estimate Mortality in Crisis-Affected Populations: Validation and Feasibility Study
86
8.8 RESIDENTIAL STRUCTURE TALLY SHEET

A New Method to Estimate Mortality in Crisis-Affected Populations: Validation and Feasibility Study
87
8.9. INTERNATIONAL FORM OF MEDICAL CERTIFICATE OF DEATH

A New Method to Estimate Mortality in Crisis-Affected Populations: Validation and Feasibility Study
88
8.10. BOOTSTRAPPING PROGRAMS FOR MORTALITY ESTIMATION District 1, Kabul

A New Method to Estimate Mortality in Crisis-Affected Populations: Validation and Feasibility Study
89

A New Method to Estimate Mortality in Crisis-Affected Populations: Validation and Feasibility Study
90

A New Method to Estimate Mortality in Crisis-Affected Populations: Validation and Feasibility Study
91
Mae La Camp

A New Method to Estimate Mortality in Crisis-Affected Populations: Validation and Feasibility Study
92
A New Method to Estimate Mortality in Crisis-Affected Populations: Validation and Feasibility Study
93
Chiradzulu District

A New Method to Estimate Mortality in Crisis-Affected Populations: Validation and Feasibility Study
94

A New Method to Estimate Mortality in Crisis-Affected Populations: Validation and Feasibility Study
95

A New Method to Estimate Mortality in Crisis-Affected Populations: Validation and Feasibility Study
96
Lugufu and Mtabila Camps

A New Method to Estimate Mortality in Crisis-Affected Populations: Validation and Feasibility Study
97

A New Method to Estimate Mortality in Crisis-Affected Populations: Validation and Feasibility Study
98
8.11. ECONOMIC FEASIBILITY COSTING Table 29. Costing by Study Site
Staff Kabul
Hourly Rate (USD)
Thailand Hourly Rate
(USD)
Chiradzulu Hourly Rate
(USD)
Tanzania Camps Hourly Rate
(USD)
Study investigators † 22.6 22.6 22.6 22.6
Other study staff * 5.25 4.5 264 * * 3.3
Collaborators * 5.40 9.9 5.7 3.5
Data collectors * 3.85 4.5 2.3 3.1
Drivers *** 4.71 27 2.2
Costs based on costs incurred during data collection for EM method. Same costs applied for survey estimations. Costs for key informants, FGD participants, EM respondents and population respondents not included. † Average cost for different study staff in each study site. ** In Chiradzulu a one-off payment was made to other study staff (household enumerators for population data) amounting to $264 in total. *** Includes costs of vehicles hire, driver fees, petrol. Exchange rates recorded on first data of data collection in each study site: 1 USD=50.20 Afghani; 1 USD=33.87 Thai Baht; 1 USD=143.29 Malawi Kwacha; 1 USD=1186.53 Tanzanian shillings. Table 30. Assumptions for Time Inputs for a Retrospective Survey, by Study Site
Activity/Staff Type District 1, Kabul Mae La Camp Chiradzulu District Tanzania Camps
Preparation
Investigators Same as for EM Same as for EM Same as for EM Same as for EM
Data collectors Same as for EM Same as for EM Same as for EM Same as for EM
Drivers Same as for EM Same as for EM Same as for EM Same as for EM
Collaborators Same as for EM Same as for EM Same as for EM Same as for EM
Population estimation
Not applicable for survey
FGD Not applicable for survey Training
Investigators 1 investigator x 4 d 1 investigator x 4 d 1 investigator x 4 d 1 investigator x 4 d
Data collectors 12 interviewers (teams of 2) x 4 days
6 interviewers x 4 days
6 interviewers x 4 days
6 interviewers x 4 days
Data collection
Investigators person-time for data collectors / n of data collectors (12)
person-time for data collectors / n of data collectors (6)
person-time for data collectors / n of data collectors (6)
person-time for data collectors / n of data collectors (6)
Data collectors 1 h preparation/cluster 15 min/household 3 min to select each new household 2 data collectors /household
15 min/household 3 min to select each new household 1 data collector /household
1 h preparation/cluster 2 h drive/cluster 15 min/household questionnaire 3 min to select each new household 2 data collectors /household
15 min/household 3 min to select each new household 1 data collector /household

A New Method to Estimate Mortality in Crisis-Affected Populations: Validation and Feasibility Study
99
Key informants* 30 min x 1 informant/cluster
30 min x 22 section chiefs
30 min x 1 informant/cluster
30 min x 35 section chiefs
Drivers 2 drivers x person-time for study investigators
No driving necessary
2 drivers x person-time for study investigators
1 driver x person-time for study investigator
Respondents 1 person /household x 15 min
1 person /household x 15 min
1 person /household x 15 min
1 person /household x 15 min
Data entry/analysis
Investigators entry: 3 min /questionnaire + 20% double entry analysis: 1 investigator x 3 d
entry: 3 min /questionnaire + 20% double entry analysis: 1 investigator x 2 d
entry: 3 min /questionnaire + 20% double entry analysis: 1 investigator x 3 d
entry: 3 min /questionnaire + 20% double entry analysis: 1 investigator x 2 d
Report production
Investigators 1 investigator x 2 d 1 investigator x 2 d 1 investigator x 2 d 1 investigator x 2 d
*To guide the team around the community. Working day assumed to be 8 hours. For general assumptions please see Section 3.5.1.
A New Method to Estimate Mortality in Crisis-Affected Populations: Validation and Feasibility Study
100
8.12. PROGRAM FOR CAPTURE-RECAPTURE ANALYSIS

A New Method to Estimate Mortality in Crisis-Affected Populations: Validation and Feasibility Study
101

A New Method to Estimate Mortality in Crisis-Affected Populations: Validation and Feasibility Study
102

A New Method to Estimate Mortality in Crisis-Affected Populations: Validation and Feasibility Study
103

A New Method to Estimate Mortality in Crisis-Affected Populations: Validation and Feasibility Study
104
A New Method to Estimate Mortality in Crisis-Affected Populations: Validation and Feasibility Study
105

A New Method to Estimate Mortality in Crisis-Affected Populations: Validation and Feasibility Study
106
8.13. VERIFICATION OF THE POISSON ASSUMPTION ON THE DISTRIBUTION OF DEATH COUNTS OVER TIME Each panel shows, from left to right, (i) observed mortality rates with linear trend, (ii) detrended data, and (iii) the frequencies of death counts per time unit, both observed and expected based on the Poisson assumption. Fugnido, Ethiopia
Lugufu, Tanzania
Mtabila, Tanzania
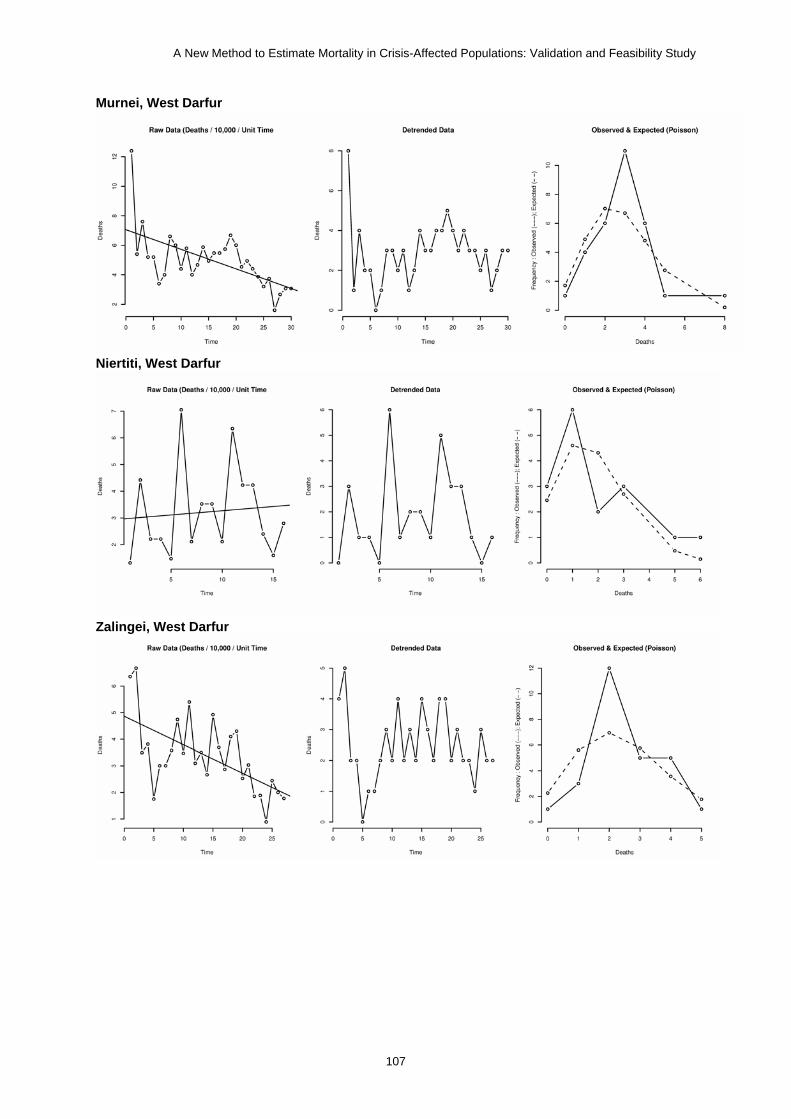
A New Method to Estimate Mortality in Crisis-Affected Populations: Validation and Feasibility Study
107
Murnei, West Darfur
Niertiti, West Darfur
Zalingei, West Darfur

A New Method to Estimate Mortality in Crisis-Affected Populations: Validation and Feasibility Study
108
8.14. SUMMARY RESULTS OF MATHEMATICAL SIMULATIONS Exhaustive Scenario

A New Method to Estimate Mortality in Crisis-Affected Populations: Validation and Feasibility Study
109
Sampling Scenario

![Sampling Networks and Aggregate Simulation for Online ... · 2.2 MDP planning by aggregate simulation Aggregate simulation follows the general scheme of the rollout algorithm [24]](https://img.pdfslide.us/doc/110x75/5ec0d4888d0e6637956bd6f5/sampling-networks-and-aggregate-simulation-for-online-22-mdp-planning-by-aggregate.jpg)