Embed Size (px)
Citation preview
Virginia Department of Medical Assistance Services
FAMIS
CAHPS® 2013 5.0H Child Medicaid (with Children with Chronic Conditions)
Survey Results
Final Report
Date: November 2013
Job Number: 13-464
2191 Defense Highway, Suite 401
Crofton, MD 21114
Phone: 410.721.0500
Fax: 410.721.7571
www.WBandA.com
2
2013 Virginia
FAMIS ChildTable of Contents
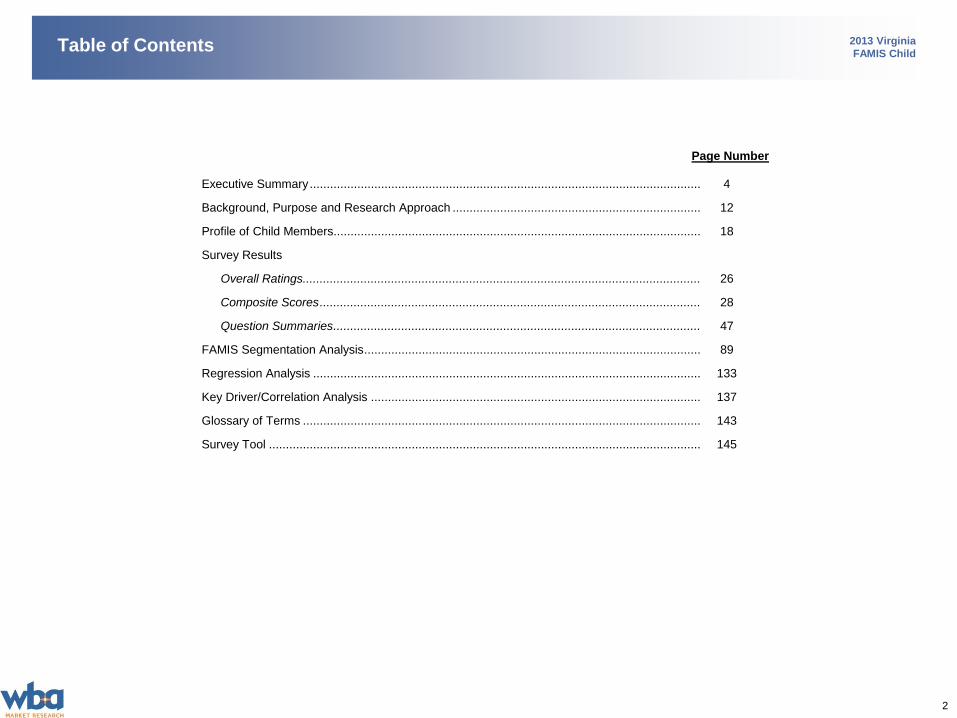
Page Number
Executive Summary ................................................................................................................... 4
Background, Purpose and Research Approach ......................................................................... 12
Profile of Child Members............................................................................................................ 18
Survey Results
Overall Ratings..................................................................................................................... 26
Composite Scores ................................................................................................................ 28
Question Summaries ............................................................................................................ 47
FAMIS Segmentation Analysis ................................................................................................... 89
Regression Analysis .................................................................................................................. 133
Key Driver/Correlation Analysis ................................................................................................. 137
Glossary of Terms ..................................................................................................................... 143
Survey Tool ............................................................................................................................... 145
Executive Summary
4
2013 Virginia
FAMIS ChildExecutive Summary
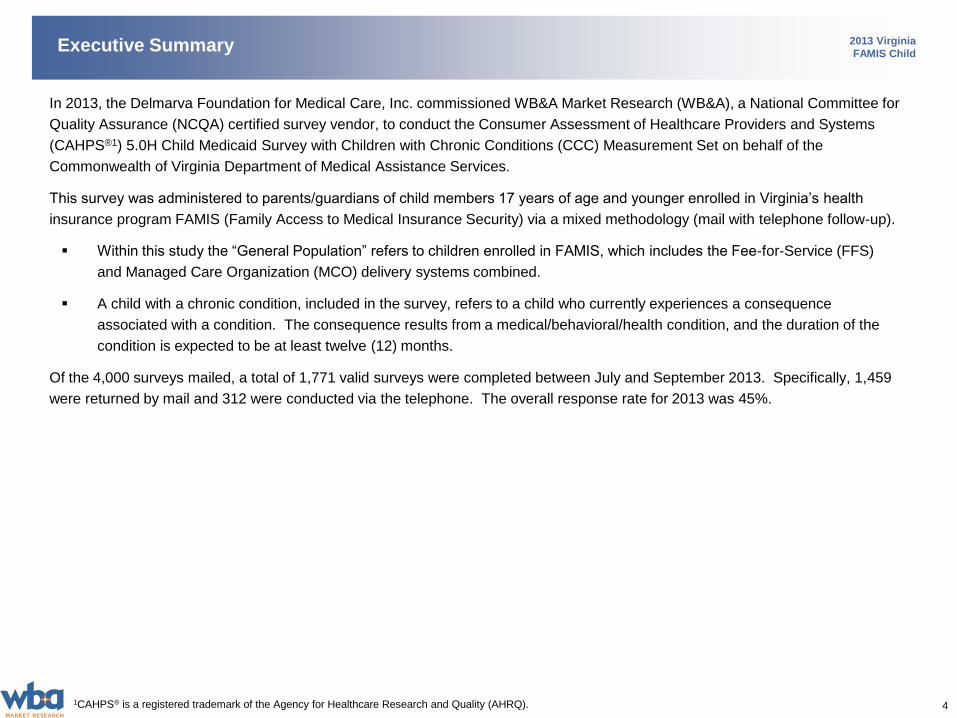
In 2013, the Delmarva Foundation for Medical Care, Inc. commissioned WB&A Market Research (WB&A), a National Committee for
Quality Assurance (NCQA) certified survey vendor, to conduct the Consumer Assessment of Healthcare Providers and Systems
(CAHPS®1) 5.0H Child Medicaid Survey with Children with Chronic Conditions (CCC) Measurement Set on behalf of the
Commonwealth of Virginia Department of Medical Assistance Services.
This survey was administered to parents/guardians of child members 17 years of age and younger enrolled in Virginia’s health
insurance program FAMIS (Family Access to Medical Insurance Security) via a mixed methodology (mail with telephone follow-up).
Within this study the “General Population” refers to children enrolled in FAMIS, which includes the Fee-for-Service (FFS)
and Managed Care Organization (MCO) delivery systems combined.
A child with a chronic condition, included in the survey, refers to a child who currently experiences a consequence
associated with a condition. The consequence results from a medical/behavioral/health condition, and the duration of the
condition is expected to be at least twelve (12) months.
Of the 4,000 surveys mailed, a total of 1,771 valid surveys were completed between July and September 2013. Specifically, 1,459
were returned by mail and 312 were conducted via the telephone. The overall response rate for 2013 was 45%.
1CAHPS® is a registered trademark of the Agency for Healthcare Research and Quality (AHRQ).
5
2013 Virginia
FAMIS ChildExecutive Summary (continued)
KEY FINDINGS FROM THE 2013 CAHPS® 5.0H CHILD MEDICAID SURVEY (WITH CCC MEASUREMENT SET)
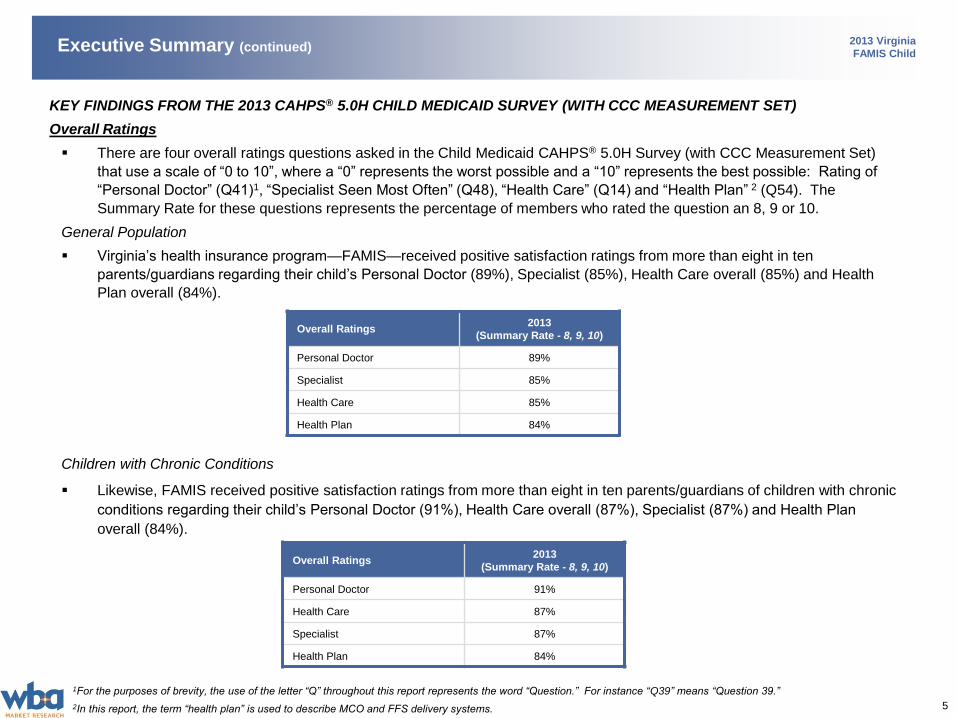
Overall Ratings
There are four overall ratings questions asked in the Child Medicaid CAHPS® 5.0H Survey (with CCC Measurement Set)
that use a scale of “0 to 10”, where a “0” represents the worst possible and a “10” represents the best possible: Rating of
“Personal Doctor” (Q41)1, “Specialist Seen Most Often” (Q48), “Health Care” (Q14) and “Health Plan” 2 (Q54). The
Summary Rate for these questions represents the percentage of members who rated the question an 8, 9 or 10.
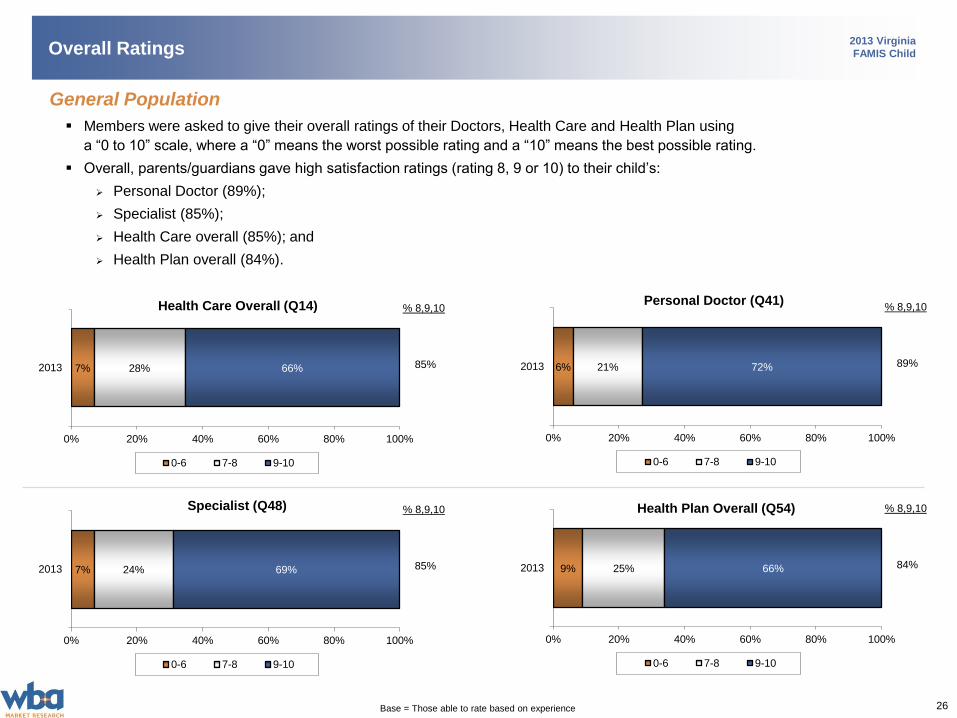
General Population
Virginia’s health insurance program—FAMIS—received positive satisfaction ratings from more than eight in ten
parents/guardians regarding their child’s Personal Doctor (89%), Specialist (85%), Health Care overall (85%) and Health
Plan overall (84%).
Children with Chronic Conditions
Likewise, FAMIS received positive satisfaction ratings from more than eight in ten parents/guardians of children with chronic
conditions regarding their child’s Personal Doctor (91%), Health Care overall (87%), Specialist (87%) and Health Plan
overall (84%).
Overall Ratings 2013
(Summary Rate - 8, 9, 10)
Personal Doctor 91%
Health Care 87%
Specialist 87%
Health Plan 84%
Overall Ratings 2013
(Summary Rate - 8, 9, 10)
Personal Doctor 89%
Specialist 85%
Health Care 85%
Health Plan 84%
1For the purposes of brevity, the use of the letter “Q” throughout this report represents the word “Question.” For instance “Q39” means “Question 39.”
2In this report, the term “health plan” is used to describe MCO and FFS delivery systems.
6
2013 Virginia
FAMIS ChildExecutive Summary (continued)
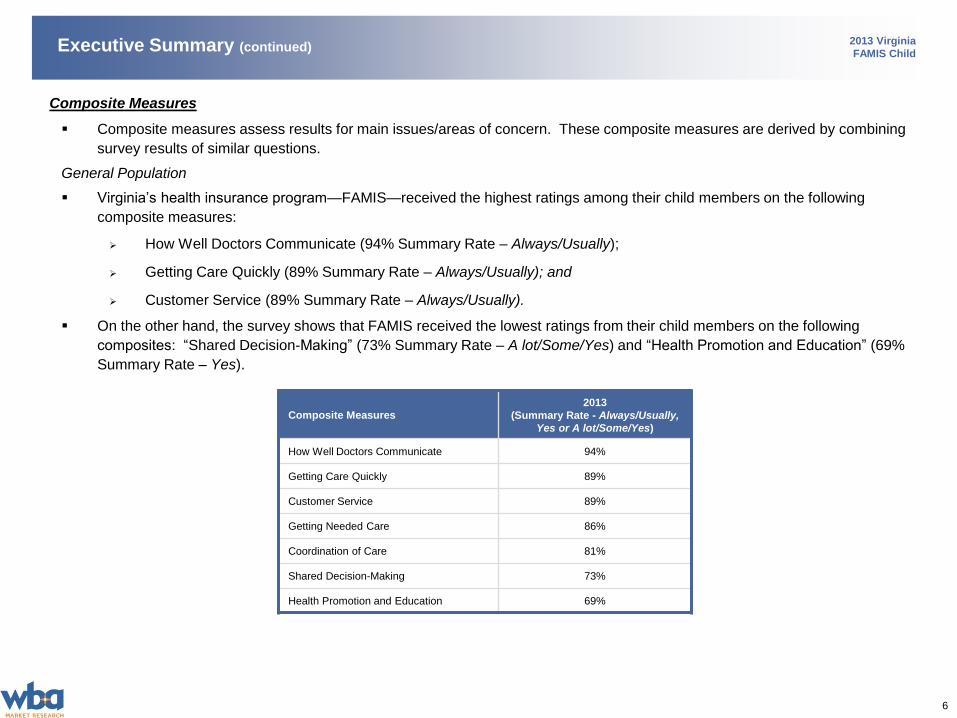
Composite Measures
Composite measures assess results for main issues/areas of concern. These composite measures are derived by combining
survey results of similar questions.
General Population
Virginia’s health insurance program—FAMIS—received the highest ratings among their child members on the following
composite measures:
How Well Doctors Communicate (94% Summary Rate – Always/Usually);
Getting Care Quickly (89% Summary Rate – Always/Usually); and
Customer Service (89% Summary Rate – Always/Usually).
On the other hand, the survey shows that FAMIS received the lowest ratings from their child members on the following
composites: “Shared Decision-Making” (73% Summary Rate – A lot/Some/Yes) and “Health Promotion and Education” (69%
Summary Rate – Yes).
Composite Measures
2013
(Summary Rate - Always/Usually,
Yes or A lot/Some/Yes)
How Well Doctors Communicate 94%
Getting Care Quickly 89%
Customer Service 89%
Getting Needed Care 86%
Coordination of Care 81%
Shared Decision-Making 73%
Health Promotion and Education 69%
7
2013 Virginia
FAMIS ChildExecutive Summary (continued)
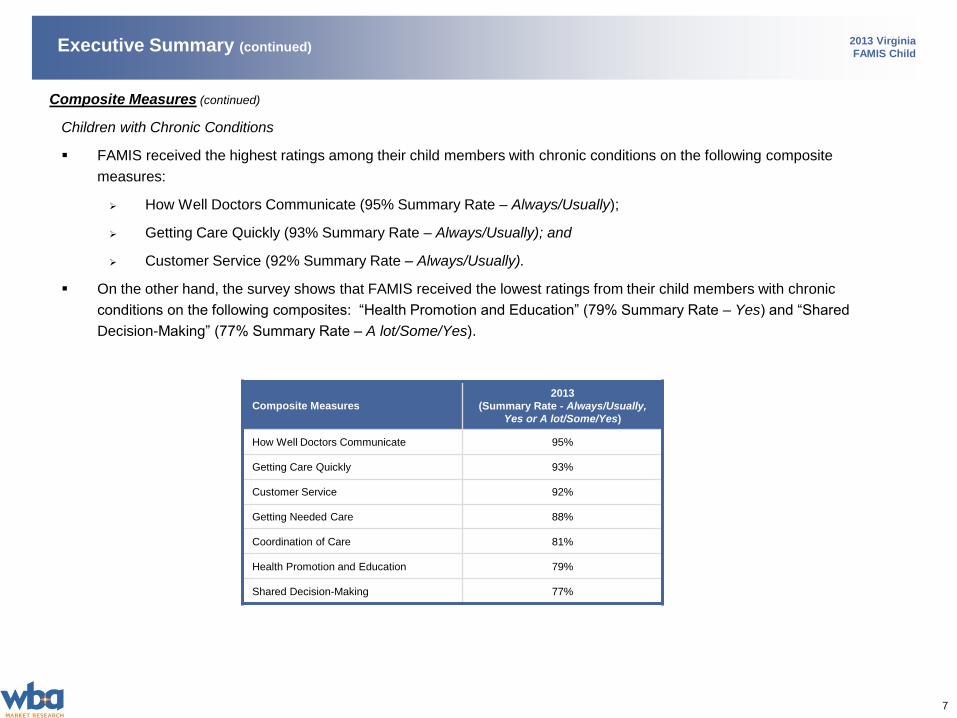
Composite Measures (continued)
Children with Chronic Conditions
FAMIS received the highest ratings among their child members with chronic conditions on the following composite
measures:
How Well Doctors Communicate (95% Summary Rate – Always/Usually);
Getting Care Quickly (93% Summary Rate – Always/Usually); and
Customer Service (92% Summary Rate – Always/Usually).
On the other hand, the survey shows that FAMIS received the lowest ratings from their child members with chronic
conditions on the following composites: “Health Promotion and Education” (79% Summary Rate – Yes) and “Shared
Decision-Making” (77% Summary Rate – A lot/Some/Yes).
Composite Measures
2013
(Summary Rate - Always/Usually,
Yes or A lot/Some/Yes)
How Well Doctors Communicate 95%
Getting Care Quickly 93%
Customer Service 92%
Getting Needed Care 88%
Coordination of Care 81%
Health Promotion and Education 79%
Shared Decision-Making 77%
8
2013 Virginia
FAMIS ChildExecutive Summary (continued)
Composite Measures (continued)
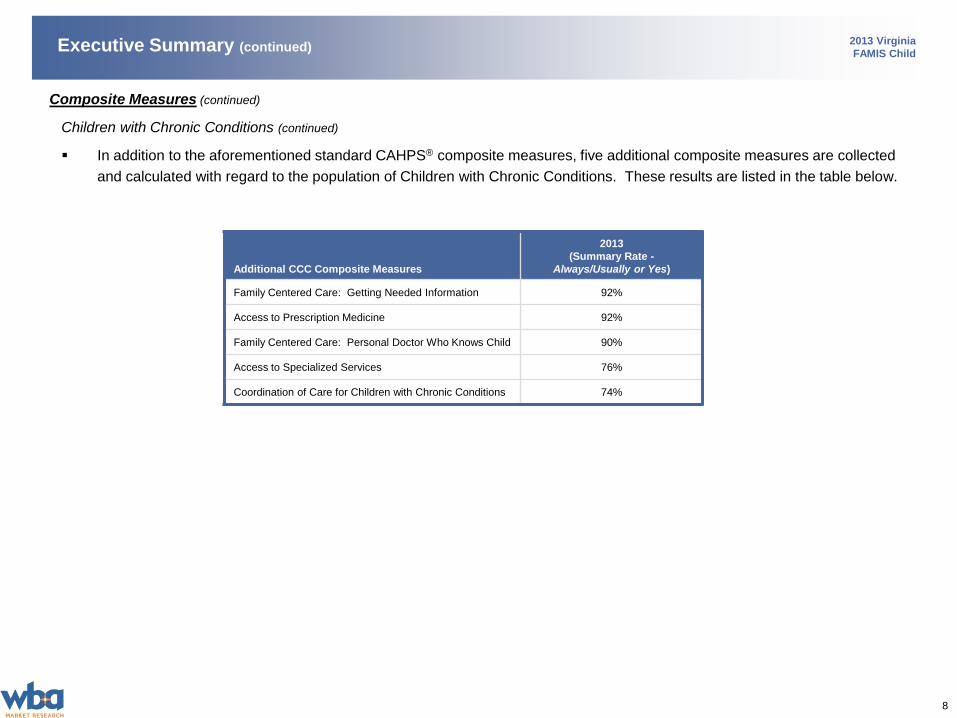
Children with Chronic Conditions (continued)
In addition to the aforementioned standard CAHPS® composite measures, five additional composite measures are collected
and calculated with regard to the population of Children with Chronic Conditions. These results are listed in the table below.
Additional CCC Composite Measures
2013
(Summary Rate -
Always/Usually or Yes)
Family Centered Care: Getting Needed Information 92%
Access to Prescription Medicine 92%
Family Centered Care: Personal Doctor Who Knows Child 90%
Access to Specialized Services 76%
Coordination of Care for Children with Chronic Conditions 74%
9
2013 Virginia
FAMIS ChildExecutive Summary (continued)
Noteworthy Findings and Conclusions/Recommendations
The findings obtained from the CAHPS® 5.0H Child Medicaid Survey (with CCC Measurement Set) allows Virginia’s health
insurance program—FAMIS—to measure how well they are meeting their child members’ expectations and needs. Further
analysis of the survey results can illustrate potential areas of opportunity for improvement and ultimately increase the quality
of care that child members receive.
How parents/guardians rate their child’s Health Plan and Health Care overall is an important indicator of quality. It is
important to understand what is driving child members’ overall rating of their Health Plan and the Health Care they receive.
A regression analysis was performed in 2013 to determine which composite measures had a significant impact on FAMIS
members’ overall rating of their Health Plan and Health Care.
Correlation analysis was then conducted between each survey question that comprises the composite measures
(attributes) and the overall rating of their Health Plan (Q54) and Health Care (Q14). As a result, FAMIS can
ascertain which attributes have the greatest impact on members’ overall ratings of their Health Plan and Health Care
and ultimately determine where to direct quality improvement efforts.
Relationship with Rating of Health Plan
Based on the 2013 findings, there are two composite measures that have the most significant impact on FAMIS members’
rating of their Health Plan overall – “Customer Service” and “Getting Needed Care”.
While there are no attributes that are considered unmet needs in terms of being priorities for improving member satisfaction
with their Health Care overall, the attribute “Received information or help needed from child’s health plan’s customer
service” is identified as a key driver that has a stronger impact on members’ rating of their Health Plan overall where they
gave FAMIS only moderate ratings (Summary Rate is 80%-89%).
This attribute should be considered a priority area for FAMIS. If ratings of this attribute are improved, it could have a
positive impact on members’ rating of their Health Plan overall.
There are two attributes that are identified as key drivers that have a stronger impact on members’ ratings of their Health
Plan overall where they gave FAMIS higher ratings (Summary Rate is at least 90%). These attributes should be considered
driving strengths of FAMIS: “Treated with courtesy and respect by child’s health plan’s customer service” and “Got the care,
tests or treatment your child needed”.
10
2013 Virginia
FAMIS ChildExecutive Summary (continued)
Relationship with Rating of Health Care
Based on the 2013 findings, the “Getting Needed Care” composite measure is identified as having the most significant
impact on members’ rating of their Health Care overall.
There are five attributes that are identified as key drivers that have a stronger impact on members’ ratings of their Health
Care overall where they gave FAMIS higher ratings (Summary Rate is at least 90%). These attributes should be considered
driving strengths of FAMIS: “Got the care, tests or treatment your child needed”, “Child’s doctor showed respect for what
you had to say”, “Child’s doctor explained things about your child’s health in a way that was easy to understand”, “Child’s
doctor listened carefully to you” and “Child’s doctor spent enough time with your child”.
There are no attributes that are considered unmet needs in terms of being priorities for improving member satisfaction with
their Health Care overall.
Background, Purpose and
Research Approach
12
2013 Virginia
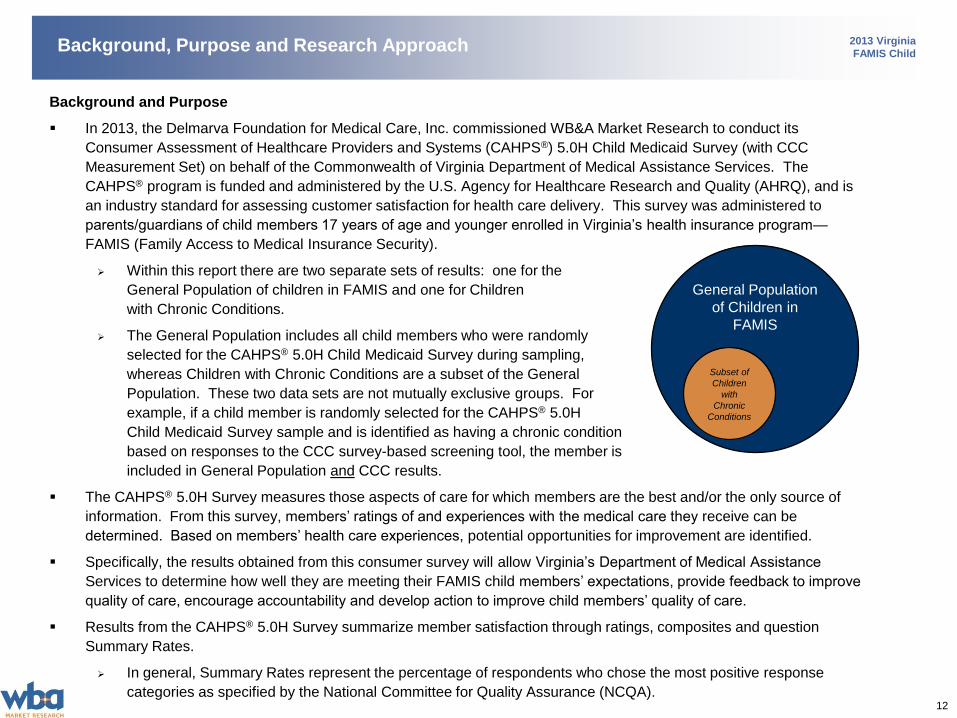
FAMIS ChildBackground, Purpose and Research Approach
Background and Purpose
In 2013, the Delmarva Foundation for Medical Care, Inc. commissioned WB&A Market Research to conduct its
Consumer Assessment of Healthcare Providers and Systems (CAHPS®) 5.0H Child Medicaid Survey (with CCC
Measurement Set) on behalf of the Commonwealth of Virginia Department of Medical Assistance Services. The
CAHPS® program is funded and administered by the U.S. Agency for Healthcare Research and Quality (AHRQ), and is
an industry standard for assessing customer satisfaction for health care delivery. This survey was administered to
parents/guardians of child members 17 years of age and younger enrolled in Virginia’s health insurance program—
FAMIS (Family Access to Medical Insurance Security).
Within this report there are two separate sets of results: one for the
General Population of children in FAMIS and one for Children
with Chronic Conditions.
The General Population includes all child members who were randomly
selected for the CAHPS® 5.0H Child Medicaid Survey during sampling,
whereas Children with Chronic Conditions are a subset of the General
Population. These two data sets are not mutually exclusive groups. For
example, if a child member is randomly selected for the CAHPS® 5.0H
Child Medicaid Survey sample and is identified as having a chronic condition
based on responses to the CCC survey-based screening tool, the member is
included in General Population and CCC results.
The CAHPS® 5.0H Survey measures those aspects of care for which members are the best and/or the only source of
information. From this survey, members’ ratings of and experiences with the medical care they receive can be
determined. Based on members’ health care experiences, potential opportunities for improvement are identified.
Specifically, the results obtained from this consumer survey will allow Virginia’s Department of Medical Assistance
Services to determine how well they are meeting their FAMIS child members’ expectations, provide feedback to improve
quality of care, encourage accountability and develop action to improve child members’ quality of care.
Results from the CAHPS® 5.0H Survey summarize member satisfaction through ratings, composites and question
Summary Rates.
In general, Summary Rates represent the percentage of respondents who chose the most positive response
categories as specified by the National Committee for Quality Assurance (NCQA).
General Population
of Children in
FAMIS
Subset of
Children
with
Chronic
Conditions
13
2013 Virginia
FAMIS ChildBackground, Purpose and Research Approach (continued)
Background and Purpose (continued)
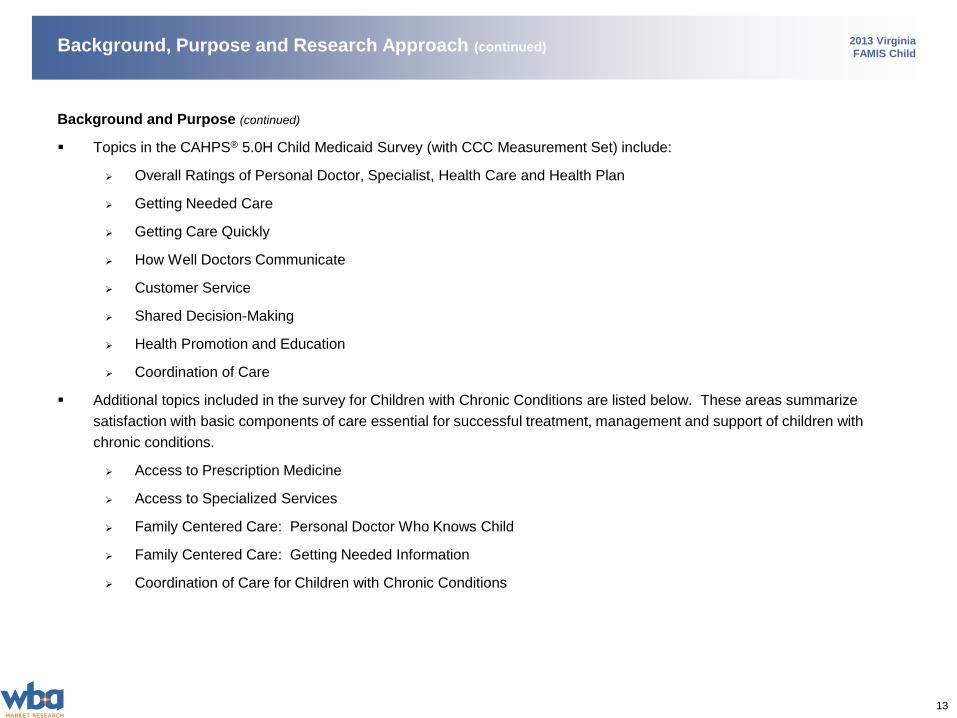
Topics in the CAHPS® 5.0H Child Medicaid Survey (with CCC Measurement Set) include:
Overall Ratings of Personal Doctor, Specialist, Health Care and Health Plan
Getting Needed Care
Getting Care Quickly
How Well Doctors Communicate
Customer Service
Shared Decision-Making
Health Promotion and Education
Coordination of Care
Additional topics included in the survey for Children with Chronic Conditions are listed below. These areas summarize
satisfaction with basic components of care essential for successful treatment, management and support of children with
chronic conditions.
Access to Prescription Medicine
Access to Specialized Services
Family Centered Care: Personal Doctor Who Knows Child
Family Centered Care: Getting Needed Information
Coordination of Care for Children with Chronic Conditions
14
2013 Virginia
FAMIS ChildBackground, Purpose and Research Approach (continued)
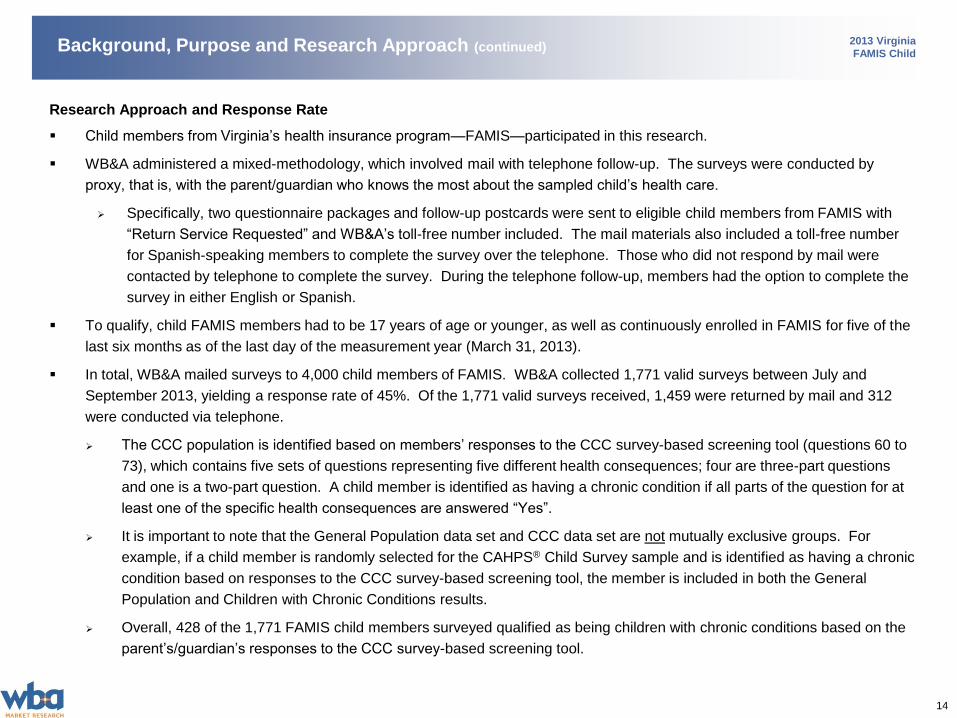
Research Approach and Response Rate
Child members from Virginia’s health insurance program—FAMIS—participated in this research.
WB&A administered a mixed-methodology, which involved mail with telephone follow-up. The surveys were conducted by
proxy, that is, with the parent/guardian who knows the most about the sampled child’s health care.
Specifically, two questionnaire packages and follow-up postcards were sent to eligible child members from FAMIS with
“Return Service Requested” and WB&A’s toll-free number included. The mail materials also included a toll-free number
for Spanish-speaking members to complete the survey over the telephone. Those who did not respond by mail were
contacted by telephone to complete the survey. During the telephone follow-up, members had the option to complete the
survey in either English or Spanish.
To qualify, child FAMIS members had to be 17 years of age or younger, as well as continuously enrolled in FAMIS for five of the
last six months as of the last day of the measurement year (March 31, 2013).
In total, WB&A mailed surveys to 4,000 child members of FAMIS. WB&A collected 1,771 valid surveys between July and
September 2013, yielding a response rate of 45%. Of the 1,771 valid surveys received, 1,459 were returned by mail and 312
were conducted via telephone.
The CCC population is identified based on members’ responses to the CCC survey-based screening tool (questions 60 to
73), which contains five sets of questions representing five different health consequences; four are three-part questions
and one is a two-part question. A child member is identified as having a chronic condition if all parts of the question for at
least one of the specific health consequences are answered “Yes”.
It is important to note that the General Population data set and CCC data set are not mutually exclusive groups. For
example, if a child member is randomly selected for the CAHPS® Child Survey sample and is identified as having a chronic
condition based on responses to the CCC survey-based screening tool, the member is included in both the General
Population and Children with Chronic Conditions results.
Overall, 428 of the 1,771 FAMIS child members surveyed qualified as being children with chronic conditions based on the
parent’s/guardian’s responses to the CCC survey-based screening tool.
15
2013 Virginia
FAMIS Child
1,771
4,000 – 99
Background, Purpose and Research Approach (continued)
Research Approach and Response Rate (continued)
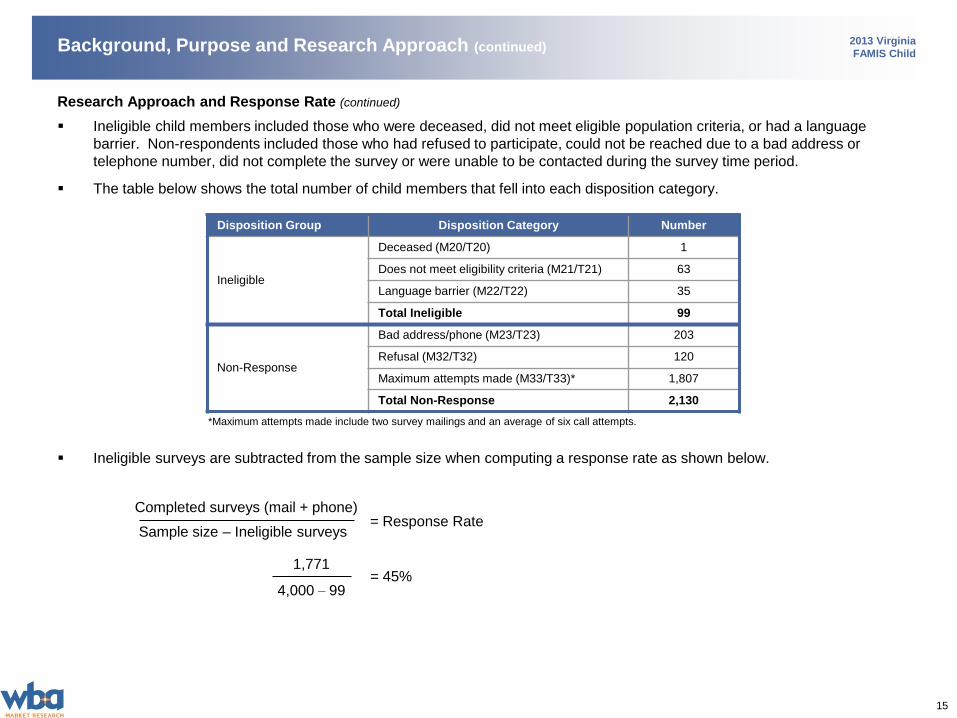
Ineligible child members included those who were deceased, did not meet eligible population criteria, or had a language
barrier. Non-respondents included those who had refused to participate, could not be reached due to a bad address or
telephone number, did not complete the survey or were unable to be contacted during the survey time period.
The table below shows the total number of child members that fell into each disposition category.
Ineligible surveys are subtracted from the sample size when computing a response rate as shown below.
Completed surveys (mail + phone)
Sample size – Ineligible surveys
Disposition Group Disposition Category Number
Ineligible
Deceased (M20/T20) 1
Does not meet eligibility criteria (M21/T21) 63
Language barrier (M22/T22) 35
Total Ineligible 99
Non-Response
Bad address/phone (M23/T23) 203
Refusal (M32/T32) 120
Maximum attempts made (M33/T33)* 1,807
Total Non-Response 2,130
*Maximum attempts made include two survey mailings and an average of six call attempts.
= Response Rate
= 45%
16
2013 Virginia
FAMIS Child
How to Read and Interpret the Results
This report includes the results of the CAHPS® 5.0H Child Medicaid Survey questions about child members’ experiences with
their health plan and the medical care they received.
Results are shown based on the type of question asked and/or the content of the question:
Results from “Yes-No” questions asked members whether they had a particular experience in the previous six months.
Results from questions based on how often respondents had certain experiences used the scale of “Always, Usually,
Sometimes or Never”.
Results from composite scores were derived by combining the results for several questions that asked how often
respondents had certain experiences using the scale of “Always, Usually, Sometimes or Never”; or whether respondents
had certain experiences using the scale of “A lot, Some, A little or Not at all”. The composite scores measure main issues
of concern (e.g., “Getting Needed Care”, “Getting Care Quickly”, “How Well Doctors Communicate”, “Customer Service”,
“Shared Decision-Making”, etc.).
Results from rating questions asked members to give their overall rating on a “0 to 10” scale, where a “0” means the worst
possible and a “10” means the best possible.
Throughout this report, results are shown as “Summary Rates”. Summary Rates represent the most favorable responses for
that question and are defined by the HEDIS 2013 CAHPS® 5.0H guidelines.
For the purposes of brevity, the use of the letter “Q” throughout this report represents the word “Question.” For instance “Q39”
means “Question 39.”
Caution should be taken when evaluating data with a small base (n<35) due to the high level of sampling error around the data.
Percentages do not always add up to 100% due to rounding.
Background, Purpose and Research Approach (continued)
Profile of Child Members
18
2013 Virginia
FAMIS ChildProfile of Child Members
The CAHPS® 5.0H Child Medicaid Survey (with CCC Measurement Set) is conducted by proxy, that is, with the parent/guardian who
knows the most about the sampled child’s health care.
The following pages provide a profile of the child FAMIS members whose parents/guardians responded to this survey on their
behalf, as well as a profile of the parents/guardians themselves.
19
2013 Virginia
FAMIS Child
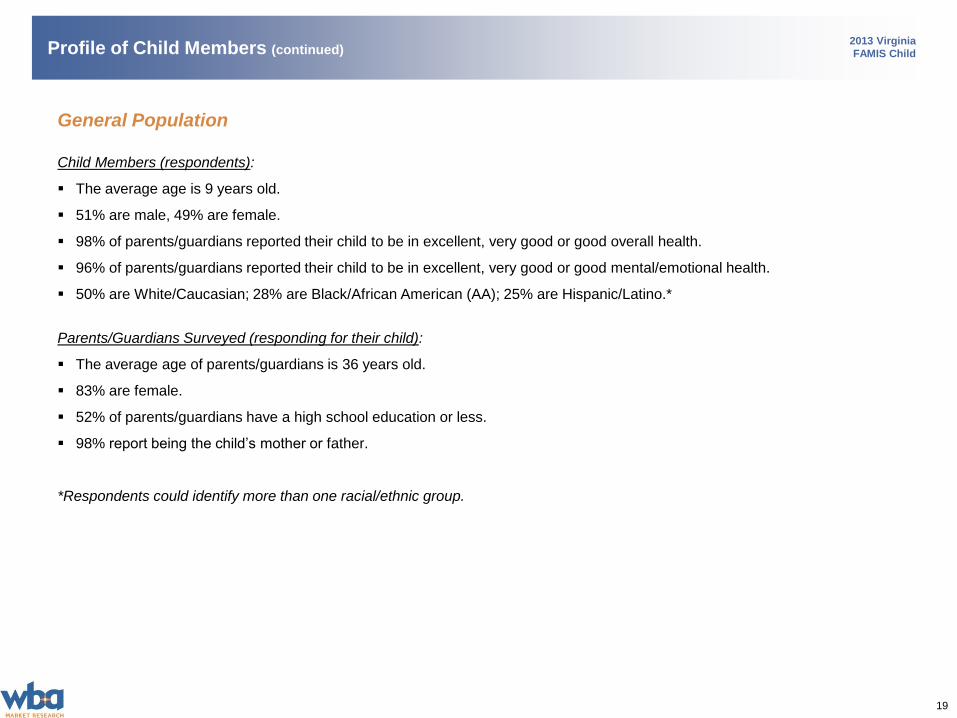
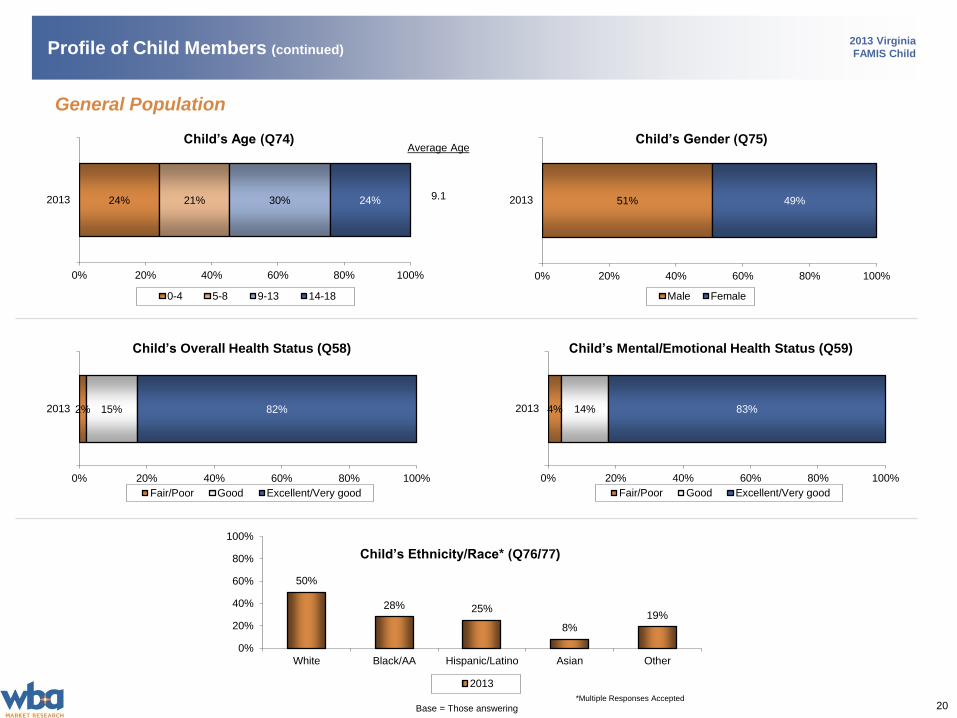
General Population
Child Members (respondents):
The average age is 9 years old.
51% are male, 49% are female.
98% of parents/guardians reported their child to be in excellent, very good or good overall health.
96% of parents/guardians reported their child to be in excellent, very good or good mental/emotional health.
50% are White/Caucasian; 28% are Black/African American (AA); 25% are Hispanic/Latino.*
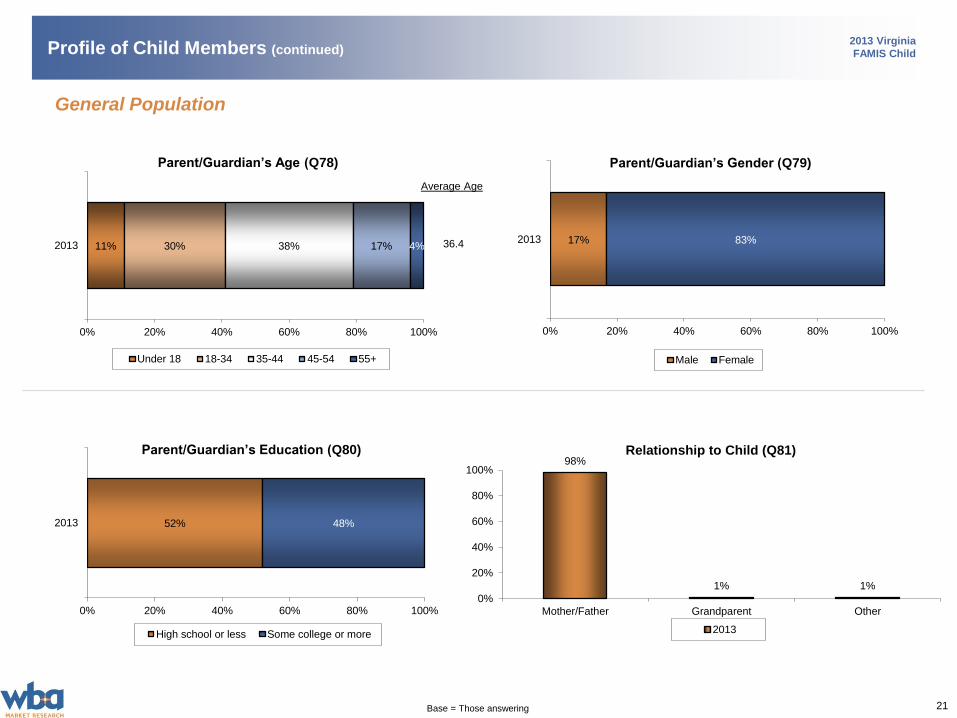
Parents/Guardians Surveyed (responding for their child):
The average age of parents/guardians is 36 years old.
83% are female.
52% of parents/guardians have a high school education or less.
98% report being the child’s mother or father.
*Respondents could identify more than one racial/ethnic group.
Profile of Child Members (continued)
20
2013 Virginia
FAMIS Child
2% 15% 82%
0% 20% 40% 60% 80% 100%
2013
Fair/Poor Good Excellent/Very good
24% 21% 30% 24%
0% 20% 40% 60% 80% 100%
2013
0-4 5-8 9-13 14-18
Child’s Gender (Q75)Child’s Age (Q74)
51% 49%
0% 20% 40% 60% 80% 100%
2013
Male Female
Child’s Ethnicity/Race* (Q76/77)
Child’s Overall Health Status (Q58)
General Population
*Multiple Responses Accepted
Base = Those answering
Average Age
9.1
50%
28% 25%
8%19%
0%
20%
40%
60%
80%
100%
White Black/AA Hispanic/Latino Asian Other
2013
Profile of Child Members (continued)
4% 14% 83%
0% 20% 40% 60% 80% 100%
2013
Fair/Poor Good Excellent/Very good
Child’s Mental/Emotional Health Status (Q59)
21
2013 Virginia
FAMIS Child
52% 48%
0% 20% 40% 60% 80% 100%
2013
High school or less Some college or more
11% 30% 38% 17% 4%
0% 20% 40% 60% 80% 100%
2013
Under 18 18-34 35-44 45-54 55+
Parent/Guardian’s Gender (Q79)Parent/Guardian’s Age (Q78)
17% 83%
0% 20% 40% 60% 80% 100%
2013
Male Female
Parent/Guardian’s Education (Q80)
General Population
Base = Those answering
Profile of Child Members (continued)
Relationship to Child (Q81)
Average Age
36.4
98%
1% 1%
0%
20%
40%
60%
80%
100%
Mother/Father Grandparent Other
2013
22
2013 Virginia
FAMIS ChildProfile of Child Members (continued)
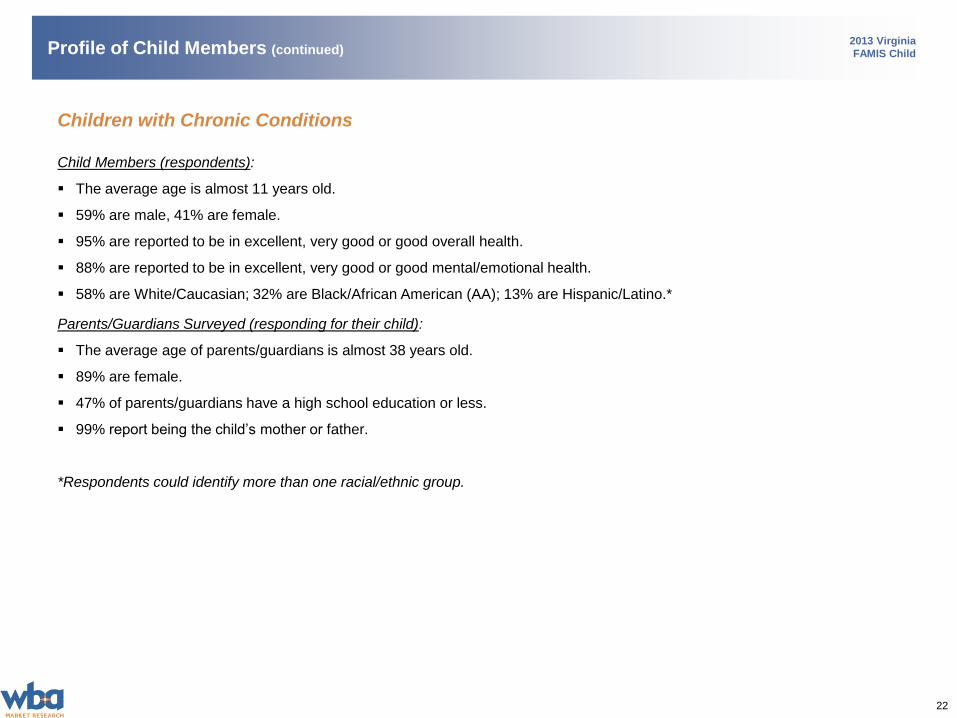
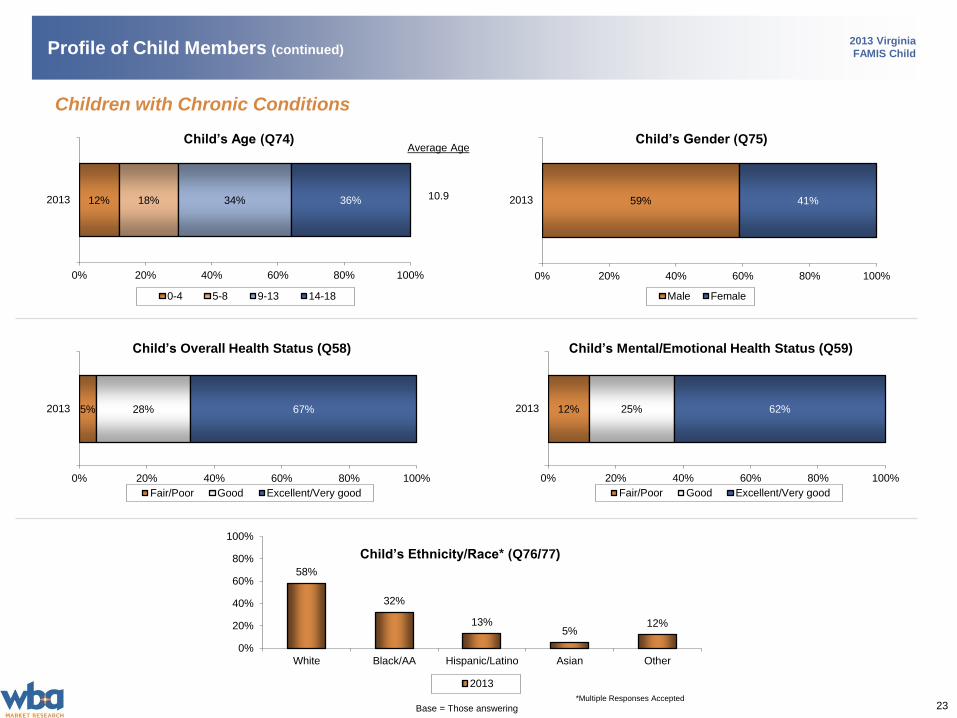
Children with Chronic Conditions
Child Members (respondents):
The average age is almost 11 years old.
59% are male, 41% are female.
95% are reported to be in excellent, very good or good overall health.
88% are reported to be in excellent, very good or good mental/emotional health.
58% are White/Caucasian; 32% are Black/African American (AA); 13% are Hispanic/Latino.*
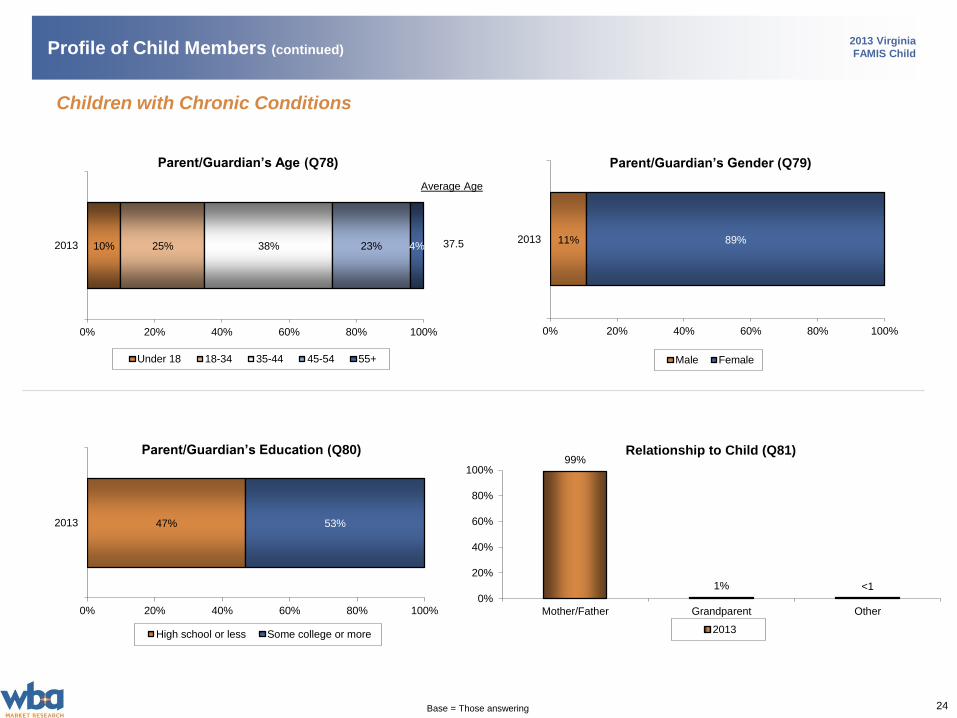
Parents/Guardians Surveyed (responding for their child):
The average age of parents/guardians is almost 38 years old.
89% are female.
47% of parents/guardians have a high school education or less.
99% report being the child’s mother or father.
*Respondents could identify more than one racial/ethnic group.
23
2013 Virginia
FAMIS Child
5% 28% 67%
0% 20% 40% 60% 80% 100%
2013
Fair/Poor Good Excellent/Very good
12% 18% 34% 36%
0% 20% 40% 60% 80% 100%
2013
0-4 5-8 9-13 14-18
Child’s Gender (Q75)Child’s Age (Q74)
59% 41%
0% 20% 40% 60% 80% 100%
2013
Male Female
Child’s Ethnicity/Race* (Q76/77)
Child’s Overall Health Status (Q58)
*Multiple Responses Accepted
Base = Those answering
Average Age
10.9
58%
32%
13%5%
12%
0%
20%
40%
60%
80%
100%
White Black/AA Hispanic/Latino Asian Other
2013
Profile of Child Members (continued)
12% 25% 62%
0% 20% 40% 60% 80% 100%
2013
Fair/Poor Good Excellent/Very good
Child’s Mental/Emotional Health Status (Q59)
Children with Chronic Conditions
24
2013 Virginia
FAMIS Child
47% 53%
0% 20% 40% 60% 80% 100%
2013
High school or less Some college or more
10% 25% 38% 23% 4%
0% 20% 40% 60% 80% 100%
2013
Under 18 18-34 35-44 45-54 55+
Parent/Guardian’s Gender (Q79)Parent/Guardian’s Age (Q78)
11% 89%
0% 20% 40% 60% 80% 100%
2013
Male Female
Parent/Guardian’s Education (Q80)
Base = Those answering
Profile of Child Members (continued)
Relationship to Child (Q81)99%
1% <10%
20%
40%
60%
80%
100%
Mother/Father Grandparent Other
2013
Average Age
37.5
Children with Chronic Conditions
Survey Results
26
2013 Virginia
FAMIS ChildOverall Ratings
7% 28% 66%
0% 20% 40% 60% 80% 100%
2013
0-6 7-8 9-10
Personal Doctor (Q41)Health Care Overall (Q14)
Specialist (Q48) Health Plan Overall (Q54)
% 8,9,10
85%
General Population
Base = Those able to rate based on experience
Members were asked to give their overall ratings of their Doctors, Health Care and Health Plan using
a “0 to 10” scale, where a “0” means the worst possible rating and a “10” means the best possible rating.
Overall, parents/guardians gave high satisfaction ratings (rating 8, 9 or 10) to their child’s:
Personal Doctor (89%);
Specialist (85%);
Health Care overall (85%); and
Health Plan overall (84%).
6% 21% 72%
0% 20% 40% 60% 80% 100%
2013
0-6 7-8 9-10
% 8,9,10
89%
7% 24% 69%
0% 20% 40% 60% 80% 100%
2013
0-6 7-8 9-10
% 8,9,10
85% 9% 25% 66%
0% 20% 40% 60% 80% 100%
2013
0-6 7-8 9-10
% 8,9,10
84%
27
2013 Virginia
FAMIS ChildOverall Ratings (continued)
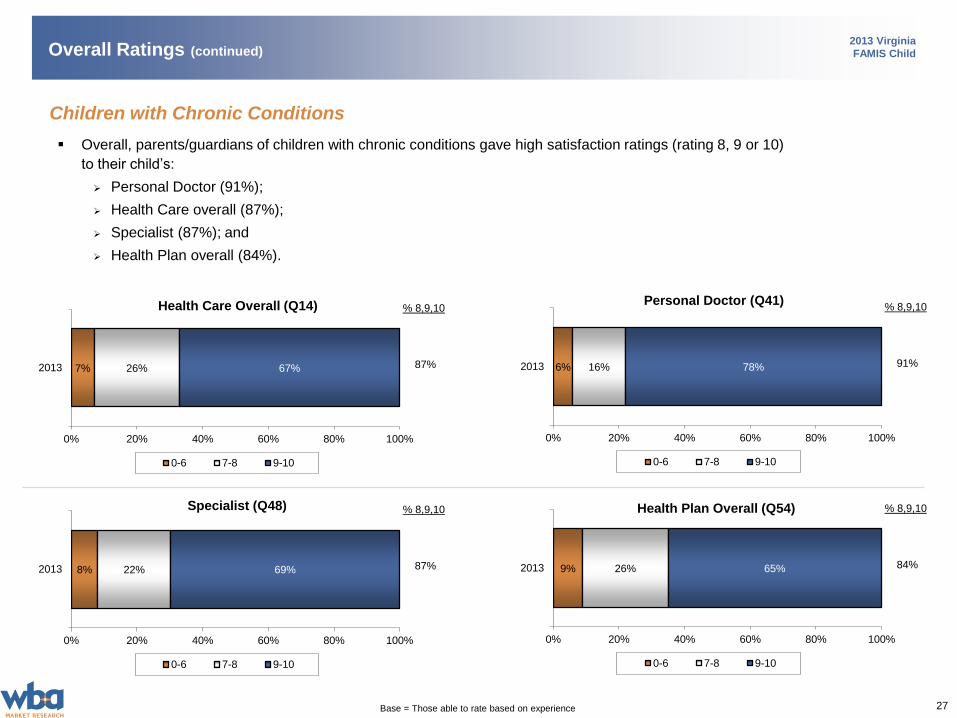
Children with Chronic Conditions
Overall, parents/guardians of children with chronic conditions gave high satisfaction ratings (rating 8, 9 or 10)
to their child’s:
Personal Doctor (91%);
Health Care overall (87%);
Specialist (87%); and
Health Plan overall (84%).
7% 26% 67%
0% 20% 40% 60% 80% 100%
2013
0-6 7-8 9-10
Personal Doctor (Q41)Health Care Overall (Q14)
Specialist (Q48) Health Plan Overall (Q54)
% 8,9,10
87%
Base = Those able to rate based on experience
6% 16% 78%
0% 20% 40% 60% 80% 100%
2013
0-6 7-8 9-10
% 8,9,10
91%
8% 22% 69%
0% 20% 40% 60% 80% 100%
2013
0-6 7-8 9-10
% 8,9,10
87% 9% 26% 65%
0% 20% 40% 60% 80% 100%
2013
0-6 7-8 9-10
% 8,9,10
84%
28
Composite Scores2013 Virginia
FAMIS Child
Composite scores are derived by combining survey results of similar questions. The table below shows how each standard
composite score is defined.
Composite Measure/Rating Item Survey Question(s) What is Measured Summary Rate1
Getting Needed Care 15 and 46
Measures members’ experiences in the last 6
months when trying to get care from specialists and
through health plan
% of members who responded
“Usually” or “Always”
Getting Care Quickly 4 and 6Measures members’ experiences with receiving care
and getting appointments as soon as they needed
% of members who responded
“Usually” or “Always”
How Well Doctors Communicate 32, 33, 34 and 37
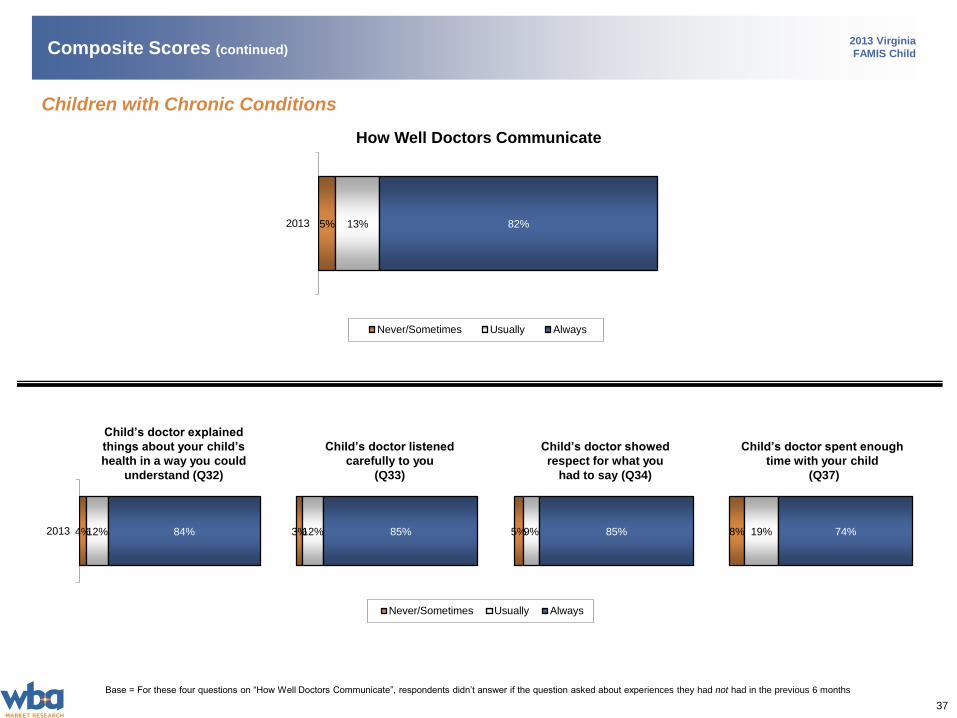
Measures how well personal doctor explains things,
listens to them, shows respect for what they have to
say and spends enough time with their child
% of members who responded
“Usually” or “Always”
Customer Service 50 and 51
Measures members’ experiences with getting the
information needed and treatment by Customer
Service staff
% of members who responded
“Usually” or “Always”
Shared Decision-Making 11, 12 and 13
Measures members’ experiences with doctors
discussing the pros and cons of starting or stopping
a prescription medicine and asking the member what
they thought was best for their child
% of members who responded
“A lot”, “Some” or “Yes”
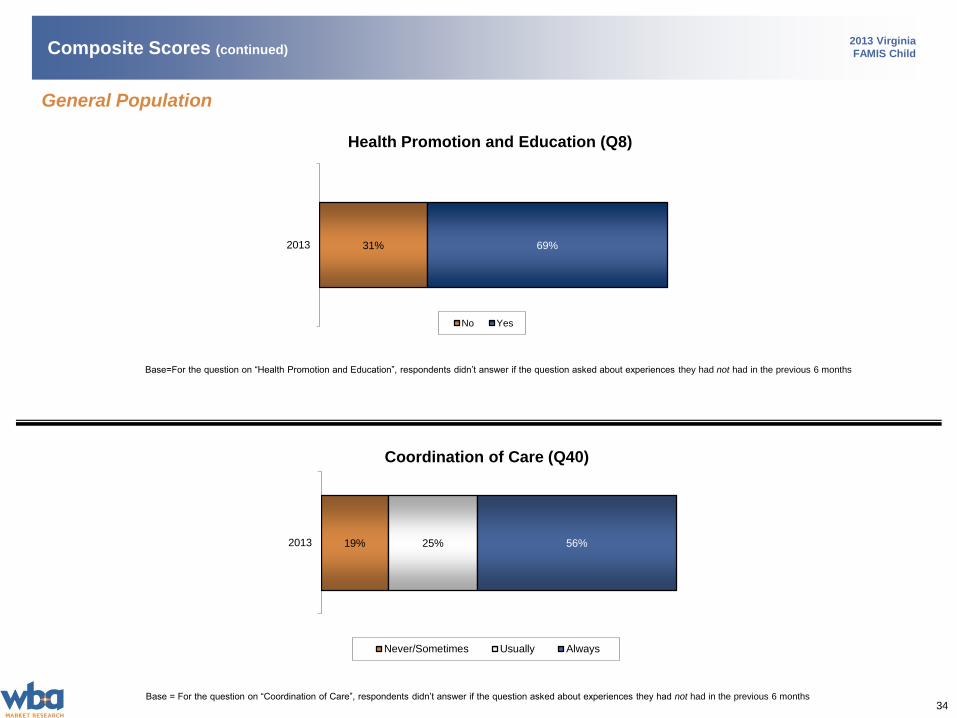
Health Promotion and Education 8Measures members’ experience with their doctor
discussing specific things to do to prevent illness
% of members who responded
“Yes”
Coordination of Care 40
Measures members’ perception of whether their
doctor is up-to-date about the care their child
received from other doctors or health providers
% of members who responded
“Usually” or “Always”
1Summary Rates most often represent the most favorable responses for that question.
29
2013 Virginia
FAMIS Child
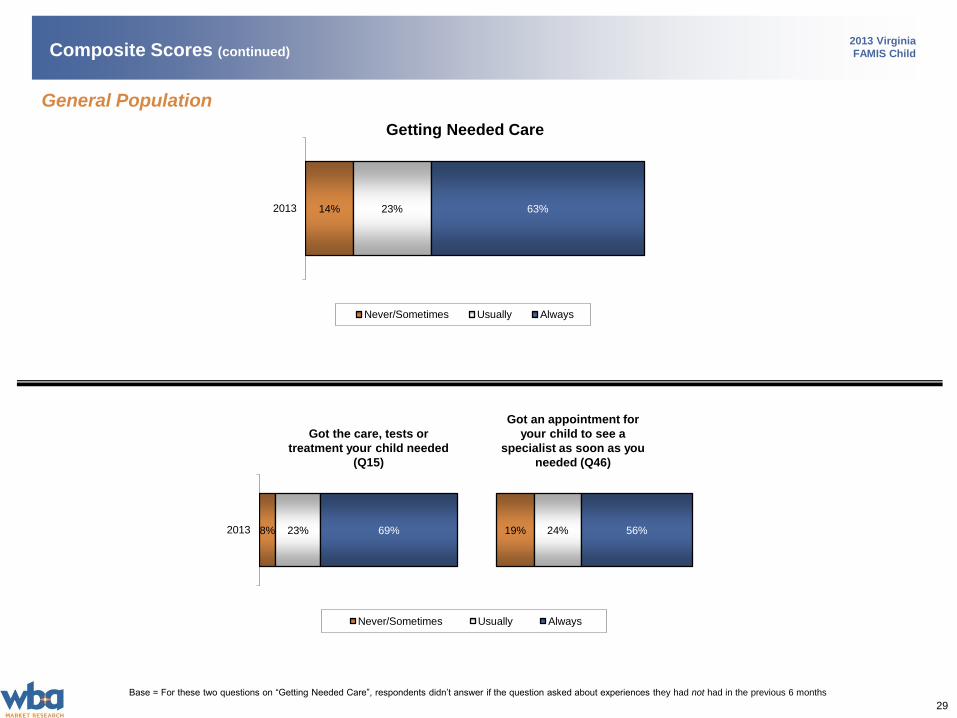
Getting Needed Care
14% 23% 63%2013
Never/Sometimes Usually Always
Base = For these two questions on “Getting Needed Care”, respondents didn’t answer if the question asked about experiences they had not had in the previous 6 months
General Population
8% 23% 69% 19% 24% 56%2013
Never/Sometimes Usually Always
Composite Scores (continued)
Got the care, tests or
treatment your child needed
(Q15)
Got an appointment for
your child to see a
specialist as soon as you
needed (Q46)
30
2013 Virginia
FAMIS Child
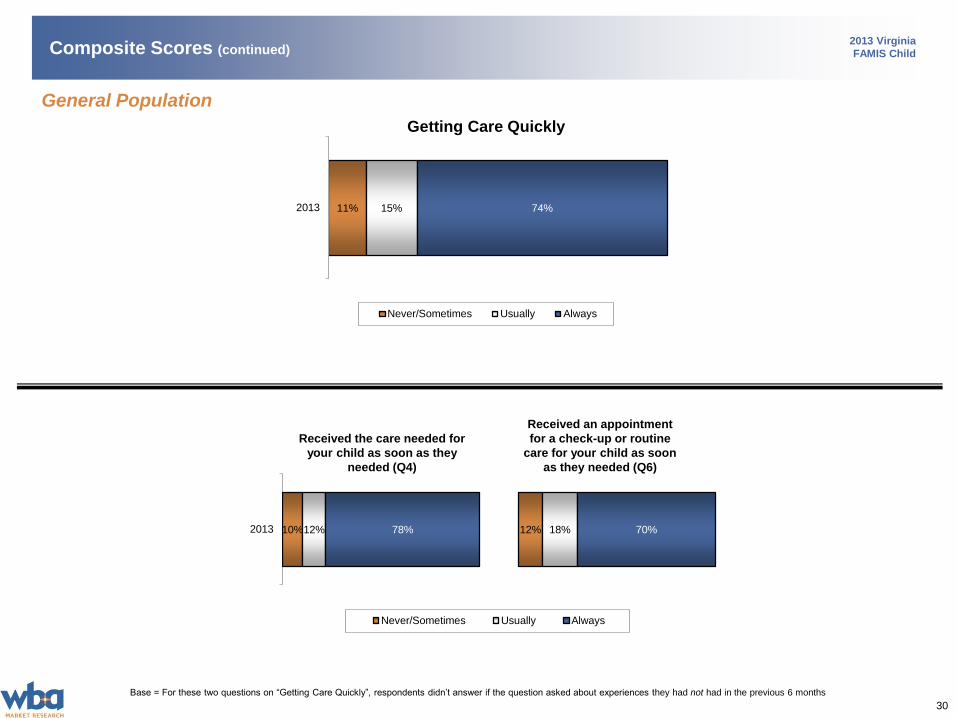
Getting Care Quickly
Base = For these two questions on “Getting Care Quickly”, respondents didn’t answer if the question asked about experiences they had not had in the previous 6 months
General Population
Composite Scores (continued)
Received the care needed for
your child as soon as they
needed (Q4)
Received an appointment
for a check-up or routine
care for your child as soon
as they needed (Q6)
11% 15% 74%2013
Never/Sometimes Usually Always
10%12% 78% 12% 18% 70%2013
Never/Sometimes Usually Always
31
2013 Virginia
FAMIS Child
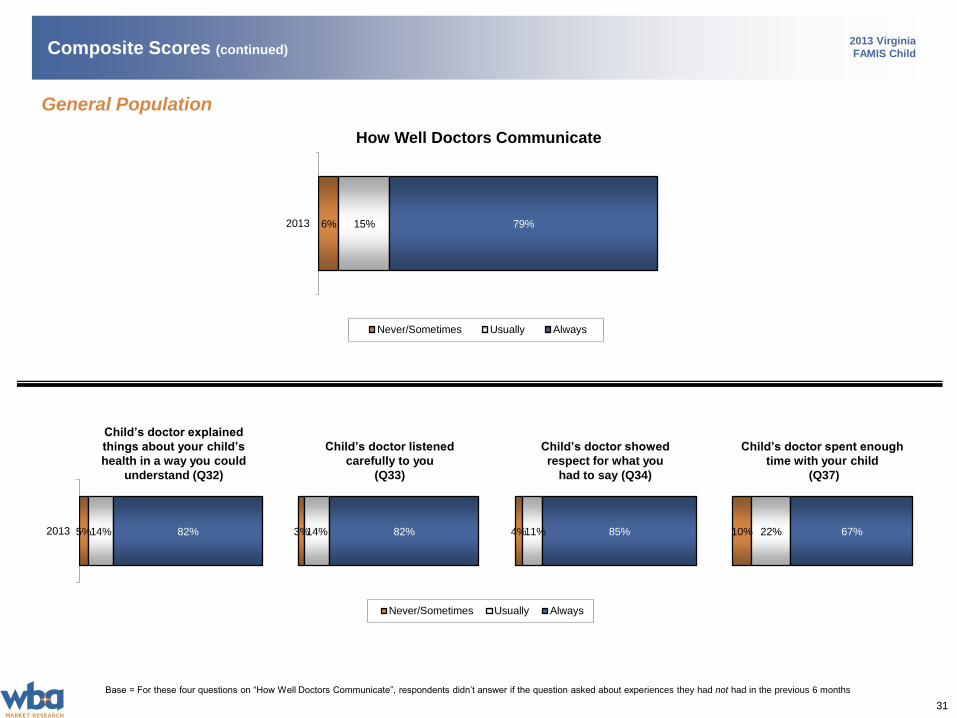
How Well Doctors Communicate
Base = For these four questions on “How Well Doctors Communicate”, respondents didn’t answer if the question asked about experiences they had not had in the previous 6 months
5%14% 82% 3%14% 82% 4%11% 85% 10% 22% 67%2013
Never/Sometimes Usually Always
General Population
Composite Scores (continued)
Child’s doctor explained
things about your child’s
health in a way you could
understand (Q32)
Child’s doctor listened
carefully to you
(Q33)
Child’s doctor showed
respect for what you
had to say (Q34)
Child’s doctor spent enough
time with your child
(Q37)
6% 15% 79%2013
Never/Sometimes Usually Always
32
2013 Virginia
FAMIS Child
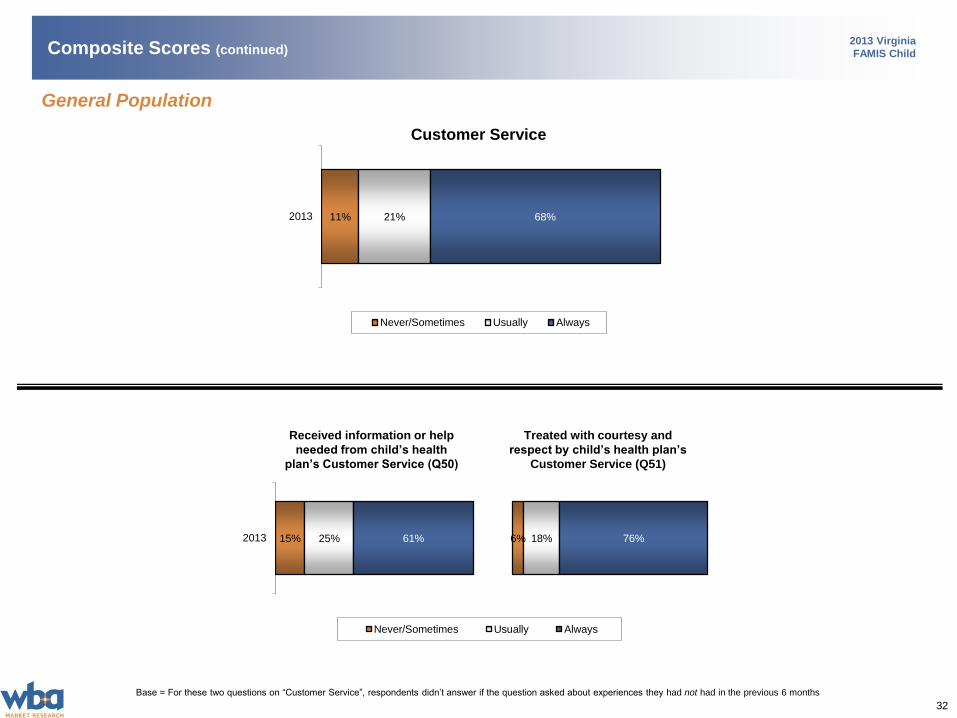
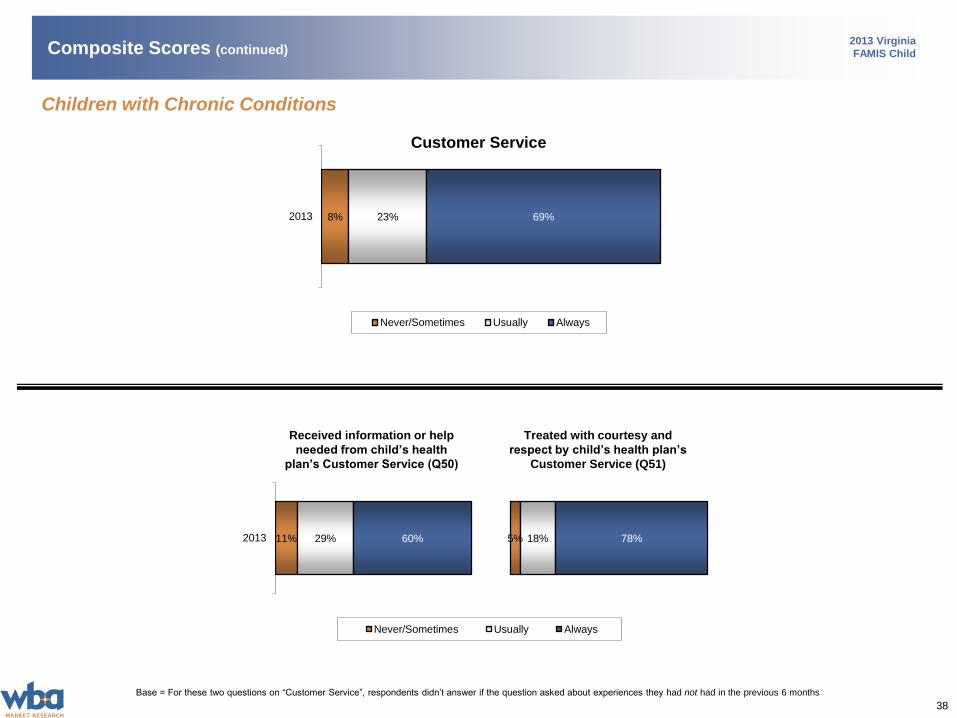
Customer Service
Base = For these two questions on “Customer Service”, respondents didn’t answer if the question asked about experiences they had not had in the previous 6 months
General Population
Composite Scores (continued)
Received information or help
needed from child’s health
plan’s Customer Service (Q50)
Treated with courtesy and
respect by child’s health plan’s
Customer Service (Q51)
11% 21% 68%2013
Never/Sometimes Usually Always
15% 25% 61% 6% 18% 76%2013
Never/Sometimes Usually Always
33
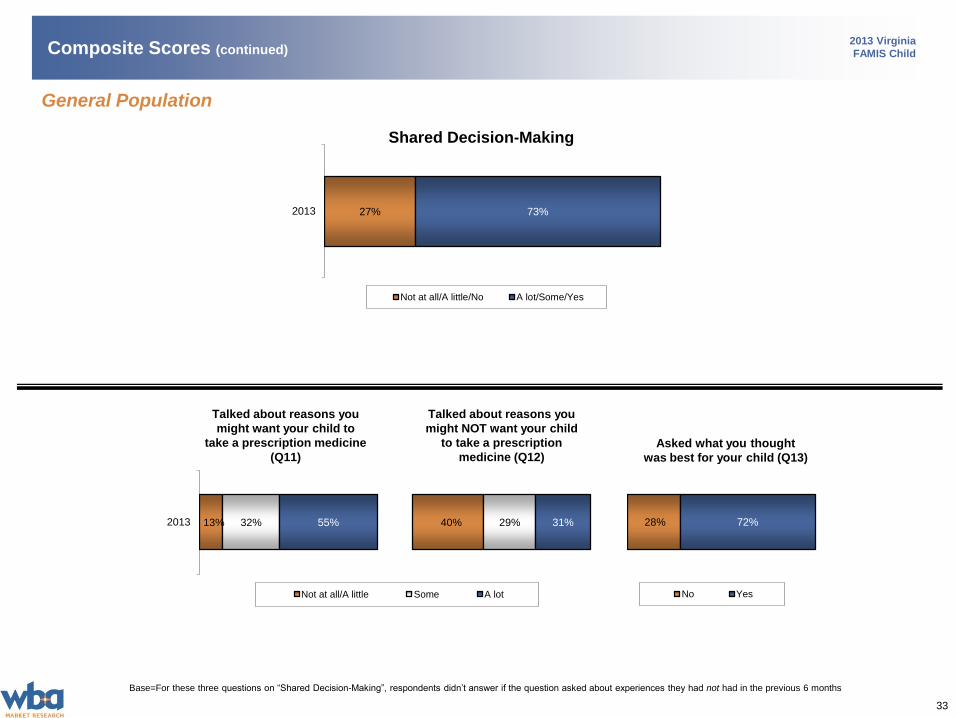
2013 Virginia
FAMIS Child
General Population
Composite Scores (continued)
Shared Decision-Making
27% 73%2013
Not at all/A little/No A lot/Some/Yes
Talked about reasons you
might want your child to
take a prescription medicine
(Q11)
Talked about reasons you
might NOT want your child
to take a prescription
medicine (Q12)Asked what you thought
was best for your child (Q13)
13% 32% 55% 40% 29% 31%2013
Not at all/A little Some A lot
28% 72%
No Yes
Base=For these three questions on “Shared Decision-Making”, respondents didn’t answer if the question asked about experiences they had not had in the previous 6 months
34
2013 Virginia
FAMIS Child
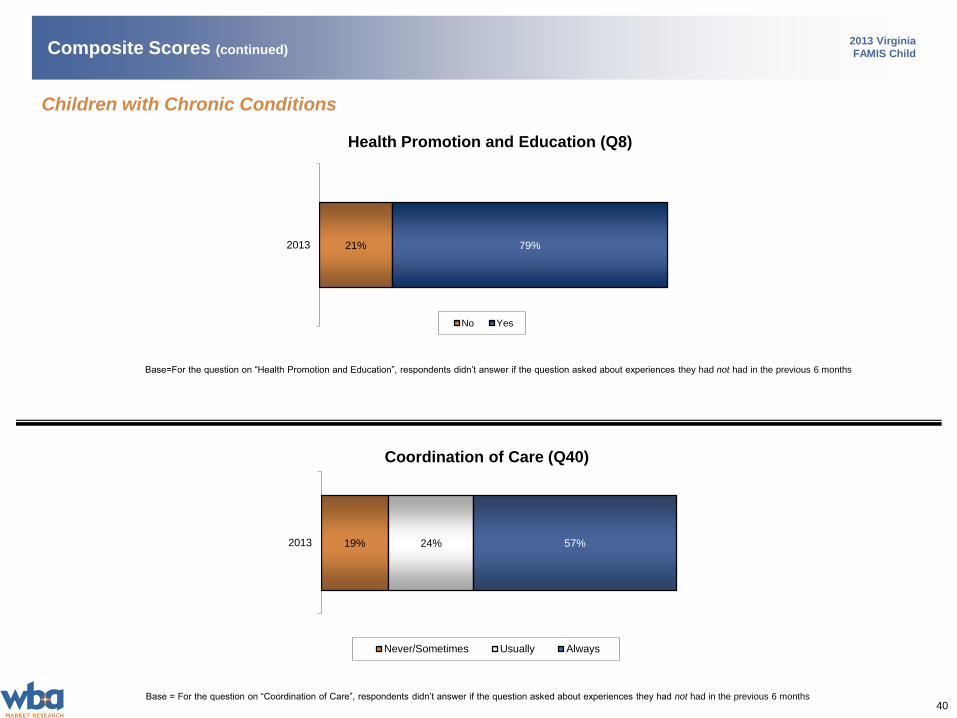
Base = For the question on “Coordination of Care”, respondents didn’t answer if the question asked about experiences they had not had in the previous 6 months
General Population
Composite Scores (continued)
Coordination of Care (Q40)
31% 69%2013
No Yes
Health Promotion and Education (Q8)
Base=For the question on “Health Promotion and Education”, respondents didn’t answer if the question asked about experiences they had not had in the previous 6 months
19% 25% 56%2013
Never/Sometimes Usually Always

35
2013 Virginia
FAMIS Child
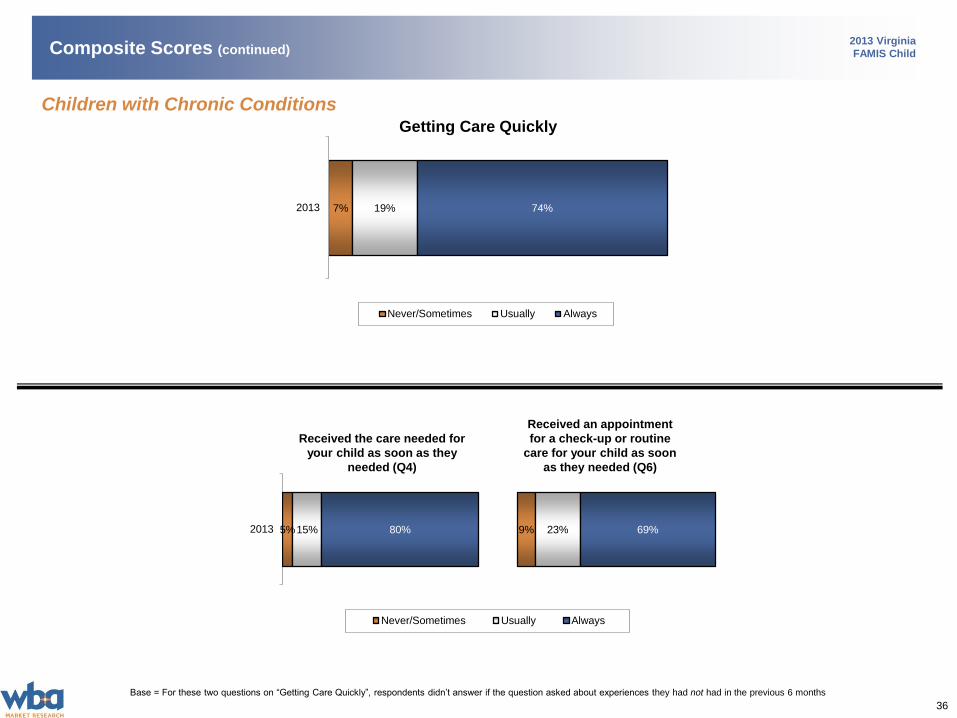
Getting Needed Care
12% 23% 65%2013
Never/Sometimes Usually Always
Base = For these two questions on “Getting Needed Care”, respondents didn’t answer if the question asked about experiences they had not had in the previous 6 months
6% 22% 71% 17% 24% 59%2013
Never/Sometimes Usually Always
Composite Scores (continued)
Got the care, tests or
treatment your child needed
(Q15)
Got an appointment for
your child to see a
specialist as soon as you
needed (Q46)
Children with Chronic Conditions
36
2013 Virginia
FAMIS Child
Getting Care Quickly
Base = For these two questions on “Getting Care Quickly”, respondents didn’t answer if the question asked about experiences they had not had in the previous 6 months
Composite Scores (continued)
Received the care needed for
your child as soon as they
needed (Q4)
Received an appointment
for a check-up or routine
care for your child as soon
as they needed (Q6)
7% 19% 74%2013
Never/Sometimes Usually Always
5%15% 80% 9% 23% 69%2013
Never/Sometimes Usually Always
Children with Chronic Conditions
37
2013 Virginia
FAMIS Child
How Well Doctors Communicate
Base = For these four questions on “How Well Doctors Communicate”, respondents didn’t answer if the question asked about experiences they had not had in the previous 6 months
4%12% 84% 3%12% 85% 5%9% 85% 8% 19% 74%2013
Never/Sometimes Usually Always
Composite Scores (continued)
Child’s doctor explained
things about your child’s
health in a way you could
understand (Q32)
Child’s doctor listened
carefully to you
(Q33)
Child’s doctor showed
respect for what you
had to say (Q34)
Child’s doctor spent enough
time with your child
(Q37)
5% 13% 82%2013
Never/Sometimes Usually Always
Children with Chronic Conditions
38
2013 Virginia
FAMIS Child
Customer Service
Base = For these two questions on “Customer Service”, respondents didn’t answer if the question asked about experiences they had not had in the previous 6 months
Composite Scores (continued)
Received information or help
needed from child’s health
plan’s Customer Service (Q50)
Treated with courtesy and
respect by child’s health plan’s
Customer Service (Q51)
8% 23% 69%2013
Never/Sometimes Usually Always
11% 29% 60% 5% 18% 78%2013
Never/Sometimes Usually Always
Children with Chronic Conditions
39
2013 Virginia
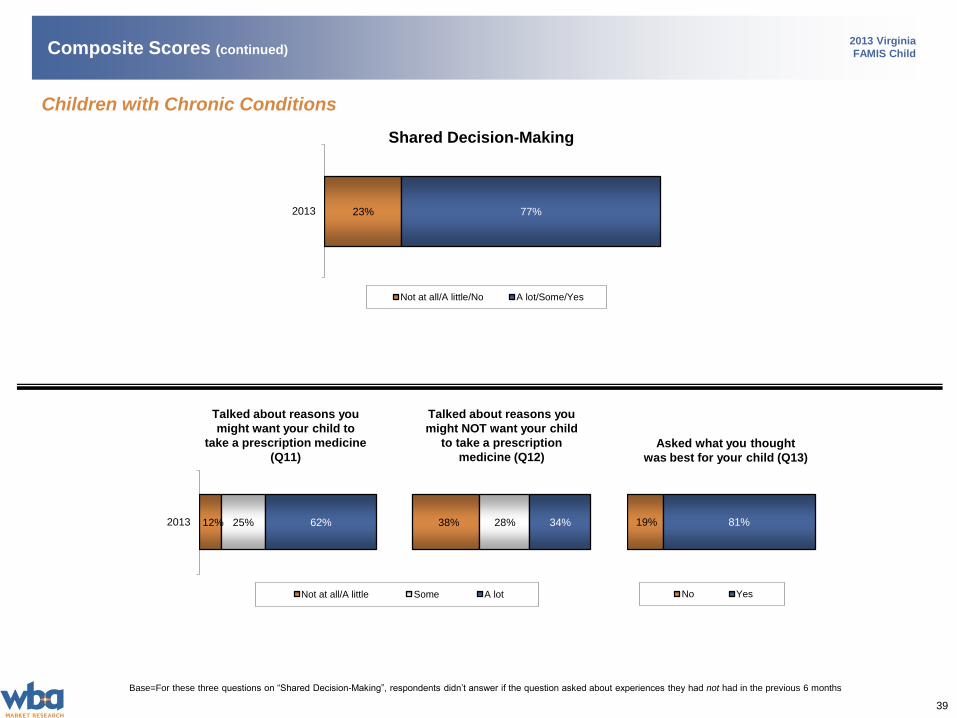
FAMIS ChildComposite Scores (continued)
Shared Decision-Making
23% 77%2013
Not at all/A little/No A lot/Some/Yes
Talked about reasons you
might want your child to
take a prescription medicine
(Q11)
Talked about reasons you
might NOT want your child
to take a prescription
medicine (Q12)Asked what you thought
was best for your child (Q13)
12% 25% 62% 38% 28% 34%2013
Not at all/A little Some A lot
19% 81%
No Yes
Base=For these three questions on “Shared Decision-Making”, respondents didn’t answer if the question asked about experiences they had not had in the previous 6 months
Children with Chronic Conditions
40
2013 Virginia
FAMIS Child
Base = For the question on “Coordination of Care”, respondents didn’t answer if the question asked about experiences they had not had in the previous 6 months
Composite Scores (continued)
Coordination of Care (Q40)
21% 79%2013
No Yes
Health Promotion and Education (Q8)
Base=For the question on “Health Promotion and Education”, respondents didn’t answer if the question asked about experiences they had not had in the previous 6 months
19% 24% 57%2013
Never/Sometimes Usually Always
Children with Chronic Conditions
41
2013 Virginia
FAMIS Child
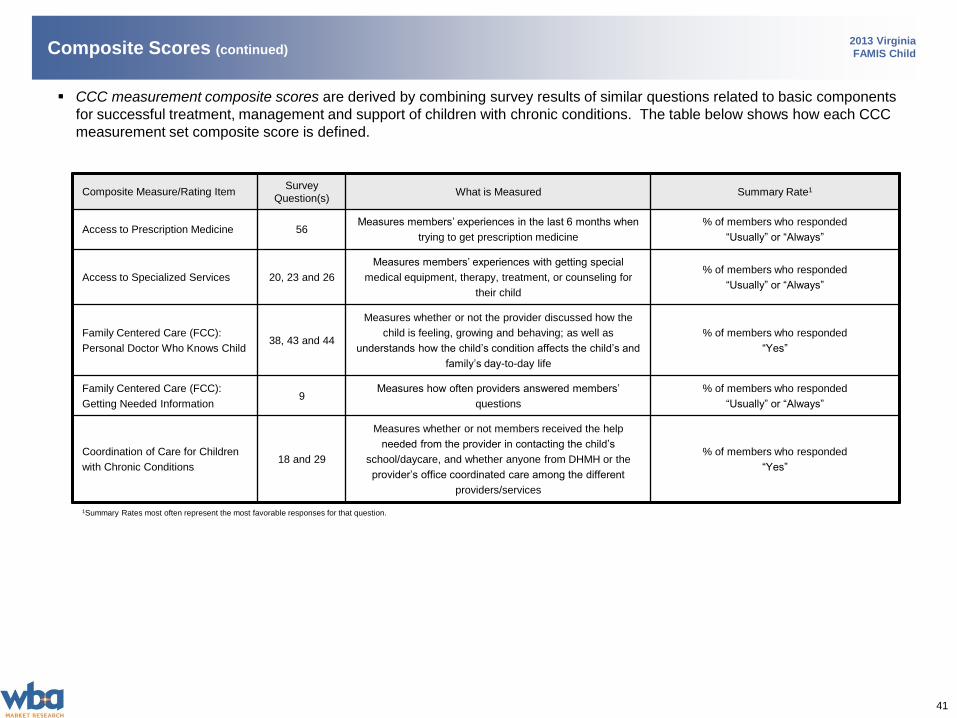
CCC measurement composite scores are derived by combining survey results of similar questions related to basic components
for successful treatment, management and support of children with chronic conditions. The table below shows how each CCC
measurement set composite score is defined.
Composite Scores (continued)
Composite Measure/Rating ItemSurvey
Question(s)What is Measured Summary Rate1
Access to Prescription Medicine 56Measures members’ experiences in the last 6 months when
trying to get prescription medicine
% of members who responded
“Usually” or “Always”
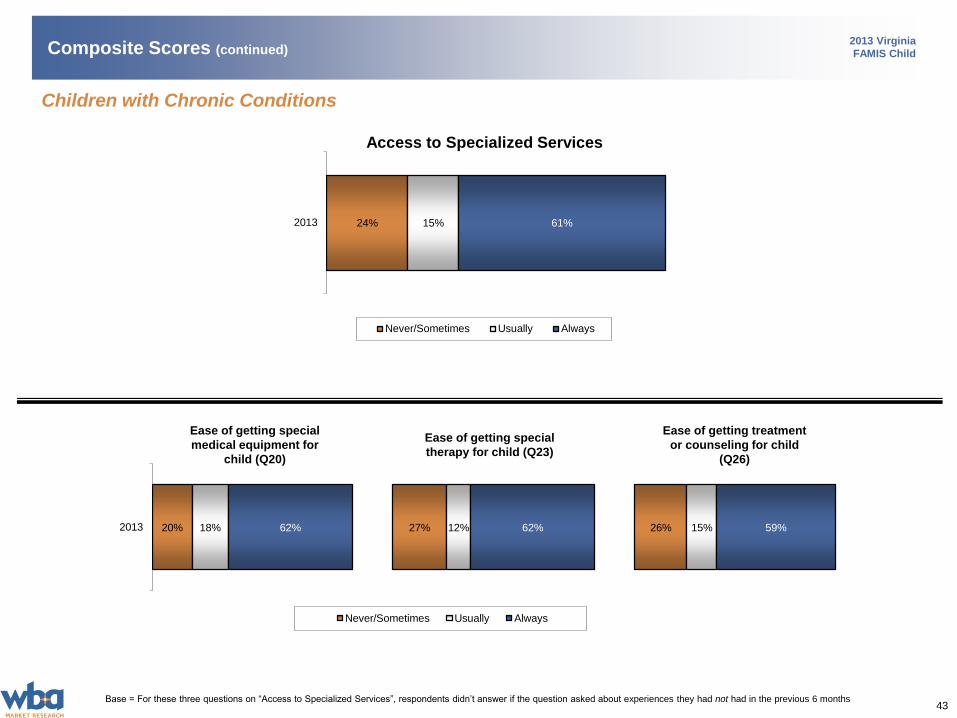
Access to Specialized Services 20, 23 and 26
Measures members’ experiences with getting special
medical equipment, therapy, treatment, or counseling for
their child
% of members who responded
“Usually” or “Always”
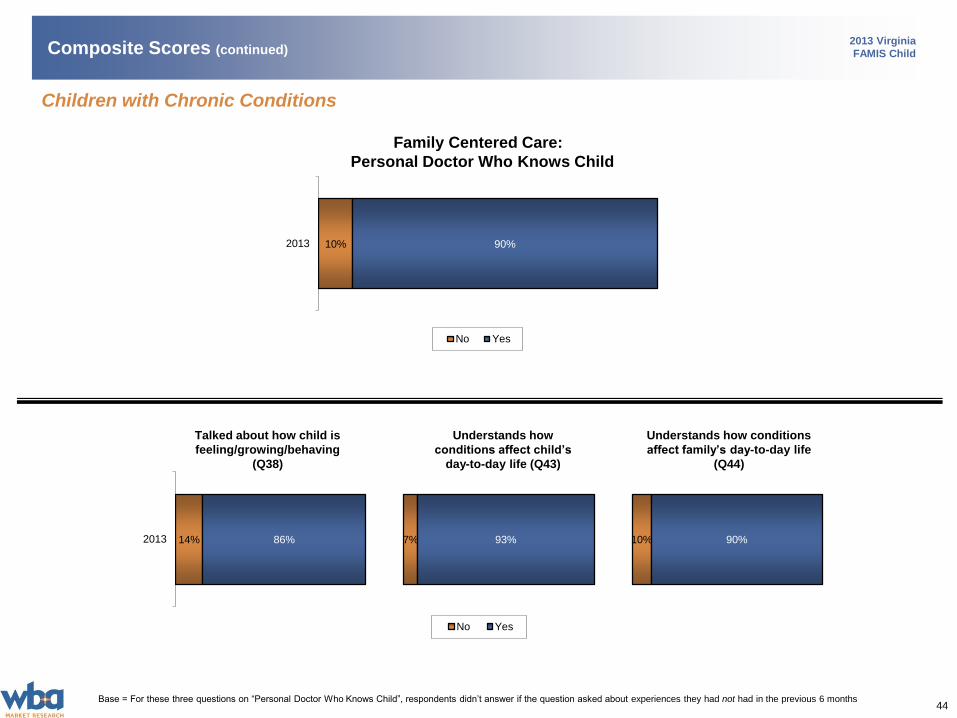
Family Centered Care (FCC):
Personal Doctor Who Knows Child38, 43 and 44
Measures whether or not the provider discussed how the
child is feeling, growing and behaving; as well as
understands how the child’s condition affects the child’s and
family’s day-to-day life
% of members who responded
“Yes”
Family Centered Care (FCC):
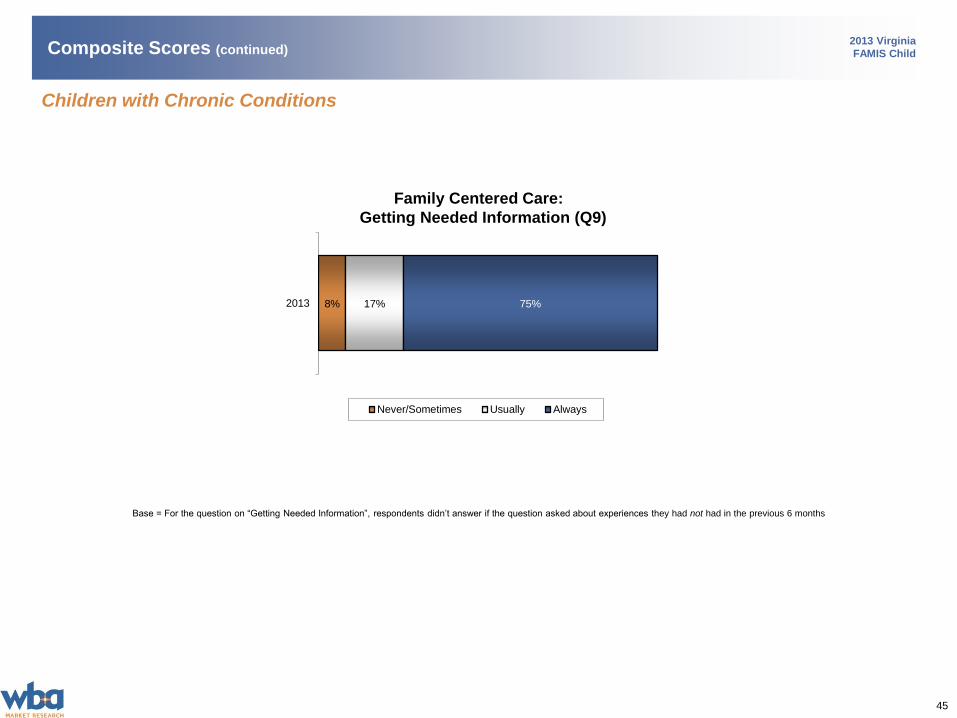
Getting Needed Information 9
Measures how often providers answered members’
questions
% of members who responded
“Usually” or “Always”
Coordination of Care for Children
with Chronic Conditions18 and 29
Measures whether or not members received the help
needed from the provider in contacting the child’s
school/daycare, and whether anyone from DHMH or the
provider’s office coordinated care among the different
providers/services
% of members who responded
“Yes”
1Summary Rates most often represent the most favorable responses for that question.
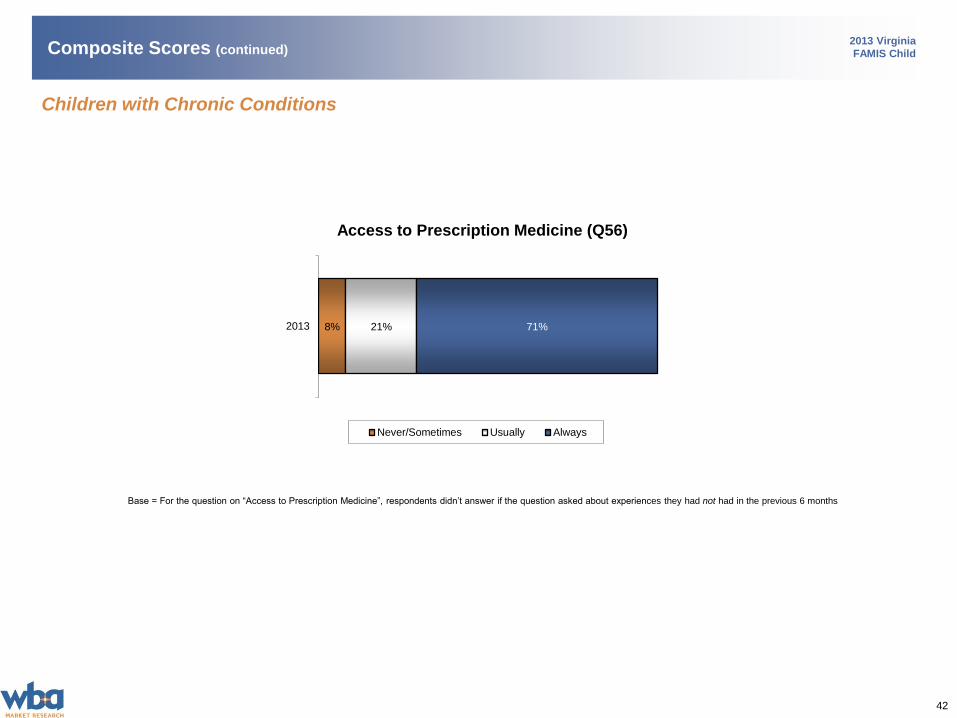
42
2013 Virginia
FAMIS Child
Base = For the question on “Access to Prescription Medicine”, respondents didn’t answer if the question asked about experiences they had not had in the previous 6 months
Access to Prescription Medicine (Q56)
Children with Chronic Conditions
Composite Scores (continued)
8% 21% 71%2013
Never/Sometimes Usually Always
43
2013 Virginia
FAMIS Child
Access to Specialized Services
Base = For these three questions on “Access to Specialized Services”, respondents didn’t answer if the question asked about experiences they had not had in the previous 6 months
Children with Chronic Conditions
Composite Scores (continued)
20% 18% 62% 27% 12% 62% 26% 15% 59%2013
Never/Sometimes Usually Always
24% 15% 61%2013
Never/Sometimes Usually Always
Ease of getting special
medical equipment for
child (Q20)
Ease of getting special
therapy for child (Q23)
Ease of getting treatment
or counseling for child
(Q26)
44
2013 Virginia
FAMIS Child
14% 86% 7% 93% 10% 90%2013
No Yes
Family Centered Care:
Personal Doctor Who Knows Child
10% 90%2013
No Yes
Base = For these three questions on “Personal Doctor Who Knows Child”, respondents didn’t answer if the question asked about experiences they had not had in the previous 6 months
Children with Chronic Conditions
Composite Scores (continued)
Talked about how child is
feeling/growing/behaving
(Q38)
Understands how
conditions affect child’s
day-to-day life (Q43)
Understands how conditions
affect family’s day-to-day life
(Q44)
45
2013 Virginia
FAMIS Child
Family Centered Care:
Getting Needed Information (Q9)
Base = For the question on “Getting Needed Information”, respondents didn’t answer if the question asked about experiences they had not had in the previous 6 months
Children with Chronic Conditions
Composite Scores (continued)
8% 17% 75%2013
Never/Sometimes Usually Always
46
2013 Virginia
FAMIS Child
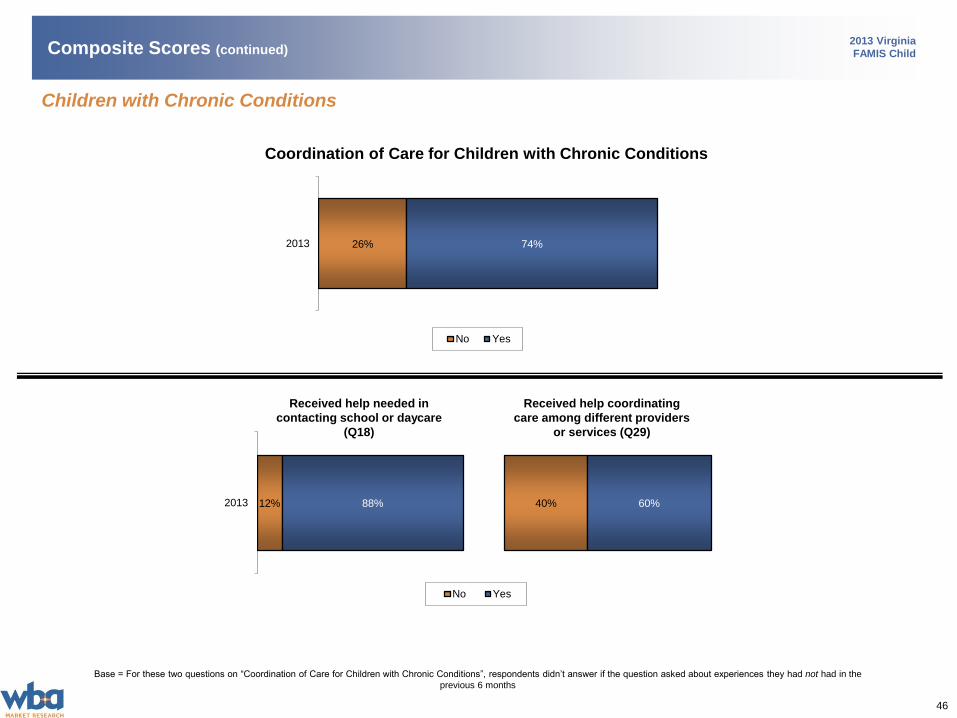
Base = For these two questions on “Coordination of Care for Children with Chronic Conditions”, respondents didn’t answer if the question asked about experiences they had not had in the
previous 6 months
12% 88% 40% 60%2013
No Yes
Coordination of Care for Children with Chronic Conditions
Children with Chronic Conditions
Composite Scores (continued)
26% 74%2013
No Yes
Received help needed in
contacting school or daycare
(Q18)
Received help coordinating
care among different providers
or services (Q29)
47
2013 Virginia
FAMIS ChildQuestion Summaries
The tables on the following pages illustrate the proportion of members that fall into each response category for all survey
questions.
The calculated Summary Rates represent the percentage of respondents who answered in the most positive way. Please
keep in mind when reviewing this section that not all questions are designed for Summary Rates (e.g., questions that
instruct the respondent to mark all that apply).
48
2013 Virginia
FAMIS Child
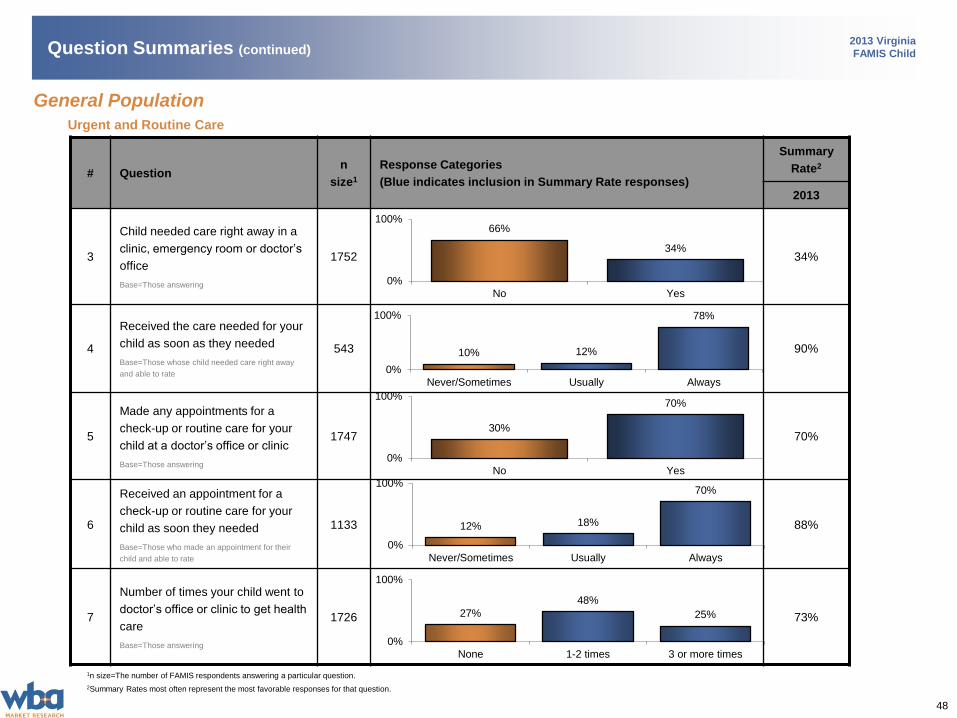
# Questionn
size1
Response Categories
(Blue indicates inclusion in Summary Rate responses)
Summary
Rate2
2013
3
Child needed care right away in a
clinic, emergency room or doctor’s
office
Base=Those answering
1752 34%
4
Received the care needed for your
child as soon as they needed
Base=Those whose child needed care right away
and able to rate
543 90%
5
Made any appointments for a
check-up or routine care for your
child at a doctor’s office or clinic
Base=Those answering
1747 70%
6
Received an appointment for a
check-up or routine care for your
child as soon they needed
Base=Those who made an appointment for their
child and able to rate
1133 88%
7
Number of times your child went to
doctor’s office or clinic to get health
care
Base=Those answering
1726 73%
1n size=The number of FAMIS respondents answering a particular question.
2Summary Rates most often represent the most favorable responses for that question.
30%
70%
0%
100%
No Yes
Urgent and Routine Care
66%
34%
0%
100%
No Yes
Question Summaries (continued)
General Population
10% 12%
78%
0%
100%
Never/Sometimes Usually Always
12% 18%
70%
0%
100%
Never/Sometimes Usually Always
27%
48%
25%
0%
100%
None 1-2 times 3 or more times
49
2013 Virginia
FAMIS Child
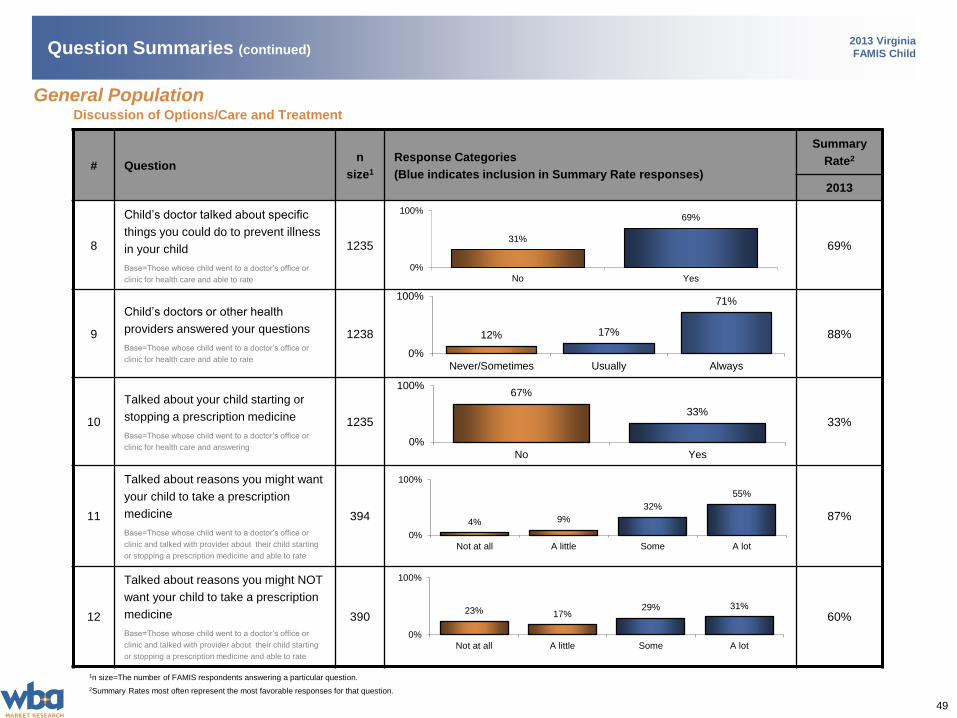
Discussion of Options/Care and Treatment
# Questionn
size1
Response Categories
(Blue indicates inclusion in Summary Rate responses)
Summary
Rate2
2013
8
Child’s doctor talked about specific
things you could do to prevent illness
in your child
Base=Those whose child went to a doctor’s office or
clinic for health care and able to rate
1235 69%
9
Child’s doctors or other health
providers answered your questions
Base=Those whose child went to a doctor’s office or
clinic for health care and able to rate
1238 88%
10
Talked about your child starting or
stopping a prescription medicine
Base=Those whose child went to a doctor’s office or
clinic for health care and answering
1235 33%
11
Talked about reasons you might want
your child to take a prescription
medicine
Base=Those whose child went to a doctor’s office or
clinic and talked with provider about their child starting
or stopping a prescription medicine and able to rate
394 87%
12
Talked about reasons you might NOT
want your child to take a prescription
medicine
Base=Those whose child went to a doctor’s office or
clinic and talked with provider about their child starting
or stopping a prescription medicine and able to rate
390 60%
1n size=The number of FAMIS respondents answering a particular question.
2Summary Rates most often represent the most favorable responses for that question.
Question Summaries (continued)
67%
33%
0%
100%
No Yes
12% 17%
71%
0%
100%
Never/Sometimes Usually Always
General Population
31%
69%
0%
100%
No Yes
4% 9%
32%
55%
0%
100%
Not at all A little Some A lot
23% 17%29% 31%
0%
100%
Not at all A little Some A lot
50
2013 Virginia
FAMIS Child
Discussion of Options/Care and Treatment (continued)
# Questionn
size1
Response Categories
(Blue indicates inclusion in Summary Rate responses)
Summary
Rate2
2013
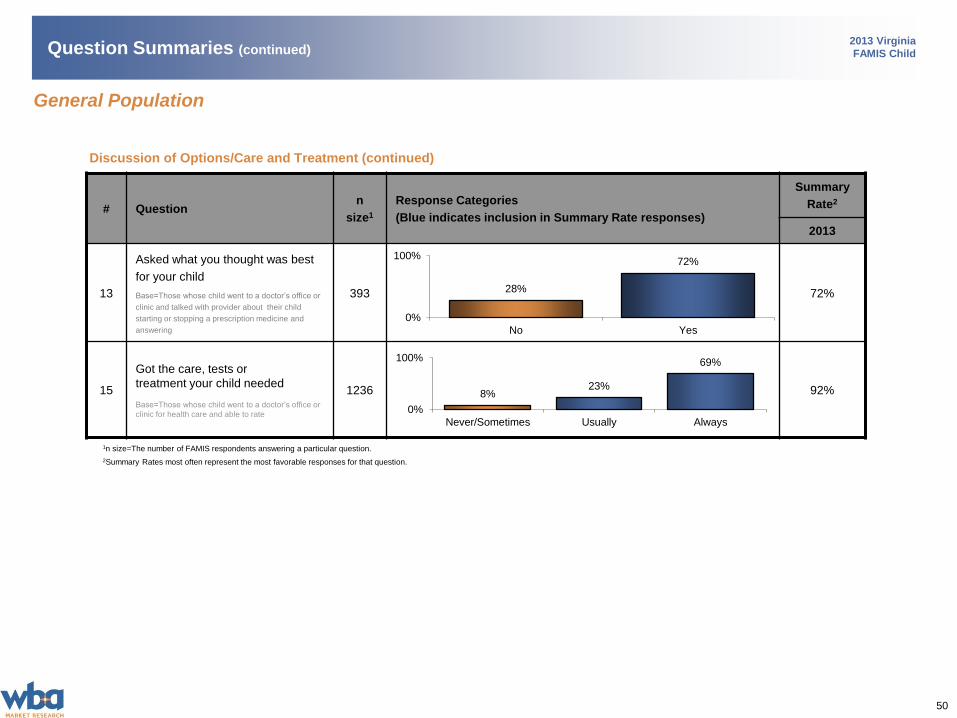
13
Asked what you thought was best
for your child
Base=Those whose child went to a doctor’s office or
clinic and talked with provider about their child
starting or stopping a prescription medicine and
answering
393 72%
15
Got the care, tests or
treatment your child needed
Base=Those whose child went to a doctor’s office or
clinic for health care and able to rate
1236 92%
1n size=The number of FAMIS respondents answering a particular question.
2Summary Rates most often represent the most favorable responses for that question.
28%
72%
0%
100%
No Yes
Question Summaries (continued)
General Population
8%23%
69%
0%
100%
Never/Sometimes Usually Always
51
2013 Virginia
FAMIS Child
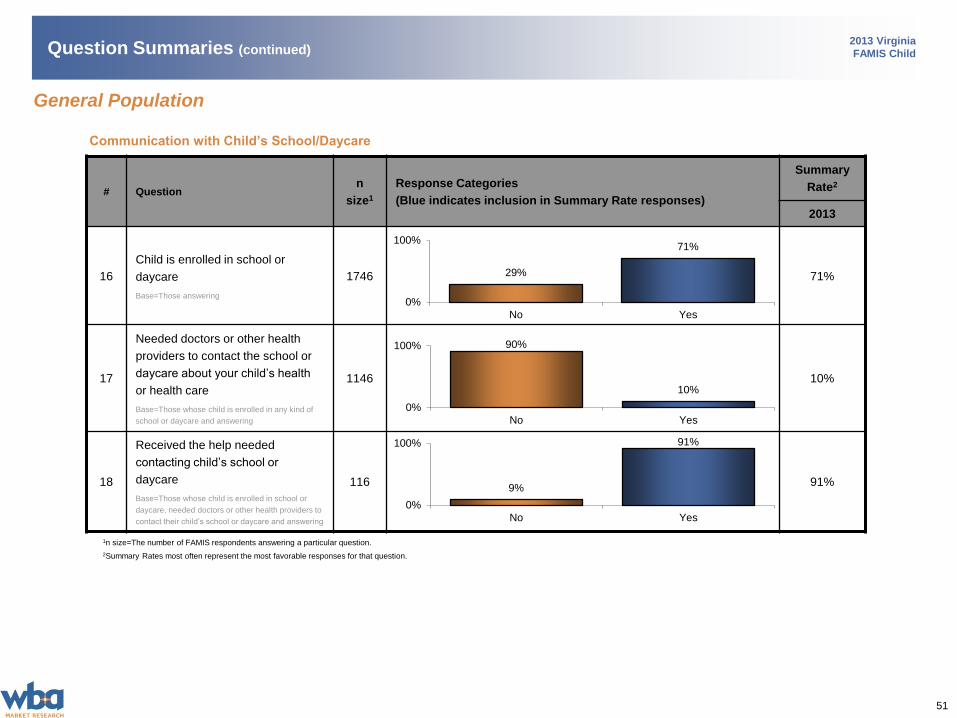
Communication with Child’s School/Daycare
# Questionn
size1
Response Categories
(Blue indicates inclusion in Summary Rate responses)
Summary
Rate2
2013
16
Child is enrolled in school or
daycare
Base=Those answering
1746 71%
17
Needed doctors or other health
providers to contact the school or
daycare about your child’s health
or health care
Base=Those whose child is enrolled in any kind of
school or daycare and answering
1146 10%
18
Received the help needed
contacting child’s school or
daycare
Base=Those whose child is enrolled in school or
daycare, needed doctors or other health providers to
contact their child’s school or daycare and answering
116 91%
1n size=The number of FAMIS respondents answering a particular question.
2Summary Rates most often represent the most favorable responses for that question.
29%
71%
0%
100%
No Yes
Question Summaries (continued)
General Population
90%
10%
0%
100%
No Yes
9%
91%
0%
100%
No Yes
52
2013 Virginia
FAMIS Child
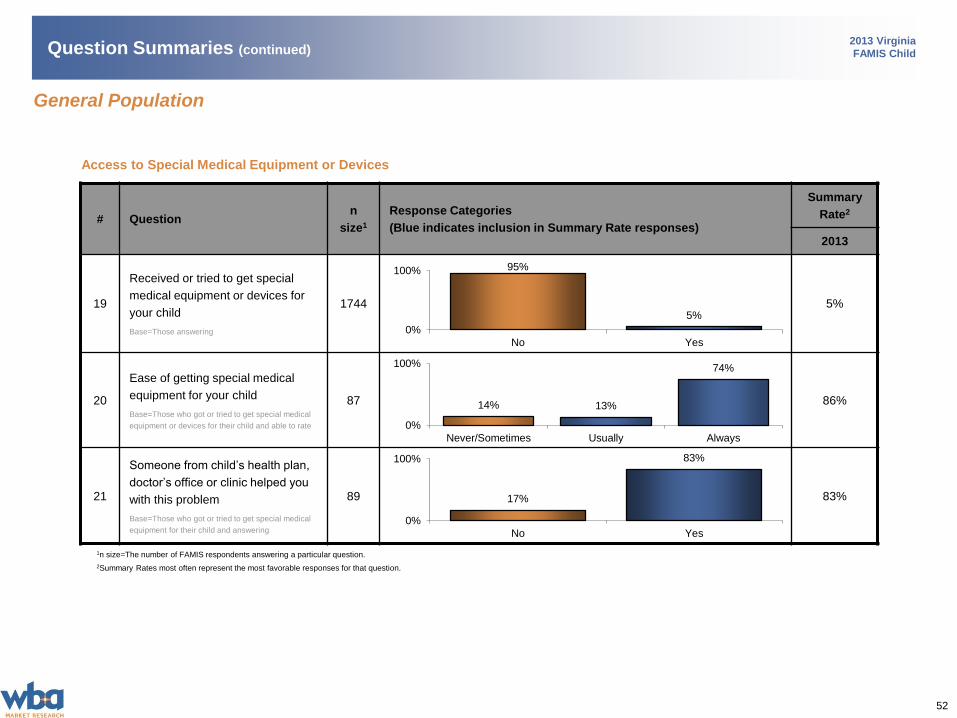
Access to Special Medical Equipment or Devices
# Questionn
size1
Response Categories
(Blue indicates inclusion in Summary Rate responses)
Summary
Rate2
2013
19
Received or tried to get special
medical equipment or devices for
your child
Base=Those answering
1744 5%
20
Ease of getting special medical
equipment for your child
Base=Those who got or tried to get special medical
equipment or devices for their child and able to rate
87 86%
21
Someone from child’s health plan,
doctor’s office or clinic helped you
with this problem
Base=Those who got or tried to get special medical
equipment for their child and answering
89 83%
1n size=The number of FAMIS respondents answering a particular question.
2Summary Rates most often represent the most favorable responses for that question.
Question Summaries (continued)
95%
5%
0%
100%
No Yes
14% 13%
74%
0%
100%
Never/Sometimes Usually Always
17%
83%
0%
100%
No Yes
General Population
53
2013 Virginia
FAMIS Child
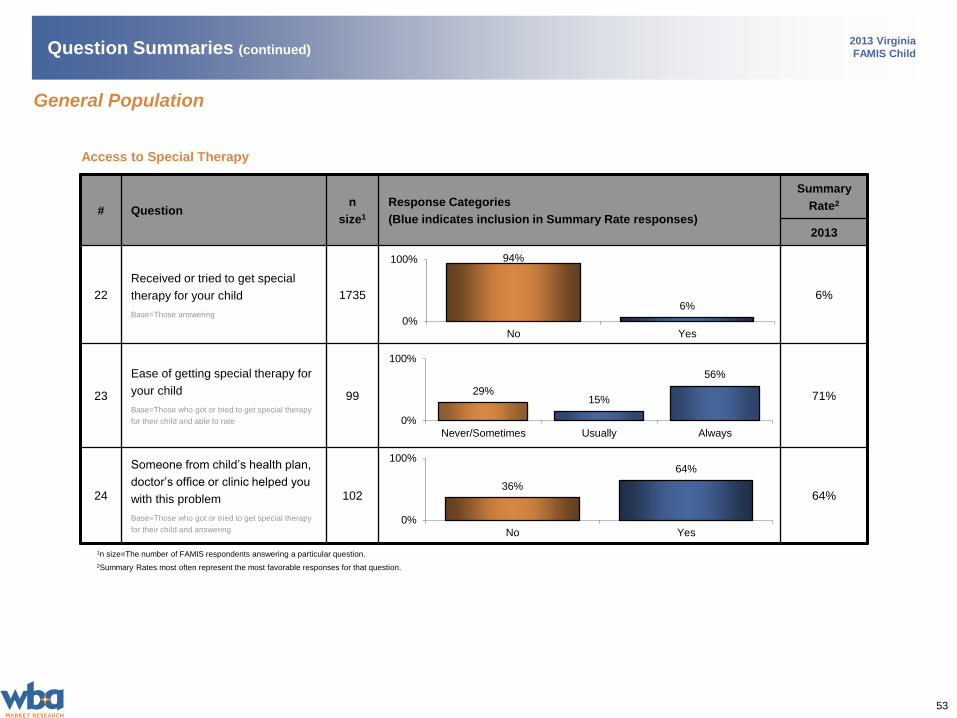
Access to Special Therapy
# Questionn
size1
Response Categories
(Blue indicates inclusion in Summary Rate responses)
Summary
Rate2
2013
22
Received or tried to get special
therapy for your child
Base=Those answering
1735 6%
23
Ease of getting special therapy for
your child
Base=Those who got or tried to get special therapy
for their child and able to rate
99 71%
24
Someone from child’s health plan,
doctor’s office or clinic helped you
with this problem
Base=Those who got or tried to get special therapy
for their child and answering
102 64%
1n size=The number of FAMIS respondents answering a particular question.
2Summary Rates most often represent the most favorable responses for that question.
94%
6%
0%
100%
No Yes
Question Summaries (continued)
29%15%
56%
0%
100%
Never/Sometimes Usually Always
36%
64%
0%
100%
No Yes
General Population
54
2013 Virginia
FAMIS Child
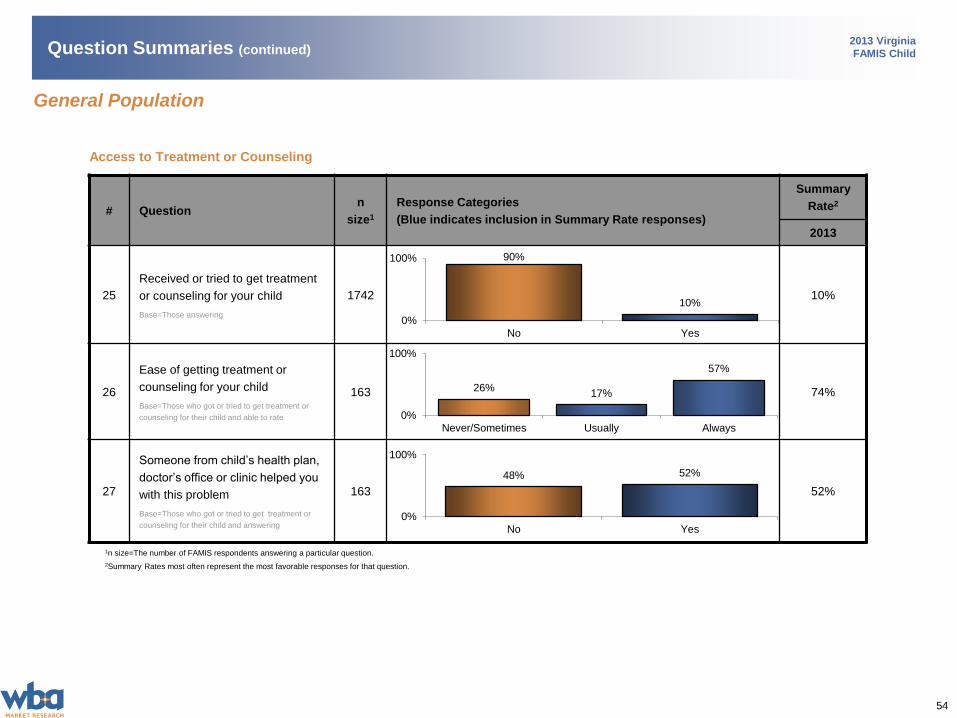
Access to Treatment or Counseling
# Questionn
size1
Response Categories
(Blue indicates inclusion in Summary Rate responses)
Summary
Rate2
2013
25
Received or tried to get treatment
or counseling for your child
Base=Those answering
1742 10%
26
Ease of getting treatment or
counseling for your child
Base=Those who got or tried to get treatment or
counseling for their child and able to rate
163 74%
27
Someone from child’s health plan,
doctor’s office or clinic helped you
with this problem
Base=Those who got or tried to get treatment or
counseling for their child and answering
163 52%
1n size=The number of FAMIS respondents answering a particular question.
2Summary Rates most often represent the most favorable responses for that question.
90%
10%
0%
100%
No Yes
26%17%
57%
0%
100%
Never/Sometimes Usually Always
Question Summaries (continued)
48% 52%
0%
100%
No Yes
General Population
55
2013 Virginia
FAMIS Child
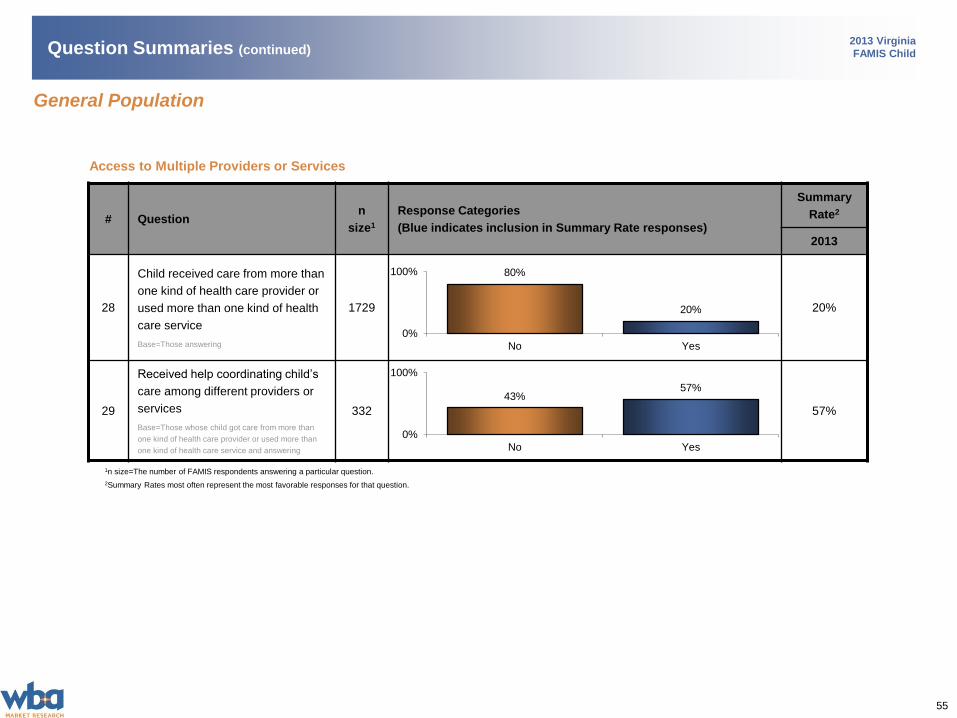
Access to Multiple Providers or Services
# Questionn
size1
Response Categories
(Blue indicates inclusion in Summary Rate responses)
Summary
Rate2
2013
28
Child received care from more than
one kind of health care provider or
used more than one kind of health
care service
Base=Those answering
1729 20%
29
Received help coordinating child’s
care among different providers or
services
Base=Those whose child got care from more than
one kind of health care provider or used more than
one kind of health care service and answering
332 57%
1n size=The number of FAMIS respondents answering a particular question.
2Summary Rates most often represent the most favorable responses for that question.
Question Summaries (continued)
80%
20%
0%
100%
No Yes
43%57%
0%
100%
No Yes
General Population
56
2013 Virginia
FAMIS Child
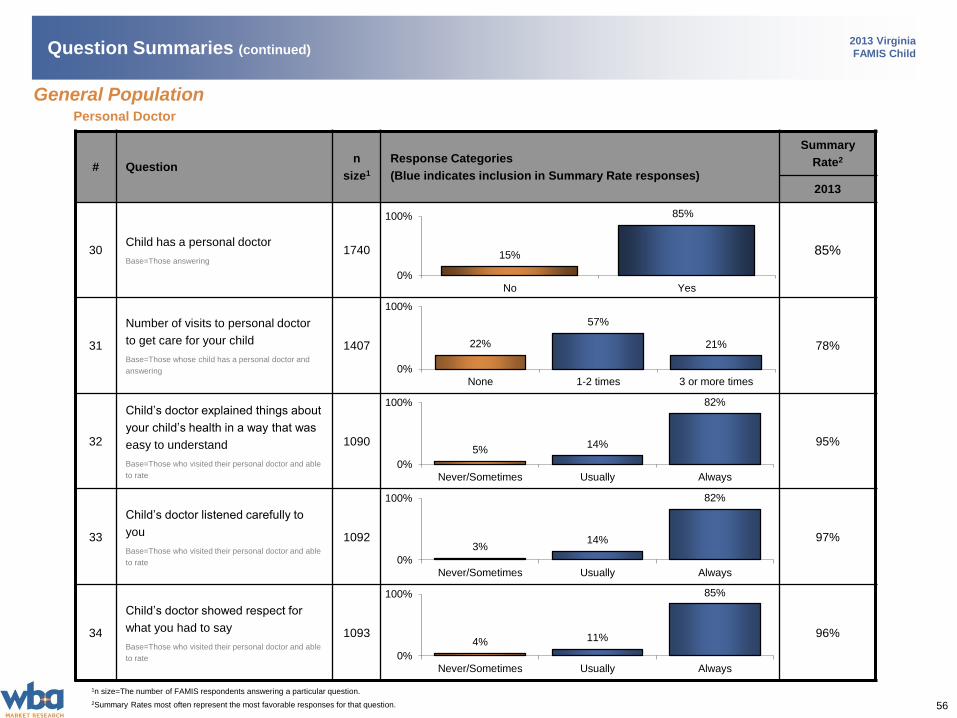
# Questionn
size1
Response Categories
(Blue indicates inclusion in Summary Rate responses)
Summary
Rate2
2013
30Child has a personal doctor
Base=Those answering
1740 85%
31
Number of visits to personal doctor
to get care for your child
Base=Those whose child has a personal doctor and
answering
1407 78%
32
Child’s doctor explained things about
your child’s health in a way that was
easy to understand
Base=Those who visited their personal doctor and able
to rate
1090 95%
33
Child’s doctor listened carefully to
you
Base=Those who visited their personal doctor and able
to rate
1092 97%
34
Child’s doctor showed respect for
what you had to say
Base=Those who visited their personal doctor and able
to rate
1093 96%
1n size=The number of FAMIS respondents answering a particular question.
2Summary Rates most often represent the most favorable responses for that question.
15%
85%
0%
100%
No Yes
4% 11%
85%
0%
100%
Never/Sometimes Usually Always
Question Summaries (continued)
3%14%
82%
0%
100%
Never/Sometimes Usually Always
5%14%
82%
0%
100%
Never/Sometimes Usually Always
22%
57%
21%
0%
100%
None 1-2 times 3 or more times
Personal Doctor
General Population
57
2013 Virginia
FAMIS Child
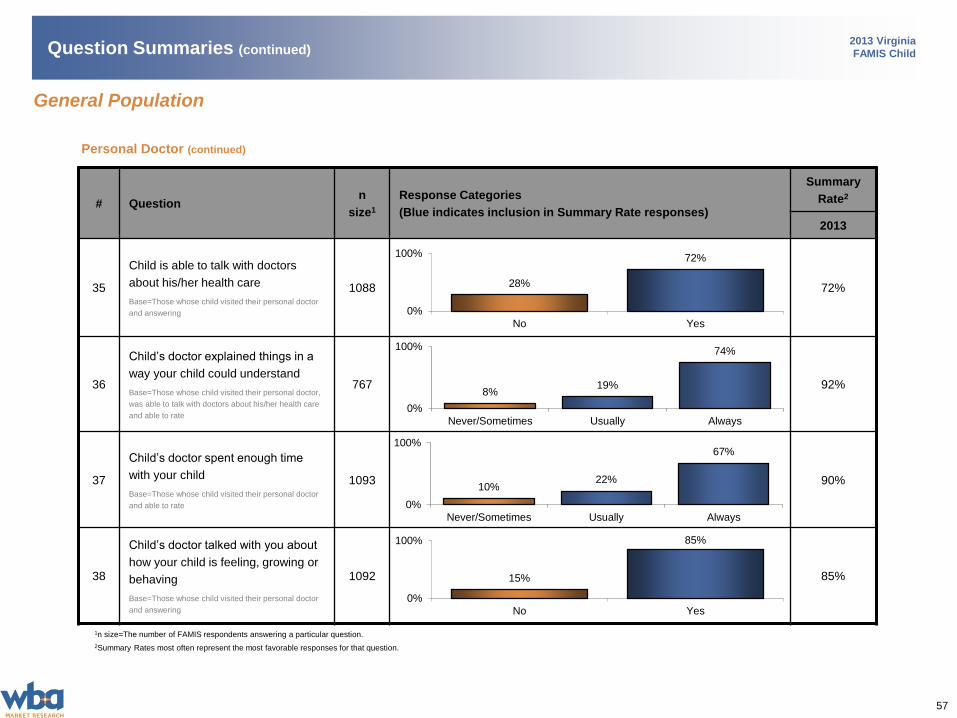
Personal Doctor (continued)
# Questionn
size1
Response Categories
(Blue indicates inclusion in Summary Rate responses)
Summary
Rate2
2013
35
Child is able to talk with doctors
about his/her health care
Base=Those whose child visited their personal doctor
and answering
1088 72%
36
Child’s doctor explained things in a
way your child could understand
Base=Those whose child visited their personal doctor,
was able to talk with doctors about his/her health care
and able to rate
767 92%
37
Child’s doctor spent enough time
with your child
Base=Those whose child visited their personal doctor
and able to rate
1093 90%
38
Child’s doctor talked with you about
how your child is feeling, growing or
behaving
Base=Those whose child visited their personal doctor
and answering
1092 85%
1n size=The number of FAMIS respondents answering a particular question.
2Summary Rates most often represent the most favorable responses for that question.
Question Summaries (continued)
8%19%
74%
0%
100%
Never/Sometimes Usually Always
10%22%
67%
0%
100%
Never/Sometimes Usually Always
28%
72%
0%
100%
No Yes
15%
85%
0%
100%
No Yes
General Population
58
2013 Virginia
FAMIS Child
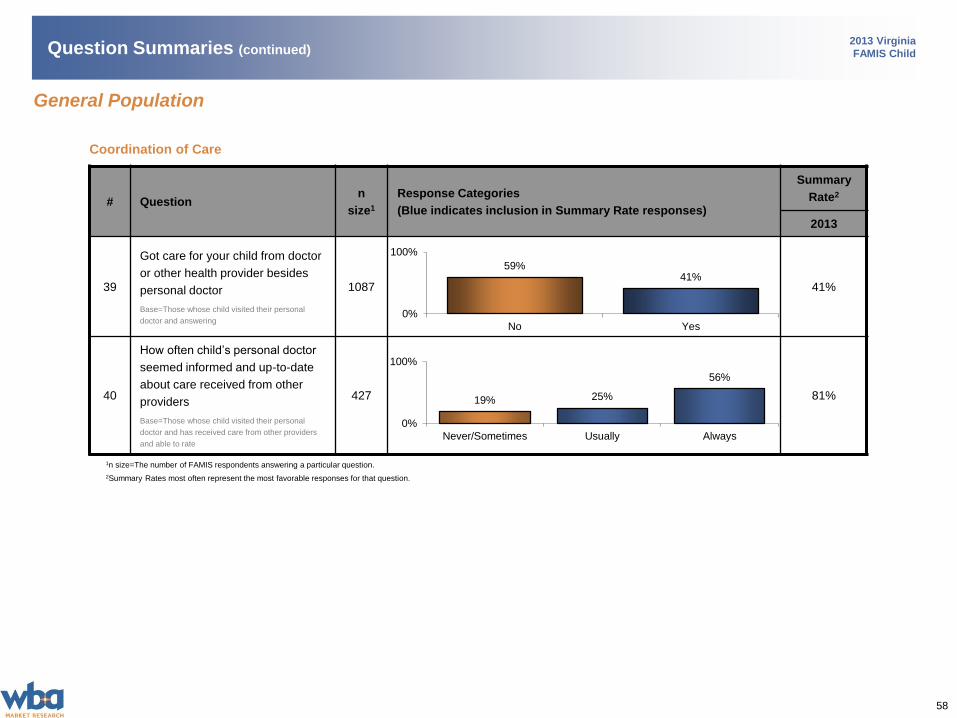
Coordination of Care
# Questionn
size1
Response Categories
(Blue indicates inclusion in Summary Rate responses)
Summary
Rate2
2013
39
Got care for your child from doctor
or other health provider besides
personal doctor
Base=Those whose child visited their personal
doctor and answering
1087 41%
40
How often child’s personal doctor
seemed informed and up-to-date
about care received from other
providers
Base=Those whose child visited their personal
doctor and has received care from other providers
and able to rate
427 81%
1n size=The number of FAMIS respondents answering a particular question.
2Summary Rates most often represent the most favorable responses for that question.
Question Summaries (continued)
19% 25%
56%
0%
100%
Never/Sometimes Usually Always
59%41%
0%
100%
No Yes
General Population
59
2013 Virginia
FAMIS Child
# Questionn
size1
Response Categories
(Blue indicates inclusion in Summary Rate responses)
Summary
Rate2
2013
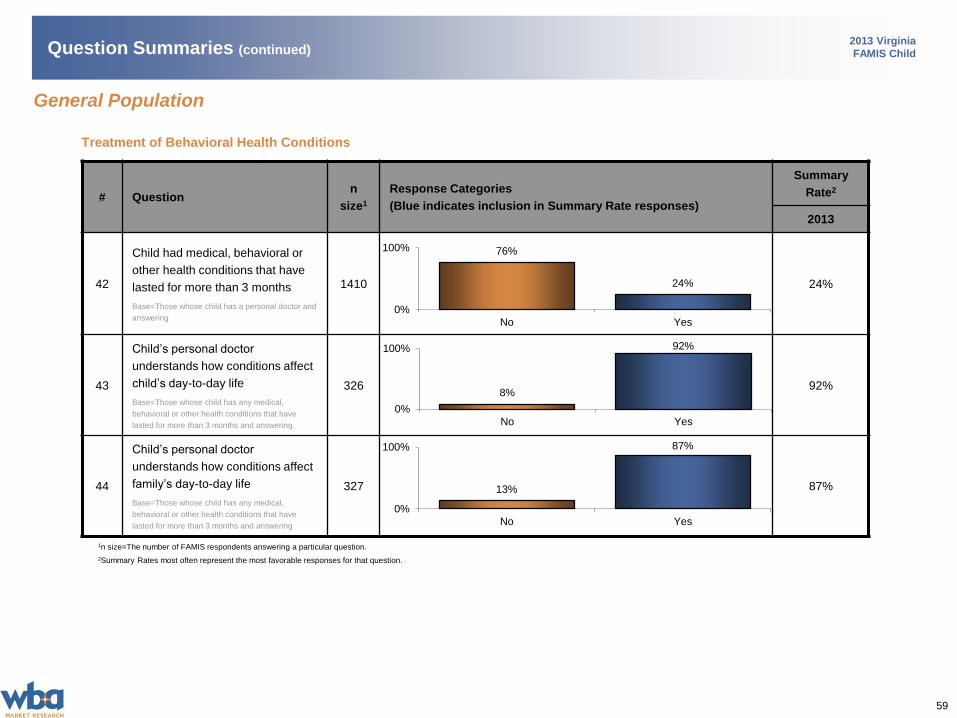
42
Child had medical, behavioral or
other health conditions that have
lasted for more than 3 months
Base=Those whose child has a personal doctor and
answering
1410 24%
43
Child’s personal doctor
understands how conditions affect
child’s day-to-day life
Base=Those whose child has any medical,
behavioral or other health conditions that have
lasted for more than 3 months and answering
326 92%
44
Child’s personal doctor
understands how conditions affect
family’s day-to-day life
Base=Those whose child has any medical,
behavioral or other health conditions that have
lasted for more than 3 months and answering
327 87%
1n size=The number of FAMIS respondents answering a particular question.
2Summary Rates most often represent the most favorable responses for that question.
76%
24%
0%
100%
No Yes
Question Summaries (continued)
Treatment of Behavioral Health Conditions
8%
92%
0%
100%
No Yes
13%
87%
0%
100%
No Yes
General Population
60
2013 Virginia
FAMIS Child
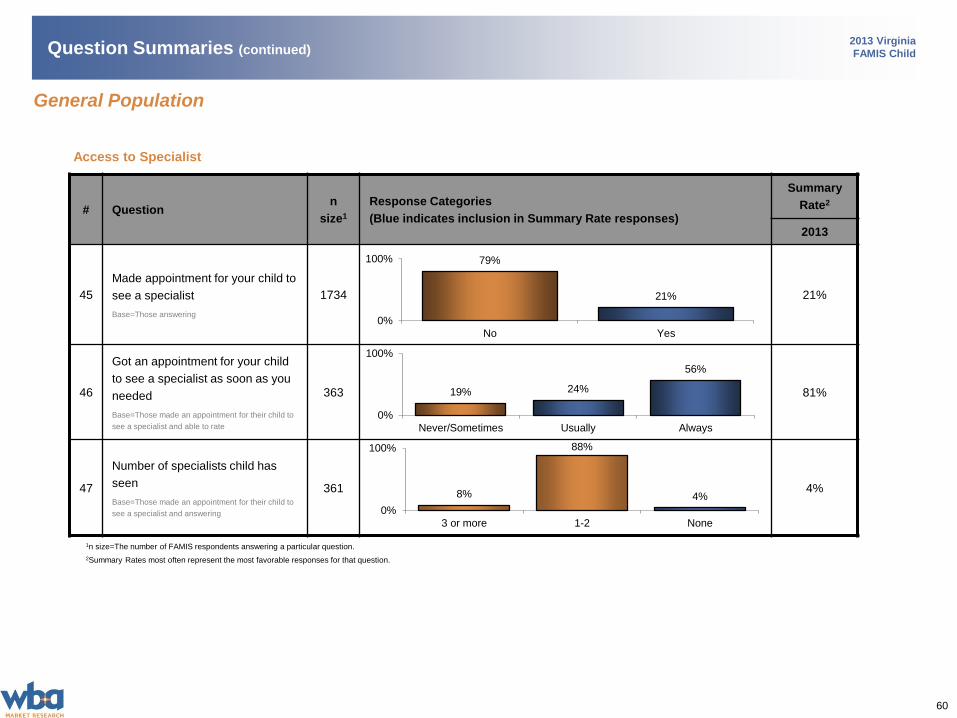
Access to Specialist
# Questionn
size1
Response Categories
(Blue indicates inclusion in Summary Rate responses)
Summary
Rate2
2013
45
Made appointment for your child to
see a specialist
Base=Those answering
1734 21%
46
Got an appointment for your child
to see a specialist as soon as you
needed
Base=Those made an appointment for their child to
see a specialist and able to rate
363 81%
47
Number of specialists child has
seen
Base=Those made an appointment for their child to
see a specialist and answering
361 4%
1n size=The number of FAMIS respondents answering a particular question.
2Summary Rates most often represent the most favorable responses for that question.
79%
21%
0%
100%
No Yes
Question Summaries (continued)
19% 24%
56%
0%
100%
Never/Sometimes Usually Always
8%
88%
4%
0%
100%
3 or more 1-2 None
General Population
61
2013 Virginia
FAMIS Child
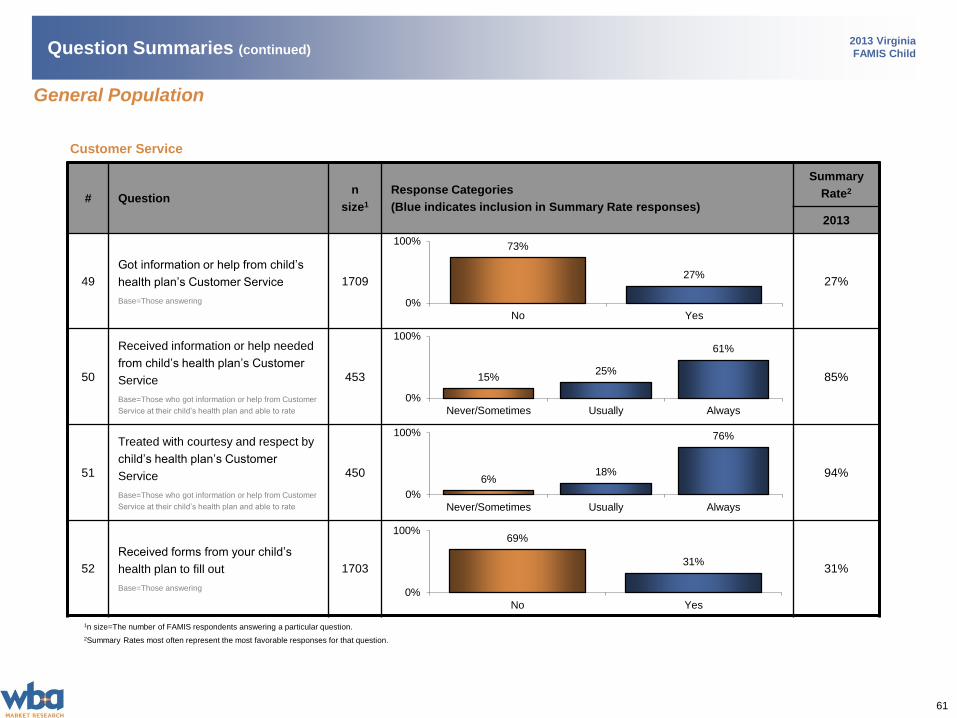
Customer Service
# Questionn
size1
Response Categories
(Blue indicates inclusion in Summary Rate responses)
Summary
Rate2
2013
49
Got information or help from child’s
health plan’s Customer Service
Base=Those answering
1709 27%
50
Received information or help needed
from child’s health plan’s Customer
Service
Base=Those who got information or help from Customer
Service at their child’s health plan and able to rate
453 85%
51
Treated with courtesy and respect by
child’s health plan’s Customer
Service
Base=Those who got information or help from Customer
Service at their child’s health plan and able to rate
450 94%
52
Received forms from your child’s
health plan to fill out
Base=Those answering
1703 31%
1n size=The number of FAMIS respondents answering a particular question.
2Summary Rates most often represent the most favorable responses for that question.
73%
27%
0%
100%
No Yes
Question Summaries (continued)
15%25%
61%
0%
100%
Never/Sometimes Usually Always
6%18%
76%
0%
100%
Never/Sometimes Usually Always
General Population
69%
31%
0%
100%
No Yes
62
2013 Virginia
FAMIS Child
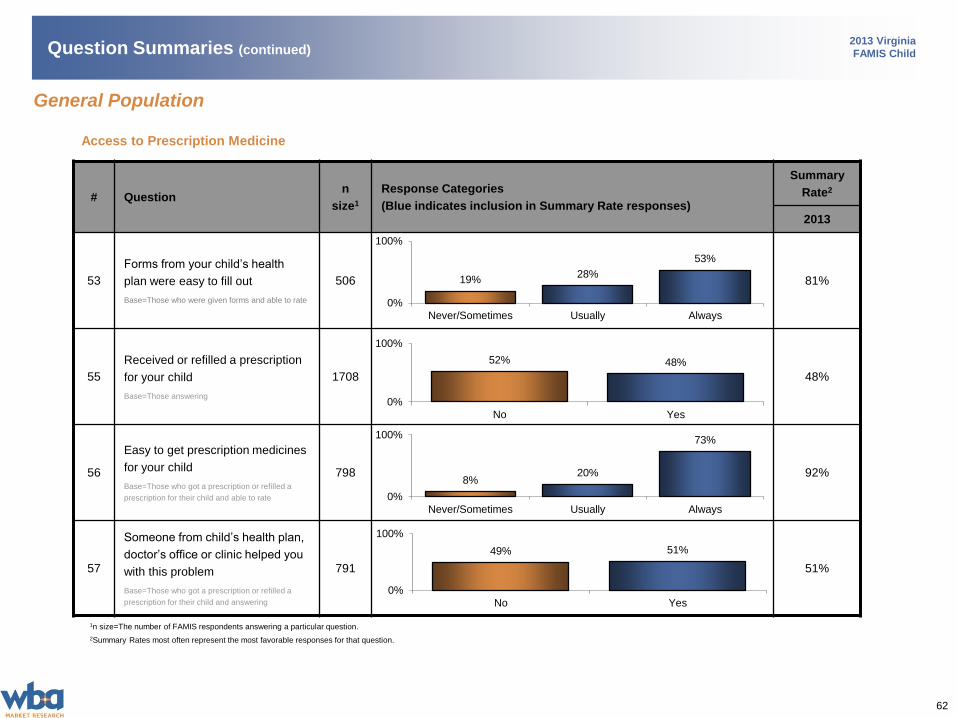
Access to Prescription Medicine
# Questionn
size1
Response Categories
(Blue indicates inclusion in Summary Rate responses)
Summary
Rate2
2013
53
Forms from your child’s health
plan were easy to fill out
Base=Those who were given forms and able to rate
506 81%
55
Received or refilled a prescription
for your child
Base=Those answering
1708 48%
56
Easy to get prescription medicines
for your child
Base=Those who got a prescription or refilled a
prescription for their child and able to rate
798 92%
57
Someone from child’s health plan,
doctor’s office or clinic helped you
with this problem
Base=Those who got a prescription or refilled a
prescription for their child and answering
791 51%
1n size=The number of FAMIS respondents answering a particular question.
2Summary Rates most often represent the most favorable responses for that question.
Question Summaries (continued)
52% 48%
0%
100%
No Yes
8%20%
73%
0%
100%
Never/Sometimes Usually Always
49% 51%
0%
100%
No Yes
General Population
19%28%
53%
0%
100%
Never/Sometimes Usually Always
63
2013 Virginia
FAMIS Child
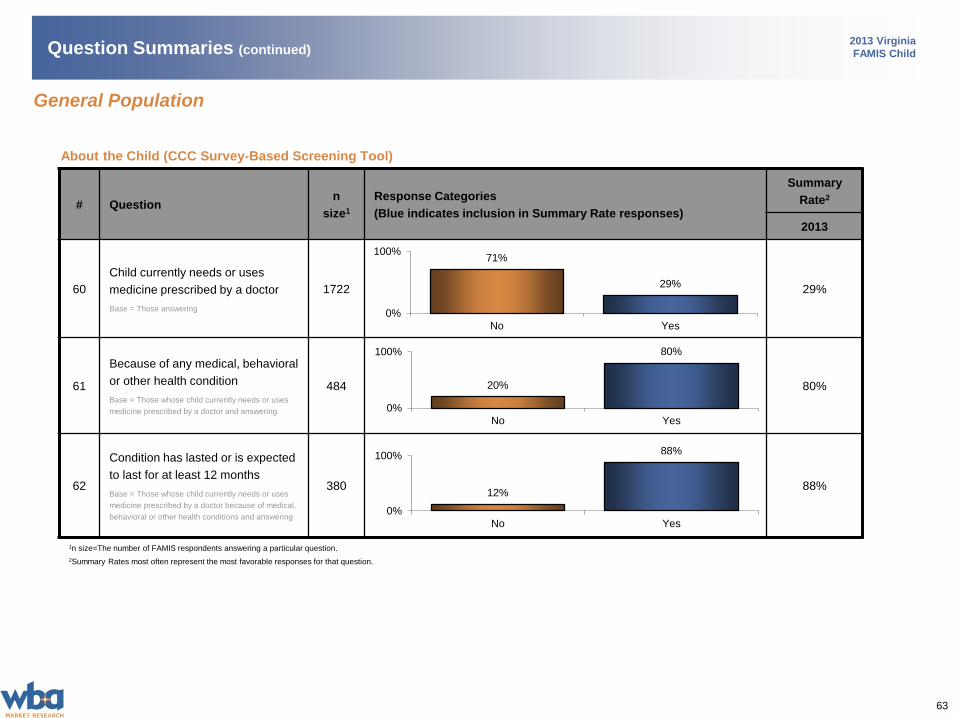
About the Child (CCC Survey-Based Screening Tool)
# Questionn
size1
Response Categories
(Blue indicates inclusion in Summary Rate responses)
Summary
Rate2
2013
60
Child currently needs or uses
medicine prescribed by a doctor
Base = Those answering
1722 29%
61
Because of any medical, behavioral
or other health condition
Base = Those whose child currently needs or uses
medicine prescribed by a doctor and answering
484 80%
62
Condition has lasted or is expected
to last for at least 12 months
Base = Those whose child currently needs or uses
medicine prescribed by a doctor because of medical,
behavioral or other health conditions and answering
380 88%
1n size=The number of FAMIS respondents answering a particular question.
2Summary Rates most often represent the most favorable responses for that question.
71%
29%
0%
100%
No Yes
Question Summaries (continued)
12%
88%
0%
100%
No Yes
20%
80%
0%
100%
No Yes
General Population
64
2013 Virginia
FAMIS Child
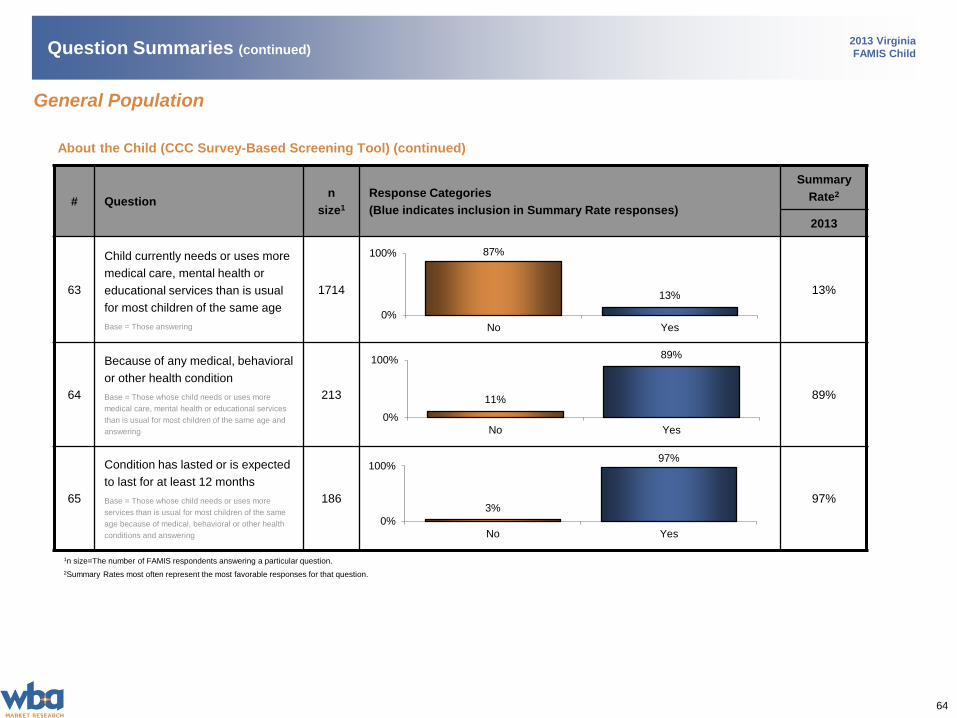
About the Child (CCC Survey-Based Screening Tool) (continued)
# Questionn
size1
Response Categories
(Blue indicates inclusion in Summary Rate responses)
Summary
Rate2
2013
63
Child currently needs or uses more
medical care, mental health or
educational services than is usual
for most children of the same age
Base = Those answering
1714 13%
64
Because of any medical, behavioral
or other health condition
Base = Those whose child needs or uses more
medical care, mental health or educational services
than is usual for most children of the same age and
answering
213 89%
65
Condition has lasted or is expected
to last for at least 12 months
Base = Those whose child needs or uses more
services than is usual for most children of the same
age because of medical, behavioral or other health
conditions and answering
186 97%
1n size=The number of FAMIS respondents answering a particular question.
2Summary Rates most often represent the most favorable responses for that question.
87%
13%
0%
100%
No Yes
Question Summaries (continued)
3%
97%
0%
100%
No Yes
11%
89%
0%
100%
No Yes
General Population
65
2013 Virginia
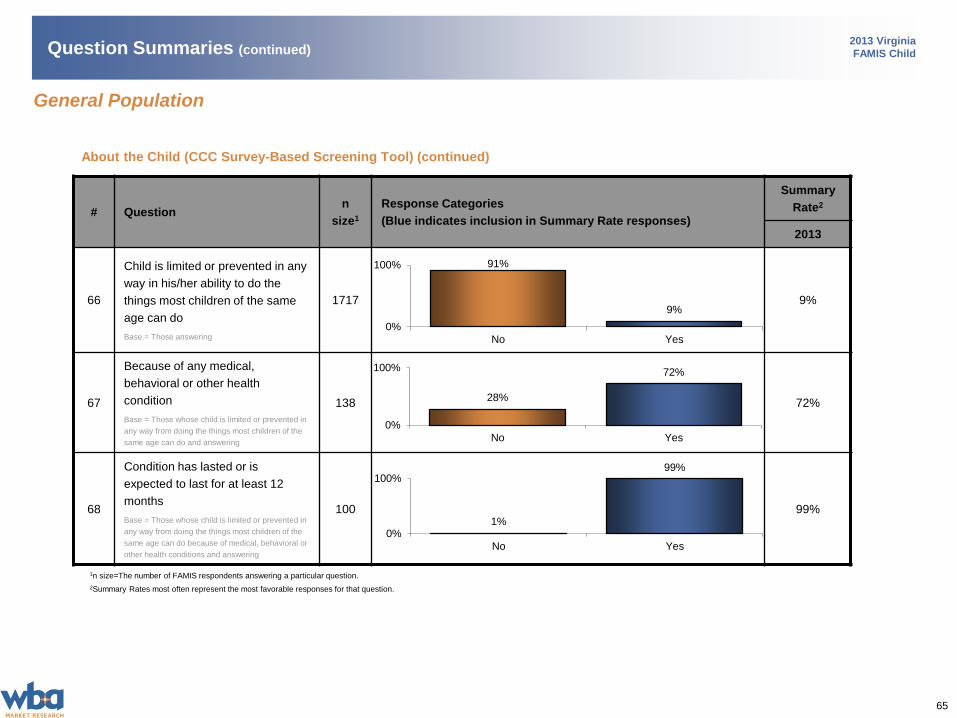
FAMIS Child
# Questionn
size1
Response Categories
(Blue indicates inclusion in Summary Rate responses)
Summary
Rate2
2013
66
Child is limited or prevented in any
way in his/her ability to do the
things most children of the same
age can do
Base = Those answering
1717 9%
67
Because of any medical,
behavioral or other health
condition
Base = Those whose child is limited or prevented in
any way from doing the things most children of the
same age can do and answering
138 72%
68
Condition has lasted or is
expected to last for at least 12
months
Base = Those whose child is limited or prevented in
any way from doing the things most children of the
same age can do because of medical, behavioral or
other health conditions and answering
100 99%
1n size=The number of FAMIS respondents answering a particular question.
2Summary Rates most often represent the most favorable responses for that question.
91%
9%
0%
100%
No Yes
Question Summaries (continued)
1%
99%
0%
100%
No Yes
28%
72%
0%
100%
No Yes
About the Child (CCC Survey-Based Screening Tool) (continued)
General Population
66
2013 Virginia
FAMIS Child
# Questionn
size1
Response Categories
(Blue indicates inclusion in Summary Rate responses)
Summary
Rate2
2013
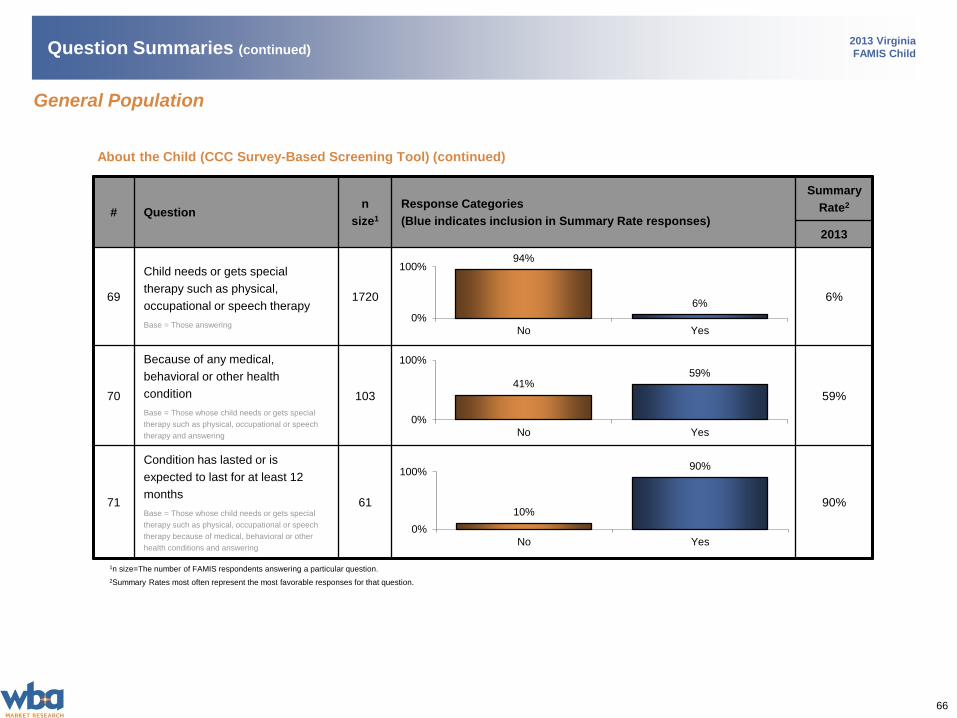
69
Child needs or gets special
therapy such as physical,
occupational or speech therapy
Base = Those answering
1720 6%
70
Because of any medical,
behavioral or other health
condition
Base = Those whose child needs or gets special
therapy such as physical, occupational or speech
therapy and answering
103 59%
71
Condition has lasted or is
expected to last for at least 12
months
Base = Those whose child needs or gets special
therapy such as physical, occupational or speech
therapy because of medical, behavioral or other
health conditions and answering
61 90%
1n size=The number of FAMIS respondents answering a particular question.
2Summary Rates most often represent the most favorable responses for that question.
94%
6%
0%
100%
No Yes
Question Summaries (continued)
10%
90%
0%
100%
No Yes
41%59%
0%
100%
No Yes
About the Child (CCC Survey-Based Screening Tool) (continued)
General Population
67
2013 Virginia
FAMIS Child
# Questionn
size1
Response Categories
(Blue indicates inclusion in Summary Rate responses)
Summary
Rate2
2013
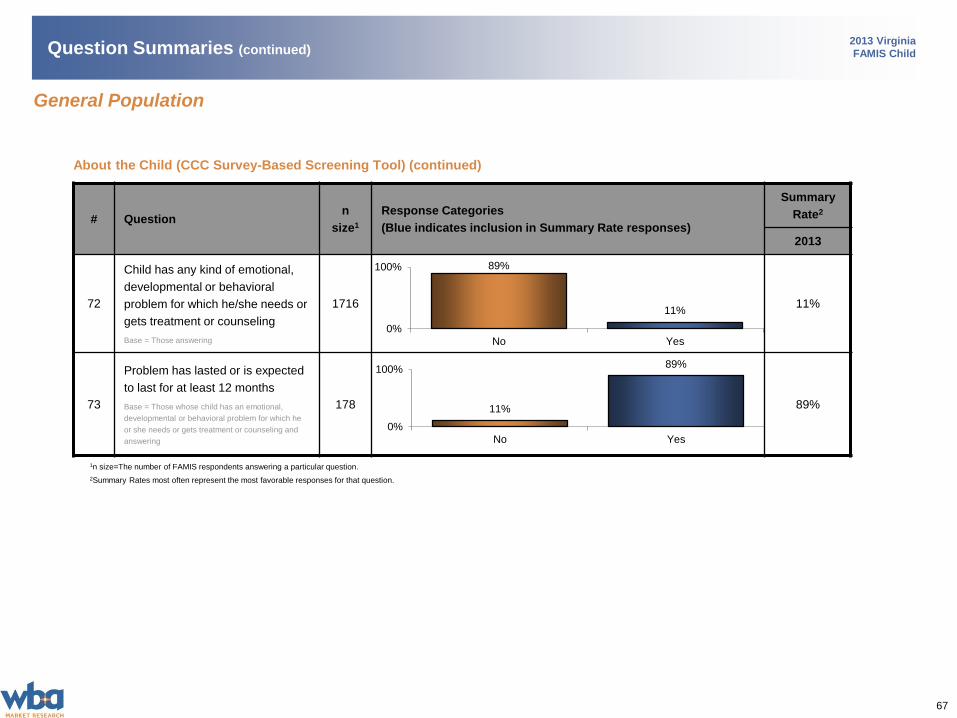
72
Child has any kind of emotional,
developmental or behavioral
problem for which he/she needs or
gets treatment or counseling
Base = Those answering
1716 11%
73
Problem has lasted or is expected
to last for at least 12 months
Base = Those whose child has an emotional,
developmental or behavioral problem for which he
or she needs or gets treatment or counseling and
answering
178 89%
1n size=The number of FAMIS respondents answering a particular question.
2Summary Rates most often represent the most favorable responses for that question.
89%
11%
0%
100%
No Yes
Question Summaries (continued)
11%
89%
0%
100%
No Yes
About the Child (CCC Survey-Based Screening Tool) (continued)
General Population
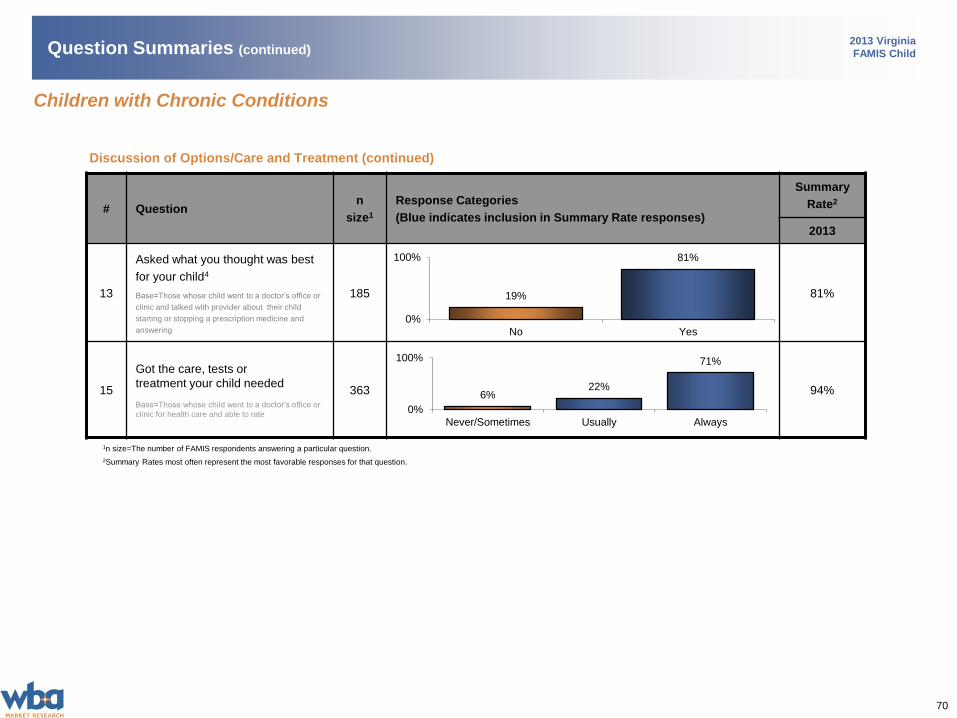
68
2013 Virginia
FAMIS Child
# Questionn
size1
Response Categories
(Blue indicates inclusion in Summary Rate responses)
Summary
Rate2
2013
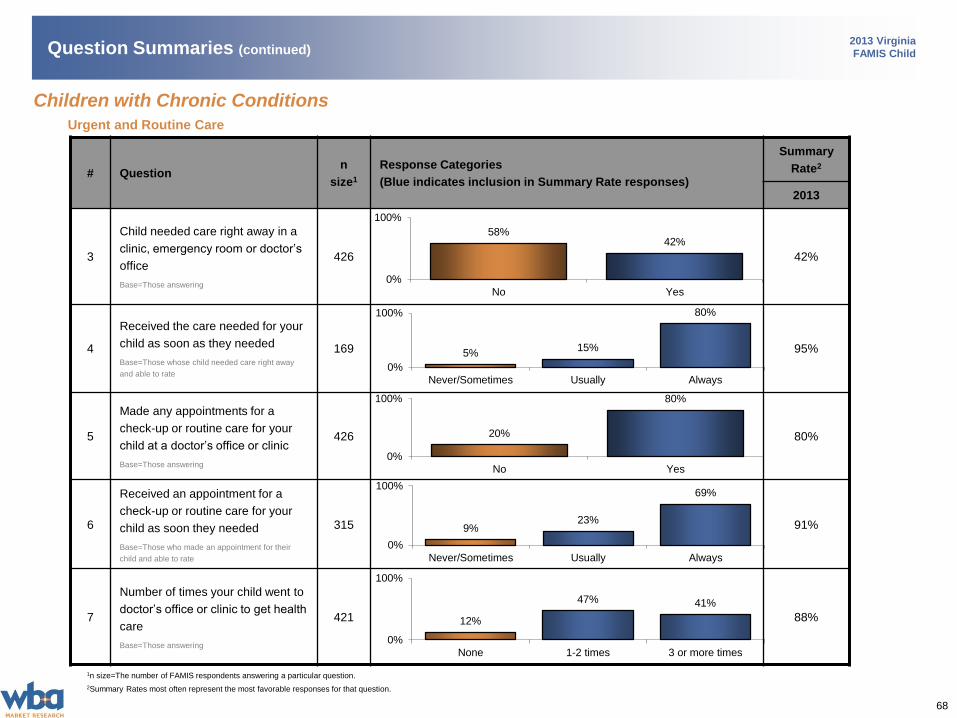
3
Child needed care right away in a
clinic, emergency room or doctor’s
office
Base=Those answering
426 42%
4
Received the care needed for your
child as soon as they needed
Base=Those whose child needed care right away
and able to rate
169 95%
5
Made any appointments for a
check-up or routine care for your
child at a doctor’s office or clinic
Base=Those answering
426 80%
6
Received an appointment for a
check-up or routine care for your
child as soon they needed
Base=Those who made an appointment for their
child and able to rate
315 91%
7
Number of times your child went to
doctor’s office or clinic to get health
care
Base=Those answering
421 88%
1n size=The number of FAMIS respondents answering a particular question.
2Summary Rates most often represent the most favorable responses for that question.
20%
80%
0%
100%
No Yes
Urgent and Routine Care
58%42%
0%
100%
No Yes
Question Summaries (continued)
Children with Chronic Conditions
5%15%
80%
0%
100%
Never/Sometimes Usually Always
9%23%
69%
0%
100%
Never/Sometimes Usually Always
12%
47% 41%
0%
100%
None 1-2 times 3 or more times
69
2013 Virginia
FAMIS Child
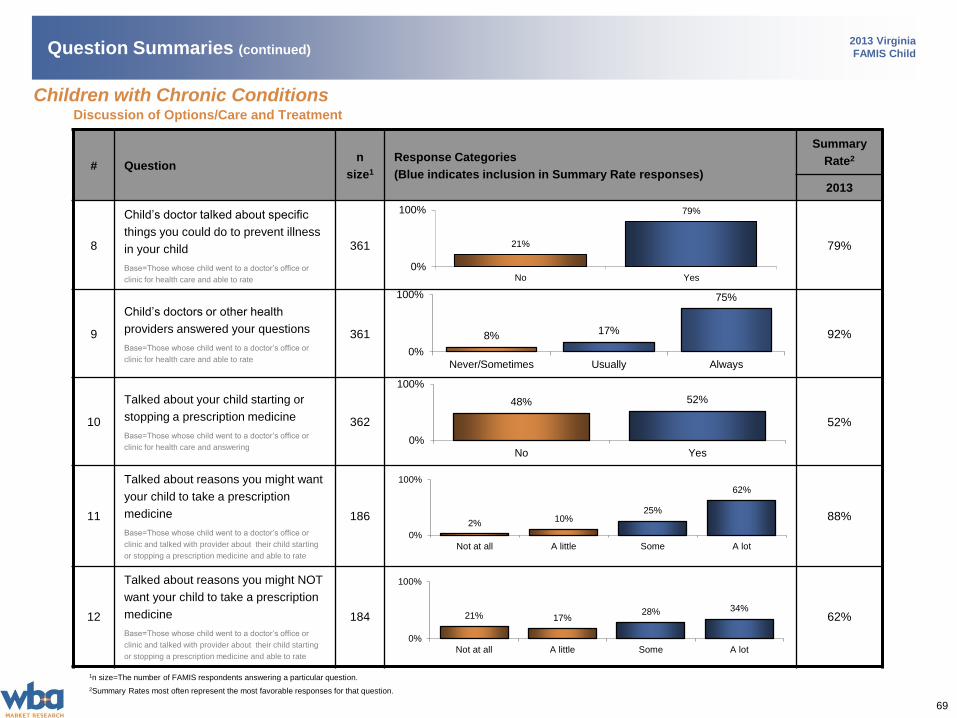
Discussion of Options/Care and Treatment
# Questionn
size1
Response Categories
(Blue indicates inclusion in Summary Rate responses)
Summary
Rate2
2013
8
Child’s doctor talked about specific
things you could do to prevent illness
in your child
Base=Those whose child went to a doctor’s office or
clinic for health care and able to rate
361 79%
9
Child’s doctors or other health
providers answered your questions
Base=Those whose child went to a doctor’s office or
clinic for health care and able to rate
361 92%
10
Talked about your child starting or
stopping a prescription medicine
Base=Those whose child went to a doctor’s office or
clinic for health care and answering
362 52%
11
Talked about reasons you might want
your child to take a prescription
medicine
Base=Those whose child went to a doctor’s office or
clinic and talked with provider about their child starting
or stopping a prescription medicine and able to rate
186 88%
12
Talked about reasons you might NOT
want your child to take a prescription
medicine
Base=Those whose child went to a doctor’s office or
clinic and talked with provider about their child starting
or stopping a prescription medicine and able to rate
184 62%
1n size=The number of FAMIS respondents answering a particular question.
2Summary Rates most often represent the most favorable responses for that question.
Question Summaries (continued)
48% 52%
0%
100%
No Yes
8%17%
75%
0%
100%
Never/Sometimes Usually Always
Children with Chronic Conditions
21%
79%
0%
100%
No Yes
2%10%
25%
62%
0%
100%
Not at all A little Some A lot
21% 17%28% 34%
0%
100%
Not at all A little Some A lot
70
2013 Virginia
FAMIS Child
Discussion of Options/Care and Treatment (continued)
# Questionn
size1
Response Categories
(Blue indicates inclusion in Summary Rate responses)
Summary
Rate2
2013
13
Asked what you thought was best
for your child4
Base=Those whose child went to a doctor’s office or
clinic and talked with provider about their child
starting or stopping a prescription medicine and
answering
185 81%
15
Got the care, tests or
treatment your child needed
Base=Those whose child went to a doctor’s office or
clinic for health care and able to rate
363 94%
1n size=The number of FAMIS respondents answering a particular question.
2Summary Rates most often represent the most favorable responses for that question.
19%
81%
0%
100%
No Yes
Question Summaries (continued)
Children with Chronic Conditions
6%22%
71%
0%
100%
Never/Sometimes Usually Always
71
2013 Virginia
FAMIS Child
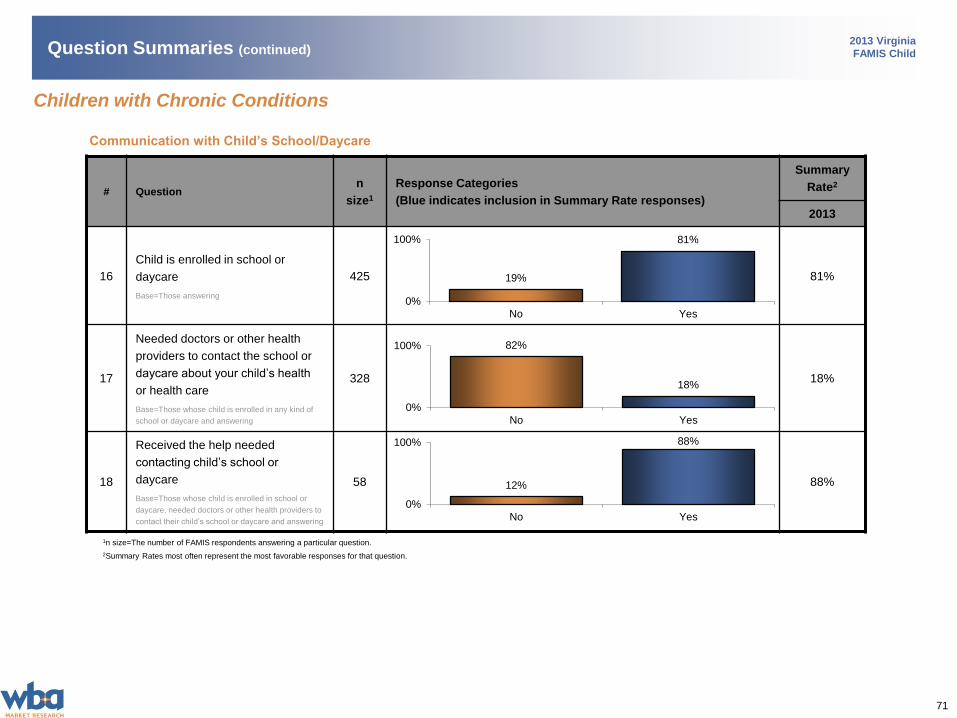
Communication with Child’s School/Daycare
# Questionn
size1
Response Categories
(Blue indicates inclusion in Summary Rate responses)
Summary
Rate2
2013
16
Child is enrolled in school or
daycare
Base=Those answering
425 81%
17
Needed doctors or other health
providers to contact the school or
daycare about your child’s health
or health care
Base=Those whose child is enrolled in any kind of
school or daycare and answering
328 18%
18
Received the help needed
contacting child’s school or
daycare
Base=Those whose child is enrolled in school or
daycare, needed doctors or other health providers to
contact their child’s school or daycare and answering
58 88%
1n size=The number of FAMIS respondents answering a particular question.
2Summary Rates most often represent the most favorable responses for that question.
19%
81%
0%
100%
No Yes
Question Summaries (continued)
Children with Chronic Conditions
82%
18%
0%
100%
No Yes
12%
88%
0%
100%
No Yes
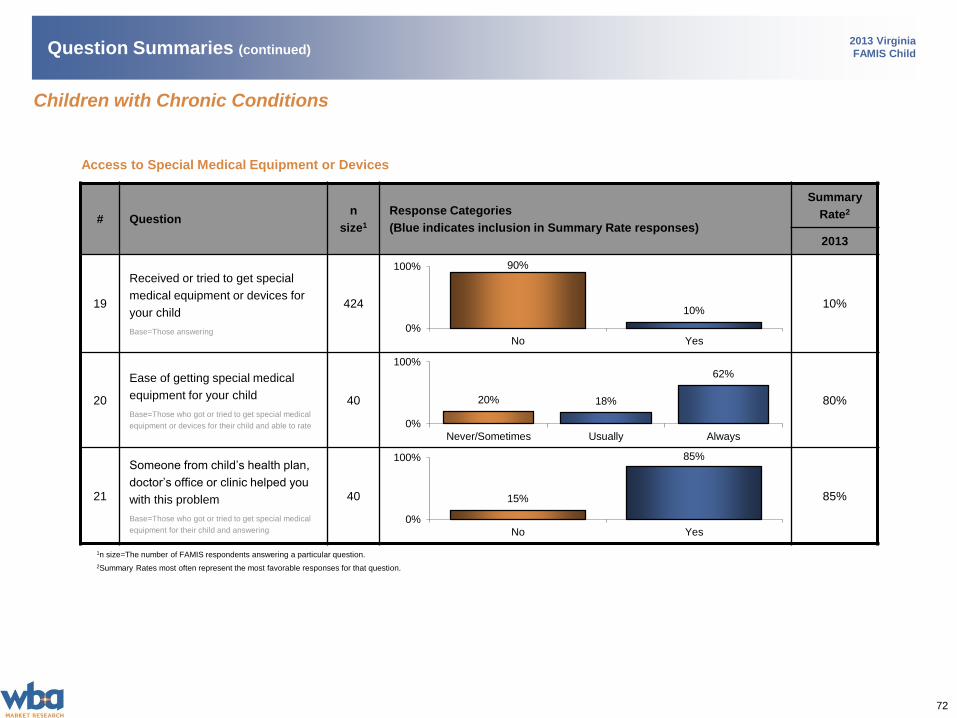
72
2013 Virginia
FAMIS Child
Access to Special Medical Equipment or Devices
# Questionn
size1
Response Categories
(Blue indicates inclusion in Summary Rate responses)
Summary
Rate2
2013
19
Received or tried to get special
medical equipment or devices for
your child
Base=Those answering
424 10%
20
Ease of getting special medical
equipment for your child
Base=Those who got or tried to get special medical
equipment or devices for their child and able to rate
40 80%
21
Someone from child’s health plan,
doctor’s office or clinic helped you
with this problem
Base=Those who got or tried to get special medical
equipment for their child and answering
40 85%
1n size=The number of FAMIS respondents answering a particular question.
2Summary Rates most often represent the most favorable responses for that question.
Question Summaries (continued)
90%
10%
0%
100%
No Yes
20% 18%
62%
0%
100%
Never/Sometimes Usually Always
15%
85%
0%
100%
No Yes
Children with Chronic Conditions

73
2013 Virginia
FAMIS Child
Access to Special Therapy
# Questionn
size1
Response Categories
(Blue indicates inclusion in Summary Rate responses)
Summary
Rate2
2013
22
Received or tried to get special
therapy for your child
Base=Those answering
423 14%
23
Ease of getting special therapy for
your child
Base=Those who got or tried to get special therapy
for their child and able to rate
60 73%
24
Someone from child’s health plan,
doctor’s office or clinic helped you
with this problem
Base=Those who got or tried to get special therapy
for their child and answering
60 65%
1n size=The number of FAMIS respondents answering a particular question.
2Summary Rates most often represent the most favorable responses for that question.
86%
14%
0%
100%
No Yes
Question Summaries (continued)
27%12%
62%
0%
100%
Never/Sometimes Usually Always
35%
65%
0%
100%
No Yes
Children with Chronic Conditions
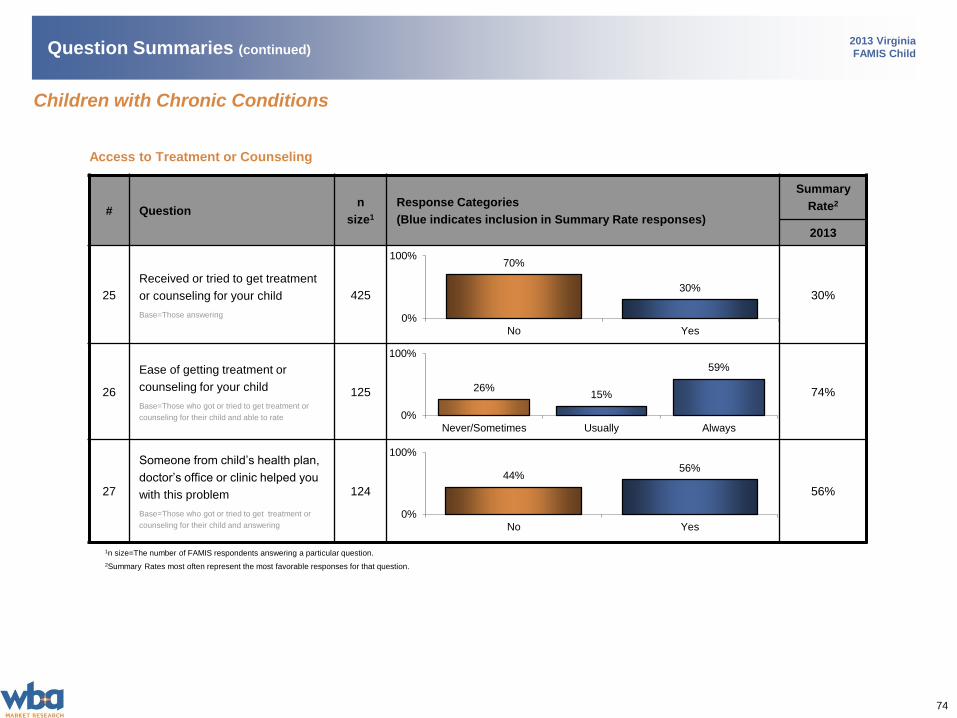
74
2013 Virginia
FAMIS Child
Access to Treatment or Counseling
# Questionn
size1
Response Categories
(Blue indicates inclusion in Summary Rate responses)
Summary
Rate2
2013
25
Received or tried to get treatment
or counseling for your child
Base=Those answering
425 30%
26
Ease of getting treatment or
counseling for your child
Base=Those who got or tried to get treatment or
counseling for their child and able to rate
125 74%
27
Someone from child’s health plan,
doctor’s office or clinic helped you
with this problem
Base=Those who got or tried to get treatment or
counseling for their child and answering
124 56%
1n size=The number of FAMIS respondents answering a particular question.
2Summary Rates most often represent the most favorable responses for that question.
70%
30%
0%
100%
No Yes
26%15%
59%
0%
100%
Never/Sometimes Usually Always
Question Summaries (continued)
44%56%
0%
100%
No Yes
Children with Chronic Conditions
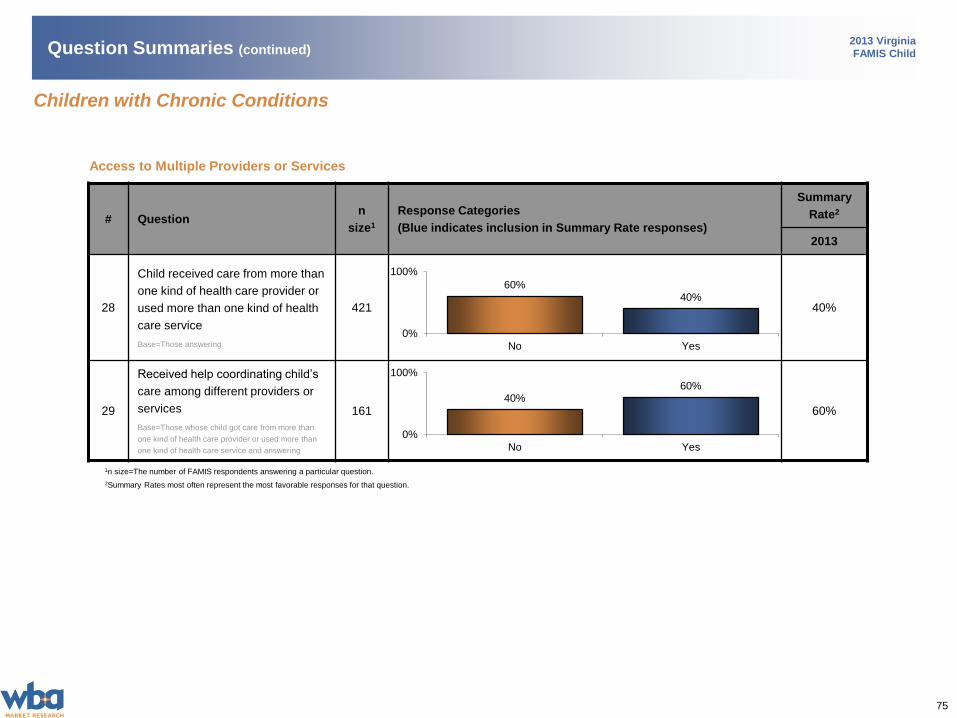
75
2013 Virginia
FAMIS Child
Access to Multiple Providers or Services
# Questionn
size1
Response Categories
(Blue indicates inclusion in Summary Rate responses)
Summary
Rate2
2013
28
Child received care from more than
one kind of health care provider or
used more than one kind of health
care service
Base=Those answering
421 40%
29
Received help coordinating child’s
care among different providers or
services
Base=Those whose child got care from more than
one kind of health care provider or used more than
one kind of health care service and answering
161 60%
1n size=The number of FAMIS respondents answering a particular question.
2Summary Rates most often represent the most favorable responses for that question.
Question Summaries (continued)
60%40%
0%
100%
No Yes
40%60%
0%
100%
No Yes
Children with Chronic Conditions
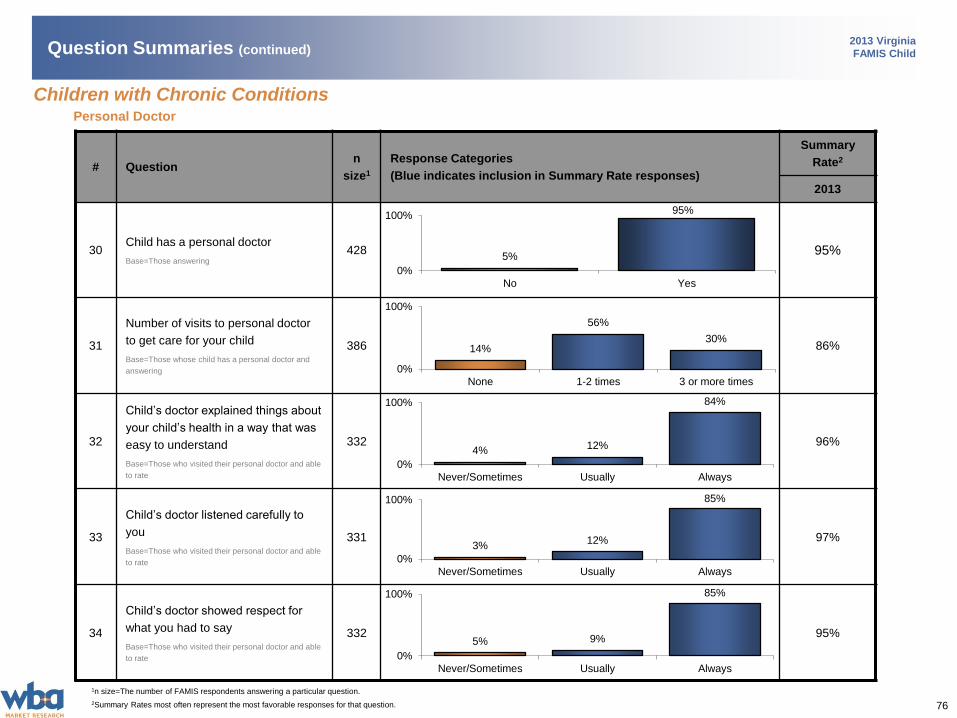
76
2013 Virginia
FAMIS Child
# Questionn
size1
Response Categories
(Blue indicates inclusion in Summary Rate responses)
Summary
Rate2
2013
30Child has a personal doctor
Base=Those answering
428 95%
31
Number of visits to personal doctor
to get care for your child
Base=Those whose child has a personal doctor and
answering
386 86%
32
Child’s doctor explained things about
your child’s health in a way that was
easy to understand
Base=Those who visited their personal doctor and able
to rate
332 96%
33
Child’s doctor listened carefully to
you
Base=Those who visited their personal doctor and able
to rate
331 97%
34
Child’s doctor showed respect for
what you had to say
Base=Those who visited their personal doctor and able
to rate
332 95%
1n size=The number of FAMIS respondents answering a particular question.
2Summary Rates most often represent the most favorable responses for that question.
5%
95%
0%
100%
No Yes
5% 9%
85%
0%
100%
Never/Sometimes Usually Always
Question Summaries (continued)
3%12%
85%
0%
100%
Never/Sometimes Usually Always
4% 12%
84%
0%
100%
Never/Sometimes Usually Always
14%
56%
30%
0%
100%
None 1-2 times 3 or more times
Personal Doctor
Children with Chronic Conditions
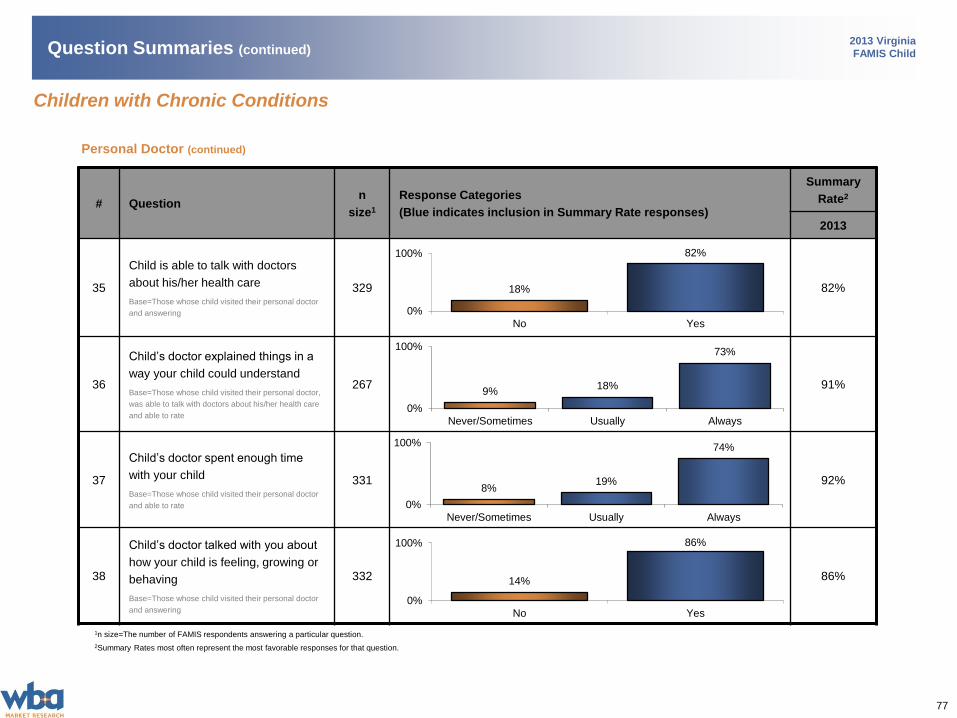
77
2013 Virginia
FAMIS Child
Personal Doctor (continued)
# Questionn
size1
Response Categories
(Blue indicates inclusion in Summary Rate responses)
Summary
Rate2
2013
35
Child is able to talk with doctors
about his/her health care
Base=Those whose child visited their personal doctor
and answering
329 82%
36
Child’s doctor explained things in a
way your child could understand
Base=Those whose child visited their personal doctor,
was able to talk with doctors about his/her health care
and able to rate
267 91%
37
Child’s doctor spent enough time
with your child
Base=Those whose child visited their personal doctor
and able to rate
331 92%
38
Child’s doctor talked with you about
how your child is feeling, growing or
behaving
Base=Those whose child visited their personal doctor
and answering
332 86%
1n size=The number of FAMIS respondents answering a particular question.
2Summary Rates most often represent the most favorable responses for that question.
Question Summaries (continued)
9%18%
73%
0%
100%
Never/Sometimes Usually Always
8%19%
74%
0%
100%
Never/Sometimes Usually Always
18%
82%
0%
100%
No Yes
14%
86%
0%
100%
No Yes
Children with Chronic Conditions
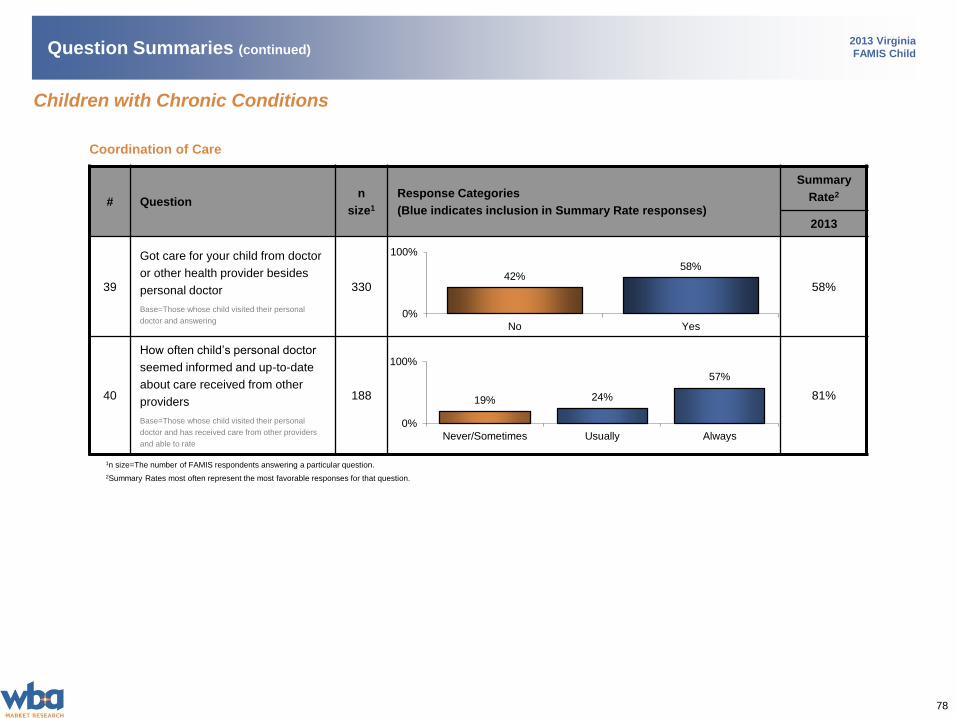
78
2013 Virginia
FAMIS Child
Coordination of Care
# Questionn
size1
Response Categories
(Blue indicates inclusion in Summary Rate responses)
Summary
Rate2
2013
39
Got care for your child from doctor
or other health provider besides
personal doctor
Base=Those whose child visited their personal
doctor and answering
330 58%
40
How often child’s personal doctor
seemed informed and up-to-date
about care received from other
providers
Base=Those whose child visited their personal
doctor and has received care from other providers
and able to rate
188 81%
1n size=The number of FAMIS respondents answering a particular question.
2Summary Rates most often represent the most favorable responses for that question.
Question Summaries (continued)
19% 24%
57%
0%
100%
Never/Sometimes Usually Always
42%58%
0%
100%
No Yes
Children with Chronic Conditions
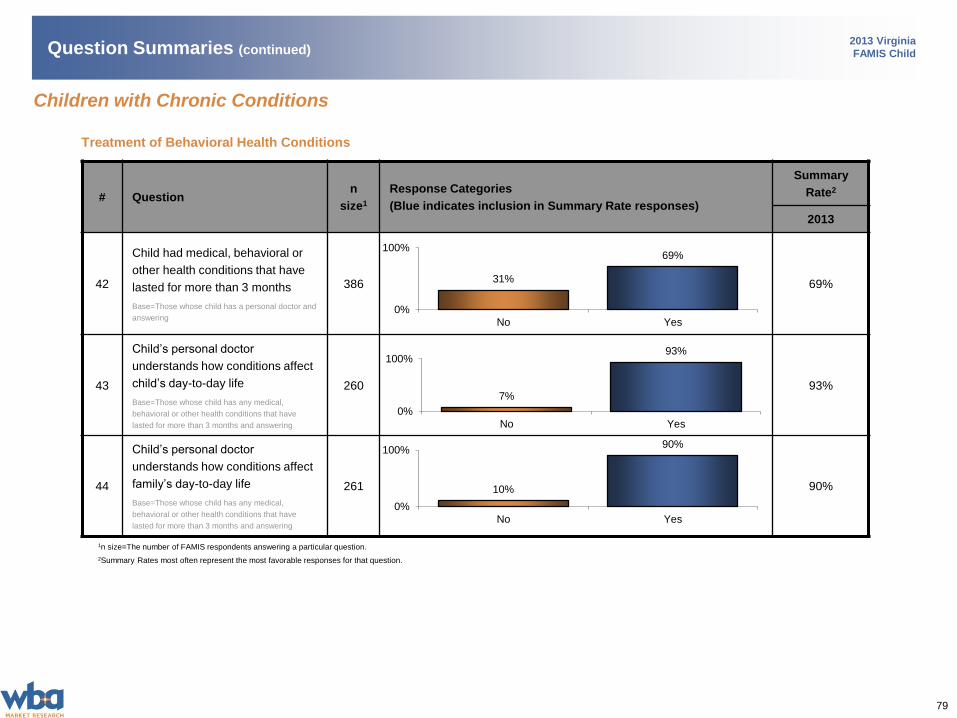
79
2013 Virginia
FAMIS Child
# Questionn
size1
Response Categories
(Blue indicates inclusion in Summary Rate responses)
Summary
Rate2
2013
42
Child had medical, behavioral or
other health conditions that have
lasted for more than 3 months
Base=Those whose child has a personal doctor and
answering
386 69%
43
Child’s personal doctor
understands how conditions affect
child’s day-to-day life
Base=Those whose child has any medical,
behavioral or other health conditions that have
lasted for more than 3 months and answering
260 93%
44
Child’s personal doctor
understands how conditions affect
family’s day-to-day life
Base=Those whose child has any medical,
behavioral or other health conditions that have
lasted for more than 3 months and answering
261 90%
1n size=The number of FAMIS respondents answering a particular question.
2Summary Rates most often represent the most favorable responses for that question.
31%
69%
0%
100%
No Yes
Question Summaries (continued)
Treatment of Behavioral Health Conditions
7%
93%
0%
100%
No Yes
10%
90%
0%
100%
No Yes
Children with Chronic Conditions
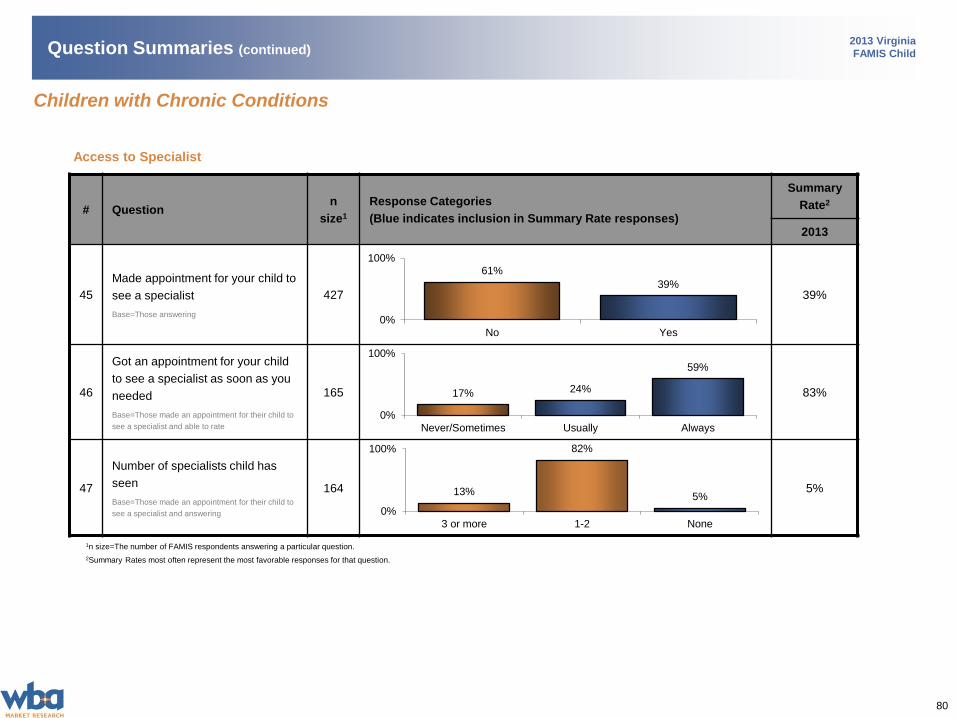
80
2013 Virginia
FAMIS Child
Access to Specialist
# Questionn
size1
Response Categories
(Blue indicates inclusion in Summary Rate responses)
Summary
Rate2
2013
45
Made appointment for your child to
see a specialist
Base=Those answering
427 39%
46
Got an appointment for your child
to see a specialist as soon as you
needed
Base=Those made an appointment for their child to
see a specialist and able to rate
165 83%
47
Number of specialists child has
seen
Base=Those made an appointment for their child to
see a specialist and answering
164 5%
1n size=The number of FAMIS respondents answering a particular question.
2Summary Rates most often represent the most favorable responses for that question.
61%
39%
0%
100%
No Yes
Question Summaries (continued)
17% 24%
59%
0%
100%
Never/Sometimes Usually Always
13%
82%
5%
0%
100%
3 or more 1-2 None
Children with Chronic Conditions
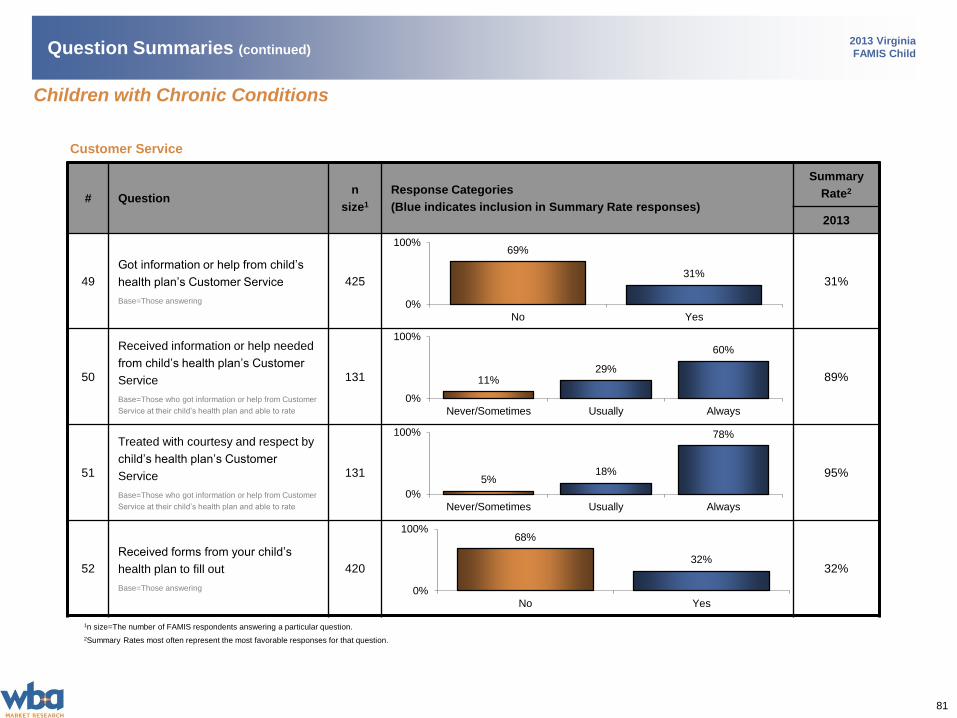
81
2013 Virginia
FAMIS Child
Customer Service
# Questionn
size1
Response Categories
(Blue indicates inclusion in Summary Rate responses)
Summary
Rate2
2013
49
Got information or help from child’s
health plan’s Customer Service
Base=Those answering
425 31%
50
Received information or help needed
from child’s health plan’s Customer
Service
Base=Those who got information or help from Customer
Service at their child’s health plan and able to rate
131 89%
51
Treated with courtesy and respect by
child’s health plan’s Customer
Service
Base=Those who got information or help from Customer
Service at their child’s health plan and able to rate
131 95%
52
Received forms from your child’s
health plan to fill out
Base=Those answering
420 32%
1n size=The number of FAMIS respondents answering a particular question.
2Summary Rates most often represent the most favorable responses for that question.
69%
31%
0%
100%
No Yes
Question Summaries (continued)
11%29%
60%
0%
100%
Never/Sometimes Usually Always
5%18%
78%
0%
100%
Never/Sometimes Usually Always
Children with Chronic Conditions
68%
32%
0%
100%
No Yes
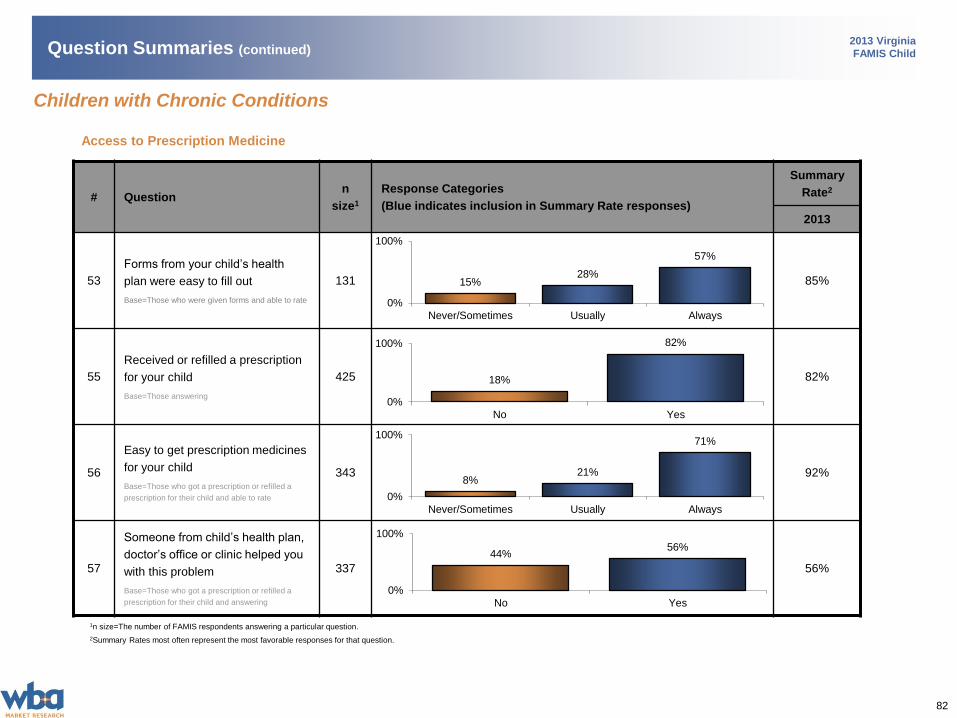
82
2013 Virginia
FAMIS Child
Access to Prescription Medicine
# Questionn
size1
Response Categories
(Blue indicates inclusion in Summary Rate responses)
Summary
Rate2
2013
53
Forms from your child’s health
plan were easy to fill out
Base=Those who were given forms and able to rate
131 85%
55
Received or refilled a prescription
for your child
Base=Those answering
425 82%
56
Easy to get prescription medicines
for your child
Base=Those who got a prescription or refilled a
prescription for their child and able to rate
343 92%
57
Someone from child’s health plan,
doctor’s office or clinic helped you
with this problem
Base=Those who got a prescription or refilled a
prescription for their child and answering
337 56%
1n size=The number of FAMIS respondents answering a particular question.
2Summary Rates most often represent the most favorable responses for that question.
Question Summaries (continued)
18%
82%
0%
100%
No Yes
8%21%
71%
0%
100%
Never/Sometimes Usually Always
44%56%
0%
100%
No Yes
Children with Chronic Conditions
15%28%
57%
0%
100%
Never/Sometimes Usually Always
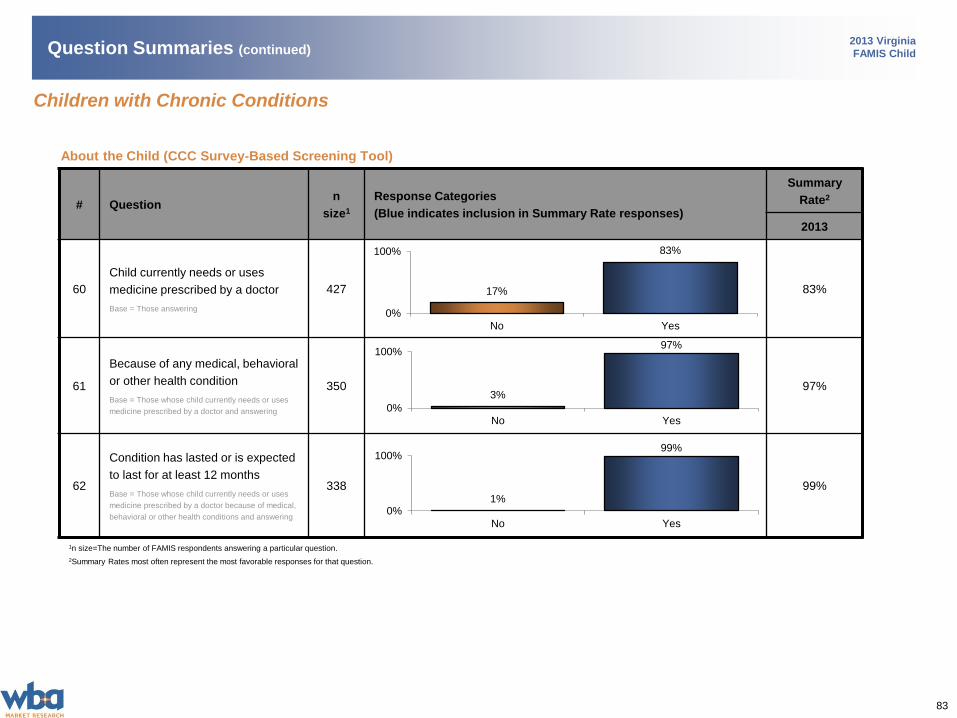
83
2013 Virginia
FAMIS Child
About the Child (CCC Survey-Based Screening Tool)
# Questionn
size1
Response Categories
(Blue indicates inclusion in Summary Rate responses)
Summary
Rate2
2013
60
Child currently needs or uses
medicine prescribed by a doctor
Base = Those answering
427 83%
61
Because of any medical, behavioral
or other health condition
Base = Those whose child currently needs or uses
medicine prescribed by a doctor and answering
350 97%
62
Condition has lasted or is expected
to last for at least 12 months
Base = Those whose child currently needs or uses
medicine prescribed by a doctor because of medical,
behavioral or other health conditions and answering
338 99%
1n size=The number of FAMIS respondents answering a particular question.
2Summary Rates most often represent the most favorable responses for that question.
17%
83%
0%
100%
No Yes
Question Summaries (continued)
1%
99%
0%
100%
No Yes
3%
97%
0%
100%
No Yes
Children with Chronic Conditions
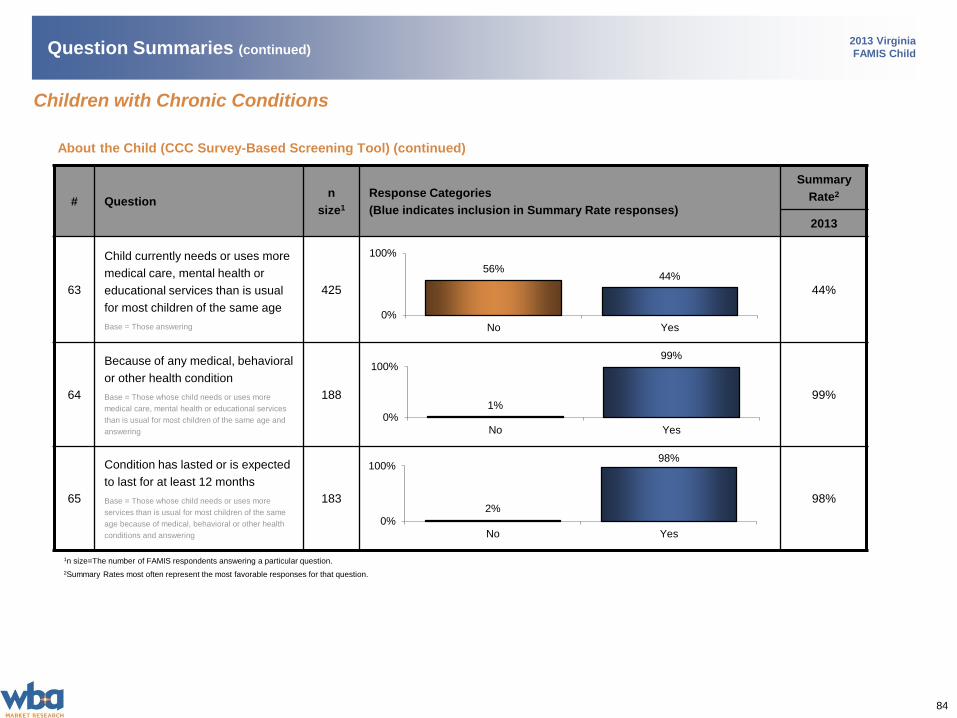
84
2013 Virginia
FAMIS Child
About the Child (CCC Survey-Based Screening Tool) (continued)
# Questionn
size1
Response Categories
(Blue indicates inclusion in Summary Rate responses)
Summary
Rate2
2013
63
Child currently needs or uses more
medical care, mental health or
educational services than is usual
for most children of the same age
Base = Those answering
425 44%
64
Because of any medical, behavioral
or other health condition
Base = Those whose child needs or uses more
medical care, mental health or educational services
than is usual for most children of the same age and
answering
188 99%
65
Condition has lasted or is expected
to last for at least 12 months
Base = Those whose child needs or uses more
services than is usual for most children of the same
age because of medical, behavioral or other health
conditions and answering
183 98%
1n size=The number of FAMIS respondents answering a particular question.
2Summary Rates most often represent the most favorable responses for that question.
56%44%
0%
100%
No Yes
Question Summaries (continued)
2%
98%
0%
100%
No Yes
1%
99%
0%
100%
No Yes
Children with Chronic Conditions
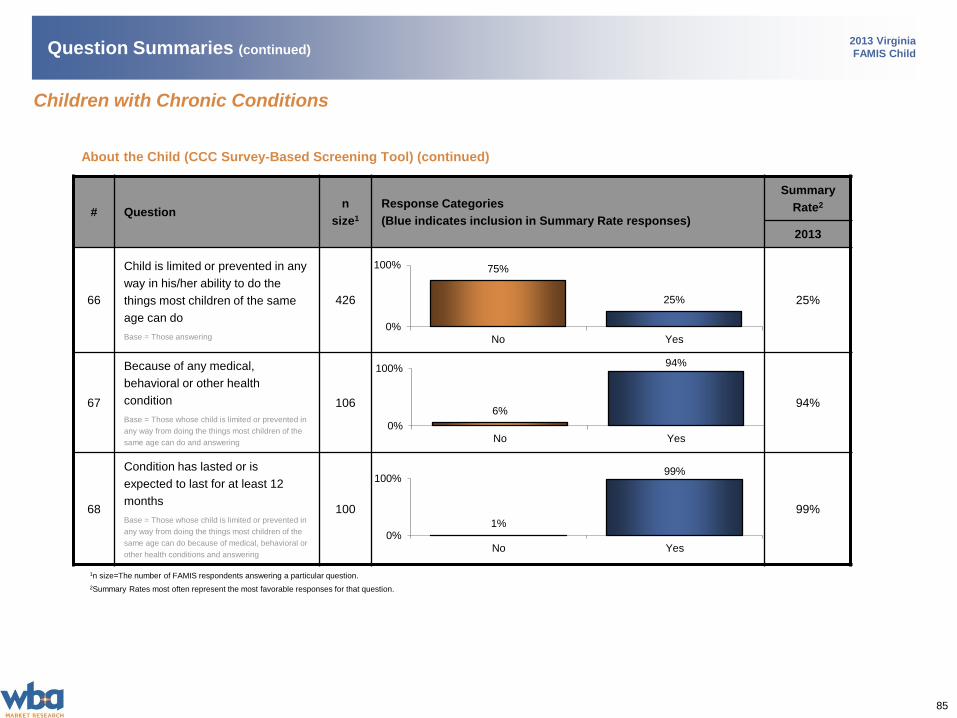
85
2013 Virginia
FAMIS Child
# Questionn
size1
Response Categories
(Blue indicates inclusion in Summary Rate responses)
Summary
Rate2
2013
66
Child is limited or prevented in any
way in his/her ability to do the
things most children of the same
age can do
Base = Those answering
426 25%
67
Because of any medical,
behavioral or other health
condition
Base = Those whose child is limited or prevented in
any way from doing the things most children of the
same age can do and answering
106 94%
68
Condition has lasted or is
expected to last for at least 12
months
Base = Those whose child is limited or prevented in
any way from doing the things most children of the
same age can do because of medical, behavioral or
other health conditions and answering
100 99%
1n size=The number of FAMIS respondents answering a particular question.
2Summary Rates most often represent the most favorable responses for that question.
75%
25%
0%
100%
No Yes
Question Summaries (continued)
1%
99%
0%
100%
No Yes
6%
94%
0%
100%
No Yes
About the Child (CCC Survey-Based Screening Tool) (continued)
Children with Chronic Conditions
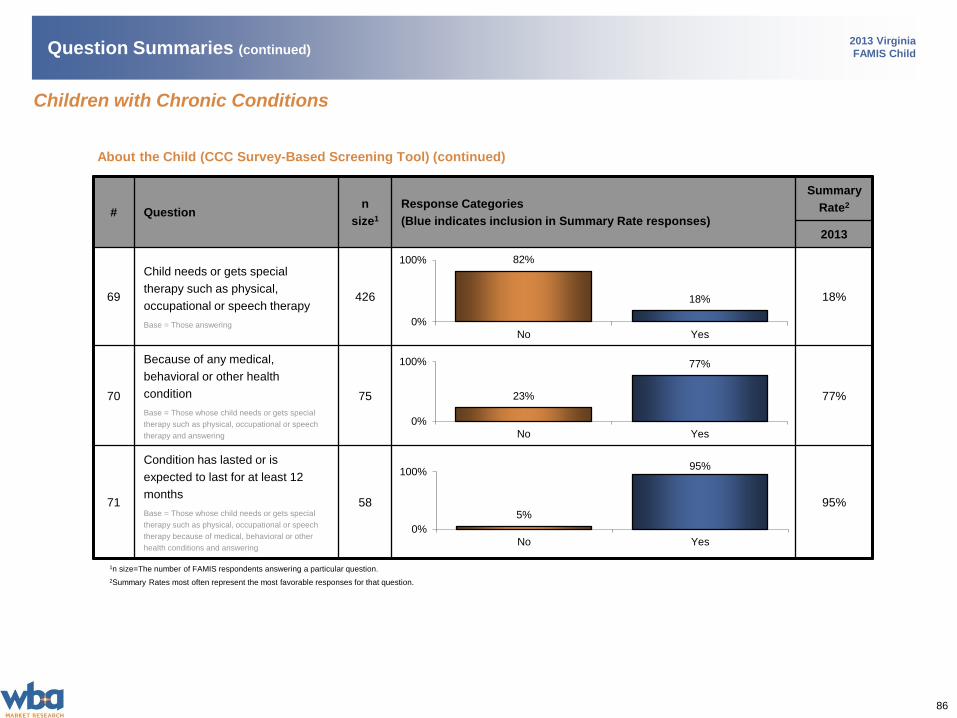
86
2013 Virginia
FAMIS Child
# Questionn
size1
Response Categories
(Blue indicates inclusion in Summary Rate responses)
Summary
Rate2
2013
69
Child needs or gets special
therapy such as physical,
occupational or speech therapy
Base = Those answering
426 18%
70
Because of any medical,
behavioral or other health
condition
Base = Those whose child needs or gets special
therapy such as physical, occupational or speech
therapy and answering
75 77%
71
Condition has lasted or is
expected to last for at least 12
months
Base = Those whose child needs or gets special
therapy such as physical, occupational or speech
therapy because of medical, behavioral or other
health conditions and answering
58 95%
1n size=The number of FAMIS respondents answering a particular question.
2Summary Rates most often represent the most favorable responses for that question.
82%
18%
0%
100%
No Yes
Question Summaries (continued)
5%
95%
0%
100%
No Yes
23%
77%
0%
100%
No Yes
About the Child (CCC Survey-Based Screening Tool) (continued)
Children with Chronic Conditions
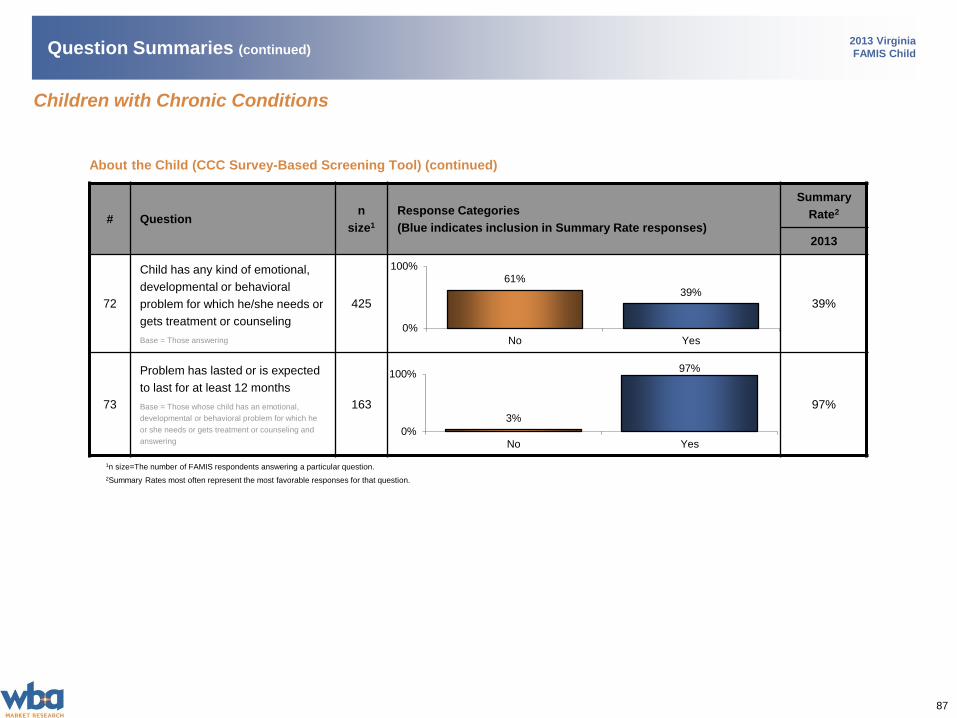
87
2013 Virginia
FAMIS Child
# Questionn
size1
Response Categories
(Blue indicates inclusion in Summary Rate responses)
Summary
Rate2
2013
72
Child has any kind of emotional,
developmental or behavioral
problem for which he/she needs or
gets treatment or counseling
Base = Those answering
425 39%
73
Problem has lasted or is expected
to last for at least 12 months
Base = Those whose child has an emotional,
developmental or behavioral problem for which he
or she needs or gets treatment or counseling and
answering
163 97%
1n size=The number of FAMIS respondents answering a particular question.
2Summary Rates most often represent the most favorable responses for that question.
61%
39%
0%
100%
No Yes
Question Summaries (continued)
3%
97%
0%
100%
No Yes
About the Child (CCC Survey-Based Screening Tool) (continued)
Children with Chronic Conditions
FAMIS Segmentation Analysis
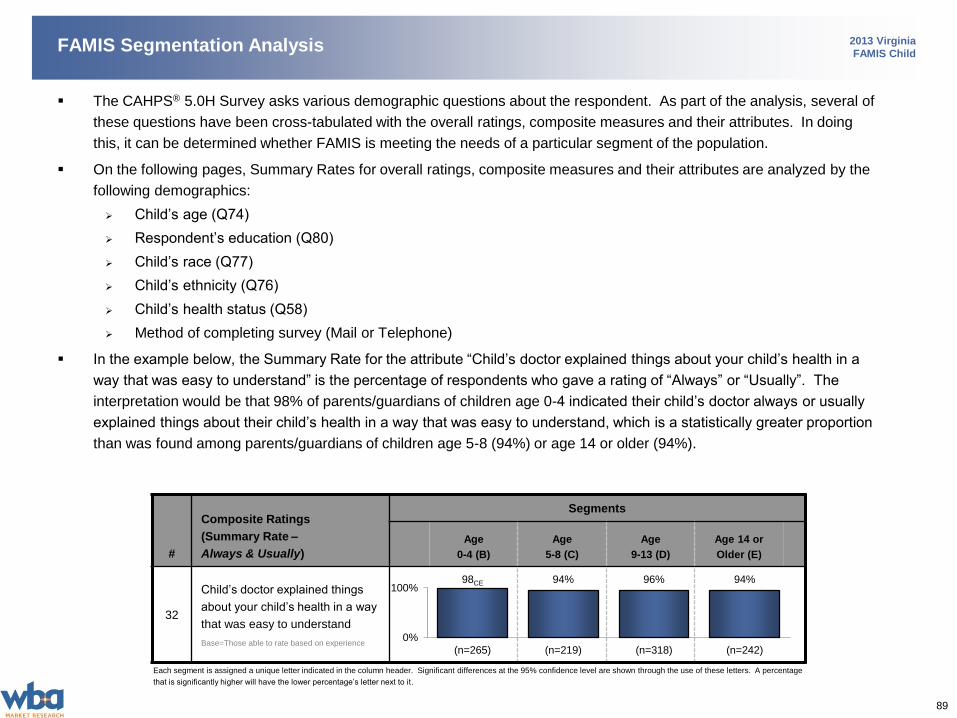
89
2013 Virginia
FAMIS ChildFAMIS Segmentation Analysis
The CAHPS® 5.0H Survey asks various demographic questions about the respondent. As part of the analysis, several of
these questions have been cross-tabulated with the overall ratings, composite measures and their attributes. In doing
this, it can be determined whether FAMIS is meeting the needs of a particular segment of the population.
On the following pages, Summary Rates for overall ratings, composite measures and their attributes are analyzed by the
following demographics:
Child’s age (Q74)
Respondent’s education (Q80)
Child’s race (Q77)
Child’s ethnicity (Q76)
Child’s health status (Q58)
Method of completing survey (Mail or Telephone)
In the example below, the Summary Rate for the attribute “Child’s doctor explained things about your child’s health in a
way that was easy to understand” is the percentage of respondents who gave a rating of “Always” or “Usually”. The
interpretation would be that 98% of parents/guardians of children age 0-4 indicated their child’s doctor always or usually
explained things about their child’s health in a way that was easy to understand, which is a statistically greater proportion
than was found among parents/guardians of children age 5-8 (94%) or age 14 or older (94%).
#
Composite Ratings
(Summary Rate –
Always & Usually)
Segments
Age
0-4 (B)
Age
5-8 (C)
Age
9-13 (D)
Age 14 or
Older (E)
32
Child’s doctor explained things
about your child’s health in a way
that was easy to understand
Base=Those able to rate based on experience
98CE 94% 96% 94%
0%
100%
(n=265) (n=219) (n=318) (n=242)
Each segment is assigned a unique letter indicated in the column header. Significant differences at the 95% confidence level are shown through the use of these letters. A percentage
that is significantly higher will have the lower percentage’s letter next to it.
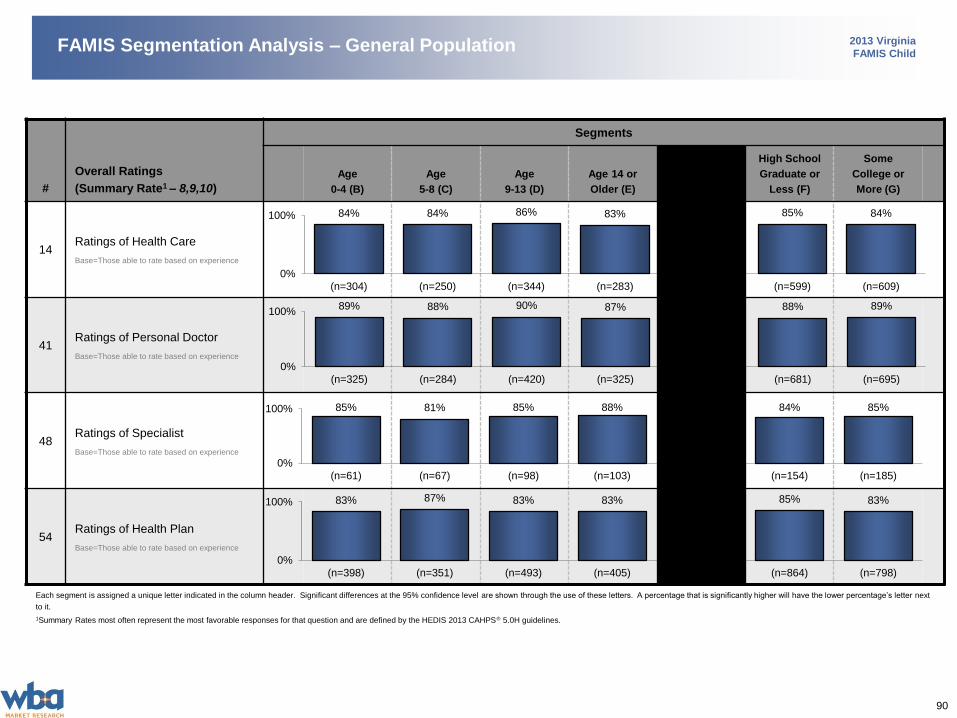
90
2013 Virginia
FAMIS ChildFAMIS Segmentation Analysis – General Population
#
Overall Ratings
(Summary Rate1 – 8,9,10)
Segments
Age
0-4 (B)
Age
5-8 (C)
Age
9-13 (D)
Age 14 or
Older (E)
High School
Graduate or
Less (F)
Some
College or
More (G)
14Ratings of Health Care
Base=Those able to rate based on experience
41Ratings of Personal Doctor
Base=Those able to rate based on experience
48Ratings of Specialist
Base=Those able to rate based on experience
54Ratings of Health Plan
Base=Those able to rate based on experience
Each segment is assigned a unique letter indicated in the column header. Significant differences at the 95% confidence level are shown through the use of these letters. A percentage that is significantly higher will have the lower percentage’s letter next
to it.
1Summary Rates most often represent the most favorable responses for that question and are defined by the HEDIS 2013 CAHPS® 5.0H guidelines.
84% 84% 86% 83% 85% 84%
0%
100%
(n=304) (n=250) (n=344) (n=283) (n=599) (n=609)
89% 88% 90% 87% 88% 89%
0%
100%
(n=325) (n=284) (n=420) (n=325) (n=681) (n=695)
85% 81% 85% 88% 84% 85%
0%
100%
(n=61) (n=67) (n=98) (n=103) (n=154) (n=185)
83% 87% 83% 83% 85% 83%
0%
100%
(n=398) (n=351) (n=493) (n=405) (n=864) (n=798)
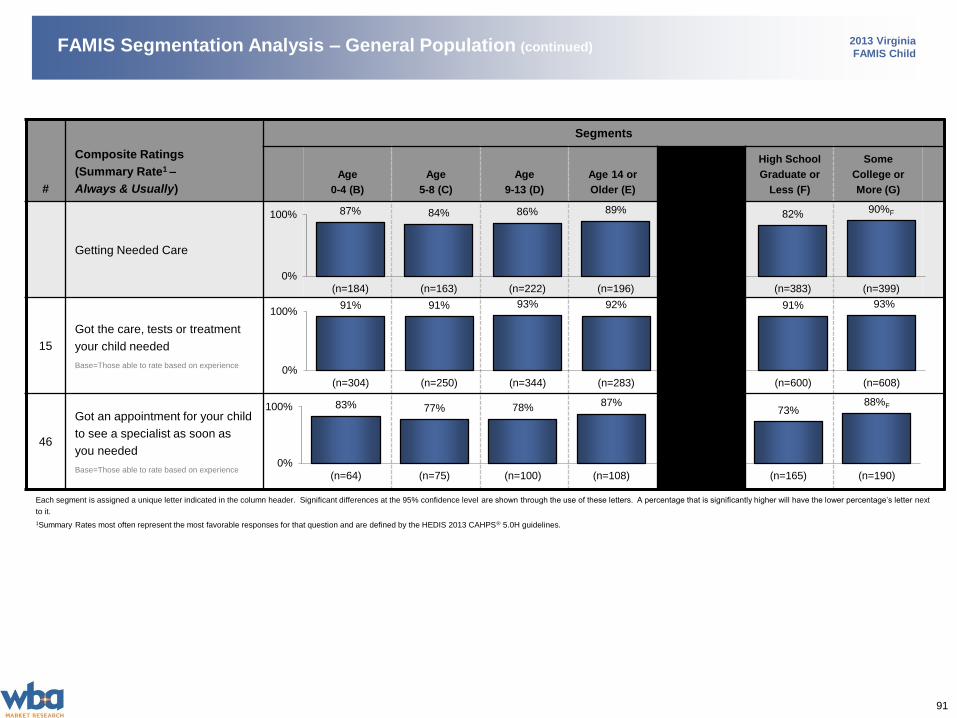
91
2013 Virginia
FAMIS ChildFAMIS Segmentation Analysis – General Population (continued)
#
Composite Ratings
(Summary Rate1 –
Always & Usually)
Segments
Age
0-4 (B)
Age
5-8 (C)
Age
9-13 (D)
Age 14 or
Older (E)
High School
Graduate or
Less (F)
Some
College or
More (G)
Getting Needed Care
15
Got the care, tests or treatment
your child needed
Base=Those able to rate based on experience
46
Got an appointment for your child
to see a specialist as soon as
you needed
Base=Those able to rate based on experience
Each segment is assigned a unique letter indicated in the column header. Significant differences at the 95% confidence level are shown through the use of these letters. A percentage that is significantly higher will have the lower percentage’s letter next
to it.
1Summary Rates most often represent the most favorable responses for that question and are defined by the HEDIS 2013 CAHPS® 5.0H guidelines.
87% 84% 86% 89% 82% 90%F
0%
100%
(n=184) (n=163) (n=222) (n=196) (n=383) (n=399)
91% 91% 93% 92% 91% 93%
0%
100%
(n=304) (n=250) (n=344) (n=283) (n=600) (n=608)
83% 77% 78%87%
73%88%F
0%
100%
(n=64) (n=75) (n=100) (n=108) (n=165) (n=190)
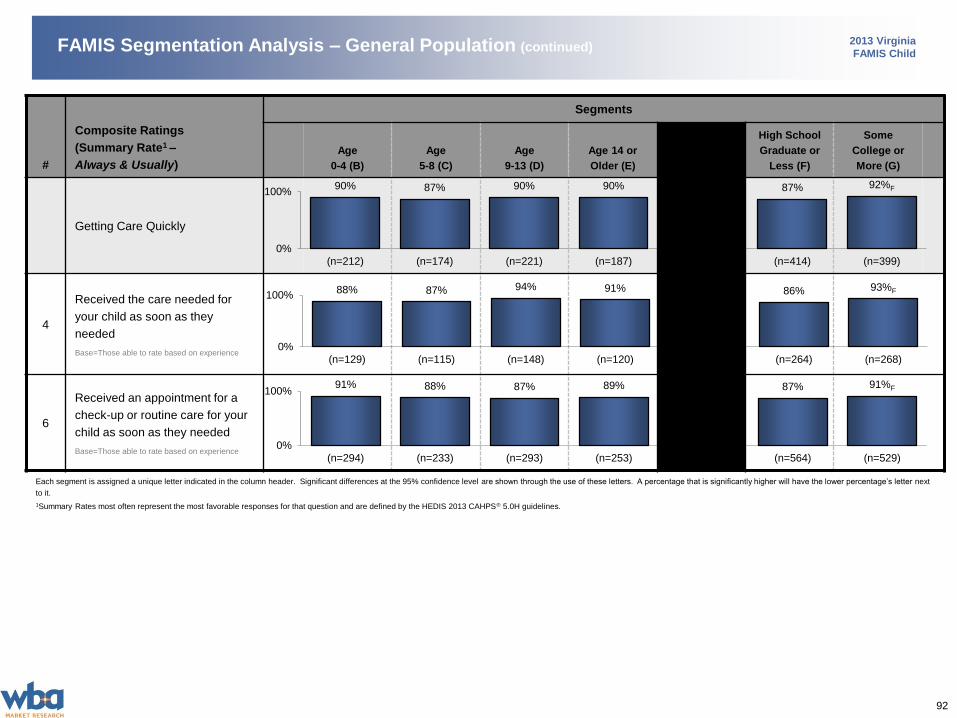
92
2013 Virginia
FAMIS ChildFAMIS Segmentation Analysis – General Population (continued)
#
Composite Ratings
(Summary Rate1 –
Always & Usually)
Segments
Age
0-4 (B)
Age
5-8 (C)
Age
9-13 (D)
Age 14 or
Older (E)
High School
Graduate or
Less (F)
Some
College or
More (G)
Getting Care Quickly
4
Received the care needed for
your child as soon as they
needed
Base=Those able to rate based on experience
6
Received an appointment for a
check-up or routine care for your
child as soon as they needed
Base=Those able to rate based on experience
Each segment is assigned a unique letter indicated in the column header. Significant differences at the 95% confidence level are shown through the use of these letters. A percentage that is significantly higher will have the lower percentage’s letter next
to it.
1Summary Rates most often represent the most favorable responses for that question and are defined by the HEDIS 2013 CAHPS® 5.0H guidelines.
90% 87% 90% 90% 87% 92%F
0%
100%
(n=212) (n=174) (n=221) (n=187) (n=414) (n=399)
88% 87% 94% 91% 86% 93%F
0%
100%
(n=129) (n=115) (n=148) (n=120) (n=264) (n=268)
91% 88% 87% 89% 87% 91%F
0%
100%
(n=294) (n=233) (n=293) (n=253) (n=564) (n=529)
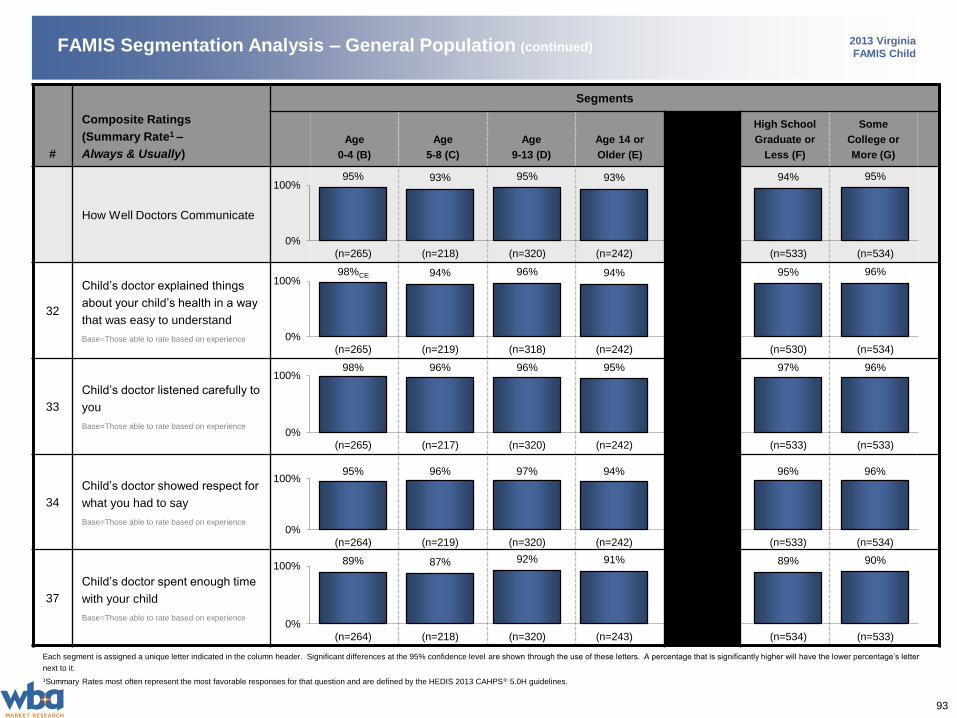
93
2013 Virginia
FAMIS ChildFAMIS Segmentation Analysis – General Population (continued)
#
Composite Ratings
(Summary Rate1 –
Always & Usually)
Segments
Age
0-4 (B)
Age
5-8 (C)
Age
9-13 (D)
Age 14 or
Older (E)
High School
Graduate or
Less (F)
Some
College or
More (G)
How Well Doctors Communicate
32
Child’s doctor explained things
about your child’s health in a way
that was easy to understand
Base=Those able to rate based on experience
33
Child’s doctor listened carefully to
you
Base=Those able to rate based on experience
34
Child’s doctor showed respect for
what you had to say
Base=Those able to rate based on experience
37
Child’s doctor spent enough time
with your child
Base=Those able to rate based on experience
Each segment is assigned a unique letter indicated in the column header. Significant differences at the 95% confidence level are shown through the use of these letters. A percentage that is significantly higher will have the lower percentage’s letter
next to it.
1Summary Rates most often represent the most favorable responses for that question and are defined by the HEDIS 2013 CAHPS® 5.0H guidelines.
95% 93% 95% 93% 94% 95%
0%
100%
(n=265) (n=218) (n=320) (n=242) (n=533) (n=534)
98%CE 94% 96% 94% 95% 96%
0%
100%
(n=265) (n=219) (n=318) (n=242) (n=530) (n=534)
98% 96% 96% 95% 97% 96%
0%
100%
(n=265) (n=217) (n=320) (n=242) (n=533) (n=533)
95% 96% 97% 94% 96% 96%
0%
100%
(n=264) (n=219) (n=320) (n=242) (n=533) (n=534)
89% 87% 92% 91% 89% 90%
0%
100%
(n=264) (n=218) (n=320) (n=243) (n=534) (n=533)
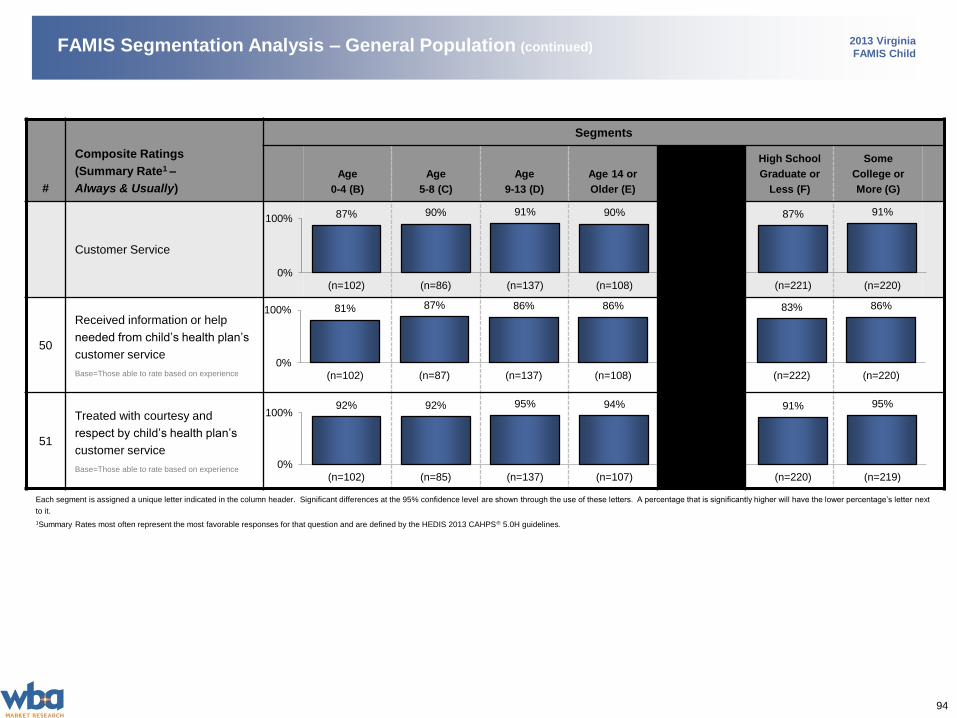
94
2013 Virginia
FAMIS ChildFAMIS Segmentation Analysis – General Population (continued)
#
Composite Ratings
(Summary Rate1 –
Always & Usually)
Segments
Age
0-4 (B)
Age
5-8 (C)
Age
9-13 (D)
Age 14 or
Older (E)
High School
Graduate or
Less (F)
Some
College or
More (G)
Customer Service
50
Received information or help
needed from child’s health plan’s
customer service
Base=Those able to rate based on experience
51
Treated with courtesy and
respect by child’s health plan’s
customer service
Base=Those able to rate based on experience
Each segment is assigned a unique letter indicated in the column header. Significant differences at the 95% confidence level are shown through the use of these letters. A percentage that is significantly higher will have the lower percentage’s letter next
to it.
1Summary Rates most often represent the most favorable responses for that question and are defined by the HEDIS 2013 CAHPS® 5.0H guidelines.
87% 90% 91% 90% 87% 91%
0%
100%
(n=102) (n=86) (n=137) (n=108) (n=221) (n=220)
81% 87% 86% 86% 83% 86%
0%
100%
(n=102) (n=87) (n=137) (n=108) (n=222) (n=220)
92% 92% 95% 94% 91% 95%
0%
100%
(n=102) (n=85) (n=137) (n=107) (n=220) (n=219)
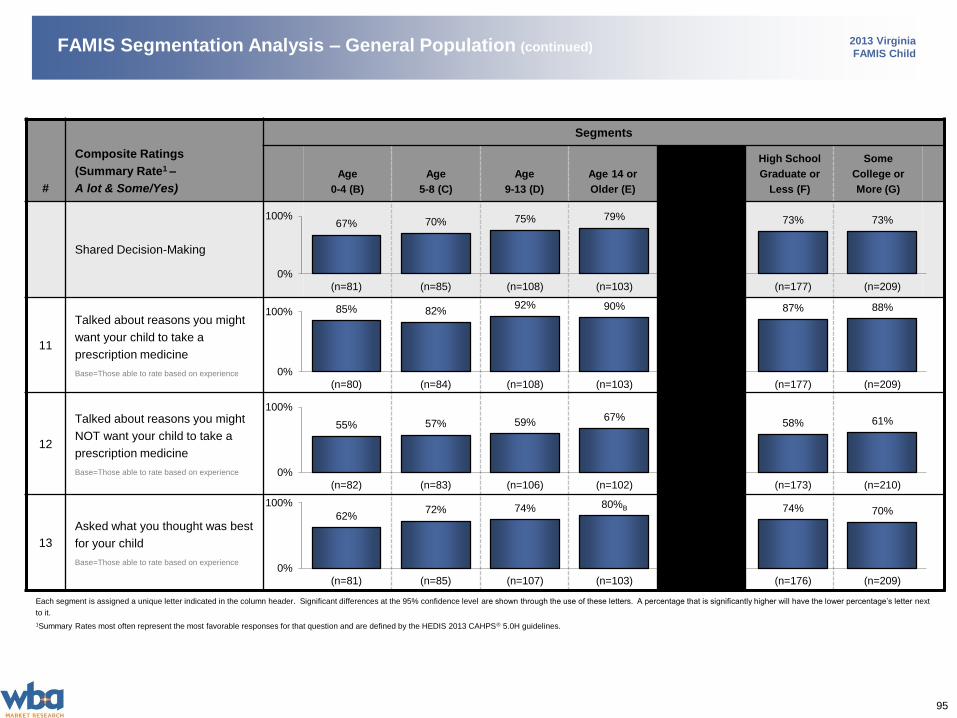
95
2013 Virginia
FAMIS ChildFAMIS Segmentation Analysis – General Population (continued)
#
Composite Ratings
(Summary Rate1 –
A lot & Some/Yes)
Segments
Age
0-4 (B)
Age
5-8 (C)
Age
9-13 (D)
Age 14 or
Older (E)
High School
Graduate or
Less (F)
Some
College or
More (G)
Shared Decision-Making
11
Talked about reasons you might
want your child to take a
prescription medicine
Base=Those able to rate based on experience
12
Talked about reasons you might
NOT want your child to take a
prescription medicine
Base=Those able to rate based on experience
13
Asked what you thought was best
for your child
Base=Those able to rate based on experience
Each segment is assigned a unique letter indicated in the column header. Significant differences at the 95% confidence level are shown through the use of these letters. A percentage that is significantly higher will have the lower percentage’s letter next
to it.
1Summary Rates most often represent the most favorable responses for that question and are defined by the HEDIS 2013 CAHPS® 5.0H guidelines.
67% 70% 75% 79% 73% 73%
0%
100%
(n=81) (n=85) (n=108) (n=103) (n=177) (n=209)
85% 82%92% 90% 87% 88%
0%
100%
(n=80) (n=84) (n=108) (n=103) (n=177) (n=209)
55% 57% 59%67%
58% 61%
0%
100%
(n=82) (n=83) (n=106) (n=102) (n=173) (n=210)
62%72% 74% 80%B 74% 70%
0%
100%
(n=81) (n=85) (n=107) (n=103) (n=176) (n=209)
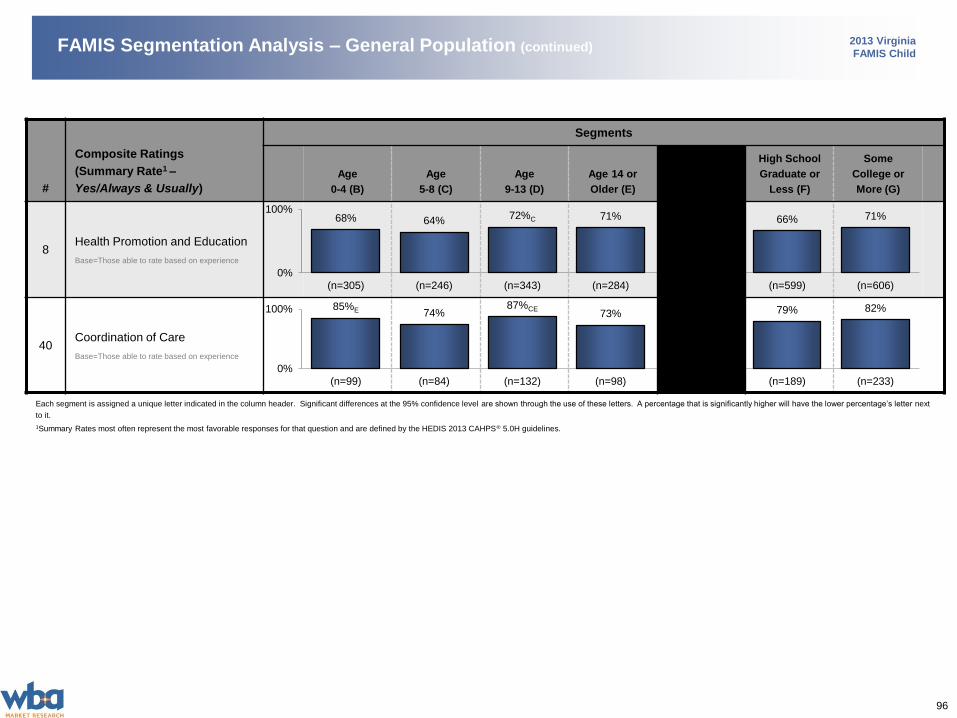
96
2013 Virginia
FAMIS ChildFAMIS Segmentation Analysis – General Population (continued)
#
Composite Ratings
(Summary Rate1 –
Yes/Always & Usually)
Segments
Age
0-4 (B)
Age
5-8 (C)
Age
9-13 (D)
Age 14 or
Older (E)
High School
Graduate or
Less (F)
Some
College or
More (G)
8Health Promotion and Education
Base=Those able to rate based on experience
40Coordination of Care
Base=Those able to rate based on experience
Each segment is assigned a unique letter indicated in the column header. Significant differences at the 95% confidence level are shown through the use of these letters. A percentage that is significantly higher will have the lower percentage’s letter next
to it.
1Summary Rates most often represent the most favorable responses for that question and are defined by the HEDIS 2013 CAHPS® 5.0H guidelines.
68% 64%72%C 71% 66% 71%
0%
100%
(n=305) (n=246) (n=343) (n=284) (n=599) (n=606)
85%E 74%87%CE
73% 79% 82%
0%
100%
(n=99) (n=84) (n=132) (n=98) (n=189) (n=233)
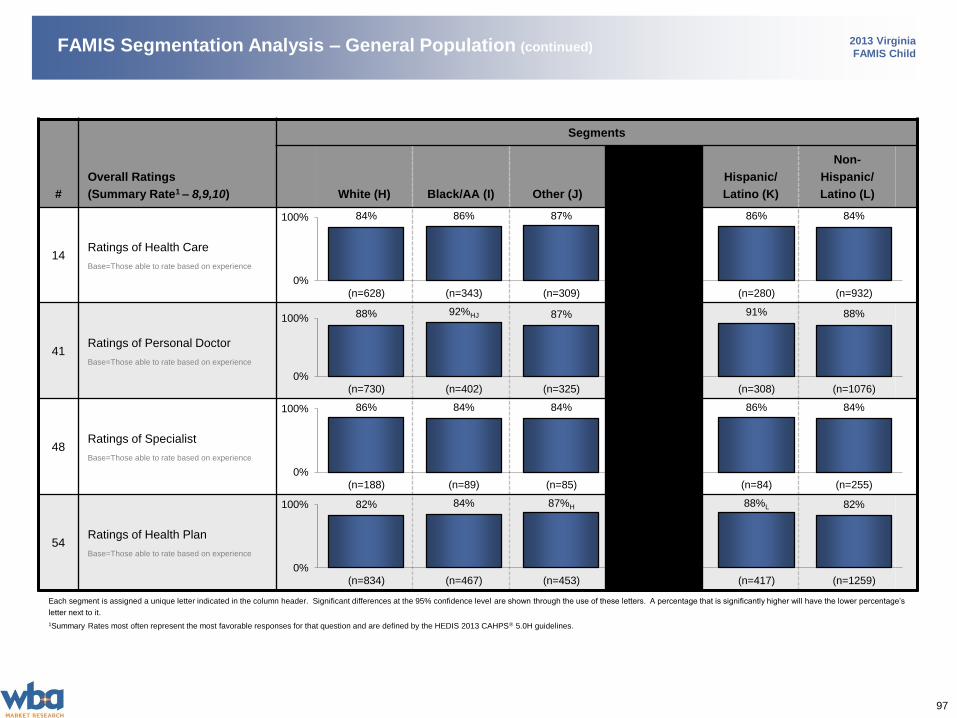
97
2013 Virginia
FAMIS ChildFAMIS Segmentation Analysis – General Population (continued)
#
Overall Ratings
(Summary Rate1 – 8,9,10)
Segments
White (H) Black/AA (I) Other (J)
Hispanic/
Latino (K)
Non-
Hispanic/
Latino (L)
14Ratings of Health Care
Base=Those able to rate based on experience
41Ratings of Personal Doctor
Base=Those able to rate based on experience
48Ratings of Specialist
Base=Those able to rate based on experience
54Ratings of Health Plan
Base=Those able to rate based on experience
Each segment is assigned a unique letter indicated in the column header. Significant differences at the 95% confidence level are shown through the use of these letters. A percentage that is significantly higher will have the lower percentage’s
letter next to it.
1Summary Rates most often represent the most favorable responses for that question and are defined by the HEDIS 2013 CAHPS® 5.0H guidelines.
84% 86% 87% 86% 84%
0%
100%
(n=628) (n=343) (n=309) (n=280) (n=932)
88% 92%HJ 87% 91% 88%
0%
100%
(n=730) (n=402) (n=325) (n=308) (n=1076)
86% 84% 84% 86% 84%
0%
100%
(n=188) (n=89) (n=85) (n=84) (n=255)
82% 84% 87%H 88%L 82%
0%
100%
(n=834) (n=467) (n=453) (n=417) (n=1259)
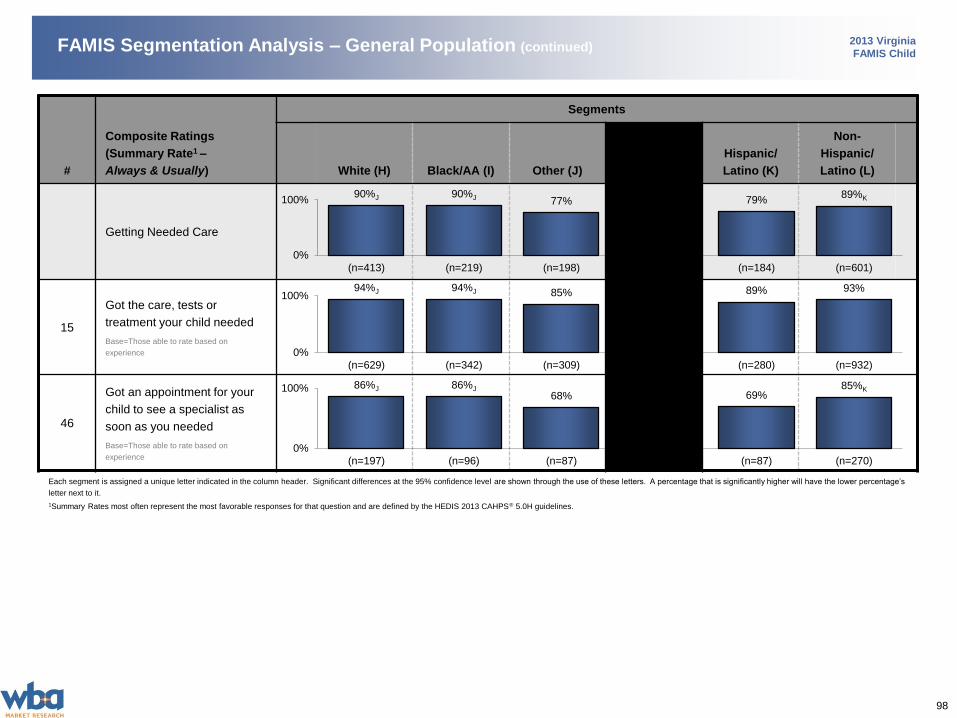
98
2013 Virginia
FAMIS ChildFAMIS Segmentation Analysis – General Population (continued)
#
Composite Ratings
(Summary Rate1 –
Always & Usually)
Segments
White (H) Black/AA (I) Other (J)
Hispanic/
Latino (K)
Non-
Hispanic/
Latino (L)
Getting Needed Care
15
Got the care, tests or
treatment your child needed
Base=Those able to rate based on
experience
46
Got an appointment for your
child to see a specialist as
soon as you needed
Base=Those able to rate based on
experience
Each segment is assigned a unique letter indicated in the column header. Significant differences at the 95% confidence level are shown through the use of these letters. A percentage that is significantly higher will have the lower percentage’s
letter next to it.
1Summary Rates most often represent the most favorable responses for that question and are defined by the HEDIS 2013 CAHPS® 5.0H guidelines.
90%J 90%J 77% 79%89%K
0%
100%
(n=413) (n=219) (n=198) (n=184) (n=601)
94%J 94%J 85% 89% 93%
0%
100%
(n=629) (n=342) (n=309) (n=280) (n=932)
86%J 86%J
68% 69%85%K
0%
100%
(n=197) (n=96) (n=87) (n=87) (n=270)
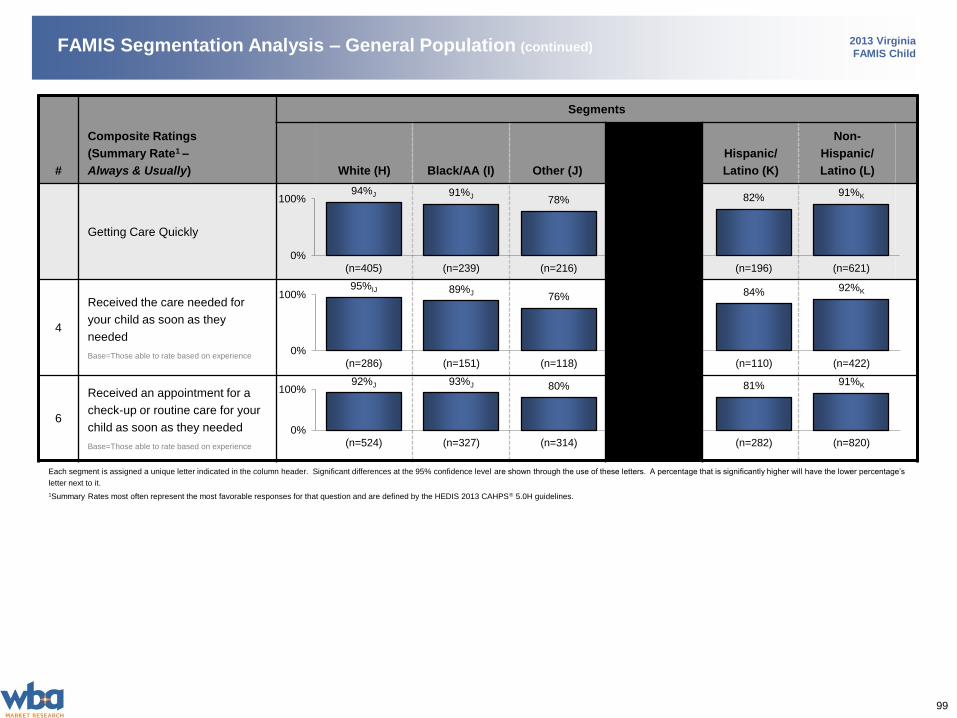
99
2013 Virginia
FAMIS ChildFAMIS Segmentation Analysis – General Population (continued)
#
Composite Ratings
(Summary Rate1 –
Always & Usually)
Segments
White (H) Black/AA (I) Other (J)
Hispanic/
Latino (K)
Non-
Hispanic/
Latino (L)
Getting Care Quickly
4
Received the care needed for
your child as soon as they
needed
Base=Those able to rate based on experience
6
Received an appointment for a
check-up or routine care for your
child as soon as they needed
Base=Those able to rate based on experience
Each segment is assigned a unique letter indicated in the column header. Significant differences at the 95% confidence level are shown through the use of these letters. A percentage that is significantly higher will have the lower percentage’s
letter next to it.
1Summary Rates most often represent the most favorable responses for that question and are defined by the HEDIS 2013 CAHPS® 5.0H guidelines.
94%J 91%J 78% 82%91%K
0%
100%
(n=405) (n=239) (n=216) (n=196) (n=621)
95%IJ 89%J 76% 84% 92%K
0%
100%
(n=286) (n=151) (n=118) (n=110) (n=422)
92%J 93%J 80% 81% 91%K
0%
100%
(n=524) (n=327) (n=314) (n=282) (n=820)
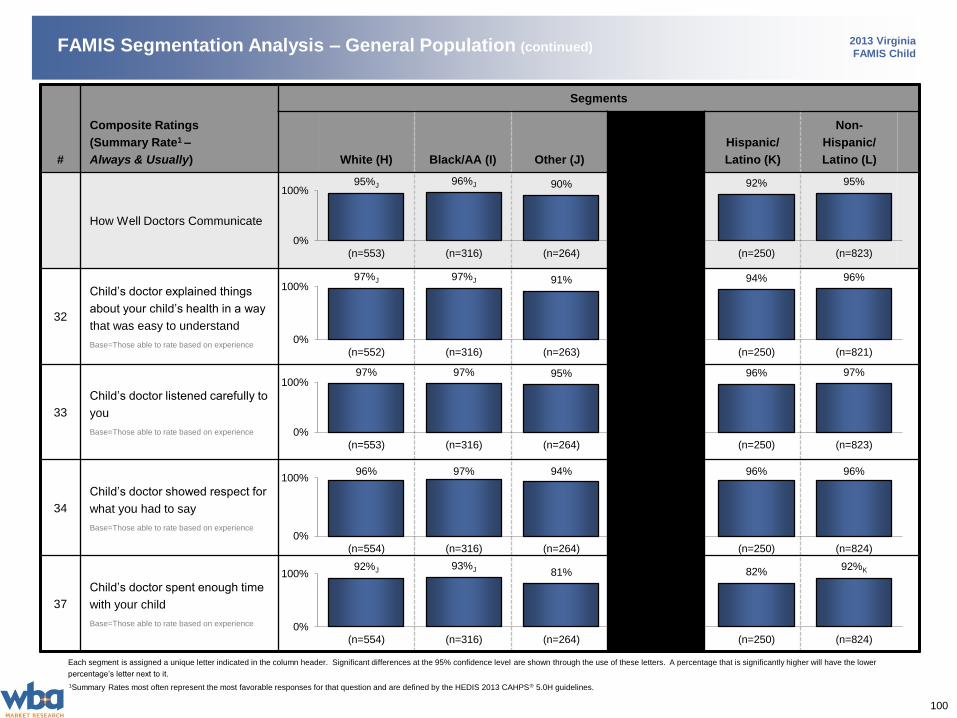
100
2013 Virginia
FAMIS ChildFAMIS Segmentation Analysis – General Population (continued)
#
Composite Ratings
(Summary Rate1 –
Always & Usually)
Segments
White (H) Black/AA (I) Other (J)
Hispanic/
Latino (K)
Non-
Hispanic/
Latino (L)
How Well Doctors Communicate
32
Child’s doctor explained things
about your child’s health in a way
that was easy to understand
Base=Those able to rate based on experience
33
Child’s doctor listened carefully to
you
Base=Those able to rate based on experience
34
Child’s doctor showed respect for
what you had to say
Base=Those able to rate based on experience
37
Child’s doctor spent enough time
with your child
Base=Those able to rate based on experience
Each segment is assigned a unique letter indicated in the column header. Significant differences at the 95% confidence level are shown through the use of these letters. A percentage that is significantly higher will have the lower
percentage’s letter next to it.
1Summary Rates most often represent the most favorable responses for that question and are defined by the HEDIS 2013 CAHPS® 5.0H guidelines.
95%J 96%J 90% 92% 95%
0%
100%
(n=553) (n=316) (n=264) (n=250) (n=823)
97%J 97%J 91% 94% 96%
0%
100%
(n=552) (n=316) (n=263) (n=250) (n=821)
97% 97% 95% 96% 97%
0%
100%
(n=553) (n=316) (n=264) (n=250) (n=823)
96% 97% 94% 96% 96%
0%
100%
(n=554) (n=316) (n=264) (n=250) (n=824)
92%J 93%J 81% 82%92%K
0%
100%
(n=554) (n=316) (n=264) (n=250) (n=824)
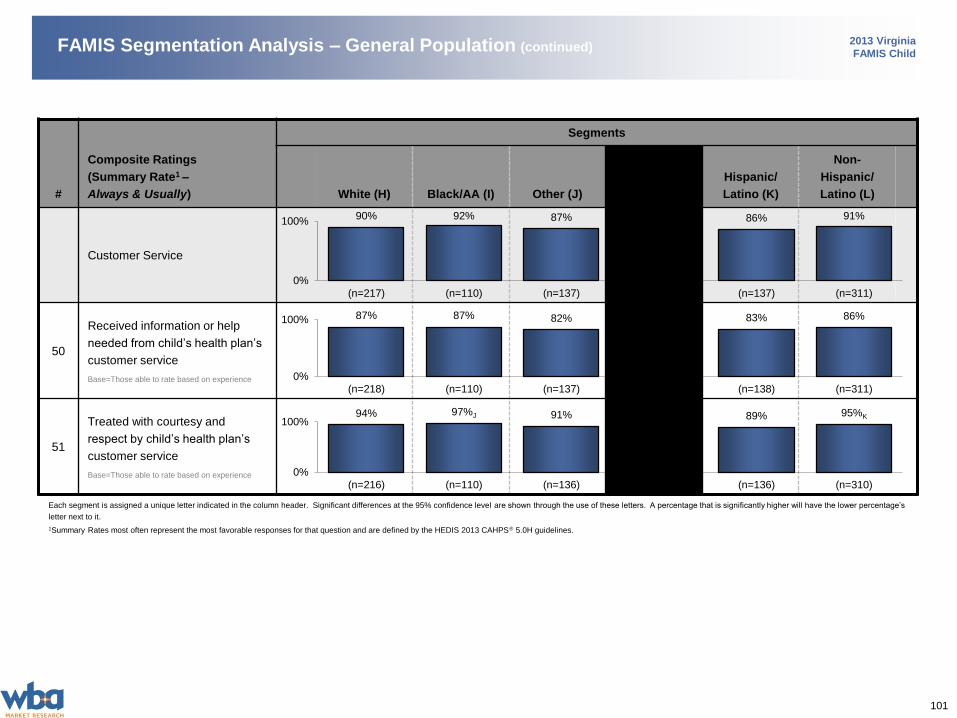
101
2013 Virginia
FAMIS ChildFAMIS Segmentation Analysis – General Population (continued)
#
Composite Ratings
(Summary Rate1 –
Always & Usually)
Segments
White (H) Black/AA (I) Other (J)
Hispanic/
Latino (K)
Non-
Hispanic/
Latino (L)
Customer Service
50
Received information or help
needed from child’s health plan’s
customer service
Base=Those able to rate based on experience
51
Treated with courtesy and
respect by child’s health plan’s
customer service
Base=Those able to rate based on experience
Each segment is assigned a unique letter indicated in the column header. Significant differences at the 95% confidence level are shown through the use of these letters. A percentage that is significantly higher will have the lower percentage’s
letter next to it.
1Summary Rates most often represent the most favorable responses for that question and are defined by the HEDIS 2013 CAHPS® 5.0H guidelines.
90% 92% 87% 86% 91%
0%
100%
(n=217) (n=110) (n=137) (n=137) (n=311)
87% 87% 82% 83% 86%
0%
100%
(n=218) (n=110) (n=137) (n=138) (n=311)
94% 97%J 91% 89% 95%K
0%
100%
(n=216) (n=110) (n=136) (n=136) (n=310)
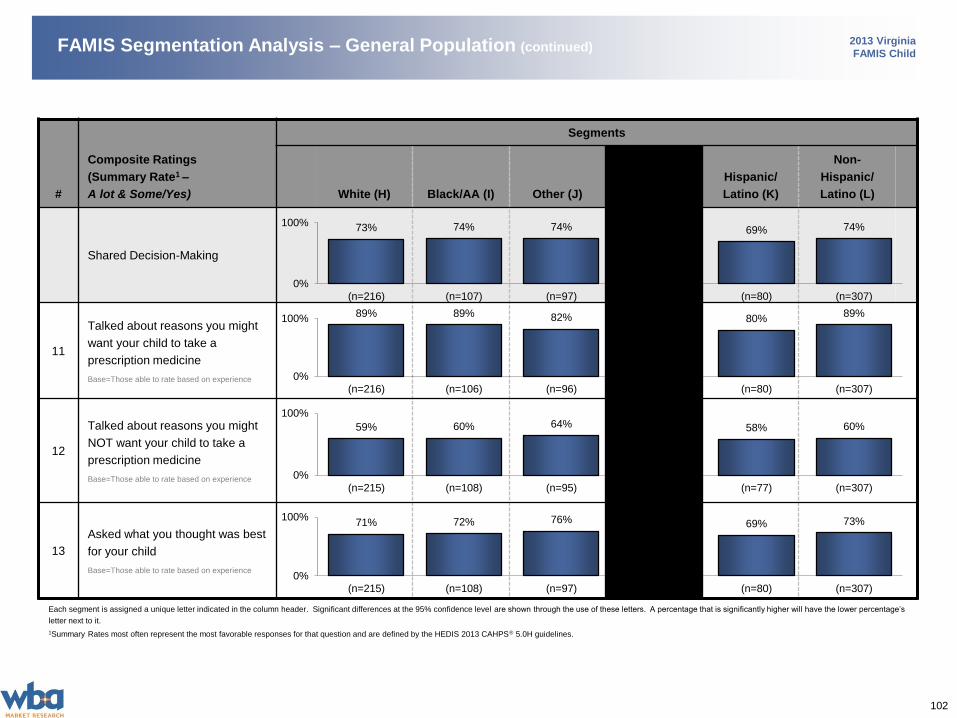
102
2013 Virginia
FAMIS ChildFAMIS Segmentation Analysis – General Population (continued)
#
Composite Ratings
(Summary Rate1 –
A lot & Some/Yes)
Segments
White (H) Black/AA (I) Other (J)
Hispanic/
Latino (K)
Non-
Hispanic/
Latino (L)
Shared Decision-Making
11
Talked about reasons you might
want your child to take a
prescription medicine
Base=Those able to rate based on experience
12
Talked about reasons you might
NOT want your child to take a
prescription medicine
Base=Those able to rate based on experience
13
Asked what you thought was best
for your child
Base=Those able to rate based on experience
Each segment is assigned a unique letter indicated in the column header. Significant differences at the 95% confidence level are shown through the use of these letters. A percentage that is significantly higher will have the lower percentage’s
letter next to it.
1Summary Rates most often represent the most favorable responses for that question and are defined by the HEDIS 2013 CAHPS® 5.0H guidelines.
73% 74% 74% 69% 74%
0%
100%
(n=216) (n=107) (n=97) (n=80) (n=307)
89% 89% 82% 80%89%
0%
100%
(n=216) (n=106) (n=96) (n=80) (n=307)
59% 60% 64% 58% 60%
0%
100%
(n=215) (n=108) (n=95) (n=77) (n=307)
71% 72% 76% 69% 73%
0%
100%
(n=215) (n=108) (n=97) (n=80) (n=307)
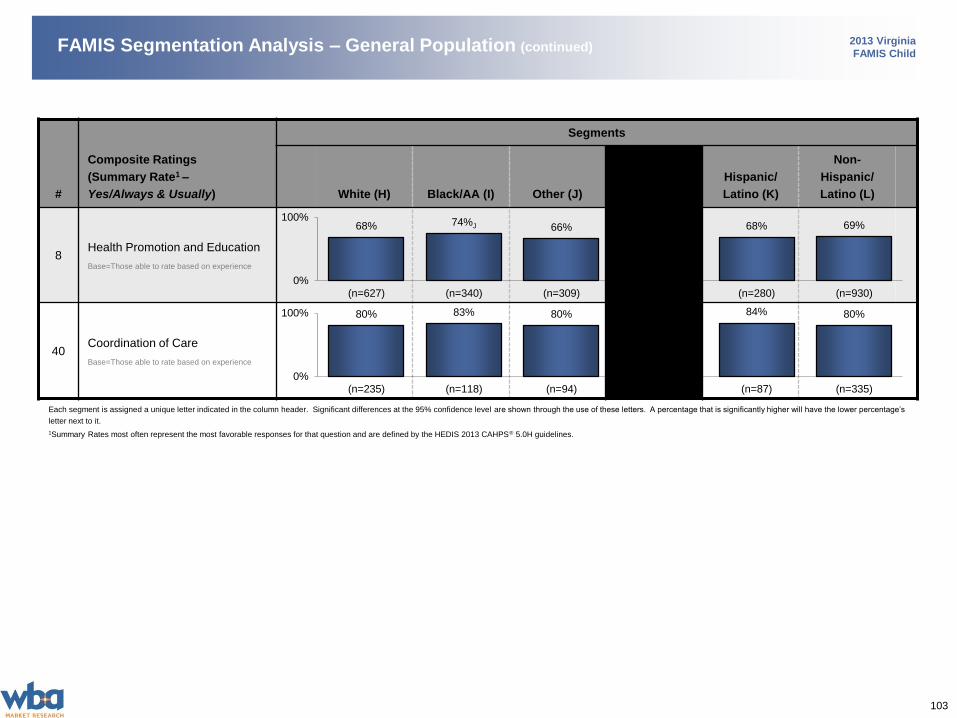
103
2013 Virginia
FAMIS ChildFAMIS Segmentation Analysis – General Population (continued)
#
Composite Ratings
(Summary Rate1 –
Yes/Always & Usually)
Segments
White (H) Black/AA (I) Other (J)
Hispanic/
Latino (K)
Non-
Hispanic/
Latino (L)
8Health Promotion and Education
Base=Those able to rate based on experience
40Coordination of Care
Base=Those able to rate based on experience
Each segment is assigned a unique letter indicated in the column header. Significant differences at the 95% confidence level are shown through the use of these letters. A percentage that is significantly higher will have the lower percentage’s
letter next to it.
1Summary Rates most often represent the most favorable responses for that question and are defined by the HEDIS 2013 CAHPS® 5.0H guidelines.
68% 74%J 66% 68% 69%
0%
100%
(n=627) (n=340) (n=309) (n=280) (n=930)
80% 83% 80% 84% 80%
0%
100%
(n=235) (n=118) (n=94) (n=87) (n=335)
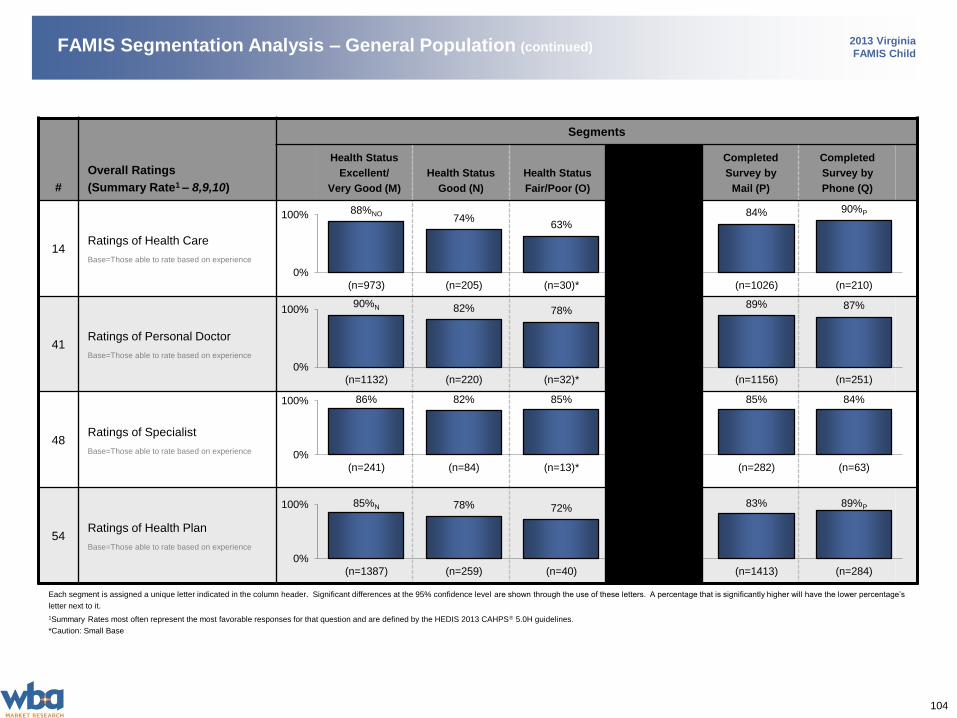
104
2013 Virginia
FAMIS ChildFAMIS Segmentation Analysis – General Population (continued)
#
Overall Ratings
(Summary Rate1 – 8,9,10)
Segments
Health Status
Excellent/
Very Good (M)
Health Status
Good (N)
Health Status
Fair/Poor (O)
Completed
Survey by
Mail (P)
Completed
Survey by
Phone (Q)
14Ratings of Health Care
Base=Those able to rate based on experience
41Ratings of Personal Doctor
Base=Those able to rate based on experience
48Ratings of Specialist
Base=Those able to rate based on experience
54Ratings of Health Plan
Base=Those able to rate based on experience
Each segment is assigned a unique letter indicated in the column header. Significant differences at the 95% confidence level are shown through the use of these letters. A percentage that is significantly higher will have the lower percentage’s
letter next to it.
1Summary Rates most often represent the most favorable responses for that question and are defined by the HEDIS 2013 CAHPS® 5.0H guidelines.
*Caution: Small Base
88%NO74%
63%84% 90%P
0%
100%
(n=973) (n=205) (n=30)* (n=1026) (n=210)
90%N 82% 78%89% 87%
0%
100%
(n=1132) (n=220) (n=32)* (n=1156) (n=251)
86% 82% 85% 85% 84%
0%
100%
(n=241) (n=84) (n=13)* (n=282) (n=63)
85%N 78% 72% 83% 89%P
0%
100%
(n=1387) (n=259) (n=40) (n=1413) (n=284)
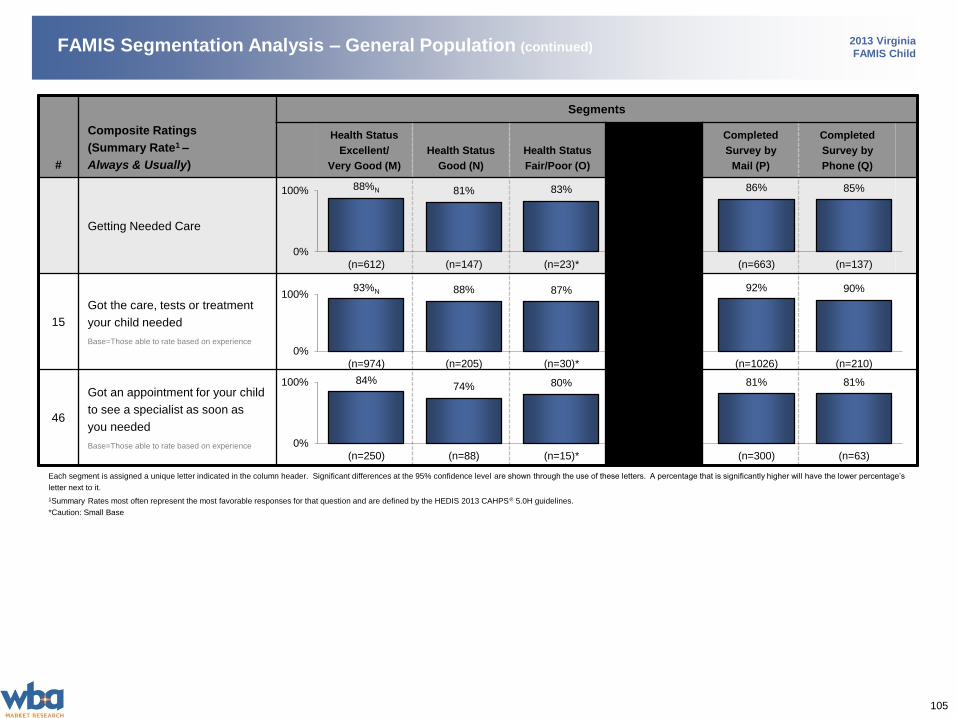
105
2013 Virginia
FAMIS ChildFAMIS Segmentation Analysis – General Population (continued)
#
Composite Ratings
(Summary Rate1 –
Always & Usually)
Segments
Health Status
Excellent/
Very Good (M)
Health Status
Good (N)
Health Status
Fair/Poor (O)
Completed
Survey by
Mail (P)
Completed
Survey by
Phone (Q)
Getting Needed Care
15
Got the care, tests or treatment
your child needed
Base=Those able to rate based on experience
46
Got an appointment for your child
to see a specialist as soon as
you needed
Base=Those able to rate based on experience
Each segment is assigned a unique letter indicated in the column header. Significant differences at the 95% confidence level are shown through the use of these letters. A percentage that is significantly higher will have the lower percentage’s
letter next to it.
1Summary Rates most often represent the most favorable responses for that question and are defined by the HEDIS 2013 CAHPS® 5.0H guidelines.
*Caution: Small Base
88%N 81% 83% 86% 85%
0%
100%
(n=612) (n=147) (n=23)* (n=663) (n=137)
93%N 88% 87% 92% 90%
0%
100%
(n=974) (n=205) (n=30)* (n=1026) (n=210)
84%74% 80% 81% 81%
0%
100%
(n=250) (n=88) (n=15)* (n=300) (n=63)
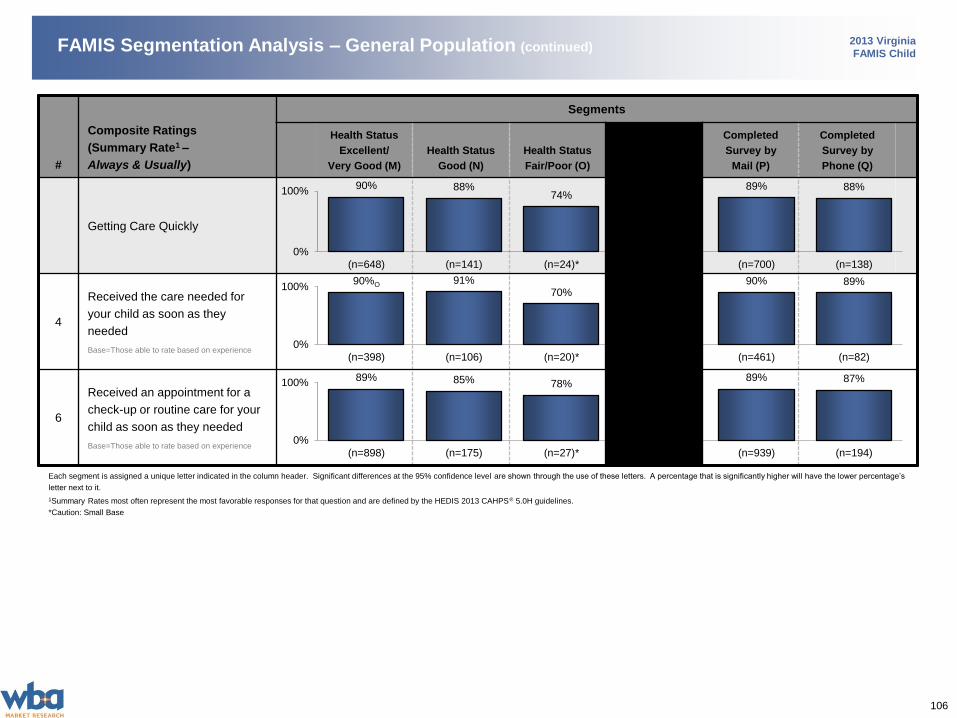
106
2013 Virginia
FAMIS ChildFAMIS Segmentation Analysis – General Population (continued)
#
Composite Ratings
(Summary Rate1 –
Always & Usually)
Segments
Health Status
Excellent/
Very Good (M)
Health Status
Good (N)
Health Status
Fair/Poor (O)
Completed
Survey by
Mail (P)
Completed
Survey by
Phone (Q)
Getting Care Quickly
4
Received the care needed for
your child as soon as they
needed
Base=Those able to rate based on experience
6
Received an appointment for a
check-up or routine care for your
child as soon as they needed
Base=Those able to rate based on experience
Each segment is assigned a unique letter indicated in the column header. Significant differences at the 95% confidence level are shown through the use of these letters. A percentage that is significantly higher will have the lower percentage’s
letter next to it.
1Summary Rates most often represent the most favorable responses for that question and are defined by the HEDIS 2013 CAHPS® 5.0H guidelines.
*Caution: Small Base
90% 88%74%
89% 88%
0%
100%
(n=648) (n=141) (n=24)* (n=700) (n=138)
90%O 91%70%
90% 89%
0%
100%
(n=398) (n=106) (n=20)* (n=461) (n=82)
89% 85% 78%89% 87%
0%
100%
(n=898) (n=175) (n=27)* (n=939) (n=194)
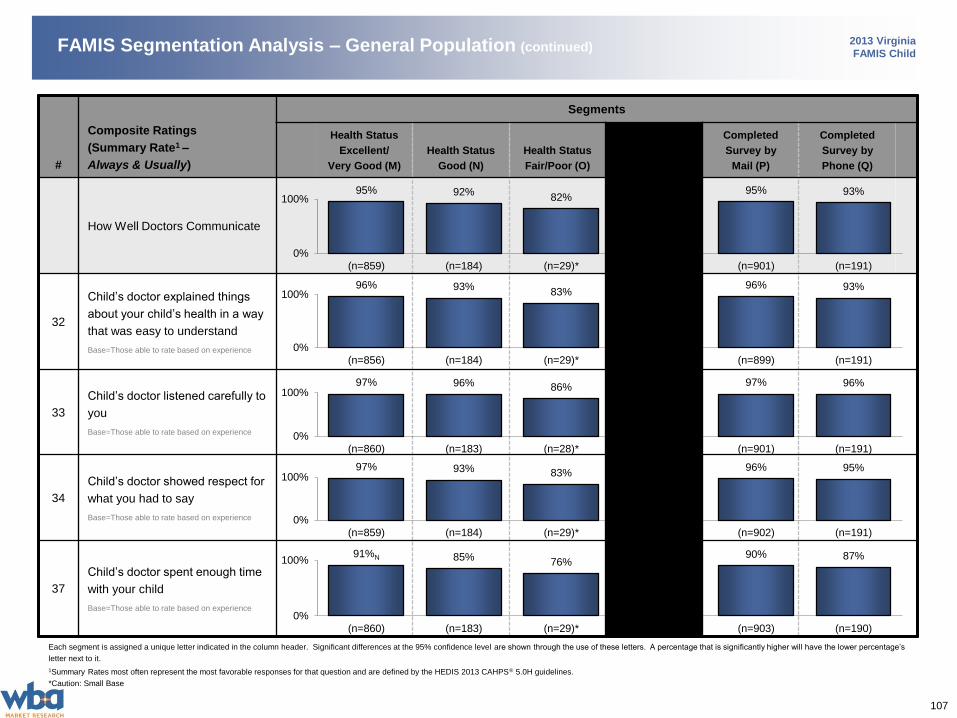
107
2013 Virginia
FAMIS ChildFAMIS Segmentation Analysis – General Population (continued)
#
Composite Ratings
(Summary Rate1 –
Always & Usually)
Segments
Health Status
Excellent/
Very Good (M)
Health Status
Good (N)
Health Status
Fair/Poor (O)
Completed
Survey by
Mail (P)
Completed
Survey by
Phone (Q)
How Well Doctors Communicate
32
Child’s doctor explained things
about your child’s health in a way
that was easy to understand
Base=Those able to rate based on experience
33
Child’s doctor listened carefully to
you
Base=Those able to rate based on experience
34
Child’s doctor showed respect for
what you had to say
Base=Those able to rate based on experience
37
Child’s doctor spent enough time
with your child
Base=Those able to rate based on experience
Each segment is assigned a unique letter indicated in the column header. Significant differences at the 95% confidence level are shown through the use of these letters. A percentage that is significantly higher will have the lower percentage’s
letter next to it.
1Summary Rates most often represent the most favorable responses for that question and are defined by the HEDIS 2013 CAHPS® 5.0H guidelines.
*Caution: Small Base
95% 92%82%
95% 93%
0%
100%
(n=859) (n=184) (n=29)* (n=901) (n=191)
96% 93%83%
96% 93%
0%
100%
(n=856) (n=184) (n=29)* (n=899) (n=191)
97% 96% 86% 97% 96%
0%
100%
(n=860) (n=183) (n=28)* (n=901) (n=191)
97% 93% 83%96% 95%
0%
100%
(n=859) (n=184) (n=29)* (n=902) (n=191)
91%N 85% 76%90% 87%
0%
100%
(n=860) (n=183) (n=29)* (n=903) (n=190)
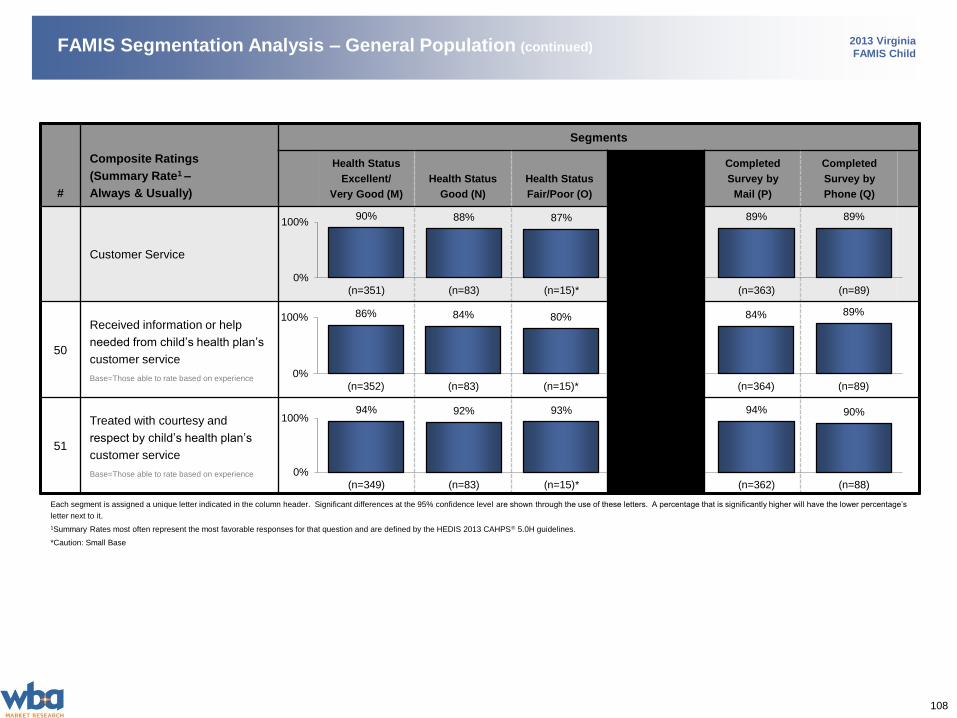
108
2013 Virginia
FAMIS ChildFAMIS Segmentation Analysis – General Population (continued)
#
Composite Ratings
(Summary Rate1 –
Always & Usually)
Segments
Health Status
Excellent/
Very Good (M)
Health Status
Good (N)
Health Status
Fair/Poor (O)
Completed
Survey by
Mail (P)
Completed
Survey by
Phone (Q)
Customer Service
50
Received information or help
needed from child’s health plan’s
customer service
Base=Those able to rate based on experience
51
Treated with courtesy and
respect by child’s health plan’s
customer service
Base=Those able to rate based on experience
Each segment is assigned a unique letter indicated in the column header. Significant differences at the 95% confidence level are shown through the use of these letters. A percentage that is significantly higher will have the lower percentage’s
letter next to it.
1Summary Rates most often represent the most favorable responses for that question and are defined by the HEDIS 2013 CAHPS® 5.0H guidelines.
*Caution: Small Base
90% 88% 87% 89% 89%
0%
100%
(n=351) (n=83) (n=15)* (n=363) (n=89)
86% 84% 80% 84% 89%
0%
100%
(n=352) (n=83) (n=15)* (n=364) (n=89)
94% 92% 93% 94% 90%
0%
100%
(n=349) (n=83) (n=15)* (n=362) (n=88)
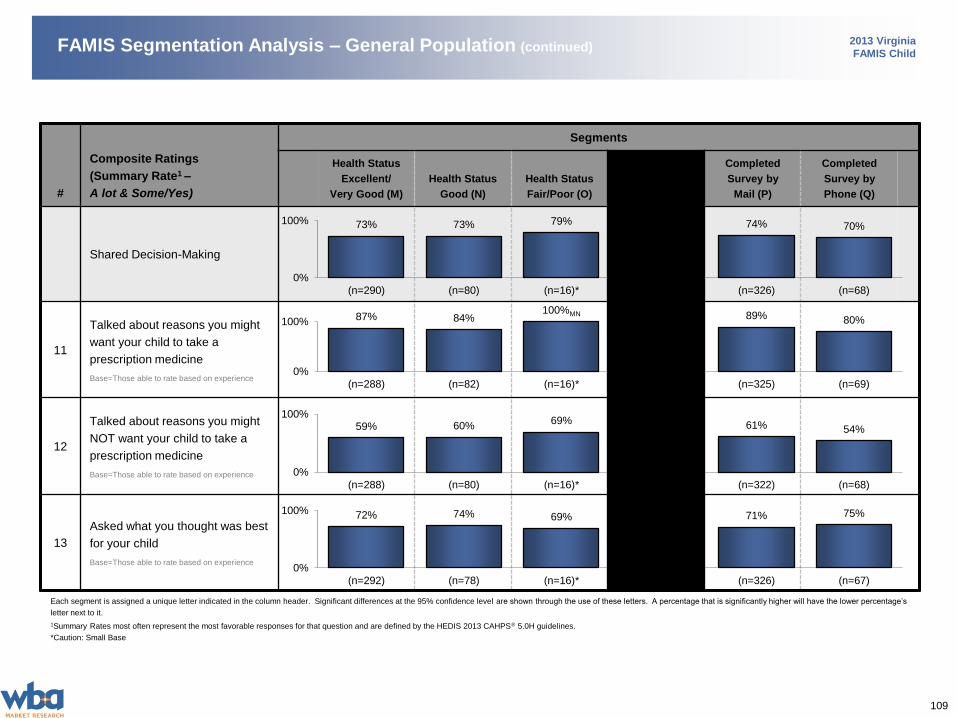
109
2013 Virginia
FAMIS ChildFAMIS Segmentation Analysis – General Population (continued)
#
Composite Ratings
(Summary Rate1 –
A lot & Some/Yes)
Segments
Health Status
Excellent/
Very Good (M)
Health Status
Good (N)
Health Status
Fair/Poor (O)
Completed
Survey by
Mail (P)
Completed
Survey by
Phone (Q)
Shared Decision-Making
11
Talked about reasons you might
want your child to take a
prescription medicine
Base=Those able to rate based on experience
12
Talked about reasons you might
NOT want your child to take a
prescription medicine
Base=Those able to rate based on experience
13
Asked what you thought was best
for your child
Base=Those able to rate based on experience
Each segment is assigned a unique letter indicated in the column header. Significant differences at the 95% confidence level are shown through the use of these letters. A percentage that is significantly higher will have the lower percentage’s
letter next to it.
1Summary Rates most often represent the most favorable responses for that question and are defined by the HEDIS 2013 CAHPS® 5.0H guidelines.
*Caution: Small Base
73% 73% 79% 74% 70%
0%
100%
(n=290) (n=80) (n=16)* (n=326) (n=68)
87% 84%100%MN 89% 80%
0%
100%
(n=288) (n=82) (n=16)* (n=325) (n=69)
59% 60%69% 61% 54%
0%
100%
(n=288) (n=80) (n=16)* (n=322) (n=68)
72% 74% 69% 71% 75%
0%
100%
(n=292) (n=78) (n=16)* (n=326) (n=67)
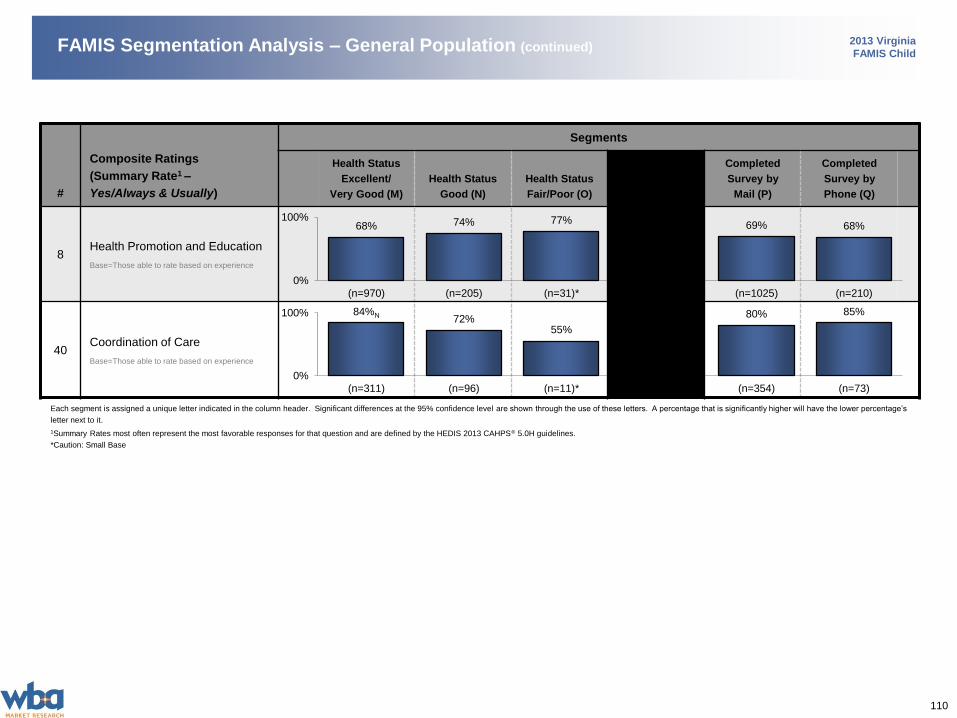
110
2013 Virginia
FAMIS ChildFAMIS Segmentation Analysis – General Population (continued)
#
Composite Ratings
(Summary Rate1 –
Yes/Always & Usually)
Segments
Health Status
Excellent/
Very Good (M)
Health Status
Good (N)
Health Status
Fair/Poor (O)
Completed
Survey by
Mail (P)
Completed
Survey by
Phone (Q)
8Health Promotion and Education
Base=Those able to rate based on experience
40Coordination of Care
Base=Those able to rate based on experience
Each segment is assigned a unique letter indicated in the column header. Significant differences at the 95% confidence level are shown through the use of these letters. A percentage that is significantly higher will have the lower percentage’s
letter next to it.
1Summary Rates most often represent the most favorable responses for that question and are defined by the HEDIS 2013 CAHPS® 5.0H guidelines.
*Caution: Small Base
68% 74% 77%69% 68%
0%
100%
(n=970) (n=205) (n=31)* (n=1025) (n=210)
84%N 72%55%
80% 85%
0%
100%
(n=311) (n=96) (n=11)* (n=354) (n=73)
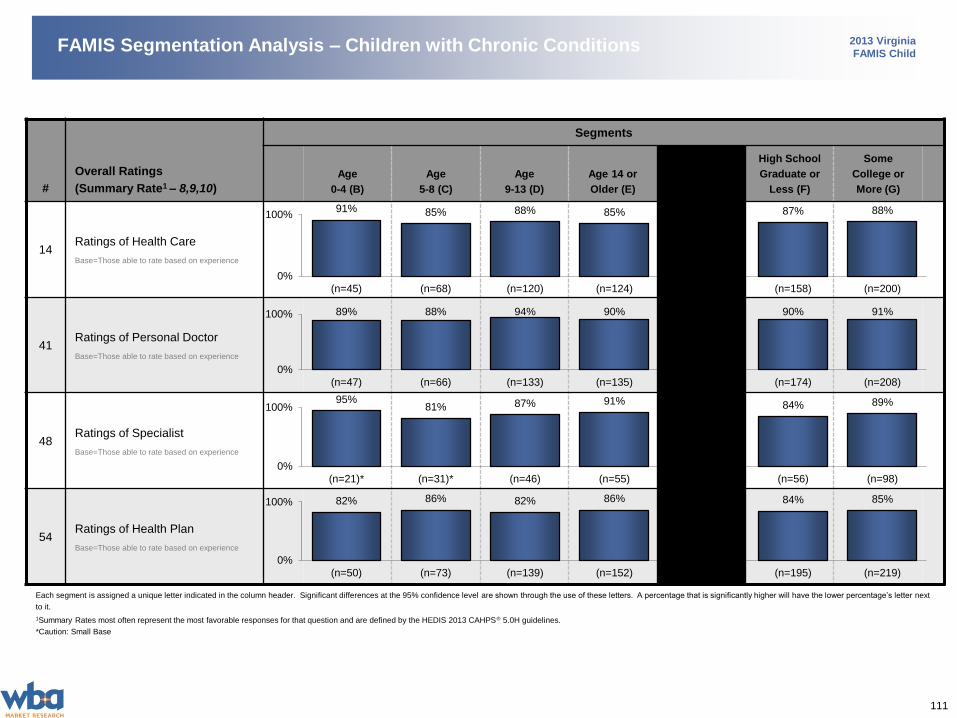
111
2013 Virginia
FAMIS ChildFAMIS Segmentation Analysis – Children with Chronic Conditions
#
Overall Ratings
(Summary Rate1 – 8,9,10)
Segments
Age
0-4 (B)
Age
5-8 (C)
Age
9-13 (D)
Age 14 or
Older (E)
High School
Graduate or
Less (F)
Some
College or
More (G)
14Ratings of Health Care
Base=Those able to rate based on experience
41Ratings of Personal Doctor
Base=Those able to rate based on experience
48Ratings of Specialist
Base=Those able to rate based on experience
54Ratings of Health Plan
Base=Those able to rate based on experience
Each segment is assigned a unique letter indicated in the column header. Significant differences at the 95% confidence level are shown through the use of these letters. A percentage that is significantly higher will have the lower percentage’s letter next
to it.
1Summary Rates most often represent the most favorable responses for that question and are defined by the HEDIS 2013 CAHPS® 5.0H guidelines.
*Caution: Small Base
91% 85% 88% 85% 87% 88%
0%
100%
(n=45) (n=68) (n=120) (n=124) (n=158) (n=200)
89% 88% 94% 90% 90% 91%
0%
100%
(n=47) (n=66) (n=133) (n=135) (n=174) (n=208)
95%81% 87% 91% 84% 89%
0%
100%
(n=21)* (n=31)* (n=46) (n=55) (n=56) (n=98)
82% 86% 82% 86% 84% 85%
0%
100%
(n=50) (n=73) (n=139) (n=152) (n=195) (n=219)

112
2013 Virginia
FAMIS ChildFAMIS Segmentation Analysis – Children with Chronic Conditions (continued)
#
Composite Ratings
(Summary Rate1 –
Always & Usually)
Segments
Age
0-4 (B)
Age
5-8 (C)
Age
9-13 (D)
Age 14 or
Older (E)
High School
Graduate or
Less (F)
Some
College or
More (G)
Getting Needed Care
15
Got the care, tests or treatment
your child needed
Base=Those able to rate based on experience
46
Got an appointment for your child
to see a specialist as soon as
you needed
Base=Those able to rate based on experience
Each segment is assigned a unique letter indicated in the column header. Significant differences at the 95% confidence level are shown through the use of these letters. A percentage that is significantly higher will have the lower percentage’s letter next
to it.
1Summary Rates most often represent the most favorable responses for that question and are defined by the HEDIS 2013 CAHPS® 5.0H guidelines.
*Caution: Small Base
89% 86% 90% 88% 84% 91%
0%
100%
(n=34)* (n=51) (n=84) (n=92) (n=110) (n=151)
91% 93% 97% 92% 94% 93%
0%
100%
(n=45) (n=68) (n=120) (n=125) (n=159) (n=200)
87% 79% 83% 84% 74% 88%F
0%
100%
(n=23)* (n=34)* (n=47) (n=58) (n=61) (n=102)
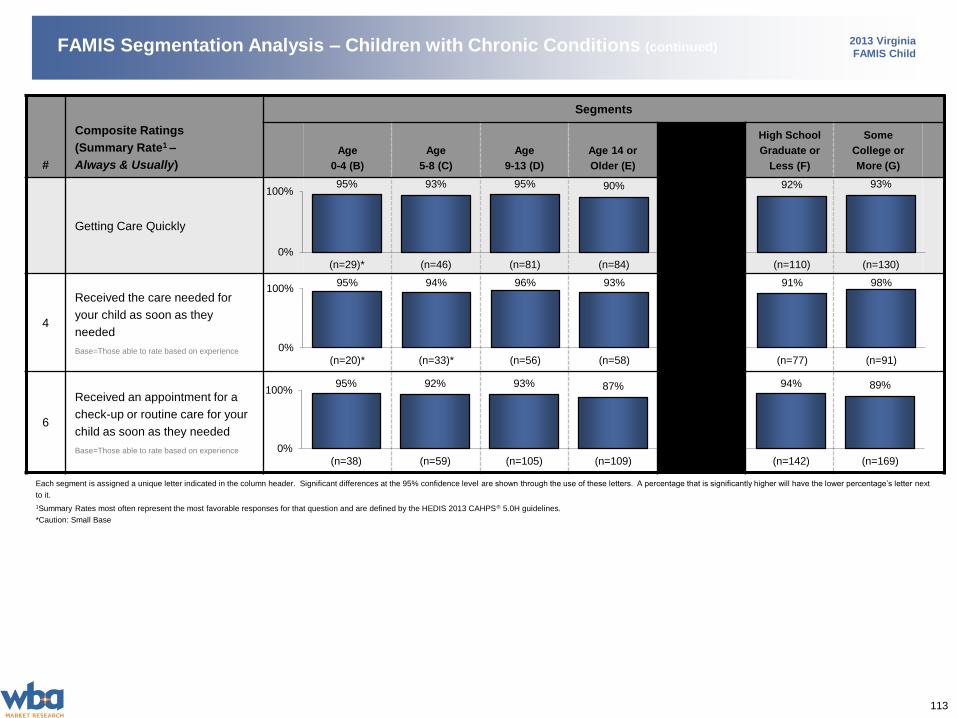
113
2013 Virginia
FAMIS ChildFAMIS Segmentation Analysis – Children with Chronic Conditions (continued)
#
Composite Ratings
(Summary Rate1 –
Always & Usually)
Segments
Age
0-4 (B)
Age
5-8 (C)
Age
9-13 (D)
Age 14 or
Older (E)
High School
Graduate or
Less (F)
Some
College or
More (G)
Getting Care Quickly
4
Received the care needed for
your child as soon as they
needed
Base=Those able to rate based on experience
6
Received an appointment for a
check-up or routine care for your
child as soon as they needed
Base=Those able to rate based on experience
Each segment is assigned a unique letter indicated in the column header. Significant differences at the 95% confidence level are shown through the use of these letters. A percentage that is significantly higher will have the lower percentage’s letter next
to it.
1Summary Rates most often represent the most favorable responses for that question and are defined by the HEDIS 2013 CAHPS® 5.0H guidelines.
*Caution: Small Base
95% 93% 95% 90% 92% 93%
0%
100%
(n=29)* (n=46) (n=81) (n=84) (n=110) (n=130)
95% 94% 96% 93% 91% 98%
0%
100%
(n=20)* (n=33)* (n=56) (n=58) (n=77) (n=91)
95% 92% 93% 87% 94% 89%
0%
100%
(n=38) (n=59) (n=105) (n=109) (n=142) (n=169)
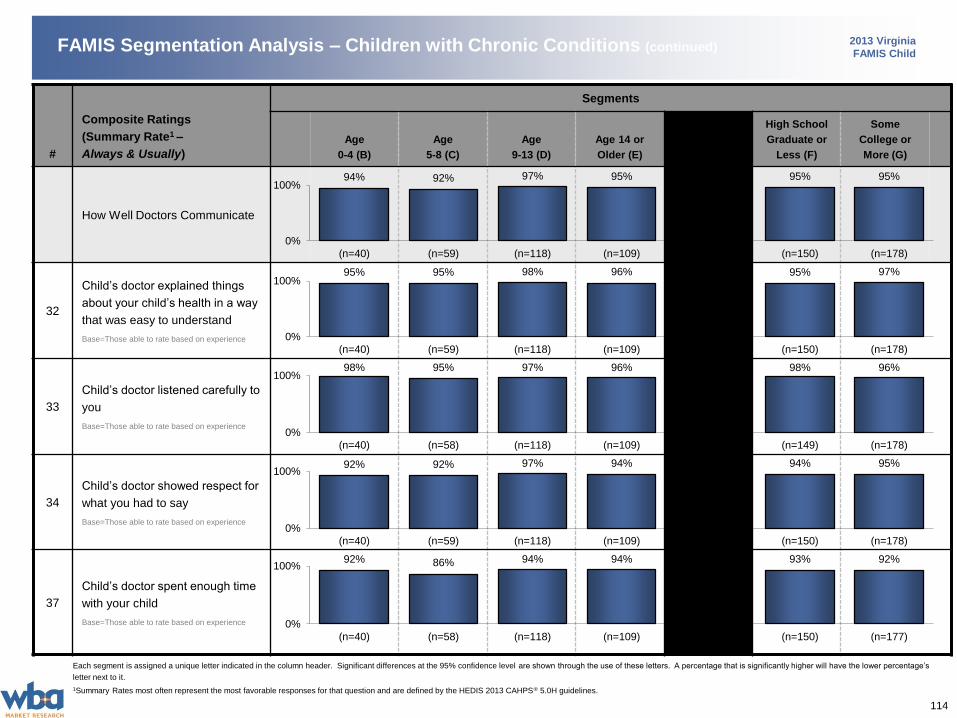
114
2013 Virginia
FAMIS ChildFAMIS Segmentation Analysis – Children with Chronic Conditions (continued)
#
Composite Ratings
(Summary Rate1 –
Always & Usually)
Segments
Age
0-4 (B)
Age
5-8 (C)
Age
9-13 (D)
Age 14 or
Older (E)
High School
Graduate or
Less (F)
Some
College or
More (G)
How Well Doctors Communicate
32
Child’s doctor explained things
about your child’s health in a way
that was easy to understand
Base=Those able to rate based on experience
33
Child’s doctor listened carefully to
you
Base=Those able to rate based on experience
34
Child’s doctor showed respect for
what you had to say
Base=Those able to rate based on experience
37
Child’s doctor spent enough time
with your child
Base=Those able to rate based on experience
Each segment is assigned a unique letter indicated in the column header. Significant differences at the 95% confidence level are shown through the use of these letters. A percentage that is significantly higher will have the lower percentage’s
letter next to it.
1Summary Rates most often represent the most favorable responses for that question and are defined by the HEDIS 2013 CAHPS® 5.0H guidelines.
94% 92% 97% 95% 95% 95%
0%
100%
(n=40) (n=59) (n=118) (n=109) (n=150) (n=178)
95% 95% 98% 96% 95% 97%
0%
100%
(n=40) (n=59) (n=118) (n=109) (n=150) (n=178)
98% 95% 97% 96% 98% 96%
0%
100%
(n=40) (n=58) (n=118) (n=109) (n=149) (n=178)
92% 92% 97% 94% 94% 95%
0%
100%
(n=40) (n=59) (n=118) (n=109) (n=150) (n=178)
92% 86% 94% 94% 93% 92%
0%
100%
(n=40) (n=58) (n=118) (n=109) (n=150) (n=177)

115
2013 Virginia
FAMIS ChildFAMIS Segmentation Analysis – Children with Chronic Conditions (continued)
#
Composite Ratings
(Summary Rate1 –
Always & Usually)
Segments
Age
0-4 (B)
Age
5-8 (C)
Age
9-13 (D)
Age 14 or
Older (E)
High School
Graduate or
Less (F)
Some
College or
More (G)
Customer Service
50
Received information or help
needed from customer service
Base=Those able to rate based on experience
51
Treated with courtesy and
respect by customer service staff
Base=Those able to rate based on experience
Each segment is assigned a unique letter indicated in the column header. Significant differences at the 95% confidence level are shown through the use of these letters. A percentage that is significantly higher will have the lower percentage’s letter next
to it.
1Summary Rates most often represent the most favorable responses for that question and are defined by the HEDIS 2013 CAHPS® 5.0H guidelines.
*Caution: Small Base
73%96% 97% 92% 91% 93%
0%
100%
(n=13)* (n=23)* (n=45) (n=46) (n=60) (n=68)
62%
96%B 93%B 89% 92% 87%
0%
100%
(n=13)* (n=23)* (n=45) (n=46) (n=60) (n=68)
85% 96% 100%BCE 96% 90% 100%F
0%
100%
(n=13)* (n=23)* (n=45) (n=46) (n=60) (n=68)
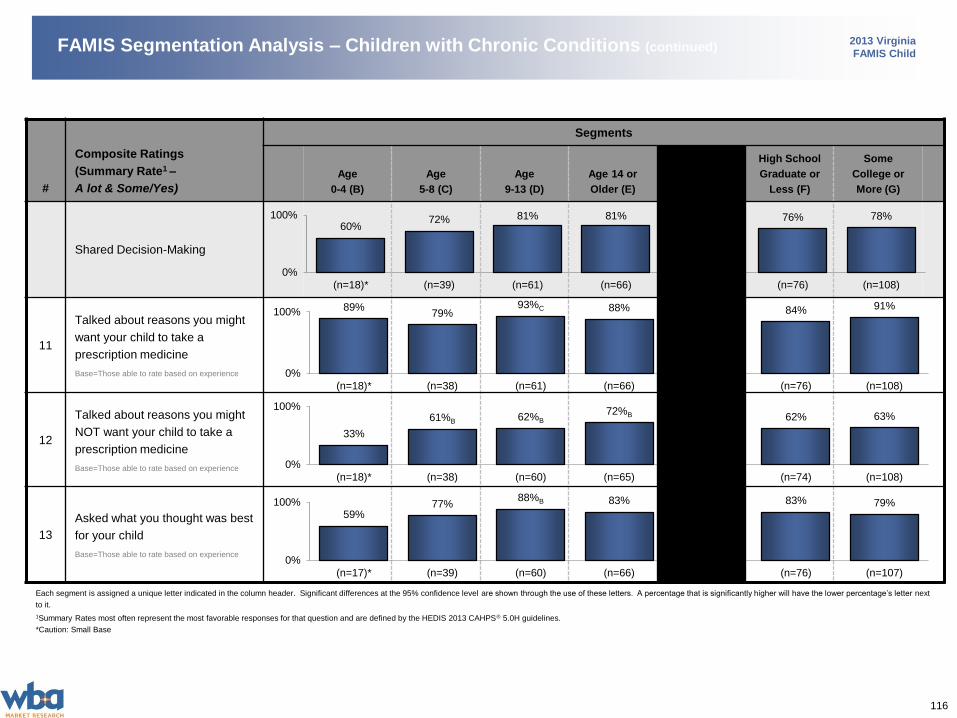
116
2013 Virginia
FAMIS ChildFAMIS Segmentation Analysis – Children with Chronic Conditions (continued)
#
Composite Ratings
(Summary Rate1 –
A lot & Some/Yes)
Segments
Age
0-4 (B)
Age
5-8 (C)
Age
9-13 (D)
Age 14 or
Older (E)
High School
Graduate or
Less (F)
Some
College or
More (G)
Shared Decision-Making
11
Talked about reasons you might
want your child to take a
prescription medicine
Base=Those able to rate based on experience
12
Talked about reasons you might
NOT want your child to take a
prescription medicine
Base=Those able to rate based on experience
13
Asked what you thought was best
for your child
Base=Those able to rate based on experience
Each segment is assigned a unique letter indicated in the column header. Significant differences at the 95% confidence level are shown through the use of these letters. A percentage that is significantly higher will have the lower percentage’s letter next
to it.
1Summary Rates most often represent the most favorable responses for that question and are defined by the HEDIS 2013 CAHPS® 5.0H guidelines.
*Caution: Small Base
60%72% 81% 81% 76% 78%
0%
100%
(n=18)* (n=39) (n=61) (n=66) (n=76) (n=108)
89%79%
93%C 88% 84% 91%
0%
100%
(n=18)* (n=38) (n=61) (n=66) (n=76) (n=108)
33%
61%B 62%B
72%B 62% 63%
0%
100%
(n=18)* (n=38) (n=60) (n=65) (n=74) (n=108)
59%77%
88%B 83% 83% 79%
0%
100%
(n=17)* (n=39) (n=60) (n=66) (n=76) (n=107)
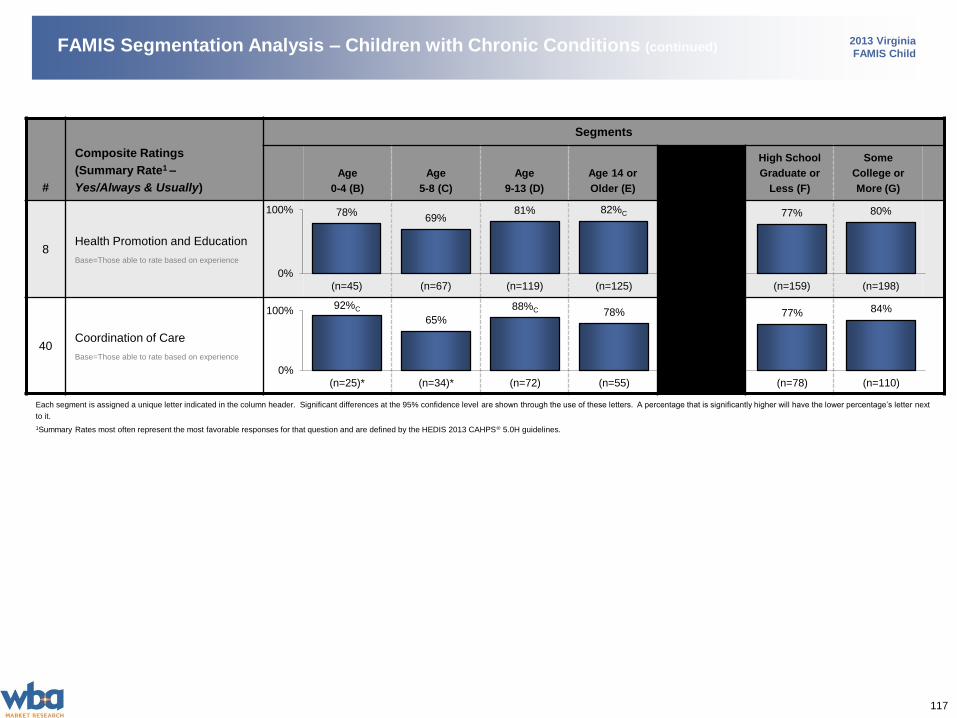
117
2013 Virginia
FAMIS ChildFAMIS Segmentation Analysis – Children with Chronic Conditions (continued)
#
Composite Ratings
(Summary Rate1 –
Yes/Always & Usually)
Segments
Age
0-4 (B)
Age
5-8 (C)
Age
9-13 (D)
Age 14 or
Older (E)
High School
Graduate or
Less (F)
Some
College or
More (G)
8Health Promotion and Education
Base=Those able to rate based on experience
40Coordination of Care
Base=Those able to rate based on experience
Each segment is assigned a unique letter indicated in the column header. Significant differences at the 95% confidence level are shown through the use of these letters. A percentage that is significantly higher will have the lower percentage’s letter next
to it.
1Summary Rates most often represent the most favorable responses for that question and are defined by the HEDIS 2013 CAHPS® 5.0H guidelines.
78%69%
81% 82%C 77% 80%
0%
100%
(n=45) (n=67) (n=119) (n=125) (n=159) (n=198)
92%C
65%
88%C 78% 77% 84%
0%
100%
(n=25)* (n=34)* (n=72) (n=55) (n=78) (n=110)
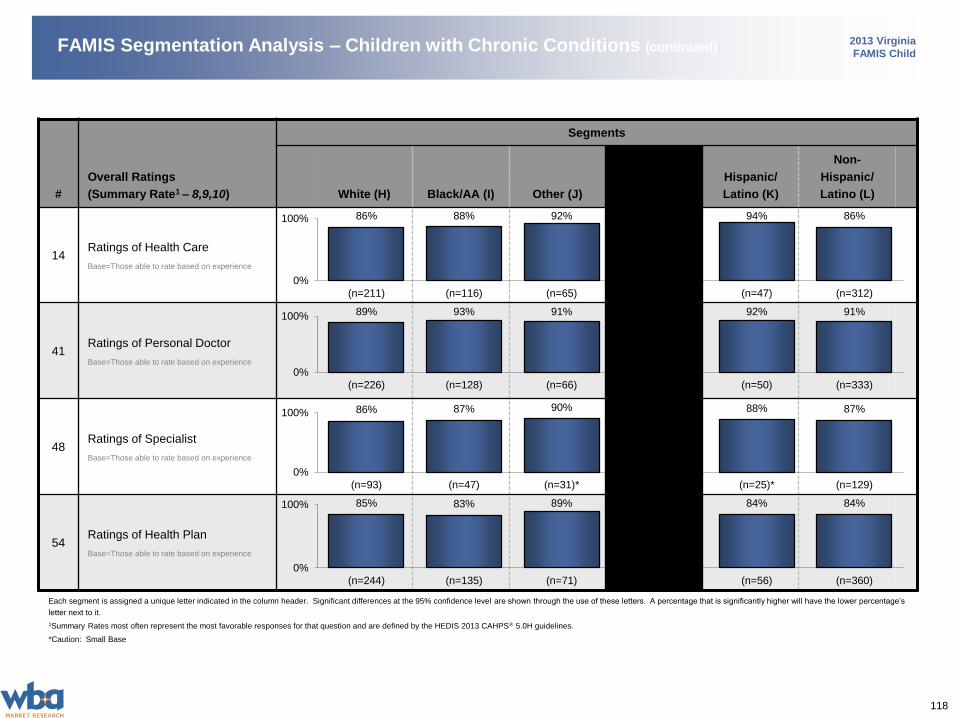
118
2013 Virginia
FAMIS ChildFAMIS Segmentation Analysis – Children with Chronic Conditions (continued)
#
Overall Ratings
(Summary Rate1 – 8,9,10)
Segments
White (H) Black/AA (I) Other (J)
Hispanic/
Latino (K)
Non-
Hispanic/
Latino (L)
14Ratings of Health Care
Base=Those able to rate based on experience
41Ratings of Personal Doctor
Base=Those able to rate based on experience
48Ratings of Specialist
Base=Those able to rate based on experience
54Ratings of Health Plan
Base=Those able to rate based on experience
Each segment is assigned a unique letter indicated in the column header. Significant differences at the 95% confidence level are shown through the use of these letters. A percentage that is significantly higher will have the lower percentage’s
letter next to it.
1Summary Rates most often represent the most favorable responses for that question and are defined by the HEDIS 2013 CAHPS® 5.0H guidelines.
*Caution: Small Base
86% 88% 92% 94% 86%
0%
100%
(n=211) (n=116) (n=65) (n=47) (n=312)
89% 93% 91% 92% 91%
0%
100%
(n=226) (n=128) (n=66) (n=50) (n=333)
86% 87% 90% 88% 87%
0%
100%
(n=93) (n=47) (n=31)* (n=25)* (n=129)
85% 83% 89% 84% 84%
0%
100%
(n=244) (n=135) (n=71) (n=56) (n=360)

119
2013 Virginia
FAMIS ChildFAMIS Segmentation Analysis – Children with Chronic Conditions (continued)
#
Composite Ratings
(Summary Rate1 –
Always & Usually)
Segments
White (H) Black/AA (I) Other (J)
Hispanic/
Latino (K)
Non-
Hispanic/
Latino (L)
Getting Needed Care
15
Got the care, tests or
treatment your child needed
Base=Those able to rate based on
experience
46
Got an appointment for your
child to see a specialist as
soon as you needed
Base=Those able to rate based on
experience
Each segment is assigned a unique letter indicated in the column header. Significant differences at the 95% confidence level are shown through the use of these letters. A percentage that is significantly higher will have the lower percentage’s
letter next to it.
1Summary Rates most often represent the most favorable responses for that question and are defined by the HEDIS 2013 CAHPS® 5.0H guidelines.
*Caution: Small Base
88% 91% 87% 84% 89%
0%
100%
(n=156) (n=83) (n=48) (n=37) (n=225)
94% 97% 89% 92% 94%
0%
100%
(n=212) (n=116) (n=65) (n=48) (n=312)
82% 86% 84% 76% 84%
0%
100%
(n=100) (n=50) (n=31)* (n=25)* (n=138)

120
2013 Virginia
FAMIS ChildFAMIS Segmentation Analysis – Children with Chronic Conditions (continued)
#
Composite Ratings
(Summary Rate1 –
Always & Usually)
Segments
White (H) Black/AA (I) Other (J)
Hispanic/
Latino (K)
Non-
Hispanic/
Latino (L)
Getting Care Quickly
4
Received the care needed for
your child as soon as they
needed
Base=Those able to rate based on experience
6
Received an appointment for a
check-up or routine care for your
child as soon as they needed
Base=Those able to rate based on experience
Each segment is assigned a unique letter indicated in the column header. Significant differences at the 95% confidence level are shown through the use of these letters. A percentage that is significantly higher will have the lower percentage’s
letter next to it.
1Summary Rates most often represent the most favorable responses for that question and are defined by the HEDIS 2013 CAHPS® 5.0H guidelines.
*Caution: Small Base
95% 93% 84% 87% 94%
0%
100%
(n=142) (n=79) (n=41) (n=34)* (n=205)
97% 92% 87% 91% 95%
0%
100%
(n=104) (n=52) (n=23)* (n=23)* (n=144)
93%J 94%J 81% 82%92%
0%
100%
(n=179) (n=106) (n=58) (n=45) (n=266)

121
2013 Virginia
FAMIS ChildFAMIS Segmentation Analysis – Children with Chronic Conditions (continued)
#
Composite Ratings
(Summary Rate1 –
Always & Usually)
Segments
White (H) Black/AA (I) Other (J)
Hispanic/
Latino (K)
Non-
Hispanic/
Latino (L)
How Well Doctors Communicate
32
Child’s doctor explained things
about your child’s health in a way
that was easy to understand
Base=Those able to rate based on experience
33
Child’s doctor listened carefully to
you
Base=Those able to rate based on experience
34
Child’s doctor showed respect for
what you had to say
Base=Those able to rate based on experience
37
Child’s doctor spent enough time
with your child
Base=Those able to rate based on experience
Each segment is assigned a unique letter indicated in the column header. Significant differences at the 95% confidence level are shown through the use of these letters. A percentage that is significantly higher will have the lower
percentage’s letter next to it.1Summary Rates most often represent the most favorable responses for that question and are defined by the HEDIS 2013 CAHPS® 5.0H guidelines.
95% 96% 93% 93% 95%
0%
100%
(n=193) (n=107) (n=60) (n=48) (n=281)
95% 98% 95% 92% 97%
0%
100%
(n=193) (n=107) (n=60) (n=48) (n=281)
96% 97% 95% 96% 97%
0%
100%
(n=192) (n=107) (n=60) (n=48) (n=280)
95% 94% 92% 94% 95%
0%
100%
(n=193) (n=107) (n=60) (n=48) (n=281)
92% 93% 88% 90% 93%
0%
100%
(n=193) (n=106) (n=60) (n=48) (n=280)
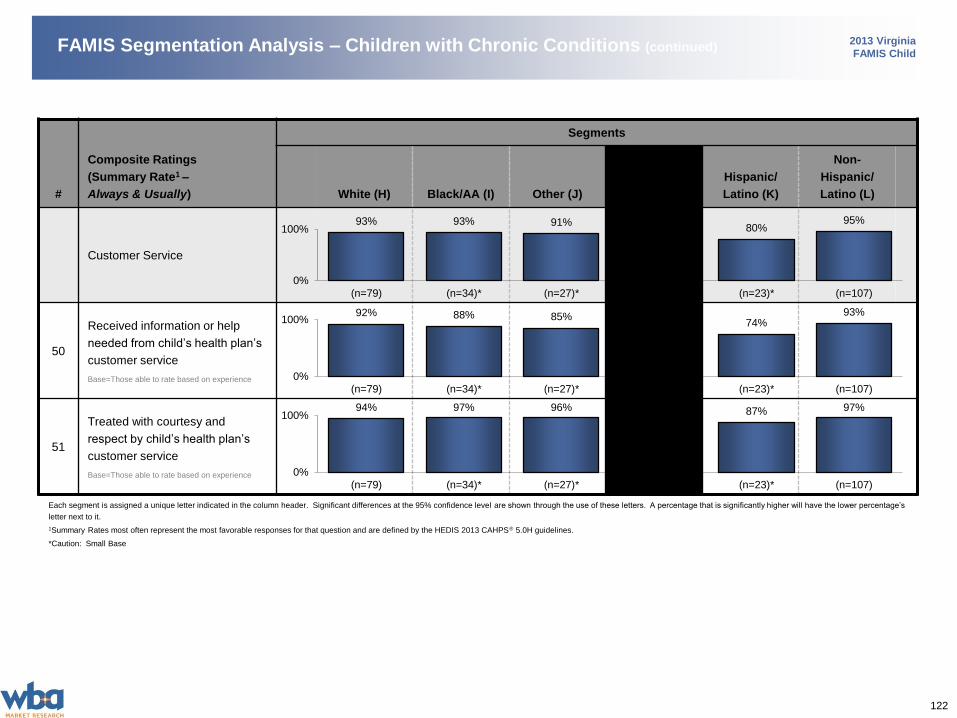
122
2013 Virginia
FAMIS ChildFAMIS Segmentation Analysis – Children with Chronic Conditions (continued)
#
Composite Ratings
(Summary Rate1 –
Always & Usually)
Segments
White (H) Black/AA (I) Other (J)
Hispanic/
Latino (K)
Non-
Hispanic/
Latino (L)
Customer Service
50
Received information or help
needed from child’s health plan’s
customer service
Base=Those able to rate based on experience
51
Treated with courtesy and
respect by child’s health plan’s
customer service
Base=Those able to rate based on experience
Each segment is assigned a unique letter indicated in the column header. Significant differences at the 95% confidence level are shown through the use of these letters. A percentage that is significantly higher will have the lower percentage’s
letter next to it.
1Summary Rates most often represent the most favorable responses for that question and are defined by the HEDIS 2013 CAHPS® 5.0H guidelines.
*Caution: Small Base
93% 93% 91%80%
95%
0%
100%
(n=79) (n=34)* (n=27)* (n=23)* (n=107)
92% 88% 85%74%
93%
0%
100%
(n=79) (n=34)* (n=27)* (n=23)* (n=107)
94% 97% 96% 87% 97%
0%
100%
(n=79) (n=34)* (n=27)* (n=23)* (n=107)
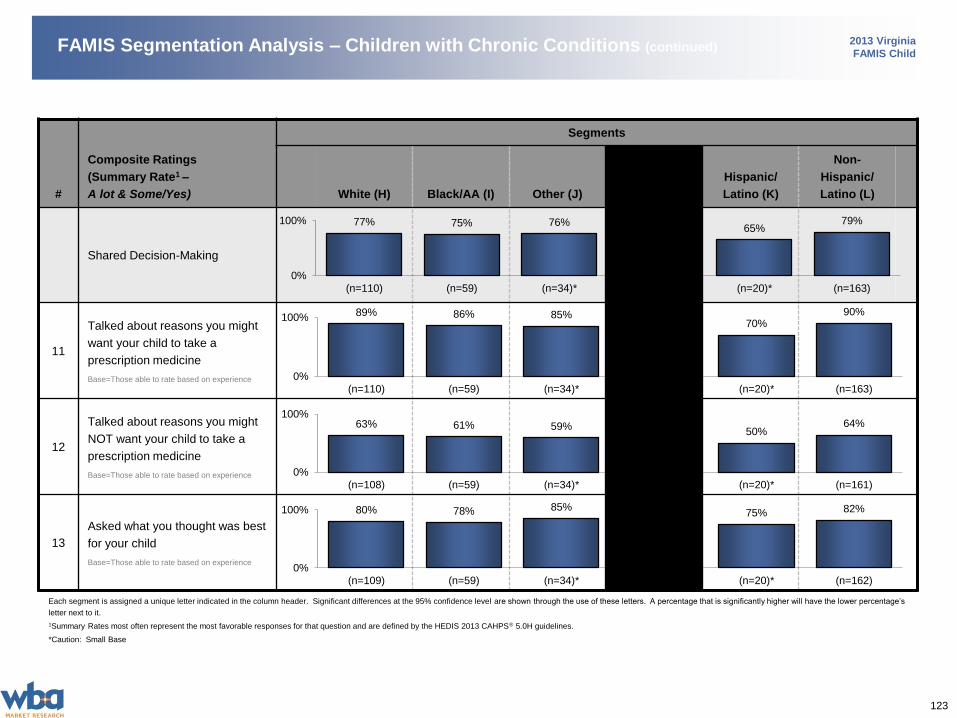
123
2013 Virginia
FAMIS ChildFAMIS Segmentation Analysis – Children with Chronic Conditions (continued)
#
Composite Ratings
(Summary Rate1 –
A lot & Some/Yes)
Segments
White (H) Black/AA (I) Other (J)
Hispanic/
Latino (K)
Non-
Hispanic/
Latino (L)
Shared Decision-Making
11
Talked about reasons you might
want your child to take a
prescription medicine
Base=Those able to rate based on experience
12
Talked about reasons you might
NOT want your child to take a
prescription medicine
Base=Those able to rate based on experience
13
Asked what you thought was best
for your child
Base=Those able to rate based on experience
Each segment is assigned a unique letter indicated in the column header. Significant differences at the 95% confidence level are shown through the use of these letters. A percentage that is significantly higher will have the lower percentage’s
letter next to it.
1Summary Rates most often represent the most favorable responses for that question and are defined by the HEDIS 2013 CAHPS® 5.0H guidelines.
*Caution: Small Base
77% 75% 76%65%
79%
0%
100%
(n=110) (n=59) (n=34)* (n=20)* (n=163)
89% 86% 85%70%
90%
0%
100%
(n=110) (n=59) (n=34)* (n=20)* (n=163)
63% 61% 59%50%
64%
0%
100%
(n=108) (n=59) (n=34)* (n=20)* (n=161)
80% 78% 85%75% 82%
0%
100%
(n=109) (n=59) (n=34)* (n=20)* (n=162)
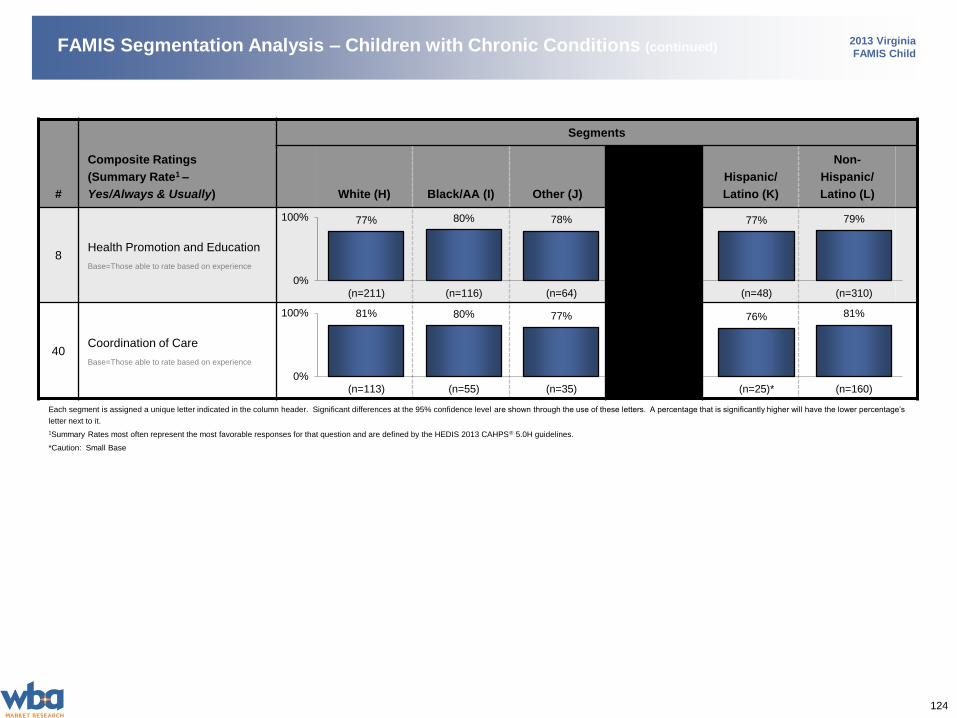
124
2013 Virginia
FAMIS ChildFAMIS Segmentation Analysis – Children with Chronic Conditions (continued)
#
Composite Ratings
(Summary Rate1 –
Yes/Always & Usually)
Segments
White (H) Black/AA (I) Other (J)
Hispanic/
Latino (K)
Non-
Hispanic/
Latino (L)
8Health Promotion and Education
Base=Those able to rate based on experience
40Coordination of Care
Base=Those able to rate based on experience
Each segment is assigned a unique letter indicated in the column header. Significant differences at the 95% confidence level are shown through the use of these letters. A percentage that is significantly higher will have the lower percentage’s
letter next to it.
1Summary Rates most often represent the most favorable responses for that question and are defined by the HEDIS 2013 CAHPS® 5.0H guidelines.
*Caution: Small Base
77% 80% 78% 77% 79%
0%
100%
(n=211) (n=116) (n=64) (n=48) (n=310)
81% 80% 77% 76% 81%
0%
100%
(n=113) (n=55) (n=35) (n=25)* (n=160)
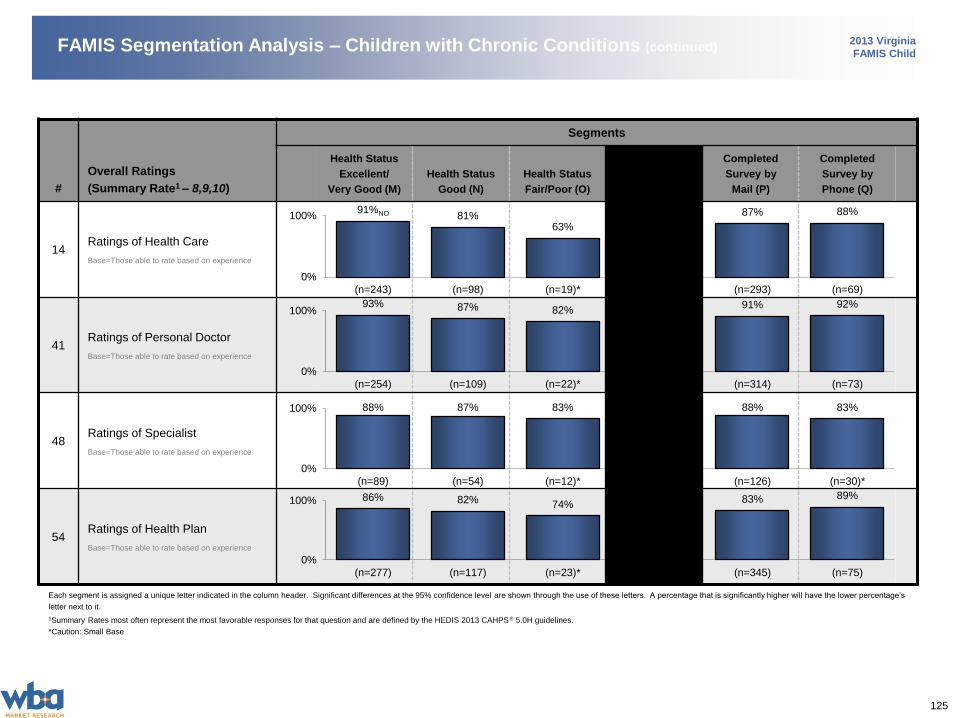
125
2013 Virginia
FAMIS ChildFAMIS Segmentation Analysis – Children with Chronic Conditions (continued)
#
Overall Ratings
(Summary Rate1 – 8,9,10)
Segments
Health Status
Excellent/
Very Good (M)
Health Status
Good (N)
Health Status
Fair/Poor (O)
Completed
Survey by
Mail (P)
Completed
Survey by
Phone (Q)
14Ratings of Health Care
Base=Those able to rate based on experience
41Ratings of Personal Doctor
Base=Those able to rate based on experience
48Ratings of Specialist
Base=Those able to rate based on experience
54Ratings of Health Plan
Base=Those able to rate based on experience
Each segment is assigned a unique letter indicated in the column header. Significant differences at the 95% confidence level are shown through the use of these letters. A percentage that is significantly higher will have the lower percentage’s
letter next to it.
1Summary Rates most often represent the most favorable responses for that question and are defined by the HEDIS 2013 CAHPS® 5.0H guidelines.
*Caution: Small Base
91%NO 81%63%
87% 88%
0%
100%
(n=243) (n=98) (n=19)* (n=293) (n=69)
93% 87% 82%91% 92%
0%
100%
(n=254) (n=109) (n=22)* (n=314) (n=73)
88% 87% 83% 88% 83%
0%
100%
(n=89) (n=54) (n=12)* (n=126) (n=30)*
86% 82% 74%83% 89%
0%
100%
(n=277) (n=117) (n=23)* (n=345) (n=75)

126
2013 Virginia
FAMIS ChildFAMIS Segmentation Analysis – Children with Chronic Conditions (continued)
#
Composite Ratings
(Summary Rate1 –
Always & Usually)
Segments
Health Status
Excellent/
Very Good (M)
Health Status
Good (N)
Health Status
Fair/Poor (O)
Completed
Survey by
Mail (P)
Completed
Survey by
Phone (Q)
Getting Needed Care
15
Got the care, tests or treatment
your child needed
Base=Those able to rate based on experience
46
Got an appointment for your child
to see a specialist as soon as
you needed
Base=Those able to rate based on experience
Each segment is assigned a unique letter indicated in the column header. Significant differences at the 95% confidence level are shown through the use of these letters. A percentage that is significantly higher will have the lower percentage’s
letter next to it.
1Summary Rates most often represent the most favorable responses for that question and are defined by the HEDIS 2013 CAHPS® 5.0H guidelines.
*Caution: Small Base
91% 83% 87% 89% 87%
0%
100%
(n=168) (n=78) (n=17)* (n=215) (n=50)
95% 91% 95% 95% 90%
0%
100%
(n=243) (n=99) (n=19)* (n=294) (n=69)
88%75% 79% 83% 83%
0%
100%
(n=93) (n=57) (n=14)* (n=135) (n=30)*
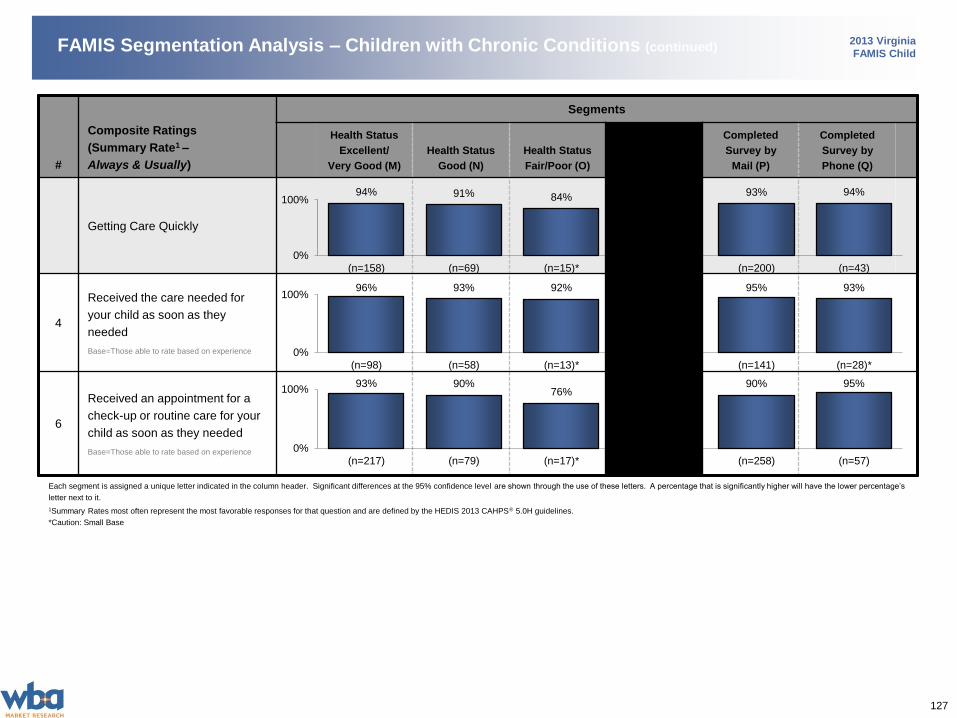
127
2013 Virginia
FAMIS ChildFAMIS Segmentation Analysis – Children with Chronic Conditions (continued)
#
Composite Ratings
(Summary Rate1 –
Always & Usually)
Segments
Health Status
Excellent/
Very Good (M)
Health Status
Good (N)
Health Status
Fair/Poor (O)
Completed
Survey by
Mail (P)
Completed
Survey by
Phone (Q)
Getting Care Quickly
4
Received the care needed for
your child as soon as they
needed
Base=Those able to rate based on experience
6
Received an appointment for a
check-up or routine care for your
child as soon as they needed
Base=Those able to rate based on experience
Each segment is assigned a unique letter indicated in the column header. Significant differences at the 95% confidence level are shown through the use of these letters. A percentage that is significantly higher will have the lower percentage’s
letter next to it.
1Summary Rates most often represent the most favorable responses for that question and are defined by the HEDIS 2013 CAHPS® 5.0H guidelines.
*Caution: Small Base
94% 91% 84% 93% 94%
0%
100%
(n=158) (n=69) (n=15)* (n=200) (n=43)
96% 93% 92% 95% 93%
0%
100%
(n=98) (n=58) (n=13)* (n=141) (n=28)*
93% 90%76%
90% 95%
0%
100%
(n=217) (n=79) (n=17)* (n=258) (n=57)
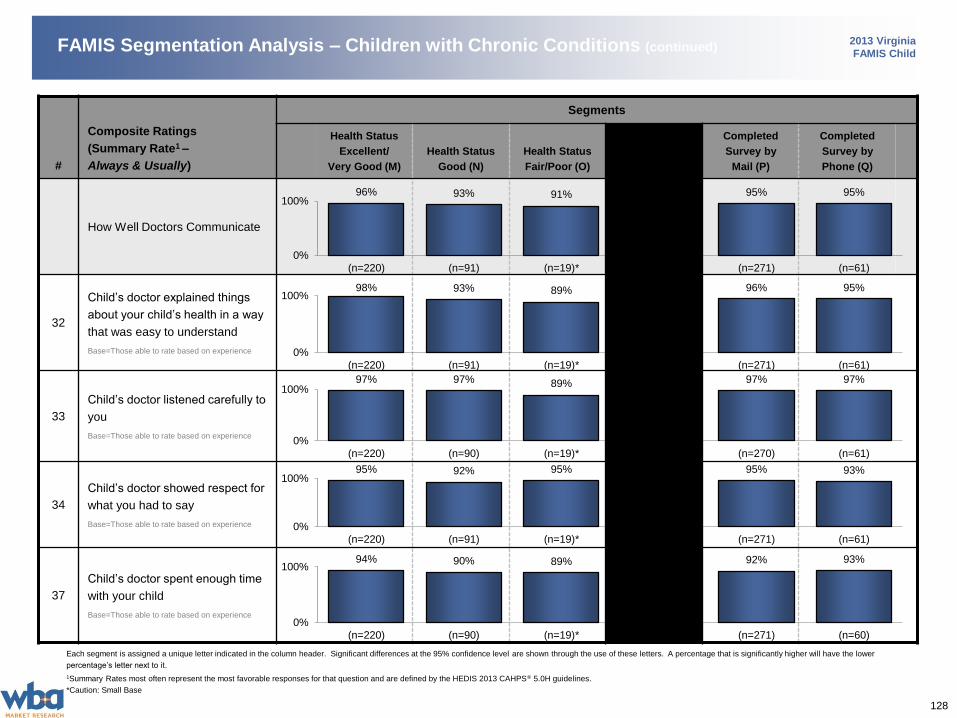
128
2013 Virginia
FAMIS ChildFAMIS Segmentation Analysis – Children with Chronic Conditions (continued)
#
Composite Ratings
(Summary Rate1 –
Always & Usually)
Segments
Health Status
Excellent/
Very Good (M)
Health Status
Good (N)
Health Status
Fair/Poor (O)
Completed
Survey by
Mail (P)
Completed
Survey by
Phone (Q)
How Well Doctors Communicate
32
Child’s doctor explained things
about your child’s health in a way
that was easy to understand
Base=Those able to rate based on experience
33
Child’s doctor listened carefully to
you
Base=Those able to rate based on experience
34
Child’s doctor showed respect for
what you had to say
Base=Those able to rate based on experience
37
Child’s doctor spent enough time
with your child
Base=Those able to rate based on experience
Each segment is assigned a unique letter indicated in the column header. Significant differences at the 95% confidence level are shown through the use of these letters. A percentage that is significantly higher will have the lower
percentage’s letter next to it.
1Summary Rates most often represent the most favorable responses for that question and are defined by the HEDIS 2013 CAHPS® 5.0H guidelines.
*Caution: Small Base
96% 93% 91% 95% 95%
0%
100%
(n=220) (n=91) (n=19)* (n=271) (n=61)
98% 93% 89% 96% 95%
0%
100%
(n=220) (n=91) (n=19)* (n=271) (n=61)
97% 97% 89% 97% 97%
0%
100%
(n=220) (n=90) (n=19)* (n=270) (n=61)
95% 92% 95% 95% 93%
0%
100%
(n=220) (n=91) (n=19)* (n=271) (n=61)
94% 90% 89% 92% 93%
0%
100%
(n=220) (n=90) (n=19)* (n=271) (n=60)
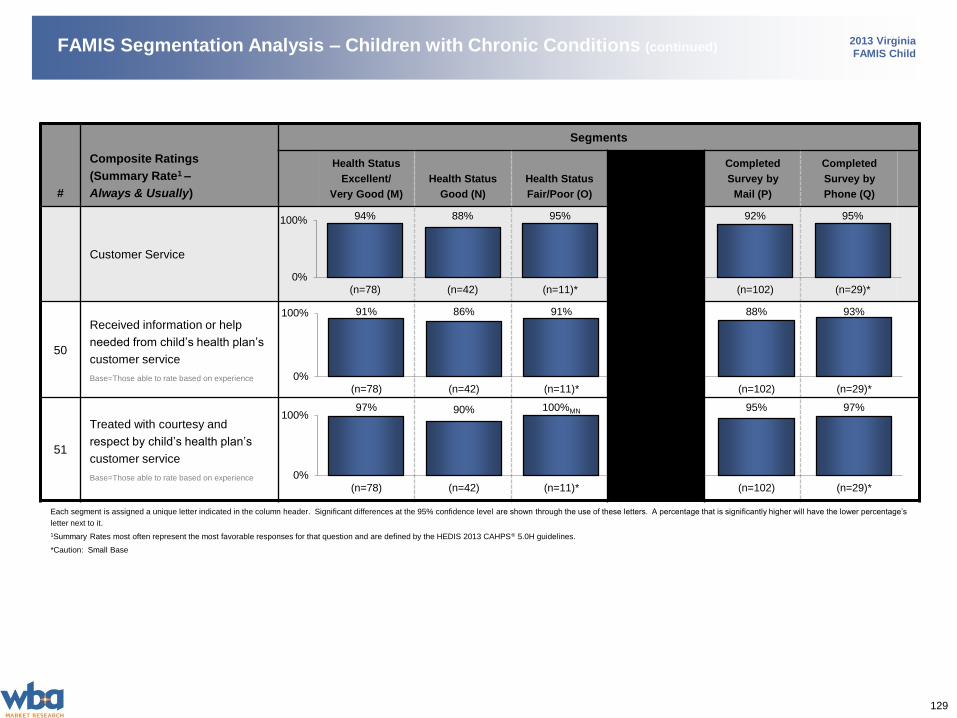
129
2013 Virginia
FAMIS ChildFAMIS Segmentation Analysis – Children with Chronic Conditions (continued)
#
Composite Ratings
(Summary Rate1 –
Always & Usually)
Segments
Health Status
Excellent/
Very Good (M)
Health Status
Good (N)
Health Status
Fair/Poor (O)
Completed
Survey by
Mail (P)
Completed
Survey by
Phone (Q)
Customer Service
50
Received information or help
needed from child’s health plan’s
customer service
Base=Those able to rate based on experience
51
Treated with courtesy and
respect by child’s health plan’s
customer service
Base=Those able to rate based on experience
Each segment is assigned a unique letter indicated in the column header. Significant differences at the 95% confidence level are shown through the use of these letters. A percentage that is significantly higher will have the lower percentage’s
letter next to it.
1Summary Rates most often represent the most favorable responses for that question and are defined by the HEDIS 2013 CAHPS® 5.0H guidelines.
*Caution: Small Base
94% 88% 95% 92% 95%
0%
100%
(n=78) (n=42) (n=11)* (n=102) (n=29)*
91% 86% 91% 88% 93%
0%
100%
(n=78) (n=42) (n=11)* (n=102) (n=29)*
97% 90% 100%MN 95% 97%
0%
100%
(n=78) (n=42) (n=11)* (n=102) (n=29)*
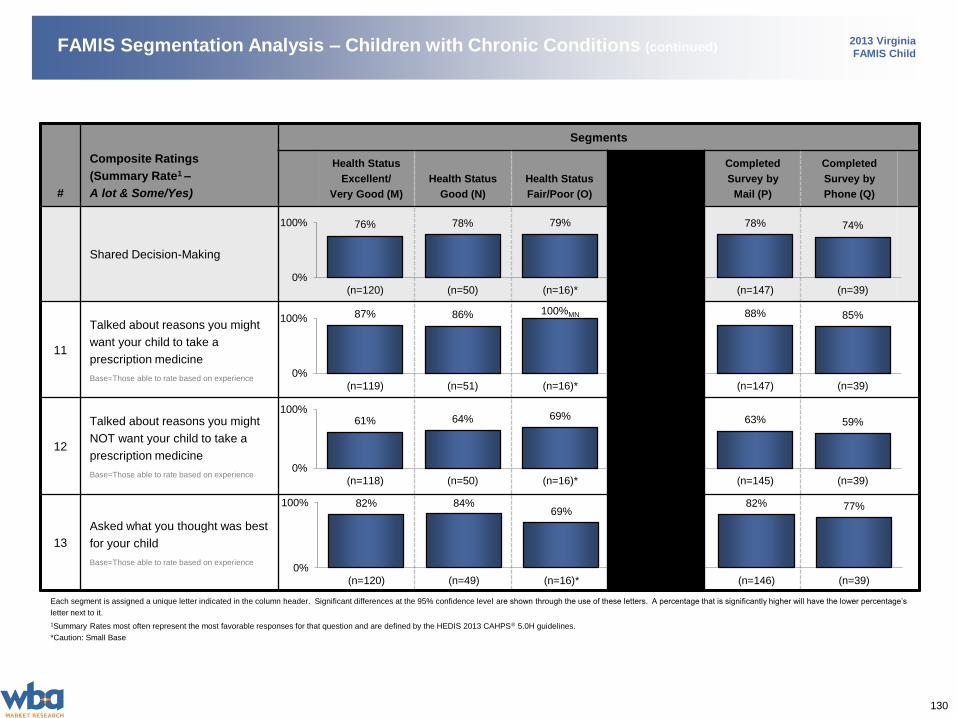
130
2013 Virginia
FAMIS ChildFAMIS Segmentation Analysis – Children with Chronic Conditions (continued)
#
Composite Ratings
(Summary Rate1 –
A lot & Some/Yes)
Segments
Health Status
Excellent/
Very Good (M)
Health Status
Good (N)
Health Status
Fair/Poor (O)
Completed
Survey by
Mail (P)
Completed
Survey by
Phone (Q)
Shared Decision-Making
11
Talked about reasons you might
want your child to take a
prescription medicine
Base=Those able to rate based on experience
12
Talked about reasons you might
NOT want your child to take a
prescription medicine
Base=Those able to rate based on experience
13
Asked what you thought was best
for your child
Base=Those able to rate based on experience
Each segment is assigned a unique letter indicated in the column header. Significant differences at the 95% confidence level are shown through the use of these letters. A percentage that is significantly higher will have the lower percentage’s
letter next to it.
1Summary Rates most often represent the most favorable responses for that question and are defined by the HEDIS 2013 CAHPS® 5.0H guidelines.
*Caution: Small Base
76% 78% 79% 78% 74%
0%
100%
(n=120) (n=50) (n=16)* (n=147) (n=39)
87% 86% 100%MN 88% 85%
0%
100%
(n=119) (n=51) (n=16)* (n=147) (n=39)
61% 64% 69% 63% 59%
0%
100%
(n=118) (n=50) (n=16)* (n=145) (n=39)
82% 84%69%
82% 77%
0%
100%
(n=120) (n=49) (n=16)* (n=146) (n=39)

131
2013 Virginia
FAMIS ChildFAMIS Segmentation Analysis – Children with Chronic Conditions (continued)
#
Composite Ratings
(Summary Rate1 –
Yes/Always & Usually)
Segments
Health Status
Excellent/
Very Good (M)
Health Status
Good (N)
Health Status
Fair/Poor (O)
Completed
Survey by
Mail (P)
Completed
Survey by
Phone (Q)
8Health Promotion and Education
Base=Those able to rate based on experience
40Coordination of Care
Base=Those able to rate based on experience
Each segment is assigned a unique letter indicated in the column header. Significant differences at the 95% confidence level are shown through the use of these letters. A percentage that is significantly higher will have the lower percentage’s
letter next to it.
1Summary Rates most often represent the most favorable responses for that question and are defined by the HEDIS 2013 CAHPS® 5.0H guidelines.
78% 79%95MN 80% 75%
0%
100%
(n=241) (n=98) (n=20)* (n=293) (n=68)
88%N70%
60%78% 91%P
0%
100%
(n=113) (n=64) (n=10)* (n=153) (n=35)
Regression Analysis
133
2013 Virginia
FAMIS ChildRegression Analysis
Regression Analysis
Regression analysis is a statistical technique used to determine which influences, or “independent variables” (composite
measures), have the greatest impact on an overall attribute, or “dependent variable” (overall rating of Health Plan or
Health Care).
Regression analysis produces a set of coefficients (“beta scores”), which show the ranking of the independent variables
by their ability to influence, or drive, the dependent variable.
The composite measures found to have a significant impact on the overall rating of Health Plan and Health Care are
reported as Key Drivers – the larger the coefficient, the greater the influence. The remaining composite measures have
been categorized as either having a “moderate impact” or “low impact” on the overall rating of Health Plan and Health
Care.
The tables on the following pages illustrate this analysis. Specifically, the independent variables for this analysis are
each of the composite measures (Getting Needed Care, Getting Care Quickly, How Well Doctors Communicate,
Customer Service and Shared Decision-Making), while the dependent variable is measured by either the overall rating of
their Health Plan (Q54) or Health Care (Q14).
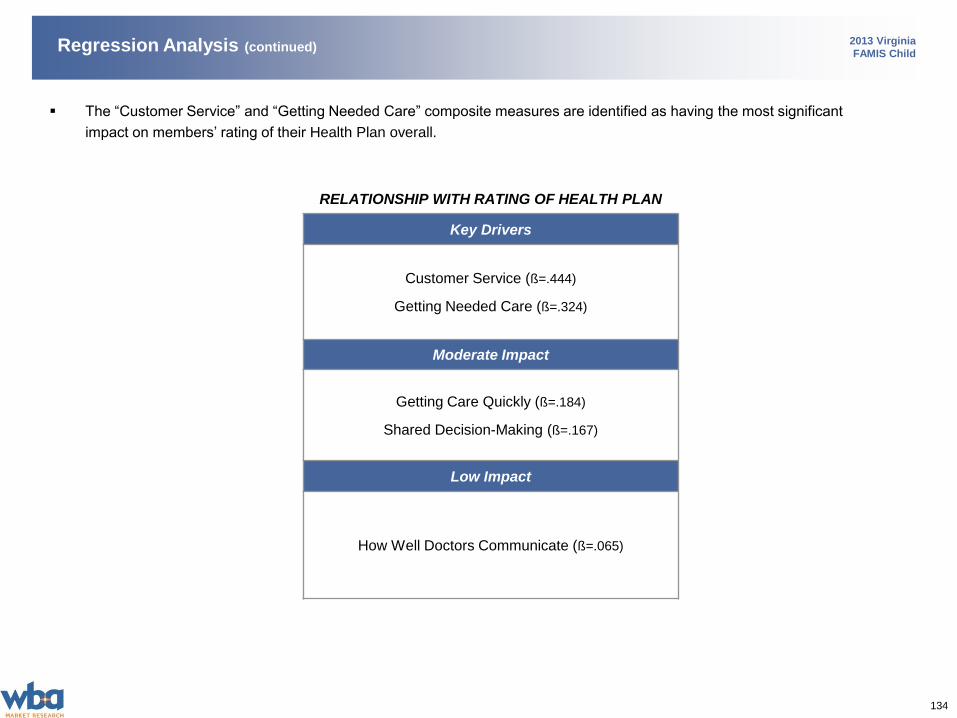
134
2013 Virginia
FAMIS Child
RELATIONSHIP WITH RATING OF HEALTH PLAN
Key Drivers
Customer Service (ß=.444)
Getting Needed Care (ß=.324)
Moderate Impact
Getting Care Quickly (ß=.184)
Shared Decision-Making (ß=.167)
Low Impact
How Well Doctors Communicate (ß=.065)
The “Customer Service” and “Getting Needed Care” composite measures are identified as having the most significant
impact on members’ rating of their Health Plan overall.
Regression Analysis (continued)
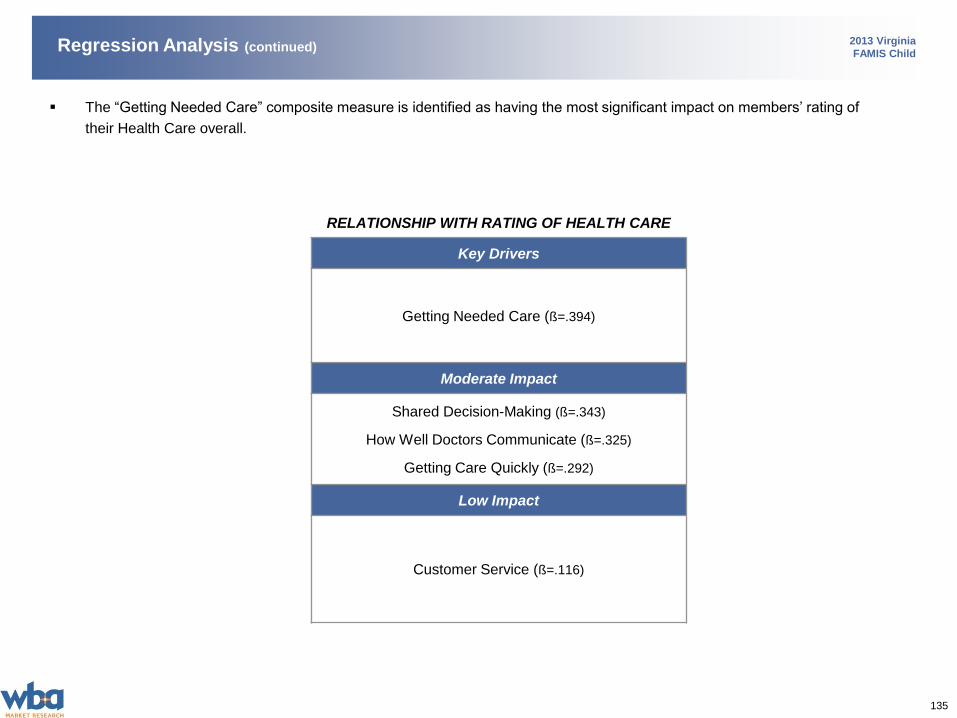
135
2013 Virginia
FAMIS Child
RELATIONSHIP WITH RATING OF HEALTH CARE
Key Drivers
Getting Needed Care (ß=.394)
Moderate Impact
Shared Decision-Making (ß=.343)
How Well Doctors Communicate (ß=.325)
Getting Care Quickly (ß=.292)
Low Impact
Customer Service (ß=.116)
The “Getting Needed Care” composite measure is identified as having the most significant impact on members’ rating of
their Health Care overall.
Regression Analysis (continued)
Key Driver/Correlation Analysis
137
2013 Virginia
FAMIS ChildKey Driver/Correlation Analysis
Key Driver Analysis
In an effort to identify the underlying components of members’ ratings of their Health Plan (Q54) and Health Care (Q14),
advanced statistical techniques were employed. Correlation analyses were conducted between each composite measure
attribute and overall rating of Health Plan and Health Care in order to ascertain which attributes have the greatest impact.
Prioritizing Actions
A key objective of any member satisfaction research is to identify priorities for improving member satisfaction. Doing this will
allow Virginia’s Department of Medical Assistance Services to focus resources to areas that have the strongest impact on
FAMIS members and where improvement is needed. These areas are referred to as unmet needs. In addition, areas that
have the strongest impact on members and on which FAMIS performs well are the driving strengths. Insights can be gained by
plotting these attributes based on their impact on members’ overall rating of their Health Plan and Health Care, as shown on
the following pages.
“Higher” performance is defined by at least 90% of respondents rating the attribute as “Always or Usually”/“A lot or
Some”/“Yes”. “Moderate” performance is defined by between 80% and 89% of respondents giving similar ratings. “Lower”
performance is defined by less than 80% of respondents rating the attribute as “Always or Usually”/“A lot or Some”/“Yes”.
138
2013 Virginia
FAMIS ChildKey Driver/Correlation Analysis (continued)
Attribute Relationship with Rating of Health Plan
While there are no attributes that are considered unmet needs in terms of being priorities for improving member satisfaction
with their Health Care overall, the attribute “Received information or help needed from child’s health plan’s customer service” is
identified as a key driver that has a stronger impact on members’ rating of their Health Plan overall where they gave FAMIS
only moderate ratings.
This attribute should be considered a priority area for FAMIS. If ratings of this attribute are improved, it could have a
positive impact on members’ rating of their Health Plan overall.
There are two attributes that are identified as key drivers that have a stronger impact on members’ ratings of their Health Plan
overall where they gave FAMIS higher ratings. These attributes should be considered driving strengths of FAMIS: “Treated
with courtesy and respect by child’s health plan’s customer service” and “Got the care, tests or treatment your child needed”.
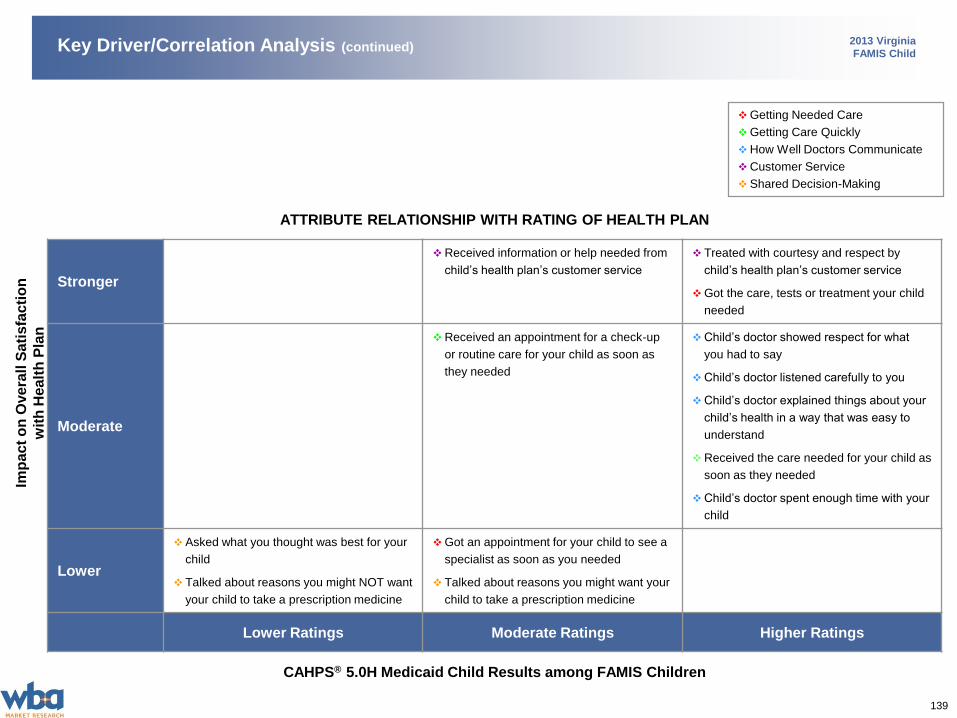
139
2013 Virginia
FAMIS ChildKey Driver/Correlation Analysis (continued)
ATTRIBUTE RELATIONSHIP WITH RATING OF HEALTH PLAN
Stronger
Received information or help needed from
child’s health plan’s customer service
Treated with courtesy and respect by
child’s health plan’s customer service
Got the care, tests or treatment your child
needed
Moderate
Received an appointment for a check-up
or routine care for your child as soon as
they needed
Child’s doctor showed respect for what
you had to say
Child’s doctor listened carefully to you
Child’s doctor explained things about your
child’s health in a way that was easy to
understand
Received the care needed for your child as
soon as they needed
Child’s doctor spent enough time with your
child
Lower
Asked what you thought was best for your
child
Talked about reasons you might NOT want
your child to take a prescription medicine
Got an appointment for your child to see a
specialist as soon as you needed
Talked about reasons you might want your
child to take a prescription medicine
Lower Ratings Moderate Ratings Higher Ratings
CAHPS® 5.0H Medicaid Child Results among FAMIS Children
Imp
act
on
Ove
rall
Sa
tis
fac
tio
n
wit
h H
ealt
h P
lan
Getting Needed Care
Getting Care Quickly
How Well Doctors Communicate
Customer Service
Shared Decision-Making
140
2013 Virginia
FAMIS ChildKey Driver/Correlation Analysis (continued)
Attribute Relationship with Rating of Health Care
There are five attributes that are identified as key drivers that have a stronger impact on members’ ratings of their Health Care
overall where they gave FAMIS higher ratings. These attributes should be considered driving strengths of FAMIS: “Got the
care, tests or treatment your child needed”, “Child’s doctor showed respect for what you had to say”, “Child’s doctor explained
things about your child’s health in a way that was easy to understand”, “Child’s doctor listened carefully to you” and “Child’s
doctor spent enough time with your child”.
There are no attributes that are considered unmet needs in terms of being priorities for improving member satisfaction with their
Health Care overall.
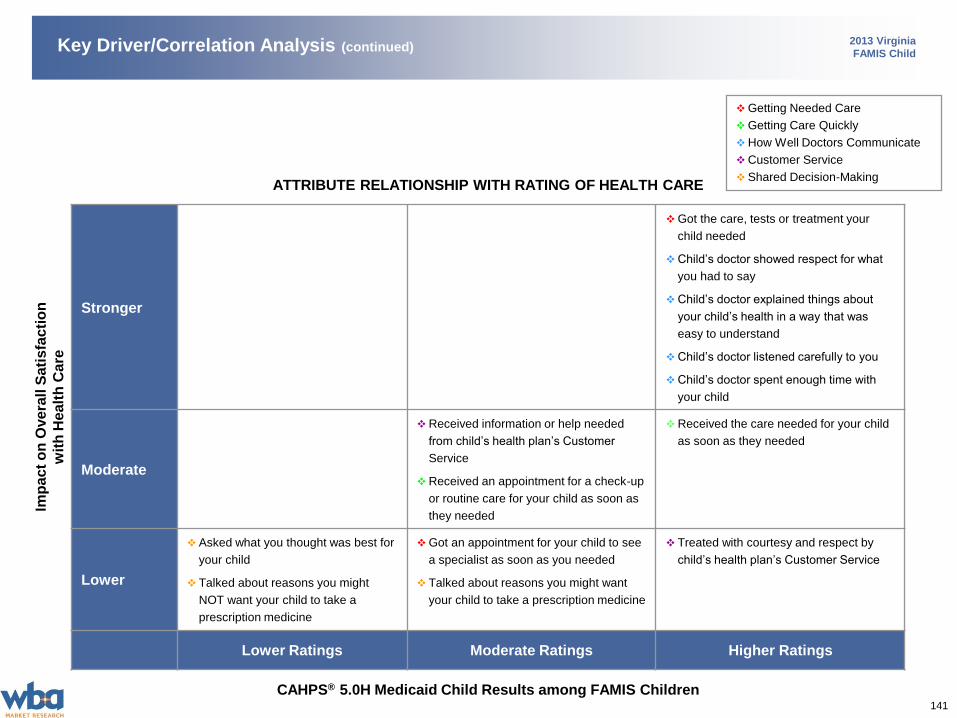
141
2013 Virginia
FAMIS ChildKey Driver/Correlation Analysis (continued)
Imp
act
on
Ove
rall
Sa
tis
fac
tio
n
wit
h H
ealt
h C
are
Getting Needed Care
Getting Care Quickly
How Well Doctors Communicate
Customer Service
Shared Decision-MakingATTRIBUTE RELATIONSHIP WITH RATING OF HEALTH CARE
Stronger
Got the care, tests or treatment your
child needed
Child’s doctor showed respect for what
you had to say
Child’s doctor explained things about
your child’s health in a way that was
easy to understand
Child’s doctor listened carefully to you
Child’s doctor spent enough time with
your child
Moderate
Received information or help needed
from child’s health plan’s Customer
Service
Received an appointment for a check-up
or routine care for your child as soon as
they needed
Received the care needed for your child
as soon as they needed
Lower
Asked what you thought was best for
your child
Talked about reasons you might
NOT want your child to take a
prescription medicine
Got an appointment for your child to see
a specialist as soon as you needed
Talked about reasons you might want
your child to take a prescription medicine
Treated with courtesy and respect by
child’s health plan’s Customer Service
Lower Ratings Moderate Ratings Higher Ratings
CAHPS® 5.0H Medicaid Child Results among FAMIS Children
Glossary of Terms
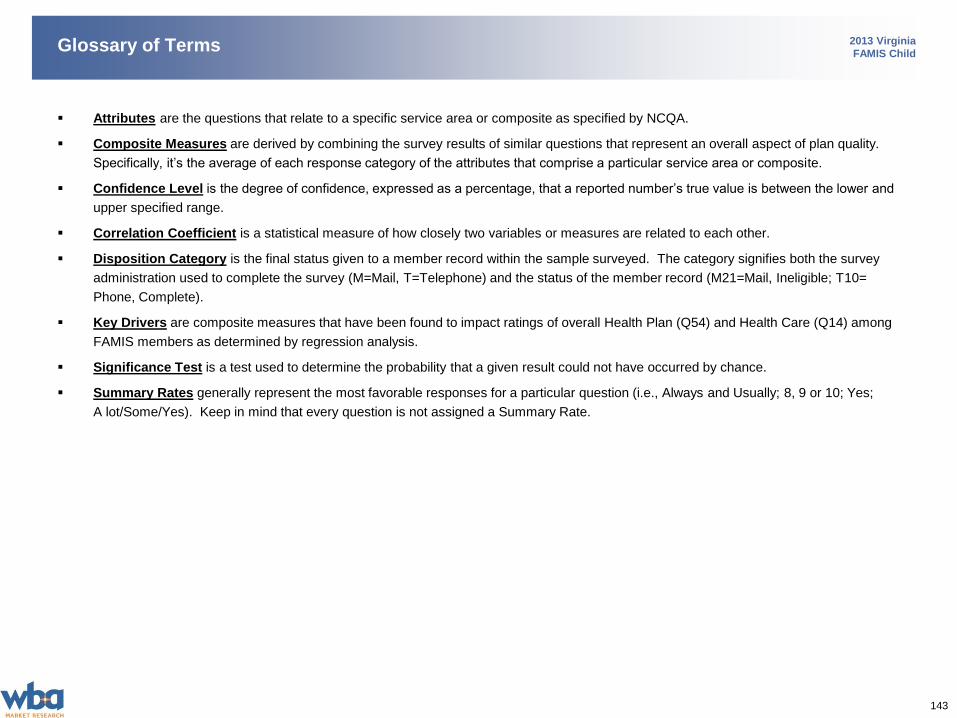
143
2013 Virginia
FAMIS ChildGlossary of Terms
Attributes are the questions that relate to a specific service area or composite as specified by NCQA.
Composite Measures are derived by combining the survey results of similar questions that represent an overall aspect of plan quality.
Specifically, it’s the average of each response category of the attributes that comprise a particular service area or composite.
Confidence Level is the degree of confidence, expressed as a percentage, that a reported number’s true value is between the lower and
upper specified range.
Correlation Coefficient is a statistical measure of how closely two variables or measures are related to each other.
Disposition Category is the final status given to a member record within the sample surveyed. The category signifies both the survey
administration used to complete the survey (M=Mail, T=Telephone) and the status of the member record (M21=Mail, Ineligible; T10=
Phone, Complete).
Key Drivers are composite measures that have been found to impact ratings of overall Health Plan (Q54) and Health Care (Q14) among
FAMIS members as determined by regression analysis.
Significance Test is a test used to determine the probability that a given result could not have occurred by chance.
Summary Rates generally represent the most favorable responses for a particular question (i.e., Always and Usually; 8, 9 or 10; Yes;
A lot/Some/Yes). Keep in mind that every question is not assigned a Summary Rate.
Survey Tool
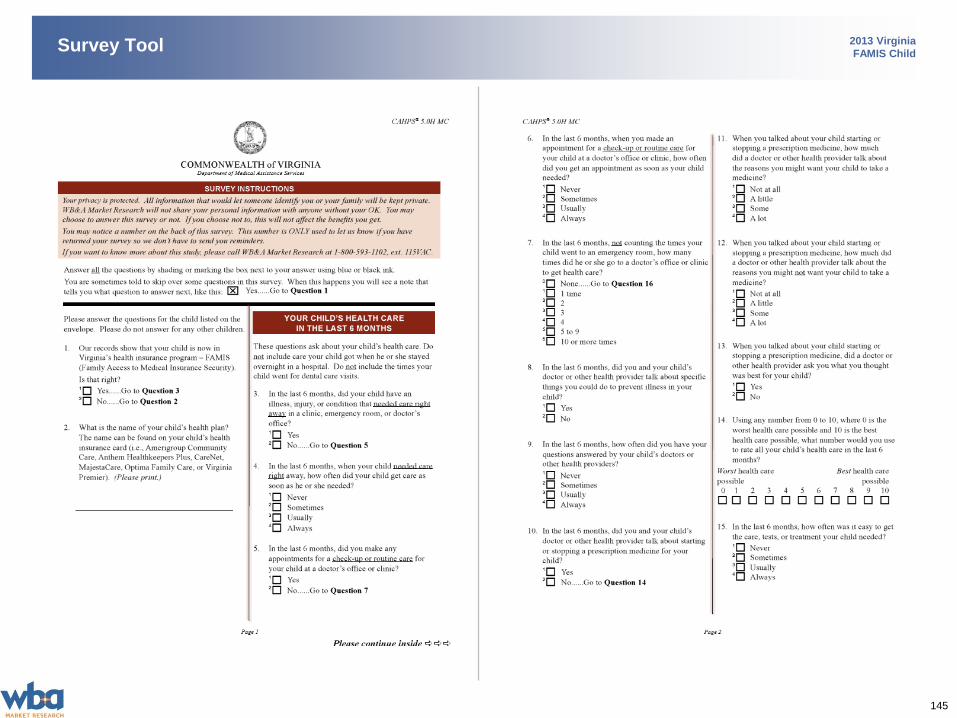
145
2013 Virginia
FAMIS ChildSurvey Tool
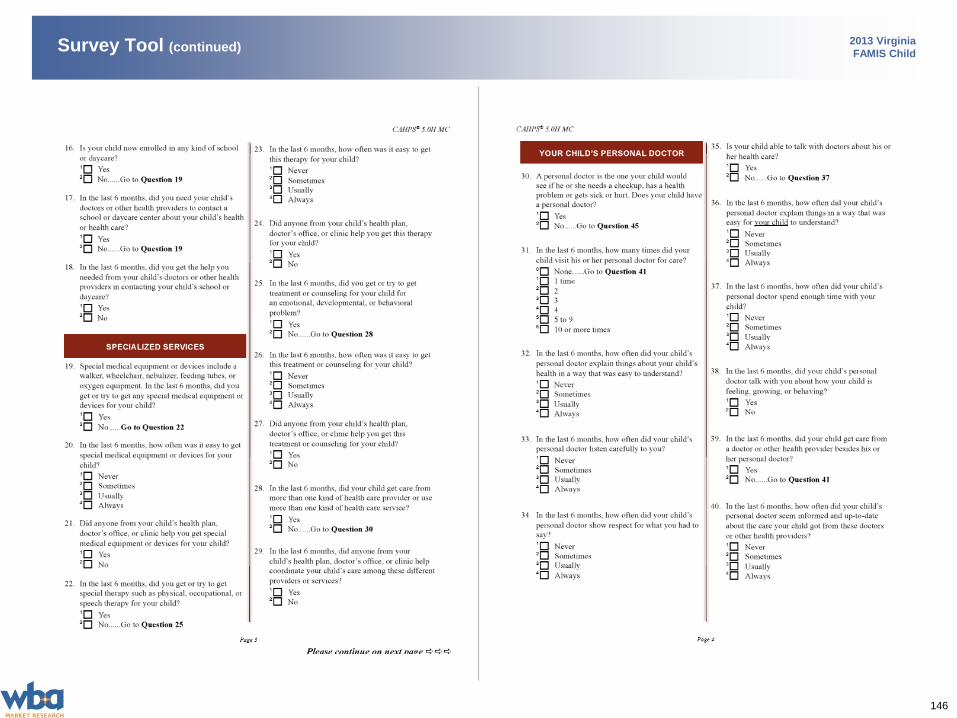
146
2013 Virginia
FAMIS ChildSurvey Tool (continued)
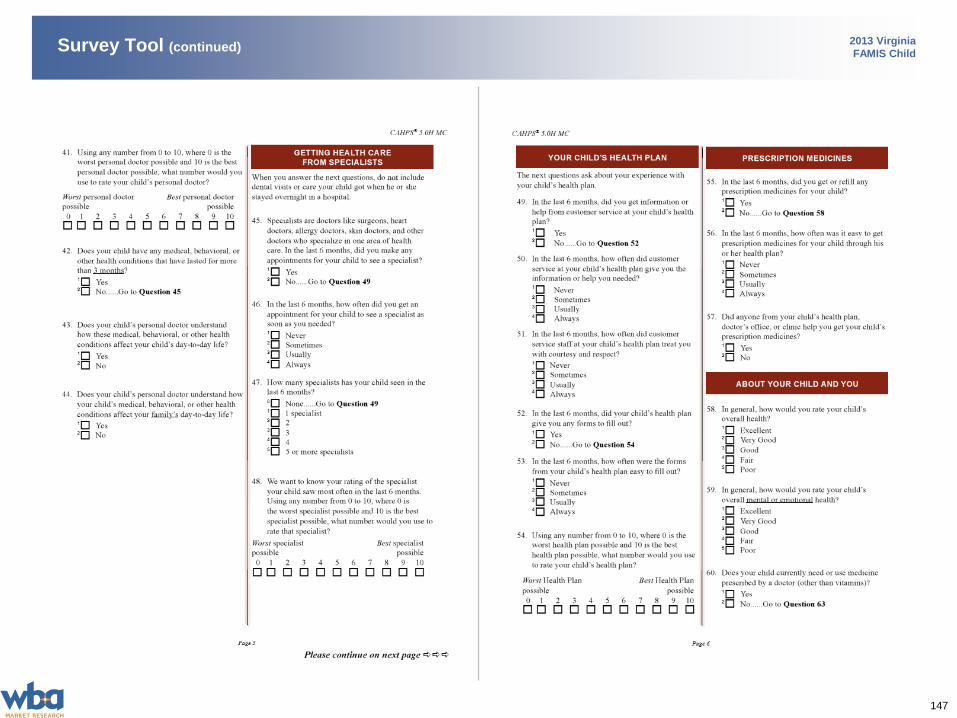
147
2013 Virginia
FAMIS ChildSurvey Tool (continued)
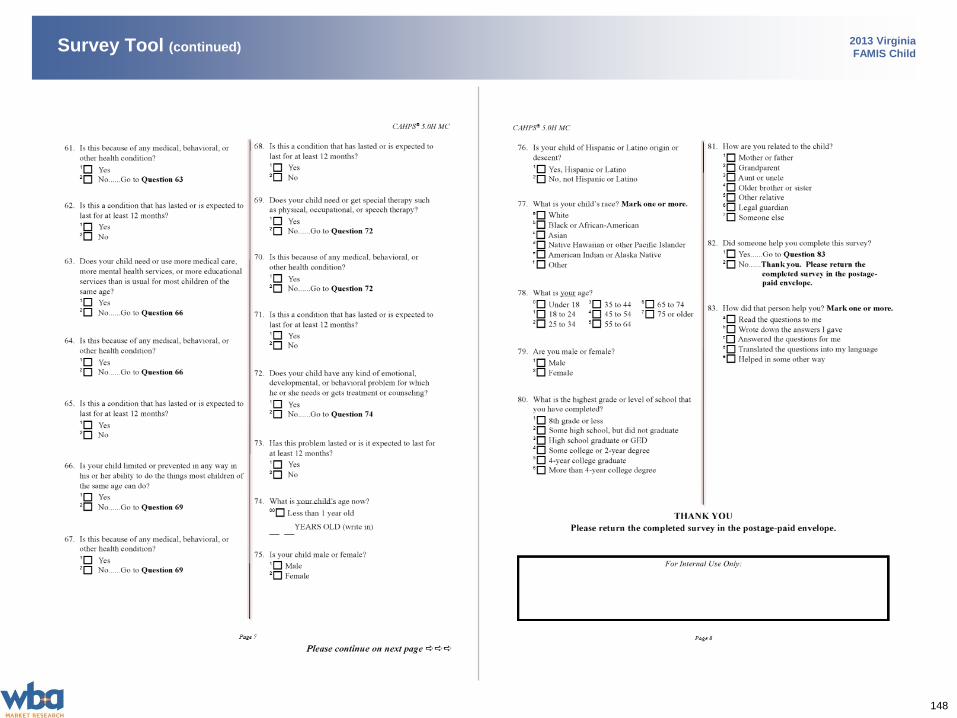
148
2013 Virginia
FAMIS ChildSurvey Tool (continued)