Embed Size (px)
Citation preview

Family Income, Parental Education and Brain Structure in Children and Adolescents
CitationNoble, K. G., S. M. Houston, N. H. Brito, H. Bartsch, E. Kan, J. M. Kuperman, N. Akshoomoff, et al. 2015. “Family Income, Parental Education and Brain Structure in Children and Adolescents.” Nature neuroscience 18 (5): 773-778. doi:10.1038/nn.3983. http://dx.doi.org/10.1038/nn.3983.
Published Versiondoi:10.1038/nn.3983
Permanent linkhttp://nrs.harvard.edu/urn-3:HUL.InstRepos:23845261
Terms of UseThis article was downloaded from Harvard University’s DASH repository, and is made available under the terms and conditions applicable to Other Posted Material, as set forth at http://nrs.harvard.edu/urn-3:HUL.InstRepos:dash.current.terms-of-use#LAA
Share Your StoryThe Harvard community has made this article openly available.Please share how this access benefits you. Submit a story .
Accessibility

Family Income, Parental Education and Brain Structure in Children and Adolescents
Kimberly G. Noble, MD, Ph.D1,2,$,*, Suzanne M. Houston, MA3,4,5,*, Natalie H. Brito, Ph.D.6, Hauke Bartsch, Ph.D.7, Eric Kan, BS4,5, Joshua M. Kuperman, Ph. D.7, Natacha Akshoomoff, Ph.D.7, David G. Amaral, Ph.D.8, Cinnamon S. Bloss, Ph.D.7, Ondrej Libiger, Ph.D.9, Nicholas J. Schork, Ph.D.7, Sarah S. Murray, Ph.D.7, B. J. Casey, Ph.D.10, Linda Chang, M.D.11, Thomas M. Ernst, Ph.D.11, Jean A. Frazier, M.D.12, Jeffrey R. Gruen, M.D.13, David N. Kennedy, Ph.D.12, Peter Van Zijl, Ph.D.14, Stewart Mostofsky, M.D.15, Walter E. Kaufmann, M.D.16,17, Tal Kenet, MD, Ph.D.17,18, Anders M. Dale, Ph.D.19, Terry L. Jernigan, Ph.D.7, Elizabeth R. Sowell, Ph.D.4,5,6,$, and for the Pediatric Imaging, Neurocognition, and Genetics Study1College of Physicians & Surgeons, Columbia University, New York, NY
2Teachers College, Columbia University, New York, NY
3Department of Psychology, University of Southern California, Los Angeles, CA
4The Saban Research Institute of Children’s Hospital, Los Angeles, CA
5Department of Pediatrics of the Keck School of Medicine, University of Southern California, Los Angeles, CA
6Robert Wood Johnson Health and Society Scholar Program, Columbia University
7University of California at San Diego
8The MIND Institute, University of California at Davis
9MD Revolution, Inc.
10Weill Medical College of Cornell University, New York, NY
11University of Hawaii at Manoa, Honolulu, HI
$Denotes corresponding authors, Correspondence jointly addressed to: Elizabeth R. Sowell, Ph.D., Director Developmental Cognitive Neuroimaging Laboratory, Professor of Pediatrics | Keck School of Medicine, University of Southern California, Division of Research on Children, Youth and Families | Department of Pediatrics, Children's Hospital Los Angeles, 4650 Sunset Blvd., Mailstop #130 | Los Angeles, CA 90027, Ph: 323-361-7347 | Fax: 323.361.7836 | [email protected], http://kidsbrains.organd Kimberly G. Noble, MD, PhD, Assistant Professor of Pediatrics, Columbia University, 630 W. 168th St., P&S Box 16, New York, NY 10032, [email protected], http://www.columbia.edu/cu/needlab.*Denotes equal contribution to the development of the manuscript
Author Contributions: K.G.N. developed the theory, conducted analyses, wrote the introduction, results, discussion and methods. S.M.H. compiled/collected data, compiled methods and created tables and figures. N.H.B. conducted analyses, wrote a portion of the results and edited the manuscript. H.B. developed the portal in which most analyses were conducted and assisted with interpretation of results and images. E.K. compiled and lent expertise regarding the imaging data and created figures. C.S.B., O.L., N.J.S. and S.S.M. performed analysis of genetic data. D.G.A., D.N.K., L.C., B.J.C., N.A., T.K., T.M.E., J.A.F., J.R.G, T.L.J., and AMD oversaw participant accrual, behavioral assessment and imaging at data collection sites. P.V.Z, S.M., and W.E.K. assisted in data analysis. E.R.S. contributed to theory development and interpretation of results, oversaw participant accrual, behavioral assessment and imaging at one site, and edited the manuscript.
We declare no conflicts of interest for any authors.
HHS Public AccessAuthor manuscriptNat Neurosci. Author manuscript; available in PMC 2015 November 01.
Published in final edited form as:Nat Neurosci. 2015 May ; 18(5): 773–778. doi:10.1038/nn.3983.
Author M
anuscriptA
uthor Manuscript
Author M
anuscriptA
uthor Manuscript

12University of Massachusetts Medical School, Boston, MA
13Departments of Pediatrics, Genetics, and Investigative Medicine, Yale University School of Medicine, New Haven, CT
14Johns Hopkins University
15Kennedy Krieger Institute
16Boston Children’s Hospital
17Harvard Medical School
18Massachusetts General Hospital
19Center for Translational Imaging and Personalized Medicine, University of California
Abstract
Socioeconomic disparities are associated with differences in cognitive development. The extent to
which this translates to disparities in brain structure is unclear. Here, we investigated relationships
between socioeconomic factors and brain morphometry, independently of genetic ancestry, among
a cohort of 1099 typically developing individuals between 3 and 20 years. Income was
logarithmically associated with brain surface area. Specifically, among children from lower
income families, small differences in income were associated with relatively large differences in
surface area, whereas, among children from higher income families, similar income increments
were associated with smaller differences in surface area. These relationships were most prominent
in regions supporting language, reading, executive functions and spatial skills; surface area
mediated socioeconomic differences in certain neurocognitive abilities. These data indicate that
income relates most strongly to brain structure among the most disadvantaged children. Potential
implications are discussed.
Early experiences are critical for shaping brain development1. In humans, maturation of the
brain regions responsible for higher cognitive functioning continues throughout childhood
and adolescence, and thus the window for experience-dependent plasticity is long2.
Childhood socioeconomic status (SES), characterized by parental educational attainment,
occupation, and income3, is associated with early experiences which are important for
cognitive development4. A burgeoning field has emerged at the intersection of the neural
and social sciences, investigating associations between childhood SES and brain function5.
SES is linked to children’s neurocognitive function across numerous domains, including
language, self-regulation, memory, and socioemotional processing6–11.
Neuroanatomical changes are the hallmarks of experience-based neural plasticity12. Recent
research has begun examining links between SES and structural brain development13–22.
Nearly all studies to date have focused on cortical volume. However, volume represents a
composite of cortical surface area and cortical thickness, two morphometric properties of the
brain that are evolutionarily, genetically and developmentally distinct23.
Noble et al. Page 2
Nat Neurosci. Author manuscript; available in PMC 2015 November 01.
Author M
anuscriptA
uthor Manuscript
Author M
anuscriptA
uthor Manuscript

Cortical thickness decreases rapidly in childhood and early adolescence, followed by a more
gradual thinning and ultimately plateauing in early adulthood2,23–25. This cortical thinning is
thought to relate to synaptic pruning and increases in myelination expanding into the
neuropil, both of which would appear as decreases in gray matter on magnetic resonance
imaging (MRI)2. Surface area is thought to be influenced by experience-related synaptic
pruning, as well as pressure from increased myelination expanding the brain surface
outward. In contrast to thickness, surface area expands through early adolescence and then
shrinks through middle adulthood25. These maturational changes, in concert, result in the
mature human brain, and are influenced by both genetic programming and experience.
Intelligence has been associated with the trajectories of both cortical thickness and surface
area. By age 10, more intelligent children have thinner cortices; this relationship becomes
more pronounced through adolescence25,26. In contrast, surface area is greater in more
intelligent children at age 1025. Parental education has been associated with prefrontal
cortical thickness, independent of age20. However, the extent to which this generalizes to
thickness of other regions, and whether SES is associated with surface area, is unknown.
Subcortically, both hippocampal14,17,19,21 and amygdala volumes14,21 have been associated
with SES. Hippocampal and amygdala volumes increase until early adulthood, and then
begin to decline.27 In adulthood, this decline is buffered by educational attainment13, but
whether SES moderates the developmental trajectories of limbic structures in childhood is
unknown.
In the United States, race and SES are highly confounded. This poses particular difficulties
for models of the association between SES and brain structure, because, like most
physiognomic variables, brain morphology differs, at least subtly, among different ancestry
groups. Therefore, it is often difficult to rule out the possibility that genetic ancestry
mediates associations between SES and brain morphological differences. When adjusting for
racial differences, socioeconomic disparities in cognition frequently persist28. However, no
study of SES and the brain has accounted for ancestral descent based on genotype analysis.
Additionally, it is critical to examine socioeconomic factors such as education and income
separately, as these correlated factors represent distinct resources that may play different
roles in children’s development. For example, income may best represent the material
resources available to children, whereas parents’ educational attainment may be more
important in shaping parent-child interactions29.
Thus, key open questions concern the extent to which distinct socioeconomic factors,
including parent education and family income, are associated with specific aspects of
neuroanatomical development, including surface area, cortical thickness, and regional
subcortical volumes, and whether such associations mediate socioeconomic disparities in
neurocognitive outcomes. Further, as structural brain development is nonlinear, it is vital to
consider whether associations with socioeconomic factors are moderated by age. Finally, the
extent to which socioeconomic disparities in brain structure occur independently of genetic
ancestry is unknown.
Noble et al. Page 3
Nat Neurosci. Author manuscript; available in PMC 2015 November 01.
Author M
anuscriptA
uthor Manuscript
Author M
anuscriptA
uthor Manuscript

Results
SES is Positively Related to Cortical Surface Area
Using data collected as part of the multi-site Pediatric Imaging, Neurocognition and
Genetics (PING) study (http://ping.chd.ucsd.edu), we investigated associations between
socioeconomic factors (parent education, family income) and surface area, adjusting for age,
scanner site, sex and genetic ancestry factor (GAF). (See Table 1 for demographics of
sample.) In all analyses below, we have taken care to examine the unique and overlapping
variance in brain structure attributable to distinct socioeconomic factors.
Initial analyses showed that models were best fit using a quadratic function for age. Models
were examined with and without the quadratic term for parental education; as this term did
not account for additional unique variance, it was dropped. As income was positively
skewed, it was log-transformed, and the natural log of income was included in all models
below.
Parental education was significantly associated with surface area independent of age,
scanner, sex and GAF (β = 0.141, p = 0.031, F(22, 1076) = 31.67, p < .001, R2Adjusted = .
381). There were no age*education or GAF*education interactions, such that the association
between parental education and surface area was invariant across child age and genetic
ancestry group. (See Table 2 and Fig. 1a.) We then visualized the model to assess regional
specificity (Fig. 1b). When adjusting for age, age2, scanner, sex and GAF, parental
education accounted for significant variation in surface area in a number of regions. Left
hemisphere regions included the left superior, middle, and inferior temporal gyri, inferior
frontal gyrus, medial orbito-frontal region and the precuneus. Right hemisphere regions
included the middle temporal gyrus, inferior temporal gyrus, supramarginal gryus, middle
and superior frontal gyri. Bilateral regions included the fusiform gyrus, temporal pole,
insula, superior and medial frontal gyri, cingulate cortex, inferior parietal cortex, lateral
occipital cortex, and postcentral gyrus. These regions are associated with language, reading,
and various executive functions and spatial skills30–34. Such skills tend to vary with
SES6,35,36.
Adjusting for age, age2, scanner, sex and GAF, family income was also significantly
associated with total surface area (β = 0.185, p = 0.004, F(22, 1076) = 32.44, p < .001,
R2Adjusted = .387) (see Table 2). The logarithmic association between family income and
surface area was steepest at the lower end of the income distribution (Fig. 2a). There were
no age*income or GAF*income interactions. We then visualized this model to assess
regional specificity (Fig. 2b). Adjusting for age, age2, scanner, sex and GAF, family income
accounted for significant variation in surface area in widespread regions of children’s
bilateral frontal, temporal and parietal lobes. Relationships were strongest in bilateral
inferior temporal, insula and inferior frontal gyrus, and in the right occipital and medial
prefrontal cortex – regions linked with various language and executive functions. These
associations remained significant bilaterally in the insula, temporal pole, and anterior and
posterior cingulate, and in the right dorsal frontal region extending onto the medial surface,
even after extremely stringent correction for multiple comparisons with false discovery rate
(FDR) levels set at 0.01, and even at 0.001 (See Supplementary Fig. 1a–c).
Noble et al. Page 4
Nat Neurosci. Author manuscript; available in PMC 2015 November 01.
Author M
anuscriptA
uthor Manuscript
Author M
anuscriptA
uthor Manuscript

We next constructed a model including both education and income, to assess whether these
socioeconomic factors uniquely accounted for variance in surface area. Only the income
term accounted for unique variance (β = .105, p = 0.001, F(22, 1076) = 32.52, p < .001,
R2Adjusted = .387; See Table 2). We visualized the model to assess regional specificity (Fig.
2c). Adjusting for age, age2, scanner, sex, GAF and parental education, family income
accounted for significant variation in surface area in bilateral inferior frontal, cingulate,
insula, and inferior temporal regions and in the right superior frontal and precuneus cortex –
regions that are associated with language and executive functioning. It is possible that, in
these regions, associations between parent education and children’s brain surface area may
be mediated by the ability of more highly educated parents to earn higher incomes – thereby
having the ability to purchase more nutritious foods, provide more cognitively stimulating
home learning environments, afford higher-quality child care settings or safer
neighborhoods, with more opportunities for physical activity and less exposure to
environmental pollutants and toxic stress3,37. It will be important in future work to
disambiguate these proximal processes by measuring home, family and other environmental
mediators38.
To allow for a finer-grained adjustment for genetic ancestry, and to ensure that SES was not
confounded with population sub-structure within an ancestry group, we re-ran the multiple
regression models above, covarying the top 20 principal components (PC’s) from the single
nucleotide polymorphism (SNP) data, rather than including GAF as a covariate. All results
were essentially unchanged. Specifically, when adjusting for age, age2, scanner, sex and the
20 PCs, parental education was significantly associated with surface area (β = 0.152, p =
0.021, F(37, 1060) = 20.34, p < .001, R2Adjusted = .395; see Supplementary Table 1).
Similarly, when adjusting for age, age2, scanner, sex and the 20 PCs, family income was
also significantly associated with total surface area (β = 0.183, p = 0.005, F(37, 1060) =
20.94, p < .001, R2Adjusted = .402; see Supplementary Table 2).
Income Linked to Cortical Thickness
We next investigated associations between SES factors and cortical thickness. Initial
analyses of thickness showed that models were best fit using a quadratic function for age.
When adjusting for age, age2, scanner, sex and GAF, multiple regression analyses indicated
that parental education was not associated with cortical thickness, whether considering a
linear, logarithmic or quadratic model. There were no age*education or GAF*education
interactions. However, adjusting for the same covariates, family income was borderline
significantly associated with cortical thickness (β = 0.088, p = 0.054, F(22, 1076) = 115.46,
p < .001, R2Adjusted = .696); see Table 3). There were no sex*income, GAF*income, or
age*income interactions.
Education is Positively Related to Hippocampal Volume
We next assessed associations between socioeconomic factors and hippocampal/amygdala
volumes. In the hippocampus, models were best fit using a quadratic function for age.
Adjusting for age, age2, scanner, sex, GAF, and whole brain volume, multiple regression
analyses indicated that parental education was significantly associated with left hippocampal
Noble et al. Page 5
Nat Neurosci. Author manuscript; available in PMC 2015 November 01.
Author M
anuscriptA
uthor Manuscript
Author M
anuscriptA
uthor Manuscript

volume (β = 0.514, p = 0.024). The quadratic term for parent education accounted for unique
variance (β = −0.494, p = 0.016), and was retained in the model (F(24, 1074) = 48.47, p < .
001, R2Adjusted = .509; See Table 4). There were no age*education or GAF*education
interactions.
The association between parent education and children’s left hippocampal volume is
steepest at lower levels of parent education (Fig. 3), indicating that, for each year of parent
educational attainment, increases in children’s hippocampal size were proportionally greater
at the lower end of the educational spectrum. Socioeconomic disparities in hippocampal
development may thus be most apparent among children of very low educated individuals.
There were no associations between parental education and right hippocampal volume, nor
between income and either left or right hippocampal volumes. This latter finding contrasts
with some previous reports, which have found that income, but not education, is associated
with hippocampal size14,38, though other studies have found associations between paternal
education and right hippocampal size17 or between hippocampal size and a composite of
parent education and occupation19. Educational attainment may moderate the effect of age
on hippocampal volume in adulthood13; we found no such interaction in the present data
among children and adolescents.
Finally, adjusting for age, age2, scanner, sex, GAF, and whole brain volume, there were no
associations between either parent education or family income and left or right amygdala
volumes. Findings regarding socioeconomic disparities in amygdala structure have been
mixed, with some studies reporting significant associations14,38 and others not17,19. Such
differences may be the result of differing socioeconomic distributions, or other demographic
differences in the samples studied.
SES-Cognition Links Mediated by Surface Area
Correlations between four neurocognitive assessments of interest from the National
Institutes of Health Toolbox® Cognition Battery (flanker inhibitory control test, list sorting
working memory test, picture vocabulary test, and oral reading recognition test; see Online
Methods) and surface area were examined. Significant correlations were found between
income and all four cognitive assessments (Flanker: r = .078; Working Memory: r = .143;
Vocabulary: r = .206; Reading: r = .095; all p’s < .001), as well as between surface area and
all four cognitive assessments (Flanker: r = .194; Working Memory: r = .212; Vocabulary: r
= .149; Reading: r = .118; all p’s < .001). We therefore conducted mediation analyses to
investigate the extent to which surface area accounted for links between income and each
cognitive assessment, adjusting for age, age2, scanner, sex, and GAF. For the flanker task,
the direct effect of income on flanker scores (β = 0.050, t(1074) = 2.68, p = .007) was
reduced when controlling for surface area (β = 0.043, t(1074) = 2.27, p = .023). A Sobel test
indicated that this reduction was significant, indicating a partial mediation (Sobel z = 2.4, p
=. 02; see Supplementary Fig. 2). Similarly, for the working memory task, the direct effect
of income (β = 0.069, t(1084) =3.77, p = 0.0002) was reduced when controlling for surface
area (β = 0.061, t(1084) = 3.31, p = 0.001). The Sobel test was significant, again indicating
partial mediation (Sobel z = 2.6, p =. 009; see Supplementary Fig. 3). Unlike past work in
which lobar brain volumes did not mediate associations between SES and IQ39, these results
Noble et al. Page 6
Nat Neurosci. Author manuscript; available in PMC 2015 November 01.
Author M
anuscriptA
uthor Manuscript
Author M
anuscriptA
uthor Manuscript

indicate that children’s whole-brain surface area partially accounts for the association
between family income and children’s performance on these executive function measures.
Surface area did not mediate the relation between income and vocabulary scores or income
and reading scores.
Although significant correlations were found between all four cognitive assessments and
cortical thickness (Flanker: r = −.612; Working Memory: r = −.573; Vocabulary: r = −.623;
Reading: r = −.645; all p’s < .001), cortical thickness did not mediate the relation between
income and any of the neurocognitive measures of interest.
Discussion
Socioeconomic disparities have long been recognized as sources of variance in individual
differences in cognitive development. Here, in the largest study to date to characterize
associations between socioeconomic factors and children’s brain structure, we have shown
that parental education and family income account for individual variation in independent
characteristics of brain structural development, in regions that are critical for the
development of language, executive functions and memory.
We found that parental education was linearly associated with children’s total brain surface
area, indicating that any increase in parental education – whether an extra year of high
school or college – was associated with a similar increase in surface area over the course of
childhood and adolescence. Family income was logarithmically associated with surface area,
indicating that for every dollar in increased income, the increase in children’s brain surface
area was proportionally greater at the lower end of the family income spectrum. Further,
surface area mediated links between income and children’s performance on certain
executive function tasks.
Of course, strong conclusions concerning development are limited in a cross-sectional
sample. Further, in the correlational, non-experimental results reported here, it is unclear
what is driving the links between SES and brain structure. Such associations could stem
from ongoing disparities in postnatal experience or exposures, such as family stress,
cognitive stimulation, environmental toxins, or nutrition, or from corresponding differences
in the prenatal environment. If this correlational evidence reflects an underlying causal
relationship, then policies targeting families at the low end of the income distribution may
be most likely to lead to observable differences in children’s brain and cognitive
development.
SES, cultural differences, and genetic ancestry are often conflated in our society. The
present study is the first study of SES and the brain to include as covariates continuously
varying measures of degree of genetic ancestry. Of note, this study can only speak to the
effects of GAF – a proxy for race. Thus, while the inclusion of genetic ancestry does not
preclude the possibility that these findings may reflect, in part, an unmeasured heritable
component40, it reduces as far as possible the likelihood that apparent SES effects were
mediated by genetic ancestry factors associated with SES in the population. Further,
Noble et al. Page 7
Nat Neurosci. Author manuscript; available in PMC 2015 November 01.
Author M
anuscriptA
uthor Manuscript
Author M
anuscriptA
uthor Manuscript

associations between SES factors and brain morphometry were invariant across ancestry
groups.
As a final point, the evidence presented here should in no way imply that a child’s
socioeconomic circumstances lead to an immutable trajectory of cognitive or brain
development. Many other factors account for variance in brain morphometry, and indeed,
the data presented here show marked variability in brain structure at all SES levels,
including among the most disadvantaged children. Certainly both school-based41 and home-
based42 interventions have resulted in important cognitive and behavioral gains for children
facing socioeconomic adversity, and small increases in family earnings in the first two years
of a child’s life may lead to remarkable differences in adult circumstances43. As such, many
leading social scientists and neuroscientists believe that policies reducing family poverty
may have meaningful effects on children’s brain functioning and cognitive development. By
elucidating the structural brain differences associated with socioeconomic disparities, we
may be better able to identify more precise endophenotypic biomarkers to serve as targets
for intervention, with the ultimate goal of reducing socioeconomic disparities in
development and achievement.
METHODS
Participants
Participants were recruited through a combination of web-based, word-of-mouth, and
community advertising at nine university-based data collection sites in and around the cities
of Los Angeles, San Diego, New Haven, Sacramento, San Diego, Boston, Baltimore,
Honolulu and New York. Participants were excluded if they had a history of neurological,
psychiatric, medical, or developmental disorders. All participants and their parents gave
their informed written consent/assent to participate in all study procedures, including whole
genome SNP genotype, neuropsychological assessments (NIH Toolbox® Cognition
Battery)44, demographic and developmental history questionnaires, and high-resolution
brain MRI. Each data collection site’s Office of Protection of Research Subjects and
Institutional Review Board approved the study. Except when indicated, all analyses were
conducted on the 1099 participants for whom complete data were available on all relevant
variables (age, sex, parent education, family income, GAF, scanner, surface area and cortical
thickness); see Table 1.
Socioeconomic status
Parents were asked to report the level of educational attainment for all parents in the home.
The average parental educational attainment was used in all analyses. Parents were also
asked to report the total yearly family income. Data were not collected on the number of
adults and children in the home, and therefore income-to-needs ratios were unable to be
calculated. Both education and income data were originally collected in bins, which were
recoded as the means of the bins for analysis (See Supplementary Table 3). Family income
was log-transformed for all analyses due to the typically observed positive skew. As
expected, parent education and income were highly correlated (r = .526; p < 10−6). There
were no SES differences in the sample by sex (parent education: t (1097) = 1.07; p = 0.28;
Noble et al. Page 8
Nat Neurosci. Author manuscript; available in PMC 2015 November 01.
Author M
anuscriptA
uthor Manuscript
Author M
anuscriptA
uthor Manuscript

family income: t (1097) = 0.19; p = 0.85). Parental education was associated with age (r = −.
07, p<.05).
Image acquisition and processing
Each site administered a standardized structural MRI protocol. (See Supplementary Table 4
for scan parameters) Pre- and post-processing techniques have been described previously45.
Briefly, high-resolution structural MRI included a 3-D T1-weighted scan, a T2-weighted
volume, and diffusion-weighted scans with multiple b-values and 30-directions. Image
analyses were performed using a modified Freesurfer software suite (http://
surfer.nmr.mgh.harvard.edu/) to obtain measures of cortical and subcortical volume regions
of interest (ROIs), and vertex-wise cortical thickness and surface area46. All neuroimaging
data passed a standardized quality-image check.
Genetic collection and analysis
Saliva samples were sent to Scripps Translational Research Institute (STRI) for analysis.
Once extracted, genomic DNA was genotyped with Illumina Human660W-Quad BeadChip.
Replication and quality control filters (i.e. sample call rate >99, call rates >95%, minor allele
frequency >5%) were performed47. To assess genetic ancestry and admixture proportions in
the PING participants, a supervised clustering approach implemented in the ADMIXTURE
software was used48. Using this approach, a genetic ancestry factor (GAF) was developed
for each participant, representing the proportion of ancestral descent for each of six major
continental populations: African, Central Asian, East Asian, European, Native American and
Oceanic. Implementation of ancestry and admixture proportions in the PING subjects is
described in detail elsewhere45. See also Akshoomoff and colleagues44 for a more complete
description of the genetic ancestry of the PING sample.
Neurocognitive testing
The following subtests from the NIH Toolbox were administered. Flanker Inhibitory Control
Test (N = 1074): The NIH Toolbox Cognition Battery version of the flanker task was
adapted from the Attention Network Test (ANT)49. Participants were presented with a
stimulus on the center of a computer screen and were required to indicate the left-right
orientation while inhibiting attention to the flankers (surrounding stimuli). On some trials
the orientation of the flankers was congruent with the orientation of the central stimulus and
on the other trials the flankers were incongruent. The test consisted of a block of 25 fish
trials (designed to be more engaging and easier to see to make the task easier for children)
and a block of 25 arrow trials, with 16 congruent and nine incongruent trials in each block,
presented in pseudorandom order. Participants who responded correctly on 5 or more of the
9 incongruent trials then proceeded to the arrows block. All children age 9 and above
received both the fish and arrows blocks regardless of performance. The inhibitory control
score was based on performance on both congruent and incongruent trials. A two-vector
method was used that incorporated both accuracy and reaction time (RT) for participants
who maintained a high level of accuracy (> 80% correct), and accuracy only for those who
did not meet this criteria. Each vector score ranged from 0 to 5, for a maximum total score
of 10 (M = 7.67, SD = 1.86).
Noble et al. Page 9
Nat Neurosci. Author manuscript; available in PMC 2015 November 01.
Author M
anuscriptA
uthor Manuscript
Author M
anuscriptA
uthor Manuscript
List Sorting Working Memory Test (N = 1084): This working memory measure requires
participants to order stimuli by size50. Participants were presented with a series of pictures
on a computer screen and heard the name of the object from a speaker. The test was divided
into the One-List and Two-List conditions. In the One-List condition, participants were told
to remember a series of objects (food or animals) and repeat them in order, from smallest to
largest. In the Two-List condition, participants were told to remember a series of objects
(food and animals, intermixed) and then again report the food in order of size, followed by
animals in order of size. Working memory scores consisted of combined total items correct
on both One-List and Two-List conditions, with a maximum of 28 points (M = 17.71, SD =
5.39).
Picture Vocabulary Test (N = 1090): This receptive vocabulary test was administered via
computer. The participant was presented with an auditory recording of a word and four high-
resolution color photos on the computer screen and participants were instructed to touch the
image that most closely represents the meaning of the auditory word. Each participant was
given two practice trials and 25 test trials. Participant performance was converted to a theta
score (ranging from 4 to −4), based on item response theory (M = .68, SD = 1.41).
Oral Reading Recognition Test (N = 1076): In this reading test, participants were presented
with a word or letter on the computer screen and the participant is asked to read it aloud.
Responses are recorded as correct or incorrect by the examiner. Items were presented in an
order of increasing difficulty. In order to assess the full range of reading ability across
multiple ages, modifications were made and letters or multiple-choice “prereading” items
were presented to young children or participants with low literacy levels. The oral reading
score ranged from 1 to 281 (M = 124.91, SD = 68.36).
Statistical analyses
The present analyses include the 1,099 participants for whom complete data were available
for parental education, family income, gender, GAF, scanner serial number, cortical surface
area, and cortical thickness, and whose neuroimaging data passed a standardized quality-
image check. For these purposes, all image surfaces and labels were visually inspected, but
not manually edited, ensuring the objectivity of results. Models were constructed to examine
the associations between socioeconomic factors (parental education and family income) and
whole-brain surface area and cortical thickness, respectively, controlling for age, sex,
scanner site, and GAF. Scanner site and GAF were entered as dummy variables. Initial
analyses investigated whether models were better fit using linear, logarithmic or quadratic
terms for age, education and income; logarithmic or quadratic terms for these variables were
incorporated into models as appropriate. Next, using a general additive model, we conducted
vertex-wise analyses on total cortical surface area and total cortical thickness, respectively.
Specifically, each model was evaluated in three steps. In the first step, all control variables
were entered (age, gender, scanner device, GAF), with surface area or cortical thickness
serving as the dependent variable. In step two, parental education or log-transformed family
income was added to examine the respective associations between these socioeconomic
factors and surface area/thickness. Step three investigated whether the effect of SES was
moderated by child age (incorporating the education*age or income*age interaction terms,
Noble et al. Page 10
Nat Neurosci. Author manuscript; available in PMC 2015 November 01.
Author M
anuscriptA
uthor Manuscript
Author M
anuscriptA
uthor Manuscript

respectively) and/or by GAF (incorporating the education*GAF or income*GAF interaction
terms, respectively). Finally, in models where both education and income significantly
accounted for variance, these terms were included in the model together to determine if one
or both socioeconomic factors accounted for unique variance. To assess the possibility that
genetic variation within an ancestry group could be confounded with SES, the top 20
principal components (PC’s) from the SNP data were calculated. These PC’s were added to
the models as covariates instead of GAF as an additional check. Regional specificity was
assessed using the PING portal, a Freesurfer based visualization platform. Regional maps
were set for a threshold of p <. 05 (FDR correction). Maps of family income and cortical
surface area were additionally thresholded at p <.01, and p <.001. All statistical tests were 2-
sided. Power analyses reveal that, with 1099 participants, we have 80% power to detect a
minimal effect size of at least .03 in these analyses.
A supplementary methods checklist is available.
Supplementary Material
Refer to Web version on PubMed Central for supplementary material.
Acknowledgements
Funding for this work was supported by the following grants: RC2 DA029475 to TLJ; R01 HD053893 to ERS; R01 MH087563 to ERS; R01 HD061414 to TLJ; and funding from the Annie E. Casey Foundation and the GH Sergievsky Center to KGN.
References
1. Rosenzweig MR. Effects of differential experience on the brain and behavior. Developmental Neuropsychology. 2003; 24:523–540. [PubMed: 14561569]
2. Sowell ER, et al. Mapping cortical change across the human life span. Nature Neuroscience. 2003; 6:309–315.
3. McLoyd VC. Socioeconomic disadvantage and child development. American Psychologist. 1998; 53:185–204. [PubMed: 9491747]
4. Brooks-Gunn J, Duncan GJ. The effects of poverty on children. [Review] [63 refs]. Future of Children. 1997; 7:55–71. [PubMed: 9299837]
5. Hackman D, Farah MJ. Socioeconomic status and the developing brain. Trends in Cognitive Sciences. 2009; 13:65–73. [PubMed: 19135405]
6. Noble KG, Wolmetz ME, Ochs LG, Farah MJ, McCandliss BD. Brain-behavior relationships in reading acquisition are modulated by socioeconomic factors. Developmental Science. 2006; 9:642–654. [PubMed: 17059461]
7. Raizada RD, Richards TL, Meltzoff A, Kuhl PK. Socioeconomic status predicts hemispheric specialisation of the left inferior frontal gyrus in young children. Neuroimage. 2008; 40:1392–1401. [PubMed: 18308588]
8. Stevens C, Lauinger B, Neville H. Differences in the neural mechanisms of selective attention in children from different socioeconomic backgrounds: An event-related brain potential study. Developmental Science. 2009; 12:634–646. [PubMed: 19635089]
9. Sheridan MA, Sarsour K, Jutte D, D'Esposito M, Boyce WT. The impact of social disparity on prefontal function in childhood. PLoS ONE. 2012; 7:e35744. [PubMed: 22563395]
10. Tomalski P, et al. Socioeconomic status and functional brain development – associations in early infancy. Developmental Science. 2013 n/a-n/a.
Noble et al. Page 11
Nat Neurosci. Author manuscript; available in PMC 2015 November 01.
Author M
anuscriptA
uthor Manuscript
Author M
anuscriptA
uthor Manuscript

11. Kim P, et al. Effects of childhood poverty and chronic stress on emotion regulatory brain function in adulthood. Proceedings of the National Academy of Sciences of the United States of America. 2013; 110:18442–18447. [PubMed: 24145409]
12. Sowell ER, et al. Longitudinal mapping of cortical thickness and brain growth in normal children. Journal of Neuroscience. 2004; 24:8223–8231. [PubMed: 15385605]
13. Noble KG, et al. Hippocampal volume varies with educational attainment across the life-span. Frontiers in Human Neuroscience. 2012; 6
14. Noble KG, Houston SM, Kan E, Sowell ER. Neural correlates of socioeconomic status in the developing human brain. Developmental Science. 2012; 15:516–527. [PubMed: 22709401]
15. Noble KG, Korgaonkar MS, Grieve SM, Brickman AM. Higher Education is an Age-Independent Predictor of White Matter Integrity and Cognitive Control in Late Adolescence. Developmental Science. 2013
16. Chiang M-C, et al. Genetics of white matter development: A DTI study of 705 twins and their siblings aged 12 to 29. NeuroImage Oct. 2010 No Pagination Specified.
17. Hanson JL, Chandra A, Wolfe BL, Pollak SD. Association between income and the hippocampus. PLoS ONE. 2011; 6:e18712. [PubMed: 21573231]
18. Hanson JL, et al. Family Poverty Affects the Rate of Human Infant Brain Growth. PLoS ONE. 2013; 8:e80954. [PubMed: 24349025]
19. Jednoróg K, et al. The influence of socioeconomic status on children’s brain structure. PLoS ONE. 2012; 7:e42486. [PubMed: 22880000]
20. Lawson GM, Duda JT, Avants BB, Wu J, Farah MJ. Associations between children's socioeconomic status and prefrontal cortical thickness. Developmental Science. 2013
21. Luby JL, et al. The Effects of Poverty on Childhood Brain Development: The Mediating Effect of Caregiving and Stressful Life Events. JAMA Pediatrics. 2013:E1–E8.
22. Staff RT, et al. Childhood socioeconomic status and adult brain size: Childhood socioeconomic status influences adult hippocampal size. Annals of Neurology. 2012; 71:653–660. [PubMed: 22522480]
23. Raznahan A, et al. How does your cortex grow? Journal of Neuroscience. 2011; 31:7174–7177. [PubMed: 21562281]
24. Sowell ER, et al. Sex differences in cortical thickness mapped in 176 healthy individuals between 7 and 87 years of age. Cerebral Cortex. 2007; 17:1550–1560. [PubMed: 16945978]
25. Schnack HG, et al. Changes in Thickness and Surface Area of the Human Cortex and Their Relationship with Intelligence. Cerebral cortex. 2014
26. Shaw P, et al. Intellectual ability and cortical development in children and adolescents. Nature. 2006; 440:676–679. [PubMed: 16572172]
27. Grieve SM, Korgaonkar MS, Clark CR, Williams LM. Regional heterogeneity in limbic maturational changes: Evidence from integrating cortical thickness, volumetric and diffusion tensor imaging measures. Neuroimage. 2011; 55:868–879. [PubMed: 21224000]
28. Duncan GJ, Magnuson KA. Can family socioeconomic resources account for racial and ethnic test score gaps?[In volume School Readiness: Closing Racial and Ethnic Gaps]. The Future of Children. 2005; 15:35–54. [PubMed: 16130540]
29. Duncan GJ, Magnuson K. Socioeconomic status and cognitive functioning: Moving from correlation to causation. Wiley Interdisciplinary Reviews: Cognitive Science. 2012; 3:377–386.
30. Vannest J, Karunanayaka PR, Schmithorst VJ, Szaflarski JP, Holland SK. Language networks in children: Evidence from functional MRI studies. American Journal of Roentgenology. 2009
31. McCandliss BD, Noble KG. The development of reading impairment: A cognitive neuroscience model. Mental Retardation & Developmental Disabilities Research Reviews. 2003; 9:196–204. [PubMed: 12953299]
32. Gianaros PJ, et al. Perigenual anterior cingulate morphology covaries with perceived social standing. Social Cognitive & Affective Neuroscience. 2007; 2:161–173. [PubMed: 18418472]
33. Casey B, et al. A developmental functional MRI study of prefrontal activation during performance on a go-no-go task. Journal of Cognitive Neuroscience. 1997; 9:835–847. [PubMed: 23964603]
Noble et al. Page 12
Nat Neurosci. Author manuscript; available in PMC 2015 November 01.
Author M
anuscriptA
uthor Manuscript
Author M
anuscriptA
uthor Manuscript

34. Klingberg T, Forssberg H, Westerberg H. Increased brain activity in frontal and parietal cortex underlies the development of visuospatial working memory capacity during childhood. Journal of Cognitive Neuroscience. 2002; 14:1–10. [PubMed: 11798382]
35. Noble KG, McCandliss BD, Farah MJ. Socioeconomic gradients predict individual differences in neurocognitive abilities. Developmental Science. 2007; 10:464–480. [PubMed: 17552936]
36. Noble KG, Norman MF, Farah MJ. Neurocognitive correlates of socioeconomic status in kindergarten children. Developmental Science. 2005; 8:74–87. [PubMed: 15647068]
37. Evans GW. The environment of childhood poverty. American Psychologist. 2004; 59:77–92. [PubMed: 14992634]
38. Luby J, et al. The Effects of Poverty on Childhood Brain Development: The Mediating Effect of Caregiving and Stressful Life Events. JAMA Pediatrics. 2013
39. Lange N, Froimowitz MP, Bigler ED, Lainhart JE. Brain Development Cooperative, G. Associations between IQ, total and regional brain volumes, and demography in a large normative sample of healthy children and adolescents. Developmental neuropsychology. 2010; 35:296–317. [PubMed: 20446134]
40. Trzaskowski M, et al. Genetic influence on family socioeconomic status and children's intelligence. Intelligence. 2014; 42:83–88. [PubMed: 24489417]
41. Raver CC, et al. CSRP’s impact on low-income preschoolers’ preacademic skills: Self-regulation as a mediating mechanism. Child Development. 2011; 82:362–378. [PubMed: 21291447]
42. Kitzman HJ, et al. Enduring effects of prenatal and infancy home visiting by nurses on children: follow-up of a randomized trial among children at age 12 years. Archives of Pediatrics & Adolescent Medicine. 2010; 164:412–418. [PubMed: 20439791]
43. Ziol-Guest KM, Duncan GJ, Kalil A, Boyce WT. Early childhood poverty, immune-mediated disease processes, and adult productivity. Proceedings of the National Academy of Sciences. 2012; 109:17289–17293.
44. Akshoomoff N, et al. The NIH Toolbox Cognition Battery: results from a large normative developmental sample (PING). Neuropsychology. 2014; 28:1–10. [PubMed: 24219608]
45. Fjell AM, et al. Multimodal imaging of the self-regulating developing brain. Proceedings of the National Academy of Sciences of the United States of America. 2012; 109:19620–19625. [PubMed: 23150548]
46. Fischl B, Dale AM. Measuring the thickness of the human cerebral cortex from magnetic resonance images. Proceedings of the National Academy of Sciences of the United States of America. 2000; 97:11050–11055. [PubMed: 10984517]
47. Bakken TE, et al. Association of common genetic variants in GPCPD1 with scaling of visual cortical surface area in humans. Proceedings of the National Academy of Sciences of the United States of America. 2012; 109:3985–3990. [PubMed: 22343285]
48. Alexander DH, Lange K. Enhancements to the ADMIXTURE algorithm for individual ancestry estimation. BMC Bioinformatics. 2011; 12:246. [PubMed: 21682921]
49. Rueda MR, et al. Development of attentional networks in childhood. Neuropsychologia. 2004; 42:1029–1040. [PubMed: 15093142]
50. Tulsky DS, et al. V. NIH TOOLBOX COGNITION BATTERY (CB): MEASURING WORKING MEMORY. Monographs of the Society for Research in Child Development. 2013; 78:70–87. [PubMed: 23952203]
Noble et al. Page 13
Nat Neurosci. Author manuscript; available in PMC 2015 November 01.
Author M
anuscriptA
uthor Manuscript
Author M
anuscriptA
uthor Manuscript

Figure 1. Parent Education is Linearly Associated with Cortical Surface Area (N=1099)A. Multiple regression showed that, when adjusting for age, age2, scanner, sex, and genetic
ancestry, parental education was significantly associated with children’s cortical surface area
in a number of regions. B. Left hemisphere regions included the left superior, middle, and
inferior temporal gyri, inferior frontal gyrus, orbito-frontal gyrus and the precuneus. Right
hemisphere regions included the middle temporal gyrus, inferior temporal gyrus,
supramarginal gryus, middle frontal gyrus and superior frontal gyrus. Bilateral regions
included the fusiform gyrus, temporal pole, insula, superior frontal gyrus, medial frontal
Noble et al. Page 14
Nat Neurosci. Author manuscript; available in PMC 2015 November 01.
Author M
anuscriptA
uthor Manuscript
Author M
anuscriptA
uthor Manuscript

gyrus, the cingulate cortex, inferior parietal cortex, lateral occipital cortex, and postcentral
gyrus. Maps are thresholded at p <. 05 (FDR correction).
Noble et al. Page 15
Nat Neurosci. Author manuscript; available in PMC 2015 November 01.
Author M
anuscriptA
uthor Manuscript
Author M
anuscriptA
uthor Manuscript

Figure 2. Family Income is Logarithmically Related to Cortical Surface Area (N=1099)A. Multiple regression showed that, when adjusting for age, age2, scanner, sex, and genetic
ancestry, family income was significantly logarithmically associated with children’s total
cortical surface area, such that the steepest gradient was present at the lower end of the
income spectrum (β = −0.19; p = 0.004). Income data are presented here on the
untransformed scale, fitted with a logarithmic curve, to enable visualization of this
asymptotic relationship. This differential rate of change is visualized with the brain maps,
where the steepest change in cortical surface area per unit income is visualized with warm
Noble et al. Page 16
Nat Neurosci. Author manuscript; available in PMC 2015 November 01.
Author M
anuscriptA
uthor Manuscript
Author M
anuscriptA
uthor Manuscript
colors and the shallowest change in cortical surface area per unit income is visualized with
cool colors. B. When adjusting for age, age2, scanner, sex, and genetic ancestry, ln(family
income) was significantly associated with surface area in widespread regions of children’s
bilateral frontal, temporal and parietal lobes. Relationships were strongest in bilateral
inferior temporal, insula and inferior frontal gyrus, and in the right occipital and medial
prefrontal cortex. C. When adjusting for age, age2, scanner, sex, genetic ancestry, and parent
education, ln(family income) was significantly associated with surface area in a smaller
number of regions including bilateral inferior frontal, cingulate, insula, and inferior temporal
regions and in the right superior frontal and precuneus cortex. Maps are thresholded at p < .
05 (FDR correction). More stringent FDR correction thresholds of .01 and .001 are shown in
Supplementary Fig. 1a–c.
Noble et al. Page 17
Nat Neurosci. Author manuscript; available in PMC 2015 November 01.
Author M
anuscriptA
uthor Manuscript
Author M
anuscriptA
uthor Manuscript
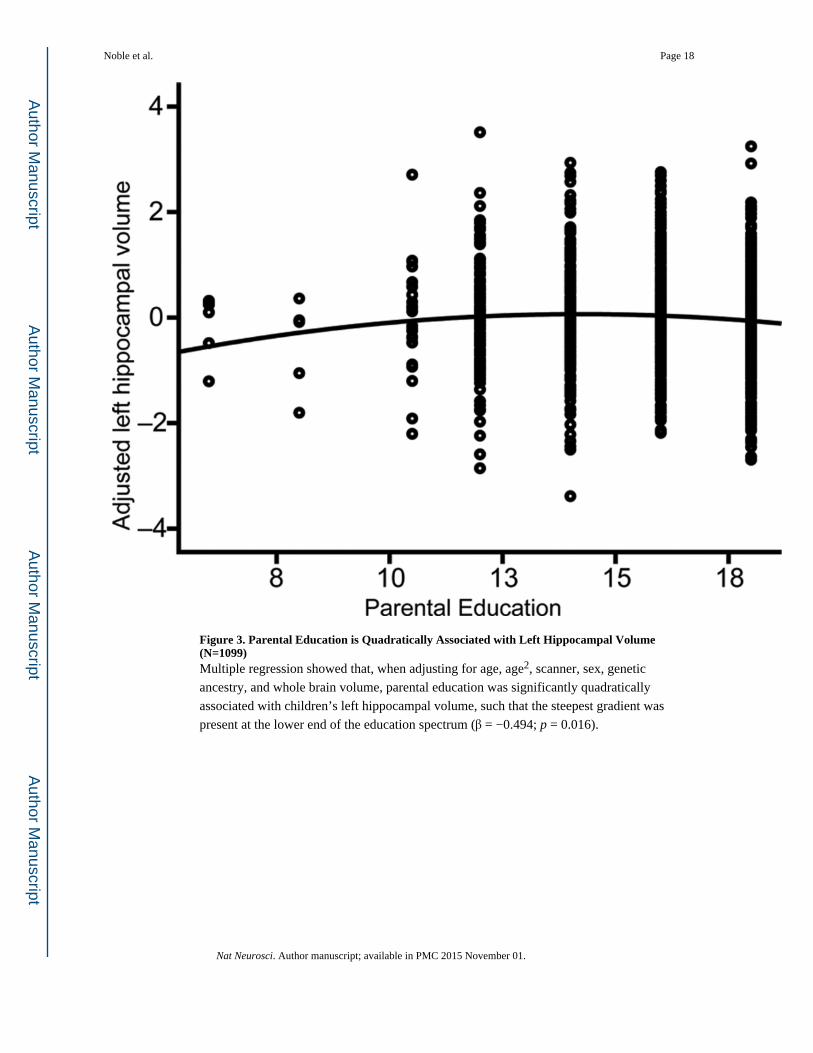
Figure 3. Parental Education is Quadratically Associated with Left Hippocampal Volume (N=1099)Multiple regression showed that, when adjusting for age, age2, scanner, sex, genetic
ancestry, and whole brain volume, parental education was significantly quadratically
associated with children’s left hippocampal volume, such that the steepest gradient was
present at the lower end of the education spectrum (β = −0.494; p = 0.016).
Noble et al. Page 18
Nat Neurosci. Author manuscript; available in PMC 2015 November 01.
Author M
anuscriptA
uthor Manuscript
Author M
anuscriptA
uthor Manuscript

Author M
anuscriptA
uthor Manuscript
Author M
anuscriptA
uthor Manuscript
Noble et al. Page 19
Table 1
Sample demographics (N=1099)
Mean (SD; Range) or N (%)
Age 11.9 (4.9; 3–20)
Sex
Female 531 (48.3%)
Male 568 (51.7%)
Average parent education (years) 15.6 (2.3; 6–18)
Family income $97,640 ($76,768; $4500–$325,000)
Genetic ancestry
African 0.12 (0.26; 0–1)
American Indian 0.05 (0.11; 0–0.832)
Central Asian 0.02 (0.12; 0–1)
East Asian 0.16 (0.31; 0–1)
European 0.64 (0.37; 0–1)
Oceanic 0.01 (0.03; 0–0.254)
Note: Genetic ancestry = mean, SD and range across all subjects of the estimated proportion of genetic ancestry for each reference population
Nat Neurosci. Author manuscript; available in PMC 2015 November 01.

Author M
anuscriptA
uthor Manuscript
Author M
anuscriptA
uthor Manuscript
Noble et al. Page 20
Table 2
Associations between parent education, family income, and cortical surface area
β t p
Model 1 (Adjusted R2 = .381)
Age 1.595 7.460 < .001
Age2 −1.384 −10.408 < .001
Sex −.463 −19.206 < .001
Scanner 1 .001 −.010 .992
Scanner 2 −.103 −3.55 < .001
Scanner 3 −.107 −3.19 .001
Scanner 4 −.031 −1.21 .225
Scanner 5 .060 1.80 .071
Scanner 6 .084 2.04 .041
Scanner 7 .001 .02 .982
Scanner 8 .071 2.15 .032
Scanner 9 .055 2.19 .029
Scanner 10 .017 .65 .514
Scanner 11 .031 .94 .350
Scanner 12 .017 .63 .528
GAF African −.213 −7.731 < .001
GAF American Indian −.046 −1.664 .096
GAF East Asian −.003 −.091 .927
GAF Oceanic .026 .902 .367
GAF Central Asian −.070 −2.819 .005
Education .141 2.164 .031
Age*Education −.135 −.813 .416
Model 2 (Adjusted R2 = .387)
Age 1.667 5.726 < .001
Age2 −1.328 −10.034 < .001
Sex −.460 −19.173 < .001
Scanner 1 −.001 −.037 .970
Scanner 2 −.107 −3.695 < .001
Scanner 3 −.112 −3.341 .001
Scanner 4 −.033 −1.277 .202
Scanner 5 .051 1.558 .119
Scanner 6 .079 1.942 .052
Scanner 7 −.006 −.189 .850
Scanner 8 .066 2.005 .045
Scanner 9 .051 2.021 .044
Scanner 10 .011 .413 .679
Scanner 11 .021 .638 .524
Scanner 12 .009 .341 .733
Nat Neurosci. Author manuscript; available in PMC 2015 November 01.

Author M
anuscriptA
uthor Manuscript
Author M
anuscriptA
uthor Manuscript
Noble et al. Page 21
β t p
GAF African −.190 −6.730 < .001
GAF American Indian −.044 −1.603 .109
GAF East Asian .001 .032 .975
GAF Oceanic .036 1.241 .215
GAF Central Asian −.069 −2.823 .005
Income .185 2.859 .004
Age*Income −.265 −1.006 .314
Model 3 (Adjusted R2 = .387)
Age 1.419 5.586 < .001
Age2 −1.335 −10.049 < .001
Sex −.461 −19.199 < .001
Scanner 1 −001 −.019 .998
Scanner 2 −.107 −3.658 < .001
Scanner 3 −.113 −3.341 .001
Scanner 4 −.033 −1.244 .196
Scanner 5 .056 1.693 .091
Scanner 6 .081 2.020 .047
Scanner 7 −.001 −.068 .976
Scanner 8 .068 2.059 .040
Scanner 9 .052 2.071 .039
Scanner 10 .012 .447 .648
Scanner 11 .023 .684 .489
Scanner 12 .011 .388 .676
GAF African −.185 −6.535 < .001
GAF American Indian −.036 −1.299 .192
GAF East Asian .004 .065 .887
GAF Oceanic .034 1.278 .237
GAF Central Asian −.073 −2.903 .003
Education .043 1.443 .149
Income .105 3.469 .001
Note: Sex = dummy coded as 0 (Male) & 1 (Female), GAF = genetic ancestry factor, Education = average parental education, Income = natural log (ln) of family income. N = 1099.
Nat Neurosci. Author manuscript; available in PMC 2015 November 01.

Author M
anuscriptA
uthor Manuscript
Author M
anuscriptA
uthor Manuscript
Noble et al. Page 22
Table 3
Associations between family income and cortical thickness
β t p Adjusted R2
.696
Age −.929 −4.537 < .001
Age2 .467 5.018 < .001
Sex .034 2.044 .041
Scanner 1 −.013 −.595 .552
Scanner 2 −.127 −6.227 < .001
Scanner 3 −.204 −8.672 < .001
Scanner 4 −.029 −1.621 .105
Scanner 5 −.086 −3.752 < .001
Scanner 6 −.140 −4.892 < .001
Scanner 7 −.048 −2.076 .038
Scanner 8 −.158 −6.835 < .001
Scanner 9 −.033 −1.858 .063
Scanner 10 −.069 −3.653 < .001
Scanner 11 −.117 −5.083 < .001
Scanner 12 −.068 −3.694 < .001
GAF African −.053 −2.644 .008
GAF American Indian −.052 −2.706 .007
GAF East Asian −.091 −4.293 < .001
GAF Oceanic −.063 −3.108 .002
GAF Central Asian −.047 −2.714 .007
Income .088 1.927 .054
Age*Income −.289 −1.565 .118
Note: Sex = dummy coded as 0 (Male) & 1 (Female), GAF = genetic ancestry factor, Income = natural log (ln) of family income. N = 1099.
Nat Neurosci. Author manuscript; available in PMC 2015 November 01.

Author M
anuscriptA
uthor Manuscript
Author M
anuscriptA
uthor Manuscript
Noble et al. Page 23
Table 4
Associations between parent education and left hippocampal volume
β t p Adjusted R2
.509
Age .681 3.450 .001
Age2 −.342 −2.785 .005
Sex −.044 −1.703 .089
Scanner 1 .003 −.103 .918
Scanner 2 .133 4.810 < .001
Scanner 3 .207 6.336 < .001
Scanner 4 .065 2.801 .005
Scanner 5 .017 .578 .564
Scanner 6 .064 1.767 .077
Scanner 7 .096 3.267 .001
Scanner 8 .042 1.422 .155
Scanner 9 −.004 −.178 .859
Scanner 10 .059 2.489 .013
Scanner 11 .092 3.137 .002
Scanner 12 .021 .892 .373
GAF African −.046 −1.798 .072
GAF American Indian .022 .871 .384
GAF East Asian −.031 −1.162 .246
GAF Oceanic .040 1.579 .115
GAF Central Asian −.027 −1.216 .224
Whole Brain Volume .700 22.65 < .001
Education .514 2.268 .024
Education2 −.494 −2.419 .016
Age*Education −.107 −.687 .492
Note: Sex = dummy coded as 0 (Male) & 1 (Female), GAF = genetic ancestry factor, Education = average parental education. N = 1099.
Nat Neurosci. Author manuscript; available in PMC 2015 November 01.