Embed Size (px)
Citation preview

FAMILY IMPACT ON ASIAN AMERICAN’S CAREER CHOICE
BY
XUHUA QIN
DISSERTATION
Submitted in partial fulfillment of the requirements for the degree of Doctor of Philosophy in Education Psychology
in the Graduate College of the University of Illinois at Urbana-Champaign, 2010
Urbana, Illinois Doctoral Committee: Professor James Rounds, Chair Associate Professor Lisa Spanierman, Contingent Chair Associate Professor Sumie Okazaki Gail Rooney, Ph.D.
CORE Metadata, citation and similar papers at core.ac.uk
Provided by Illinois Digital Environment for Access to Learning and Scholarship Repository

- ii -
Abstract
Based on census data, Asian Americans are overrepresented in some occupations
(e.g. science, professional, and technology) while being underrepresented in others (e.g.,
production, entertaining, social and humanistic field). Recent scholarship shows that
vocational interests are less related to Asian American’s career choice. Asian American
might choose their career based on their family’s mission rather on their own interests,
which may lead to occupational incongruence. Family influence on Asian Americans’
career development and career choice has been less studied, despite acknowledgements
of its importance. What are good indicators for family influence and how these indicators
separately (or as a whole) impact Asian Americans are still unclear. Based on literatures,
three cultural specific indicators (intergeneration conflict, family obligation, and
perceived opportunities) were chosen for further examination. The purpose of the present
study was to provide empirical evidence on how these three variables impact Asian
American young adults’ career choice and occupational congruence. The present study
was also aimed at examining the current pattern of occupational segregation among Asian
Americans. 249 Asian Americans completed a questionnaire regarding their career choice
and family influence. The results indicated that intergenerational conflicts and perceived
opportunity was negatively associated with interest-choice congruence, and they
functioned as a barrier to career choice. Family obligation, instead, functioned as a
positive contributing factor to interest-choice congruence. In addition, participants’
reported majors and preferred occupations were coded into RIASEC categories. The
patterns of selected majors and preferred occupations reflected occupational segregation.

- iii -
Interest-choice congruence was significantly higher in atypically represented majors
(Artistic, Social major) than in traditionally over represented majors (Realistic,
Investigative, and Enterprising major). These findings provided evidence for Relative
Functionalism proposed by Sue and Okazaki (1990). Finally, significant results were
found for congruence and its correlation with family variables across acculturation,
generation status, RIASEC major/occupation, gender, and parents’ education. The
meaning of these research findings to occupational segregation and other considerations
were discussed.

- iv -
To my son Jaden To Yizhou
To my mother Xueying Li and my father Yongxin Qin
Deepest thank to my advisor James Rounds for his support, trust, and help Thank Qing Zhou for her help with data collection

- v -
Table of Contents List of Tables................................................................................................................... vii List of Figures................................................................................................................. viii Chapter I Introduction ......................................................................................................1
Prelude....................................................................................................................1 Occupation Segregation.........................................................................................2 Occupational Congruence.....................................................................................5 Family Influence on Occupational Congruence..................................................7 Family Obligations...............................................................................................12 Perceived Opportunities......................................................................................13 Intergenerational Conflicts .................................................................................15 Acculturation and Occupational Congruence...................................................17 Summary...............................................................................................................19
Chapter II Method ...........................................................................................................22
Pilot Study.............................................................................................................22 Participants and Recruitment.............................................................................23 Current Data Set Characteristics.......................................................................25 Measures...............................................................................................................29 Data Analysis........................................................................................................47
Chapter III Results ..........................................................................................................50 Descriptive Statistics............................................................................................50 RIASEC Majors and Occupations.....................................................................52 Participants’ Profile on Negotiating...................................................................52 Congruence Results.............................................................................................54 Correlation Between Congruence and Variables..............................................65 Summary With Highlighted Results..................................................................71
Chapter IV Discussion.....................................................................................................74
Occupation Segregation.......................................................................................74 Major/Occupation Congruence and Relative Functionalism ..........................76 Family Impact on Career Choice.......................................................................79 Gender Difference................................................................................................81 Limitations of the Study and Future Research.................................................83
References.........................................................................................................................86
Appendix A Figures.........................................................................................................94

- vi -
Appendix B Tables.........................................................................................................100
Appendix C Pilot Study Questionnaire........................................................................115
Appendix D Questionnaire............................................................................................117

- vii -
List of Tables
Table Page B1 Participants’ Cultural Heritage...........................................................................100 B2 Illustrative Weights for Assessing Agreement Between Two
Three-letter Codes...............................................................................................101
B3 Summary Statistics of Measures..........................................................................102 B4 Correlation of Measures......................................................................................103 B5 Summary of Two Types of Congruence With Three Congruence
Indices..................................................................................................................104 B6 Correlation Between Congruence Indices...........................................................105 B7 Results of the ANOVA for Congruence Indices Across RIASEC
Majors..................................................................................................................106
B8 Mean Comparison Between Each Pair of RIASEC Majors.................................107 B9 Mean Comparison Between Generation Status...................................................108 B10 Correlation Between Congruence and Acculturation..........................................109 B11 Mean Comparison of Occupation-interest Congruence Between
Each Pair of American Acculturation Levels......................................................110
B12 Correlation Results Between Occupation-interest Congruence and Three Variables Across Different Gender Groups..............................................111
B13 Correlation Results Between Occupation-interest Congruence and Three Variables Across RIASEC Occupations....................................................112
B14 Correlation Results Between Occupation-interest Congruence and Three Variables Across RIASEC Majors………………………….....................113
B15 Correlation Results Between Occupation-interest Congruence and Three Variables Across Parents’ Education........................................................114

- viii -
List of Figures
Figure Page
A1 Holland’s Hexagonal Model ..................................................................................94
A2 Percentages of RIASEC Majors/Occupations .......................................................95
A3 Mean of Major-Interest Congruence across RIASEC Majors ...............................96
A4 Mean of Congruence across Generation Status .....................................................97
A5 Mean of Congruence across Asian Acculturation .................................................98
A6 Mean of Congruence across American Acculturation ...........................................99

1
Chapter I
Introduction
Prelude
Based on census data, Asian Americans are overrepresented in some occupations
(e.g. science, professional, and technology) while being underrepresented in others (e.g.,
production, entertaining, social and humanistic field) (Leong & Hardin, 2002; Leong &
Gupta, 2007; Fouad, Kantamneni, Smothers, Chen, Fitzpatrick, & Terry, 2008; Tang,
Fouad, & Smith, 1999). Fouad et al. (2008) cited the U.S. Bureau of the Census data in
2007 and summarized that although Asian American comprise only 4% of US population
they represent 25% of computer engineers, 30% of medical scientists, 17% of physicians,
and 14% of dentists, but only 1% of social service workers. Major career development
theories (e.g., Holland theory of personality types and work environments, social
cognitive career theory) assumed that vocational interests are the primary factors in
determining career choice (Holland, 1997), which lead the traditional research on Asian
Americans’ career choice focusing on vocational interest (e.g., Day & Rounds, 1998).
Nevertheless, recent scholarship shows that vocational interests are less related to Asian
American’s career choice (Leong & Gupta, 2007; Leong & Hardin, 2002). Asian
American might choose their career based on their family’s mission rather on their own
interests (e.g., Leong, 1998; Leong & Gupta, 2007; Tang et al., 1999). Tang et al. (1999)
examined the relationship between individual’s vocational interests, self-efficacy, family
background, and acculturation with career choice among 187 Asian American college

- 2 -
students. Their results indicated that interests were not related to Asian American’s career
choice but self-efficacy, family background, and acculturation did impact career choice.
Tang’s et al. (1999) results were replicated with a more homogeneous sample of South
Asian American students (Castelino, 2005). Castelino, in his dissertation, replicated Tang
et al.’s study and asserted that interest was not related to South Asian American students’
career choice but family factors were related.
The purpose of the present study is to provide research to further explore family
variables and their impacts on Asian American students’ career choice. The outcome of
choosing certain occupations rather than others was measured by the congruence between
students’ interest and actual career choice. Examining the interest-choice congruence and
understanding more about contributing factors will help career counselors explore other
avenues with Asian American clients given that the traditional way of suggesting career
options based on matching individual interest with occupational environment may not be
appropriate for Asian American clients.
Occupation Segregation
Occupation segregation in Asian American population has long been documented.
An early study (Sue & Kirk, 1972, cited in Leong & Serafica, 1995) of Chinese-
American first-year college students at University of California, Berkeley, showed that
compared to other freshmen, Asian Americans expressed more interest in physical
sciences, applied technical fields, and business occupations and less interest in social
sciences, aesthetic cultural field, and verbal linguistic vocations. Similar patterns were

- 3 -
observed from other studies. For example, Hsia (1988) analyzed the data from nine major
occupational groupings and found that compared to Euro-Americans Asian Americans
were more likely to be in three areas: professional (18% vs. 12.8%), technical (5.5% vs.
3.1%), and service (15.6% vs. 11.6%). In contrast, fewer Asian Americans than Euro-
Americans were observed in three areas: sales (8.4% vs. 10.7%), production/craft (8.4%
vs. 13.4%), and operator/laborer (14.2% vs. 17.1%). As a benchmark study, Tang et al.
(1999) drew data from eight major universities in the eastern and Midwestern areas of the
United State. Among 187 students, 33.3% Asian American students were in science,
23.0% in business, 13.7% in social sciences, 5.9% in art, and 5.6% in others.
National wide studies also provided evidence for this trend of occupation
segregation. Leung, Ivey, and Suzuki (1994) in their study cited a survey conducted by
the National Science Foundation and National Research Council in 1989 with earned
doctorates by United States citizens. They reported that 28% of the doctoral degrees
awarded to Asian Americans were in engineering, 20% were in agricultural or biological
sciences, 12% were in physical sciences, and 3% were in computer and information
sciences. The census 2000 (Occupations: 2000) data further indicated that 44.6% of
Asian American labor of force chose to pursue Management, Professional, and related
occupations compared to European/White Americans (35.6%) or other racial minority
populations (e.g., African American, 25.2%; Hispanic or Latino, 18.1%) and quite above
the average percentage among the total labor of force (33.6%). Therefore, the census
2000 concluded that “Asians and non-Hispanic Whites (who reported no other race) were

- 4 -
more often in management, professional, and related occupations than people reporting
other races”.
All above sources highlighted three points. First, science, technical, and
professional occupations are overly represented by Asian Americans. Second, business
or enterprising occupations have gradually increased the numbers of Asian Americans,
although early data indicated that sales related occupations had a smaller representation
of Asian Americans. Third, services occupations were overrepresented by Asian
Americans in early years, but social science occupations were avoided by Asian
Americans. Leung et al. (1994) documented that only 5% of earned doctorates national
wide were in social science. They further argued that Asian Americans as a group may
prefer structured, logical, concrete, and impersonal occupations but not occupations that
require interpersonal interaction, and verbal or written expression/communication. Leong
and Gupta (2007) argued that some personality traits observed in Asian Americans may
contribute to such choice. They listed social anxiety and intolerance of ambiguity as
contributors to under-representation in social science area. However, more recent studies
showed some signs that compared to data prior to 1990s Asian Americans are more
willing to choose social science as their majors/occupations. The present study was aimed
at exploring whether the pattern of occupation segregation continues to demonstrate a
similar pattern in nowadays or it has already changed. Getting a clearer picture of current
pattern of occupation segregation would also help to understand the occupational
congruence/incongruence that observed in Asian Americans.

- 5 -
Occupational Congruence
Congruence in vocational psychology is defined as a match between one’s
needs/desire and situation rewards/supplies (Tinsley, 2000). Spokane, Meir, and Catelano
(2000) summarized a decade’s congruence literature from 1985-1999. They categorized
congruence as a concept into: occupational congruence (match between individual’s
interest/personality and occupational choice), environmental congruence (match between
one’s personality and other individuals’ personalities within the same environment), skill
utilization congruence (match between one’s skills and job requirements), aspect-based
congruence (match between aspects of occupational characteristics and worker’s
preference of those aspects), within occupation congruence (match calculated in a
specific occupation), and avocational congruence (match between one’s leisure activities
and personality type). The present study focused on occupational congruence. Thus, the
word “congruence” or “incongruence” used in the present research referred to
occupational congruence, if it is not specifically noted.
Most previous studies of occupational congruence have focused on identifying
relations between occupational congruence and outcome variables such as job satisfaction,
job preference, job stability, and well-being (Hutchinson, 2000; Meir, 1995; Tinsley,
2000; Spokane et al., 2000). There were few studies examining cultural variables and
congruence (Spokane et al., 2000). Spokane et al. (2000) reported only one study on
Asian-cultural investigation of congruence, the study conducted by Tanaka and Ogawa
(1986) on examining person-environment fit among 117 retired teachers. Tanaka and
Ogawa (1986) examined the correlation between within occupation congruence

- 6 -
(congruence calculated within all teachers) and a general satisfaction with employment.
They reported that within occupation congruence was not significantly related to
satisfaction. Spokane et al. (2000) concluded that “we still have relatively little (cross-
cultural data) upon which to base any firm conclusions in this area” (p.174).
Since Spokane et al (2000)’s summary few studies have examined congruence
and cultural factors. Most of congruence literature continued paying attention to the
association between congruence and a certain outcome variable, such as career choice
certainty (Tracey, in press), satisfaction (Meir & Melamed, 2005), work performance
(Tziner, Meir, & Segal, 2002), and wellbeing (Lachter & Meir, 2004). One of few studies
on cultural factors and congruence was conducted by Gupta and Tracey (2005). They
compared interest-choice congruence between 83 Asian Indian and 107 White/European
American students, and concluded that Asian Indians students evidenced less congruence
than White counterparts due to their adherence to Dharma culture in which family duty is
greatly expected. These results suggest that culture factors plays a role influencing ethnic
minority’s occupational congruence, and family duty is one of important culture factors
for Asian Indian Americans.
Understanding Asian Americans’ patterns of occupational congruence (or
incongruence) with career choice is important since vocational psychologists may
develop a better understanding of Asian American population and career counselors
could gain more insights on Asian American clients’ possible concerns/struggles. As
noted above, Asian Americans may choose their career based on family’s mission rather
than their personal interest (Leong, 1998; Tang et al., 1999). Asian families, especially

- 7 -
immigrant families, feel the pressure to immerse into mainstream society by expecting
their children to choose well paid occupations (Chung & Bemak, 2007). Asian American
students report feeling torn when selecting a career based on their personal choice rather
than on parents’ academic expectation (Inman & Yeh, 2007; Ma & Yeh, 2005; Okubo,
Yeh, Lin, Fujita, & Shea, 2007; Sung, 1985). Asian American students are more likely to
choose majors and occupations to satisfy their parents, despite their inclination to work in
different fields. Therefore, I expect that Asian American students present a low to
moderate level of interest-choice congruence. In addition, I hypothesized that Asian
American students’ interest-choice congruence varies across majors. Asian American
students in more traditionally represented areas (e.g., Engineering) may have lower
interest-choice congruence compared to students in more atypically represented areas
(e.g., arts, psychology) who may have higher occupational congruence.
Family Influence on Occupational Congruence
Asian families have been considered as collective in orientation, emphasizing
interdependency and the priority of social obligations and duties over individual desires
(Ho, 1994; U.Kim & Choi, 1994; Triandis, Bontempo, Villareal, Asai, & lucca, 1988;
cited in Okagaki & Bojczyk, 2002; Yee et al., 2007). Family factors have long been
considered as influential variables in many aspects of Asian Americans’ life (Chung,
2001; Sue & Sue, 2003), such as mental well beings (Inman & Yeh, 2007), academic
achievement (Slaughter-Defoe et al. 1990; Sue & Okazaki, 1990; Tseng, Chao, &
Padmawidjaja, 2007), and career decision making (Ferry, Fouad, & Smith, 2000; Okubo,

- 8 -
Yeh, Lin, Fujita & Shea, 2007). It is believed that family has a strong influence on career
choices of Asian Americans (Leong & Chou, 1994; Leong & Gupta, 2007; Yee et al.
2007).
From a younger family member’s perspective, Leong & Chou (1994) stated that
Career choice and career advancement may be seen more as a means of providing for one’s own family, helping ones siblings, and fulfilling one’s responsibility to care for parents in their old age than as ways of implementing self attributes (p.140).
From a parent’s perspective, continuous monitoring, training, and guiding children is
essential part of being an Asian parent (Okagaki & Bojczyk, 2002). Scholars (Chao &
Tseng, 2002; Yee et al., 2007) argued that in Asian family systems intensive guidance
and restrict training of one’s children is perceived as an expression of parental concern,
duty, and love. If one does not heavily involved in making decisions for one’s children,
s/he may even be considered as not taking good responsibility to be a parent in Asian
culture. All above literature supported that parents’ impact on Asian American’s career
choice is highly valued in Asian families.
Despite acknowledgments of its importance, family impact on Asian Americans’
career development and career choice has been less studied compared to studies on other
areas (e.g., well being, academic achievements). Few empirical studies have been
conducted in this area (Whiston & Keller, 2004), which has led to repeated calls for more
research addressing family impact on Asian American’s career issues (Leong & Serafica,
1995; Leong & Hardin, 2002; Leong & Gupta, 2007). Regardless of a small amount of
empirical studies, scholars (e.g., Tang et al., 1999; Gupta & Tracey, 2005; Yee,
- 9 -
DeBaryshe, Yuen, Kim, & McCubbin, 2007) have agreed that family does greatly impact
Asian Americans’ career choice, but in what way and to what extent does family play a
role is still unclear. No consensus has been reached on what are good indicators for
family influence and how these indicators separately (or as a whole) impact Asian
Americans’ career choice.
Previous studies have examined different indicators of family influence. For
example, Tang et al. (1999) selected parents’ involvement as an indicator for family
influence. They measured parents’ involvement by asking eight questions on a five-point
scale, such as “How often have your parents or any family members discussed your
career plans with you?”, “Have your parents asked you to carry on the family tradition?”,
“How much do they listen to your opinion about career plans?”, “Have your parents
pressured you to take a job that is financially secure?”, “Have your parents forced you to
follow their choice of occupations for you?”, “Have your parents provided you only the
information of the job that they want you to pursue?”, “Have they compared you with
others who are successful in certain occupations?” (Tang, 1999, p.147). A path analysis
yielded complex results indicating that family’s involvement significantly impacted
career choice although it did not impact interest. It is notable that family’s involvement
was defined as a broad concept in Tang et al.’s study. The eight items were very diverse,
ranging from the frequency of family discussion of career related topics to values that
family may reinforce onto next generation. The reported reliability among these items
was low (α = .59). Tang et al. further called for more study on family variables and stated
that “A valid instrument to measure family background variables is also needed” (p.154).

- 10 -
Another study conducted by Ferry, Fouad & Smith (2000) examined the role of
family context in a Social Cognitive Model for career related choice behaviors within
math and science area. In an effort of identifying familial variables, they broke down
family influence into several different components. The final chosen familial variables
included role modeling, parental expectation, parental encouragement, parenting style,
socioeconomic status, parental math/science proficiency, and family relationship. They
examined 791 undergraduate students enrolled in psychology classes at two universities.
After a path analysis, they concluded that six out of seven familial variables did not yield
significant paths. Only parental encouragement as a familial variable was found to
significantly influence learning experience. It is notable that the participants in this study
were dominantly White/European American (85%) and Asian American only represent
4% of the sample. However, this study was a clear effort to break down familial factors
into more concrete variables.
Choosing indicators for familial variables has continued to be a theoretical and
practical concern for research. More recent studies started to identify a few concrete
variables. Lee (2009) in her dissertation examined factors that influence career choice
among Asian American social workers. Lee chose family immigration status as a familial
variable. With a total of 370 Asian American social workers that participated in the study,
Lee concluded that family immigration status significantly impacted the perception of
career barriers, which in turn impacted the choice of being a social worker. Barcebal
(2009) explored acculturation, emotion, and career choice in Filipino American women

- 11 -
and concluded that no statistical significant differences were found across generation
status on the frequency of choosing certain career field.
A recent qualitative study conducted by Fouad, Kantamneni, Smothers, Chen,
Fitzpatrick, and Terry (2008) shed some lights on a systematic way of looking at family
influence on career choice. Fouad et al. (2008) interviewed 12 Asian Americans who
were in the workforce and employed for at least five years. They summarized seven
domains that influence Asian American’s career decision making, among which family is
the top domain they listed. The rest of six domains were cultural influence, external
influence, career goals, role models, work values, and self-identity. Within family domain,
they further listed four sub-areas: family expectation, support by family, family
obligation, cultural expectations of roles. In their cultural influence domain, perceived
opportunity and gender are two of sub-areas. They further argued that family and culture
were the only domains that all participants agreed on as the influencing their career
choices.
The present study selected family obligation from the family domain and
perceived opportunity from cultural domain for further examination. In addition,
intergeneration conflict was also chosen as one of family factors to be further examined
because Asian Americans are highly interdependent and family is the key place where
values of interdependency are practiced and maintained. The relationship between
parents and children relates to Asian fundamental values. Intergeneration conflict (one
format of intergeneration relationship) was suggested to be an influential factor that
impacting different aspect of Asian American’s life.

- 12 -
Family Obligations
Family obligation is one of core values that is emphasized in Asian culture (Yee
et al., 2007). Family obligation relates to Confucian ethics, a perspective that emphasizes
obligation to others rather than individual rights, and a fundamental factor that impacts
family dynamic in China, Japan, and Korea (Okagaki & Bojczyk, 2002). It is believed
that the family interests take precedence over individual member’s interests, and children
of the family are expected to obey elders and participate in maintaining the household
(Fuligni, Yip, & Tseng, 2002). Yee et al. (2007) further argued that family obligation
includes both attitudinal and behavioral responsibilities, in which children are expected to
show respect and affection for older family members, seek elder’s advice and accept their
decision, and keep up with needed assistance to family and emotional ties with elders
throughout their life.
The importance of family obligations perceived by Asian Americans is fully
recognized by scholars (e.g., Fuligni et al, 2002; Fuligni, Tseng, & Lam, 1999; Yee et al.,
2007). For example, Fuligni et al (2002) pointed out that Chinese American adolescents
reported more importance in supporting and assisting family household than their
counterparts from European background. Family obligations may be perceived differently
among different individuals, varying from a more explicit way such as how much time to
spend with family to a more hidden way such as feeling obligated to bring up family’s
status by taking a well paid job.
Yee et al. (2007) argued that family obligation can function as a protection for
Asian American children when they select majors/careers since their career path has been

- 13 -
filtered to a relatively “safe” direction where networking and role models have been
established for them by elders in their family system. However, family obligation can
also function as a barrier to Asian American children in that obligations may hinder
children from pursuing their true passion if their choices are quite different from what
elders have chosen for them. No previous studies have been identified on family
obligation as a support or a barrier to Asian Americans’ career choice. Another purpose
of the present study was to examine the association between family obligation and
interest-choice congruence. A negative association would suggest that family obligation
functions as a barrier to career choice, while positive association would suggest that
family obligation functions as a support to career choice. I hypothesized that family
obligation is a barrier to career choice. More specifically, I hypothesized that interest
would have stronger association with career choice when perceived family obligations
were low and interest would have weaker association with career choice when perceived
family obligations were high. Examining the relationship among family obligation,
vocational interest, and career choice could be a possible way to explain the lack of
relation between Asian Americans’ vocational interest and career choice.
Perceived Opportunities
Fouad et al. (2008) identified seven domains that influence Asian Americans’
career decision making. Besides family factors they hypothesized that cultural influence
is another aspect found to be important in career-decision making. In this cultural
influence domain, perceived opportunity is one of sub-categories.

- 14 -
Nguyen and Huang (2007) pointed out that “U.S. history is replete with incidents
of social disadvantage for Asian Americans, due to racism, prejudice, discrimination, and
oppression” (p.91). They indicated that the social hierarchy and structure has caused
residential, economic, social, and psychological segregation. Economic segregation
involves persistent employment discrimination in hiring and pay. Residential segregation
reflects a strategy of grouping a set of resources together to cope with externally imposed
restrictions and limitations on choice. This in turn results in having many Asian
American children grow up in an inhibiting environment, in which they only perceive
limited occupation opportunities.
Similarly, Leong and Hardin (2002) pointed out that Asian Americans are likely
to encounter barriers to success due to racism and discrimination based on perceived or
real experiences. They cited Woo’s (2000) article explaining that the experienced barriers
for Asian Americans to advance in organization are similar to the “glass-ceiling effect”
documented for women. Leong and Hardin (2002) also stated that assuming equal
opportunity and choices for all individuals regardless their ethnic background is not
realistic. They argued that minority status may influence career interest by affecting
activities and occupations to which individuals are exposed. Moreover, Sue and Okazaki
(1990) noted that Asian Americans experience and perceive limited mobility in areas
such as sport, politics, and entertaining, in which achievements do not heavily rely on
education level. Therefore, Asian Americans intent to choose career areas that heavily
rely on education level because those areas are perceived among Asian Americans to
have more opportunities for success.

- 15 -
These studies documented that Asian Americans perceive limited opportunities
that may then impact their vocational interest and later career choices. Leong and Hardin
(2002) summarized that exploring how perceptions of limited opportunities due to one’s
minority status would be important to consider when explaining the overt categories of
minority membership. In responding to Leong and Hardin’s (2002) call on designing
studies with cultural specific variables, I chose to include perceived opportunities as a
variable and to examine the association between perceived opportunities and interest-
choice congruence. I hypothesized that the greater perception of limited opportunity, the
lower the interest-choice congruence.
Intergenerational Conflicts
Scholar (Drachman, Kwon-Ahn, & Paulino, 1996; Ying & Chao, 1996) have
observed that Asian American families suffer from intergeneration conflict or tension
between immigrant parents and their children. Compared to European American
counterparts, levels of intergenerational conflict were significantly higher among Asian
American college students (Tsai-Chae & Nagata, 2008). Intergeneration conflicts have
been explained as an acculturation gap, which due to the different rate of acculturation, in
addition to the typical generation gap between immigrant parents (or parents strongly
adhere to traditional culture) and their U.S.-raised children (Lee, Choe, Kim, & Ngo,
2000). Intergeneration conflict also reflects generational differences in cultural
orientation (Tsai, Chentsovaa-Dutton, & Wong, 2002). Lee et al. (2000) noted that
intergenerational conflicts can occur in many domains of parents-children interactions,

- 16 -
such as martial, occupational, economic, and social domains. Few studies have
investigated the area of intergenerational conflicts and career choice. Despite limited
studies, scholars (e.g., Chung, 2001) reported that immigrant parents want their children
to pursue occupations that would help bringing up the whole family’s social economic
status. However, their children may not necessarily want to pursue such occupations. The
intergenerational conflict may thus occur over competing desires. However, given the
strong Asian value of respecting authority and submitting to the wisdom of the elders,
Asian American students are more likely than their European American counterparts to
follow parental guidance (Leong & Gupta, 2007).
The importance of obeying parents’ guidance is further described in filial piety, a
critical and fundamental value emphasized in Asian culture. Filial piety refers to
obeying and honoring one’s parents, providing for the material and mental well-being of one’s aged parents, performing the ceremonial duties of ancestral worship, taking care to avoid harm to one’s body, ensuring the continuity of the family line, and in general conducting oneself so as to bring honor and not disgrace to the family name. (Ho, 1994; cited in Okagaki & Bojczyk, 2002)
Obeying elders is believed to be an expected way to fulfill family obligations and filial
piety. If an elder family-member wants younger members to pursue certain career path,
younger members are expected to do so; otherwise, they can be accused for not having
filial piety, an important misbehavior in traditional Asian culture. Therefore, compared
to other formats of parent-child relationship, intergenerational conflicts are more likely to
cause the direct sacrifice of personal interest to follow parental guidance, which may in
turn lead to low interest-choice congruence. I hypothesized that intergeneration conflicts
would impact the association between Asian Americans’ interest and career choice. More

- 17 -
specifically, I hypothesized that interest would have stronger association with career
choice goals when intergeneration conflicts were low and interest would have weaker
association with career choice when intergeneration conflicts were high.
Acculturation and Occupational Congruence
Many researchers (e.g., Byars & McCubbin, 2001; Fouad, & Bingham, 1995;
Kim, 2007; Leong & Hardin, 2002; Ponterott, Baluch, & Carielli, 1998; Tsai, Chentsova-
Dutton, & Wong, 2002) have suggested that acculturation is an important variable to
consider in studies of Asian Americans’ career development. Moreover, Yee, DeBaryshe,
Yuen, Kim, & McCubbin (2007) indicated that acculturation level needs to be considered
together with family influence when explaining how Asian American youth choose
careers. In Yee’s et al. (2007) review they concluded that Asian Americans are greatly
impacted by their families on choosing certain occupational pathways, “which is
specifically true among less acculturated families” (p.79). They cited Castelino’s 2005
study pointing out that immigrant families have a perception of which occupations can
effectively help family’s economic status thus strongly encouraged their younger family
members to pursue such occupations. Chung (2001) provided some evidence of the
association between acculturation and intergenerational conflicts. Based on the data from
342 Asian American college students, Chung found that Asian Americans who were
more acculturated reported experiencing less conflict with their parents in the areas of
education and career than low acculturated counterparts. In addition, Leong and Hardin
(2002) stated that less acculturated Asian Americans were more influenced by family

- 18 -
input while more acculturated Asian Americans were greatly impacted by personal
interests and individual strengths. They highlighted the importance of adding an
understanding of the effects of acculturation on career variables in Asian American’s
career studies. The present study included acculturation to understand the occupational
segregation and occupational congruence.
Acculturation, as a psychological structure, has historically been considered as a
unidimensional process in which gaining values and characteristic of host culture will be
in the cost of losing those of heritage culture (Berry & Annis, 1974; Szapocznik, Scopetta,
Kurtines, & Aranalde, 1978). More recent research recognize the complexity of the
acculturation and propose a bicultural concept of acculturation process in which adapting
to the host culture does not necessarily sacrifice the identification with heritage culture.
On the contrary, the preexistence of a minority community would help individuals to
maintain the culture of origin while accommodating to the host culture, therefore, two
identities can be co-existing (Kim, 2007). The bidimensional model proposed by Berry
(1980) stated that an individual can identify with both host and heritage culture, and the
development of acculturation to each culture is independent.
Tsai et al. (2000) argued that there is no one model fits all patterns of
acculturation of Asian Americans. They examined acculturation patterns of Chinese
Americans who were born in U.S. versus those who were born outside U.S. and came to
U.S. before age 12 versus those who came to U.S. after age 12. They concluded that the
unidimensional model represented the experience of the recent immigrants better and the
bidimensional model represented the experience of later generation better. Given that the

- 19 -
present research was focused on 1.5 and beyond generations, the bidimensional model
was used to measure participants’ acculturation level. The present research was aimed to
evaluating how different dimensions and levels of acculturation would impact Asian
American students’ interest-choice congruence. I hypothesized that Asian American
students with highly acculturated to Asian culture would show lower interest-choice
congruence given that they might sacrifice their interests to obey their parents’ guidance
on selecting major/occupations than those individuals who have lower acculturation level.
In addition, I hypothesized that Asian American students with higher level of
acculturation to American culture would show higher major/occupation-interest
congruence given that they have a higher chance to follow their own interest on selecting
major/occupations than those individuals who have lower acculturation level.
Summary
In summary, Asian Americans demonstrate occupational segregation that may be
impacted by family and cultural factors. The present study primarily examined family
influence on Asian American’s career choice, so that the results would enrich the
understanding of occupational segregation among Asian Americans. The research
questions were: (a) Do Asian Americans present a pattern of interest-choice
incongruency (as a result of occupational segregation), (b) Is interest-choice
incongruency higher in majors that Asian Americans are traditionally overly represented
and lower in majors that are atypically represented by Asian Americans, (c) Do family
factors (intergeneration conflicts and family obligations) directly impact interest-choice

- 20 -
incongruence, and (d) Do perceived opportunity and acculturation directly impact
interest-choice incongruence?
I examined six hypotheses:
Hypothesis 1. Asian American students’ occupational congruence varies across
majors (Hypothesis 1a). Students in more traditionally represented areas (e.g.,
Engineering) have lower occupational congruence, while students in more atypically
represented areas (e.g., arts, psychology) have higher occupational congruence
(Hypothesis 1b).
Hypothesis 2. Interest-choice congruence is also impacted by generation status.
The higher the generation status (meaning that the family stays in the U.S. for more
years/generations), the higher the interest-choice congruence.
Hypothesis 3. Acculturation impacts interest-choice congruence. Students that
have a higher acculturation level to Asian culture would have lower interest-choice
congruence than those who have a lower acculturation level to Asian culture. Students
that have a higher acculturation level to American culture would have higher interest-
choice congruence than those who have a lower acculturation level to American culture.
Hypothesis 4. Intergenerational conflict impacts interest-choice congruence. I
hypothesized that the greater the intergenerational conflicts, the lower the interest-choice
congruence; the less the intergenerational conflicts, the higher the interest-choice
congruence.
Hypothesis 5. Family obligation impacts interest-choice congruence. I
hypothesized that the greater the perceived family obligations, the lower the interest-

- 21 -
choice congruence; and the less the perceived family obligations, the higher the interest-
choice congruence.
Hypothesis 6. Perceived opportunity impacts interest-choice congruence. I
hypothesized that the greater the perceived limited opportunity, the lower the interest-
choice congruence; and the less the perceived limited opportunity, the higher the interest-
choice congruence.
The results of present research can help career counselors better understand Asian
Americans’ career behaviors and struggles to make career choices. It will provide another
avenue (e.g., family influence) for career counselors to consider besides identifying Asian
American clients’ vocational interest. Moreover, the results of present research would
further inform direct career intervention programs specific to Asian Americans.

- 22 -
Chapter II
Method
Pilot Study
A focus group interview was conducted to collect first-hand information on
interaction between parents and their Asian American children regarding career related
issues. Group members were 7 undergraduate Asian American students who registered
for a psychology research lab at a mid west university. I first asked each group member
to fill out a questionnaire which consisted of 10 open-ended questions (see Appendix C).
Then, the group members discussed their answers to the questions. Six out of seven
students reported that their parents impacted their career decision. When being asked how
their parents are involved in their decisions, some students talked about they were still
financially depended upon parents’ support, so parents decided which school they
attended. Some others talked about they would consider any advice their parents gave.
One student wrote “I want a successful career so I would be able to support them (my
parents) in the future”. Two students mentioned that their parents want them to be
financially stable and live in good life. Still another reported that her parents want her to
be a layer or a dentist or an architect. When being asked “what factors you may consider
when you choose your major”, students listed several things they considered such as
interest, job market, wage of the career, whether the occupation would bring up the way
of family, and what their parents suggest. Among all above factors, it seemed that being
able to financially provide family and consider parents or family’s need were of themes.

- 23 -
Some students said that they wanted to pay back to their parents. In addition, they
mentioned their perceptions of parents’ expectations are important as well. These above
themes confirmed the decision of including family obligation as a variable in the present
study.
Moreover, this writer asked students in the pilot study whether their parents’
expectations conflict with what they want to do. One third of students said “yes”. When
being asked whether students have other types of conflicts with their parents and whether
such conflict impact their career choice, five out of seven students answered the question
and four out of five said they have other conflicts with their parents (e.g., dating, who
they spend time with to study or hang out) but they were not sure whether such conflict
would impact their career choice. This exploratory result supported that intergeneration
conflicts commonly occur in Asian American families, but whether or not general
intergeneration conflict would impact students’ career choice still needs further
examination. This semi-structured interview helped to gain many inputs from Asian
American students. Feedbacks and inputs were used to develop item pools for the family
impact scale.
Participants and Recruitment
Participants were 249 Asian Americans drawn from a large west coast university
(a major university in the University of California system) and those who viewed a
website (Angryasianman.com ) that has Asian Americans as its target viewers.
Participants from the large west coast university were draw from students who enrolled in

- 24 -
an undergraduate subject pool of Psychology Department. Students in the subject pool
chose the present study among other research projects and indicated their interest of
participation by registering in prescreening. The prescreening questions asked students to
provide their age, ethnic identity, years in the U.S., and other personal information.
Students who were age 18 and identified as Asian American and immigrated to the U.S.
for more than 8 years were contacted with detailed information about the present study
and a link to the online questionnaire. Participants were granted 1 research credit upon
their completion of the questionnaire.
Participants recruited from viewers of Angryasianman.com website received no
compensation but they were encouraged to fill out the questionnaire to support research
on Asian Americans. The Angryasianamn.com is a website that usually attracts viewers
who are interested in political or/and cultural issues of Asian Americans in the U.S. The
website usually posts news either featuring Asian American individuals or social topics
that relate to Asian American community. Although the name of the website may lead to
biased impression, the website is not for men only and not for angry person only.
Participants in the current study that recruited from this website showed that these
viewers of the website were individuals who are young adults, graduate students or
individuals with a job. One out of third of the participants were female. Detailed
statistical representation of this data set is presented in the following session. The link to
the online questionnaire was provided in the invitation letter that was posted on the
Angryasianman.com website. The screening of valid participants was done after the data
was collected from this source.

- 25 -
The recruitment also included an effort of (a) emailing presidents/heads of Asian
American students’ organizations and asking for their permission to announce this
research opportunity on their list serve, and b) calling/emailing professors or counselors
on campuses and requesting them to forward the description of the research opportunity
and the link of online questionnaire to Asian American students.
Each participant completed an online questionnaire measuring his/her attitude
towards different activities and experiences of interacting with parents. The questionnaire
had 145 questions in total consisting of four measures: an interest measurement (Interest
Profiler Short Form; Rounds, Smith, Hubert, Lewis, & Rivkin, 1999), a set of family
impact scales (including intergeneration conflict items, family obligation items, perceived
opportunities items) that were developed specifically for this research, and an
acculturation scale (Vancouver Index of Acculturation [VIA]; Ryder, Alden, & Paulhus,
2000), and a demography questionnaire. It took 40 minutes in average to complete this
questionnaire.
Current Data Set Characteristics
General information. The data was primarily collected from two sources:
audience of Angryasianman.com (a website with Asian Americans as its targeted
viewers), and students in a Department of Psychology experiment pool at a large west
coast university. During the data collection, 606 individuals reviewed the online
questionnaire through the Angryasianman.com, 201 (33.17%) participants submitted their
answers, and 141 (23.27%) responses were valid. The data collected through the

- 26 -
university setting had a higher return rate. There were 165 individuals that reviewed the
questionnaire, 117 (70.91%) students submitted their answers, and 108 (65.45%)
responses were valid. The invalid data included those who finished only few questions in
the questionnaire, or finished less then two subscales, or were repeated answers from the
same individual. Those responses indicating that the participants were under 18 or were
not identified as Asian American were also excluded from the data set.
Age, gender, and academic class. The 249 valid participants are from 18 to 45
years old. The average age in this sample was 22.16 (SD = 4.88). There were 88 (35.34%)
participants aged from 18 to 19, 140 (56.22%) participants aged between 20 to 29, and 21
(8.43%) participants aged between 30 to 45. Two samples from different sources
indicated a different pattern. Within the university sample (108 valid data), participants
are from 18 to 25 years old. There were 45 (41.7%) participants aged 18, 21 (19.4%)
aged 19, 26 (24.1%) aged 20, and 16 (14.8) aged between 21 and 25. The website sample
showed a wider range of age with majority participants aged between 22 to 26. More
specifically, within the website sample (141 valid data), participants are from 18 to 45
years old. There were 7 (5%) participants aged 18, 15 (10.6%) aged 19, 15 (10.6%) aged
20, 15 (10.6%) aged 21, 54 (38.3%) aged between 22 to 26, 28 (19.8%) aged between 27-
34, and 7 (5%) aged between 35 to 45.
The 76 (30.5%) participants in total sample identified as male, 172 (69.1%)
participants identified as female, and 1 (.4%) identified as transgender. Two samples
from different sources indicated a similar pattern. Within the university sample, 34
(31.5%) identified as male, 73 (67.6%) participants identified as female, and 1 (.9%)

- 27 -
identified as transgender. Within the website sample, 44 (29.8%) identified as male, and
99 (70.2%) participants identified as female.
Sorting participants into their academic year, within total sample, 46 (18.5%)
participants were freshman, 34 (13.7%) participants were sophomore, 43 (17.3%)
participants were junior, 42 (16.9%) participants were senior, 38 (15.3%) participants
were graduate student, and 44 (17.7%) participants reported that they had graduated and
obtained a job now. Two separate samples showed a different pattern. Within the
university sample, 42 (38.9%) participants were freshman, 23 (21.3%) participants were
sophomore, 29 (26.9%) participants were junior, and 14 (13.0%) participants were senior.
Within website sample, only 4 (2.8%) participants were freshman, 11 (7.8%) participants
were sophomore, 15 (10.6%) participants were junior, 28 (19.9%) participants were
senior, 38 (27.0%) participants were graduate student, and 44 (31.2%) participants
reported that they had graduated and obtained a job now.
Cultural heritage and generation status. The present study asked participants to
specify their cultural heritage (e.g., Chinese, Korean) within their Asian American
identities. The reported cultural heritages included 14 sub-cultural groups. Some
participants identified with bi-cultural heritages. Table 1 presented a summary of all
reported cultural heritages. The top 6 sub-cultural groups were Chinese (n = 114, 45.8%),
Korean (n = 28, 11.2%), Filipino (n = 21, 8.4%), Vietnamese (n = 20, 8.0%), Taiwanese
(n = 15, 6.0%), and Japanese (n = 9, 3.6%). Two separate samples indicated similar patter
with slightly differences. Within university sample, the top 6 sub-cultural groups were
Chinese (n = 57, 52.8%), Korean (n = 15, 13.9%), Vietnamese (n = 9, 8.3%), Filipino (n

- 28 -
= 7, 6.5%), Indian (n = 6, 5.6%), and Taiwanese (n = 5, 4.6%). Within website sample,
the top 6 sub-cultural groups were Chinese (n = 57, 40.4%), Korean (n = 13, 9.2%),
Filipino (n = 14, 9.9%), Vietnamese (n = 11, 7.8%), Taiwanese (n = 10, 7.1%), and
Japanese (n = 9, 6.4%).
The present study also asked participants to identify their generation status. The
generation status was defined as follows: first generation meant that a participant was
born outside the U.S. and immigrated into the U.S. after age 16, the 1.5 generation meant
that a participant was born outside the U.S. and came to the U.S. after age 5, second
generation meant that a participant was born in the U.S. but one or both parents were first
or 1.5 generation, and third generation or beyond meant that the participant and parents
were born in the U.S. Most of participants in the present study within total sample were
second generation (n = 168, 67.5%), followed by 1.5 generation (n = 59, 23.7%), third
generation or beyond (n = 16, 6.4%), and first generation (n = 6, 2.4%). The two separate
samples showed a similar pattern. The second generation counted for two third of
participants (university sample: n = 73, 67.6%; website sample: n = 95, 67.4%). It
followed by 1.5 generation (university sample: n = 28, 25.9%; website sample: n = 31,
22.0%), third generation or beyond (university sample: n = 4, 3.7%; website sample: n =
12, 8.5%), and first generation (university sample: n = 3, 2.8%; website sample: n = 3,
2.1%).

- 29 -
Measures
Interest Profiler Short Form. Participants’ interest was measured by Interest
Profiler Short Form (IPSF). The IPSF, a short form, was developed from the long form of
the O*NET Interest Profiler (IP; Rounds, Walker, Day, & Hubert, 1999). The long form
of the Interest Profiler includes 180 items in total with 30 items each for six interest
categories (Realistic, Investigative, Artistic, Social, Enterprising, and Conventional)
defined by Holland (1997). The Cronbach alpha coefficients for IP, based on a sample of
1,061 individuals, ranged from .93 to .96 for the six RIASEC scales. The test-retest
reliability, based on a sample of 132 individuals, ranged from .81 to .92 for the RIASEC
scales. The concurrent validity of IP was examined by correlating the IP RIASEC scales
with the Interest-Finder (Wall & Baker, 1997; Wall, Wise, & Baker, 1996) corresponding
RIASEC scales. The correlations ranged from .73 to .84 for the six RIASEC scales. The
Interest Profiler Short Form (IPSF) was developed based on an effort to reduce the
administration time and ease the scoring process while maintaining reliability and
validity of IP.
The IPSF contains 60 items in total with 10 items per RIASEC type. Each item is
a work activity (See Appendix D for the IPSF). Several sample items were “Build kitchen
cabinets”, “Teach an individual an exercise routine”, and “Buy and sell stocks and
bonds.” These items were designed to explore individual’s vocational interests by rating
the extent to which an individual would like to do certain activities. Participants were
asked to rate each item based on a five-point scale with 1 indicating strongly dislike, 3
indicating Neutral, and 5 indicating strongly like. The IPSF was scored on the six

- 30 -
RIASEC scales and the three highest scores were converted into a three-letter Holland
code.
Choice goals. Choice goals were measure by two open-ended questions in the
demographic questionnaire. Participants were asked about their academic majors. If
undecided, they were instructed to list possible major(s) they would pursue. Also,
participants were asked about their career intention(s) and were instructed to give specific
occupation title(s) as their answers. If a participant gave more than one answer for their
majors or occupations, the first listed major/occupation was used as her/his answer. Each
major and occupation title was then coded into a three-letter Holland code, respectively.
For example, psychology major was coded as “ISE”. The occupation title “counseling
psychologist” was coded as “SIA”. The procedure for coding majors and occupations is
discussed below. The codes for majors and occupations were used later to compare with
each participant’s RIASEC code that obtained from IPSF (the interest measurement) for
major-interest congruence and occupation-interest congruence.
Procedure for coding occupations. One of main efforts in data analyses was to
code all participants’ self preferred occupations and parents’ expected occupations into
Holland three-letter codes. Rounds, McKenna, Hubert, and Day (2000) reminded
researchers that classifying occupational titles based on few raters’ rating may introduce
potential errors, which will in turn impact the following congruence computation. To
avoid errors caused by directly coding the occupational titles by one or few raters based
on their training of understanding Holland theory and coding system, the present study
chose to use existing code systems to classify occupations.

- 31 -
Occupations in the present study were coded based on the O*NET (Occupational
Information Network) online database. The O*NET system is a data base that was
developed by the US Department of Labor and Employment and Training Administration.
It currently includes 965 occupations. The O*NET data base provides for each
occupation its job descriptions, required skills/knowledge/abilities, Holland code, average
wage, projective needs in the job market within a few years, and etc. The Holland code
for each occupation provided in the O*NET was used in the present study. To get the
matched Holland code from the O*NET for each reported occupation title in the current
data, the coding procedure was conducted with following steps: this writer typed in one
reported occupation title in the O*NET database (http://online.onetcenter.org/), searched
for the Holland code for the occupation. However, some occupations could not be found
in O*NET with the exact type-in occupation title or there was only two-letter code
instead of three-letter code reported in O*NET for a specific occupation. In above
occasions, two rules were followed.
Rule 1. Use the alternative occupation with the highest relevant score to represent
the type-in occupation.
Some occupations reported by participants could not be found with the exact
occupation title in the O*NET data base. In such cases, the O*NET data base provided
several alternative occupation titles with a “relevant score” attached with each alternative
occupational title. The relevant score, a score ranging from 0 to 100, indicated to what
extend the alternative occupation title is relevant to or similar with the typed-in
occupation title. An alternative occupation title with its relevant score as 100 meant that

- 32 -
the alternative occupation title was exactly the same as the typed-in occupation. An
alternative occupational title with its relevant score as 0 meant that the alternative
occupation title was not similar at all with the typed-in occupation. The alternative
occupation title with the highest relevant score was selected as the replacement of the
type-in occupation title, and its Holland code was obtained to be used as the final code
for the typed-in occupation. For example, a reported occupation title from a participant is
“journalist”. When typing in “journalist” (the typed-in occupation) in the O*NET data
base, no exact occupation with the same occupation title came out, however; several
alternative occupation titles were listed, such as “reporters and correspondents,”
“broadcast news analysts,” “radio and television announcers,” and etc. Each alternative
occupation was presented with a relevance score indicating how much each of alternative
occupations was similar with the typed-in occupation (“Journalist”). The “reporters and
correspondents” had a relevant score of 100, while “broadcast news analysts” had a
relevance score of 90, and “radio and television announcers” had a relevant score of 87.
Therefore, the “reporters and correspondents” occupation that had the highest relevant
score was chosen and its Holland’s code was obtained to be used as the code for
“journalist”, which was “AEI”.
Rule 2. Check Occupational Interest Profiler (OIP) scores when O*NET provides
only two-letter code instead of three-letter code for an occupation.
It was notable that some occupations were presented with two-letter Holland code
in O*NET, which could not fully achieve the goal of coding all reported occupations in
the present study with three-letter codes. In these cases, the Occupational Interest Profiles

- 33 -
(OIP) was used to obtain the third letter of the code. OIP was an analyst ratings system
consisting six numerical scores for each occupation based on how descriptive and
characteristic the occupation was for each RIASEC environment defined by Holland. The
OIP was first developed in 1998 by Rounds, Smith, Huber, Lewis, and Rivkin (1999).
The latest revision was published in 2008 (Rounds, Armstrong, Liao, Lewis, & Rivkin,
2008). The OIP was an extended source to Holland code in the O*NET database in terms
of that it provided a complete profile based on six RIASEC ratings for an occupation. As
mentioned earlier, when the O*NET only provided a two-letter code for an occupation,
this writer checked the same type-in occupation in OIP data set and identified the third
highest score among six RIASEC ratings and then used it as the third letter code for the
occupation.
With above procedures and rules, participants’ reported “self preferred
occupation” and “parents expected occupation” were coded. Among the effort of coding
all self preferred occupations, 234 out of 249 self preferred occupations were coded with
three-letter Holland code and 15 out of 249 responses were not coded into Holland code
because participants reported that they do not know what they will pursue as occupations.
Among parents expected occupations reported by 249 participants, 153 out of 249
responses were coded with three-letter codes, and 96 out of 249 (38.55%) responses were
not coded into Holland code because participants did not give any occupation titles as
their answers. Instead, they provided some abstract ideas about what their parents
expected them to do. For example, some participants said “(my parents) expect me to
take a job that commands a high income along with social respects”; “any job they see as
- 34 -
lucrative and stable”, “something with high status”. Some others just said “(my parents
expect me to take) whatever I want”. Still others reported that “I don’t know” or “not
sure”.
Procedure for coding majors. Self reported majors indicated by 249 participants
were coded into three-letter Holland code as well. Majors in the present study were
coded based on the Educational Opportunities Finder (EOF), which was developed by
Rosen, Holmberg, and Holland in 1992. The EOF is the second edition of the College
Majors Finder, which was developed to provide Holland codes for majors in order to help
students to search majors based on matched vocational interest. The EOF was used with
the Self-Directed Search and the Vocational Preference Inventory, measurements for
vocational interest based on Holland RIASEC hexagonal model. The EOF presented 750
programs of study (major) with a three-letter code for each program of study (major). A
straightforward procedure was used to obtain RIASEC codes for majors reported in the
present study. This writer first identified a participant’s reported major, and then searched
the alphabetical listing of programs of study in the EOF. Once the major was located in
the list in the EOF, the three-letter code was obtained for the major. In cases that the
reported major could not be located in the EOF, which was rarely happened, the reported
major was searched online to identify its study contents. A most similar alternative major
was then assigned based on its study contents to replace the original reported major. This
alternative major was then searched in the EOF and the code for the major was obtained.
All 249 reported majors were coded with three-letter codes expect one participant
because the participant reported that s/he did not know her/his major yet.

- 35 -
Procedure for coding interests. In terms of coding for interests measured by
Interest Profiler Short Form into three-letter Holland code, the code was obtained based
on the result of comparing six RIASEC scale scores. The type (Realistic, Investigative,
Artistic, Social, Enterprising, Conventional) that has the highest score was coded as the
first letter, the type with second highest score was coded as the second letter, and the type
with the third highest score was coded into the third letter. For example, the scores for
RIASEC subscales for a participant were 16 (Realistic), 21 (Investigative), 47 (Artistic),
33 (Social), 18 (Enterprising), and 13 (conventional). Therefore, the Holland code for this
participant’s vocational interest is ASI. When having tie scores across RIASEC scales,
the following rules were used to assign the code.
Rule 1. If two or more RIASEC scales have tie scores when assigning the second
or the third letter code, the assigned letter was selected to reflect the nearest
hexagonal distance (in the RIASEC hexagonal model) to the previous identified
letter code.
For example, a participant’s six (6) RIASEC scale sores are 32 (Realistic), 41
(Investigative), 32 (Artistic), 28 (Social), 25 (Enterprising), and 34 (Conventional). The
first letter of Holland code is I, the second letter is C, and the third letter is R. Letter R is
assigned because comparing R and A (which have tie scores on these two subscales) R is
nearer than A to the second letter C (the previous identified letter code) in the hexagonal
model (see Figure 1 for the Holland hexagonal model). The same rule was applied when
tie scores occurred in assigning the second letter. When assigning the second letter, if two
tie scores occurred and one was assigned as the second letter, the other one was assigned

- 36 -
as the third letter. If three or more tie scores occurred in assigning the second letter, one
was assigned as the second letter based on the Rule 1, the third letter was selected
between the remaining two or more tie scores to reflect the nearest hexagonal distance (in
the RIASEC hexagonal model) to the second letter code. In the occasion that tie scores
occurred when assigning the first letter, the Rule 2 was applied.
Rule 2. If two or more RIASEC scales have tie scores when assigning the first
letter code, the letter was selected to match with the self-reported result of directly
ranking six RIASEC type.
In addition to IPSF measurement, all participants were asked to directly rank six
RIASEC type based on how much they like each set of descriptions of six RIASEC
categories. The participant’s responses on ranking these six (6) RIASEC type was
checked as the reference source, if tie scores occurred when assigning the first letter.
Among all tie scores, the type which has a closer distance in a hexagonal model with the
top ranked RIASEC type was selected as the first letter. For example, a participant’s six
(6) RIASEC scale sores are 36 (Realistic), 36 (Investigative), 29 (Artistic), 15 (Social),
21 (Enterprising), and 22 (Conventional). The highest scores are obtained on both R and I
type. This author then referred to the answers this participant gave to the question in the
questionnaire asking the participant to rank six type of activities based on their interest.
This participant ranked Realistic activities as the top interested activities. Therefore, the
Holland code for this person’s interest is RIA.
Congruence computation. Ever since Spokane (1985) reviewed eight methods of
calculating congruence, more congruence indices have been proposed (e.g., Brown &

- 37 -
Gore, 1994; Lent & Lopez, 1996; Young, Tokar, & Subich, 1998). Some of them use the
discrepancy between the corresponding one (or two, or three) letter code(s) of interests
and chosen occupations, while other indices are more complex assigning congruence
index based on the interrelationship among the RIASEC scores. No one index has proved
to be more valid than other indices. Tinsley (2000) advised that any study using
congruence indices needs to include 2 or 3 congruence indices. In responding to this
advice, the current study chose three methods of calculating congruence: C index, FLHD
index, and M index.
C index. “C Index” proposed by Brown and Gore (1994) is believed to be the
most sensitive to different out-of-order code comparisons, and is reported to be the only
symmetrically distributed index among all proposed indices (Brown & Gore, 1994;
Spokane, Meir, & Catalano, 2000). Tinsley (2000) also indicated that C index is one of
few indices that best captures the Holland RIASEC typology. To understand the rationale
of assigning values to letter comparisons in C index, it is crucial to understand J.
Holland’s (1973, 1997) trait theory and his hexagon. In Holland theory, individuals are
categorized as one of six types: Realistic(R), Investigative (I), Artistic (A), Social (S),
Enterprising (E), or Conventional (C). Holland and colleagues proposed a hexagon to
represent the inter-relations between the six interest categories, producing a circular
arrangement (see Figure 1). This configuration is often referred to as RIASEC model. In
this model, adjacent types (e.g., R and I) are more similar than alternate types (e.g., R and
A), and alternate types are more similar than opposite types (e.g., R and S).

- 38 -
According to Brown and Gore (1994), the “C Index” extends the Holland’s (1973)
first letter hexagonal distance measure (FLHD index) to a more than one-letter case. The
C index is obtained through assigning corresponding values (3, 2, 1, 0) to the result of
comparing first, second, and third codes of person and environment, respectively, and
then multiply with corresponding weights (3, 2, 1) for the first, second, and third code
comparison. The formula of C index is as following:
C = 3 (Xi) + 2 (Xi) + (Xi)
where Xi are values (3, 2, 1, 0) assigned to each comparison based on hexagonal distance
between the letters (3 = two letters are identical, 2 = two letters are adjacent in hexagon,
1 = two letters are alternate in hexagon, 0 = two letters are opposite in hexagon). For
example, an individual has RIA as his interest code. If he has RIA as his environment
code as well, then his C index gets a perfect score which is 18 = 3(3) + 2(3) + (3). If he
has CER as his environment code, then the values assigned to the first code comparison is
2 given the two letters are adjacent in hexagon, the value for the second code comparison
is 0 given the two letters are opposite to each other, and the value for the third code
comparison is 1 given the two letters are alternate in hexagon. His C index score is 7 =
3(2) + 2(0) + (1). The range of C index is 0 to 18.
FLHD index. Holland’s First Letter Hexagonal Distance index (FLHD index)
(Holland, 1973) was selected in the present study because of a practical consideration. As
stated earlier, the present study coded participants’ reported occupations based on the
O*NET classification system, which is one of several classification systems. Eggerth,
Doules, Tunick, and Andrew (2005) reviewed three main Holland code classifications

- 39 -
(O*NET, Dictionary of Holland Occupational Types, Strong Interest Inventory). They
concluded that their study result yielded an acceptable rate of agreement between the
three classification systems. They reported a first letter agreement rate of 70.6% when
pairing two out of three classification systems to compare and a rate of 60.21% when
comparing across all three systems. For two letters agreement (first and second Holland
code letter), they reported a rate of 32.33% with pairwise approach and a rate of 15.71%
with a three-way approach. In terms of three letters agreement (first, second, and third
Holland code letters), they reported a pairwise agreement rate of 12.56% and a three-way
agreement rate of 2.62%. Given its significant drops of agreement rate from one letter
agreement to two letter agreement (70.6% to 32.33% pairwise, 60.21% to 15.71% three-
way), this writer believes that choosing one letter instead of two or three letters to
compute congruence index would greatly avoid errors introduced by selecting one
particular classification system (O*NET in current case) to compute congruence index. In
other words, the acceptable agreement rate on first letter across three classifications
suggested that using FLHD index would reasonably capture the desired quality of
computing congruence, no matter which classification was chosen, and avoid errors that
may be attached with the approaches of using three letters to compute congruence.
FLHD index uses the concept of hexagonal distance between RIASEC typology
to indicate 4 different levels of congruence. Correspondingly, the FLHD index has a
range of 1 to 4. The score (1, 2, 3, 4) was assigned to comparison between person and
environment types based on the hexagonal distance between the two types. When two
types are identical (the hexagonal distance is zero), the congruence level is the highest
- 40 -
and a score of “4” was assigned. For example, a score of 4 was assigned when
comparing Realistic type and Realistic type, Investigative type and Investigative type,
Artistic type and Artistic type, and so forth. When two types are adjacent to each other in
hexagonal distance, their congruence hits the second highest level and a score of “3” was
assigned. For example, comparing Realistic type and Investigative type or comparing
Investigative type and Artistic type would yield a congruence index score of 3. Similarly,
when two types are alternate from each other in hexagon, their congruence hit the third
level with a congruence index score of 2. Several examples include comparing Realistic
type with Artistic type, or Investigative type with Social type, or Realistic type with
Enterprising type. Lastly, if two types locate opposite in hexagon, their congruence level
is the lowest of 4 levels with a congruence index score of 1. Several examples are
Realistic type with Social type, Investigative type with Enterprising type, and Artistic
type with Conventional type.
M index. Different from C index and FLHD index which were computed based
on the concept of hexagonal distance, the Ichan’s M index was developed based on a
mathematic approach which Ichan (1984) claimed to have a broader applications both
within and out of vocational setting to calculate agreement. Ichan’s M index was
therefore selected to provide another perspective of computing congruence in the present
study. According to Ichan (1984), the formula of M index is as following:
∑∑==
=k
jijij
k
i
wM11
δ
where σij = 1 if the object ranked ith by judge 1 is ranked jth by judge 2, σij = 0 otherwise.

- 41 -
When σij = 1, it indicates that an agreement of the (i, j) type occurs, corresponding to a
match in position i and j.
Ichan (1984) provided a table for wij when computing M. Table 2 presents the table that
was given by Ichan. The measure M is computed by adding the weights corresponding to
positions where matches occur. For example, a participant’s Holland code for self
preferred occupation is EIA and the code obtained from Interest Profiler is ESI. As
shown in Table 2, the weight for the match between position 1 of judge 1(from EIA) and
position 1of judge 2 (from ESI) is 22 and the weight for the match between position 2 of
judge 1(from EIA) and position 3 of judge 2 (from ESI) is 2. Then, M = 1*22 + 1*2 = 24.
Intergeneration conflicts. The present study was aimed at examining how family
conflicts, especially on major/career related topics, impacted Asian American students on
choosing their majors/careers. The existing family conflicts scales (e.g., [Asian American
Family Conflicts Scale], Lee, Choe, Kim, & Ngo, 2000) is more general rather than
focuses specifically on occupational conflicts. The present study developed an item pool
to serve the specific design of this study. The intergeneration conflicts item pool
consisted of 40 items in total. It was developed to measure intergeneration conflicts from
two aspects: one aspect measuring specific conflicts on major/career related values,
another aspect covering the intergeneration conflicts in general. As shown in the
Appendix D intergeneration conflict scale, the first 20 items measures specific conflicts
on major/career related values. These items were developed based on a revision of items
related to “family recognition through achievement” from the Asian American Values
Scale-Multidimensional (AAVS-M). The first 10 items are the same as the next 10 items.

- 42 -
Each of 10 items reflects a type of value related to career choices with a consideration of
family. Several sample items are: “Succeeding occupationally is an important way of
making one’s family proud”, “One should bring fame to family through taking high
prestige jobs”, and “Making achievements is an important way to show one’s
appreciation for one’s family.” Participants were instructed to respond to the first 10
items based on how they think the following values were held by their parents, while
participants were instructed to respond to the item 11 to 20 based on how much they
agree with these values. The comparison of corresponding items between perceived
parents’ value and one’s own value provides an index on how much conflicts participants
have with their parents on choosing a career with considerations for family. The sum of
absolute values of differences between comparisons of corresponding items was
computed for the total score of “intergeneration conflict on major/career related values”
subscale. A higher score indicated a higher level of intergeneration conflicts on
major/career related values. In addition, the sum of first 10 item scores was computed as
a total score for perceived “parents’ belief on major/career related values” subscale. A
higher score indicated that one perceived his/her parents hold strong beliefs that one
should help family through their major/career. The sum of the item 11-20 scores was
computed as a total score for “self belief on major/career related values” subscale. A
higher score indicated that one holds strong belief that one should help family through
their major/career. The reliability of the “intergeneration conflict on major/career related
values” items was examined with internal consistency analysis. The Cronbach’s alphas
coefficient for items of parents’ belief on major/career related values was .92, and

- 43 -
Cronbach’s alphas coefficient for items of self belief on major/related values was .88,
both of which suggested a good stability of the item pool.
The second part of intergeneration conflict item pool contained another 20 items,
which covered more general intergeneration conflicts. These items were developed based
on a revision of items related to education and career in the Intergenerational Conflict
Inventory (Chung, 2001). Several sample items were: My parents and I have different
ideas on “How much time to spend on studying”, “Importance of academic achievement”,
and “What to major in college”. Again, the first 10 items within this part were the same
as the next 10 items. Participants were asked to respond to the first 10 items within this
part based on how often these conflicts appeared, then participants were asked to respond
to the next 10 items based on how intense when such conflicts happened. This second
part of intergeneration conflict item pool is referred to as the subscale of “general
intergeneration conflict with frequency measure” and “general intergeneration conflict
with severity measure”. The total scores were computed for frequency and severity,
respectively. A higher score on this subscale with frequency measure indicated more
frequent intergeneration conflicts on general developmental tasks. A higher score on this
subscale with severity measure indicated more severe intergeneration conflicts on general
developmental tasks. The reliability of the general intergeneration conflict items was
examined with internal consistency analysis. The Cronbach’s alphas coefficient was .79
for items of “general intergeneration conflict with frequency measure”, and the
Cronbach’s alphas coefficient was .85 for items of “general intergeneration conflict with
severity measure”. Scholars (Lee et al., 2000) suggested that two measures (frequency

- 44 -
measures, severity measures) are not theoretically significant different from each other,
thus, one measure can be chosen to represent the general intergeneration conflict. The
present study chose severity measure as the representative scale given its higher internal
reliability.
The Family Acculturation Conflicts Scale (Lee, Choe, Kim, & Ngo, 2000) was
also included in the present study to provide a concurrent validity check for the
Intergeneration Conflict Item Pool developed for the present study. The Family
Acculturation Conflicts Scale (FCS) consisted of 10 items asking participants to rate the
likelihood of conflict and seriousness of problems on 10 family situations. The FCS-
Likelihood and FCS-Seriousness scores were computed for each participant. High score
on FCS-Likelihood indicated great likelihood of having family acculturation conflicts.
High score on FCS-Seriousness indicated high level of seriousness of family
acculturation conflicts. Cronbach’s alpha coefficients were .81 and .84, respectively, for
FAC-Likelihood and FCS-Seriousness, suggesting internal reliability for the scale. The 3-
week test-rest reliability, based on a sample of 11 participants (Lee et al., 2000), was high
for both FCS-Likelihood (r = .80) and FCS-Seriousness (r =.85). The concurrent validity
test, based on a sample of 109 Asian American college students, showed that FCS
moderate correlated with family based acculturative stress (r = .53). Again, the present
study chose FCS-Seriousness measure as the representative scale for Family
Acculturation Conflicts Scale given its higher internal reliability.
Family obligations. Family obligations items were developed specifically for the
present study, given that no existing family obligation scales specifically measure career

- 45 -
related family obligations. The item pool, which consisted of 8 items, was written by this
writer and was revised based on discussions in the pilot study. Some sample items are “I
feel obligated to follow my parent’s ideas about the choice of majors/careers”, “I feel it is
my duty to achieve financial success to raise my family’s social status in the society”, and
“I feel like I won my parents because they have sacrificed a lot for me”. Participants are
asked to rate how much they agree on such descriptions. The reliability of the Family
obligation scale was examined with internal consistency analysis. The Cronbach’s alphas
coefficient was .84 suggesting a good stability of the scale.
Perceived opportunities. Given that no existing scale that was available for the
present study to examine one’s perception of career opportunities for Asian Americans,
five items were specifically developed. Sample items are: “I feel that I have fewer career
options than students of other races”, “I can only succeed in a small number of
majors/careers”, “I have more chances to succeed if I enter the same occupation as my
parent’s occupation”, “I feel that my career opportunities are limited by my
ethnicity/race/language”, and “I have opportunities to succeed in almost any major/career
that I choose”. The reliability of the Family obligation scale was examined with internal
consistency analysis. The Cronbach’s alphas coefficient was .81 suggesting a good
stability of the scale.
Acculturation. Acculturation was measured by Vancouver Index of
Acculturation ([VIA], Ryder, Alden, & Paulhus, 2000). VIA was developed based on
bidimensional model believing that heritage and mainstream culture identifications are
independent rather than strongly inverse with each other. It is a self-report instrument that

- 46 -
covers several domains relevant to acculturation, including values, social relationships,
and adherence to traditions. The VIA contains 20 items, with 10 items measuring heritage
dimension and another 10 items measuring mainstream culture dimension. Several
sample items are: “I often participate in my heritage cultural traditions”, “I often
participate in mainstream American cultural traditions”, “I would be willing to date a
person from my heritage culture”, and “I would be willing to date a mainstream
American”. The Cronbach alpha coefficients for heritage subscale among Chinese (n =
204), non-Chinese East Asian (n = 70), and non-English-speaking (excluding Chinese
and East Asian) descent (n = 140) sample are .91, .92, and .91, respectively. The
Cronbach alpha coefficients for mainstream subscale among these three populations
are .89, .85, and .87, respectively. The concurrent validity of VIA when compared with
mean scores of the Suinn-Lew Asian Self-Identity Acculturation Scale (SL-ASIA) was -
.57 for heritage subscale and .60 for mainstream subscale among Chinese sample; and
was -.60 for heritage subscale and .51 for mainstream subscale among East Asian sample.
Demographic Questionnaire. The demographic questionnaire consisted of 14
items. It collected participants’ information, such as age, gender, academic class standing,
major, racial identity, generation status, years in the U.S., number of siblings, self-
expected occupation, parents-expected occupation, parents’ education background, and
parents’ occupation. Participants were required to answer personal information but were
asked to voluntarily provide answers to parents’ related information.

- 47 -
Data Analysis
Preliminary analysis. Prior to data analysis, data was screened by examining for
missing values. Responses that contained more than 5% missing values were removed
from data analysis. All participants, especially those who were recruited from the
Angryasianman.com website, were screened for their legibility of participating in the
study. Those who did not identify themselves as Asian American, or aged under 18, or
had lived in the U.S. for less than 8 years were deleted from the data set. The mean score,
standard deviation, the internal reliability estimates, and correlation matrix for all the
scale variables were calculated.
Descriptive analysis. The general descriptive statistics were calculated to present
the characteristic of the sample. The congruence indices were also calculated. The present
study first computed two different types of congruence: congruence between current
major and vocational interest (major-interest congruence), congruence between self-
expected occupation and vocational interest (occupation-interest congruence). The means
of two types of congruence with three congruence indices (FLHD index, C index, M
index) were summarized and presented. The correlation between each pair of congruence
types and each pair of congruence indices were calculated and presented as well. This
information provided an overall picture about Asian American students’ congruence.
Mean comparison on congruence. The present study hypothesized that Asian
American students’ major-interest congruence differs across majors (Hypothesis 1).
Moreover, the present study hypothesized that major-interest congruence and occupation-
interest congruence differ across generation status (Hypothesis 2), and acculturation

- 48 -
levels (Hypothesis 3). To test these hypotheses, I compared mean scores of congruence
indices among different levels of each factor (e.g., RIASEC major, generation status, and
acculturation level). Given that the acculturation was measured as a continuous variable,
the correlation between acculturation and congruence was computed. I then converted the
two dimensions of acculturation from a continuous variable to a category variable.
Participants’ total score on the acculturation scale was classified into three levels. Those
who score within the bottom third of the possible range for the instrument were classified
as the low acculturation group. Those in the middle third were classified as the average
acculturation group. Those in the top third were classified as the high acculturation
group. The analysis of variance (ANOVA) was then conducted to decide whether
statistical differences were reached among each pair of comparison. The least squares and
maximum likelihood estimators were selected to use when conducting ANOVA given
that this approach uses minimum variance unbiased estimators. The F-test for equality of
factor level means was conducted to determine whether different group means differ from
each other in a statistical significant way. Once statistical significance was reached in the
F-test, the post hoc tests were performed to further estimate and test for factor level
effects. The Bonferroni multiple comparison procedure was use to minimize type I error.
The comparison and test results for each pair of groups were summarized in tables and
figures.
Correlation between occupation-interest congruence and three main
variables. As proposed in the present study, contextual factors (e.g., international
conflicts, family obligation, and perceived opportunity) would impact Asian American
- 49 -
students’ occupation-interest congruence (Hypothesis 4, 5, 6). To test these hypotheses,
the present study computed the correlation between occupation-interest congruence and
international conflicts, family obligation, and perceived opportunity. Intergeneration
conflict was measured by Intergeneration Conflict Item Pool (with two components:
conflicts on career/major related values, conflicts on general developmental tasks) and
Family Acculturation Conflicts Scale. Three subscales of intergeneration conflict
measurement were used, instead of a whole scale, to compute the correlation with
occupation-interest congruence.
It was also expected that some personal and contextual factors (e.g., gender,
RIASEC occupation, RIASEC major, parents’ education level) may impact the
association between occupation-interest congruence and intergeneration conflicts, family
obligation, and perceived opportunities. To test these hypotheses, an ANOVA was
conducted to decide whether statistical differences were reached among each pair of
comparison. The least squares and maximum likelihood estimators were selected to use
when conducting ANOVA given that this approach uses minimum variance unbiased
estimators. The F-test for equality of factor level means was conducted to determine
whether different group means differ from each other in a statistical significant way.
Once statistical significance was reached in the F-test, the post hoc tests were performed
to further estimate and test for factor level effects. The Bonferroni multiple comparison
procedure was use to minimize type I error. The comparison and test results for each pair
of groups were summarized in tables and figures.

- 50 -
Chapter III
Results
Descriptive Statistics
The mean score and standard deviation of each scale that measured in the present
study were first computed. Table 3 presented these statistics for males, females, and total
sample. The Vancouver Index of Acculturation scale (VIA) has a score range of 10 to 90.
The mean score of VIA on acculturation with heritage dimension is 67.95 with total
sample. The mean score of VIA on acculturation with mainstream culture dimension is
69.28 with total sample. The intergeneration conflict item pool consists of three
components with 5 subscales in total. The subscale of “parents’ belief on career/major
related value” has a score range of 10 to 50. The mean score of this subscale is 40.20 with
total sample. The subscale of “students’ belief on career/major related value” has a score
range of 10 to 50. The mean score of this subscale is 35.34 with total sample. The
subscale of “intergenerational conflict on career/major related value” has a score range of
0 to 40. The mean score of this subscale is 8.24 with total sample. The subscale of
“general intergeneration conflict with severity measure” has a score range of 10 to 50.
The mean score of severity measure is 19.93 with total sample. The subscale of “family
acculturation conflict scale with severity measure” has a score range of 10 to 50. The
mean score of this subscale is 20.75 with total sample. The Family Obligation item pool
has a score range of 8 to 40. The mean score of this scale is 26.94 with total sample. The

- 51 -
perceived opportunity item pool has a score range of 5 to 25. The mean score of this scale
is 11.54 with total sample.
The analysis of mean differences (t-test) indicated that male participants’
perception of parents’ belief on career/major related value was statistically significant (t =
-2.56, p = .01) when compared to female participants. As shown in Table 3, compared to
males, females perceive their parents having stronger belief that younger generations
should help family with their careers. Moreover, the perception of family acculturation
conflict was statistically significant across gender on the severity measure (t = -2.03, p
= .04). Compared to males, females perceive more severe acculturation conflicts.
The correlations between each measure are presented in Table 4. As shown in
Table 4, the correlation coefficients ranged from .01 to .74. The measure of parents’
belief on career/major related value and the measure of perceived opportunity
significantly correlated to most of measures. The highest correlation was between general
intergeneration conflict and family acculturation conflict scale (r = .74). It was followed
by the correlation between the measure of self belief on career/major related value and
the measure of perceived opportunity (r = .62), and the correlation between the measure
of parents’ belief on career/major related valued and family acculturation conflict scale (r
= .53). The rest of correlation coefficients indicated none to moderate correlation among
measures.

- 52 -
RIASEC Majors and Occupations
The present study coded participants’ reported majors and occupations into
RIASEC categories. As shown in Figure 2(a), 53.8% participants were in Investigative
major, 20.5% were in Enterprising major, 12% were in Social major, 8% were in artistic
major, 4% were in Realistic major, 1.2% were in Conventional major, and .4% were
undecided. Self preferred occupations presented a similar trend. The 32.5% students
preferred to enter an Investigative occupation, 22.1% preferred Enterprising occupations,
24.1% preferred Social occupations, 8.8% preferred Artistic occupations, 4.4% preferred
Conventional occupations, 2% preferred Realistic occupations, and 6% were undecided.
As expected, Investigative and Enterprising majors/occupations are chosen most often.
Participants’ Profile on Negotiating
It is clear that Asian American students tried to achieve a balance between their
parents’ input and their own interest when choosing major/career. The negotiation
process can be complicated, and it is not of the focus of the present study. However,
some thoughts about negotiation process were documented here, hoping to suggest future
research directions.
During the coding procedure in which I assigned Holland codes to participants’
reported majors, self preferred occupations, and parents expected occupations, several
patterns were observed from the data set. First, about 7% students have their preferred
occupations completely different from their majors. Second, 9.2% of students specifically
reported that their parents want them to have “a job that commands a high income along

- 53 -
with social respects”, or “any job they see as lucrative and stable”, or “something with
high status.” In addition, 19.3% students reported that their parents allow them to choose
whatever they want or whatever makes them happy. Another 10.4% of students do not
perceive their parents to have any specific expectations toward their career. Third, among
those students whose major, self expected occupation, and parents expected occupation
are not completely the same but have some connections, students seem to demonstrate a
negotiation strategy that help them to follow their interest and at the same time
incorporate their parents’ expectations. Selecting an occupation that meets their parents’
expectation on prestige level, although the chosen occupation is not exactly the same as
the one their parents proposed, seemed to be one of strategies. For example, some parents
want their children to be medical doctor; however, their children choose to be lawyers.
Parent would be okay with it since it still provides financial stability and social prestige.
Fourth, and finally, based on different intergenerational dynamic and negotiation results,
participants’ profile in this study roughly presented in six categories and their
characteristics are as such:
• Category 1 (follower child): student’s major and self preferred occupation is different or quite opposite to each other, but his/her major match with parents expected occupation.
• Category 2 (rebellious child): student’s major and self preferred occupation matches with each other, but neither his/her major or self preferred occupation matches with parents’ expected occupation.
• Category 3 (compromised child): student’s major does not fully match with self preferred occupation, self preferred occupation does not fully match with parents’ expected occupation, major does not fully match with parents’ expected occupation, but all three choices are connected to each other. Such

- 54 -
student does not fully follow parent, but also not fully follow their interest either.
• Category 4 (no clear idea child): student has a major, but is not sure what s/he wants to pursue as a career, and is not sure whether parents has any expectations.
• Category 5 (supportive parent): student’s major matches self preferred occupation, and his/her parents said whatever the child wants to choose is fine with them.
• Category 6 (conditional parent): student’s major and self preferred occupation can be the same or different, and parents do not expect specific occupation but indicate that the chosen occupation should have high income, high stability, and high prestige.
All these above patterns presented an exploratory perspective on Asian American
students’ negotiation results. Future studies are needed to further examine the negotiation
process and provide some quantitative evidence.
Congruence Results
The present study used three congruence indices (FLHD index [Holland, 1973], C
index [Brown & Gore, 1994], and M index [Iachan, 1984, 1990]) to examine two types of
congruence: (a) congruence between one’s current major and vocational interest
(abbreviated as “major-interest congruence” in text below), and (b) congruence between
one’s self-expected occupation and vocational interest (abbreviated as “occupation-
interest congruence” in text below). As shown in Table 5, all congruence indices
indicated a moderate fit for two types of congruence. The FLHD index has a range from
1 to 4. The FLHD index result for 2 types of congruence in current data set ranged from
2.99 to 3.02. The C index has a range from 0 to 18. The C index result for 2 types of

- 55 -
congruence in current data set ranged from 10.29 to 11.10. The M index has a range from
0 to 28, and the M index result for 2 types of congruence in current data set ranged from
15.36 to 16.85.
An independent-samples t test was conducted to determine whether there was any
gender difference on the mean scores of congruence indices. Given that the data set had
only one participant identified as transgender, this one participant was deleted from the
data set for this analysis. The mean score of all congruence indices across genders is
presented in Table 5. None of the tests were statistically significant suggesting that
gender differences are not present for the level of congruence.
The correlation between each pair of congruence indices across two types of
congruence were calculated, and the results were presented in Table 6. As shown in Table
6, within each type of congruence the three computed congruence indices (FLHD, C
index, M index) showed high correlation with each other with coefficient r ranging
from .60 to .85, which indicated that three congruence indices produce similar, though
not identical, assessment of congruence. The correlation between major-interest
congruence and occupation-interest congruence was statistically significant, with
coefficient r ranging from .17 to .44.
The following text reported all significant results. A significant result supported
by all three congruence indices (FLHD, C index, M index) or two of three indices would
be considered as a robust result. Caution should be used when a significant result was
only supported by one out of three indices.

- 56 -
Major-interest congruence across RIASEC majors. The present study
hypothesized that Asian American students’ major-interest congruence varies across
majors (Hypothesis 1a). Asian American students in more traditionally represented areas
(e.g., Bioscience, Business, Engineering) have lower major-interest congruence, and
students in more atypically represented areas (e.g., arts, psychology) have higher major-
interest congruence (Hypothesis 1b). To test these hypotheses, majors were first coded
with three-letter Holland code. Based on the first letter of the code, all majors were
categorized into six Holland RIASEC groups, and all participants were sorted into six
according groups based on the first letter of their major’s code. Then the mean score of
major-interest congruence indices for each group was calculated and compared.
An ANOVA was performed to determine whether or not major-interest
congruence differed across RIASEC majors. The least squares and maximum likelihood
estimators were selected to use when conducting ANOVA given that this approach uses
minimum variance unbiased estimators. The F-test for equality of factor level means was
conducted to determine whether different group means differ from each other in a
statistical significant way. The F-test results were summarized in Table 7. As shown in
the upper rows of Table 7, F-test with three indices all indicated significant results (F [5,
213] = 6.01, p < .001, FLHD; F [5, 213] = 4.69, p < .001, C index; F [5, 213] = 5.57, p
< .001, M index) suggesting that at least one of the mean scores for each RIASEC group
were significantly different from other mean scores. This result showed that major-
interest congruence varies across majors and the Hypothesis 1a was supported.

- 57 -
The post hoc tests were used to further estimate and test for factor level effects.
The Bonferroni multiple comparison procedure was selected because this statistical test
minimize type I error. The comparison and test results for each pair of groups were
summarized in Table 8. As shown in Table 8, three congruence indices agreed that major-
interest congruence were significantly different: between students with Realistic major
and students with Artistic major (p < .01), between students with Realistic major and
students with Social major (p < .05), between students with Investigative major and
students with Artistic major (p < .01), between students with Investigative major and
students with Social major (p < .01), between students with Enterprising major and
students with Artistic major (p < .01), and between students with Enterprising major and
student with Social major(p < .05). In summary, significant differences were found
between Realistic, Investigative, and Enterprising major vs. Artistic and Social major.
The mean scores of congruence indices for each RIASEC group were also plotted
in Figure 3. As shown in the Figure 3(a), 3(b), and 3(c), three indices for major-interest
congruence indicated a consistent trend. Students in Realistic major had the lowest
major-interest congruence, and students in Artistic major had the highest major-interest
congruence. Students in Social major and in Conventional majors indicated the second
highest level of major-interest congruence. Students in Enterprising major and in
Investigative major indicated the second lowest level of major-interest congruence. In
other words, if ranking all RIASEC majors based on means of major-interest congruence
from the lowest to the highest, the order was: Realistic, Enterprising and Investigative,
Social and Conventional, and Artistic. It is notable that three types of majors (Realistic,

- 58 -
Enterprising, Investigative) that hit the lowest level of major-interest congruence are
majors that Asian American students are traditionally over represented. The types of
major that hit the highest level of major-interest congruence is the atypical major for
Asian American students. This meant that major-interest congruence was significantly
different between traditionally represented majors and atypically represented majors. The
Hypothesis 1b was supported.
Congruence across generation status. The present study asked students about
their generation status and categorized generation status into four groups: first generation,
1.5 generation, second generation, and third generation or beyond. I hypothesized that
generation status may be another factor impacting the congruence between major and
interest or/and between occupation and interest (Hypothesis 2).
The mean scores of congruence indices across different generation status were
first plotted into Figure 4. As shown in Figure 4(a), 4(b), and 4(c), three indices for
major-interest congruence illustrated a similar pattern. The highest major-interest
congruence was observed in the third generation and beyond, and the lowest major-
interest congruence was observed in the first generation. Major-interest congruence
showed an increase when generation status moved from the first generation to the third
generation or beyond. It was notable that the 1.5 generation and the second generation
shared a similar level of major-interest congruence. Figure 4(d), 4(e), and 4(f) presented a
similar pattern of occupation-interest congruence across generation status. The highest
occupation-interest congruence was observed in third generation and beyond while the
lowest occupation-interest congruence was observed in the first generation. Occupation-

- 59 -
interest congruence indicated an increase when generation status moved from the first
generation to the third generation and beyond. The occupation-interest congruence in the
second generation dropped slightly or stayed the same compared to the 1.5 generation.
An ANOVA was performed to determine whether or not the observed differences
among mean scores of the congruence indices reached a statistical significance. The least
squares and maximum likelihood estimators approach was used. The F-test for equality
of factor level means was conducted. The F-test for major-interest congruence yielded no
statistically significant results across FLHD index (F [3, 215] = .47, p = .71), C index (F
[3, 215] = .21, p = .89), and M index (F [3, 215] = 2.28, p = .08) indicating that no
statistically significant differences were found across generation status despite the
observed difference in Figure 4. The F-test for occupation-interest congruence indicated
statistically significant result only for the M index (F [3, 203] = 2.86, p = .04), indicating
that at least one of the mean scores of occupation-interest congruence was significantly
different than that of other generation status. These results suggest that generation status
is related to occupation-interest congruence but not relate to major-interest congruence.
The Hypothesis 2b was partially supported.
The post hoc tests were conducted only on occupation-interest congruence to
further estimate and test for factor level effects. The Bonferroni multiple comparison
procedure was selected to use to minimize type I error. The results of comparing and
testing the difference of mean scores across each generation status are summarized in
Table 9. As shown in Table 9, M index, but not the other two indices, indicated
statistically significant results. The mean score of occupation-interest congruence for first

- 60 -
generation was significantly (p < .05) different from that of the 1.5 generation and the
second generation, and was significantly (p < .01) different from that of the third
generation or beyond. There was no significant difference among any pair of 1.5
generation, second generation, and the third generation or beyond. These results are
consistent with the observed results from Figure 4(d), 4(e), 4(f) that Asian American
students with first generation status had a poorer occupational fit than Asian American
students with higher generation status. Moreover, Asian American students with 1.5
generation status and second generation status indicated a similar pattern which may
mean that these two groups of students have similar experiences with choice of a major.
Congruence across acculturation levels. The present study used a two
dimensional acculturation model. One dimension measured participants’ acculturation
with American culture and the other dimension measured participants’ acculturation with
heritage culture. I hypothesized that acculturation level (on both dimensions) is related to
major-interest congruence and occupation-interest congruence (Hypothesis 3). To test
this hypothesis, the acculturation was first correlated with major-interest congruence and
occupation-interest congruence, and results were presented in Table 10. As shown in
Table 10, neither the major-interest congruence nor occupation-interest congruence was
significantly related to acculturation with the combined male and female samples.
However, male participants’ results showed that two out of three indices (C index, M
index) for occupation-interest congruence significantly correlated (r = .29, p = .02 for the
C index; r = .29, p = .02 for the M index) with acculturation to American culture. This
result suggested that the higher the reported acculturation with American culture the

- 61 -
better the occupation-interest fit for male students. One of occupation-interest congruence
index (M index) was significantly correlated (r = .39, p = .00) to acculturation with
heritage culture among male students. This result suggests that a higher acculturation
with Asian culture also presented a better occupation-interest fit for male students. These
two significant results for male students may together suggest that the higher the
acculturation (no matter with Asian or American culture) the better the occupation-
interest fit for male students. Moreover, only one of major-interest congruence index
(FLHD index) was significantly (r = -.20, p = .02) correlated with acculturation with
American culture for the Asian American female students. This result indicates that the
lower the acculturation with American culture the better the major-interest fit for female
students.
An additional analysis was conducted to explore the effect of acculturation on
choice of major vs. choice of occupation. The acculturation scores on both dimensions
were converted from a continuous variable to a categorical variable. Participants’ total
score on the acculturation scale was classified into three levels. Those who scored within
the bottom third of the possible range for the measure were classified as the low
acculturation group. Those in the middle third were classified as the average
acculturation group. Those in the top third were classified as the high acculturation
group. The mean scores of congruence indices across different acculturation levels were
plotted and shown in Figure 5 and Figure 6. Figure 5 shows the congruence indices
across participants’ heritage acculturation (acculturation with Asian culture), and Figure
6 shows the congruence indices across participants’ American acculturation.

- 62 -
As shown in Figure 5(a), 5(b), and 5(c), three indices for major-interest
congruence illustrated a similar pattern. The highest major-interest congruence was
observed in students who had low acculturation level to Asian culture. Students who had
middle and high level of acculturation to Asian culture appeared to yield similar major-
interest congruence and hit a low level of congruence. Figure 5(d), 5(e), and 5(f)
presented an opposite pattern for occupation-interest congruence across acculturation
levels. Students with low acculturation level to Asian culture indicated the lowest
occupation-interest congruence, and students with middle and high acculturation level
yield similar results and hit a high level of occupation-interest congruence. These results
were consistent with the correlation results.
When comparing major-interest congruence and occupation-interest congruence
with the same congruence index (FLHD index for example), students who have a low
level of Asian acculturation showed a large discrepancy between two types of congruence
(major-interest congruence and occupation-interest congruence), and students with
middle or high level of Asian acculturation showed consistency between major-interest
congruence and occupation-interest congruence. The other two indices also showed a
similar pattern. This finding may suggest that Asian American students who have low
acculturation with Asian culture may tend to choose a major that matches with their
interests and then choose a different occupation when other considerations later take
prevalence. In contrast, students who have middle or high acculturation with Asian
culture may start from the very beginning to choose a major that they may continue
pursuing as their later occupation, and this major/occupation may be a compromise

- 63 -
between their interests and other considerations such as family obligation or/and
perceived opportunities.
Students’ acculturation with American culture was also examined to determine
whether congruence differed across acculturation levels. As shown in Figure 6(a), 6(b),
and 6(c), two out of three indices (FLHD index, C index) for major-interest congruence
illustrated a similar pattern while the third index (M index) displayed a slightly different
pattern. The highest major-interest congruence was observed in students who have a
middle level of American acculturation. The lowest major-interest congruence was
observed among students who either have a high or low acculturation with American
culture. Figure 6(d), 6(e), and 6(f) presented a consistent yet slightly different pattern for
occupation-interest congruence across acculturation levels. Three indices agreed on the
tendency that students with a middle level of acculturation with American culture
illustrated the highest occupation-interest congruence, and students with a low level of
acculturation with American culture had the lowest occupation-interest congruence.
It was notable that occupation-interest congruence yielded a wider range of values
than that of major-interest congruence. For example, major-interest congruence with
FLHD index ranged from 2.92 to 3.15 and occupation-interest congruence with FLHD
index ranged from 1.75 to 3.10. This pattern was observed in other two congruence
indices as well. In addition, an impression on Figure 6(a) to 6(f) was that students with
middle acculturation level to American culture always had the highest congruence for
major-interest congruence and occupation-interest. Moreover, two out of three indices
(FLHD index, C index) agreed: (a) major-interest congruence was higher than
- 64 -
occupation-interest congruence for students with a low level of American acculturation,
and (b) major-interest congruence and occupation-interest congruence were consistent for
students with middle and high level of American acculturation.
An ANOVA was performed to determine whether or not the observed differences
among mean scores of congruence indices were statistical significant. The least squares
and maximum likelihood estimators approach was used. The F-test for equality of factor
level means was conducted. The F-test for major-interest congruence and occupation-
interest congruence yielded no statistically significant results across acculturation levels
with Asian culture. In testing acculturation levels with American culture, the F-test for
major-interest congruence was not statistically significant, but the F-test for occupation-
interest congruence indicated statistically significant result (F [2, 204] = 3.61, p = .03) for
the FLHD index. A post hoc test was conducted only on occupation-interest congruence
to further examine factor level effects. The Bonferroni multiple comparison procedure
was selected to use to minimize type I error. The results of comparing and testing the
difference of mean scores across each level of American acculturation are summarized in
Table 11. As shown in Table 11, the FLHD index, but not the other two indices, indicated
statistically significant results. The mean score of occupation-interest congruence of
students with low level of American acculturation was significantly (p = .03) different
from that of student with middle level of American acculturation.

- 65 -
Correlation Between Congruence and Variables
The present study also examined how occupation-interest congruence is directly
associated with three main variables: intergeneration conflicts, family obligation, and
perceived opportunity. I hypothesized that intergeneration conflict, family obligation, and
perceived opportunity have a negative association with occupation-interest congruence
(Hypothesis 4, 5, 6). The present study examined the association between each subscale
of intergeneration conflict (intergeneration conflict on career/major related beliefs,
intergeneration conflict on general developmental tasks, family acculturation conflict)
with occupation-interest congruence.
Correlation across genders. The correlations between congruence and
intergeneration conflicts, family obligation, and perceived opportunity are presented in
Table 12. As shown in the left column of Table 12, congruence is not related to
intergeneration conflicts, family obligation, and perceived opportunity with the total
sample. Only when male participants examined separately are the correlations
statistically significant.
The middle columns of Table 12 show the correlations for male participants and
the right columns of Table 12 show the correlations for female participants. Male
participants showed several statistical significant results while none of results for female
participants reached statistical significance. More specifically, as shown in the middle
columns of Table 12, occupation-interest congruence was significantly correlated (r = .26,
p < .05, M index) with student’s belief on career/major related values, meaning that the

- 66 -
greater the students valued the belief that they can use their career/major to help their
family the better the fit between occupation and interest for males.
In addition, occupation-interest congruence was significantly negatively
correlated with family acculturation conflict across all indices for male students. The
correlation coefficients ranged from -.28 (p = .03) to -.36 (p = .00) indicating that the
more severe the family-acculturation conflict the lower occupation-interest congruence.
Finally, occupation-interest congruence was significantly correlated (r =.41, p
< .01, M index) with family obligation among male students, meaning that a better
occupation-interest fit was observed in male students who showed a greater perceptions
of family obligation. This result was opposite to the hypothesis that family obligation
functions as a barrier to Asian American students’ career choice. Instead, this result
supported the argument that family obligation functions as a positive contributing factor
to career choice among Asian Americans. One explanation is that male Asian American
students may internalize the value and obligation of helping family when they grow up
and then treat those occupations that match with their family’s expectations/interest as
their own interest. More discussion is followed in the discussion section.
In summary, compared to female Asian American students, male Asian American
students are more likely to be impacted by intergeneration conflict when they choose
their career/major. Significant correlations were found between occupation-interest
congruence and intergeneration conflict and between occupation-interest congruence and
family obligation only for male participants. These relationships mirror the observation
that male Asian Americans have greater pressure than female Asian Americans to take on

- 67 -
the role of following tradition, obeying parents, and bringing up family status (Liu &
Chang, 2007).
Correlation across RIASEC occupations. Participants reported their expected
occupation, which was further coded into the RIASEC model. Participants were then
sorted into RIASEC categories based on the first letter code of their preferred occupation.
The correlation coefficients for each RIASEC category was calculated and tested for
statistical significance. Table 13 presented the correlation results for participants in the
Social, Enterprising, and Conventional occupations.
As shown in the middle column of Table 13, occupation-interest congruence was
significantly negatively correlated (r =-.33, p < .05, C index) with intergeneration conflict
on career/major related values for students with Enterprising occupation, meaning that
the greater the intergeneration conflict on career/major related values the poorer the
occupation-interest fit. Moreover, occupation-interest congruence was significantly
positively correlated (r =.34, p < .05, FLHD index; r =.36, p < .05, C index; r =.43, p
< .01, M index;) with self belief on career/major related values for students with
Enterprising occupation, meaning that the greater the students value the belief that they
need to help family with their careers/majors the better the occupation-interest fit.
As shown in the right column of Table 13, occupation-interest congruence was
significantly negatively correlated (r = -.70, p < .05, C index; r = -.80, p < .01, M index;)
with intergeneration conflict on general developmental tasks for students with
Conventional occupation, meaning that the greater the intergeneration conflict on general
developmental tasks the poorer the occupation-interest fit. Moreover, all correlation

- 68 -
coefficients across indices (r ranged from -.64 to -.86; p ranged from .00 to .04,
accordingly) consistently indicated that occupation-interest congruence was significantly
negatively correlated with family acculturation conflict for students with Conventional
occupation, meaning that the greater the family acculturation conflict the poorer the
occupation-interest fit.
As shown in the left and middle column of Table 13, occupation-interest
congruence was significantly positively correlated (r =.35, p < .01, M index; r = .30, p
< .05, FLHD; r = .38, p < .05, M index) with family obligation in students who have
Social or Enterprising occupation, meaning that the greater the students perceived family
obligation the better the occupation-interest fit, and this result was particularly observed
in students who expected to take Social or Enterprising type of occupations.
Finally, as shown in the right column of Table 13, occupation-interest congruence
was significantly negatively correlated (r = -.63, p < .05, C index) with perceived
opportunity in students with Conventional occupation, meaning that the greater the
students perceived limited opportunities the poorer occupation-interest fit. This may
suggest that Asian American students choose to take Conventional occupation although
these occupations may not match with their interests because they perceive that Asian
Americans have limited occupational opportunities and Conventional occupation is the
area that has opportunities for Asian Americans.
In summary, Asian American students who preferred Social, Enterprising, and
Conventional occupations had statistically significant correlations between occupation-
interest congruence and three main variables of intergeneration conflict, family obligation,

- 69 -
perceived opportunities. Students who preferred Social and Enterprising occupations,
compared to students with other occupations, are impacted more by family obligations.
Students who preferred Enterprising occupations, compared to students preferred other
occupations, may be impacted more by intergeneration conflicts on career/major related
value, self belief on helping family with their career/major, and family obligation.
Students who preferred Conventional occupation may be impacted more by
intergeneration conflict on general developmental tasks, family acculturation conflict,
and perceived opportunity.
Correlation across current RIASEC majors. In the present study, participants
reported their major, which was RIASEC coded. Participants were then sorted into
RIASEC categories based on the first letter code of their major. The correlation
coefficients for each RIASEC category was calculated and tested for statistical
significance. Table 14 presented the correlation results for participants in Investigative,
and Social majors, in which correlation coefficients achieved statistical significance.
As shown in the middle columns of Table 14, occupation-interest congruence was
significantly negatively correlated (r = -.21, p < .05, FLHD index; r = -.21, p < .05, C
index; r = -.20, p < .05, M index) with perceived parents’ career/major related value
among students with Investigative occupation, meaning that the greater the students
believe that their parents think that they need to help family with their career the poorer
the occupation-interest fit. This result suggests that Asian American students who have
Investigative major may choose their occupations based on family expectations rather
than their individual interests. As shown in the right column of Table 14, occupation-

- 70 -
interest congruence was significantly negatively correlated (r = -.42, p < .05, FLHD
index) with intergeneration conflicts on career/major related values among students who
had Social major, meaning that the greater the intergeneration conflicts on career/major
related values the poorer the occupation-interest fit.
In summary, Asian American students who are in Investigative and Social majors
indicate significant correlations between occupation-interest congruence and three main
variables (intergeneration conflict, family obligation, perceived opportunities). Students
who have Investigative major may choose their major/career based on their parents’
expectations or family mission because they believe that their parents expect them to help
family with their career. Students who have Conventional major, compared to student
with other majors, are impacted more by intergeneration conflicts on career/major related
values.
Correlation across parents’ education. In the present study, participants were
asked whether or not their parents had education in the U.S. Participants were then sorted
into 2 groups: parents had no American education vs. parents had American education.
The correlation coefficients for each groups was calculated and tested for statistical
significance. Table 15 presented the correlation results and highlighted correlation
coefficients that achieved statistical significance.
As shown in the middle columns of Table 15, occupation-interest congruence was
significantly positively correlated (r = .21, p < .05, C index; r = .28, p < .01, M index)
with family obligation among students whose parents had education in the U.S., meaning
that a better occupation-interest fit was observed among students who perceived a greater

- 71 -
family obligation. As shown in the right columns of Table 15, occupation-interest
congruence was significantly negatively correlated (r = -.22, p < .05, C index) with
intergeneration conflicts on general developmental tasks among students whose parents
did not have education in the U.S., meaning that the greater the intergeneration conflict
the poorer the occupation-interest fit. Moreover, as shown in the right columns of Table
15, occupation-interest congruence was significantly negatively correlated (r = -.21, p
< .05, FLHD index; r = -.26, p < .05, C index) with perceived opportunity among
students whose parents did not have education in the U.S., meaning that the greater the
perceived limited career opportunities the poorer the occupation-interest fit.
In summary, these results suggest that Asian American students whose parents
had education in the U.S., compared to those whose parents did not have American
education, are impacted more by family obligation when choosing their occupations. In
the contrary, students whose parents did not have American education are impacted more
by perceived opportunity and intergeneration conflict than those whose parents had
American education.
Summary With Highlighted Results
1. Asian American students are highly represented in Investigative and Enterprising majors and occupations, and are well represented in Social majors and occupations in the present data set. These findings are different from the pattern observed about 10 years ago, in which Asian American students were reported to be overly represented in Realistic majors and occupations but not in Social majors and occupations.
2. Significant gender differences were found. Compared to males, females perceive their parents having stronger belief that young generations should help

- 72 -
family with their careers. Females perceive more severe family acculturation conflicts than males. In addition, the occupation-interest fit was significantly correlated to intergeneration conflicts and family obligation for males but not females.
3. Asian American students’ major-interest congruence varied across RIASEC majors. Congruence was significantly higher in atypically represented majors (Artistic, Social major) than in traditionally over represented majors (Realistic, Investigative, and Enterprising major). Hypothesis 1 was supported.
4. Occupation-interest congruence varied across generation status. First generation students’ occupation-interest congruence was lower than that of other generations. Hypothesis 2 was supported.
5. Occupation-interest congruence varied across acculturation. Based on correlation results, the higher the acculturation (no matter with Asian or American culture) the better the occupation-interest fit for male students. The lower the acculturation with American culture the better the major-interest fit for female students. Based on F-test results, occupation-interest congruence was significantly different across levels of acculturation with American culture. Based on a visual display, students with a middle level of acculturation with American culture illustrated the highest occupation-interest congruence, and students with a low level of acculturation with American culture hit the lowest occupation-interest congruence. Hypothesis 3 was partially supported.
6. Intergeneration conflicts on major/career related values were significantly related to occupation-interest congruence in a negative direction for those participants that have the following characteristics: Social majors, or preference for Enterprising occupations. Hypothesis 4 was partially supported.
7. Intergeneration conflicts on general developmental tasks significantly correlated to occupation-interest congruence in a negative direction for those students that have following characteristics: male, or preference for Conventional occupations, or parents not educated in the U.S. Hypothesis 4 was partially supported.
8. Family acculturation conflicts significantly correlated to occupation-interest congruence in a negative direction for those students that have following characteristics: male, or preference for Conventional occupations. Hypothesis 4 was partially supported.
9. Family obligation significantly correlated to occupation-interest congruence in a positive direction for those participants that have following characteristics: male,

- 73 -
or preference for Enterprising or Social occupations, or parents educated in the U.S. Hypothesis 5 was not supported. The results showed that family obligation is a positive contributing factor to occupation-interest fit.
10. Perceived opportunity was significantly correlated with occupation-interest congruence in a negative direction for those participants that have following characteristics: preference for Conventional occupations, or parents not educated in the U.S. Hypothesis 6 was partially supported.

- 74 -
Chapter IV
Discussion
The present study aimed at advancing our understanding of the occupation
segregation reported by previous studies and examining the association between family
variables and Asian American college students’ career choices. I attempted to answer
three main questions: (a) Is occupation segregation observed in the current data set? If so,
is the observed pattern presented in the same way as that of previous studies? (b) Does
interest-choice congruence differ across types of majors or occupations? (c) Do family
factors impact choice-interest congruence? In addition, interest-choice congruence and
association between interest-choice congruence and family factors were examined across
gender, acculturation level, generation status, types of majors/occupations, and parents’
education background.
Occupation Segregation
Previous literature showed that Asian Americans excel in technically related
occupations and prefer technical occupations (Leong & Serafica, 1995; Leong & Gupta,
2007; Tang et al., 1999), which lead to the fact that science, technical, and professional
occupations are overly represented by Asian Americans. Moreover, Asian Americans are
under represented in entertaining, artistic, and labor type of occupations (Leong &
Serafica, 1995; Leong & Gupta, 2007; Tang et al., 1999). Business or enterprising
occupations have gradually increased the numbers of Asian Americans, although early
data indicated that sales related occupations had a smaller representation of Asian

- 75 -
Americans. The present study, generally speaking, showed a similar pattern with this
trend of occupation segregation. The top three most selected majors among participants
in the present study are Investigative major (53.8%), Enterprising major (20.5%), and
Social major (12%). Self preferred occupations presented a similar trend. The top three
most preferred occupations are Investigative occupation (32.5%), Enterprising occupation
(22.1%), and Social occupations (24.1%).
As expected, Investigative and Enterprising majors/occupations are the leading
areas, which matched the historically observed trend. Social majors/occupations became
the third leading area in the current data, which was different from the historical trend
that Asian American students are less likely to choose a social science major/occupation.
Interestingly, the present data set also showed that fewer students chose Realistic majors
and occupations. Only 4% of students were in Realistic majors and 2% expected to enter
a Realistic occupation. These results indicated that the basic trend of occupation
segregation is observed in the current data with a lightly different switch. I suspect that
nowadays Asian American students are more willing to choose Social major/occupation
but less driven to choose Realistic major/occupation. However, given the fact that the
current data may not be a well representative sample for the whole Asian American
population, a better represented sample is needed to further examine this possible new
trend carefully.

- 76 -
Major/Occupation Congruence and Relative Functionalism
One of major hypotheses in the present study was that students in majors in which
Asian Americans are traditionally perceived to be successful may present lower
congruence than that of those students who are in atypical majors because students in
traditionally overrepresented major are more likely than students in atypical majors to
choose majors based on survival considerations rather than vocational interest. The
results of present study support this hypothesis. Significant differences of major-interest
congruence were found between Realistic, Investigative, Enterprising major vs. Artistic
and Social major. This means that major-interest congruence was significantly different
between traditionally represented majors (Realistic, Investigative, and Enterprising
majors) and atypically represented majors (Artistic and Social majors). More specifically,
major-interest congruence was higher in atypical represented majors than in traditionally
represented majors. Mean scores of major-interest congruence across RIASEC majors
ranking from the lowest to highest were: Realistic, Enterprising and Investigative, Social
and Conventional, and Artistic.
This finding matched with arguments made by early studies. Sue and Frank (1973)
suggested that children from Asian immigrant families are often encouraged to pursue
occupations that best help them to survive in the U.S. society and to avoid those
occupations that bring them direct contact with racial and cultural discriminations.
Moreover, Leong (1991) suggested that compared to European American students Asian
American students tend to place a higher value in selecting major/occupations that
provide prestige, income, and social status, which function as a strategy to attain upward

- 77 -
mobility and survival. This survival strategy can motivate Asian Americans to give up
their vocational interest and pursue majors/occupations that provide them security and
opportunities, which in turn impacts their interest-choice congruence.
In addition, the argument of perceived limited opportunity would impact Asian
American students’ career choice was also supported by the results of present study. In
the present study, occupation-interest congruence was significantly negatively correlated
to perceived opportunity (the greater the perceived limited opportunity, the lower the
occupation-interest fit) for students who have a Realistic major, or prefer Conventional
occupation, or parents not educated in the U.S. This may suggest that Asian American
students may pursue occupations that they perceived to have greater opportunities even in
the price that the chosen occupation may not necessarily match with their interest, and
this effect is particularly held true for students with above characteristics. Realistic and
Conventional occupations are areas Asian Americans traditionally entered, and these
areas are perceived to have more opportunities for Asian Americans. Moreover, Asian
immigrant parents who did not have education in the U.S. perceive limited opportunity in
their career, which may in turn impact the way they influence their children when
choosing majors/occupations.
Relative functionalism proposed by Sue and Okazaki (1990) further shed some
lights on explaining these findings. Sue and Okazaki (1990) in their study on academic
achievement of Asian American students discussed the need of mobility and survival
among Asian Americans. They argued that Asian Americans’ educational attainments are
greatly impacted by the opportunities present for upward mobility. Asian Americans

- 78 -
experience/perceive limited mobility in many areas where success does not heavily reply
on education. Several examples of such areas are sport, politics, and entertainment. When
mobility is limited in these areas, Asian Americans try to avoid these areas. A great
number of Asian Americans chose to enter education-dependent occupations to have a
higher chance of upward mobility. Sue and Okazaki called it relative functionalism. I
believe that a bi-product of relative functionalism is that Asian American students may
not choose their majors primarily based on their interest because their interest may lead
them to areas with limited opportunity/mobility for Asian Americans. Factors, such as
perceived opportunities, may become more important than interest in the decision making
process. Occupation segregation, thus, emerges as a result of survival.
Given the concept that relative functionalism helps to explain occupation
segregation, it is also possible that the segregated occupations may change when the
opportunity of upward mobility change along with the societal structure. Sue and
Okazaki (1990) presented a nice and condensed overview of societal changes over years
and its impact in Asian American community. They summarized that in 1940s Asian
American was discriminated and refused union membership which functioned as a block
for Asian American’s career path. Also, in general, Asian immigrants at that time
perceived career limitations and, therefore, avoid those fields such as the social sciences
and humanities, in which English facility and interpersonal skills specific to American
society are needed. After World War II the technological advancements and an
expanding economy required educated professionals and white collar employees, which
opened another door for Asian Americans. Mathematics and sciences are more likely to

- 79 -
emphasize technical competence, which presented an opportunity to Asian Americans.
From a relative functionalism perspective, pursuing higher education and acquiring
relevant skills serve the goals of upward mobility, and thus, motivate Asian American to
take action. Nowadays, increased opportunities for upward mobility make education a
less emphasized avenue for mobility. I believe that with a new focus on globalization,
social movement for diversity, and emergence of role models in social science, Asian
Americans may perceive more upward mobility in areas where opportunities are
traditionally limited for Asian Americans, which will in turn impact their choice of
education attainment and career path. More studies are needed to identify and shed light
on this possible new trend of occupation segregation.
Family Impact on Career Choice
The present study chose family impact as cultural specific factor for Asian
Americans and examined the association between different family variables
(intergeneration conflict, family obligation) and interest-choice congruence. The
intergeneration conflict was broken down into three components: intergeneration
conflicts on career/major related values, general conflicts, and family acculturation
conflict. Parents’ education background was also considered when examine the
association between congruence and family variables. It was hypothesized that the more
intergeneration conflict the lower choice-interest congruence. In addition, the more
perceived family obligation, the lower choice-interest congruence.

- 80 -
The results of present study, generally speaking, partially supported these
hypotheses. As expected, occupation-interest congruence was negatively correlated with
intergeneration conflicts on career/major related values, general conflicts, and family
acculturation conflicts. It was notable that correlation coefficients were not statistical
significant with the total data set, but statistical significance were found in male sample.
In other words, gender differences were found when examining family factors with
interest-choice congruence. This result suggested that family’s impact on Asian
Americans’ career choice is tempered by gender variable. Family factors and gender
variable should be considered together in understanding Asian American’s career choice.
More discussion of gender difference and family impacts on choice-interest congruence
are presented in the next section.
Interesting finding is that the occupation-interest congruence was positively
correlated to family obligation, which was opposite to the hypothesis (the more perceived
family obligation, the lower occupation-interest congruence). Nevertheless, Yee et al.
(2007) argued that family obligation can function both as a protective factor or a risk
factor for Asian Americans. On one hand, family obligation facilitates family
interdependency which can provide a powerful resource for Asian Americans. On the
other hand, family obligation creates a source of stress and may lead to the decision of
sacrificing one’s interest to achieve family’s interest. Thus, the present study raised a
question at the very beginning of whether family obligation function as a barrier or as a
support to interest-choice congruence? The results of the present study demonstrated that
family obligation facilitated occupation-interest congruence, supporting the argument that

- 81 -
family obligation functions as a positive contributing factor rather than barrier to Asian
American’s occupational congruence. It seemed that family obligation provides a strong
motivation to succeed for the good of one’s family. I suspected that Asian American
students may internalize their family obligation and translate it into their own expectation
in the early stage of career development. Therefore, family’s needs/interests were
developed into their own interests. More studies are needed to further shed lights on this
finding.
Gender Difference
Gender differences were found when examining the association between
occupation-interest congruence and family variables (intergeneration conflicts, family
obligation). Significant correlations were found between occupation-interest congruence
with intergeneration conflict and with family obligation for male participants but not
female participants. The statistically significant results indicated that, for male students
but not female students, the higher the intergeneration conflict the poorer the occupation-
interest fit, and the higher the family obligation (or stronger self belief on helping family)
the better the occupation-interest fit. Moreover, compared to female students male
students showed significant relation between occupation-interest congruence and self
belief on major/career related values. In other words, the greater male students believe
that their career can help family to achieve upward mobility, the better the occupation-
interest fit. This result was consistent with the finding that the greater perceived family
obligation the better occupation-interest fit for male students. Also, family acculturation

- 82 -
conflict were significantly negatively correlated to occupation-interest congruence for
male participants but not female participants, suggesting that the more severe of family
acculturation conflict, the lower the occupation-interest fit.
In summary, these above results suggested that compared to female Asian
American students, male Asian American students are more likely to be impacted by
intergeneration conflict and family obligation when they choose their career/major. This
result matched with the observation that male Asian Americans are assuming greater
family responsibilities than their female counterparts (Yee et al., 2007), and matched with
the argument that Asian American men tend to be more conforming, more obedient to
authority, and more connected to family control (Leong & Gupta, 2007).
Nguyen and Huang (2007) pointed out that Asian American parents in general are
restrictive on the children’s independence of social activities and occupational choice. It
is believed that Asian American men are brought up under strict gender role expectations,
and certain cultural values such as group harmony and filial piety, prominence in the
family, risk taking, and courageous behavior, are emphasized in the development process
(Liu & Chang, 2007). Liu and Chang further pointed out (2007) that Asian American
men are expected to fulfill their filial duties, such as maintaining family name,
conforming to the expectations of their parents, and carrying on culture and traditions. In
contrary, Asian American parents are more restrict to their female children on dating and
marriage (Yee et al., 2007), and may be less restrict on their career choice.

- 83 -
Limitations of the Study and Future Research
The present study confirmed that intergeneration conflict, family obligation,
gender, perceived opportunities, and acculturation impact Asian American students’
career choice and interest-choice congruence. With all these variables we are painting a
clearer picture of culturally specific framework for Asian American students’ career
choice. Occupation segregation still exists with a possibly slight shift in segregated areas.
Gender difference along with family variables continue to be of important factors that
impact Asian American students’ actual career choice and interest-choice congruence.
Contextual variables, such as perceived opportunities and acculturation, were confirmed
to impact Asian Americans’ career development and career choices. The concept of
adaptive culture or relative functionalism shed lights on explaining occupation
segregation and on explaining the lack of direct association between vocational interest
and career choice in Asian American population. However, the study of Asian
American’s career development and family impacts on career choices is still far beyond
completed. The present study indicated several limitations.
First of all, the data was primarily collected through one west-coast university and
Asian American audience that viewed a national website on a specific period of days.
The data may not efficiently represent Asian American population in general. Although
participants showed an age range from 18-45 in the present study, the target participants
were still college students. Moreover, less achieved Asian Americans and those who did
not make to college were barely included in the study due to the data collection

- 84 -
approaches. Therefore, the results and conclusions in the present study may not be
generalized to Asian American population in general.
Secondly, as a common limitation in other ethnic research, the present study was
unable to collect a large enough sample for each sub-ethnic group within Asian American
population as well as balance other diversity variables. The majority of participants
(45.8%) in the present study were Chinese American. It followed by Korean, Filipino,
and Vietnamese American. However, Asian American has a tremendous diversity within
the populations including country of origin difference, immigration status difference,
acculturation difference, and generational difference. Nguyen & Huang (2007) argued
that there are 28 ethnic groups within Asian American populations. In terms of the
generational difference, the term Asian American consists of Hmong who are relatively
recent immigrants, while the term Asian American also consists of Japanese, many
among whom are already the fifth generation or beyond in the U.S. The reasons of
immigration also vary within the group. All above diversities make it hard to use the
Asian American as a homogenous group when examining their career choices. Therefore,
the generalization of present study results was affected, and the inference needs to be
made cautiously.
Finally, the present study was focused on examining a few family variables and
other contextual variables, and the list of cultural variables that may impact Asian
American’s career choice was not complete. Some other variables may need to be
included in future research in addition to cultural specific variables that had been already
included in the present study. For example, based on several observations in the present

- 85 -
study, prestige is another variable that may greatly impact Asian American students’
career choice. For another example, Reeve and Heggestad (2004) described a
gravitational effect to explain the decision a person made to choose their jobs and
possible mobility of their jobs. They pointed out that, in addition to interest, individuals
make decision also on how their cognitive abilities matches with the jobs. In other words,
if their interests match with job environment (high vocational congruence) but their
cognitive abilities do not match with job requirement, individuals will chose to move
their jobs and they call this effect as gravitation effect. This concept may further provide
supplementary explanations on why Asian American students’ career choices do not
directly associate with their interest. Longitudinal research is also needed to further
examine how Asian Americans’ decision may change across the time, such as across
college years or life span.

- 86 -
References
Barcebal, M. L. (2009). Acculturation, emotion, and career choice in Filipino American women. Dissertation Abstracts International: Section B: Sciences and Engineering, 70(2-B), 1380.
Berry, J. W. (1980). Acculturation as varieties of adaptation. In A. Padilla (Ed.), Acculturation: Theory, models, and findings (pp. 9-25). Boulder, CO: Westview Press.
Berry, J. W. (2002). Conceptual approaches to acculturation. In K. M. Chun, P. B. Organista, & G. Marin (Eds.), Acculturation: Advances in theory, measurement, and applied research (pp. 17-37). Washington, DC, American Psychological Association.
Berry, J. W., & Annis, R. C. (1974). Acculturative stress: The role of ecology, culture and differentiation. Journal of Cross-Cultural Psychology, 5, 382-406.
Byars, A. M., & McCubbin, L. D. (2001). Trends in career development research with racial/ethnic minorities: Prospects and challenges. In J. G. Ponterotto, J. M. Casas, L. A. Suzuki, & C. M. Alexander (Eds.). Handbook of multicultural counseling (2nd ed., pp.633-654). Thousand Oaks, CA: Sage Publications.
Brown, S. D., & Gore, P. A., Jr. (1994). An evaluation of interest congruence indices: Distribution characteristics and measurement properties. Journal of Vocational Behavior, 45, 310–327.
Castelino, P. (2005). Factors influencing career choices of South Asian Americans: A path analysis. Dissertation Abstracts International: Section A: Humanities and Social Sciences, 65(8-A), 1380.
Chao, R., & Tseng, V. (2002). Parenting of Asians. In M. H. Bornstein (Ed.), Handbook of parenting: Vol. 4. Social conditions and applied parenting (end ed., pp. 59-93). Mahwah, NJ: Lawrence Erlbaum.
Chung, R. H. (2001). Gender, ethnicity, and acculturation in intergenerational conflict of Asian American college students. Cultural Diversity & Ethnic Minority Psychology, 7(4), 376-386.
Chung, R. C. Y., Bemak, F. (2007). Asian immigrants and refugees. In F. T. L. Leong, A. G. Inman, A. Ebreo, L. H. Yang, L. Kinoshita, & M. Fu (Eds.) Handbook of Asian American Psychology (2nd edition)(pp. 227-243). Thousand Oaks, CA: Sage Publication.

- 87 -
Day, S. X., & Rounds, J. (1998). Universality of vocational interest structure among racial and ethnic minorities. American Psychologist, 53(7), 728-736.
Eggerth, D. E., & Andrew, M. E. (2006). Modifying the C index for use with Holland codes of unequal length. Journal of Career Assessment, 14, 267-275.
Eggerth, D. E., Bowles, S. M., Tunick, R. H., & Andrew, M.E. (2005). Convergent validity of O*NET Holland code classifications. Journal of Career Assessment, 13, 150-170.
Ferry, T. R., Fouad, N. A., & Smith, P. L. (2000). The role of family context in a social cognitive model for career-related choice behavior: A math and science perspective. Journal of Vocational Behavior, 57, 348-364.
Fishbein, M. (1996). Behavioral science and public health: A necessary partnership for HIV prevention. Public Health Reports, 111 (Supl 1), 5-10.
Fouad, N. A., & Bingham, R. P. (1995). Career counseling with racial and ethnic minorities. In W. B. Walsh & S. H. Osipow (Eds.), Handbook of vocational psychology: Theory, research, and practice (2nd ed., pp.331-365). Mahwah, NJ: Lawrence Erlbaum.
Fouad, N. A., Kantamneni, N., Smothers, M. K., Chen, Y., Fitzpatrick, M., & Terry, S. (2008). Asian American career development: A qualitative analysis. Journal of Vocational Behavior, 72, 43-59.
Fuligni, A. J. (1998). Authority, autonomy, and parent-adolescent conflict and cohesion: A study of adolescents from Mexican, Chinese, Filipino, and European backgrounds. Developmental Psychology, 34, 782-792.
Fuligni, A. J., Tseng, V., & Lam, M. (1999). Attitudes toward family obligations among American adolescents with Asian, Latin American, and European backgrounds. Child Development, 70(4), 1030-1044.
Fuligni, A. J., Yip, T. & Tseng, V. (2002). The impact of family obligation on daily activities and psychological well-being of Chinese American adolescents. Child Development, 73(1), 302-314.
Garson, G. D. (2001). Guide to Writing Empirical Papers, Theses, and Dissertations. Retrieved from http://www2.chass.ncsu.edu/garson/pa765/structur.htm
Gore, P. A., Jr., & Brown, S. D. (2006). Simpler may still be better: A reply to Eggerth and Andrew. Journal of Career Assessment, 14, 276-282.

- 88 -
Gupta, S. & Tracey, T. J. G. (2005). Dharma and Interest-Occupation Congruence in Asian Indian College Students. Journal of Career Assessment, 13, 320-336.
Hsia, J. (1988). Asian Americans in higher education and at work. Hillsdale, NY: Lawrence Erlbaum Associates.
Hu, L., & Bentler, P. M. (1998). Fit indices in covariance structure modeling: Sensitivity to underparameteriezed model misspecification. Psychological Methods, 3, 424-453.
Hu, L., & Bentler, P. M. (1999). Cutoff criteria for fit indexes in covariance structure analysis: Conventional criteria versus new alternatives. Structural Equation Modeling, 6, 1-55.
Holland, J. L. (1973). Making vocational choices: A theory of careers. Englewood Cliffs, NJ: Prentice Hall.
Holland, J. L. (1997). Making vocational choices (3rd Ed.). Odessa, FL: Psychological Assessment Resources.
Hutchinson, T. P. (2000). Measuring the Agreement of Several Three-Letter Holland Codes for One Person. Journal of Employment Counseling, 37(3), 160-162.
Iachan, R. (1984). A measure of agreement for use with the Holland classification system. Journal of Vocational Behavior, 24, 133-141.
Iachan, R. (1990). Some extensions of the Iachan congruence index. Journal of Vocational Behavior, 36, 176–180.
Inman, A. G. & Yeh, C. J. (2007). Asian American Stress and Coping. In F. T. L. Leong, A. G. Inman, A. Ebreo, L. H. Yang, L. Kinoshita, & M. Fu (Eds.) Handbook of Asian American Psychology (2nd ed., pp.323-339). Thousand Oaks, CA: Sage Publication.
Kim, B. S. K. (2007). Acculturation and Enculturation. In F. T. L. Leong, A. G. Inman, A. Ebreo, L. H. Yang, L. Kinoshita, & M. Fu (Eds.) Handbook of Asian American Psychology (2nd ed., pp.141-158). Thousand Oaks, CA: Sage Publication.
Kwak, J. C., & Pulvino, C. J. (1982). A mathematical model for comparing Holland’s personality and environmental codes. Journal of Vocational Behavior, 21, 231-241
Lachterman, B., & Meir, E. I. (2004). The impact of work setting congruence on well-being. Journal of Career Assessment, 12(2), 150-168.

- 89 -
Lee, R. M., Choe, J., Kim, G. & Ngo, V. (2000). Construction of the Asian American Family Conflicts Scale. Journal of Counseling Psychology, 47(2), 211-222.
Lee, S. M. (2009). Asian American social workers: Exploring relationships among factors influencing career choices. Dissertation Abstracts International: Section B: Sciences and Engineering, 70(1-A), 351.
Lent, E. B., & Lopez, F. G. (1996). Congruence from many angles: Relations of multiple congruence indices to job satisfaction among adult workers. Journal of Vocational Behavior, 49, 24–37.
Lent, R. W., Brown, S. D., & Hackett, G. (1994). Toward a unifying social cognitive theory of career and academic interest, choice, and performance. Journal of Vocational Behavior, 45, 79-122.
Lent, R. W., Brown, S. D., & Hackett, G. (2004). Contextual supports and barriers to career choice: A social cognitive analysis. Journal of Counseling Psychology, 47, 36-49.
Lent, R. W., Brown, S. D., Sheu, H.B., Schmidt, J., Brenner, B. R., Gloster, C. S., & et al. (2005). Social cognitive predictors of academic interests and goals in engineering: Utility for women and students at historically Black universities. Journal of Counseling Psychology, 52, 84-92.
Lent, R. W., & Brown, S. D. (2006). Integrating person and situation perspectives on work satisfaction: A social-cognitive view. Journal of Vocational Behavior, 69, 236-247.
Lent, R.W. (2005). A social cognitive view of career development and counseling. In S.D. Brown, & R.W. Lent (Eds.), Career development and counseling: Putting theory and research to work (pp. 101-127). New York: Wiley.
Lent, R. W., Paixao, M. P., Silva, J. T. leitao, L. M. (2010). Predicting occupational interests and choice aspirations in Portuguese high school students: A test of social cognitive career theory. Journal of Vocational Behavior, 76, 244-251.
Leong, F. T. L. (1998). Career development and vocational behavior. In Lee C. Lee, & Nolan W. S. Zane (Eds.) Handbook of Asian American Psychology (pp. 359-398). Thousand Oaks, CA: Sage Publication.
Leong, F. T. L., & Chou, E. L. (1994). The role of ethnic identity and acculturation in the vocational behavior of Asian Americans: An integrative review. Journal of Vocational Behavior, 44, 155-172.

- 90 -
Leong, F. T. L., & Gupta, A. (2007). Career development and vocational behaviors of Asian Americans. In F. T. L. Leong, A. G. Inman, A. Ebreo, L. H. Yang, L. Kinoshita, & M. Fu (Eds.) Handbook of Asian American Psychology (2nd ed., pp. 159-178). Thousand Oaks, CA: Sage Publication.
Leong, F. T. L., & Hardin, E. (2002). Career psychology of Asian Americans: Cultural validity and cultural specificity. In G. Nagayama & S. Okazaki (Eds.), Asian American psychology: The science of lives in context (pp. 131-152). Washington, DC: American Psychological Association.
Leong, F. T. L., & Serafica, F. C. (1995). Career development of Asian Americans: A research area of in need of a good theory. In F. Leong (Ed.), Career development and vocational behaviors of racial and ethnic minorities (pp. 67-102). Hillsdale, NY: Erlbaum.
Leong, F. T. L., & Tata, S. P. (1990). Sex and acculturation differences in occupational values among Chinese American children. Journal of Counseling Psychology, 37, 208-212.
Leung, S. A., Ivey, D., & Suzuki, L. (1994). Factors affecting the career aspirations of Asian Americans. Journal of Counseling & Development, 72, 404-410.
Liu, W. M., & Chang, T. (2007). Asian American Masculinities. In F. T. L. Leong, A. G. Inman, A. Ebreo, L. H. Yang, L. Kinoshita, & M. Fu (Eds.) Handbook of Asian American Psychology (2nd ed., pp. 197-211). Thousand Oaks, CA: Sage Publication.
Liu, W. M., Pope-Davis, D. B., Nevitt, J., & Toporek, R. L. (1999). Understanding the function of acculturation and prejudicial attitudes among Asian Americans. Cultural Diversity & Ethnic Minority Psychology, 5, 317-328.
Meir, E. I. (1995). Elaboration of the relation between interest congruence and satisfaction. Journal of Career Assessment, 3, 341–346.
Meir, E. I., & Melamed, S. (2005). Occupational specialty congruence: New data and future directions. Journal of Vocational Behavior, 67(1), 21-34.
Ma, P. W., & Yeh, C. J. (2005). Factors influencing the career decision status of Chinese American youth. Career Development Quarterly, 53, 337-347.
Nguyen, L., Huang, L. N. (2007). Understanding Asian American youth development: A social ecological perspective. In F. T. L. Leong, A. G. Inman, A. Ebreo, L. H. Yang, L. Kinoshita, & M. Fu (Eds.) Handbook of Asian American Psychology (2nd ed., pp. 87-103). Thousand Oaks, CA: Sage Publication.

- 91 -
Okagaki, L., & Bojczyk, K. E. (2002). Perspectives on Asian American development. In G. Nagayama-Hall & S. Okazaki (Eds.), Asian American psychology: The science of lives in context (pp.67-104). Washington DC: American Psychological Association.
Okazaki, S. (2002). Beyond questionnaires: Conceptual and methodological innovations in Asian American psychology. In G. Nagayama-Hall & S. Okazaki (Eds.), Asian American psychology: The science of lives in context (pp. 13-40). Washington DC: American Psychological Association.
Okubo, Y., Yeh, C. J., Lin, P.-Y., Fujita, K., & Shea, J. M.-Y. (2007). The career decision-making process of Chinese American youth. Journal of Counseling & Development, 85(4), 440-449.
Ponterotto, J. G., Baluch, S., & Carielli, D. (1998). The Suinn–Lew Asian Self-Identity Scale (SL-ASIA): Critique and research recommendations. Measurement and Evaluation in Counseling and Development, 31, 109–124.
Reeve, C.L., & Heggestad, E.D. (2004). Differential relations between general cognitive ability and interest-vocation fit. Journal of Occupational and Organizational Psychology, 77, 385-402.
Rounds, J., Armstrong, P., Liao, H.Y., Lewis, P., & Rivkin, D. (2008). Second generation Occupational Interest Profiles for the O*NET system: Summary. The National Center for O*NET Development. Retrieved from http://www.onetcenter.org/research.html#development
Rounds, J., McKenna, M. C., Hubert, L., & Day, S. X. (2000). Tinsley on Holland: A misshapen argument. Journal of Vocational Behavior, 56, 205-215.
Rounds, J., Smith, T., Hubert, L., Lewis, P., & Rivkin, D. (1999). Development of Occupational Interest Profiles for O*NET. The National Center for O*NET Development. Retrieved from http://www.onetcenter.org/research.html#development
Ryder, A. G., Alden, L. E., & Paulhus, D. L. (2000). Is acculturation unidimensional or bidimensional? A head-to-head comparison in the prediction of personality, self-identity, and adjustment. Journal of Personality and Social Psychology, 79(1), 49-65.
Slaughter-Defoe, D. T., Nakagawa, K., Takanishi, R., & Johnson, D. J. (1990). Toward cultural/ecological perspectives on scholloing and achievement in African- and Asian-American children. Child Development, 61, 363-383.

- 92 -
Solberg, V. S., Ritsma, S., Davis, B. J., Tata, S. P., & Jolly, A. (1994). Asian-American students’ severity of problems and willingness to seek help from university counseling centers: Role of previous counseling experience gender, and ethnicity. Journal of Counseling Psychology, 41(3), 275-279.
Spokane, A. R., Meir, E. I., & Catalano, M. (2000). Person-Environment congruence and Holland’s theory: A review and reconsideration. Journal of Vocational Behavior, 57, 137-187.
Sue, D. W., & Sue, D. (2003). Counseling the culturally diverse: theory and practice (4th ed.). New York, NY: Wiley.
Sue, S. & Okazaki, S. (1990). Asian-American Educational Achievements: A phenomenon in Search of an Explanation. American Psychologist, 45(8), 913-920.
Sung, B. L. (1985). Bicultural conflicts in Chinese immigrant children. Journal of Comparative Family Studies Special Issue: Family, Kinship and Ethnic Identity Among the Overseas Chinese, 16, 255-269.
Szapocznik, J., Scopetta, M. A., Kurtines, W., & Aranalde, M. A. (1978). Theory and measurement of acculturation. Interamerican Journal of Psychology, 12, 113-120.
Tang, M., Fouad, N. A., & Smith, P.L. (1999). Asian American’s career choices: A path model to examine factors influencing their career choices. Journal of Vocational Behavior, 54, 142-157.
Tinsley, H. E. A. (2000). The congruence myth: An analysis of the efficacy of the person-environment fit model. Journal of Vocational Behavior, 56, 147-179.
Tracey, T. J. G. (in press). Relation of interest and self-efficacy occupational congruence and career choice certainty. Journal of Vocational Behavior.
Tsai, J. L., Ying, Y., & Lee, P. A. (2000). The meaning of “being Chinese” and “being American”: Variation among Chinese American young adults. Journal of Cross-Cultural Psychology, 31(3), 302-332.
Tsai, J. L., Chentsova-Dutton, Y., & Wong, Y. (2002). Why and how researchers should study ethnic identity, acculturation, and cultural orientation. In G. Nagayama & S. Okazaki (Eds.), Asian American psychology: The science of lives in context (pp. 41-65). Washington, DC: American Psychological Association.

- 93 -
Tsai-Chae, A. H., & Nagata, D. K. (2008). Asian values and perceptions of intergenerational family conflict among Asian American students. Cultural Diversity and Ethnic Minority Psychology, 14(3), 205-214.
Tseng, V., Chao, R. K., & Padmawidjaja, I. A. (2007). Asian Americans’ educational experiences. In F. T. L. Leong, A. G. Inman, A. Ebreo, L. H. Yang, L. Kinoshita, & M. Fu (Eds.) Handbook of Asian American Psychology (2nd ed., pp. 105-123). Thousand Oaks, CA: Sage Publication.
Tziner, A., Meir, E. I., & Segal, H. (2002). Occupational congruence and personal task-related attributes: How do they relate to work performance? Journal of Career Assessment, 10(4), 401-412.
Wall, J. E., & Baker, H. E. (1997). The Interest-Finder: Evidence of validity. Journal of Career Assessment, 5, 255–273.
Wall, J. E., Wise, L. L., & Baker, H. E. (1996). Development of the Interest Finder: A new RIASEC-based interest inventory. Measurement and Evaluation in Counseling and Development, 29, 134–152.
Whiston, S. C., & Keller, B. K. (2004). The influences of the family of origin on career development: a Review and analysis. The Counseling Psychologist, 32(4), 493-568.
Yee, B. W. K., DeBaryshe, B. D., Yuen, S., Kim, S. Y., & McCubbin, H. I. (2007). Asian American and Pacific Islander family: Resiliency and life-span socialization in a cultural context. In F. T. L. Leong, A. G. Inman, A. Ebreo, L. H. Yang, L. Kinoshita, & M. Fu (Eds.) Handbook of Asian American Psychology (2nd ed., pp. 69-86). Thousand Oaks, CA: Sage Publication.
Young, G., Tokar, D. M., & Subich, L. M. (1998). Congruence revisited: Do 11 indices differentially predict job satisfaction and its relation moderated by person and situation variables? Journal of Vocational Behavior, 52, 208–223.

- 94 -
Appendix A
Figures
Figure A1. Holland’s Hexagonal Model.
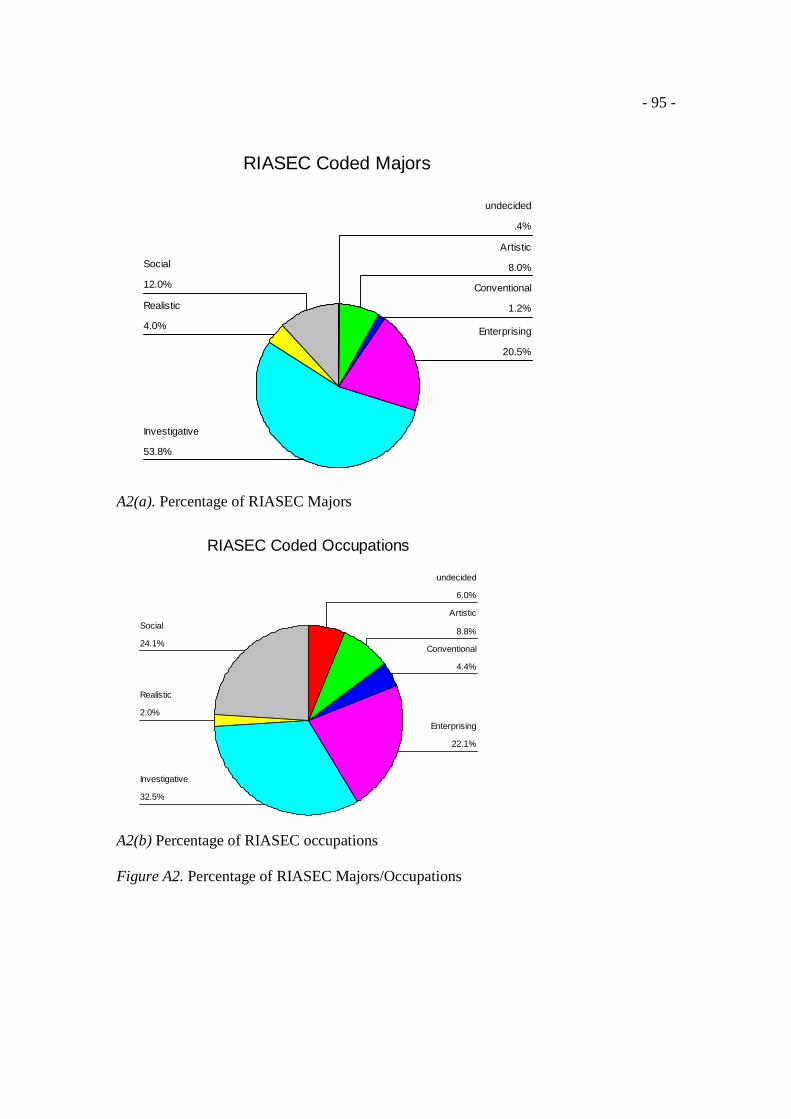
- 95 -
RIASEC Coded Majors
12.0%
4.0%
53.8%
20.5%
1.2%
8.0%
.4%
Social
Realistic
Investigative
Enterprising
Conventional
Artistic
undecided
A2(a). Percentage of RIASEC Majors
RIASEC Coded Occupations
24.1%
2.0%
32.5%
22.1%
4.4%
8.8%
6.0%
Social
Realistic
Investigative
Enterprising
Conventional
Artistic
undecided
A2(b) Percentage of RIASEC occupations Figure A2. Percentage of RIASEC Majors/Occupations

- 96 -
Group of majors
ConventionalEnterprisingSocialArtisticInvestigativeRealistic
Mea
n of
maj
or-in
tere
st c
ongr
uenc
e---
FLH
D
4.0
3.8
3.6
3.4
3.2
3.0
2.8
2.6
2.4
A3(a). Mean of major-interest congruence across RIASEC majors with FLHD index
Group of Majors
ConventionalEnterprisingSocialArtisticInvestigativeRealistic
Mea
n of
maj
or-in
tere
st c
ongr
uenc
e---
C in
dex
14
13
12
11
10
9
8
A3(b). Mean of major-interest congruence across RIASEC majors with C index
Group of majors
ConventionalEnterprisingSocialArtisticInvestigativeRealistic
Mea
n of
maj
or-in
tere
st c
ongr
uenc
e---
M in
dex
24
22
20
18
16
14
12
10
8
A3(c). Mean of major-interest congruence across RIASEC majors with M index Figure A3. Mean of Major-Interest Congruence across RIASEC Majors

- 97 -
Figure A4. Mean of Congruence across Generation Status

- 98 -
Figure A5. Mean of Congruence across Asian Acculturation

- 99 -
Figure A6. Mean of Congruence across American Acculturation

- 100 -
Appendix B
Tables
Table B1
Participants’ Cultural Heritage
Frequency Percent Identified single cultural heritage
1 Chinese 114 45.78 2 Korean 28 11.24 3 Filipino 21 8.43 4 Vietnamese 20 8.03 5 Taiwanese 15 6.02 6 Japanese 9 3.61 7 Indian 7 2.81 8 Hmong 6 2.41 9 Thai 5 2.01
10 Cambodian 3 1.20 11 Chinese/Vietnamese 3 1.20 12 Laos 3 1.20 13 Indonesian 1 .40 14 Tibetan 1 .40
Identified bi-cultural heritage
1 Chinese/Filipino 2 .80 2 Chinese/Lao 1 .40 3 Indian/Black. 1 .40 4 Indo-Nepalese Hinduism 1 .40 5 Japanese/polish 1 .40 6 Taiwanese/Japanese 1 .40
Other (did not specify countries, e.g., Asian, South Asian) 6 2.41
Total 249 100

- 101 -
Table B2
Illustrative Weights for Assessing Agreement Between Two Three-letter Codes
IPSF code (judge 2) Self expected occupation code (judge 1) First letter Second letter Third letter
First letter 22 10 4
Second letter 10 5 2
Third letter 4 2 1
Note. The present table was edited based on the Table 1 provided in the Ichan’s (1984)
article.

- 102 -
Table B3
Summary Statistics of Measures
Total Male Female Measure n M SD n M SD n M SD t p
Acculturation 1 249 67.95 12.80 76 67.53 13.30 172 68.19 12.70 -.37 .71
Acculturation 2 249 69.28 11.30 76 68.04 12.00 172 69.83 11.10 -1.15 .25
Value 1 247 40.20 7.65 76 38.43 6.83 170 41.09 7.79 -2.56* .01
Value 2 247 35.34 7.60 76 34.61 7.94 170 35.74 7.41 -1.08 .28
Conflict 1 247 8.24 6.35 76 8.46 6.47 170 8.18 6.31 .32 .75
Conflict 2 238 19.93 7.46 73 19.25 7.74 164 20.27 7.34 -.98 .33
Conflict 3 226 20.75 9.07 67 18.93 8.35 158 21.59 9.26 -2.03* .04
Family Obligation 225 26.94 6.08 67 26.51 6.37 157 27.12 5.98 -.69 .49
Perceived Opportunity 224 11.54 4.38 67 11.70 4.62 156 11.52 4.27 .29 .78
Note. Acculturation 1 = Vancouver Index of Acculturation scale (heritage dimension). Acculturation 2 = Vancouver Index of Acculturation scale (mainstream culture dimension). Value 1 = parents’ belief on career/major related value. Value 2 = students’ belief on career/major related value. Conflict 1 = subscale of intergeneration conflict on career/major related value. Conflict 2 = general intergeneration conflict with severity measure. Conflict 3 = family acculturation conflict scale with severity measure. * p < .05

- 103 -
Table B4
Correlations of Measures
Measure 1 2 3 4 5 6 7 8 9
1. Acculturation 1 1
2. Acculturation 2 0.48** 1
3. Value 1 0.09 0.08 1
4. Value 2 0.35** 0.18** 0.37** 1
5. Conflict 1 -0.23** -0.04 0.23** -0.50** 1
6. Conflict 2 -0.13* -0.10 0.45** -0.03 0.35** 1
7. Conflict 3 -0.10 -0.04 0.53** -0.06 0.47** 0.74** 1
8. Family Obligation 0.01 -0.14* 0.25** 0.19* -0.04 0.30** 0.23** 1
9. Perceived Opportunity 0.36** 0.19** 0.30** 0.62** -0.34** 0.02 -0.01 0.22** 1
Note. Acculturation 1 = Vancouver Index of Acculturation scale (heritage dimension). Acculturation 2 = Vancouver Index of Acculturation scale (mainstream culture dimension). Value 1 = parents’ belief on career/major related value. Value 2 = students’ belief on career/major related value. Conflict 1 = subscale of intergeneration conflict on career/major related value. Conflict 2 = general intergeneration conflict with severity measure. Conflict 3 = family acculturation conflict scale with severity measure. * p < .05 ** p < .01

- 104 -
Table B5
Summary of Two Types of Congruence With Three Congruence Indices
Total Male Female M SD n M SD n M SD n Major-interest Congruence FLHD index (range from 1to 4) 3.01 .97 219 3.00 1.03 65 3.02 .95 153 C index (range from 0 to 18) 10.96 3.41 219 10.71 3.51 65 11.10 3.36 153 M index (range from 0 to 28) 15.46 8.23 219 15.71 8.14 65 15.36 8.32 153 Occupation-interest Congruence FLHD index 2.99 1.02 207 2.98 .98 62 2.99 1.04 144 C index 10.72 3.84 207 10.29 3.51 62 10.85 3.93 144 M index 16.73 7.84 207 16.27 7.41 62 16.85 8.01 144
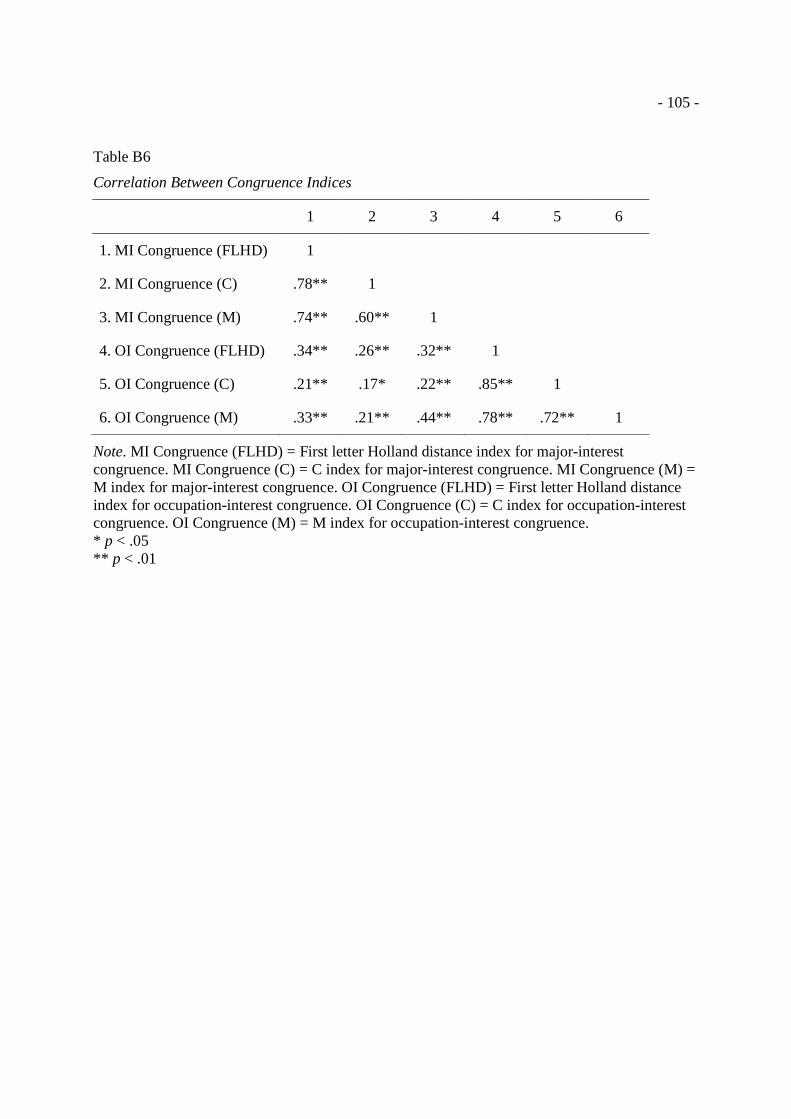
- 105 -
Table B6
Correlation Between Congruence Indices
1 2 3 4 5 6
1. MI Congruence (FLHD) 1
2. MI Congruence (C) .78** 1
3. MI Congruence (M) .74** .60** 1
4. OI Congruence (FLHD) .34** .26** .32** 1
5. OI Congruence (C) .21** .17* .22** .85** 1
6. OI Congruence (M) .33** .21** .44** .78** .72** 1
Note. MI Congruence (FLHD) = First letter Holland distance index for major-interest congruence. MI Congruence (C) = C index for major-interest congruence. MI Congruence (M) = M index for major-interest congruence. OI Congruence (FLHD) = First letter Holland distance index for occupation-interest congruence. OI Congruence (C) = C index for occupation-interest congruence. OI Congruence (M) = M index for occupation-interest congruence. * p < .05 ** p < .01

- 106 -
Table B7
Results of the ANOVA for Congruence Indices Across RIASEC Majors
Sum of Squares df
Mean Square F p
Major-interest congruence across RIASEC majors FLHD index Between Groups 25.45 5 5.09 6.01** <.001 Within Groups 180.5 213 .85 Total 206 218 C index Between Groups 251 5 50.20 4.69** <.001 Within Groups 2281 213 10.70 Total 2532 218 M index Between Groups 1707 5 341 5.57** <.001 Within Groups 13050 213 61.30 Total 14756 218 Major-interest congruence across academic classes FLHD index Between Groups 11.89 4 2.97 3.24* .01 Within Groups 166.1 181 .92 Total 178 185 C index Between Groups 119.3 4 29.8 2.62* .04 Within Groups 2059 181 11.4 Total 2179 185 M index Between Groups 284.8 4 71.2 1.04 .39 Within Groups 12400 181 68.5 Total 12685 185 Occupation-interest congruence across academic classes FLHD index Between Groups 2.987 4 .75 .73 .57 Within Groups 172.9 170 1.02 Total 175.9 174 C index Between Groups 26.15 4 6.54 .46 .77 Within Groups 2441 170 14.4 Total 2467 174 M index Between Groups 226.4 4 56.6 .93 .45 Within Groups 10325 170 60.7 Total 10552 174

- 107 -
Table B8
Mean Comparison Between Each Pair of RIASEC Majors
FLHD index C index M index
(I) major
(J) major
Mean Difference
(I-J) p
Mean Difference
(I-J) p
Mean Difference
(I-J) p R I -.39 .25 -.65 .17 -3.49 .22 A -.24** < .001 -.74** < .001 -11.9** <.001 S -1.06* .01 -.24* .02 -8.42* .01 E -.27 .44 -1.29 .30 -4.54 .13 C -.17 .06 -2.00 .37 -8.83 .10 I R .39 .25 1.65 .17 3.49 .22 A -.85** <.001 -3.09** <.001 -8.38** <.001 S -.67** <.001 -1.59* .03 -4.93** <.001 E .12 .46 0.35 .53 -1.05 .44 C -.78 .15 -0.35 .85 -5.34 .24
A R 1.24** <.001 4.74** <.001 11.87** <.001 I .85** <.001 3.09** <.001 8.38** <.001 S .18 .53 1.50 .13 3.45 .15 E .97** <.001 3.45** <.001 7.33** <.001 C .07 .90 2.74 .18 3.04 .53
S R 1.06* .01 3.24* .02 8.42* .01 I .67** <.001 1.59* .03 4.93** <.001 A -.18 .53 -1.50 .13 -3.45 .15 E .79** <.001 1.95* .02 3.88* .05 C -.11 .85 1.24 .54 -0.41 .93
E R .27 .44 1.29 .30 4.54 .13 I -.12 .46 -.35 .53 1.05 .44 A -.97** <.001 -3.45** <.001 -7.33** <.001 S -.79** <.001 -1.95* .02 -3.88* .05 C -.90 .10 -.71 .72 -4.29 .36
C R 1.17 .06 2 .37 8.83 .10 I .78 .15 .35 .85 5.34 .24 A -.07 .90 -2.74 .18 -3.04 .53 S .11 .85 -1.24 .54 .41 .93 E .90 .10 .71 .72 4.29 .36
Note. R = Realistic major. I = Investigative major. A = Artistic major. S = Social major. E = Enterprising major. C = Conventional major. * p < .05 ** P < .01.

- 108 -
Table B9
Mean Comparison Between Generation Status
FLHD index C index M index (I)
Generation status
(J) Generation
status
Mean Difference
(I-J) p
Mean Difference
(I-J) p
Mean Difference
(I-J) p Occupation-interest congruence
1 generation 1.5 generation -.56 .29 -1.15 .57 -8.67* .03 2 generation -.43 .40 -.79 .69 -8.62* .03 3 or beyond -1.00 .08 -2.46 .26 -12.6** <.001 1.5 generation 1 generation .56 .29 1.15 .57 8.67* .03 2 generation .13 .43 .36 .58 .05 .97 3 or beyond -.44 .16 -1.32 .26 -3.9 .10 2 generation 1 generation .43 .40 .79 .69 8.62* .03 1.5 generation -.13 .43 -.36 .58 -.05 .97 3 or beyond -.57 .05 -1.68 .12 -3.95 .07 3 or beyond 1 generation 1.00 .08 2.46 .26 12.57** <.001 1.5 generation .44 .16 1.32 .26 3.91 .10 2 generation .57 .05 1.68 .12 3.95 .07
* p < .05 ** p < .01.

- 109 -
Table B10
Correlation Between Congruence and Acculturation
Correlations Total Male Female
Acculturation
1
Acculturation
2
Acculturation
1
Acculturation
2
Acculturation
1
Acculturation
2
MI Congruence (FLHD) r -.02 -.09 .06 .10 -.07 -.20*
p (.73) (.18) (.66) (.43) (.40) (.02)
MI Congruence (C) r -.06 -.04 -.04 .08 -.07 -.10
p (.38) (.57) (.72) (.54) (.36) (.21)
MI Congruence (M) r -.03 -.04 .08 .22 -.08 -.20
p (.67) (.57) (.53) (.07) (.34) (.06)
OI Congruence (FLHD) r .10 .12 .21 .23 .05 .08
p (.17) (.08) (.11) (.08) (.53) (.35)
OI Congruence (C) r .12 .13 .13 .29* .13 .07
p (.08) (.06) (.33) (.02) (.12) (.41)
OI Congruence (M) r .12 .07 .39** .29* .02 -0
p. (.08) (.33) (0) (.02) (.82) (.77)
Note. MI Congruence (FLHD) = First letter Holland distance index for major-interest congruence. MI Congruence (C) = C index for major-interest congruence. MI Congruence (M) = M index for major-interest congruence. OI Congruence (FLHD) = First letter Holland distance index for occupation-interest congruence. OI Congruence (C) = C index for occupation-interest congruence. OI Congruence (M) = M index for occupation-interest congruence. Acculturation 1 = Vancouver Index of Acculturation scale (heritage dimension). Acculturation 2 = Vancouver Index of Acculturation scale (mainstream culture dimension).
**. p < .01 *. p < .05

- 110 -
Table B11
Mean Comparison of Occupation-interest Congruence Between Each Pair of American Acculturation Levels
FLHD index C index M index
Acculturation with American culture
Mean Difference
(I-J) p
Mean Difference
(I-J) p
Mean Difference
(I-J) p (I)
Acculturation
(J)
Acculturation
low middle -1.36* .03 -3.68 .19 -5.31 .56
high -1.21 .06 -3.46 .23 -4.15 .89
middle low 1.36* .03 3.68 .19 5.31 .56
high .15 .95 .22 1 1.16 .94
high low 1.21 .06 3.46 .23 4.15 .89
middle -.15 .95 -.22 1 -1.16 .94
* p < .05

- 111 -
Table B12
Correlation Results Between Occupation-interest Congruence and Three Variables Across Different Gender Groups
Total (n =207) Male (n = 62) Female (n = 144) Measures FLHD C M FLHD C M FLHD C M Values Value 1 -.05 -.06 -.06 -.17 -.21 -.12 <.001 .01 -.03 Value 2 .04 .07 .07 .08 .16 .26* .03 .05 <-.001 Intergeneration conflict
Conflict 1 .02 -.04 -.06 .03 -.07 -.13 .01 -.02 -.02 Conflict 2 -.02 -.06 -.06 -.09 -.21 -.18 .02 < .001 <.001 Conflict 3 -.07 -.11 -.10 -.28* -.36** -.36** .01 -.03 -.01 Family Obligation .08 0.11 .12 .11 .19 .41** .07 .08 <.001 Perceived Opportunity -.02 -.06 .02 -.14 -.16 -.11 .04 < -.001 .10
Note. Value 1 = parents’ belief on career/major related value. Value 2 = students’ belief on career/major related value. Conflict 1 = subscale of intergeneration conflict on career/major related value. Conflict 2 = general intergeneration conflict with severity measure. Conflict 3 = family acculturation conflict scale with severity measure. * p < .05 ** p < .01

- 112 -
Table B13
Correlation Results Between Occupation-interest Congruence and Three Variables Across RIASEC Occupations
Social (n=53) Enterprising (n=46) Conventional (n=11)
Measures FLHD C M FLHD C M FLHD C M
Values
Value 1 -.01 -.02 .05 .08 .02 .07 -.58 -.45 -.53
Value 2 .12 .07 .17 .34* .36* .43** .29 .54 .56
Intergeneration conflict
Conflict 1 -.04 -.10 -.11 -.22 -.33* -.29 -.27 -.60 -.55
Conflict 2 .21 .03 .06 -.09 -.14 -.09 -.60 -.70* -.80**
Conflict 3 < .001 <-.001 -.07 -.17 -.27 -.20 -.64* -.86** -.66*
Family Obligation .16 .22 .35** .30* .28 .38* -.14 .29 .27
Perceived Opportunity .20 .19 .24 -.28 -.23 -.19 -.59 -.63* -.58
Note. Value 1 = parents’ belief on career/major related value. Value 2 = students’ belief on career/major related value. Conflict 1 = subscale of intergeneration conflict on career/major related value. Conflict 2 = general intergeneration conflict with severity measure. Conflict 3 = family acculturation conflict scale with severity measure. * p < .05 ** p < .01

- 113 -
Table B14
Correlation Results Between Occupation-interest Congruence and Three Variables Across RIASEC Majors
Investigative (n=106) Social (n=25)
Measures FLHD C M FLHD C M
Values
Value 1 -.21* -.21* -.20* .04 .08 .10
Value 2 -.13 -.09 -.06 .40 .33 .32
Intergeneration conflict
Conflict 1 .10 .08 .04 -.42* -.34 -.34
Conflict 2 -.07 -.10 -.07 -.09 -.16 .03
Conflict 3 -.09 -.11 -.03 -.39 -.25 -.26
Family Obligation -.05 -.05 -.03 .28 .29 .31
Perceived Opportunity -.12 -.18 -.05 .07 .07 .13
Note. Value 1 = parents’ belief on career/major related value. Value 2 = students’ belief on career/major related value. Conflict 1 = subscale of intergeneration conflict on career/major related value. Conflict 2 = general intergeneration conflict with severity measure. Conflict 3 = family acculturation conflict scale with severity measure. * p < .05

- 114 -
Table B15
Correlation Results Between Occupation-interest Congruence and Three Variables Across Parents’ Education
Parents educated in U.S.
(n=104)
Parents not educated in U.S.
(n=100)
Measures FLHD C M FLHD C M
Values
Value 1 -.03 -.03 -.04 -.09 -.12 -.07
Value 2 -.02 .04 .12 .14 .12 .04
Intergeneration conflicts
Conflict 1 .07 -.02 -.08 -.07 -.09 -.05
Conflict 2 < -.001 -.03 -.02 -.19 -.22* -.16
Conflict 3 -.03 -.09 -.12 -.15 -.18 -.11
Family Obligation .18 .21* .28** <.001 .02 < .001
Perceived Opportunity .12 .08 .19 -.21* -.26* .18
Note. Value 1 = parents’ belief on career/major related value. Value 2 = students’ belief on career/major related value. Conflict 1 = subscale of intergeneration conflict on career/major related value. Conflict 2 = general intergeneration conflict with severity measure. Conflict 3 = family acculturation conflict scale with severity measure. * p < .05 ** p < .01
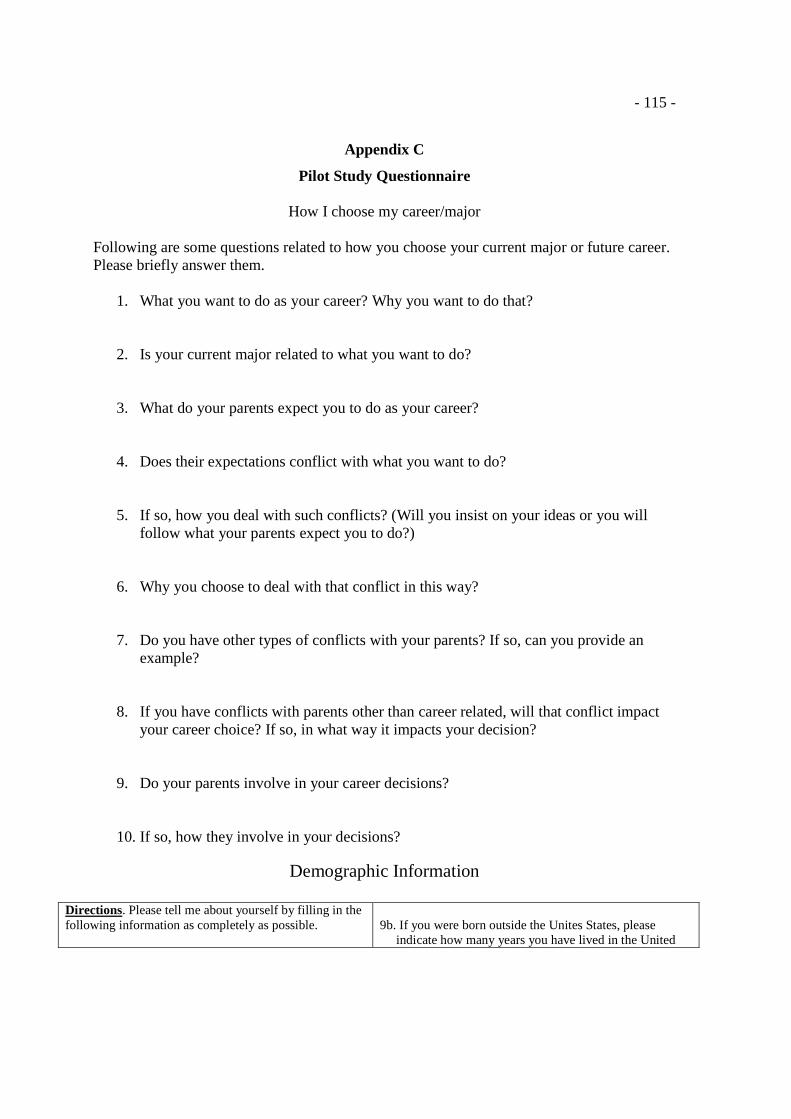
- 115 -
Appendix C
Pilot Study Questionnaire
How I choose my career/major Following are some questions related to how you choose your current major or future career. Please briefly answer them.
1. What you want to do as your career? Why you want to do that? 2. Is your current major related to what you want to do?
3. What do your parents expect you to do as your career? 4. Does their expectations conflict with what you want to do?
5. If so, how you deal with such conflicts? (Will you insist on your ideas or you will
follow what your parents expect you to do?) 6. Why you choose to deal with that conflict in this way?
7. Do you have other types of conflicts with your parents? If so, can you provide an example?
8. If you have conflicts with parents other than career related, will that conflict impact your career choice? If so, in what way it impacts your decision?
9. Do your parents involve in your career decisions?
10. If so, how they involve in your decisions?
Demographic Information
Directions. Please tell me about yourself by filling in the following information as completely as possible.
9b. If you were born outside the Unites States, please
indicate how many years you have lived in the United

- 116 -
1. Age: ____________ 2. Gender: ___ Male ___ Female 3. Class Standing: a. Freshman b. Sophomore c. Junior d. Senior e. Grad 4. Academic Major (please specify major and
department) . 5a. Where you come from (e.g. Chicago, IL)?
___________________________
5b. What is/are your cultural heritage(s)? (e.g. Chinese, Korean, Filipino) _____________________________________ 6. What is your racial identity?
a. Asian/Asian American/Pacific Islander b. Black/African American c. Native American d. Non-Hispanic White e. Hispanic
f. Biracial/multiracial g. Other (please specify ______________)
7. Please specify your ethnicity (i.e., Puerto Rican,
Chinese, Indian). . 9a. What is your generation status a. First generation (was born outside the United States
and come to U.S. after 16) b. 1.5 generation (was born outside the United States
and come to U.S. after 5) c. Second generation (was born in U.S., but parents
are first or 1.5 generation) d. Third generation or beyond
States. . 10. The number of siblings you have. a. I am the only child b. 2 or less c. 3 to 5 d. 6 or more 11a. Did your parents get education in American education
system? � Yes � No 11b. If your answer is yes for 12a, please indicate what
education your parents obtained in American education system, and how many years?
____________________________________________ 12. Please indicate your guardians’ household income: a. $19,000 or less b. $20,000 to $39,000 c. $40,000 to $59,000 d. $60,000 to $79,000 e. $80,000 and above
Thank you for your responses!

- 117 -
Appendix D
Questionnaire
Informed Consent to Participate in Research
You are invited to participate in a research project on family’s impact on Asian American’s career decisions. The purpose of this project is to help career counselors better understand Asian American clients’ career behaviors, thoughts, and concerns on choosing majors and careers. The results of current study may be presented in conferences and/or submitted to psychology journals. The Responsible Project Investigator for this project is Prof. James Rounds (Department of Educational Psychology, University of Illinois at Urbana Champaign). Anyone over age 18 who identifies him/herself as Asian American is welcome to participate. Individuals who identify themselves as Asian (e.g., Asian international students, Asian immigrants who do not have parents with them in the U.S. or have lived in the U.S. for less than 8 years) will not be the target participants for this study because the present study focuses on Asian American college students who have been raised through their adolescent years under two cultures. In this project, you will be asked to complete a questionnaire measuring your attitude towards different activities and your experience of interacting with your parents. The estimated completion of the survey is approximately 40 minutes. You will receive one hour of research credit for completing the questionnaire if you are either in the Psychology 100 subject pool or Educational Psychology Subject Pool at UIUC. Your responses will be kept completely confidential. Your email will be collected at the beginning of the questionnaire, and it is collected only for the purpose of granting research credits. Once the research credit has been granted to you, your email address will be deleted. If you don’t need any research credits, you do not need to provide your email. Also, your parent/guardian’s phone number or email account or mailing address will be asked at the end of the study. Providing this information is optional. Once you provide this information, your parents/guardians will be contacted to complete a short survey about their expectations toward your career development. It will take about 5 minutes for your parents/guardians to complete the survey. Whether or not you grant your permission for the researcher to contact your parents will not impact you to get your research credits.Your online response will be confidentially stored in a data set. The data will be stored in a password protected computer in a locked office. Only investigators can access to this data. Your participation in this research is completely voluntary. Your choice to participate or not will not impact your status at the university or your grades in classes. Completing this questionnaire may cause you to reflect on your attitude toward some activities and your feelings about yourself, your thoughts, behaviors, past experiences of interacting with your parents. It is possible that answering some questions may remind you of some negative feelings. You have the right to refuse to participate in this project without penalty. In addition, if at any point you wish to stop participating, you may do so without penalty. If you have any questions later, please contact Xuhua Qin at [email protected] . If you have questions about your rights as a research participant you may contact the University of Illinois Institutional Review Board at (217) 333-2670 (collect calls are accepted), or by email at [email protected]. By clicking on the "Begin Survey" button, you confirm that: a) you understand the above information and voluntarily consent to participate in the research project described above, and b) you identify yourself as Asian American, and c) you are 18 years or older. You may print and keep a copy of this consent form. Completing this survey signifies your consent.

- 118 -
If you are willing to participate in the study described above, please click on the “Begin Survey” button. NEXT

- 119 -
Interest Profile Short Form The following items are designed to help you explore your vocational interests by rating the extent to which you would like to do certain activities. To complete these items, circle the number that most closely represents how you feel about each of the activities.
Strongly Dislike
Dislike Neutral Like Strongly Like
1 2 3 4 5
1 Build kitchen cabinets 1 2 3 4 5
2 Teach an individual an exercise routine 1 2 3 4 5
3 Buy and sell stocks and bonds 1 2 3 4 5
4 Manage a retail store 1 2 3 4 5
5 Develop a spreadsheet using computer software 1 2 3 4 5
6 Proofread records or forms 1 2 3 4 5
7 Lay brick or tile 1 2 3 4 5
8 Help people with personal or emotional problems 1 2 3 4 5
9 Operate a beauty salon or barber shop 1 2 3 4 5
10 Monitor a machine on an assembly line 1 2 3 4 5 11 Repair household appliances 1 2 3 4 5
12 Write books or plays 1 2 3 4 5
13 Play a musical instrument 1 2 3 4 5
14 Teach children how to read 1 2 3 4 5
15 Load computer software into a large computer network 1 2 3 4 5
16 Study ways to reduce water pollution 1 2 3 4 5
17 Give career guidance to people 1 2 3 4 5
18 Raise fish in a fish hatchery 1 2 3 4 5
19 Compose or arrange music 1 2 3 4 5
20 Operate a calculator 1 2 3 4 5
21 Assemble electronic parts 1 2 3 4 5
22 Drive a truck to deliver packages to offices and homes 1 2 3 4 5
23 Perform rehabilitation therapy 1 2 3 4 5
24 Do volunteer work at a non-profit organization 1 2 3 4 5
25 Conduct chemical experiments 1 2 3 4 5
26 Draw pictures 1 2 3 4 5
27 Create special effects for movies 1 2 3 4 5

- 120 -
28 Teach sign language to people with hearing disabilities 1 2 3 4 5
29 Manage a department within a large company 1 2 3 4 5
30 Keep shipping and receiving records 1 2 3 4 5
31 Study the movement of planets 1 2 3 4 5
32 Help conduct a group therapy session 1 2 3 4 5
33 Calculate the wages of employees 1 2 3 4 5
34 Examine blood samples using a microscope 1 2 3 4 5
35 Investigate the cause of a fire 1 2 3 4 5
36 Paint sets for plays 1 2 3 4 5
37 Start your own business 1 2 3 4 5
38 Negotiate business contracts 1 2 3 4 5
39 Inventory supplies using a hand-held computer 1 2 3 4 5
40 Design sets for plays 1 2 3 4 5
41 Represent a client in a lawsuit 1 2 3 4 5
42 Develop a way to better predict the weather 1 2 3 4 5
43 Work in a biology lab 1 2 3 4 5
44 Write scripts for movies or television shows 1 2 3 4 5
45 Market a new line of clothing 1 2 3 4 5
46 Test the quality of parts before shipment 1 2 3 4 5
47 Invent a replacement for sugar 1 2 3 4 5
48 Perform jazz or tap dance 1 2 3 4 5
49 Take care of children at a day-care center 1 2 3 4 5
50 Sell merchandise at a department store 1 2 3 4 5
51 Record rent payments 1 2 3 4 5
52 Repair and install locks 1 2 3 4 5
53 Manage a clothing store 1 2 3 4 5
54 Keep inventory records 1 2 3 4 5
55 Set up and operate machines to make products 1 2 3 4 5
56 Do laboratory tests to identify diseases 1 2 3 4 5
57 Study weather conditions 1 2 3 4 5
58 Edit movies 1 2 3 4 5
59 Teach a high-school class 1 2 3 4 5
60 Stamp, sort, and distribute mail for an organization 1 2 3 4 5
In this section, you will read descriptions about six different sets of interests that many people have. Individuals can have an interest in certain things even if they are not

- 121 -
necessarily good at all the activities. Please rate each of the following descriptions according to how much you like each set of descriptions.
Strongly Dislike
Dislike Neutral Like Strongly Like
1 2 3 4 5
1 • Interested in building and repairing activities. • Enjoy jobs that produce tangible results, such as
technology and engineering. 1 2 3 4 5
2 • Interested in science (gathering information, uncovering new facts or theories, and analyzing or interpreting data)
• Might enjoy careers such as medicine, mathematics, and psychology.
1 2 3 4 5
3 • Interested in self-expression and activities that are associated with the arts, both in leisure activities as well as in vocational activities or environments.
• Might enjoy careers such as music, writing, and interior decorating.
1 2 3 4 5
4 • Interested in helping people and prefer to solve problems through interacting with others.
• Might enjoy careers such as teaching, counseling, social work.
1 2 3 4 5
5 • Interested in persuading others and seeking positions of leadership.
• Might enjoy careers such as marketing, business, and management.
1 2 3 4 5
6 • Interested in activities that require attention to detail, accuracy and organization.
• Might enjoy careers such as accounting, computer systems analysis.
1 2 3 4 5

- 122 -
Vancouver Index of Acculturation Please answer following questions as carefully as possible by CIRCLING ONE of the numbers to the right of each question to indicate your degree of agreement or disagreement.
Many of these questions will refer to your HERITAGE CULTURE, meaning the culture that has influenced you the most (other than mainstream American culture). It may be the culture of your birth, the culture in which you have been raised, or another culture that forms part of your background. If there are several such cultures, pick the one that has influenced you the MOST (e.g., Irish, Chinese, Mexican, Black). If you do not feel that you have been influenced by any other culture, please try to identify a culture that may have had an impact on previous generations of your family.
Please write your HERITAGE CULTURE in the space provided. __________________________ Use the following key to help guide your answers:
Strongly Disagree
Disagree Neutral/ Depends
Agree Strongly Agree
1 2 3 4 5 6 7 8 9
1. I often participate in my heritage cultural traditions………………………………………...
1 2 3 4 5 6 7 8 9
2. I often participate in mainstream American cultural traditions………………………………..
1 2 3 4 5 6 7 8 9
3. I would be willing to date a person from my heritage culture…………………………………..
1 2 3 4 5 6 7 8 9
4. I would be willing to date a mainstream American………………………………………
1 2 3 4 5 6 7 8 9
5. I enjoy social activities with people from the same heritage culture as myself……………….
1 2 3 4 5 6 7 8 9
6. I enjoy social activities with typical mainstream Americans…………………………..
1 2 3 4 5 6 7 8 9
7. I am comfortable working with people of the same heritage culture as myself………….....
1 2 3 4 5 6 7 8 9
8. I am comfortable working with typical mainstream Americans…………………………..
1 2 3 4 5 6 7 8 9
9. I enjoy entertainment (e.g., movies, music) from my heritage culture………………………..
1 2 3 4 5 6 7 8 9
10. I enjoy mainstream American entertainment (e.g., movies, music)…………………………….
1 2 3 4 5 6 7 8 9

- 123 -
11. I often behave in ways that are typical of my heritage culture…………………………………
1 2 3 4 5 6 7 8 9
Strongly Disagree
Disagree Neutral/ Depends
Agree Strongly Agree
1 2 3 4 5 6 7 8 9
12. I often behave in ways that are typically mainstream American……………………………
1 2 3 4 5 6 7 8 9
13. It is important for me to maintain or develop the practices of my heritage culture…………...
1 2 3 4 5 6 7 8 9
14. It is important for me to maintain or develop mainstream American cultural practices………...
1 2 3 4 5 6 7 8 9
15. I believe in the values of my heritage culture……………………………………………
1 2 3 4 5 6 7 8 9
16. I believe in mainstream American values…. 1 2 3 4 5 6 7 8 9
17. I enjoy the jokes and the humor of my heritage culture…………………………………..
1 2 3 4 5 6 7 8 9
18. I enjoy typical mainstream American jokes and humor……………………………………….
1 2 3 4 5 6 7 8 9
19. I am interested in having friends from my heritage culture………………………………….
1 2 3 4 5 6 7 8 9
20. I am interested in having mainstream American friends………………………………..
1 2 3 4 5 6 7 8 9

- 124 -
Asian American Family Impact Scale Asian American Intergeneration Conflict Item Pool The following items are designed to explore how your family impacts you on choosing your majors/careers. To complete these items, circle the number that most closely represents the degree you think your parents would agree with the statement, and the degree you agree with the statement. Read each statement and answer the following questions using the following rating scales:
Strongly Disagree
Disagree Neutral Agree Strongly Agree
1 2 3 4 5
My parents believe that: Strongly Strongly Disagree Agree
I believe that: Strongly Strongly Disagree Agree
1. Succeeding occupationally is an important way of making your family proud.
1…..2…..3…..4…..5 1…..2…..3…..4…..5
2. Getting into a good school reflects well on your family.
1…..2…..3…..4…..5 1…..2…..3…..4…..5
3. Failing academically brings shame to your family
1…..2…..3…..4…..5 1…..2…..3…..4…..5
4. You should go as far as you can academically and professionally on behalf of your family
1…..2…..3…..4…..5 1…..2…..3…..4…..5
5. Your academic and occupational reputation reflects on the family’s reputation.
1…..2…..3…..4…..5 1…..2…..3…..4…..5
6. It is an important way to show your appreciation for your family by succeeding in school and work.
1…..2…..3…..4…..5 1…..2…..3…..4…..5
7. It is your duty to bring honor through achievements to your family.
1…..2…..3…..4…..5 1…..2…..3…..4…..5
8. You should work hard so that you won’t be a disappointment to your family.
1…..2…..3…..4…..5 1…..2…..3…..4…..5
9. You should bring respect to family by having a high prestige job.
1…..2…..3…..4…..5 1…..2…..3…..4…..5
10. You should secure family’s financial 1…..2…..3…..4…..5 1…..2…..3…..4…..5
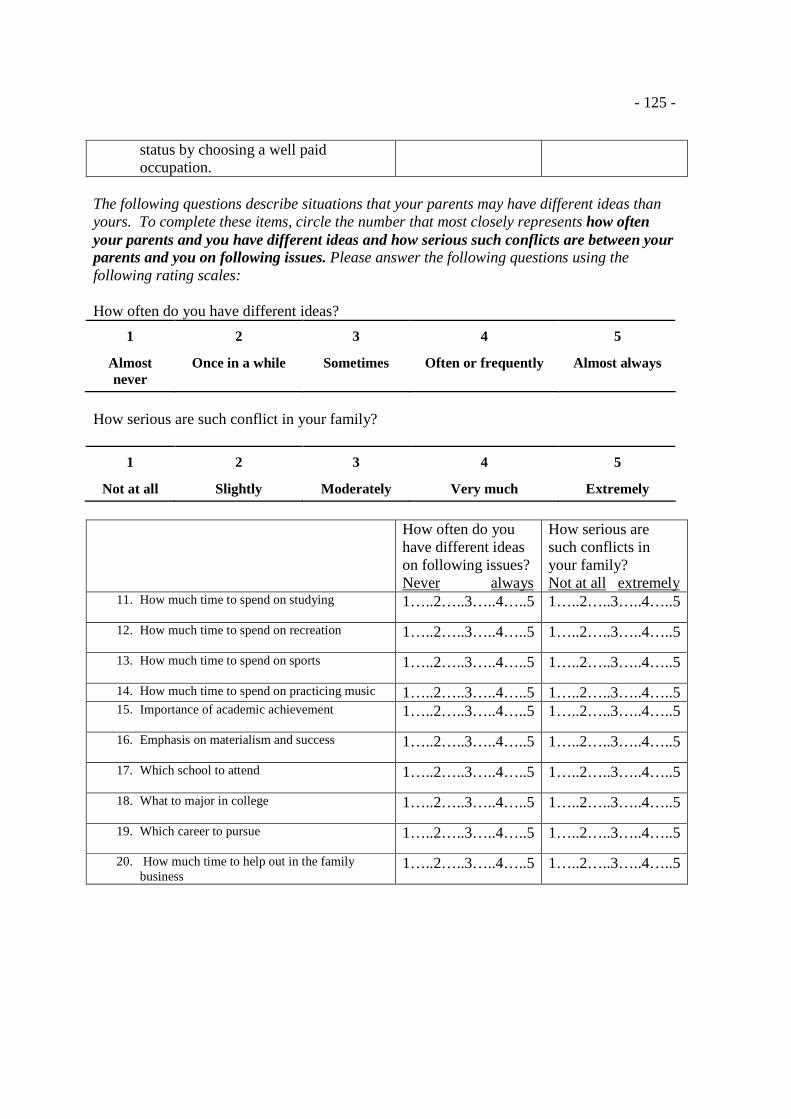
- 125 -
status by choosing a well paid occupation.
The following questions describe situations that your parents may have different ideas than yours. To complete these items, circle the number that most closely represents how often your parents and you have different ideas and how serious such conflicts are between your parents and you on following issues. Please answer the following questions using the following rating scales: How often do you have different ideas?
1 2 3 4 5
Almost never
Once in a while Sometimes Often or frequently Almost always
How serious are such conflict in your family?
1 2 3 4 5
Not at all Slightly Moderately Very much Extremely
How often do you have different ideas on following issues? Never always
How serious are such conflicts in your family? Not at all extremely
11. How much time to spend on studying
1…..2…..3…..4…..5 1…..2…..3…..4…..5
12. How much time to spend on recreation
1…..2…..3…..4…..5 1…..2…..3…..4…..5
13. How much time to spend on sports
1…..2…..3…..4…..5 1…..2…..3…..4…..5
14. How much time to spend on practicing music 1…..2…..3…..4…..5 1…..2…..3…..4…..5 15. Importance of academic achievement
1…..2…..3…..4…..5 1…..2…..3…..4…..5
16. Emphasis on materialism and success
1…..2…..3…..4…..5 1…..2…..3…..4…..5
17. Which school to attend
1…..2…..3…..4…..5 1…..2…..3…..4…..5
18. What to major in college
1…..2…..3…..4…..5 1…..2…..3…..4…..5
19. Which career to pursue
1…..2…..3…..4…..5 1…..2…..3…..4…..5
20. How much time to help out in the family business
1…..2…..3…..4…..5 1…..2…..3…..4…..5

- 126 -
Family Obligation Item Pool The following questions ask about your feeling toward your family. Please rate how much you agree with each of the following statements using the following rating scales:
Strongly Disagree
Disagree Neutral Agree Strongly Agree
1 2 3 4 5
21. I feel obligated to follow my parent’s ideas about the choice of majors/careers
1 2 3 4 5
22. I feel it is my duty to achieve financial success to raise my family’s social status in the society
1 2 3 4 5
23. I feel like I owe my parents because they have sacrificed a lot for me
1 2 3 4 5
24. I feel obligated to keep peace in the family 1 2 3 4 5
25. I feel that I need to do things to please my parents 1 2 3 4 5
26. I feel that I need to make my parents proud 1 2 3 4 5
27. I feel that I must not argue with my parents 1 2 3 4 5
28. I feel that I have to take my parents’ advice 1 2 3 4 5

- 127 -
Perceived Opportunities Item Pool The following questions ask about your perception of working opportunities in society. Please rate how much you agree with each of following statements using the following rating scales:
Strongly Disagree
Disagree Neutral Agree Strongly Agree
1 2 3 4 5
29. I feel that I have fewer career options than students of other races.
1 2 3 4 5
30. I can only succeed in a small number of majors/careers.
1 2 3 4 5
31. I have more chances to succeed if I enter the same occupation as my parent’s occupation.
1 2 3 4 5
32. I feel that my career opportunities are limited by my ethnicity/race/language
1 2 3 4 5
33. I have opportunities to succeed in almost any major/career that I choose.
1 2 3 4 5

- 128 -
Demographic Information
Directions. Please answer the questions on this page as completely as possible. 1. Age: ____________ 2. Sex: ___ Male ___ Female 3. Class Standing: a. Freshman b. Sophomore c. Junior d. Senior e. Graduate student 4. Have you declared your major? � Yes � No 5. What is your academic major (please specify major
and department). If undecided, please list possible major(s). .
6. What occupation do you want to pursue after graduation?
7. What occupation do your parents/guardian want you to pursue after graduation? _________________________________________
8. What is your racial identity? (check all that applied)
a. Asian/Asian American b. Black/African American c. Native American d. Non-Hispanic White e. Hispanic
f. Other (please specify ______________)
9. Please specify your cultural & ethnic heritage(s) (i.e., Chinese, Korean, Indian).
.
10. What is your generation status? a. First generation (was born outside the United States
and came to U.S. after age 16) b. 1.5 generation (was born outside the United States and
came to U.S. after age 5) c. Second generation (was born in U.S., but one or both
parents are first or 1.5 generation) d. Third generation or beyond (was born in US, parents
were born in US as well) 11. If you were born outside the Unites States, please
indicate how many years you have lived in the United States.
. 12. How many siblings do you have? a. 0 b. 1 or 2 c. 3 to 5 d. 6 or more 13. Did your mother or father obtain their education in the
American education system? � Yes � No 14. If your answer is yes for 13, please indicate what
education your parent(s) obtained in American education system, and for how many years?
____________________________________________ ____________________________________________ 15. What are your parents’ occupations? (Please be specific.
For example, rather than writing “self-employed” or “business owner,” specify “owns a convenience shop” rather than “a lawyer,” write “law firm partner”)
Mother ______________________ Father ______________________
Thank you for your responses!