Embed Size (px)
Citation preview
FamReiin th
A RepFoster
By Kerry D
milyimbhe Uport fror Care
DeVooght,
y FobursU.S.om a 2Provid
Child Tren
ostesem 2012 Nder Cla
ds, and De
er Cmen
Nationassific
ennis Blaze
Carent R
al Surcations
ey
© Child Tre
e ate
vey ons and R
ends 2013. May
es
n FamRates
ApPublication
be reprinted wi
ily
ril 9, 2013 #2013‐19 th citation.
1
AcknowledgmentsThe Family Foster Care Provider Classifications and Rates survey (an add‐on component to the 2008/2010 Casey Child Welfare Financing Survey) was funded by the Annie E. Casey Foundation and Casey Family Programs. The views in this report do not necessarily reflect the positions of the sponsoring organizations, but rather are those of the authors. The authors would foremost like to express their gratitude to the staff at the state child welfare agencies for the time and effort they dedicated to completing the survey. States donated numerous hours and staff resources to this research, and were diligent in working to ensure that the data they provided were accurate and thorough. We are so appreciative of their contributions, without which this report would not be possible. We also thank our funders and project officers at the Annie E. Casey Foundation and Casey Family Programs for their financial support of this research and the consultation they provided us throughout the project. Additionally, we would like to acknowledge the assistance of Hope Cooper of True North Group for her review and feedback on this report. Finally, we are grateful for individuals who reviewed the survey instrument prior to its dissemination: specifically, we thank Anita Light, Don Schmid, Pat Wilson and Don Winstead for their assistance in this process.
2
ExecutiveSummaryThis report presents findings from a national survey of states’ family foster care provider classifications and rates. The “standard” or “general” payment to foster care providers in family settings is often referred to as the “basic” rate, though specific terminology for this rate level varies. Previous research has documented the tremendous variation in basic family foster care rates across the country (e.g., Hitting the M.A.R.C.: Establishing Foster Care Minimum Adequate Rates for Children, 2007; National Resource Center on Family‐Centered Practice and Permanency Planning at the Hunter College School of Social Work (last updated 2008); Los Angeles County Department of Child and Family Services (last updated 2011)). However, less is known about the various levels within the “family foster care” category in states, including what proportion of children receive higher‐level payments (i.e., higher than the basic rate), and how the determination is made to classify children or providers into particular payment rate categories.
Since not all children in family foster homes receive the basic rate—and in some states relatively few children receive this rate—describing states’ full rate structures is essential to a more accurate understanding of the financial support provided to foster parents around the country. This survey aimed to produce a more comprehensive picture of both the commonalities and variations between states in family foster care payments.
In addition to the findings presented in the main report, a brief profile document for each state is presented summarizing the state’s family foster care rates and policies. These detailed state profiles can be found in Section 3 of the report. Key findings include:
All states responding to the survey (n=46) classify children into different payment levels of family foster care. In other words, no state utilizes only a single rate for children in family foster homes that applies across the state for all children. States vary widely in the number of different payment “levels” or “categories” they use, however. Some states have as few as two rate levels for children in family foster homes (e.g., “Basic rate” and “Special Board Rate”), while several states reported 10 or more payment categories.
The basic family foster care rates in most states vary by a child’s age, and in most cases the rates increase incrementally by age. Of the 40 states reporting age‐related breakdowns for their basic rates, the most common ages in which rate changes occur are at ages 5 or 6 (with 27 states reporting a change at one of these ages) and ages 12 or 13 (with 37 states reporting a rate change at one of these ages). The single most common age at which transitions occur is 6, with 21 states reporting a rate change for 6 year olds.
In the majority of states providing information about the proportion of the family foster care caseload receiving basic rates vs. higher‐level rates, most children receive the basic rate. However, in some states, the minority of children receive the basic rate. Substantial variation exists across states in the use of the basic rate. Of the states that could provide us with caseload percentages (just over half of the those surveyed), the percent of children in family foster homes receiving the basic rates ranged from a low of 14% in one state, to a high of greater than 90% in several other states.
The basic foster care rates in the majority of states fall below our estimate of the costs of caring for a child. A comparison of the basic rates for various age groups to a computed estimate (based on USDA data) of the cost of caring for a child of that age range in that region of the country show that only a small number of states have rates that meet or exceed this estimate. A number of states have rates that represent less than half of the estimated cost of care.
3
Most states report that foster care providers are given additional allowances for personal incidentals in addition to the daily rates. These include payment or reimbursement for such items as books and school supplies, diapers, clothing (or emergency clothing), and holidays/birthdays. States vary widely on the specific incidental payments provided, and the amounts, however; ranging from itemized amounts for specific categories (e.g., $35 per month for allowance for children; $30 per year for holidays/birthdays), to overall maximums for broader categories (e.g., $3,000 per child per year for clothing/incidentals). See the state rate profiles in Section 3 for more detail on the additional payments provided in each state. These additional payments are important to keep in mind when interpreting the foster care per diem rates in states, and particularly when comparing rates across states.
4
FAMILY FOSTER CARE REIMBURSEMENT RATES IN THE U.S. A REPORT FROM A 2012 NATIONAL SURVEY OF FAMILY FOSTER CARE PROVIDER CLASSIFICATIONS AND RATES
IntroductionIn the United States, states are charged with ensuring that children who have been removed from their homes due to abuse or neglect are well cared for in their out‐of‐home placements. Foster care providers are responsible for directly providing the shelter, food, clothing, supervision, educational necessities, and other personal incidentals required to promote the safety, permanency, and well‐being of children in their care. To assist them in meeting the children’s needs, child welfare agencies offer a payment (or reimbursement) to the providers. Although the Federal government has certain requirements regarding the provision of foster care payments (if the state chooses to seek Federal reimbursement for some of the costs for children in care through the title IV‐E program), there are no national requirements regarding the specific payment structures or amounts provided.1 Rather, states have considerable discretion in designing and administering their own foster care payment systems. In some cases, the authority to establish the rates lies with the individual counties or localities across the state. Children in foster care may be placed in a variety of settings, including family foster homes, group homes, and institutions, and states might have separate payment rates for each type of setting. Further, within individual settings, a variety of payment “levels” or “categories” may exist, depending on the characteristics of the child and/or the provider (such as a child’s age, whether or not s/he requires additional support services in the placement, a provider’s certification level, etc.). As a result, the question of “How much does a foster parent in [state] receive?” does not have a simple answer. Additionally, tremendous variation exists across the country in states’ approaches to their foster care payment systems, including how the rates are set, how often rates are revised, how many types of foster placements exist, and how children (and possibly the placement providers themselves) are classified into different payment levels. For this report, Child Trends, with support from the Annie E. Casey Foundation and Casey Family Programs, surveyed states about their payment rate structures for a specific type of foster care placement: the family foster home (also referred to as a “foster family home.”) According to the Federal government, a “foster family home” refers to “…for the purposes of title IV‐E eligibility, the home of an individual or family licensed or approved as meeting the standards established by the State licensing or approval authority(ies) (or with respect to foster family homes on or near Indian reservations, by the tribal licensing or approval authority(ies)), that provides 24‐hour out‐of‐home care for children” (Code of Federal Regulations, title 45, sec. 1355.20). Foster family homes differ from other types of foster care placements in that the child resides in a family‐based setting in a residence, as opposed to a congregate care setting such as a group home or an institution. According to Federal data, 296,217 children resided in foster family homes (with either relatives or non‐relatives) in the U.S. at the end of FY 2011 (U.S. DHHS, 2012). This represents nearly three‐quarters (74%) of all children in care at that time, making foster family homes the most common placement setting for foster children. Foster family homes can be seen as a less‐restrictive and more “family‐like” setting for a child who has been removed from home, and thus some consider this to be a preferable environment for a child in foster care (as opposed to a congregate care setting) as long as his/her needs are adequately met in this placement type. Sometimes children with higher‐level needs require a greater level of supervision or specialized care from a foster parent to remain safely in a foster home setting. As such, states may offer higher reimbursement
1 See U.S. Congressional Research Service (2012) for a detailed overview of the title IV‐E foster care maintenance program.
5
rates to foster parents caring for these children, to allow for children with higher‐level needs to be cared for in these family settings. This survey addresses the gaps in available data regarding family foster care rates by documenting and describing both the rates and the processes utilized by states to classify children (and/or providers) into various settings. Additionally, the survey collected information on the frequency with which states revise their rates.2 Thus, the report provides an important array of detail not previously available on a national basis, which will be valuable for policymakers, advocates, and other key stakeholders at the federal, state, and local levels. The report comprises four sections:
Section 1: Summary of state family foster care provider classifications and rates
Section 2: Basic family foster care rates: A closer look
Section 3: State family foster care rate profiles
Section 4: Appendix: Attachments to state profiles
2 Although the survey was not designed to capture information on how states set their rates and did not include specific questions
targeting this information (e.g., the methodologies used to establish reimbursement amounts) some states did provide this information. Several states noted using cost estimates from the United States Department of Agriculture (USDA) to assess and/or revise their rates. One state reported using the HHS Federal Poverty Guideline for the state in their methodology, while another adjusts their family foster care rates based on a state‐specific inflation index. For a discussion of rate‐setting methodology as collected through a 2007 survey by the National Association of Public Child Welfare Administrators (NAPCWA), see Hitting the M.A.R.C. (2007).
6
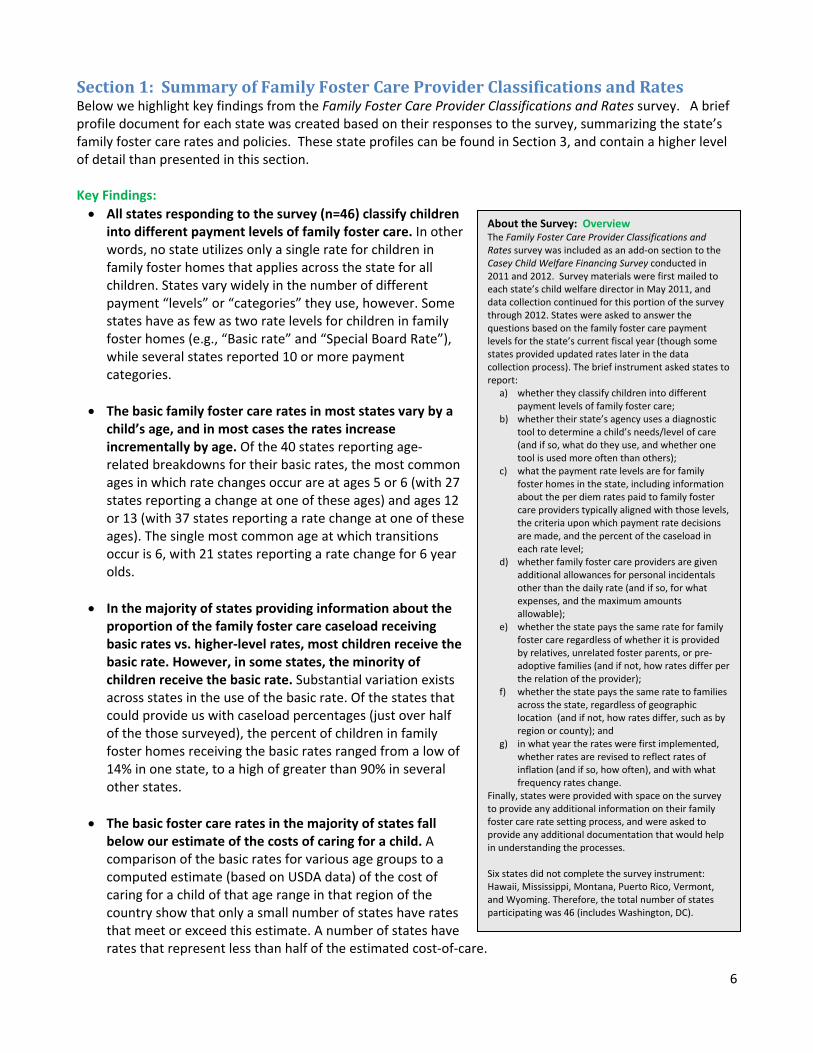
Section1:SummaryofFamilyFosterCareProviderClassificationsandRatesBelow we highlight key findings from the Family Foster Care Provider Classifications and Rates survey. A brief profile document for each state was created based on their responses to the survey, summarizing the state’s family foster care rates and policies. These state profiles can be found in Section 3, and contain a higher level of detail than presented in this section. Key Findings:
All states responding to the survey (n=46) classify children into different payment levels of family foster care. In other words, no state utilizes only a single rate for children in family foster homes that applies across the state for all children. States vary widely in the number of different payment “levels” or “categories” they use, however. Some states have as few as two rate levels for children in family foster homes (e.g., “Basic rate” and “Special Board Rate”), while several states reported 10 or more payment categories.
The basic family foster care rates in most states vary by a child’s age, and in most cases the rates increase incrementally by age. Of the 40 states reporting age‐related breakdowns for their basic rates, the most common ages in which rate changes occur are at ages 5 or 6 (with 27 states reporting a change at one of these ages) and ages 12 or 13 (with 37 states reporting a rate change at one of these ages). The single most common age at which transitions occur is 6, with 21 states reporting a rate change for 6 year olds.
In the majority of states providing information about the proportion of the family foster care caseload receiving basic rates vs. higher‐level rates, most children receive the basic rate. However, in some states, the minority of children receive the basic rate. Substantial variation exists across states in the use of the basic rate. Of the states that could provide us with caseload percentages (just over half of the those surveyed), the percent of children in family foster homes receiving the basic rates ranged from a low of 14% in one state, to a high of greater than 90% in several other states.
The basic foster care rates in the majority of states fall below our estimate of the costs of caring for a child. A comparison of the basic rates for various age groups to a computed estimate (based on USDA data) of the cost of caring for a child of that age range in that region of the country show that only a small number of states have rates that meet or exceed this estimate. A number of states have rates that represent less than half of the estimated cost‐of‐care.
About the Survey: Overview The Family Foster Care Provider Classifications and Rates survey was included as an add‐on section to the Casey Child Welfare Financing Survey conducted in 2011 and 2012. Survey materials were first mailed to each state’s child welfare director in May 2011, and data collection continued for this portion of the survey through 2012. States were asked to answer the questions based on the family foster care payment levels for the state’s current fiscal year (though some states provided updated rates later in the data collection process). The brief instrument asked states to report:
a) whether they classify children into different payment levels of family foster care;
b) whether their state’s agency uses a diagnostic tool to determine a child’s needs/level of care (and if so, what do they use, and whether one tool is used more often than others);
c) what the payment rate levels are for family foster homes in the state, including information about the per diem rates paid to family foster care providers typically aligned with those levels, the criteria upon which payment rate decisions are made, and the percent of the caseload in each rate level;
d) whether family foster care providers are given additional allowances for personal incidentals other than the daily rate (and if so, for what expenses, and the maximum amounts allowable);
e) whether the state pays the same rate for family foster care regardless of whether it is provided by relatives, unrelated foster parents, or pre‐adoptive families (and if not, how rates differ per the relation of the provider);
f) whether the state pays the same rate to families across the state, regardless of geographic location (and if not, how rates differ, such as by region or county); and
g) in what year the rates were first implemented, whether rates are revised to reflect rates of inflation (and if so, how often), and with what frequency rates change.
Finally, states were provided with space on the survey to provide any additional information on their family foster care rate setting process, and were asked to provide any additional documentation that would help in understanding the processes. Six states did not complete the survey instrument: Hawaii, Mississippi, Montana, Puerto Rico, Vermont, and Wyoming. Therefore, the total number of states participating was 46 (includes Washington, DC).
7
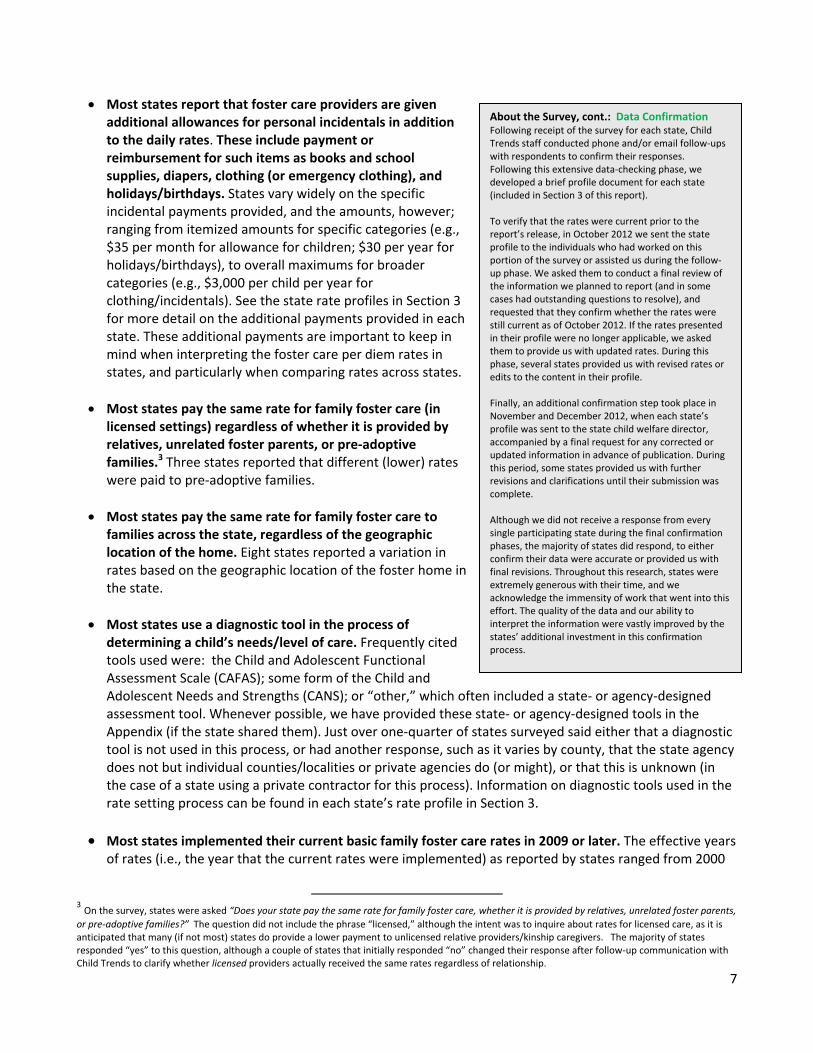
Most states report that foster care providers are given additional allowances for personal incidentals in addition to the daily rates. These include payment or reimbursement for such items as books and school supplies, diapers, clothing (or emergency clothing), and holidays/birthdays. States vary widely on the specific incidental payments provided, and the amounts, however; ranging from itemized amounts for specific categories (e.g., $35 per month for allowance for children; $30 per year for holidays/birthdays), to overall maximums for broader categories (e.g., $3,000 per child per year for clothing/incidentals). See the state rate profiles in Section 3 for more detail on the additional payments provided in each state. These additional payments are important to keep in mind when interpreting the foster care per diem rates in states, and particularly when comparing rates across states.
Most states pay the same rate for family foster care (in licensed settings) regardless of whether it is provided by relatives, unrelated foster parents, or pre‐adoptive families.3 Three states reported that different (lower) rates were paid to pre‐adoptive families.
Most states pay the same rate for family foster care to families across the state, regardless of the geographic location of the home. Eight states reported a variation in rates based on the geographic location of the foster home in the state.
Most states use a diagnostic tool in the process of determining a child’s needs/level of care. Frequently cited tools used were: the Child and Adolescent Functional Assessment Scale (CAFAS); some form of the Child and Adolescent Needs and Strengths (CANS); or “other,” which often included a state‐ or agency‐designed assessment tool. Whenever possible, we have provided these state‐ or agency‐designed tools in the Appendix (if the state shared them). Just over one‐quarter of states surveyed said either that a diagnostic tool is not used in this process, or had another response, such as it varies by county, that the state agency does not but individual counties/localities or private agencies do (or might), or that this is unknown (in the case of a state using a private contractor for this process). Information on diagnostic tools used in the rate setting process can be found in each state’s rate profile in Section 3.
Most states implemented their current basic family foster care rates in 2009 or later. The effective years of rates (i.e., the year that the current rates were implemented) as reported by states ranged from 2000
3 On the survey, states were asked “Does your state pay the same rate for family foster care, whether it is provided by relatives, unrelated foster parents,
or pre‐adoptive families?” The question did not include the phrase “licensed,” although the intent was to inquire about rates for licensed care, as it is anticipated that many (if not most) states do provide a lower payment to unlicensed relative providers/kinship caregivers. The majority of states responded “yes” to this question, although a couple of states that initially responded “no” changed their response after follow‐up communication with Child Trends to clarify whether licensed providers actually received the same rates regardless of relationship.
About the Survey, cont.: Data Confirmation Following receipt of the survey for each state, Child Trends staff conducted phone and/or email follow‐ups with respondents to confirm their responses. Following this extensive data‐checking phase, we developed a brief profile document for each state (included in Section 3 of this report). To verify that the rates were current prior to the report’s release, in October 2012 we sent the state profile to the individuals who had worked on this portion of the survey or assisted us during the follow‐up phase. We asked them to conduct a final review of the information we planned to report (and in some cases had outstanding questions to resolve), and requested that they confirm whether the rates were still current as of October 2012. If the rates presented in their profile were no longer applicable, we asked them to provide us with updated rates. During this phase, several states provided us with revised rates or edits to the content in their profile. Finally, an additional confirmation step took place in November and December 2012, when each state’s profile was sent to the state child welfare director, accompanied by a final request for any corrected or updated information in advance of publication. During this period, some states provided us with further revisions and clarifications until their submission was complete. Although we did not receive a response from every single participating state during the final confirmation phases, the majority of states did respond, to either confirm their data were accurate or provided us with final revisions. Throughout this research, states were extremely generous with their time, and we acknowledge the immensity of work that went into this effort. The quality of the data and our ability to interpret the information were vastly improved by the states’ additional investment in this confirmation process.
8
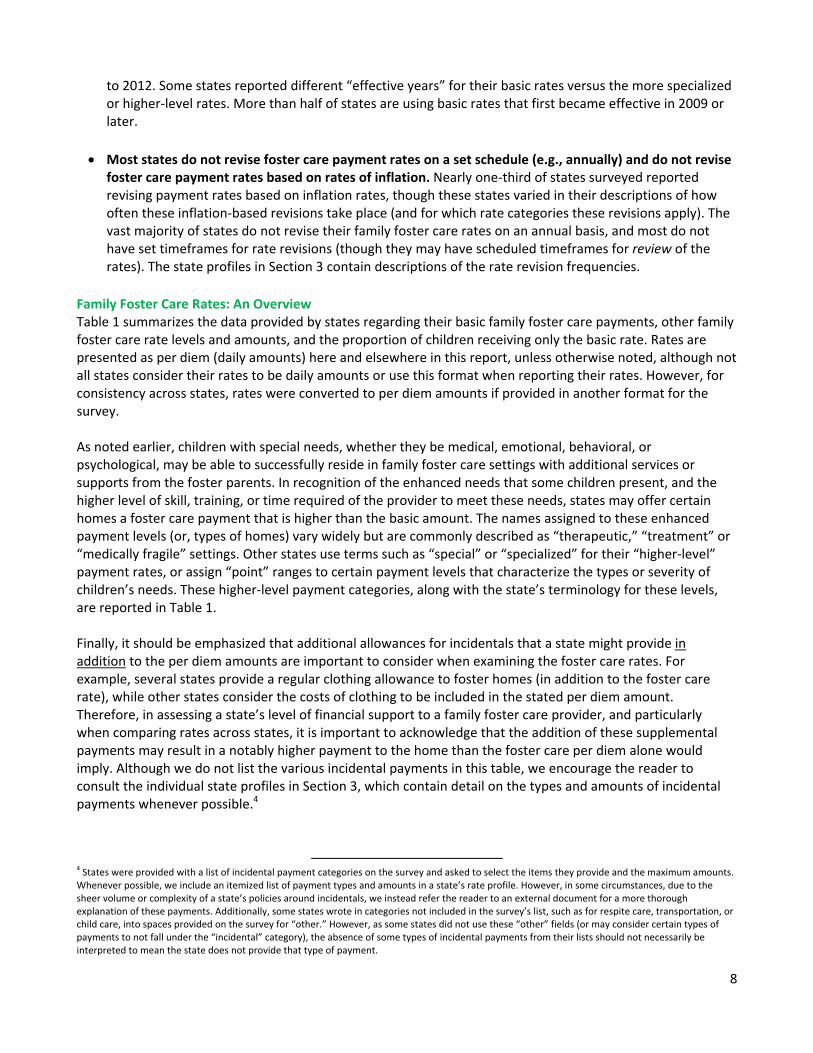
to 2012. Some states reported different “effective years” for their basic rates versus the more specialized or higher‐level rates. More than half of states are using basic rates that first became effective in 2009 or later.
Most states do not revise foster care payment rates on a set schedule (e.g., annually) and do not revise
foster care payment rates based on rates of inflation. Nearly one‐third of states surveyed reported revising payment rates based on inflation rates, though these states varied in their descriptions of how often these inflation‐based revisions take place (and for which rate categories these revisions apply). The vast majority of states do not revise their family foster care rates on an annual basis, and most do not have set timeframes for rate revisions (though they may have scheduled timeframes for review of the rates). The state profiles in Section 3 contain descriptions of the rate revision frequencies.
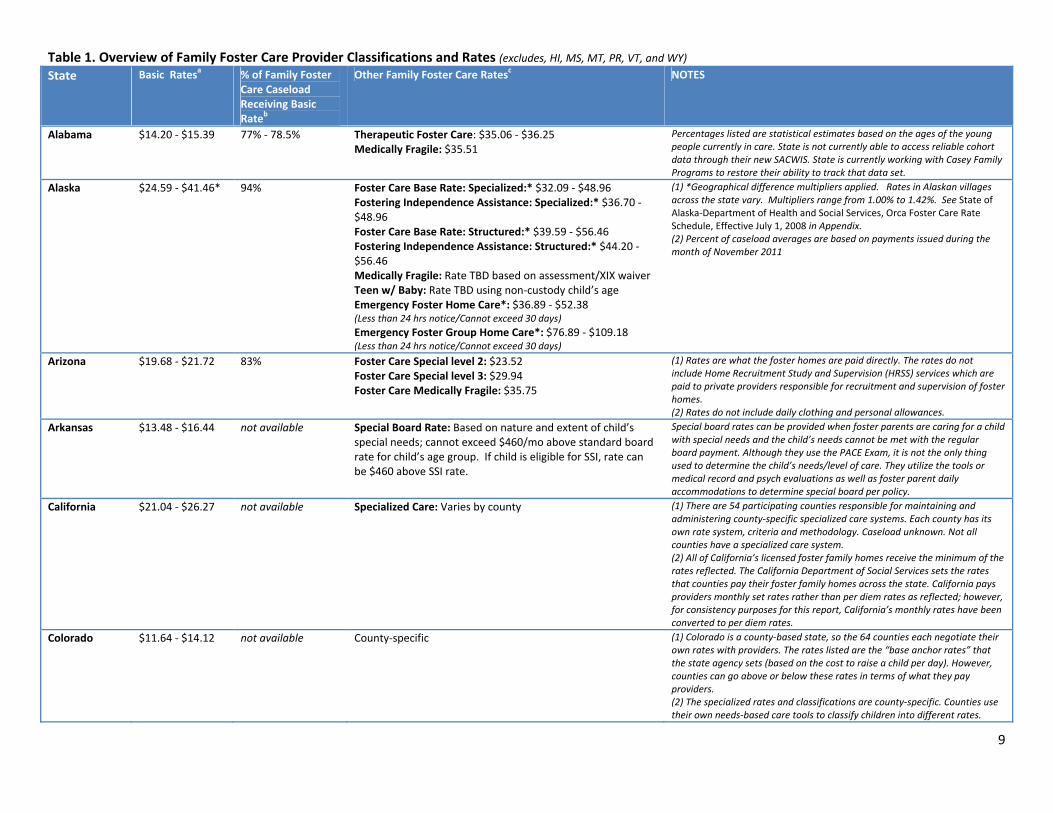
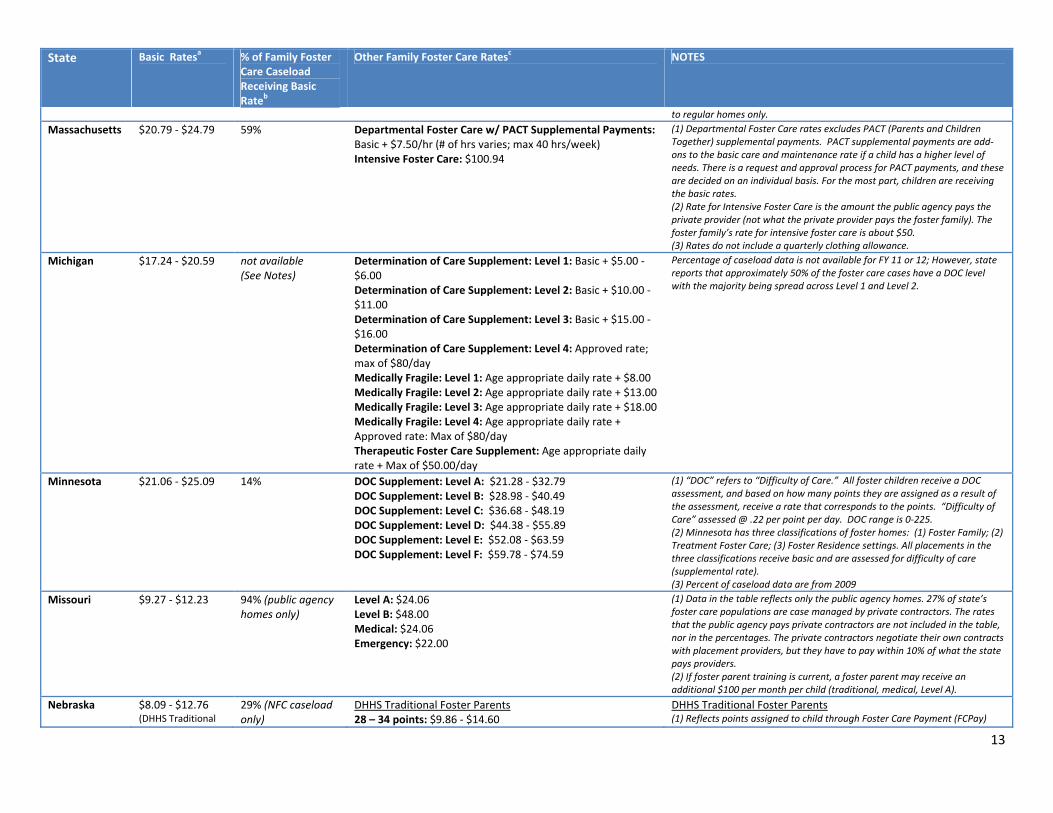
Family Foster Care Rates: An Overview Table 1 summarizes the data provided by states regarding their basic family foster care payments, other family foster care rate levels and amounts, and the proportion of children receiving only the basic rate. Rates are presented as per diem (daily amounts) here and elsewhere in this report, unless otherwise noted, although not all states consider their rates to be daily amounts or use this format when reporting their rates. However, for consistency across states, rates were converted to per diem amounts if provided in another format for the survey. As noted earlier, children with special needs, whether they be medical, emotional, behavioral, or psychological, may be able to successfully reside in family foster care settings with additional services or supports from the foster parents. In recognition of the enhanced needs that some children present, and the higher level of skill, training, or time required of the provider to meet these needs, states may offer certain homes a foster care payment that is higher than the basic amount. The names assigned to these enhanced payment levels (or, types of homes) vary widely but are commonly described as “therapeutic,” “treatment” or “medically fragile” settings. Other states use terms such as “special” or “specialized” for their “higher‐level” payment rates, or assign “point” ranges to certain payment levels that characterize the types or severity of children’s needs. These higher‐level payment categories, along with the state’s terminology for these levels, are reported in Table 1. Finally, it should be emphasized that additional allowances for incidentals that a state might provide in addition to the per diem amounts are important to consider when examining the foster care rates. For example, several states provide a regular clothing allowance to foster homes (in addition to the foster care rate), while other states consider the costs of clothing to be included in the stated per diem amount. Therefore, in assessing a state’s level of financial support to a family foster care provider, and particularly when comparing rates across states, it is important to acknowledge that the addition of these supplemental payments may result in a notably higher payment to the home than the foster care per diem alone would imply. Although we do not list the various incidental payments in this table, we encourage the reader to consult the individual state profiles in Section 3, which contain detail on the types and amounts of incidental payments whenever possible.4
4 States were provided with a list of incidental payment categories on the survey and asked to select the items they provide and the maximum amounts. Whenever possible, we include an itemized list of payment types and amounts in a state’s rate profile. However, in some circumstances, due to the sheer volume or complexity of a state’s policies around incidentals, we instead refer the reader to an external document for a more thorough explanation of these payments. Additionally, some states wrote in categories not included in the survey’s list, such as for respite care, transportation, or child care, into spaces provided on the survey for “other.” However, as some states did not use these “other” fields (or may consider certain types of payments to not fall under the “incidental” category), the absence of some types of incidental payments from their lists should not necessarily be interpreted to mean the state does not provide that type of payment.
9
Table 1. Overview of Family Foster Care Provider Classifications and Rates (excludes, HI, MS, MT, PR, VT, and WY) State Basic Ratesa % of Family Foster
Care Caseload Receiving Basic Rateb
Other Family Foster Care Ratesc NOTES
Alabama $14.20 ‐ $15.39 77% ‐ 78.5% Therapeutic Foster Care: $35.06 ‐ $36.25 Medically Fragile: $35.51
Percentages listed are statistical estimates based on the ages of the young people currently in care. State is not currently able to access reliable cohort data through their new SACWIS. State is currently working with Casey Family Programs to restore their ability to track that data set.
Alaska $24.59 ‐ $41.46* 94% Foster Care Base Rate: Specialized:* $32.09 ‐ $48.96 Fostering Independence Assistance: Specialized:* $36.70 ‐ $48.96 Foster Care Base Rate: Structured:* $39.59 ‐ $56.46 Fostering Independence Assistance: Structured:* $44.20 ‐ $56.46 Medically Fragile: Rate TBD based on assessment/XIX waiver Teen w/ Baby: Rate TBD using non‐custody child’s age Emergency Foster Home Care*: $36.89 ‐ $52.38 (Less than 24 hrs notice/Cannot exceed 30 days)
Emergency Foster Group Home Care*: $76.89 ‐ $109.18 (Less than 24 hrs notice/Cannot exceed 30 days)
(1) *Geographical difference multipliers applied. Rates in Alaskan villages across the state vary. Multipliers range from 1.00% to 1.42%. See State of Alaska‐Department of Health and Social Services, Orca Foster Care Rate Schedule, Effective July 1, 2008 in Appendix. (2) Percent of caseload averages are based on payments issued during the month of November 2011
Arizona $19.68 ‐ $21.72 83% Foster Care Special level 2: $23.52 Foster Care Special level 3: $29.94 Foster Care Medically Fragile: $35.75
(1) Rates are what the foster homes are paid directly. The rates do not include Home Recruitment Study and Supervision (HRSS) services which are paid to private providers responsible for recruitment and supervision of foster homes. (2) Rates do not include daily clothing and personal allowances.
Arkansas $13.48 ‐ $16.44 not available Special Board Rate: Based on nature and extent of child’s special needs; cannot exceed $460/mo above standard board rate for child’s age group. If child is eligible for SSI, rate can be $460 above SSI rate.
Special board rates can be provided when foster parents are caring for a child with special needs and the child’s needs cannot be met with the regular board payment. Although they use the PACE Exam, it is not the only thing used to determine the child’s needs/level of care. They utilize the tools or medical record and psych evaluations as well as foster parent daily accommodations to determine special board per policy.
California $21.04 ‐ $26.27 not available Specialized Care: Varies by county (1) There are 54 participating counties responsible for maintaining and administering county‐specific specialized care systems. Each county has its own rate system, criteria and methodology. Caseload unknown. Not all counties have a specialized care system. (2) All of California’s licensed foster family homes receive the minimum of the rates reflected. The California Department of Social Services sets the rates that counties pay their foster family homes across the state. California pays providers monthly set rates rather than per diem rates as reflected; however, for consistency purposes for this report, California’s monthly rates have been converted to per diem rates.
Colorado $11.64 ‐ $14.12 not available County‐specific (1) Colorado is a county‐based state, so the 64 counties each negotiate their own rates with providers. The rates listed are the “base anchor rates” that the state agency sets (based on the cost to raise a child per day). However, counties can go above or below these rates in terms of what they pay providers. (2) The specialized rates and classifications are county‐specific. Counties use their own needs‐based care tools to classify children into different rates.
10
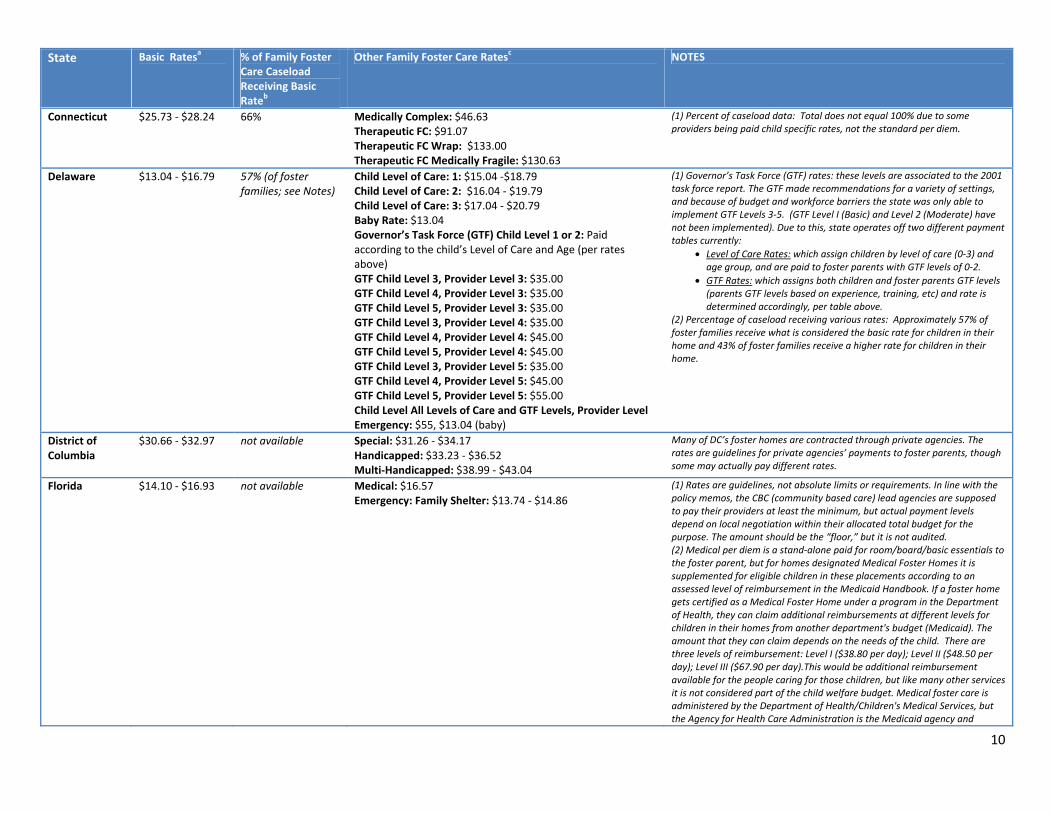
State Basic Ratesa % of Family Foster Care Caseload Receiving Basic Rateb
Other Family Foster Care Ratesc NOTES
Connecticut $25.73 ‐ $28.24 66% Medically Complex: $46.63 Therapeutic FC: $91.07 Therapeutic FC Wrap: $133.00 Therapeutic FC Medically Fragile: $130.63
(1) Percent of caseload data: Total does not equal 100% due to some providers being paid child specific rates, not the standard per diem.
Delaware $13.04 ‐ $16.79 57% (of foster families; see Notes)
Child Level of Care: 1: $15.04 ‐$18.79 Child Level of Care: 2: $16.04 ‐ $19.79 Child Level of Care: 3: $17.04 ‐ $20.79 Baby Rate: $13.04 Governor’s Task Force (GTF) Child Level 1 or 2: Paid according to the child’s Level of Care and Age (per rates above) GTF Child Level 3, Provider Level 3: $35.00 GTF Child Level 4, Provider Level 3: $35.00 GTF Child Level 5, Provider Level 3: $35.00 GTF Child Level 3, Provider Level 4: $35.00 GTF Child Level 4, Provider Level 4: $45.00 GTF Child Level 5, Provider Level 4: $45.00 GTF Child Level 3, Provider Level 5: $35.00 GTF Child Level 4, Provider Level 5: $45.00 GTF Child Level 5, Provider Level 5: $55.00 Child Level All Levels of Care and GTF Levels, Provider Level Emergency: $55, $13.04 (baby)
(1) Governor’s Task Force (GTF) rates: these levels are associated to the 2001 task force report. The GTF made recommendations for a variety of settings, and because of budget and workforce barriers the state was only able to implement GTF Levels 3‐5. (GTF Level I (Basic) and Level 2 (Moderate) have not been implemented). Due to this, state operates off two different payment tables currently:
Level of Care Rates: which assign children by level of care (0‐3) and age group, and are paid to foster parents with GTF levels of 0‐2.
GTF Rates: which assigns both children and foster parents GTF levels (parents GTF levels based on experience, training, etc) and rate is determined accordingly, per table above.
(2) Percentage of caseload receiving various rates: Approximately 57% of foster families receive what is considered the basic rate for children in their home and 43% of foster families receive a higher rate for children in their home.
District of Columbia
$30.66 ‐ $32.97 not available Special: $31.26 ‐ $34.17 Handicapped: $33.23 ‐ $36.52 Multi‐Handicapped: $38.99 ‐ $43.04
Many of DC’s foster homes are contracted through private agencies. The rates are guidelines for private agencies’ payments to foster parents, though some may actually pay different rates.
Florida $14.10 ‐ $16.93 not available Medical: $16.57 Emergency: Family Shelter: $13.74 ‐ $14.86
(1) Rates are guidelines, not absolute limits or requirements. In line with the policy memos, the CBC (community based care) lead agencies are supposed to pay their providers at least the minimum, but actual payment levels depend on local negotiation within their allocated total budget for the purpose. The amount should be the “floor,” but it is not audited. (2) Medical per diem is a stand‐alone paid for room/board/basic essentials to the foster parent, but for homes designated Medical Foster Homes it is supplemented for eligible children in these placements according to an assessed level of reimbursement in the Medicaid Handbook. If a foster home gets certified as a Medical Foster Home under a program in the Department of Health, they can claim additional reimbursements at different levels for children in their homes from another department's budget (Medicaid). The amount that they can claim depends on the needs of the child. There are three levels of reimbursement: Level I ($38.80 per day); Level II ($48.50 per day); Level III ($67.90 per day).This would be additional reimbursement available for the people caring for those children, but like many other services it is not considered part of the child welfare budget. Medical foster care is administered by the Department of Health/Children's Medical Services, but the Agency for Health Care Administration is the Medicaid agency and
11
State Basic Ratesa % of Family Foster Care Caseload Receiving Basic Rateb
Other Family Foster Care Ratesc NOTES
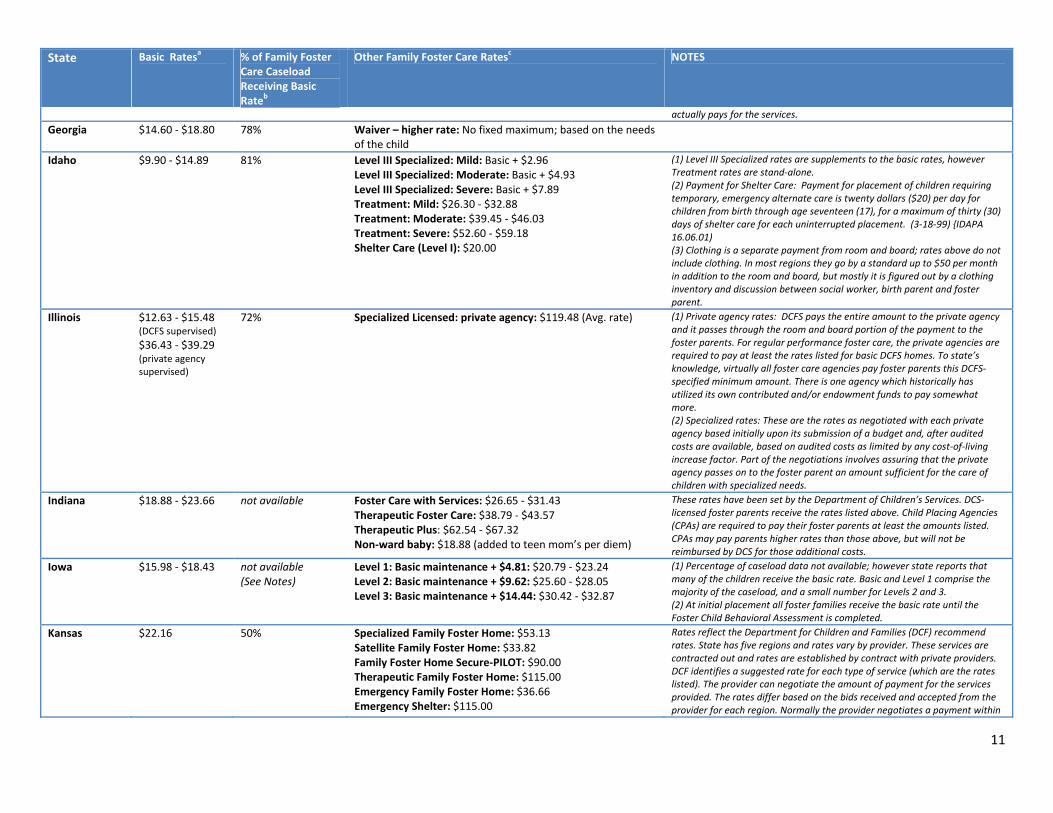
actually pays for the services.
Georgia $14.60 ‐ $18.80 78% Waiver – higher rate: No fixed maximum; based on the needs of the child
Idaho $9.90 ‐ $14.89 81% Level III Specialized: Mild: Basic + $2.96 Level III Specialized: Moderate: Basic + $4.93 Level III Specialized: Severe: Basic + $7.89 Treatment: Mild: $26.30 ‐ $32.88 Treatment: Moderate: $39.45 ‐ $46.03 Treatment: Severe: $52.60 ‐ $59.18 Shelter Care (Level I): $20.00
(1) Level III Specialized rates are supplements to the basic rates, however Treatment rates are stand‐alone. (2) Payment for Shelter Care: Payment for placement of children requiring temporary, emergency alternate care is twenty dollars ($20) per day for children from birth through age seventeen (17), for a maximum of thirty (30) days of shelter care for each uninterrupted placement. (3‐18‐99) {IDAPA 16.06.01) (3) Clothing is a separate payment from room and board; rates above do not include clothing. In most regions they go by a standard up to $50 per month in addition to the room and board, but mostly it is figured out by a clothing inventory and discussion between social worker, birth parent and foster parent.
Illinois $12.63 ‐ $15.48 (DCFS supervised) $36.43 ‐ $39.29 (private agency supervised)
72% Specialized Licensed: private agency: $119.48 (Avg. rate)
(1) Private agency rates: DCFS pays the entire amount to the private agency and it passes through the room and board portion of the payment to the foster parents. For regular performance foster care, the private agencies are required to pay at least the rates listed for basic DCFS homes. To state’s knowledge, virtually all foster care agencies pay foster parents this DCFS‐specified minimum amount. There is one agency which historically has utilized its own contributed and/or endowment funds to pay somewhat more. (2) Specialized rates: These are the rates as negotiated with each private agency based initially upon its submission of a budget and, after audited costs are available, based on audited costs as limited by any cost‐of‐living increase factor. Part of the negotiations involves assuring that the private agency passes on to the foster parent an amount sufficient for the care of children with specialized needs.
Indiana $18.88 ‐ $23.66 not available Foster Care with Services: $26.65 ‐ $31.43 Therapeutic Foster Care: $38.79 ‐ $43.57 Therapeutic Plus: $62.54 ‐ $67.32 Non‐ward baby: $18.88 (added to teen mom’s per diem)
These rates have been set by the Department of Children’s Services. DCS‐licensed foster parents receive the rates listed above. Child Placing Agencies (CPAs) are required to pay their foster parents at least the amounts listed. CPAs may pay parents higher rates than those above, but will not be reimbursed by DCS for those additional costs.
Iowa $15.98 ‐ $18.43 not available (See Notes)
Level 1: Basic maintenance + $4.81: $20.79 ‐ $23.24 Level 2: Basic maintenance + $9.62: $25.60 ‐ $28.05 Level 3: Basic maintenance + $14.44: $30.42 ‐ $32.87
(1) Percentage of caseload data not available; however state reports that many of the children receive the basic rate. Basic and Level 1 comprise the majority of the caseload, and a small number for Levels 2 and 3. (2) At initial placement all foster families receive the basic rate until the Foster Child Behavioral Assessment is completed.
Kansas $22.16 50% Specialized Family Foster Home: $53.13 Satellite Family Foster Home: $33.82 Family Foster Home Secure‐PILOT: $90.00 Therapeutic Family Foster Home: $115.00 Emergency Family Foster Home: $36.66 Emergency Shelter: $115.00
Rates reflect the Department for Children and Families (DCF) recommend rates. State has five regions and rates vary by provider. These services are contracted out and rates are established by contract with private providers. DCF identifies a suggested rate for each type of service (which are the rates listed). The provider can negotiate the amount of payment for the services provided. The rates differ based on the bids received and accepted from the provider for each region. Normally the provider negotiates a payment within
12
State Basic Ratesa % of Family Foster Care Caseload Receiving Basic Rateb
Other Family Foster Care Ratesc NOTES
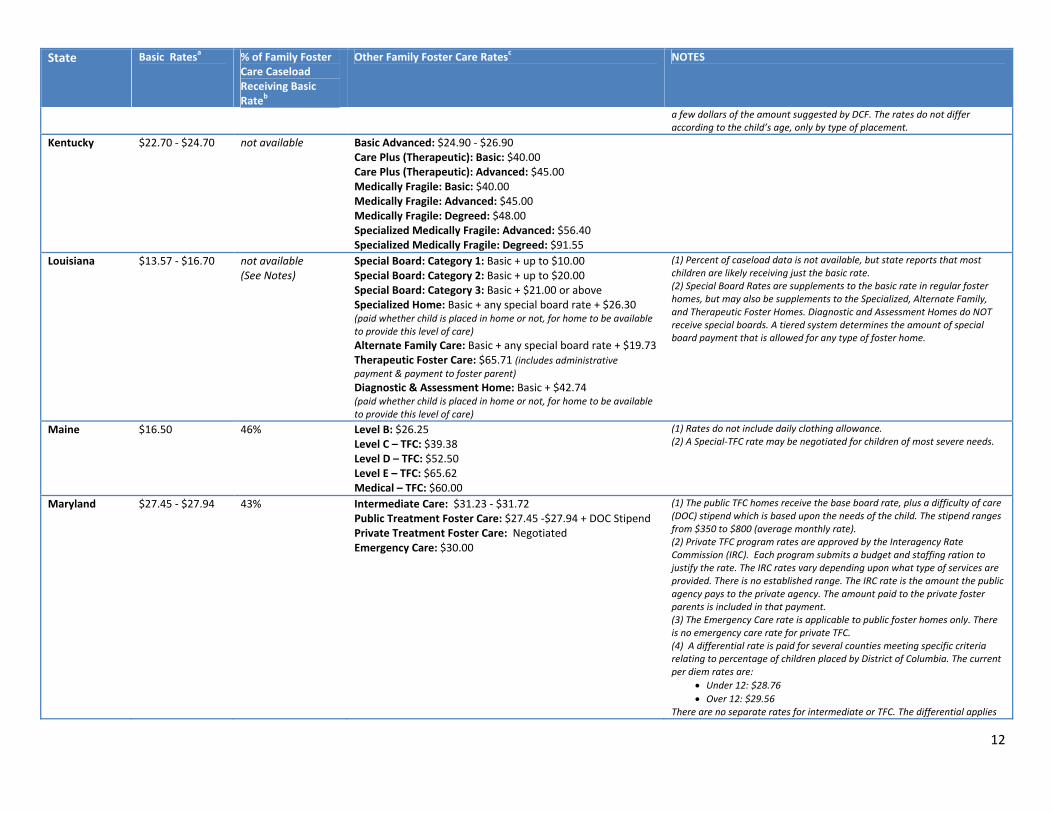
a few dollars of the amount suggested by DCF. The rates do not differ according to the child’s age, only by type of placement.
Kentucky $22.70 ‐ $24.70 not available Basic Advanced: $24.90 ‐ $26.90 Care Plus (Therapeutic): Basic: $40.00 Care Plus (Therapeutic): Advanced: $45.00 Medically Fragile: Basic: $40.00 Medically Fragile: Advanced: $45.00 Medically Fragile: Degreed: $48.00 Specialized Medically Fragile: Advanced: $56.40 Specialized Medically Fragile: Degreed: $91.55
Louisiana $13.57 ‐ $16.70 not available (See Notes)
Special Board: Category 1: Basic + up to $10.00 Special Board: Category 2: Basic + up to $20.00 Special Board: Category 3: Basic + $21.00 or above Specialized Home: Basic + any special board rate + $26.30 (paid whether child is placed in home or not, for home to be available to provide this level of care) Alternate Family Care: Basic + any special board rate + $19.73 Therapeutic Foster Care: $65.71 (includes administrative payment & payment to foster parent) Diagnostic & Assessment Home: Basic + $42.74 (paid whether child is placed in home or not, for home to be available to provide this level of care)
(1) Percent of caseload data is not available, but state reports that most children are likely receiving just the basic rate. (2) Special Board Rates are supplements to the basic rate in regular foster homes, but may also be supplements to the Specialized, Alternate Family, and Therapeutic Foster Homes. Diagnostic and Assessment Homes do NOT receive special boards. A tiered system determines the amount of special board payment that is allowed for any type of foster home.
Maine $16.50 46% Level B: $26.25 Level C – TFC: $39.38 Level D – TFC: $52.50 Level E – TFC: $65.62 Medical – TFC: $60.00
(1) Rates do not include daily clothing allowance. (2) A Special‐TFC rate may be negotiated for children of most severe needs.
Maryland $27.45 ‐ $27.94 43% Intermediate Care: $31.23 ‐ $31.72 Public Treatment Foster Care: $27.45 ‐$27.94 + DOC Stipend Private Treatment Foster Care: Negotiated Emergency Care: $30.00
(1) The public TFC homes receive the base board rate, plus a difficulty of care (DOC) stipend which is based upon the needs of the child. The stipend ranges from $350 to $800 (average monthly rate). (2) Private TFC program rates are approved by the Interagency Rate Commission (IRC). Each program submits a budget and staffing ration to justify the rate. The IRC rates vary depending upon what type of services are provided. There is no established range. The IRC rate is the amount the public agency pays to the private agency. The amount paid to the private foster parents is included in that payment. (3) The Emergency Care rate is applicable to public foster homes only. There is no emergency care rate for private TFC. (4) A differential rate is paid for several counties meeting specific criteria relating to percentage of children placed by District of Columbia. The current per diem rates are:
Under 12: $28.76 Over 12: $29.56
There are no separate rates for intermediate or TFC. The differential applies
13
State Basic Ratesa % of Family Foster Care Caseload Receiving Basic Rateb
Other Family Foster Care Ratesc NOTES
to regular homes only.
Massachusetts $20.79 ‐ $24.79 59% Departmental Foster Care w/ PACT Supplemental Payments: Basic + $7.50/hr (# of hrs varies; max 40 hrs/week) Intensive Foster Care: $100.94
(1) Departmental Foster Care rates excludes PACT (Parents and Children Together) supplemental payments. PACT supplemental payments are add‐ons to the basic care and maintenance rate if a child has a higher level of needs. There is a request and approval process for PACT payments, and these are decided on an individual basis. For the most part, children are receiving the basic rates. (2) Rate for Intensive Foster Care is the amount the public agency pays the private provider (not what the private provider pays the foster family). The foster family’s rate for intensive foster care is about $50. (3) Rates do not include a quarterly clothing allowance.
Michigan $17.24 ‐ $20.59 not available (See Notes)
Determination of Care Supplement: Level 1: Basic + $5.00 ‐ $6.00 Determination of Care Supplement: Level 2: Basic + $10.00 ‐ $11.00 Determination of Care Supplement: Level 3: Basic + $15.00 ‐ $16.00 Determination of Care Supplement: Level 4: Approved rate; max of $80/day Medically Fragile: Level 1: Age appropriate daily rate + $8.00 Medically Fragile: Level 2: Age appropriate daily rate + $13.00 Medically Fragile: Level 3: Age appropriate daily rate + $18.00 Medically Fragile: Level 4: Age appropriate daily rate + Approved rate: Max of $80/day Therapeutic Foster Care Supplement: Age appropriate daily rate + Max of $50.00/day
Percentage of caseload data is not available for FY 11 or 12; However, state reports that approximately 50% of the foster care cases have a DOC level with the majority being spread across Level 1 and Level 2.
Minnesota $21.06 ‐ $25.09 14% DOC Supplement: Level A: $21.28 ‐ $32.79 DOC Supplement: Level B: $28.98 ‐ $40.49 DOC Supplement: Level C: $36.68 ‐ $48.19 DOC Supplement: Level D: $44.38 ‐ $55.89 DOC Supplement: Level E: $52.08 ‐ $63.59 DOC Supplement: Level F: $59.78 ‐ $74.59
(1) “DOC” refers to “Difficulty of Care.” All foster children receive a DOC assessment, and based on how many points they are assigned as a result of the assessment, receive a rate that corresponds to the points. “Difficulty of Care” assessed @ .22 per point per day. DOC range is 0‐225. (2) Minnesota has three classifications of foster homes: (1) Foster Family; (2) Treatment Foster Care; (3) Foster Residence settings. All placements in the three classifications receive basic and are assessed for difficulty of care (supplemental rate). (3) Percent of caseload data are from 2009
Missouri $9.27 ‐ $12.23 94% (public agency homes only)
Level A: $24.06 Level B: $48.00 Medical: $24.06 Emergency: $22.00
(1) Data in the table reflects only the public agency homes. 27% of state’s foster care populations are case managed by private contractors. The rates that the public agency pays private contractors are not included in the table, nor in the percentages. The private contractors negotiate their own contracts with placement providers, but they have to pay within 10% of what the state pays providers. (2) If foster parent training is current, a foster parent may receive an additional $100 per month per child (traditional, medical, Level A).
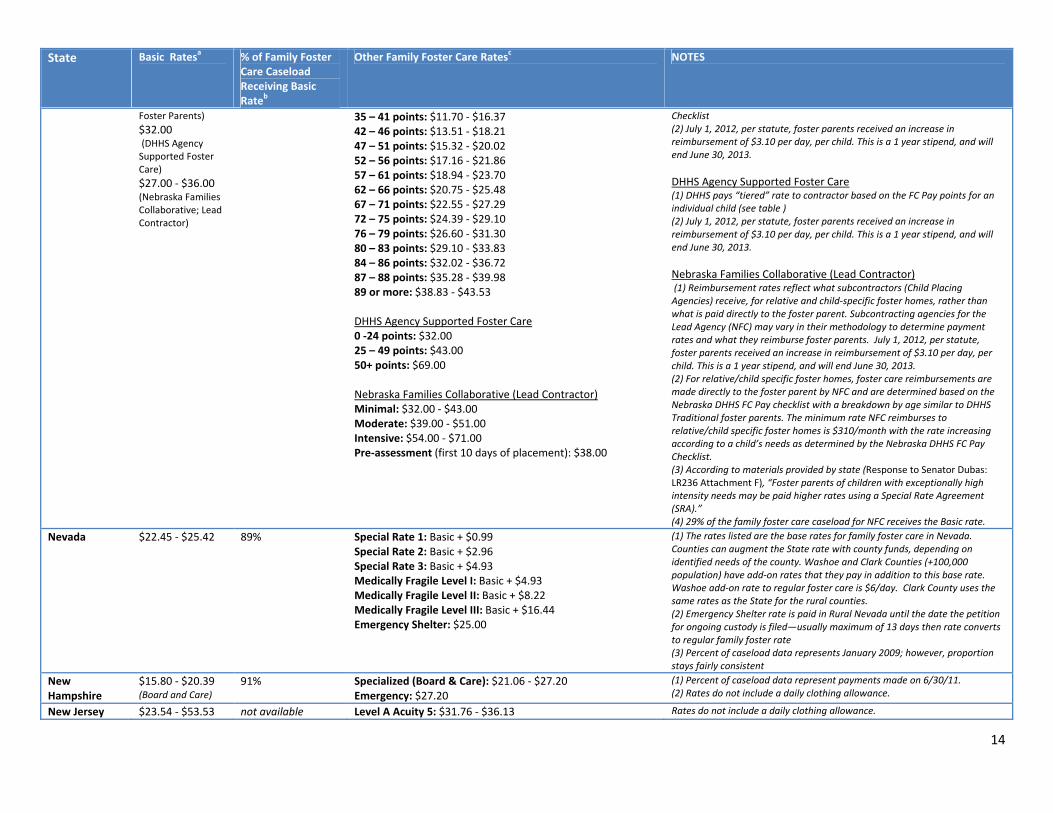
Nebraska $8.09 ‐ $12.76 (DHHS Traditional
29% (NFC caseload only)
DHHS Traditional Foster Parents 28 – 34 points: $9.86 ‐ $14.60
DHHS Traditional Foster Parents (1) Reflects points assigned to child through Foster Care Payment (FCPay)
14
State Basic Ratesa % of Family Foster Care Caseload Receiving Basic Rateb
Other Family Foster Care Ratesc NOTES
Foster Parents)
$32.00 (DHHS Agency Supported Foster Care)
$27.00 ‐ $36.00 (Nebraska Families Collaborative; Lead Contractor)
35 – 41 points: $11.70 ‐ $16.37 42 – 46 points: $13.51 ‐ $18.21 47 – 51 points: $15.32 ‐ $20.02 52 – 56 points: $17.16 ‐ $21.86 57 – 61 points: $18.94 ‐ $23.70 62 – 66 points: $20.75 ‐ $25.48 67 – 71 points: $22.55 ‐ $27.29 72 – 75 points: $24.39 ‐ $29.10 76 – 79 points: $26.60 ‐ $31.30 80 – 83 points: $29.10 ‐ $33.83 84 – 86 points: $32.02 ‐ $36.72 87 – 88 points: $35.28 ‐ $39.98 89 or more: $38.83 ‐ $43.53 DHHS Agency Supported Foster Care 0 ‐24 points: $32.00 25 – 49 points: $43.00 50+ points: $69.00 Nebraska Families Collaborative (Lead Contractor) Minimal: $32.00 ‐ $43.00 Moderate: $39.00 ‐ $51.00 Intensive: $54.00 ‐ $71.00 Pre‐assessment (first 10 days of placement): $38.00
Checklist(2) July 1, 2012, per statute, foster parents received an increase in reimbursement of $3.10 per day, per child. This is a 1 year stipend, and will end June 30, 2013.
DHHS Agency Supported Foster Care (1) DHHS pays “tiered” rate to contractor based on the FC Pay points for an individual child (see table ) (2) July 1, 2012, per statute, foster parents received an increase in reimbursement of $3.10 per day, per child. This is a 1 year stipend, and will end June 30, 2013.
Nebraska Families Collaborative (Lead Contractor) (1) Reimbursement rates reflect what subcontractors (Child Placing Agencies) receive, for relative and child‐specific foster homes, rather than what is paid directly to the foster parent. Subcontracting agencies for the Lead Agency (NFC) may vary in their methodology to determine payment rates and what they reimburse foster parents. July 1, 2012, per statute, foster parents received an increase in reimbursement of $3.10 per day, per child. This is a 1 year stipend, and will end June 30, 2013. (2) For relative/child specific foster homes, foster care reimbursements are made directly to the foster parent by NFC and are determined based on the Nebraska DHHS FC Pay checklist with a breakdown by age similar to DHHS Traditional foster parents. The minimum rate NFC reimburses to relative/child specific foster homes is $310/month with the rate increasing according to a child’s needs as determined by the Nebraska DHHS FC Pay Checklist. (3) According to materials provided by state (Response to Senator Dubas: LR236 Attachment F), “Foster parents of children with exceptionally high intensity needs may be paid higher rates using a Special Rate Agreement (SRA).” (4) 29% of the family foster care caseload for NFC receives the Basic rate.
Nevada $22.45 ‐ $25.42 89% Special Rate 1: Basic + $0.99 Special Rate 2: Basic + $2.96 Special Rate 3: Basic + $4.93 Medically Fragile Level I: Basic + $4.93 Medically Fragile Level II: Basic + $8.22 Medically Fragile Level III: Basic + $16.44 Emergency Shelter: $25.00
(1) The rates listed are the base rates for family foster care in Nevada.Counties can augment the State rate with county funds, depending on identified needs of the county. Washoe and Clark Counties (+100,000 population) have add‐on rates that they pay in addition to this base rate. Washoe add‐on rate to regular foster care is $6/day. Clark County uses the same rates as the State for the rural counties. (2) Emergency Shelter rate is paid in Rural Nevada until the date the petition for ongoing custody is filed—usually maximum of 13 days then rate converts to regular family foster rate (3) Percent of caseload data represents January 2009; however, proportion stays fairly consistent
New Hampshire
$15.80 ‐ $20.39 (Board and Care)
91% Specialized (Board & Care): $21.06 ‐ $27.20 Emergency: $27.20
(1) Percent of caseload data represent payments made on 6/30/11.(2) Rates do not include a daily clothing allowance.
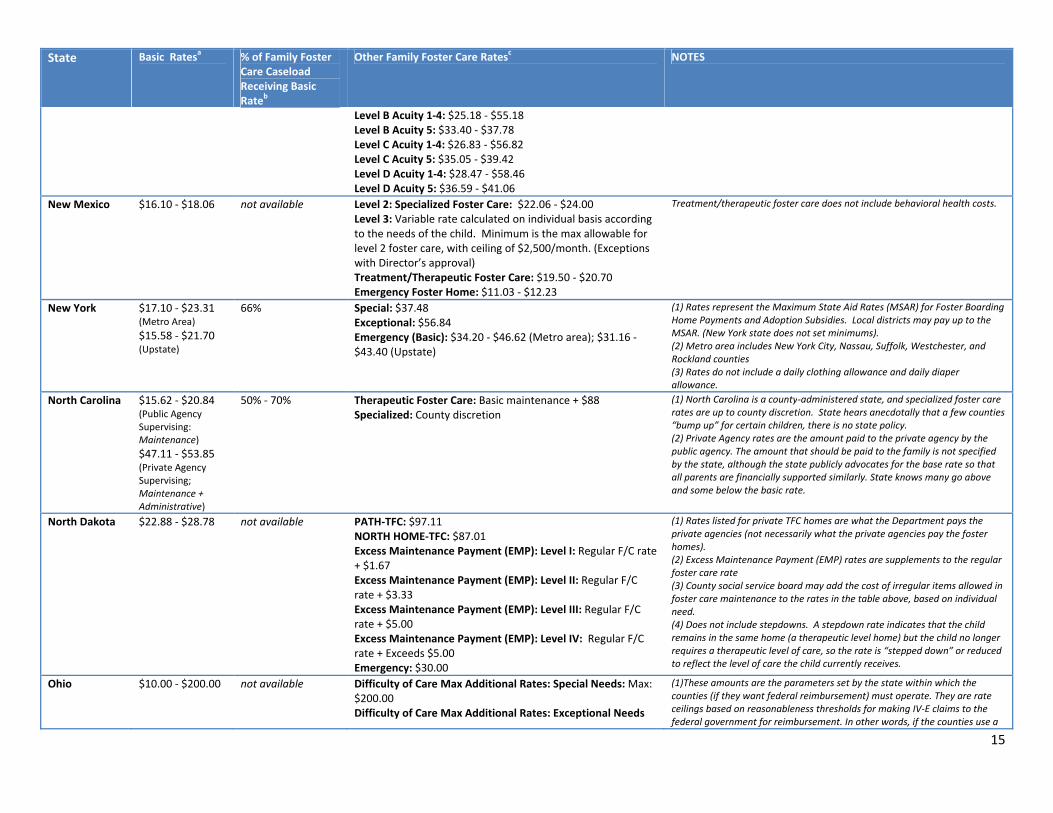
New Jersey $23.54 ‐ $53.53 not available Level A Acuity 5: $31.76 ‐ $36.13 Rates do not include a daily clothing allowance.
15
State Basic Ratesa % of Family Foster Care Caseload Receiving Basic Rateb
Other Family Foster Care Ratesc NOTES
Level B Acuity 1‐4: $25.18 ‐ $55.18 Level B Acuity 5: $33.40 ‐ $37.78 Level C Acuity 1‐4: $26.83 ‐ $56.82 Level C Acuity 5: $35.05 ‐ $39.42 Level D Acuity 1‐4: $28.47 ‐ $58.46 Level D Acuity 5: $36.59 ‐ $41.06
New Mexico $16.10 ‐ $18.06 not available Level 2: Specialized Foster Care: $22.06 ‐ $24.00 Level 3: Variable rate calculated on individual basis according to the needs of the child. Minimum is the max allowable for level 2 foster care, with ceiling of $2,500/month. (Exceptions with Director’s approval) Treatment/Therapeutic Foster Care: $19.50 ‐ $20.70 Emergency Foster Home: $11.03 ‐ $12.23
Treatment/therapeutic foster care does not include behavioral health costs.
New York $17.10 ‐ $23.31 (Metro Area) $15.58 ‐ $21.70 (Upstate)
66% Special: $37.48 Exceptional: $56.84 Emergency (Basic): $34.20 ‐ $46.62 (Metro area); $31.16 ‐ $43.40 (Upstate)
(1) Rates represent the Maximum State Aid Rates (MSAR) for Foster Boarding Home Payments and Adoption Subsidies. Local districts may pay up to the MSAR. (New York state does not set minimums). (2) Metro area includes New York City, Nassau, Suffolk, Westchester, and Rockland counties (3) Rates do not include a daily clothing allowance and daily diaper allowance.
North Carolina $15.62 ‐ $20.84 (Public Agency Supervising: Maintenance)
$47.11 ‐ $53.85 (Private Agency Supervising; Maintenance + Administrative)
50% ‐ 70% Therapeutic Foster Care: Basic maintenance + $88 Specialized: County discretion
(1) North Carolina is a county‐administered state, and specialized foster care rates are up to county discretion. State hears anecdotally that a few counties “bump up” for certain children, there is no state policy. (2) Private Agency rates are the amount paid to the private agency by the public agency. The amount that should be paid to the family is not specified by the state, although the state publicly advocates for the base rate so that all parents are financially supported similarly. State knows many go above and some below the basic rate.
North Dakota $22.88 ‐ $28.78 not available PATH‐TFC: $97.11 NORTH HOME‐TFC: $87.01 Excess Maintenance Payment (EMP): Level I: Regular F/C rate + $1.67 Excess Maintenance Payment (EMP): Level II: Regular F/C rate + $3.33 Excess Maintenance Payment (EMP): Level III: Regular F/C rate + $5.00 Excess Maintenance Payment (EMP): Level IV: Regular F/C rate + Exceeds $5.00 Emergency: $30.00
(1) Rates listed for private TFC homes are what the Department pays the private agencies (not necessarily what the private agencies pay the foster homes). (2) Excess Maintenance Payment (EMP) rates are supplements to the regular foster care rate (3) County social service board may add the cost of irregular items allowed in foster care maintenance to the rates in the table above, based on individual need. (4) Does not include stepdowns. A stepdown rate indicates that the child remains in the same home (a therapeutic level home) but the child no longer requires a therapeutic level of care, so the rate is “stepped down” or reduced to reflect the level of care the child currently receives.
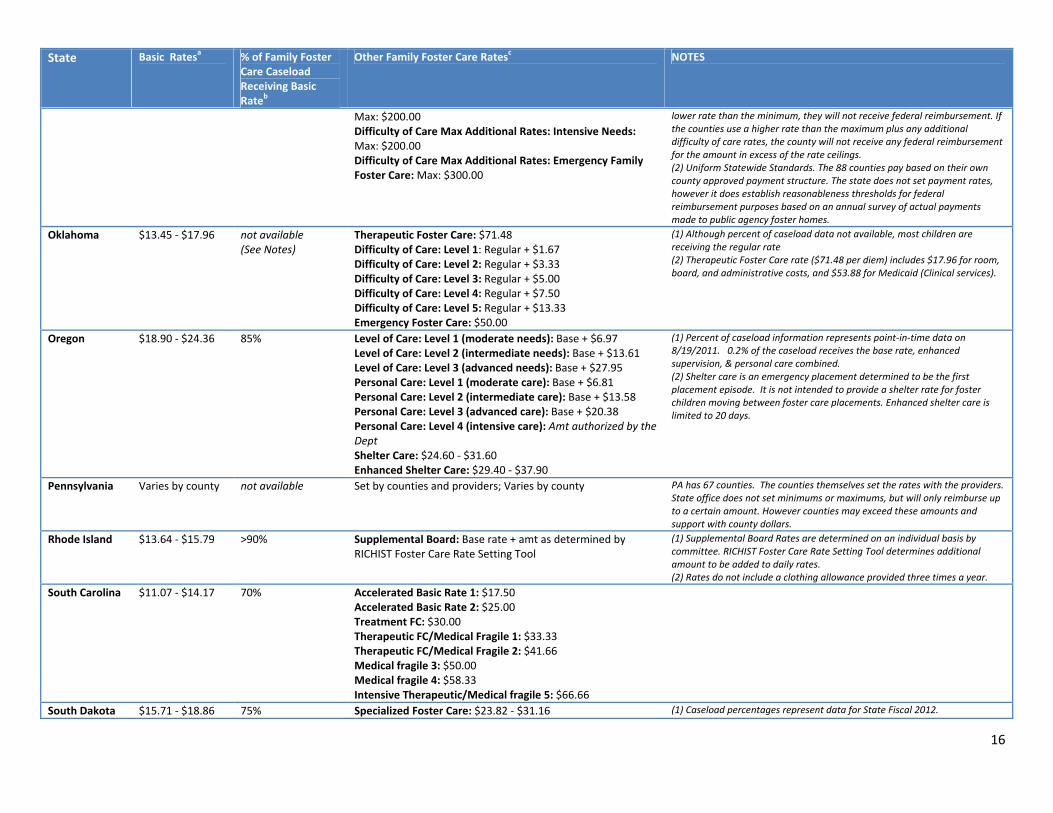
Ohio $10.00 ‐ $200.00 not available Difficulty of Care Max Additional Rates: Special Needs: Max: $200.00 Difficulty of Care Max Additional Rates: Exceptional Needs
(1)These amounts are the parameters set by the state within which the counties (if they want federal reimbursement) must operate. They are rate ceilings based on reasonableness thresholds for making IV‐E claims to the federal government for reimbursement. In other words, if the counties use a
16
State Basic Ratesa % of Family Foster Care Caseload Receiving Basic Rateb
Other Family Foster Care Ratesc NOTES
Max: $200.00 Difficulty of Care Max Additional Rates: Intensive Needs: Max: $200.00 Difficulty of Care Max Additional Rates: Emergency Family Foster Care: Max: $300.00
lower rate than the minimum, they will not receive federal reimbursement. If the counties use a higher rate than the maximum plus any additional difficulty of care rates, the county will not receive any federal reimbursement for the amount in excess of the rate ceilings. (2) Uniform Statewide Standards. The 88 counties pay based on their own county approved payment structure. The state does not set payment rates, however it does establish reasonableness thresholds for federal reimbursement purposes based on an annual survey of actual payments made to public agency foster homes.
Oklahoma $13.45 ‐ $17.96 not available (See Notes)
Therapeutic Foster Care: $71.48 Difficulty of Care: Level 1: Regular + $1.67 Difficulty of Care: Level 2: Regular + $3.33 Difficulty of Care: Level 3: Regular + $5.00 Difficulty of Care: Level 4: Regular + $7.50 Difficulty of Care: Level 5: Regular + $13.33 Emergency Foster Care: $50.00
(1) Although percent of caseload data not available, most children are receiving the regular rate (2) Therapeutic Foster Care rate ($71.48 per diem) includes $17.96 for room, board, and administrative costs, and $53.88 for Medicaid (Clinical services).
Oregon $18.90 ‐ $24.36 85% Level of Care: Level 1 (moderate needs): Base + $6.97 Level of Care: Level 2 (intermediate needs): Base + $13.61 Level of Care: Level 3 (advanced needs): Base + $27.95 Personal Care: Level 1 (moderate care): Base + $6.81 Personal Care: Level 2 (intermediate care): Base + $13.58 Personal Care: Level 3 (advanced care): Base + $20.38 Personal Care: Level 4 (intensive care): Amt authorized by the Dept Shelter Care: $24.60 ‐ $31.60 Enhanced Shelter Care: $29.40 ‐ $37.90
(1) Percent of caseload information represents point‐in‐time data on 8/19/2011. 0.2% of the caseload receives the base rate, enhanced supervision, & personal care combined. (2) Shelter care is an emergency placement determined to be the first placement episode. It is not intended to provide a shelter rate for foster children moving between foster care placements. Enhanced shelter care is limited to 20 days.
Pennsylvania Varies by county not available Set by counties and providers; Varies by county PA has 67 counties. The counties themselves set the rates with the providers. State office does not set minimums or maximums, but will only reimburse up to a certain amount. However counties may exceed these amounts and support with county dollars.
Rhode Island $13.64 ‐ $15.79 >90% Supplemental Board: Base rate + amt as determined by RICHIST Foster Care Rate Setting Tool
(1) Supplemental Board Rates are determined on an individual basis by committee. RICHIST Foster Care Rate Setting Tool determines additional amount to be added to daily rates. (2) Rates do not include a clothing allowance provided three times a year.
South Carolina $11.07 ‐ $14.17 70% Accelerated Basic Rate 1: $17.50 Accelerated Basic Rate 2: $25.00 Treatment FC: $30.00 Therapeutic FC/Medical Fragile 1: $33.33 Therapeutic FC/Medical Fragile 2: $41.66 Medical fragile 3: $50.00 Medical fragile 4: $58.33 Intensive Therapeutic/Medical fragile 5: $66.66
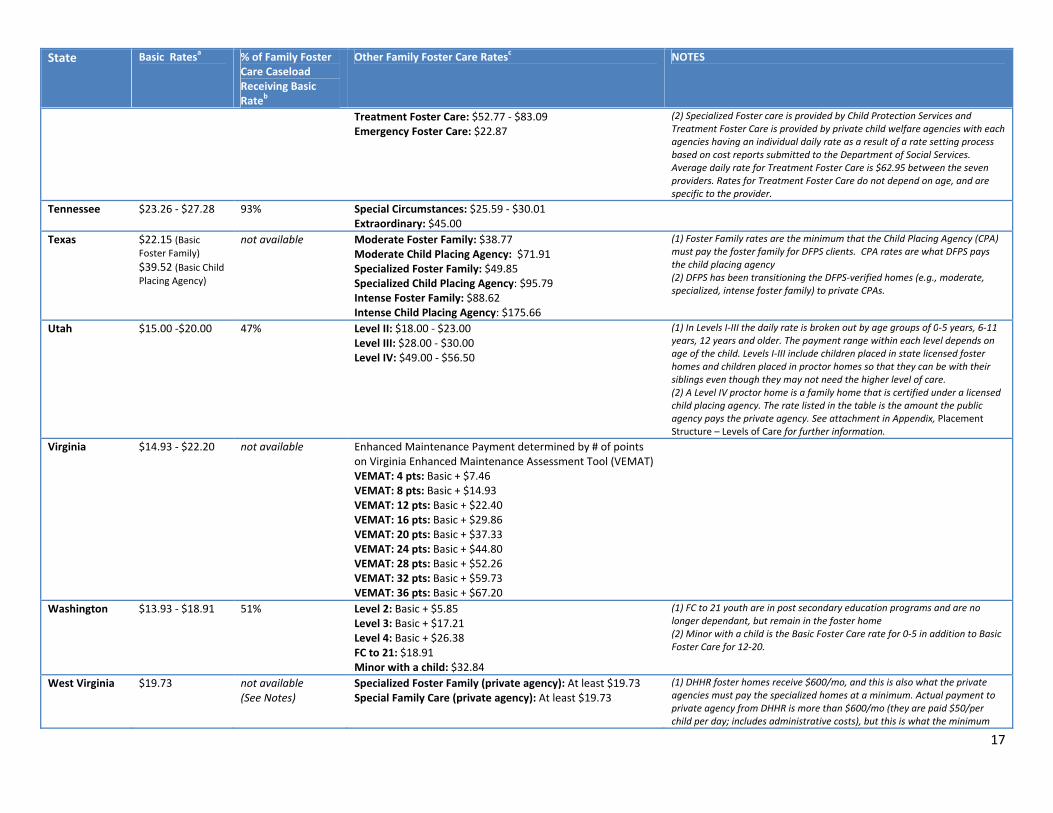
South Dakota $15.71 ‐ $18.86 75% Specialized Foster Care: $23.82 ‐ $31.16 (1) Caseload percentages represent data for State Fiscal 2012.
17
State Basic Ratesa % of Family Foster Care Caseload Receiving Basic Rateb
Other Family Foster Care Ratesc NOTES
Treatment Foster Care: $52.77 ‐ $83.09 Emergency Foster Care: $22.87
(2) Specialized Foster care is provided by Child Protection Services and Treatment Foster Care is provided by private child welfare agencies with each agencies having an individual daily rate as a result of a rate setting process based on cost reports submitted to the Department of Social Services. Average daily rate for Treatment Foster Care is $62.95 between the seven providers. Rates for Treatment Foster Care do not depend on age, and are specific to the provider.
Tennessee $23.26 ‐ $27.28 93% Special Circumstances: $25.59 ‐ $30.01 Extraordinary: $45.00
Texas $22.15 (Basic Foster Family) $39.52 (Basic Child Placing Agency)
not available Moderate Foster Family: $38.77 Moderate Child Placing Agency: $71.91 Specialized Foster Family: $49.85 Specialized Child Placing Agency: $95.79 Intense Foster Family: $88.62 Intense Child Placing Agency: $175.66
(1) Foster Family rates are the minimum that the Child Placing Agency (CPA) must pay the foster family for DFPS clients. CPA rates are what DFPS pays the child placing agency (2) DFPS has been transitioning the DFPS‐verified homes (e.g., moderate, specialized, intense foster family) to private CPAs.
Utah $15.00 ‐$20.00 47% Level II: $18.00 ‐ $23.00 Level III: $28.00 ‐ $30.00 Level IV: $49.00 ‐ $56.50
(1) In Levels I‐III the daily rate is broken out by age groups of 0‐5 years, 6‐11 years, 12 years and older. The payment range within each level depends on age of the child. Levels I‐III include children placed in state licensed foster homes and children placed in proctor homes so that they can be with their siblings even though they may not need the higher level of care. (2) A Level IV proctor home is a family home that is certified under a licensed child placing agency. The rate listed in the table is the amount the public agency pays the private agency. See attachment in Appendix, Placement Structure – Levels of Care for further information.
Virginia $14.93 ‐ $22.20 not available Enhanced Maintenance Payment determined by # of points on Virginia Enhanced Maintenance Assessment Tool (VEMAT) VEMAT: 4 pts: Basic + $7.46 VEMAT: 8 pts: Basic + $14.93 VEMAT: 12 pts: Basic + $22.40 VEMAT: 16 pts: Basic + $29.86 VEMAT: 20 pts: Basic + $37.33 VEMAT: 24 pts: Basic + $44.80 VEMAT: 28 pts: Basic + $52.26 VEMAT: 32 pts: Basic + $59.73 VEMAT: 36 pts: Basic + $67.20
Washington $13.93 ‐ $18.91 51% Level 2: Basic + $5.85 Level 3: Basic + $17.21 Level 4: Basic + $26.38 FC to 21: $18.91 Minor with a child: $32.84
(1) FC to 21 youth are in post secondary education programs and are no longer dependant, but remain in the foster home (2) Minor with a child is the Basic Foster Care rate for 0‐5 in addition to Basic Foster Care for 12‐20.
West Virginia $19.73 not available (See Notes)
Specialized Foster Family (private agency): At least $19.73 Special Family Care (private agency): At least $19.73
(1) DHHR foster homes receive $600/mo, and this is also what the private agencies must pay the specialized homes at a minimum. Actual payment to private agency from DHHR is more than $600/mo (they are paid $50/per child per day; includes administrative costs), but this is what the minimum
18
State Basic Ratesa % of Family Foster Care Caseload Receiving Basic Rateb
Other Family Foster Care Ratesc NOTES
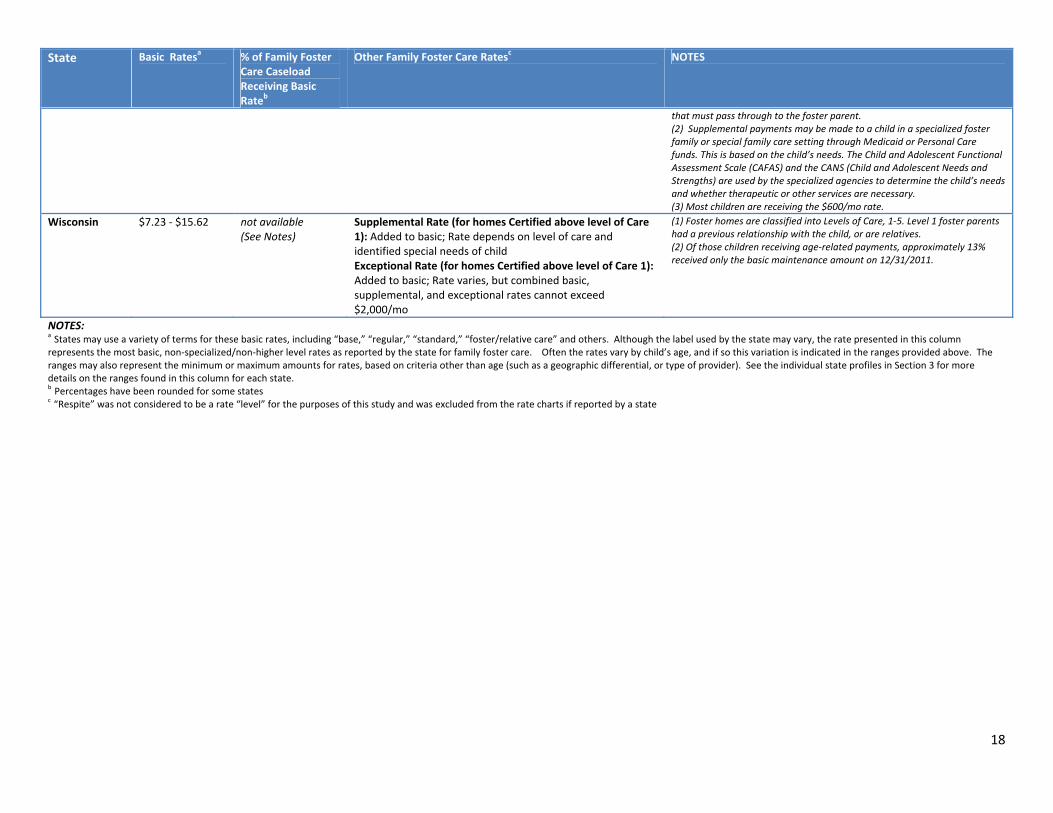
that must pass through to the foster parent. (2) Supplemental payments may be made to a child in a specialized foster family or special family care setting through Medicaid or Personal Care funds. This is based on the child’s needs. The Child and Adolescent Functional Assessment Scale (CAFAS) and the CANS (Child and Adolescent Needs and Strengths) are used by the specialized agencies to determine the child’s needs and whether therapeutic or other services are necessary. (3) Most children are receiving the $600/mo rate.
Wisconsin $7.23 ‐ $15.62 not available (See Notes)
Supplemental Rate (for homes Certified above level of Care 1): Added to basic; Rate depends on level of care and identified special needs of child Exceptional Rate (for homes Certified above level of Care 1): Added to basic; Rate varies, but combined basic, supplemental, and exceptional rates cannot exceed $2,000/mo
(1) Foster homes are classified into Levels of Care, 1‐5. Level 1 foster parents had a previous relationship with the child, or are relatives. (2) Of those children receiving age‐related payments, approximately 13% received only the basic maintenance amount on 12/31/2011.
NOTES: a States may use a variety of terms for these basic rates, including “base,” “regular,” “standard,” “foster/relative care” and others. Although the label used by the state may vary, the rate presented in this column
represents the most basic, non‐specialized/non‐higher level rates as reported by the state for family foster care. Often the rates vary by child’s age, and if so this variation is indicated in the ranges provided above. The ranges may also represent the minimum or maximum amounts for rates, based on criteria other than age (such as a geographic differential, or type of provider). See the individual state profiles in Section 3 for more details on the ranges found in this column for each state. b Percentages have been rounded for some states
c “Respite” was not considered to be a rate “level” for the purposes of this study and was excluded from the rate charts if reported by a state
19
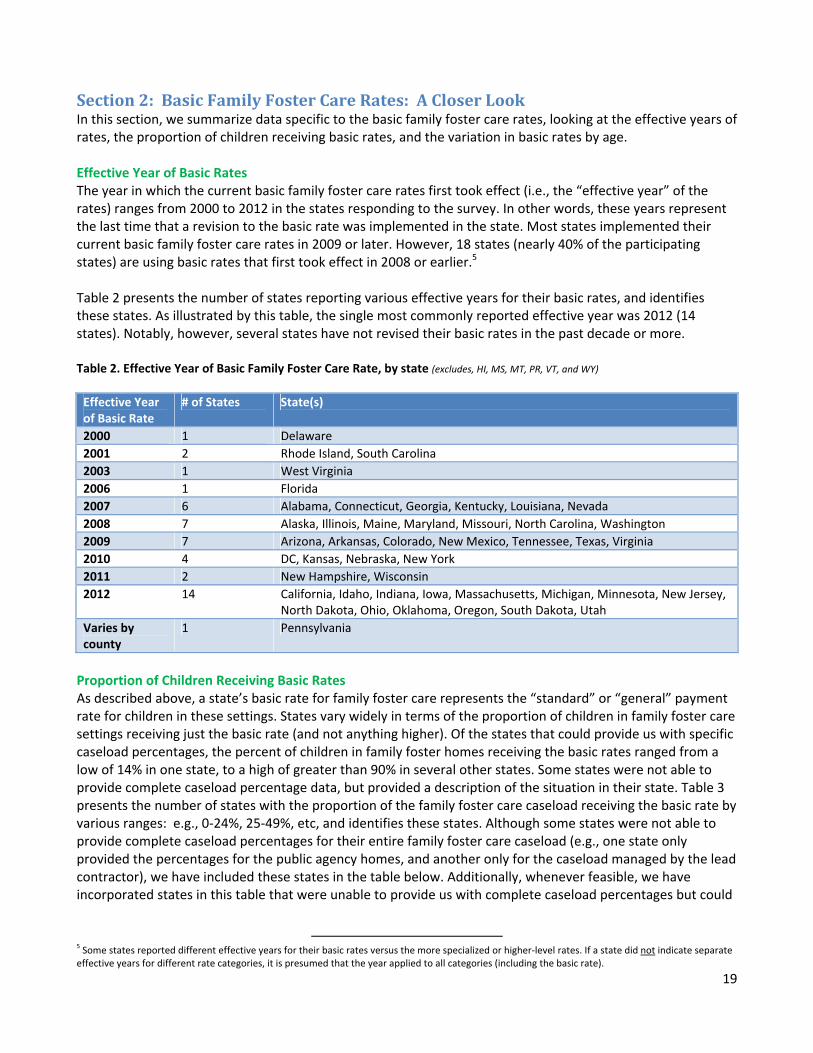
Section2:BasicFamilyFosterCareRates:ACloserLookIn this section, we summarize data specific to the basic family foster care rates, looking at the effective years of rates, the proportion of children receiving basic rates, and the variation in basic rates by age. Effective Year of Basic Rates The year in which the current basic family foster care rates first took effect (i.e., the “effective year” of the rates) ranges from 2000 to 2012 in the states responding to the survey. In other words, these years represent the last time that a revision to the basic rate was implemented in the state. Most states implemented their current basic family foster care rates in 2009 or later. However, 18 states (nearly 40% of the participating states) are using basic rates that first took effect in 2008 or earlier.5 Table 2 presents the number of states reporting various effective years for their basic rates, and identifies these states. As illustrated by this table, the single most commonly reported effective year was 2012 (14 states). Notably, however, several states have not revised their basic rates in the past decade or more. Table 2. Effective Year of Basic Family Foster Care Rate, by state (excludes, HI, MS, MT, PR, VT, and WY)
Effective Year of Basic Rate
# of States State(s)
2000 1 Delaware
2001 2 Rhode Island, South Carolina
2003 1 West Virginia
2006 1 Florida
2007 6 Alabama, Connecticut, Georgia, Kentucky, Louisiana, Nevada
2008 7 Alaska, Illinois, Maine, Maryland, Missouri, North Carolina, Washington
2009 7 Arizona, Arkansas, Colorado, New Mexico, Tennessee, Texas, Virginia
2010 4 DC, Kansas, Nebraska, New York
2011 2 New Hampshire, Wisconsin
2012 14 California, Idaho, Indiana, Iowa, Massachusetts, Michigan, Minnesota, New Jersey,North Dakota, Ohio, Oklahoma, Oregon, South Dakota, Utah
Varies by county
1 Pennsylvania
Proportion of Children Receiving Basic Rates As described above, a state’s basic rate for family foster care represents the “standard” or “general” payment rate for children in these settings. States vary widely in terms of the proportion of children in family foster care settings receiving just the basic rate (and not anything higher). Of the states that could provide us with specific caseload percentages, the percent of children in family foster homes receiving the basic rates ranged from a low of 14% in one state, to a high of greater than 90% in several other states. Some states were not able to provide complete caseload percentage data, but provided a description of the situation in their state. Table 3 presents the number of states with the proportion of the family foster care caseload receiving the basic rate by various ranges: e.g., 0‐24%, 25‐49%, etc, and identifies these states. Although some states were not able to provide complete caseload percentages for their entire family foster care caseload (e.g., one state only provided the percentages for the public agency homes, and another only for the caseload managed by the lead contractor), we have included these states in the table below. Additionally, whenever feasible, we have incorporated states in this table that were unable to provide us with complete caseload percentages but could
5 Some states reported different effective years for their basic rates versus the more specialized or higher‐level rates. If a state did not indicate separate effective years for different rate categories, it is presumed that the year applied to all categories (including the basic rate).
20
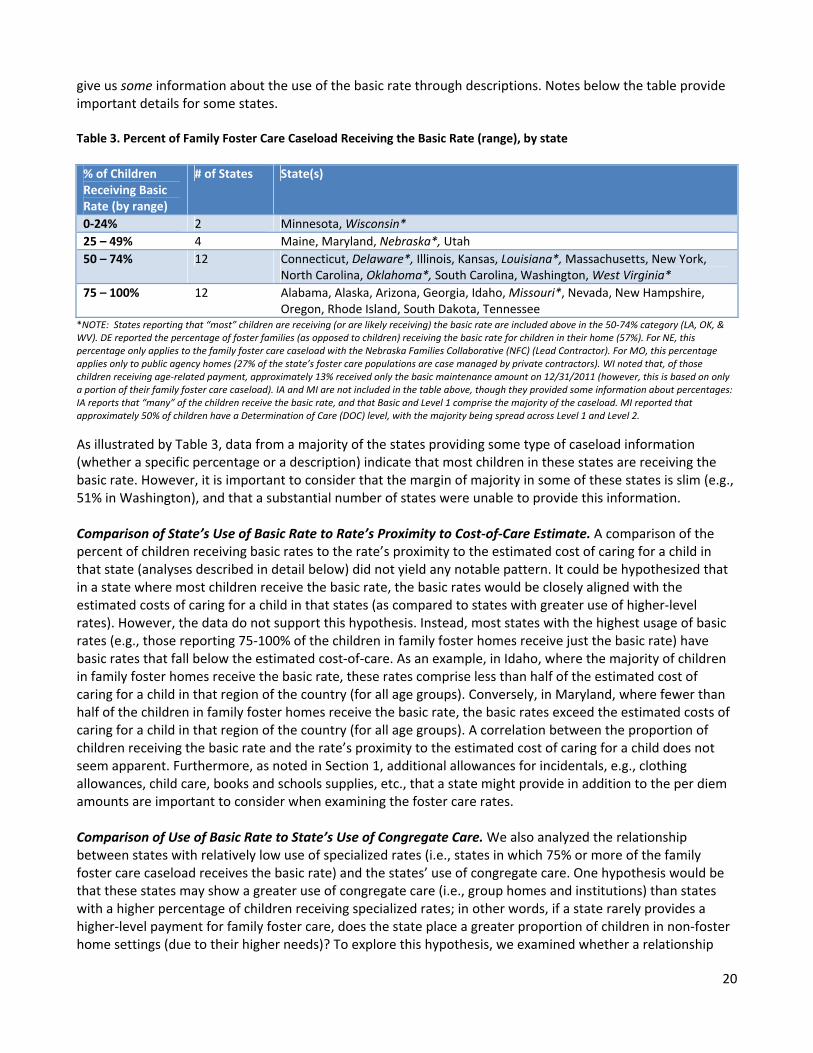
give us some information about the use of the basic rate through descriptions. Notes below the table provide important details for some states. Table 3. Percent of Family Foster Care Caseload Receiving the Basic Rate (range), by state
% of Children Receiving Basic Rate (by range)
# of States State(s)
0‐24% 2 Minnesota, Wisconsin*
25 – 49% 4 Maine, Maryland, Nebraska*, Utah
50 – 74% 12 Connecticut, Delaware*, Illinois, Kansas, Louisiana*, Massachusetts, New York, North Carolina, Oklahoma*, South Carolina, Washington, West Virginia*
75 – 100% 12 Alabama, Alaska, Arizona, Georgia, Idaho, Missouri*, Nevada, New Hampshire, Oregon, Rhode Island, South Dakota, Tennessee
*NOTE: States reporting that “most” children are receiving (or are likely receiving) the basic rate are included above in the 50‐74% category (LA, OK, & WV). DE reported the percentage of foster families (as opposed to children) receiving the basic rate for children in their home (57%). For NE, this percentage only applies to the family foster care caseload with the Nebraska Families Collaborative (NFC) (Lead Contractor). For MO, this percentage applies only to public agency homes (27% of the state’s foster care populations are case managed by private contractors). WI noted that, of those children receiving age‐related payment, approximately 13% received only the basic maintenance amount on 12/31/2011 (however, this is based on only a portion of their family foster care caseload). IA and MI are not included in the table above, though they provided some information about percentages: IA reports that “many” of the children receive the basic rate, and that Basic and Level 1 comprise the majority of the caseload. MI reported that approximately 50% of children have a Determination of Care (DOC) level, with the majority being spread across Level 1 and Level 2.
As illustrated by Table 3, data from a majority of the states providing some type of caseload information (whether a specific percentage or a description) indicate that most children in these states are receiving the basic rate. However, it is important to consider that the margin of majority in some of these states is slim (e.g., 51% in Washington), and that a substantial number of states were unable to provide this information. Comparison of State’s Use of Basic Rate to Rate’s Proximity to Cost‐of‐Care Estimate. A comparison of the percent of children receiving basic rates to the rate’s proximity to the estimated cost of caring for a child in that state (analyses described in detail below) did not yield any notable pattern. It could be hypothesized that in a state where most children receive the basic rate, the basic rates would be closely aligned with the estimated costs of caring for a child in that states (as compared to states with greater use of higher‐level rates). However, the data do not support this hypothesis. Instead, most states with the highest usage of basic rates (e.g., those reporting 75‐100% of the children in family foster homes receive just the basic rate) have basic rates that fall below the estimated cost‐of‐care. As an example, in Idaho, where the majority of children in family foster homes receive the basic rate, these rates comprise less than half of the estimated cost of caring for a child in that region of the country (for all age groups). Conversely, in Maryland, where fewer than half of the children in family foster homes receive the basic rate, the basic rates exceed the estimated costs of caring for a child in that region of the country (for all age groups). A correlation between the proportion of children receiving the basic rate and the rate’s proximity to the estimated cost of caring for a child does not seem apparent. Furthermore, as noted in Section 1, additional allowances for incidentals, e.g., clothing allowances, child care, books and schools supplies, etc., that a state might provide in addition to the per diem amounts are important to consider when examining the foster care rates. Comparison of Use of Basic Rate to State’s Use of Congregate Care. We also analyzed the relationship between states with relatively low use of specialized rates (i.e., states in which 75% or more of the family foster care caseload receives the basic rate) and the states’ use of congregate care. One hypothesis would be that these states may show a greater use of congregate care (i.e., group homes and institutions) than states with a higher percentage of children receiving specialized rates; in other words, if a state rarely provides a higher‐level payment for family foster care, does the state place a greater proportion of children in non‐foster home settings (due to their higher needs)? To explore this hypothesis, we examined whether a relationship
21
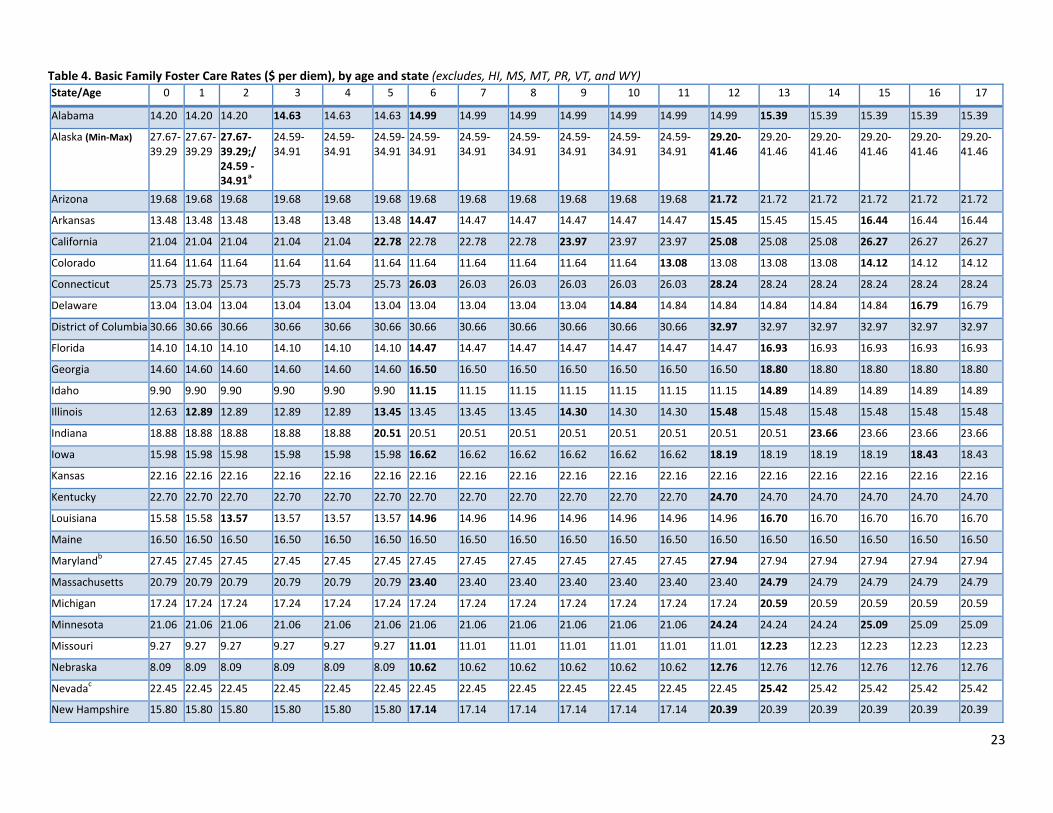
existed between the states that fall into both the highest and lowest categories for the percentage of their family foster care caseload receiving the basic rates, and the proportion of foster children in congregate care in these states (using data from Fiscal Year 2010 from the Adoption and Foster Care Analysis and Reporting System (AFCARS), U.S. DHHS, 2011). The national statistic for the percent of foster children in care on the last day of FY 2010 who were in congregate care was 15% (US DHHS, 2011). Of the group of states reporting high usage of the basic family foster care rate on the survey, some of these states fall above the national statistic while others fall below. Of the group of states reporting lower usage of the basic family foster care rate on the survey (albeit a small group of four, reporting less than half of children receive the basic rate), two of these states fall below the national statistic for congregate care usage, while two fall above. Thus, there does not appear to be a correlation between the states’ use of the basic rate (vs. higher‐level rates) and their use of congregate care. For both the analyses we describe in this section, it is important to consider that not all states were able to provide us with percentage of caseload data, and thus we are working with a limited sample size that may not be representative of the majority of states. Despite this limitation, however, the data from the group of states available for analyses showing little to no correlation between the use of basic rates and either the proximity of the rate to cost‐of‐care estimates or the states’ use of congregate care settings is notable, and raises additional questions about what other factors may be influencing the variation among states in the use of the basic vs. higher level rates. Basic Rates by Age Another finding from the survey is that in most states, basic rates vary based on a child’s age. In the majority of these states, payments increase as children’s ages increase. We present a detailed breakdown of the basic family foster care rates by age and state in Table 4 below. This table provides the basic per diem amount in each state by each age between 0 and 17; that is, the per diem for a child in that state who is age 0 (under 1), age 1, age 2, and so on. There are several important items to highlight about the material in Table 4. As illustrated by Table 1 earlier in the report, some states have multiple “types” of basic rates. For example, there may be one set of rates for foster homes supervised by the public child welfare agency, and another set of rates for foster homes supervised by a private agency. Or, rate‐setting authority in a state may lie with private providers or counties, but the state may provide “suggested” or “anchor” rates as guides, or set minimum and/or maximum amounts. In light of this variation, if a state offered multiple types of basic rates, the rates presented in the table below include only the rates for public child welfare agency homes, for consistency across states. In a few states, the rates listed are ranges set by the state, or are designed to serve more as guides for counties or private agencies rather than reflect the actual amounts provided to foster homes. Despite the various caveats that apply to the data for some states, it can be valuable to view the variation in the age‐specific rates as presented below. For one, the breakdown of basic rates by age allows for an analysis of the ages that tend to serve as “transition” points in terms of the per diem amounts, as well as the number of age‐related transitions used in a state. In Table 4, whenever a rate change occurs (either an increase or decrease) when compared to the previous age, the cell listing this rate is bolded. For example, in Alabama, rates increase at ages 3, 6, and 13. Therefore, the text in the cells presenting the per diem amounts for each of these ages is bolded in Alabama’s row to indicate that a rate transition occurs at these ages. While there are variations across states in terms of how many age groups are used, and at which ages a change of rate occurs, some themes emerge from this table.
22
Of the 40 states reporting age‐related breakdowns for their basic rates, the most common ages in which rate changes occur are at ages 5 or 6 (with 27 states reporting a change at one of these ages) and ages 12 or 13 (with 37 states reporting a rate change at one of these ages). The single most common age at which transitions occur is 6, with 21 states reporting a rate change for 6 year olds.
The number of age‐related transition points in a state ranges from one (i.e., the state has just two age groups for rates, such as a rate for 0‐11 yr olds, and a rate for 12 & up) to four (i.e., the state has five age groups for rates, such as Under age 1, 1‐4 yr olds, 5‐8 yr olds, 9‐11 yr olds, and 12 & up). The majority of states (out of the 40 reporting age‐related breakdowns) have two rate transition points (i.e., three age groups for basic rate amounts).
23
Table 4. Basic Family Foster Care Rates ($ per diem), by age and state (excludes, HI, MS, MT, PR, VT, and WY) State/Age 0 1 2 3 4 5 6 7 8 9 10 11 12 13 14 15 16 17
Alabama 14.20 14.20 14.20 14.63 14.63 14.63 14.99 14.99 14.99 14.99 14.99 14.99 14.99 15.39 15.39 15.39 15.39 15.39
Alaska (Min‐Max) 27.67‐ 39.29
27.67‐ 39.29
27.67‐39.29;/ 24.59 ‐ 34.91
a
24.59‐ 34.91
24.59‐ 34.91
24.59‐34.91
24.59‐ 34.91
24.59‐ 34.91
24.59‐ 34.91
24.59‐ 34.91
24.59‐ 34.91
24.59‐ 34.91
29.20‐ 41.46
29.20‐ 41.46
29.20‐ 41.46
29.20‐ 41.46
29.20‐ 41.46
29.20‐ 41.46
Arizona 19.68 19.68 19.68 19.68 19.68 19.68 19.68 19.68 19.68 19.68 19.68 19.68 21.72 21.72 21.72 21.72 21.72 21.72
Arkansas 13.48 13.48 13.48 13.48 13.48 13.48 14.47 14.47 14.47 14.47 14.47 14.47 15.45 15.45 15.45 16.44 16.44 16.44
California 21.04 21.04 21.04 21.04 21.04 22.78 22.78 22.78 22.78 23.97 23.97 23.97 25.08 25.08 25.08 26.27 26.27 26.27
Colorado 11.64 11.64 11.64 11.64 11.64 11.64 11.64 11.64 11.64 11.64 11.64 13.08 13.08 13.08 13.08 14.12 14.12 14.12
Connecticut 25.73 25.73 25.73 25.73 25.73 25.73 26.03 26.03 26.03 26.03 26.03 26.03 28.24 28.24 28.24 28.24 28.24 28.24
Delaware 13.04 13.04 13.04 13.04 13.04 13.04 13.04 13.04 13.04 13.04 14.84 14.84 14.84 14.84 14.84 14.84 16.79 16.79
District of Columbia 30.66 30.66 30.66 30.66 30.66 30.66 30.66 30.66 30.66 30.66 30.66 30.66 32.97 32.97 32.97 32.97 32.97 32.97
Florida 14.10 14.10 14.10 14.10 14.10 14.10 14.47 14.47 14.47 14.47 14.47 14.47 14.47 16.93 16.93 16.93 16.93 16.93
Georgia 14.60 14.60 14.60 14.60 14.60 14.60 16.50 16.50 16.50 16.50 16.50 16.50 16.50 18.80 18.80 18.80 18.80 18.80
Idaho 9.90 9.90 9.90 9.90 9.90 9.90 11.15 11.15 11.15 11.15 11.15 11.15 11.15 14.89 14.89 14.89 14.89 14.89
Illinois 12.63 12.89 12.89 12.89 12.89 13.45 13.45 13.45 13.45 14.30 14.30 14.30 15.48 15.48 15.48 15.48 15.48 15.48
Indiana 18.88 18.88 18.88 18.88 18.88 20.51 20.51 20.51 20.51 20.51 20.51 20.51 20.51 20.51 23.66 23.66 23.66 23.66
Iowa 15.98 15.98 15.98 15.98 15.98 15.98 16.62 16.62 16.62 16.62 16.62 16.62 18.19 18.19 18.19 18.19 18.43 18.43
Kansas 22.16 22.16 22.16 22.16 22.16 22.16 22.16 22.16 22.16 22.16 22.16 22.16 22.16 22.16 22.16 22.16 22.16 22.16
Kentucky 22.70 22.70 22.70 22.70 22.70 22.70 22.70 22.70 22.70 22.70 22.70 22.70 24.70 24.70 24.70 24.70 24.70 24.70
Louisiana 15.58 15.58 13.57 13.57 13.57 13.57 14.96 14.96 14.96 14.96 14.96 14.96 14.96 16.70 16.70 16.70 16.70 16.70
Maine 16.50 16.50 16.50 16.50 16.50 16.50 16.50 16.50 16.50 16.50 16.50 16.50 16.50 16.50 16.50 16.50 16.50 16.50
Marylandb 27.45 27.45 27.45 27.45 27.45 27.45 27.45 27.45 27.45 27.45 27.45 27.45 27.94 27.94 27.94 27.94 27.94 27.94
Massachusetts 20.79 20.79 20.79 20.79 20.79 20.79 23.40 23.40 23.40 23.40 23.40 23.40 23.40 24.79 24.79 24.79 24.79 24.79
Michigan 17.24 17.24 17.24 17.24 17.24 17.24 17.24 17.24 17.24 17.24 17.24 17.24 17.24 20.59 20.59 20.59 20.59 20.59
Minnesota 21.06 21.06 21.06 21.06 21.06 21.06 21.06 21.06 21.06 21.06 21.06 21.06 24.24 24.24 24.24 25.09 25.09 25.09
Missouri 9.27 9.27 9.27 9.27 9.27 9.27 11.01 11.01 11.01 11.01 11.01 11.01 11.01 12.23 12.23 12.23 12.23 12.23
Nebraska 8.09 8.09 8.09 8.09 8.09 8.09 10.62 10.62 10.62 10.62 10.62 10.62 12.76 12.76 12.76 12.76 12.76 12.76
Nevadac 22.45 22.45 22.45 22.45 22.45 22.45 22.45 22.45 22.45 22.45 22.45 22.45 22.45 25.42 25.42 25.42 25.42 25.42
New Hampshire 15.80 15.80 15.80 15.80 15.80 15.80 17.14 17.14 17.14 17.14 17.14 17.14 20.39 20.39 20.39 20.39 20.39 20.39
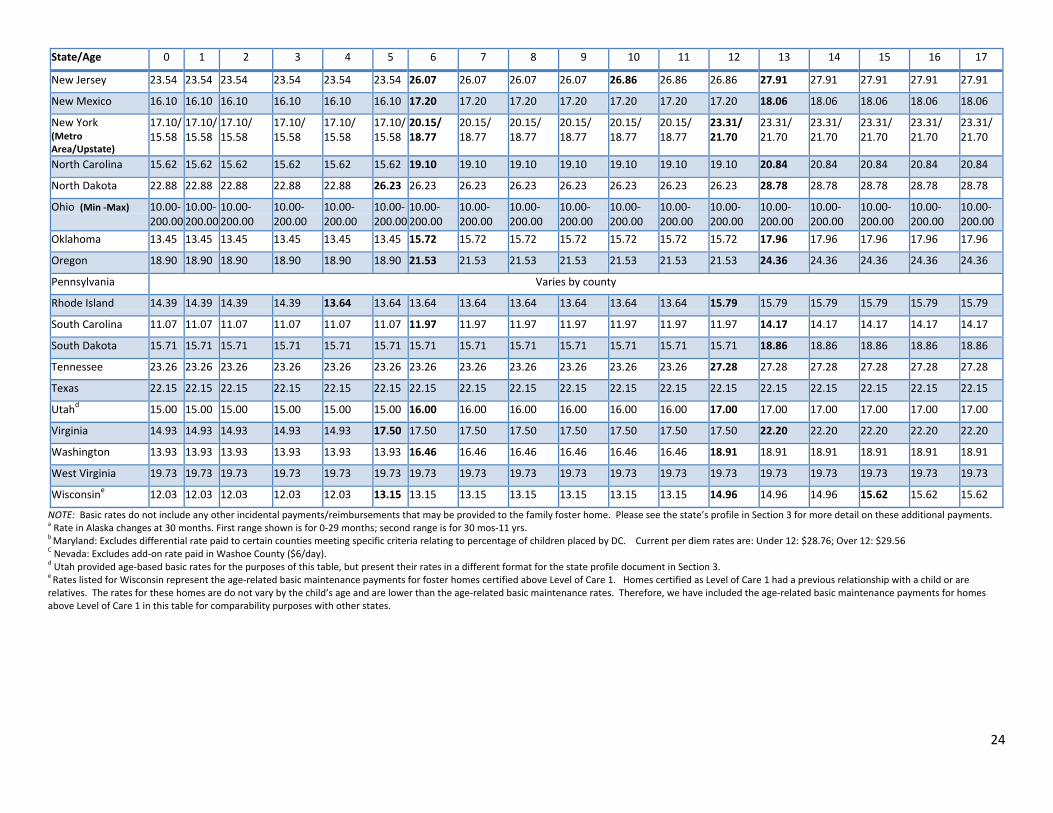
24
State/Age 0 1 2 3 4 5 6 7 8 9 10 11 12 13 14 15 16 17
New Jersey 23.54 23.54 23.54 23.54 23.54 23.54 26.07 26.07 26.07 26.07 26.86 26.86 26.86 27.91 27.91 27.91 27.91 27.91
New Mexico 16.10 16.10 16.10 16.10 16.10 16.10 17.20 17.20 17.20 17.20 17.20 17.20 17.20 18.06 18.06 18.06 18.06 18.06
New York (Metro Area/Upstate)
17.10/ 15.58
17.10/ 15.58
17.10/ 15.58
17.10/ 15.58
17.10/ 15.58
17.10/15.58
20.15/ 18.77
20.15/ 18.77
20.15/ 18.77
20.15/ 18.77
20.15/ 18.77
20.15/ 18.77
23.31/ 21.70
23.31/ 21.70
23.31/ 21.70
23.31/ 21.70
23.31/ 21.70
23.31/ 21.70
North Carolina 15.62 15.62 15.62 15.62 15.62 15.62 19.10 19.10 19.10 19.10 19.10 19.10 19.10 20.84 20.84 20.84 20.84 20.84
North Dakota 22.88 22.88 22.88 22.88 22.88 26.23 26.23 26.23 26.23 26.23 26.23 26.23 26.23 28.78 28.78 28.78 28.78 28.78
Ohio (Min ‐Max) 10.00‐ 200.00
10.00‐ 200.00
10.00‐ 200.00
10.00‐200.00
10.00‐200.00
10.00‐200.00
10.00‐200.00
10.00‐200.00
10.00‐200.00
10.00‐200.00
10.00‐200.00
10.00‐200.00
10.00‐200.00
10.00‐200.00
10.00‐200.00
10.00‐200.00
10.00‐200.00
10.00‐200.00
Oklahoma 13.45 13.45 13.45 13.45 13.45 13.45 15.72 15.72 15.72 15.72 15.72 15.72 15.72 17.96 17.96 17.96 17.96 17.96
Oregon 18.90 18.90 18.90 18.90 18.90 18.90 21.53 21.53 21.53 21.53 21.53 21.53 21.53 24.36 24.36 24.36 24.36 24.36
Pennsylvania Varies by county
Rhode Island 14.39 14.39 14.39 14.39 13.64 13.64 13.64 13.64 13.64 13.64 13.64 13.64 15.79 15.79 15.79 15.79 15.79 15.79
South Carolina 11.07 11.07 11.07 11.07 11.07 11.07 11.97 11.97 11.97 11.97 11.97 11.97 11.97 14.17 14.17 14.17 14.17 14.17
South Dakota 15.71 15.71 15.71 15.71 15.71 15.71 15.71 15.71 15.71 15.71 15.71 15.71 15.71 18.86 18.86 18.86 18.86 18.86
Tennessee 23.26 23.26 23.26 23.26 23.26 23.26 23.26 23.26 23.26 23.26 23.26 23.26 27.28 27.28 27.28 27.28 27.28 27.28
Texas 22.15 22.15 22.15 22.15 22.15 22.15 22.15 22.15 22.15 22.15 22.15 22.15 22.15 22.15 22.15 22.15 22.15 22.15
Utahd 15.00 15.00 15.00 15.00 15.00 15.00 16.00 16.00 16.00 16.00 16.00 16.00 17.00 17.00 17.00 17.00 17.00 17.00
Virginia 14.93 14.93 14.93 14.93 14.93 17.50 17.50 17.50 17.50 17.50 17.50 17.50 17.50 22.20 22.20 22.20 22.20 22.20
Washington 13.93 13.93 13.93 13.93 13.93 13.93 16.46 16.46 16.46 16.46 16.46 16.46 18.91 18.91 18.91 18.91 18.91 18.91
West Virginia 19.73 19.73 19.73 19.73 19.73 19.73 19.73 19.73 19.73 19.73 19.73 19.73 19.73 19.73 19.73 19.73 19.73 19.73
Wisconsine 12.03 12.03 12.03 12.03 12.03 13.15 13.15 13.15 13.15 13.15 13.15 13.15 14.96 14.96 14.96 15.62 15.62 15.62
NOTE: Basic rates do not include any other incidental payments/reimbursements that may be provided to the family foster home. Please see the state’s profile in Section 3 for more detail on these additional payments. a Rate in Alaska changes at 30 months. First range shown is for 0‐29 months; second range is for 30 mos‐11 yrs. b Maryland: Excludes differential rate paid to certain counties meeting specific criteria relating to percentage of children placed by DC. Current per diem rates are: Under 12: $28.76; Over 12: $29.56
C Nevada: Excludes add‐on rate paid in Washoe County ($6/day).
d Utah provided age‐based basic rates for the purposes of this table, but present their rates in a different format for the state profile document in Section 3.
e Rates listed for Wisconsin represent the age‐related basic maintenance payments for foster homes certified above Level of Care 1. Homes certified as Level of Care 1 had a previous relationship with a child or are relatives. The rates for these homes are do not vary by the child’s age and are lower than the age‐related basic maintenance rates. Therefore, we have included the age‐related basic maintenance payments for homes above Level of Care 1 in this table for comparability purposes with other states.
25
Basic Rates as Compared to Cost Estimates for Caring for Children As family foster care payments are designed to assist foster parents in meeting children’s needs, in order to promote their safety, permanency, and well‐being, there is great interest in whether the financial support provided to foster parents is adequate for these purposes. In Hitting the M.A.R.C., (2007), the authors concluded that the foster care rates in nearly every state (with the exception of Arizona and D.C.) fell short of the amount actually required to sufficiently meet foster children’s needs. The Foster Care M.A.R.C. (or, “Minimum Adequate Rates for Children”) for each state was established using a variety of sources to estimate the costs of food, clothing, shelter, daily supervision, school supplies, personal incidentals, and liability and property insurance for children aged 2, 9, and 16. For the current survey, we developed an alternative methodology for foster care rate comparisons, using data on the estimated costs of caring for children in various regions of the country published by the United States Department of Agriculture (USDA). The USDA issues a report annually, Expenditures on Children and Families, based on data from the Consumer Expenditure Survey (CES). In this report, the USDA approximates the costs of caring for children of different age cohorts in various family configurations (single parent or husband‐wife), regions of the country (e.g., Northeast, Midwest), types of communities (rural vs. urban), and family income levels. As highlighted in Hitting the M.A.R.C., there are limitations to using the USDA estimates as‐is as comparisons for foster care rates, given that the USDA rates include some expenses not usually considered to be covered by the foster care payment (such as health care and education). To account for these limitations, we computed a rate for comparison purposes based on the USDA data but with certain exclusions and parameters. Our cost estimate is designed to be a useful benchmark for states, and to serve as one point of comparison for their basic foster care rates. Our Cost Estimate Methodology From the Expenditures on Children by Families annual reports for 2011 (USDA, 2012), we used the estimated annual costs for husband‐wife households in the middle income grouping (of the 3 income groups in the report) by age cohort and by geographic area. For the purposes of these analyses, we excluded from this amount the reported costs for “health care,” “child care/education,” and 50% of the “miscellaneous” category (which includes personal care items, entertainment, and reading materials)—presuming that the majority (if not all) of these costs would otherwise be provided for a child in foster care external to the basic foster care payment. Therefore, the annual rate utilized for these analyses included costs from the categories of “housing,” “food,” “transportation,” “clothing,” and 50% of “miscellaneous.” The resulting total was then divided by 365 to produce a daily “cost‐of‐care” estimate for each region and age cohort. Basic Rates Compared to Our Cost Estimate: All States by Age Cohort On the next several pages, you will find tables presenting states’ basic family foster care rates by USDA age cohort, and the computed rate (described above) using our estimates for the costs of raising a child in that region of the country for 2011 (the most recent year in which USDA estimates are available). A table is presented for each USDA age group (e.g., a table for 0‐2 yr olds, a table for 3‐5 yr olds). If a state changed its payment rate for a given age within a USDA age cohort (e.g., if a payment rate for 4 and 5 year olds was different from that of 3 year olds, although the USDA age cohort is 3‐5), the rate listed reflects the average of the rates reported by the state within that age group. In addition, in the following tables we display a calculation of the percentage of the cost estimate for each age group in each state that the basic rate comprises (in other words, what proportion of the “cost‐of‐care” estimate does the state’s basic foster care payment for that age group represent). A statutory requirement of the title IV‐E program, in which all states and DC participate (see CRS, 2012 for more detail), dictates that a requirement of each title IV‐E plan is for the state to provide for the “….periodic review of the…amounts paid as foster care maintenance payments and adoption assistance to assure their continuing appropriateness” (42 U.S.C. 671 (a) (11)). Thus, without asserting any assessment or judgment of the adequacy or “appropriateness”
26
of any state’s foster care payment, we present below data regarding each state’s “proportion of coverage” to the cost‐of‐care estimate described above. To do this, a percentage was calculated to show the percent of our cost‐of‐care estimate that the foster care rate represents. A percent at or above 100 indicates that the foster care rate for that particular age group either meets or exceeds our estimate, whereas a percent below 100 indicates that the foster care rate is lower than our estimate. If a state changed its payment rate for a given age within a USDA age cohort (e.g., if a payment rate for 4 and 5 year olds was different from that of 3 year olds, although the USDA age cohort is 3‐5), the rate listed for that column in the tables below reflects the average of the rates reported by the state within the USDA cohort. An important note for interpretation of the data is that the basic rates presented here, which are also presented in Table 4 above, do not include the incidental payments/reimbursements that states reported on the survey as being provided in addition to the foster care per diem amount. For some states that provide regular clothing allowances or other payments on a routine basis, this could result in an understatement of the true amount typically provided to foster parents. However, for consistency across states (and acknowledging that states may provide some incidental payments/reimbursements that they did NOT report on the survey) incidental payments were not added into rates. Rather, these tables reflect only the state’s basic foster care rates by age, as listed in Table 4 above.
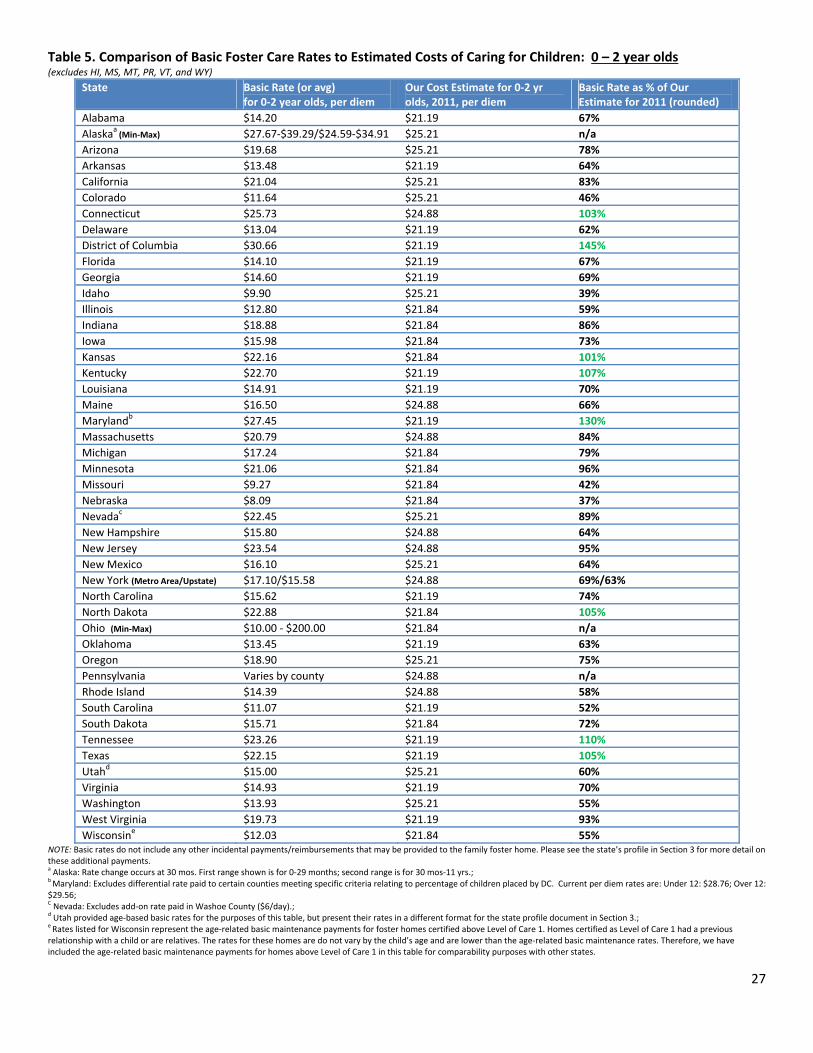
27
Table 5. Comparison of Basic Foster Care Rates to Estimated Costs of Caring for Children: 0 – 2 year olds
(excludes HI, MS, MT, PR, VT, and WY)
State Basic Rate (or avg) for 0‐2 year olds, per diem
Our Cost Estimate for 0‐2 yr olds, 2011, per diem
Basic Rate as % of Our Estimate for 2011 (rounded)
Alabama $14.20 $21.19 67%
Alaskaa (Min‐Max) $27.67‐$39.29/$24.59‐$34.91 $25.21 n/a
Arizona $19.68 $25.21 78%
Arkansas $13.48 $21.19 64%
California $21.04 $25.21 83%
Colorado $11.64 $25.21 46%
Connecticut $25.73 $24.88 103%
Delaware $13.04 $21.19 62%
District of Columbia $30.66 $21.19 145%
Florida $14.10 $21.19 67%
Georgia $14.60 $21.19 69%
Idaho $9.90 $25.21 39%
Illinois $12.80 $21.84 59%
Indiana $18.88 $21.84 86%
Iowa $15.98 $21.84 73%
Kansas $22.16 $21.84 101%
Kentucky $22.70 $21.19 107%
Louisiana $14.91 $21.19 70%
Maine $16.50 $24.88 66%
Marylandb $27.45 $21.19 130%
Massachusetts $20.79 $24.88 84%
Michigan $17.24 $21.84 79%
Minnesota $21.06 $21.84 96%
Missouri $9.27 $21.84 42%
Nebraska $8.09 $21.84 37%
Nevadac $22.45 $25.21 89%
New Hampshire $15.80 $24.88 64%
New Jersey $23.54 $24.88 95%
New Mexico $16.10 $25.21 64%
New York (Metro Area/Upstate) $17.10/$15.58 $24.88 69%/63%
North Carolina $15.62 $21.19 74%
North Dakota $22.88 $21.84 105%
Ohio (Min‐Max) $10.00 ‐ $200.00 $21.84 n/a
Oklahoma $13.45 $21.19 63%
Oregon $18.90 $25.21 75%
Pennsylvania Varies by county $24.88 n/a
Rhode Island $14.39 $24.88 58%
South Carolina $11.07 $21.19 52%
South Dakota $15.71 $21.84 72%
Tennessee $23.26 $21.19 110%
Texas $22.15 $21.19 105%
Utahd $15.00 $25.21 60%
Virginia $14.93 $21.19 70%
Washington $13.93 $25.21 55%
West Virginia $19.73 $21.19 93%
Wisconsine $12.03 $21.84 55% NOTE: Basic rates do not include any other incidental payments/reimbursements that may be provided to the family foster home. Please see the state’s profile in Section 3 for more detail on these additional payments. a Alaska: Rate change occurs at 30 mos. First range shown is for 0‐29 months; second range is for 30 mos‐11 yrs.; b Maryland: Excludes differential rate paid to certain counties meeting specific criteria relating to percentage of children placed by DC. Current per diem rates are: Under 12: $28.76; Over 12: $29.56; C Nevada: Excludes add‐on rate paid in Washoe County ($6/day).; d Utah provided age‐based basic rates for the purposes of this table, but present their rates in a different format for the state profile document in Section 3.; e Rates listed for Wisconsin represent the age‐related basic maintenance payments for foster homes certified above Level of Care 1. Homes certified as Level of Care 1 had a previous relationship with a child or are relatives. The rates for these homes are do not vary by the child’s age and are lower than the age‐related basic maintenance rates. Therefore, we have included the age‐related basic maintenance payments for homes above Level of Care 1 in this table for comparability purposes with other states.
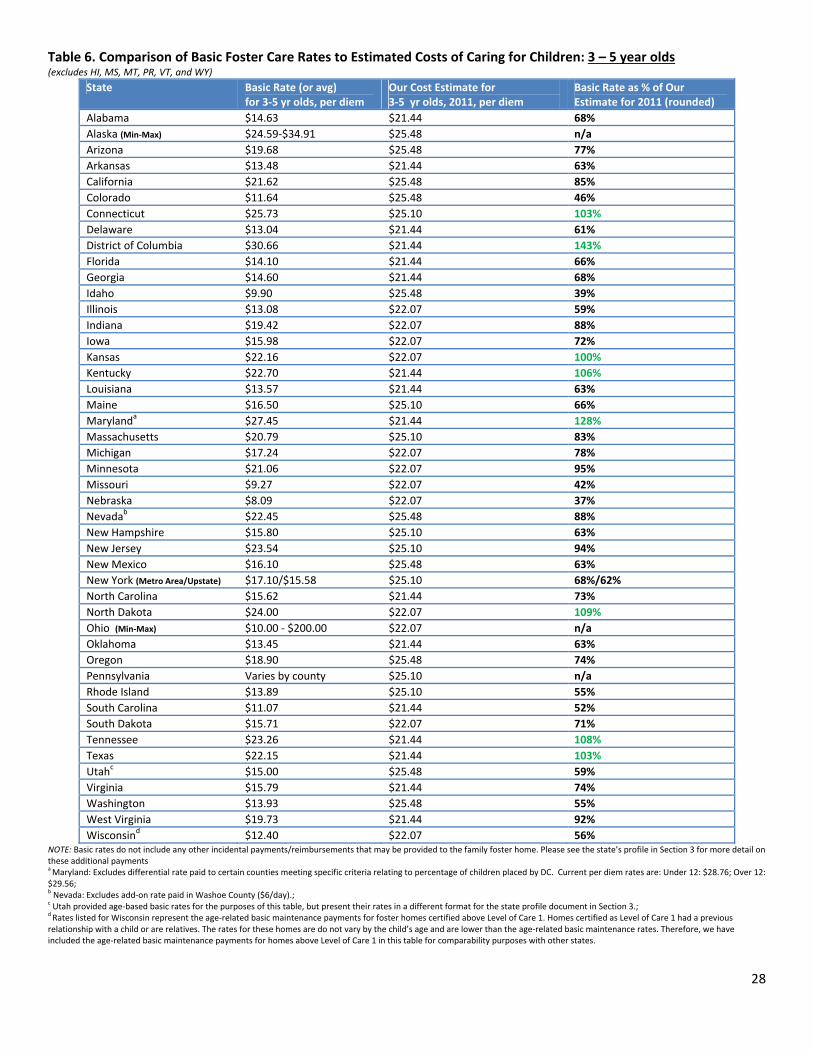
28
Table 6. Comparison of Basic Foster Care Rates to Estimated Costs of Caring for Children: 3 – 5 year olds
(excludes HI, MS, MT, PR, VT, and WY)
State Basic Rate (or avg) for 3‐5 yr olds, per diem
Our Cost Estimate for 3‐5 yr olds, 2011, per diem
Basic Rate as % of Our Estimate for 2011 (rounded)
Alabama $14.63 $21.44 68%
Alaska (Min‐Max) $24.59‐$34.91 $25.48 n/a
Arizona $19.68 $25.48 77%
Arkansas $13.48 $21.44 63%
California $21.62 $25.48 85%
Colorado $11.64 $25.48 46%
Connecticut $25.73 $25.10 103%
Delaware $13.04 $21.44 61%
District of Columbia $30.66 $21.44 143%
Florida $14.10 $21.44 66%
Georgia $14.60 $21.44 68%
Idaho $9.90 $25.48 39%
Illinois $13.08 $22.07 59%
Indiana $19.42 $22.07 88%
Iowa $15.98 $22.07 72%
Kansas $22.16 $22.07 100%
Kentucky $22.70 $21.44 106%
Louisiana $13.57 $21.44 63%
Maine $16.50 $25.10 66%
Marylanda $27.45 $21.44 128%
Massachusetts $20.79 $25.10 83%
Michigan $17.24 $22.07 78%
Minnesota $21.06 $22.07 95%
Missouri $9.27 $22.07 42%
Nebraska $8.09 $22.07 37%
Nevadab $22.45 $25.48 88%
New Hampshire $15.80 $25.10 63%
New Jersey $23.54 $25.10 94%
New Mexico $16.10 $25.48 63%
New York (Metro Area/Upstate) $17.10/$15.58 $25.10 68%/62%
North Carolina $15.62 $21.44 73%
North Dakota $24.00 $22.07 109%
Ohio (Min‐Max) $10.00 ‐ $200.00 $22.07 n/a
Oklahoma $13.45 $21.44 63%
Oregon $18.90 $25.48 74%
Pennsylvania Varies by county $25.10 n/a
Rhode Island $13.89 $25.10 55%
South Carolina $11.07 $21.44 52%
South Dakota $15.71 $22.07 71%
Tennessee $23.26 $21.44 108%
Texas $22.15 $21.44 103%
Utahc $15.00 $25.48 59%
Virginia $15.79 $21.44 74%
Washington $13.93 $25.48 55%
West Virginia $19.73 $21.44 92%
Wisconsind $12.40 $22.07 56% NOTE: Basic rates do not include any other incidental payments/reimbursements that may be provided to the family foster home. Please see the state’s profile in Section 3 for more detail on these additional payments a Maryland: Excludes differential rate paid to certain counties meeting specific criteria relating to percentage of children placed by DC. Current per diem rates are: Under 12: $28.76; Over 12: $29.56; b Nevada: Excludes add‐on rate paid in Washoe County ($6/day).; c Utah provided age‐based basic rates for the purposes of this table, but present their rates in a different format for the state profile document in Section 3.; d Rates listed for Wisconsin represent the age‐related basic maintenance payments for foster homes certified above Level of Care 1. Homes certified as Level of Care 1 had a previous relationship with a child or are relatives. The rates for these homes are do not vary by the child’s age and are lower than the age‐related basic maintenance rates. Therefore, we have included the age‐related basic maintenance payments for homes above Level of Care 1 in this table for comparability purposes with other states.
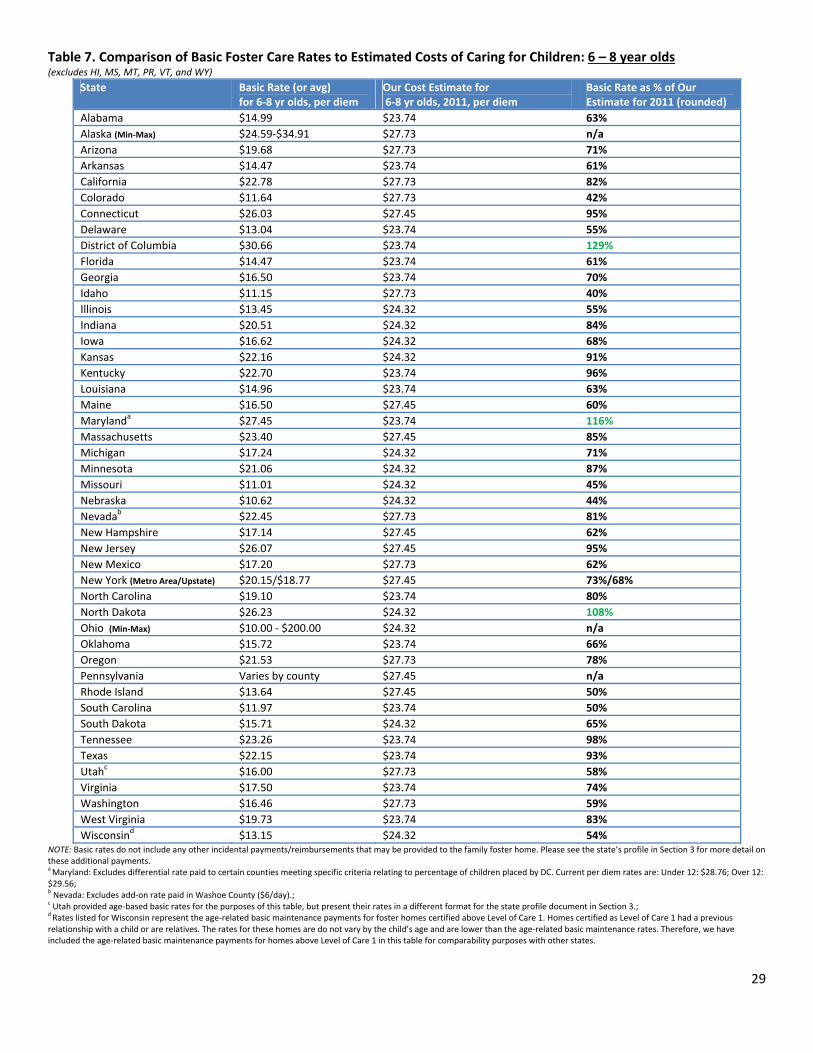
29
Table 7. Comparison of Basic Foster Care Rates to Estimated Costs of Caring for Children: 6 – 8 year olds
(excludes HI, MS, MT, PR, VT, and WY)
State Basic Rate (or avg) for 6‐8 yr olds, per diem
Our Cost Estimate for 6‐8 yr olds, 2011, per diem
Basic Rate as % of Our Estimate for 2011 (rounded)
Alabama $14.99 $23.74 63%
Alaska (Min‐Max) $24.59‐$34.91 $27.73 n/a
Arizona $19.68 $27.73 71%
Arkansas $14.47 $23.74 61%
California $22.78 $27.73 82%
Colorado $11.64 $27.73 42%
Connecticut $26.03 $27.45 95%
Delaware $13.04 $23.74 55%
District of Columbia $30.66 $23.74 129%
Florida $14.47 $23.74 61%
Georgia $16.50 $23.74 70%
Idaho $11.15 $27.73 40%
Illinois $13.45 $24.32 55%
Indiana $20.51 $24.32 84%
Iowa $16.62 $24.32 68%
Kansas $22.16 $24.32 91%
Kentucky $22.70 $23.74 96%
Louisiana $14.96 $23.74 63%
Maine $16.50 $27.45 60%
Marylanda $27.45 $23.74 116%
Massachusetts $23.40 $27.45 85%
Michigan $17.24 $24.32 71%
Minnesota $21.06 $24.32 87%
Missouri $11.01 $24.32 45%
Nebraska $10.62 $24.32 44%
Nevadab $22.45 $27.73 81%
New Hampshire $17.14 $27.45 62%
New Jersey $26.07 $27.45 95%
New Mexico $17.20 $27.73 62%
New York (Metro Area/Upstate) $20.15/$18.77 $27.45 73%/68%
North Carolina $19.10 $23.74 80%
North Dakota $26.23 $24.32 108%
Ohio (Min‐Max) $10.00 ‐ $200.00 $24.32 n/a
Oklahoma $15.72 $23.74 66%
Oregon $21.53 $27.73 78%
Pennsylvania Varies by county $27.45 n/a
Rhode Island $13.64 $27.45 50%
South Carolina $11.97 $23.74 50%
South Dakota $15.71 $24.32 65%
Tennessee $23.26 $23.74 98%
Texas $22.15 $23.74 93%
Utahc $16.00 $27.73 58%
Virginia $17.50 $23.74 74%
Washington $16.46 $27.73 59%
West Virginia $19.73 $23.74 83%
Wisconsind $13.15 $24.32 54% NOTE: Basic rates do not include any other incidental payments/reimbursements that may be provided to the family foster home. Please see the state’s profile in Section 3 for more detail on these additional payments. a Maryland: Excludes differential rate paid to certain counties meeting specific criteria relating to percentage of children placed by DC. Current per diem rates are: Under 12: $28.76; Over 12: $29.56; b Nevada: Excludes add‐on rate paid in Washoe County ($6/day).; c Utah provided age‐based basic rates for the purposes of this table, but present their rates in a different format for the state profile document in Section 3.; d Rates listed for Wisconsin represent the age‐related basic maintenance payments for foster homes certified above Level of Care 1. Homes certified as Level of Care 1 had a previous relationship with a child or are relatives. The rates for these homes are do not vary by the child’s age and are lower than the age‐related basic maintenance rates. Therefore, we have included the age‐related basic maintenance payments for homes above Level of Care 1 in this table for comparability purposes with other states.
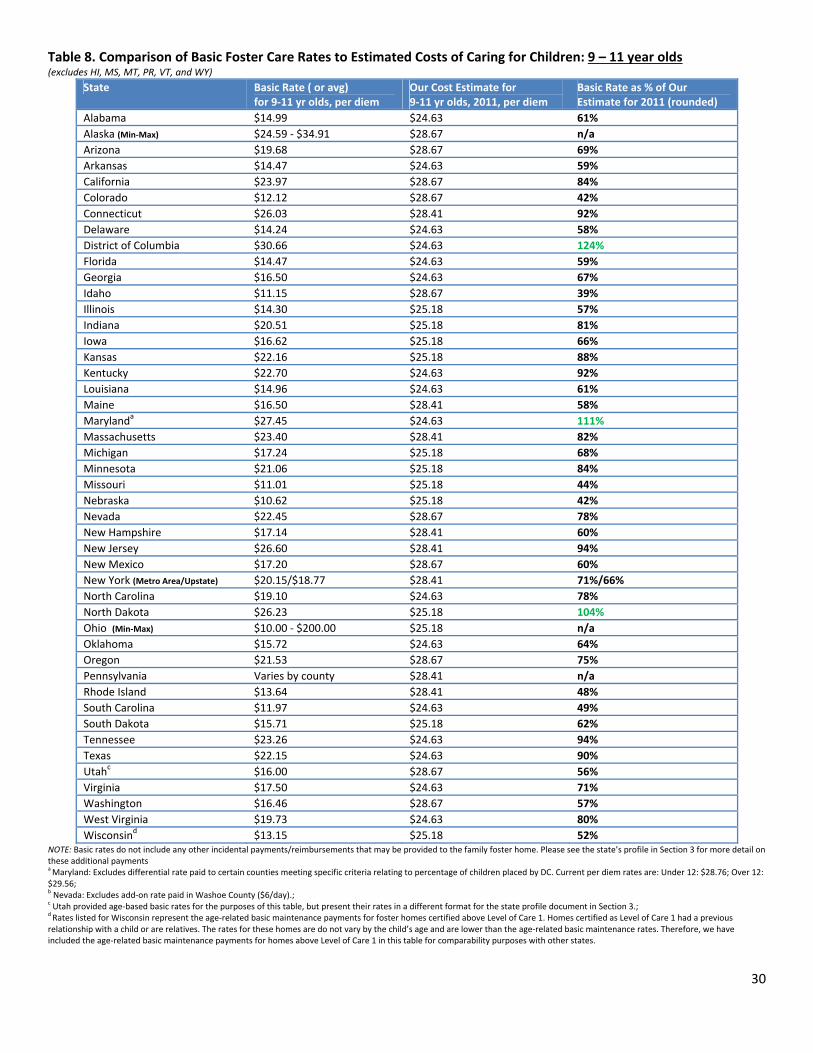
30
Table 8. Comparison of Basic Foster Care Rates to Estimated Costs of Caring for Children: 9 – 11 year olds (excludes HI, MS, MT, PR, VT, and WY)
State Basic Rate ( or avg) for 9‐11 yr olds, per diem
Our Cost Estimate for 9‐11 yr olds, 2011, per diem
Basic Rate as % of Our Estimate for 2011 (rounded)
Alabama $14.99 $24.63 61%
Alaska (Min‐Max) $24.59 ‐ $34.91 $28.67 n/a
Arizona $19.68 $28.67 69%
Arkansas $14.47 $24.63 59%
California $23.97 $28.67 84%
Colorado $12.12 $28.67 42%
Connecticut $26.03 $28.41 92%
Delaware $14.24 $24.63 58%
District of Columbia $30.66 $24.63 124%
Florida $14.47 $24.63 59%
Georgia $16.50 $24.63 67%
Idaho $11.15 $28.67 39%
Illinois $14.30 $25.18 57%
Indiana $20.51 $25.18 81%
Iowa $16.62 $25.18 66%
Kansas $22.16 $25.18 88%
Kentucky $22.70 $24.63 92%
Louisiana $14.96 $24.63 61%
Maine $16.50 $28.41 58%
Marylanda $27.45 $24.63 111%
Massachusetts $23.40 $28.41 82%
Michigan $17.24 $25.18 68%
Minnesota $21.06 $25.18 84%
Missouri $11.01 $25.18 44%
Nebraska $10.62 $25.18 42%
Nevada $22.45 $28.67 78%
New Hampshire $17.14 $28.41 60%
New Jersey $26.60 $28.41 94%
New Mexico $17.20 $28.67 60%
New York (Metro Area/Upstate) $20.15/$18.77 $28.41 71%/66%
North Carolina $19.10 $24.63 78%
North Dakota $26.23 $25.18 104%
Ohio (Min‐Max) $10.00 ‐ $200.00 $25.18 n/a
Oklahoma $15.72 $24.63 64%
Oregon $21.53 $28.67 75%
Pennsylvania Varies by county $28.41 n/a
Rhode Island $13.64 $28.41 48%
South Carolina $11.97 $24.63 49%
South Dakota $15.71 $25.18 62%
Tennessee $23.26 $24.63 94%
Texas $22.15 $24.63 90%
Utahc $16.00 $28.67 56%
Virginia $17.50 $24.63 71%
Washington $16.46 $28.67 57%
West Virginia $19.73 $24.63 80%
Wisconsind $13.15 $25.18 52% NOTE: Basic rates do not include any other incidental payments/reimbursements that may be provided to the family foster home. Please see the state’s profile in Section 3 for more detail on these additional payments a Maryland: Excludes differential rate paid to certain counties meeting specific criteria relating to percentage of children placed by DC. Current per diem rates are: Under 12: $28.76; Over 12: $29.56; b Nevada: Excludes add‐on rate paid in Washoe County ($6/day).; c Utah provided age‐based basic rates for the purposes of this table, but present their rates in a different format for the state profile document in Section 3.; d Rates listed for Wisconsin represent the age‐related basic maintenance payments for foster homes certified above Level of Care 1. Homes certified as Level of Care 1 had a previous relationship with a child or are relatives. The rates for these homes are do not vary by the child’s age and are lower than the age‐related basic maintenance rates. Therefore, we have included the age‐related basic maintenance payments for homes above Level of Care 1 in this table for comparability purposes with other states.
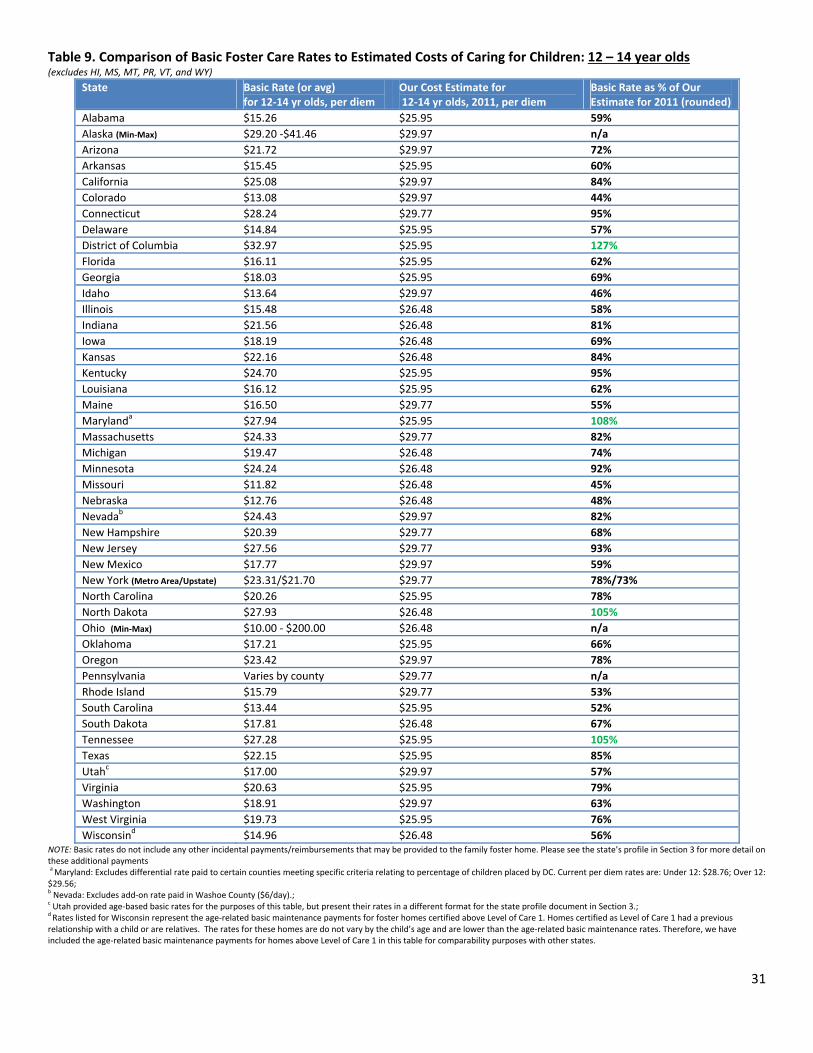
31
Table 9. Comparison of Basic Foster Care Rates to Estimated Costs of Caring for Children: 12 – 14 year olds (excludes HI, MS, MT, PR, VT, and WY)
State Basic Rate (or avg) for 12‐14 yr olds, per diem
Our Cost Estimate for 12‐14 yr olds, 2011, per diem
Basic Rate as % of Our Estimate for 2011 (rounded)
Alabama $15.26 $25.95 59%
Alaska (Min‐Max) $29.20 ‐$41.46 $29.97 n/a
Arizona $21.72 $29.97 72%
Arkansas $15.45 $25.95 60%
California $25.08 $29.97 84%
Colorado $13.08 $29.97 44%
Connecticut $28.24 $29.77 95%
Delaware $14.84 $25.95 57%
District of Columbia $32.97 $25.95 127%
Florida $16.11 $25.95 62%
Georgia $18.03 $25.95 69%
Idaho $13.64 $29.97 46%
Illinois $15.48 $26.48 58%
Indiana $21.56 $26.48 81%
Iowa $18.19 $26.48 69%
Kansas $22.16 $26.48 84%
Kentucky $24.70 $25.95 95%
Louisiana $16.12 $25.95 62%
Maine $16.50 $29.77 55%
Marylanda $27.94 $25.95 108%
Massachusetts $24.33 $29.77 82%
Michigan $19.47 $26.48 74%
Minnesota $24.24 $26.48 92%
Missouri $11.82 $26.48 45%
Nebraska $12.76 $26.48 48%
Nevadab $24.43 $29.97 82%
New Hampshire $20.39 $29.77 68%
New Jersey $27.56 $29.77 93%
New Mexico $17.77 $29.97 59%
New York (Metro Area/Upstate) $23.31/$21.70 $29.77 78%/73%
North Carolina $20.26 $25.95 78%
North Dakota $27.93 $26.48 105%
Ohio (Min‐Max) $10.00 ‐ $200.00 $26.48 n/a
Oklahoma $17.21 $25.95 66%
Oregon $23.42 $29.97 78%
Pennsylvania Varies by county $29.77 n/a
Rhode Island $15.79 $29.77 53%
South Carolina $13.44 $25.95 52%
South Dakota $17.81 $26.48 67%
Tennessee $27.28 $25.95 105%
Texas $22.15 $25.95 85%
Utahc $17.00 $29.97 57%
Virginia $20.63 $25.95 79%
Washington $18.91 $29.97 63%
West Virginia $19.73 $25.95 76%
Wisconsind $14.96 $26.48 56% NOTE: Basic rates do not include any other incidental payments/reimbursements that may be provided to the family foster home. Please see the state’s profile in Section 3 for more detail on these additional payments a Maryland: Excludes differential rate paid to certain counties meeting specific criteria relating to percentage of children placed by DC. Current per diem rates are: Under 12: $28.76; Over 12: $29.56; b Nevada: Excludes add‐on rate paid in Washoe County ($6/day).; c Utah provided age‐based basic rates for the purposes of this table, but present their rates in a different format for the state profile document in Section 3.; d Rates listed for Wisconsin represent the age‐related basic maintenance payments for foster homes certified above Level of Care 1. Homes certified as Level of Care 1 had a previous relationship with a child or are relatives. The rates for these homes are do not vary by the child’s age and are lower than the age‐related basic maintenance rates. Therefore, we have included the age‐related basic maintenance payments for homes above Level of Care 1 in this table for comparability purposes with other states.
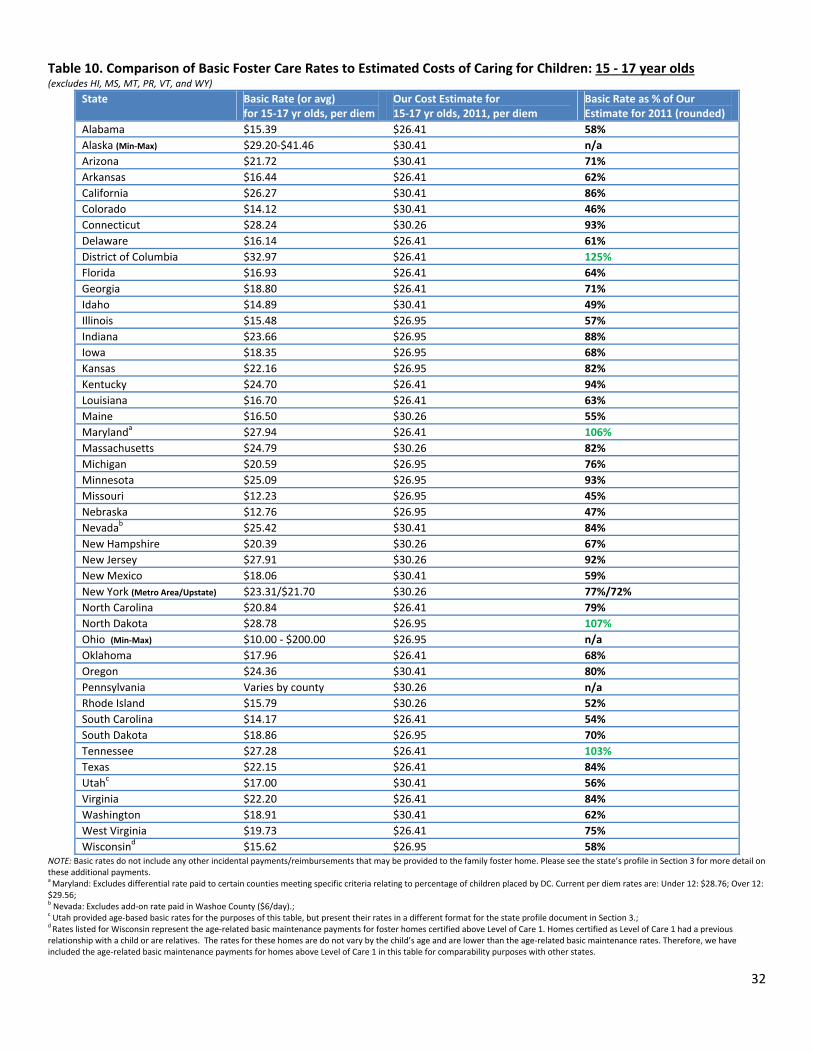
32
Table 10. Comparison of Basic Foster Care Rates to Estimated Costs of Caring for Children: 15 ‐ 17 year olds
(excludes HI, MS, MT, PR, VT, and WY)
State Basic Rate (or avg) for 15‐17 yr olds, per diem
Our Cost Estimate for 15‐17 yr olds, 2011, per diem
Basic Rate as % of Our Estimate for 2011 (rounded)
Alabama $15.39 $26.41 58%
Alaska (Min‐Max) $29.20‐$41.46 $30.41 n/a
Arizona $21.72 $30.41 71%
Arkansas $16.44 $26.41 62%
California $26.27 $30.41 86%
Colorado $14.12 $30.41 46%
Connecticut $28.24 $30.26 93%
Delaware $16.14 $26.41 61%
District of Columbia $32.97 $26.41 125%
Florida $16.93 $26.41 64%
Georgia $18.80 $26.41 71%
Idaho $14.89 $30.41 49%
Illinois $15.48 $26.95 57%
Indiana $23.66 $26.95 88%
Iowa $18.35 $26.95 68%
Kansas $22.16 $26.95 82%
Kentucky $24.70 $26.41 94%
Louisiana $16.70 $26.41 63%
Maine $16.50 $30.26 55%
Marylanda $27.94 $26.41 106%
Massachusetts $24.79 $30.26 82%
Michigan $20.59 $26.95 76%
Minnesota $25.09 $26.95 93%
Missouri $12.23 $26.95 45%
Nebraska $12.76 $26.95 47%
Nevadab $25.42 $30.41 84%
New Hampshire $20.39 $30.26 67%
New Jersey $27.91 $30.26 92%
New Mexico $18.06 $30.41 59%
New York (Metro Area/Upstate) $23.31/$21.70 $30.26 77%/72%
North Carolina $20.84 $26.41 79%
North Dakota $28.78 $26.95 107%
Ohio (Min‐Max) $10.00 ‐ $200.00 $26.95 n/a
Oklahoma $17.96 $26.41 68%
Oregon $24.36 $30.41 80%
Pennsylvania Varies by county $30.26 n/a
Rhode Island $15.79 $30.26 52%
South Carolina $14.17 $26.41 54%
South Dakota $18.86 $26.95 70%
Tennessee $27.28 $26.41 103%
Texas $22.15 $26.41 84%
Utahc $17.00 $30.41 56%
Virginia $22.20 $26.41 84%
Washington $18.91 $30.41 62%
West Virginia $19.73 $26.41 75%
Wisconsind $15.62 $26.95 58% NOTE: Basic rates do not include any other incidental payments/reimbursements that may be provided to the family foster home. Please see the state’s profile in Section 3 for more detail on these additional payments. a Maryland: Excludes differential rate paid to certain counties meeting specific criteria relating to percentage of children placed by DC. Current per diem rates are: Under 12: $28.76; Over 12: $29.56; b Nevada: Excludes add‐on rate paid in Washoe County ($6/day).; c Utah provided age‐based basic rates for the purposes of this table, but present their rates in a different format for the state profile document in Section 3.; d Rates listed for Wisconsin represent the age‐related basic maintenance payments for foster homes certified above Level of Care 1. Homes certified as Level of Care 1 had a previous relationship with a child or are relatives. The rates for these homes are do not vary by the child’s age and are lower than the age‐related basic maintenance rates. Therefore, we have included the age‐related basic maintenance payments for homes above Level of Care 1 in this table for comparability purposes with other states.
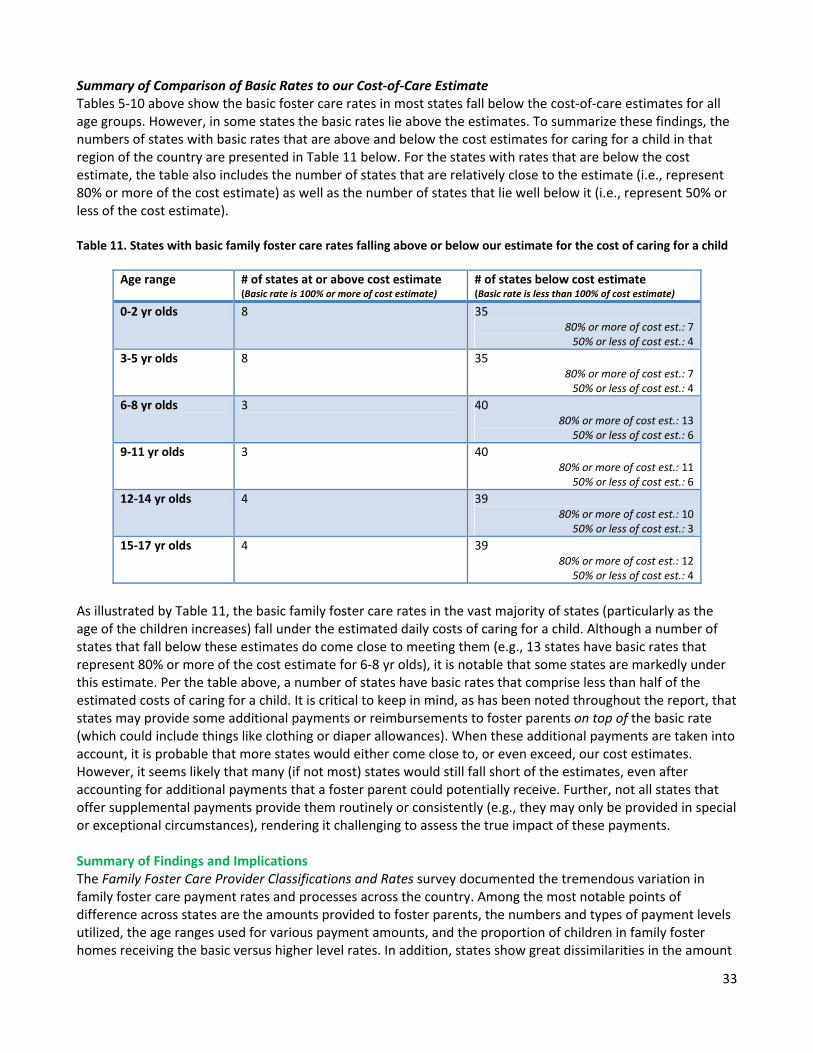
33
Summary of Comparison of Basic Rates to our Cost‐of‐Care Estimate Tables 5‐10 above show the basic foster care rates in most states fall below the cost‐of‐care estimates for all age groups. However, in some states the basic rates lie above the estimates. To summarize these findings, the numbers of states with basic rates that are above and below the cost estimates for caring for a child in that region of the country are presented in Table 11 below. For the states with rates that are below the cost estimate, the table also includes the number of states that are relatively close to the estimate (i.e., represent 80% or more of the cost estimate) as well as the number of states that lie well below it (i.e., represent 50% or less of the cost estimate). Table 11. States with basic family foster care rates falling above or below our estimate for the cost of caring for a child
Age range # of states at or above cost estimate (Basic rate is 100% or more of cost estimate)
# of states below cost estimate (Basic rate is less than 100% of cost estimate)
0‐2 yr olds 8 35 80% or more of cost est.: 7 50% or less of cost est.: 4
3‐5 yr olds 8 3580% or more of cost est.: 7 50% or less of cost est.: 4
6‐8 yr olds 3 4080% or more of cost est.: 13
50% or less of cost est.: 6
9‐11 yr olds 3 4080% or more of cost est.: 11
50% or less of cost est.: 6
12‐14 yr olds 4 3980% or more of cost est.: 10
50% or less of cost est.: 3
15‐17 yr olds 4 3980% or more of cost est.: 12
50% or less of cost est.: 4
As illustrated by Table 11, the basic family foster care rates in the vast majority of states (particularly as the age of the children increases) fall under the estimated daily costs of caring for a child. Although a number of states that fall below these estimates do come close to meeting them (e.g., 13 states have basic rates that represent 80% or more of the cost estimate for 6‐8 yr olds), it is notable that some states are markedly under this estimate. Per the table above, a number of states have basic rates that comprise less than half of the estimated costs of caring for a child. It is critical to keep in mind, as has been noted throughout the report, that states may provide some additional payments or reimbursements to foster parents on top of the basic rate (which could include things like clothing or diaper allowances). When these additional payments are taken into account, it is probable that more states would either come close to, or even exceed, our cost estimates. However, it seems likely that many (if not most) states would still fall short of the estimates, even after accounting for additional payments that a foster parent could potentially receive. Further, not all states that offer supplemental payments provide them routinely or consistently (e.g., they may only be provided in special or exceptional circumstances), rendering it challenging to assess the true impact of these payments. Summary of Findings and Implications The Family Foster Care Provider Classifications and Rates survey documented the tremendous variation in family foster care payment rates and processes across the country. Among the most notable points of difference across states are the amounts provided to foster parents, the numbers and types of payment levels utilized, the age ranges used for various payment amounts, and the proportion of children in family foster homes receiving the basic versus higher level rates. In addition, states show great dissimilarities in the amount
34
of additional payments for incidentals given in addition to the foster care payment, the types of tools or processes used to classify children (or providers) into different rate levels, and the frequency with which rates are reviewed and/or revised. In sum, there seem to be many more differences than commonalities across states in terms of the processes used to determine and provide financial support to family foster care providers on behalf of the children in their care. The survey results raise a host of important questions around whether there is an “optimal” rate structure or rate setting process for family foster care, and whether states are truly meeting the needs of foster children by the payments currently provided to foster parents. This paper presents a useful estimate of the cost of care for children in various regions of the country, derived from USDA data. One key finding from the analyses is that the basic foster care rates (excluding the supplemental payments some states offer in addition to the basic payment) in most states fall below these estimates (similar to findings from Hitting the M.A.R.C., 2007). However, the basic foster care rates in some states lie well above the estimates. Despite the supplemental payments in some states potentially boosting the overall level of financial support provided, many states have rates that lie below the estimated costs of caring for a child. Analyses of the states’ use of basic rates as compared to the proximity of the rate to cost‐of‐care estimates or the states’ use of congregate care settings results in little to no relationship between these factors (though with a limited sample size). Thus, additional questions are raised about why some states use their basic foster family care rates much more heavily than other states. If the actual amount of the payment, as examined in light of the estimated cost of care, does not correlate with a high or low usage of the basic rate, what accounts for this variation? Perhaps some states have higher “thresholds” than others for children to be classified in a specialized/higher‐level payment category. Indeed, states have varied and unique systems for placing children (and/or providers) into rate levels. (These criteria and processes are described, whenever possible, in the state profiles in Section 3.) Or, it may be that the foster care caseloads in states differ from one another to a degree such that caseloads in some states may comprise fewer children with “higher‐needs” than in others (and therefore fewer children would be need to be classified into higher rate categories in these states). Another notable variation seen across states in their rate structures involves the difference between the rate levels; in other words, the dollar amount of the basic rate compared to the amount of the specialized/higher level rate(s). States vary tremendously in the magnitude of difference between the basic rates and other rates. In some states, certain specialized rates are close to the basic rates, while in others the specialized rates vastly exceed the basic rates. For example, in several states the first specialized rate level is less than $1.00 per diem higher than the basic rate. However, in other states, the specialized rates start at $15.00 per diem or more over the basic rate. This variation in the gap between rates contributes to questions about whether there is an optimal design for rate structures; not only in the actual amounts, but in the differences between rate levels themselves. One area that the survey did not focus on involves how states establish their rates: What methodologies do they use to set the reimbursement amounts? What regional or state‐specific benchmarks, if any, are used as a point of comparison to assess or revise rates? Do current or former foster parents or other key stakeholders provide input to this process? Although some states provided us with some degree of information about their methods, the data were not explicitly collected through the survey instrument. This information is a critical piece to understanding what factors are being considered or prioritized by states when rates are set. Additional research is warranted to explore both the processes and the implications of states’ rate setting methods on indicators such as foster parent recruitment and retention, placement stability for children, and child outcomes (i.e., well‐being, permanency, and safety). The findings of this survey can be valuable to state and local child welfare staff, advocates, and policymakers, as they assess the level of payments given to providers on behalf of children in family foster care settings. The
35
survey collected a level of detail not previously available on family foster care provider classifications and rates, and the overview of states’ rate categories and amounts provided in Table 1 highlights the tremendous variation in family foster care rate structures across the U.S. Additionally, although this report did not endeavor to assess the “adequacy” of each states’ foster care rates, the comparisons to the cost‐of‐care estimates highlight some critical disparities across states in terms of payment levels (after adjusting for regional differences in cost‐of‐living). These data can be useful as states consider rate revisions and conduct their title IV‐E‐mandated periodic reviews of the appropriateness of their rates. Although the sections above presented an overview of the survey’s findings, states provided a wealth of detail about their foster care rate structures and processes through this research. As such, we have created a profile document for each participating state that summarizes their responses to our survey. These summary profiles are found in Section 3 of the report. Following this is the Appendix in Section 4, which contains additional information provided by the state that may be useful to the reader, including some state‐specific assessment or diagnostic tools used when classifying children and/or providers in various rate categories, as well as sections of state policy manuals that provide further detail on the various rates and payments.
36
References42 U.S.C. § 671 : US Code ‐ Section 671: State plan for foster care and adoption assistance Available at: http://codes.lp.findlaw.com/uscode/42/7/IV/E/671 Code of Federal Regulations, Title 45, sec. 1355.20. Available at: http://cfr.regstoday.com/45cfr1355.aspx#45_CFR_1355p20 Hitting the Marc: Establishing Foster Care Minimum Adequate Rates for Children (2007). Children’s Rights, National Foster Parent Association, and University of Maryland School of Social Work. Available at: http://www.family.umaryland.edu/ryc_research_and_evaluation/publication_product_files/final_reports/MARCTechReport.pdf Los Angeles County Department of Children and Family Services (last updated 9/26/2011). Nationwide Foster Care Rates. http://dcfs.co.la.ca.us/policy/hndbook%20fce/E070/NationalRates.htm National Resource Center for Family‐Centered Practice and Permanency Planning at the Hunter College School of Social Work (last updated 2008). Foster Care Maintenance Payments. Available at: http://www.hunter.cuny.edu/socwork/nrcfcpp/downloads/foster‐care‐maintenance‐payments.pdf U.S. Congressional Research Service (2012). Child Welfare: A Detailed Overview of Program Eligibility and Funding for Foster Care, Adoption Assistance and Kinship Guardianship Assistance under Title IV‐E of the Social Security Act. October 26, 2012, by Emilie Stoltzfus. Washington, DC. Available at: http://greenbook.waysandmeans.house.gov/sites/greenbook.waysandmeans.house.gov/files/2012/documents/R42792_gb_2.pdf U.S. Department of Health and Human Services, Administration for Children and Families, Administration on Children, Youth and Families, Children’s Bureau. (2012). The AFCARS Report. Preliminary FY 2011 Estimates as of July 2012. No. 19. Available at: www.acf.hhs.gov/programs/cb U.S. Department of Health and Human Services, Administration for Children and Families, Administration on Children, Youth and Families, Children’s Bureau. (2011). The AFCARS Report. Preliminary FY 2010 Estimates as of June 2011. No. 18. Available at: www.acf.hhs.gov/programs/cb U.S. Department of Agriculture, Center for Nutrition Policy and Promotion (2012). Expenditures on Children by Families, 2011. Available
at: http://www.cnpp.usda.gov/Publications/CRC/crc2011.pdf. By Mark Lino. Miscellaneous Publication No. 1528‐2011.
AbouttheAuthors Kerry DeVooght, M.S.W., is a Research Scientist in the Child Welfare program area at Child Trends. Ms. DeVooght served as the lead author on the two most recent child welfare financing reports (Federal, State, and Local Spending to Address Child Abuse and Neglect in SFYs 2008 and 2010, and Federal, State, and Local Spending to Address Child Abuse and Neglect in SFY 2006), based on surveys conducted by Child Trends with support from the Annie E. Casey Foundation and Casey Family Programs. Ms. DeVooght manages the State Child Welfare Policy Database for Casey Family Programs (www.childwelfarepolicy.org), an online database that consolidates and organizes information on an array of state child welfare policies so that policy makers, advocates, practitioners, researchers, and other stakeholders can stay abreast of the policies that protect our nation's most vulnerable children. Prior to joining Child Trends, Ms. DeVooght served as a foster care caseworker in Washington, DC, where she provided direct services and case management to youth in therapeutic foster care and their families. She has a bachelor’s degree in psychology from Davidson College, and a master’s degree in social work from the University of North Carolina at Chapel Hill. Dennis Blazey is a well regarded and recognized knowledge source on child welfare finance programs and strategies. Prior to his retirement in April, 2007, Mr. Blazey was employed within the Ohio Department of Job and Family Services from 1977 ‐ 2007. There his job duties included 20+ years as Ohio's child welfare/social services budget and fiscal officer. In that capacity, Mr. Blazey’s responsibilities included development and operation of child welfare financing policies and strategies for both State and County level child welfare programs; creation, development, and operation of Ohio's IV‐E waiver/demonstration ‐ ProtectOhio; and harmonizing finance operations with program policy objectives. In recognition of his work and its benefits to Ohio's children and county child welfare agencies, Mr. Blazey was named Child Welfare Advocate of the Year in 2006 by the Public Children Services Association of Ohio ‐ the first time that honor had ever been given to a finance officer. Since his retirement, Mr. Blazey has worked as a technical assistance resource/consultant/advisor on child welfare policy and finance issues for the Pew Charitable Trusts (Kids Are Waiting campaign), National CASA Association, Action Research Partners, Child Trends, Casey Family Programs, the Child Welfare Strategy Group of the Annie E. Casey Foundation, and various States and Counties. Mr. Blazey is a 1973 graduate from Adrian College (BA with majors in political science, history, and religion), and a 1976 graduate from the University of Toledo College of Law (JD).