Embed Size (px)
Citation preview
Family Court Statistics Quarterly, England and Wales Annual 2016 including October to December 2016 Ministry of Justice Statistics bulletin
Published 30 March 2017
Contents
Contents 1
Introduction 2
Key Findings 4
Section 1 - The Family Justice System 6
Section 2 - Public Law 8
Section 3 - Private Law 12
Section 4 - Legal representation 14
Section 5 - Matrimonial matters 17
Section 6 - Domestic violence remedy orders 20
Section 7 - Forced Marriage Protection Orders 20
Section 8 – Female Genital Mutilation Protection Orders 22
Section 9 - Adoptions 23
Section 10 – The Mental Capacity Act 24
Section 11 – The Probate Service 28
Contacts 30
Family Court Statistics Quarterly: Annual 2016 including October to December 2016
2
Introduction
This statistical bulletin presents statistics on activity in the family courts of England and Wales and provides provisional figures for 2016 as well as the latest quarter (October to December 2016) with accompanying commentary and analysis. The figures give a summary overview of the volume of cases dealt with by these courts over time, with statistics also broken down for the main types of case involved. Detailed statistics and historic time series can be found in the accompanying Excel tables.
The statistics in this bulletin are used to monitor court workloads, to assist in the development of policy, and their subsequent monitoring and evaluation.
Information on civil cases can be found here:
https://www.gov.uk/government/collections/civil-justice-statistics
Information on criminal cases can be found here:
https://www.gov.uk/government/collections/criminal-justice-statistics
Information on publicly funding legal services is now published by the Legal Aid Agency and can be found here:
https://www.gov.uk/government/collections/legal-aid-statistics
There is also a separate Guide to Family Court Statistics published alongside this publication which provides definitions for the terms used in this report, information regarding the symbols and conventions used in the bulletin, as well as information about the systems and data sources used to compile the statistics.
Family Court Statistics Visualisation Tool
As part of our wider work on improving data visualisation and accessibility, we have developed a data visualisation tool which sits on top of the data underlying the publication and its associated csv files – the tool provides users with the capability to:
interrogate the published information at a lower level of detail; and
produce bespoke charts specific to their user requirements.
The tool can be found here: https://public.tableau.com/profile/moj.analysis#!/vizhome/FamilyCourtstatisticstool2016Q4/Frontpage
We are seeking views on how effectively the data visualisation tool:
better meets user needs; and
improves the dissemination of information.
Family Court Statistics Quarterly: Annual 2016 including October to December 2016
3
As well as requesting feedback on the data visualisation tool, the structure and content of this report are continually being reviewed to reflect user requirements. If you have any feedback about the report generally, please contact the production team using the contact details at the back of this report.
Previous editions of Family Court Statistics Quarterly can be found at:
www.gov.uk/government/collections/family-court-statistics-quarterly
Earlier editions of the information presented in this bulletin prior to July 2014 are in the Family chapters of the Court Statistics Quarterly publications which can be found at:
www.gov.uk/government/collections/court-statistics-quarterly
There are a number of CSV files that support this publication, in the accompanying zip file. Further information about these files can be found in the word document ‘Guide to Family Justice - Guide to national and court-level information.doc’, which is also included in the zip file. The CSV files contain:
Selected summary of family cases by Designated Family Judge area and region.
Additional breakdowns and further details for each of the ‘main tables’ published alongside this document.
Changes in reporting
There are no new tables in this edition of Family Court Statistics Quarterly however it should be noted that there has been a revision to the methodology used to produce Tables 7 and 8 – specifically to account for the issue in Public law cases where applicants would generally be public bodies (mostly local authorities) with access to their own legal resources, but who would previously have been shown as an ‘unrepresented’ party. This has now been amended such that they are now shown as represented parties in the above tables, and this has changed the percentage of applicants with legal representation in Public law cases with at least one hearing from around 20% to 99%.
Users of the statistics
The main users of these statistics are Ministers and officials in central government responsible for developing policy with regard to family justice. Other users include the central government departments, and various voluntary organisations with an interest in family justice. The data also feed into statistics produced by the Office for National Statistics, such as public sector productivity.
Next publication
The next edition of Family Court Statistics Quarterly is scheduled to be published on 29 June 2017, covering the period January to March 2017.
Family Court Statistics Quarterly: Annual 2016 including October to December 2016
4
Key Findings
This report presents statistics on activity in the family courts of England and Wales in 2016 and the fourth quarter of 2016 (October to December).
Over 256,000 cases started in family courts in England and Wales in 2016, an increase over the previous two years mainly driven by increases in public law, private law and financial remedy cases.
The number of public law cases started remained fairly steady between 2011 and 2014, until rising to 16,000 in 2015 and again to nearly 19,000 in 2016, an increase of 18% from the previous year. Although figures for Q4 2016 show the first downturn since the start
of 2015, volumes are still up compared with Q4 2015.
The number of private law cases started in 2016 increased by 11% over the previous year from 43,347 to 48,244.
The average time for the disposal of a care or supervision application saw a long term downward trend seen from over 55 weeks in 2011 to 30 weeks in 2014. The drop continued, albeit at a reduced rate over the last two years, to an average of 28.3 weeks for 2015, and then to 26.9 weeks for 2016.
Accordingly, the percentage of care or supervision proceedings disposed of within 26 weeks, increased from 12% in 2011 to 61% in 2016, following on from the 26 week time limit introduced in the Children and Families Act 2014.
The number of applications for domestic violence remedy orders has remained stable over recent years at around 19,000 non-molestation and 4,700 occupation applications per annum.
Following their introduction in July 2015, there have been 121 applications and 94 orders made for Female Genital Mutilation Protection Orders (FGMPOs) up to the end of 2016.
5,868 applications were made for an adoption order in 2016 compared to 6,259 in 2015, and a further drop from the 6,830 applications recorded for 2014.
There has been a steady upward trend in the number of applications made under the Mental Capacity Act 2005, with nearly 30,000 made in 2016. The number of orders made however fell in 2016 to 26,494 from a high of 29,083 in the previous year.
Applications relating to deprivation of liberty increased from 109 in 2013 to 525 in 2014 to 1,497 in 2015. Latest figures show another large increase, more than doubling to 3,143 applications in 2016.
Family Court Statistics Quarterly: Annual 2016 including October to December 2016
5
The number of Lasting Powers of Attorney (LPAs) received has been increasing considerably and steadily since 2008, from 52,494 to 590,593 in 2016.
Family Court Statistics Quarterly: Annual 2016 including October to December 2016
6
Section 1 - The Family Justice System
Until 22 April 2014, family cases were dealt with at Family Proceedings Courts (which were part of the magistrates’ courts), at county courts or in the Family Division of the High Court. From 22 April 2014, all family cases are now dealt with in the Single Family Court.
Family courts deal with cases such as: parental disputes (Private Law), local authority intervention to protect children (Public Law), matrimonial cases such as divorce petitions, the financial provisions for children after divorce or relationship breakdown, domestic violence remedies and adoption.
Total family court case caseload
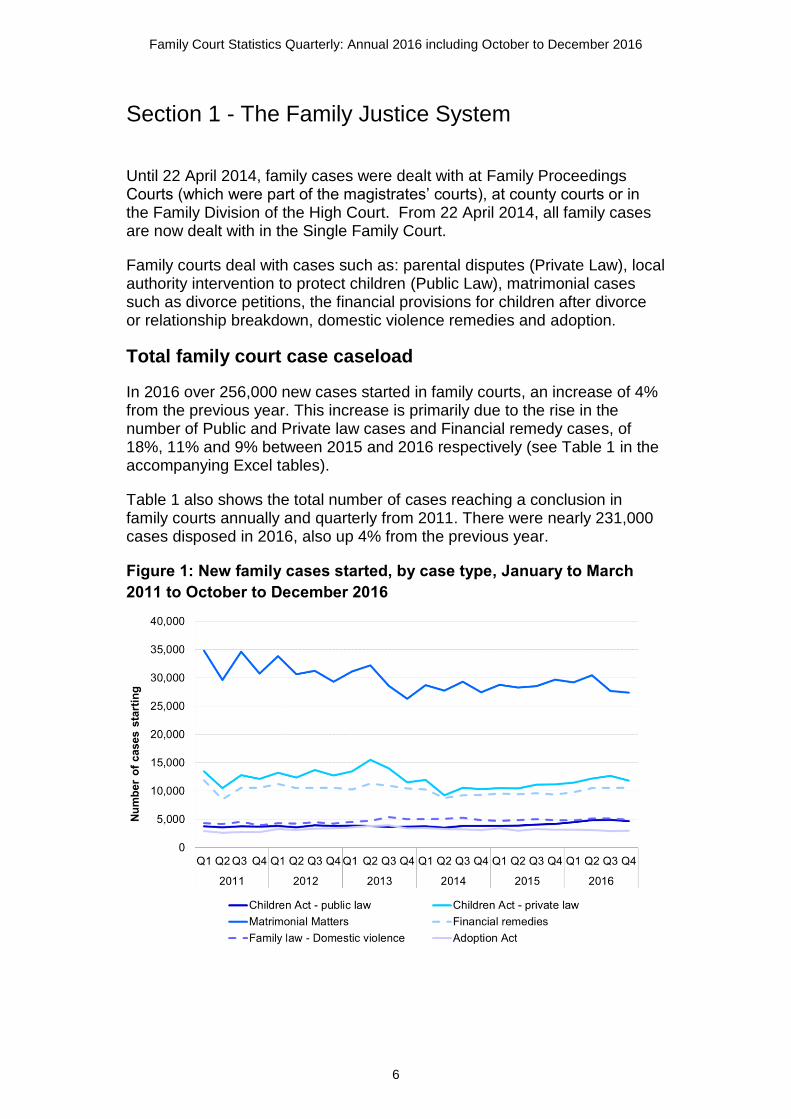
In 2016 over 256,000 new cases started in family courts, an increase of 4% from the previous year. This increase is primarily due to the rise in the number of Public and Private law cases and Financial remedy cases, of 18%, 11% and 9% between 2015 and 2016 respectively (see Table 1 in the accompanying Excel tables).
Table 1 also shows the total number of cases reaching a conclusion in family courts annually and quarterly from 2011. There were nearly 231,000 cases disposed in 2016, also up 4% from the previous year.
Figure 1: New family cases started, by case type, January to March
2011 to October to December 2016
Family Court Statistics Quarterly: Annual 2016 including October to December 2016
7
Timeliness by Case Type
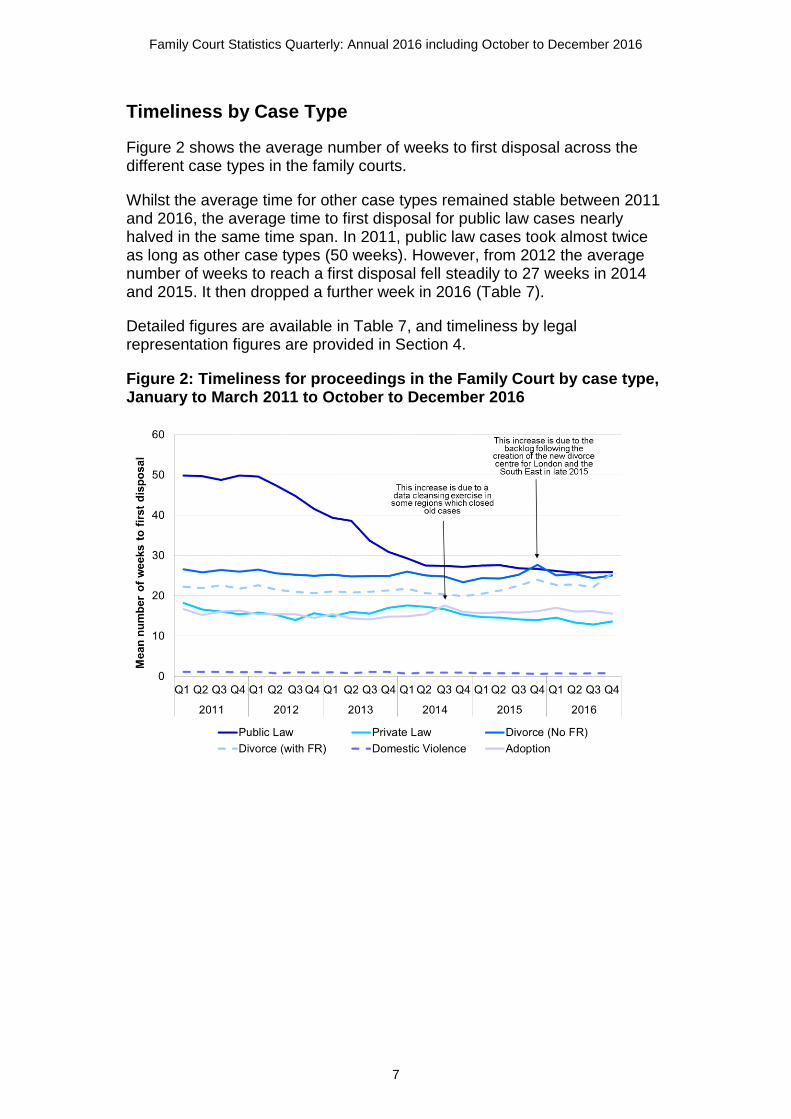
Figure 2 shows the average number of weeks to first disposal across the different case types in the family courts.
Whilst the average time for other case types remained stable between 2011 and 2016, the average time to first disposal for public law cases nearly halved in the same time span. In 2011, public law cases took almost twice as long as other case types (50 weeks). However, from 2012 the average number of weeks to reach a first disposal fell steadily to 27 weeks in 2014 and 2015. It then dropped a further week in 2016 (Table 7).
Detailed figures are available in Table 7, and timeliness by legal representation figures are provided in Section 4.
Figure 2: Timeliness for proceedings in the Family Court by case type, January to March 2011 to October to December 2016
Family Court Statistics Quarterly: Annual 2016 including October to December 2016
8
Section 2 - Public Law
Public law cases are those brought by local authorities or, very rarely, an authorised person to protect the child and ensure they get the care they need. They can apply for a range of different orders, including a care or supervision order which determines whether the child should be looked after or supervised by the local authority, or an emergency protection order which allows an individual or local authority to take a child away from a place where they are in immediate danger to a place of safety.
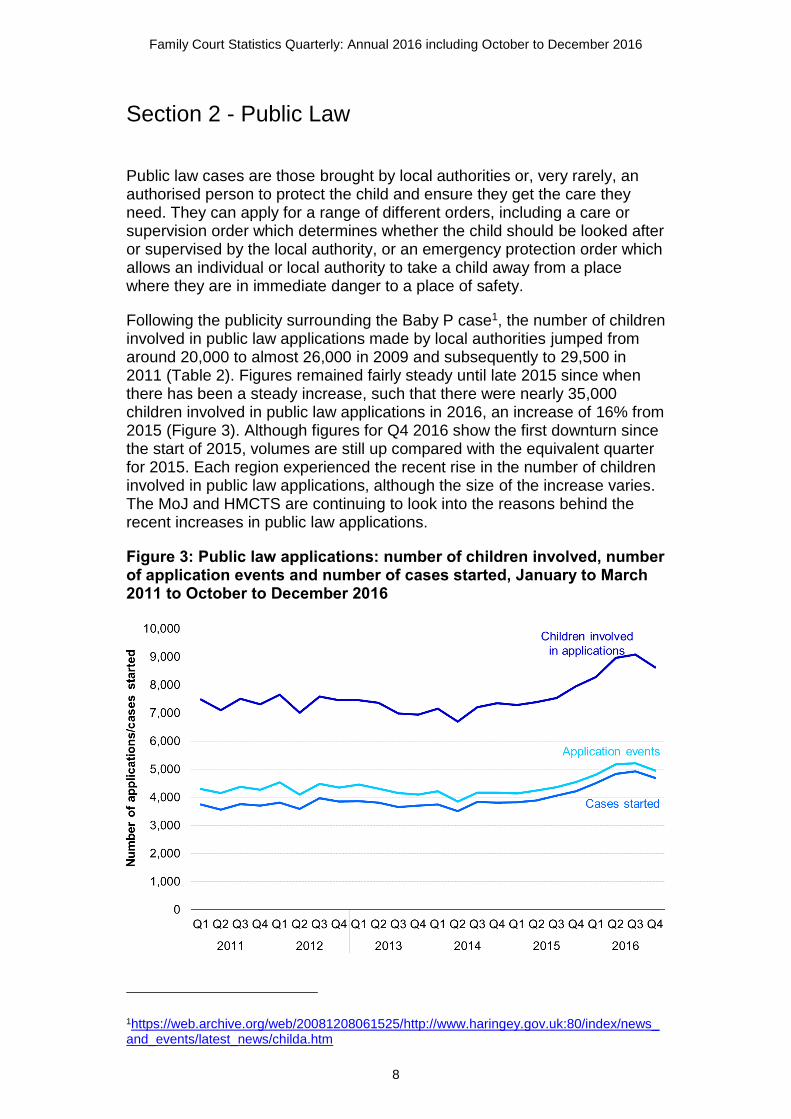
Following the publicity surrounding the Baby P case1, the number of children involved in public law applications made by local authorities jumped from around 20,000 to almost 26,000 in 2009 and subsequently to 29,500 in 2011 (Table 2). Figures remained fairly steady until late 2015 since when there has been a steady increase, such that there were nearly 35,000 children involved in public law applications in 2016, an increase of 16% from 2015 (Figure 3). Although figures for Q4 2016 show the first downturn since the start of 2015, volumes are still up compared with the equivalent quarter for 2015. Each region experienced the recent rise in the number of children involved in public law applications, although the size of the increase varies. The MoJ and HMCTS are continuing to look into the reasons behind the recent increases in public law applications.
Figure 3: Public law applications: number of children involved, number of application events and number of cases started, January to March 2011 to October to December 2016
1https://web.archive.org/web/20081208061525/http://www.haringey.gov.uk:80/index/news_and_events/latest_news/childa.htm
Family Court Statistics Quarterly: Annual 2016 including October to December 2016
9
More than one application may be made during the life of a case. The number of public law cases started increased by 18% to nearly 19,000 in 2016 compared to 2015. The number of applications made, which can cover more than one child, was over 20,000 in 2016 – on average, there were 1.7 children involved in each application.
The number of individual children involved in Public law applications by age group is given in Table 5 – showing that nearly half of the children are aged under 5 at the time of application.
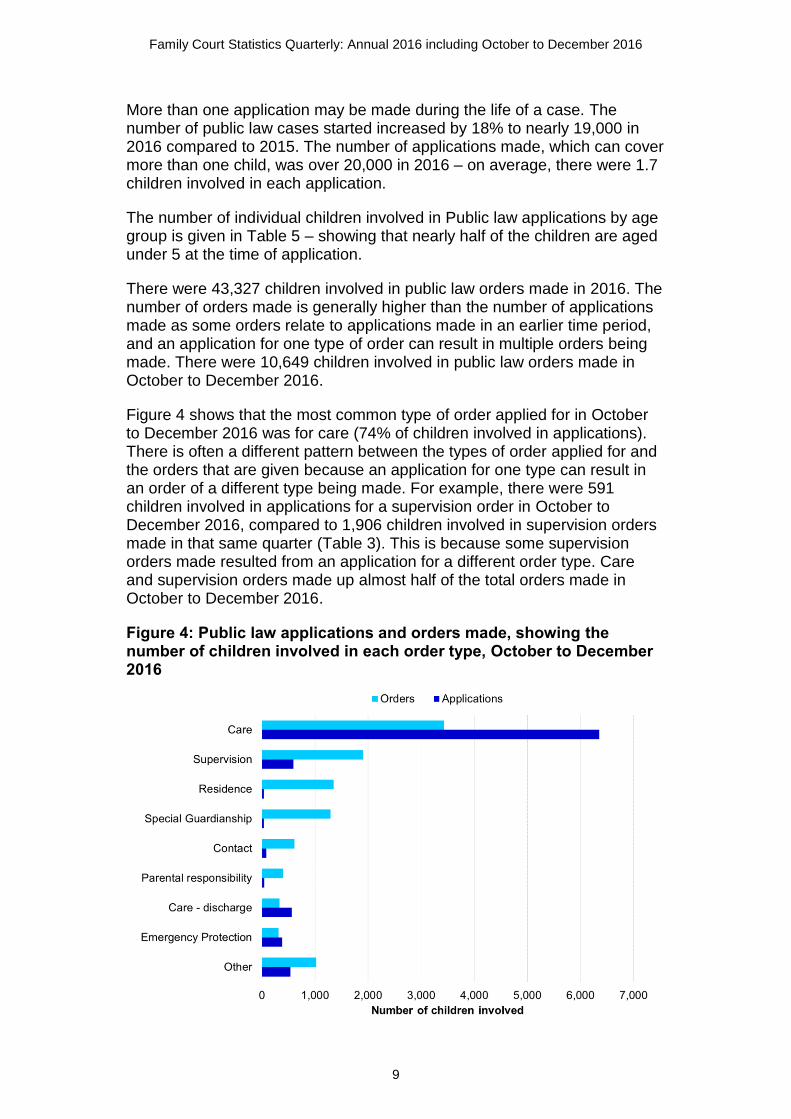
There were 43,327 children involved in public law orders made in 2016. The number of orders made is generally higher than the number of applications made as some orders relate to applications made in an earlier time period, and an application for one type of order can result in multiple orders being made. There were 10,649 children involved in public law orders made in October to December 2016.
Figure 4 shows that the most common type of order applied for in October to December 2016 was for care (74% of children involved in applications). There is often a different pattern between the types of order applied for and the orders that are given because an application for one type can result in an order of a different type being made. For example, there were 591 children involved in applications for a supervision order in October to December 2016, compared to 1,906 children involved in supervision orders made in that same quarter (Table 3). This is because some supervision orders made resulted from an application for a different order type. Care and supervision orders made up almost half of the total orders made in October to December 2016.
Figure 4: Public law applications and orders made, showing the number of children involved in each order type, October to December 2016
Family Court Statistics Quarterly: Annual 2016 including October to December 2016
10
The Children and Family Court Advisory and Support Service (Cafcass) also publishes data on the number of care applications, the latest edition of which can be found here:
https://www.cafcass.gov.uk/leaflets-resources/organisational-material/care-and-private-law-demand-statistics/care-demand-statistics.aspx
Case level care order figures are currently not produced by the MoJ and so comparisons between the two datasets cannot be made at this time.
Timeliness of care proceedings
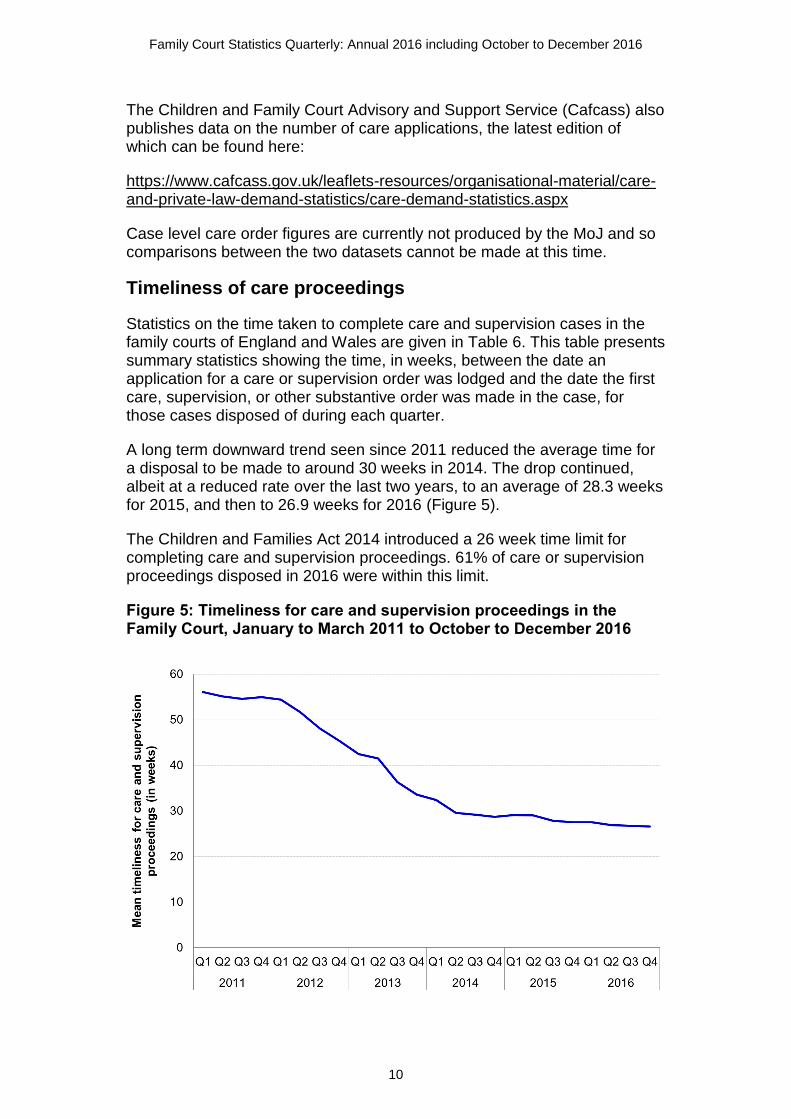
Statistics on the time taken to complete care and supervision cases in the family courts of England and Wales are given in Table 6. This table presents summary statistics showing the time, in weeks, between the date an application for a care or supervision order was lodged and the date the first care, supervision, or other substantive order was made in the case, for those cases disposed of during each quarter.
A long term downward trend seen since 2011 reduced the average time for a disposal to be made to around 30 weeks in 2014. The drop continued, albeit at a reduced rate over the last two years, to an average of 28.3 weeks for 2015, and then to 26.9 weeks for 2016 (Figure 5).
The Children and Families Act 2014 introduced a 26 week time limit for completing care and supervision proceedings. 61% of care or supervision proceedings disposed in 2016 were within this limit.
Figure 5: Timeliness for care and supervision proceedings in the Family Court, January to March 2011 to October to December 2016
Family Court Statistics Quarterly: Annual 2016 including October to December 2016
11
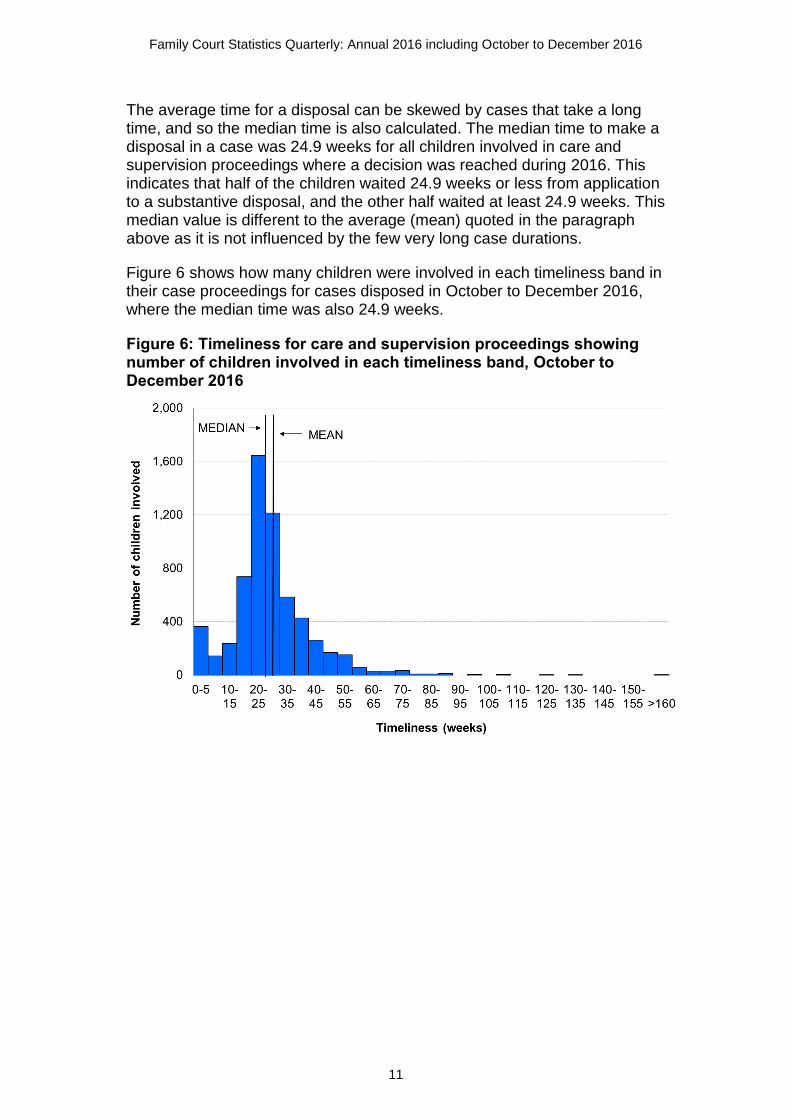
The average time for a disposal can be skewed by cases that take a long time, and so the median time is also calculated. The median time to make a disposal in a case was 24.9 weeks for all children involved in care and supervision proceedings where a decision was reached during 2016. This indicates that half of the children waited 24.9 weeks or less from application to a substantive disposal, and the other half waited at least 24.9 weeks. This median value is different to the average (mean) quoted in the paragraph above as it is not influenced by the few very long case durations.
Figure 6 shows how many children were involved in each timeliness band in their case proceedings for cases disposed in October to December 2016, where the median time was also 24.9 weeks.
Figure 6: Timeliness for care and supervision proceedings showing number of children involved in each timeliness band, October to December 2016
Family Court Statistics Quarterly: Annual 2016 including October to December 2016
12
Section 3 - Private Law
Private law cases are those court cases between two or more private individuals who are trying to resolve a dispute. This is generally where parents have split up and there is a disagreement about who the children should live with and have contact or otherwise spend time with.
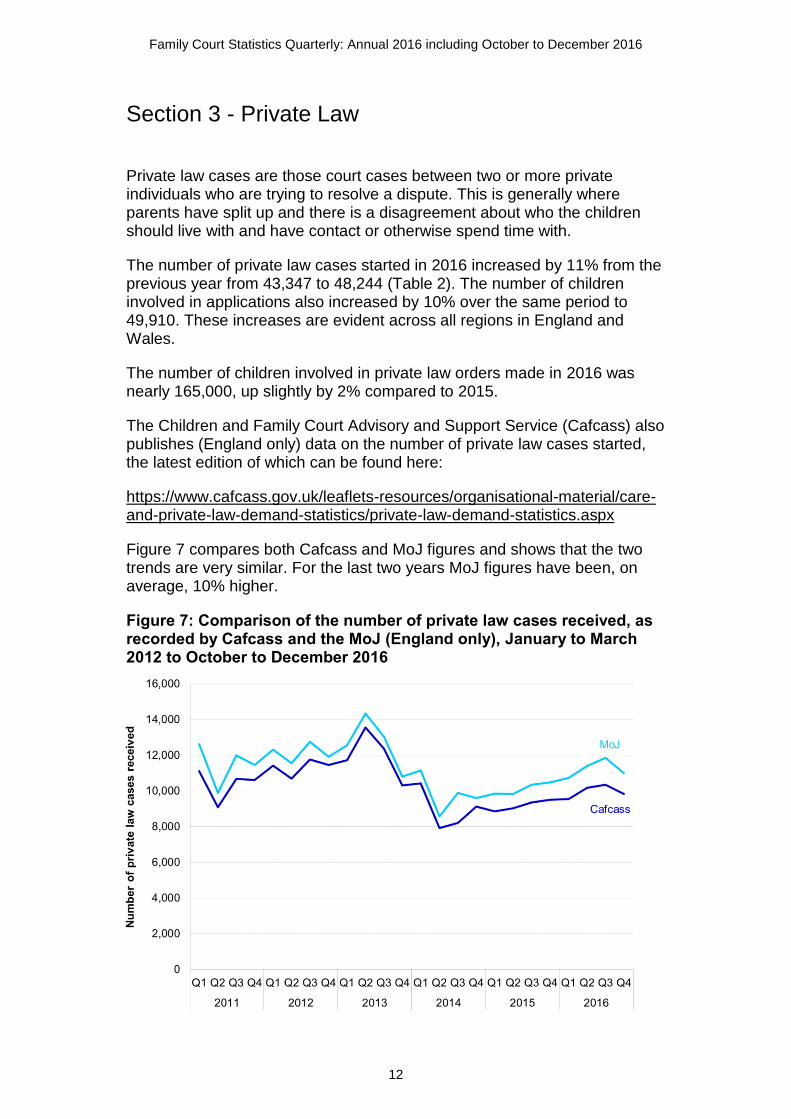
The number of private law cases started in 2016 increased by 11% from the previous year from 43,347 to 48,244 (Table 2). The number of children involved in applications also increased by 10% over the same period to 49,910. These increases are evident across all regions in England and Wales.
The number of children involved in private law orders made in 2016 was nearly 165,000, up slightly by 2% compared to 2015.
The Children and Family Court Advisory and Support Service (Cafcass) also publishes (England only) data on the number of private law cases started, the latest edition of which can be found here:
https://www.cafcass.gov.uk/leaflets-resources/organisational-material/care-and-private-law-demand-statistics/private-law-demand-statistics.aspx
Figure 7 compares both Cafcass and MoJ figures and shows that the two trends are very similar. For the last two years MoJ figures have been, on average, 10% higher.
Figure 7: Comparison of the number of private law cases received, as recorded by Cafcass and the MoJ (England only), January to March 2012 to October to December 2016
Family Court Statistics Quarterly: Annual 2016 including October to December 2016
13
This is mostly due to Cafcass only receiving Section 8 cases2 from the courts. Other differences between the two data sets include the following:
Section 8 cases where all of the issues are dealt with on the day (called 'urgent without notice' applications) should not be sent to Cafcass.
Section 8 cases which are not listed within the Private Law Programme (PLP) and do not have a first hearing dispute resolution appointment (FHDRA) should also not be sent to Cafcass.
Certain non-section 8 cases can be sent to Cafcass if the subject child is a party to ongoing proceedings (and a Cafcass officer has been appointed as the children’s guardian) or the court is directed to do so by a judge or legal advisor.
This accounts for the discrepancy between the two data sets which cannot be accurately matched as it is impossible to identify the various situations described above from administrative data sources (particularly the 'urgent without notice' applications).
Timeliness of private law cases
As shown in Figure 2 and Table 7, from the middle of 2012 to the end of March 2014 the average time to first definitive disposal had been on a slight upward trend for private law cases overall. This trend then reversed with the average time to first disposal at 14.3 weeks for 2015 overall, down 2.5 weeks from the 2014 overall average, and with a further drop to 13.6 weeks for 2016.
2 Under the Children Act 1989, Section 8 orders refer to child arrangement orders (contact and residence), prohibited steps and specific issue orders.
Family Court Statistics Quarterly: Annual 2016 including October to December 2016
14
Section 4 - Legal representation
Figures on the legal representation of parties in family-related court cases are shown in Table 7. This gives the number of disposals made during each quarter and the average duration between application and first substantive disposal, for divorce, public law, private law, adoption and domestic violence cases, according to whether the applicant(s), respondent(s), both or neither had legal representation during the case. A further breakdown of Table 7 by region is published in the CSV files that accompany this publication.
The legal representation status reflects whether the applicant/respondent's legal representative has been recorded or left blank within FamilyMan, the family court case management system. A blank field is assumed to indicate that no legal representation has been used. Table 7 suggests that for over half of divorce cases not involving financial remedies disposed, neither party had legal representation. However, further analysis shows that these were uncontested cases and almost all of them did not have a single hearing. Therefore, parties recorded as without legal representation are not necessarily self-representing litigants in person.
Therefore, to give a more appropriate proxy for litigants in person, a new table (Table 8) has been added which shows the number of parties in cases with at least one hearing by their legal representation status. So, for example, for divorces involving financial remedy, it can be seen that only a small percentage of cases (about 10%) have a hearing, and of those only about a third of the parties involved are unrepresented.
Please note that there has been a revision to the methodology used to produce Tables 7 and 8 – specifically to account for the issue in Public law cases where applicants would generally be public bodies (mostly local authorities) with access to their own legal resources, but who would previously have been shown as an ‘unrepresented’ party. This has now been amended such that they are now shown as represented parties in the above tables, and this has changed the percentage of applicants with legal representation in Public law cases with at last one hearing from around 20% to 99%. The overall trends seen in mean time to disposal of Public law cases by representation type however (table 7) have not changed.
Legal Aid, Sentencing and Punishment of Offender Act, 2012
The implementation of the Legal Aid, Sentencing and Punishment of Offenders Act (LASPO) in April 2013 made changes to the scope and eligibility of legal aid. From April 2013, legal aid is now only available for private family law cases (such as contact or divorce) if there is evidence of domestic violence or child abuse and child abduction cases. Legal aid remains available for public family law cases (such as adoption).
The full details of the LASPO Act can be found here: www.legislation.gov.uk/ukpga/2012/10/enacted
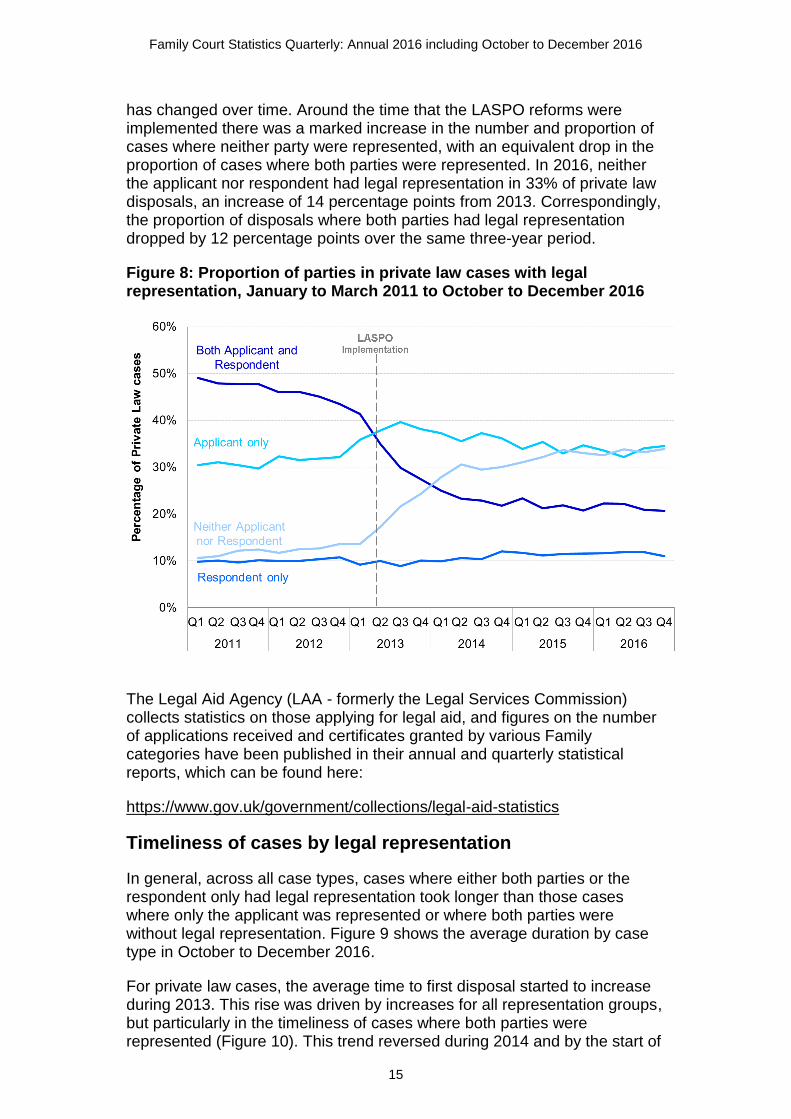
The removal of legal aid for many private law cases has resulted in a change in the pattern of legal representation, and Figure 8 shows how this
Family Court Statistics Quarterly: Annual 2016 including October to December 2016
15
has changed over time. Around the time that the LASPO reforms were implemented there was a marked increase in the number and proportion of cases where neither party were represented, with an equivalent drop in the proportion of cases where both parties were represented. In 2016, neither the applicant nor respondent had legal representation in 33% of private law disposals, an increase of 14 percentage points from 2013. Correspondingly, the proportion of disposals where both parties had legal representation dropped by 12 percentage points over the same three-year period.
Figure 8: Proportion of parties in private law cases with legal representation, January to March 2011 to October to December 2016
The Legal Aid Agency (LAA - formerly the Legal Services Commission) collects statistics on those applying for legal aid, and figures on the number of applications received and certificates granted by various Family categories have been published in their annual and quarterly statistical reports, which can be found here:
https://www.gov.uk/government/collections/legal-aid-statistics
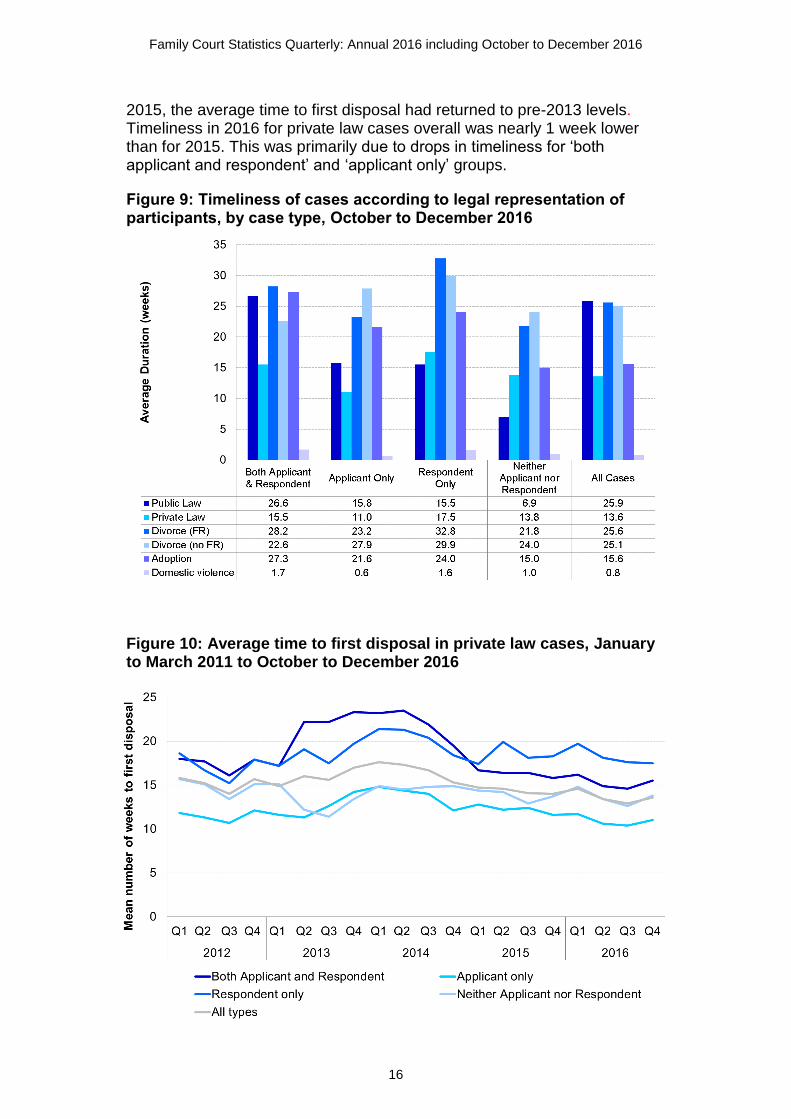
Timeliness of cases by legal representation
In general, across all case types, cases where either both parties or the respondent only had legal representation took longer than those cases where only the applicant was represented or where both parties were without legal representation. Figure 9 shows the average duration by case type in October to December 2016.
For private law cases, the average time to first disposal started to increase during 2013. This rise was driven by increases for all representation groups, but particularly in the timeliness of cases where both parties were represented (Figure 10). This trend reversed during 2014 and by the start of
Family Court Statistics Quarterly: Annual 2016 including October to December 2016
16
2015, the average time to first disposal had returned to pre-2013 levels. Timeliness in 2016 for private law cases overall was nearly 1 week lower than for 2015. This was primarily due to drops in timeliness for ‘both applicant and respondent’ and ‘applicant only’ groups.
Figure 9: Timeliness of cases according to legal representation of participants, by case type, October to December 2016
Figure 10: Average time to first disposal in private law cases, January to March 2011 to October to December 2016
Family Court Statistics Quarterly: Annual 2016 including October to December 2016
17
Section 5 - Matrimonial matters
Table 9 provides the numbers of petitions and decrees granted for divorce, annulment and judicial separation in England and Wales. The National CSV file and the data visualisation tool that accompanies this publication provide additional information on matrimonial proceedings such as gender of petitioner and whether children were involved or not.
Eleven centralised divorce centres were introduced throughout 2014 and 2015 in England and Wales, with the vast majority of uncontested decree nisi applications being considered by legal advisers (rather than district judges) at those centres. This should be noted when looking at the relevant figures given in the DFJ and Region level CSV file.
There were 114,121 petitions in 2016, continuing level trend over recent years. Over 99% of petitions filed for matrimonial proceedings are for divorce. There are very small numbers for annulments and judicial separations.
There were 114,170 decrees nisi and 108,290 decrees absolutes granted in 2016, an increase of 15% and 6% respectively compared to 2015. These increases are primarily due to the backlog following the creation of the new centralised divorce centre for London and the South East Region during 2015, and its subsequent clearance of cases during 2016.
Divorce case progression can be found in Table 10, which shows the number of divorce cases commencing in each year since 2003 and in each quarter since 2009, together with the proportion of those cases that had reached certain stages by the beginning of February 2017 (when the data was extracted for producing this bulletin).
Family Court Statistics Quarterly: Annual 2016 including October to December 2016
18
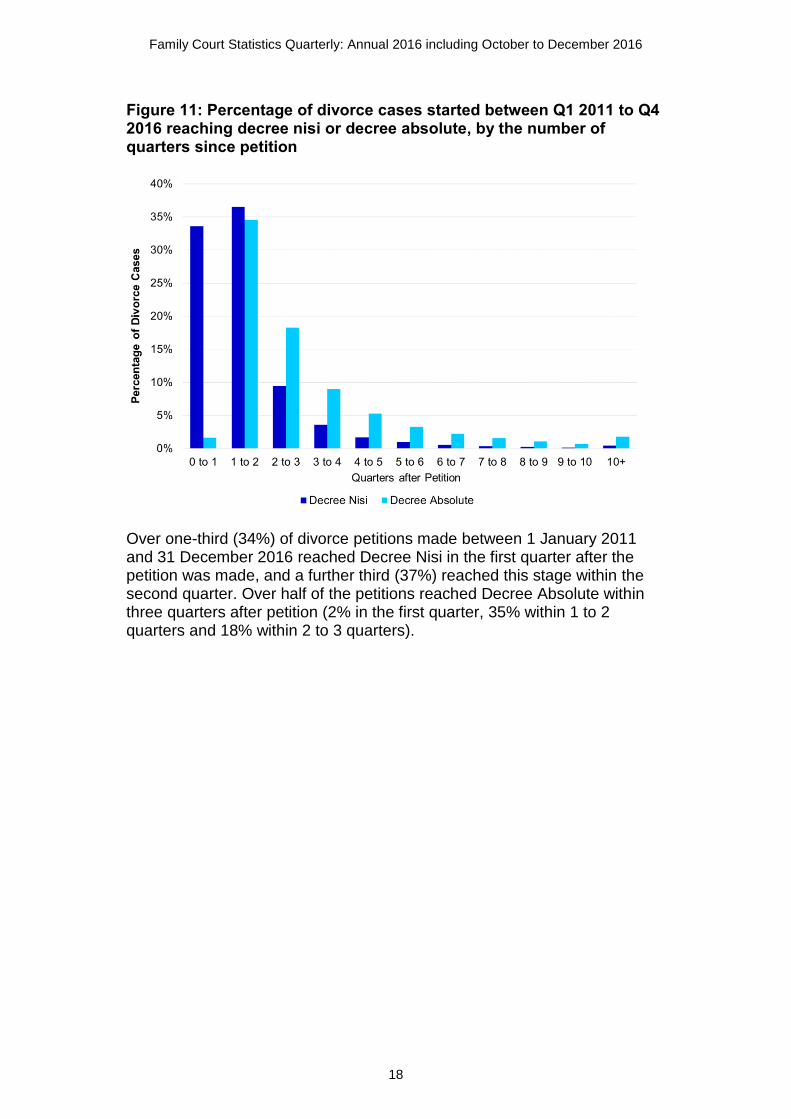
Figure 11: Percentage of divorce cases started between Q1 2011 to Q4 2016 reaching decree nisi or decree absolute, by the number of quarters since petition
Over one-third (34%) of divorce petitions made between 1 January 2011 and 31 December 2016 reached Decree Nisi in the first quarter after the petition was made, and a further third (37%) reached this stage within the second quarter. Over half of the petitions reached Decree Absolute within three quarters after petition (2% in the first quarter, 35% within 1 to 2 quarters and 18% within 2 to 3 quarters).
Family Court Statistics Quarterly: Annual 2016 including October to December 2016
19
Financial remedy
During a divorce, a marriage annulment, or a judicial separation, or the dissolution of a civil partnership, there may still be a need for the court to settle disputes over money or property. The court can make a financial remedy order, formerly known as ‘ancillary relief’. These orders include dealing with the arrangements for the sale or transfer of property, maintenance payments, a lump sum payment or the sharing of a pension. Orders for financial provision other than for financial remedy are not dependent upon divorce proceedings and may be made for children.
There were 46,588 financial remedy applications in 2016, a 10% increase compared to the previous two years (Table 12).
In 2016, there were 40,631 financial remedy disposals, a 5% increase from the previous year. In 2016, 70% of disposals were uncontested, 5 percentage points higher than the previous two years, with 21% initially contested and 9% were contested throughout.
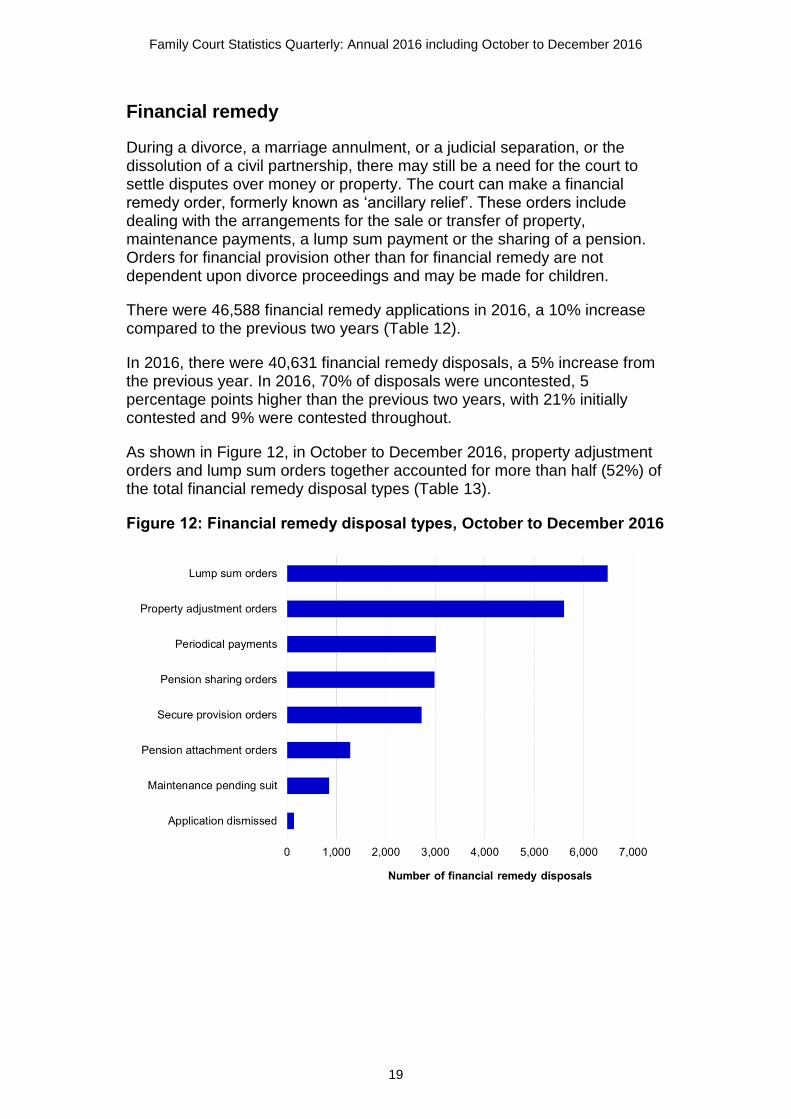
As shown in Figure 12, in October to December 2016, property adjustment orders and lump sum orders together accounted for more than half (52%) of the total financial remedy disposal types (Table 13).
Figure 12: Financial remedy disposal types, October to December 2016
Family Court Statistics Quarterly: Annual 2016 including October to December 2016
20
Section 6 - Domestic violence remedy orders
A range of people can apply to the court for a domestic violence remedy order: spouses, cohabitants, ex-cohabitants, those who live or have lived in the same household (other than by reason of one of them being the other’s employee, tenant, lodger or boarder), certain relatives (for example, parents, grandparents, in-laws, brothers, sisters), and those who have agreed to marry one another.
Two types of order can be granted:
a non-molestation order, which can either prohibit particular behaviour or general molestation by someone who has previously been violent towards the applicant and/or any relevant children,
an occupation order, which can define or regulate rights of occupation of the home by the parties involved.
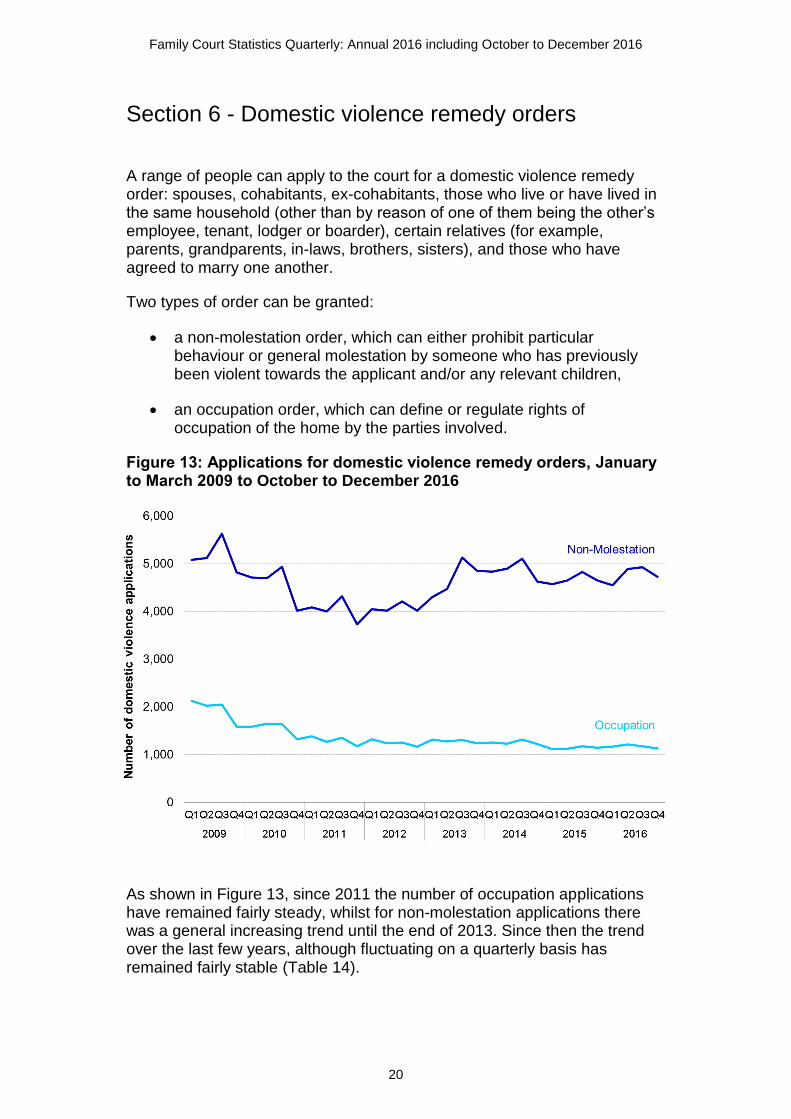
Figure 13: Applications for domestic violence remedy orders, January to March 2009 to October to December 2016
As shown in Figure 13, since 2011 the number of occupation applications have remained fairly steady, whilst for non-molestation applications there was a general increasing trend until the end of 2013. Since then the trend over the last few years, although fluctuating on a quarterly basis has remained fairly stable (Table 14).
Family Court Statistics Quarterly: Annual 2016 including October to December 2016
21
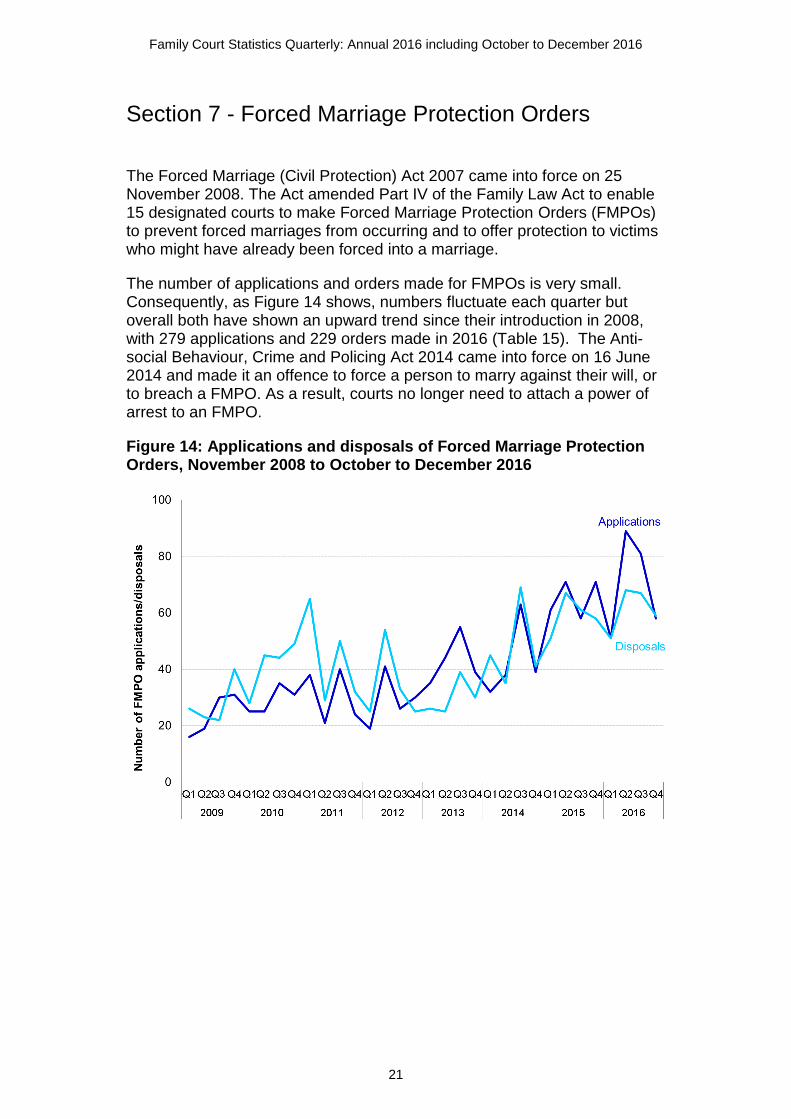
Section 7 - Forced Marriage Protection Orders
The Forced Marriage (Civil Protection) Act 2007 came into force on 25 November 2008. The Act amended Part IV of the Family Law Act to enable 15 designated courts to make Forced Marriage Protection Orders (FMPOs) to prevent forced marriages from occurring and to offer protection to victims who might have already been forced into a marriage.
The number of applications and orders made for FMPOs is very small. Consequently, as Figure 14 shows, numbers fluctuate each quarter but overall both have shown an upward trend since their introduction in 2008, with 279 applications and 229 orders made in 2016 (Table 15). The Anti-social Behaviour, Crime and Policing Act 2014 came into force on 16 June 2014 and made it an offence to force a person to marry against their will, or to breach a FMPO. As a result, courts no longer need to attach a power of arrest to an FMPO.
Figure 14: Applications and disposals of Forced Marriage Protection Orders, November 2008 to October to December 2016
Family Court Statistics Quarterly: Annual 2016 including October to December 2016
22
Section 8 – Female Genital Mutilation Protection Orders
Female Genital Mutilation Protection Orders (FGMPOs) are intended to safeguard girls who are at risk of FGM at home or abroad, or who are survivors.
FGMPOs came into effect on 17 July 2015, and quarterly figures for these orders are presented in this bulletin (Table 16). In total, there have been 121 applications and 94 orders made since their introduction up to the end of 2016.
Family Court Statistics Quarterly: Annual 2016 including October to December 2016
23
Section 9 - Adoptions
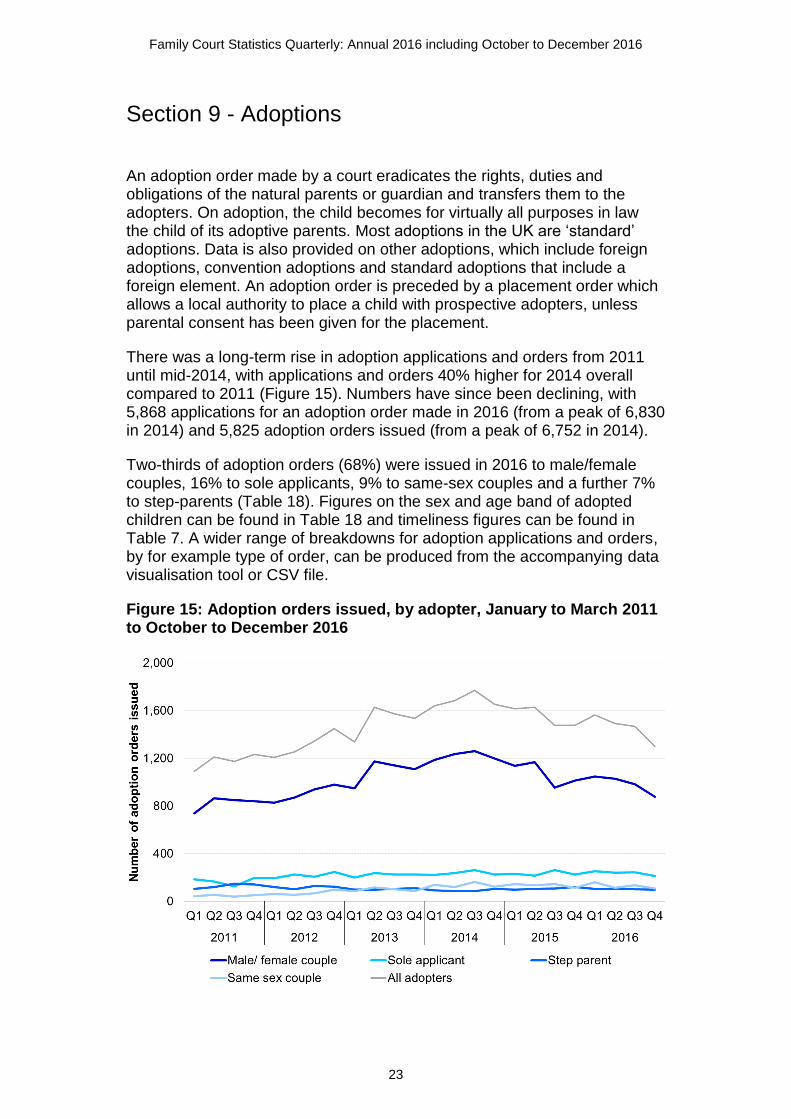
An adoption order made by a court eradicates the rights, duties and obligations of the natural parents or guardian and transfers them to the adopters. On adoption, the child becomes for virtually all purposes in law the child of its adoptive parents. Most adoptions in the UK are ‘standard’ adoptions. Data is also provided on other adoptions, which include foreign adoptions, convention adoptions and standard adoptions that include a foreign element. An adoption order is preceded by a placement order which allows a local authority to place a child with prospective adopters, unless parental consent has been given for the placement.
There was a long-term rise in adoption applications and orders from 2011 until mid-2014, with applications and orders 40% higher for 2014 overall compared to 2011 (Figure 15). Numbers have since been declining, with 5,868 applications for an adoption order made in 2016 (from a peak of 6,830 in 2014) and 5,825 adoption orders issued (from a peak of 6,752 in 2014).
Two-thirds of adoption orders (68%) were issued in 2016 to male/female couples, 16% to sole applicants, 9% to same-sex couples and a further 7% to step-parents (Table 18). Figures on the sex and age band of adopted children can be found in Table 18 and timeliness figures can be found in Table 7. A wider range of breakdowns for adoption applications and orders, by for example type of order, can be produced from the accompanying data visualisation tool or CSV file.
Figure 15: Adoption orders issued, by adopter, January to March 2011 to October to December 2016
Family Court Statistics Quarterly: Annual 2016 including October to December 2016
24
Section 10 – The Mental Capacity Act
The Mental Capacity Act 2005 provides a statutory framework to empower and protect vulnerable people who are not able to make their own decisions. The Act makes it clear who can take decisions, in which situations, and how they should go about this. It enables people to plan ahead for a time when they may lose capacity.
When the Mental Capacity Act 2005 came into force on 1 October 2007, the role and function of the Court of Protection (CoP) changed, and in addition, the Office of the Public Guardian (OPG) was established. The OPG, an executive agency of the Ministry of Justice, supports the Public Guardian in registering Enduring Powers of Attorney (EPA), Lasting Powers of Attorney (LPA) and supervising Court of Protection appointed Deputies.
For more information on the roles of these specialised courts please see A Guide to Family Court Statistics that is published alongside this publication.
Court of Protection
In 2016, there were 29,711 applications made under the Mental Capacity Act 2005, up 11% on 2015 and continuing the long term upward trend. The majority of these (54%) related to applications for appointment of a property and affairs deputy (Table 19).
Following the introduction of new forms in July 2015, applicants must make separate applications for ‘property and affairs’ and ‘personal welfare’. This is why there were almost no ‘hybrid deputy’ applications in 2016, and explains the increase in the number of applications for appointment of a personal welfare deputy, which more than doubled between 2015 and 2016 (from 446 to 1,014).
There were 26,494 orders made under the MCA in 2016, which in contrast to the number of applications was a drop of 10% from 2015. Half of the orders in 2016 related to the appointment of a deputy for property and affairs (Table 20).
Family Court Statistics Quarterly: Annual 2016 including October to December 2016
25
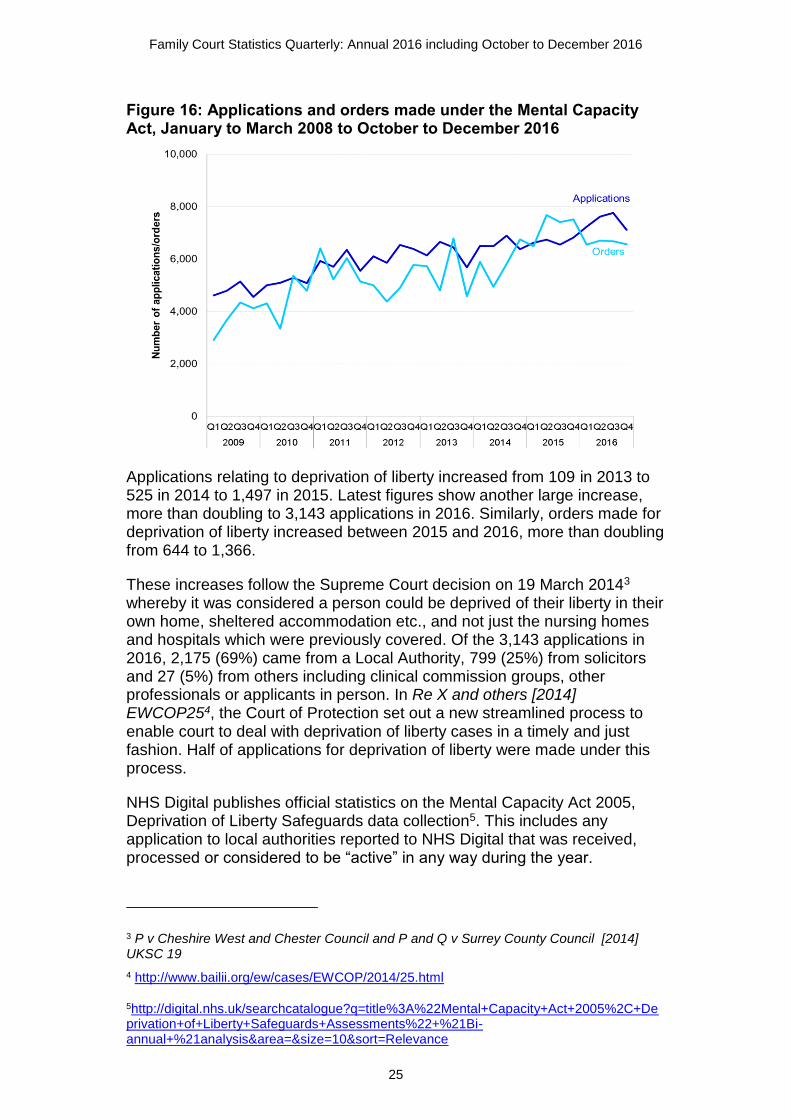
Figure 16: Applications and orders made under the Mental Capacity Act, January to March 2008 to October to December 2016
Applications relating to deprivation of liberty increased from 109 in 2013 to 525 in 2014 to 1,497 in 2015. Latest figures show another large increase, more than doubling to 3,143 applications in 2016. Similarly, orders made for deprivation of liberty increased between 2015 and 2016, more than doubling from 644 to 1,366.
These increases follow the Supreme Court decision on 19 March 20143 whereby it was considered a person could be deprived of their liberty in their own home, sheltered accommodation etc., and not just the nursing homes and hospitals which were previously covered. Of the 3,143 applications in 2016, 2,175 (69%) came from a Local Authority, 799 (25%) from solicitors and 27 (5%) from others including clinical commission groups, other professionals or applicants in person. In Re X and others [2014] EWCOP254, the Court of Protection set out a new streamlined process to enable court to deal with deprivation of liberty cases in a timely and just fashion. Half of applications for deprivation of liberty were made under this process.
NHS Digital publishes official statistics on the Mental Capacity Act 2005, Deprivation of Liberty Safeguards data collection5. This includes any application to local authorities reported to NHS Digital that was received, processed or considered to be “active” in any way during the year.
3 P v Cheshire West and Chester Council and P and Q v Surrey County Council [2014] UKSC 19
4 http://www.bailii.org/ew/cases/EWCOP/2014/25.html
5http://digital.nhs.uk/searchcatalogue?q=title%3A%22Mental+Capacity+Act+2005%2C+Deprivation+of+Liberty+Safeguards+Assessments%22+%21Bi-annual+%21analysis&area=&size=10&sort=Relevance
Family Court Statistics Quarterly: Annual 2016 including October to December 2016
26
Office of the Public Guardian
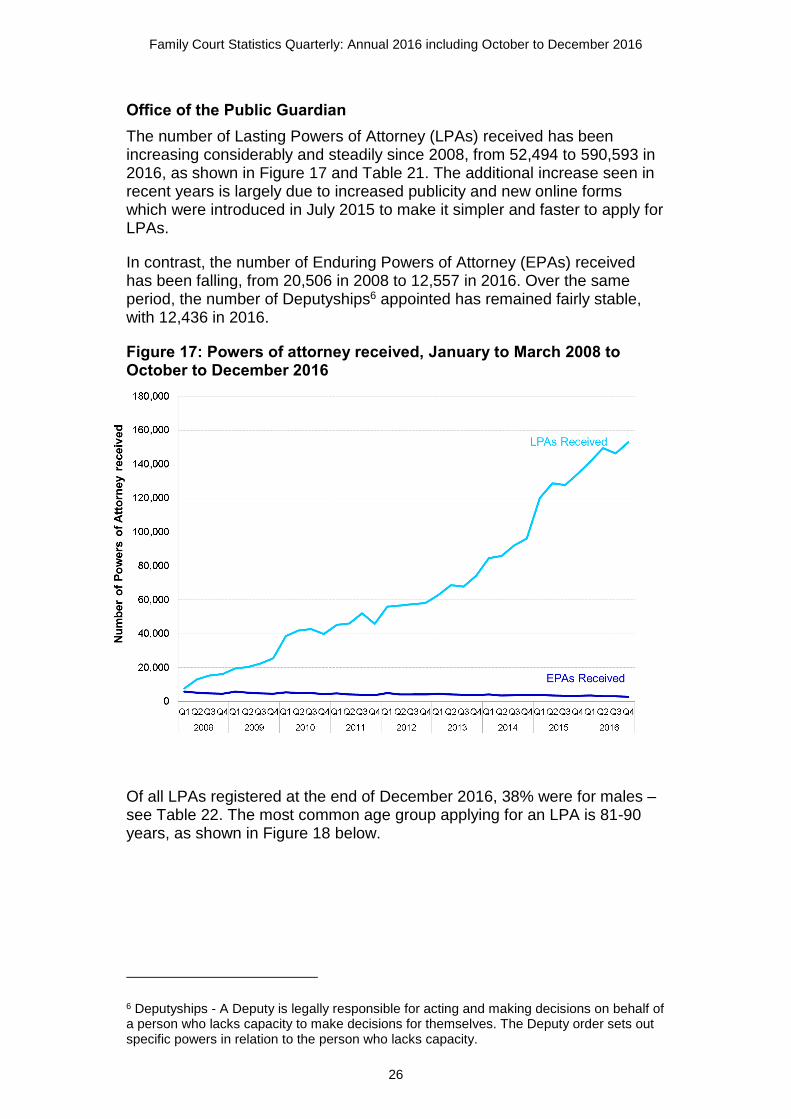
The number of Lasting Powers of Attorney (LPAs) received has been increasing considerably and steadily since 2008, from 52,494 to 590,593 in 2016, as shown in Figure 17 and Table 21. The additional increase seen in recent years is largely due to increased publicity and new online forms which were introduced in July 2015 to make it simpler and faster to apply for LPAs.
In contrast, the number of Enduring Powers of Attorney (EPAs) received has been falling, from 20,506 in 2008 to 12,557 in 2016. Over the same period, the number of Deputyships6 appointed has remained fairly stable, with 12,436 in 2016.
Figure 17: Powers of attorney received, January to March 2008 to October to December 2016
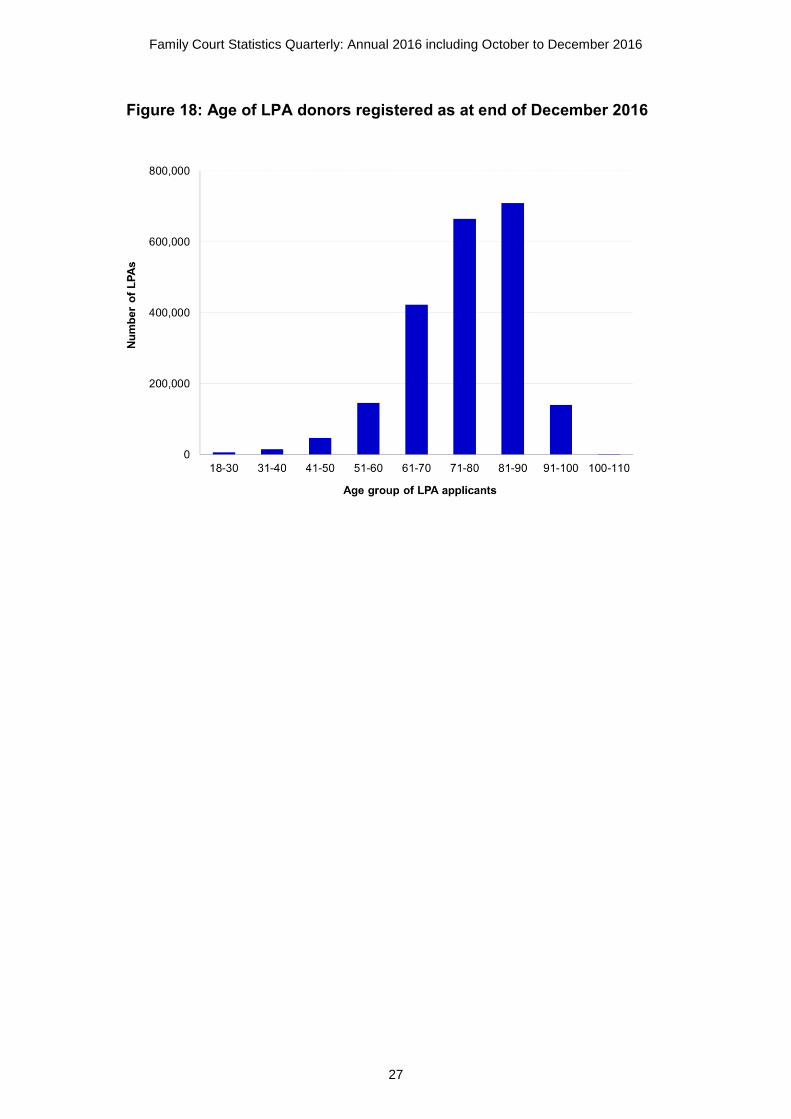
Of all LPAs registered at the end of December 2016, 38% were for males – see Table 22. The most common age group applying for an LPA is 81-90 years, as shown in Figure 18 below.
6 Deputyships - A Deputy is legally responsible for acting and making decisions on behalf of a person who lacks capacity to make decisions for themselves. The Deputy order sets out specific powers in relation to the person who lacks capacity.
Family Court Statistics Quarterly: Annual 2016 including October to December 2016
27
Figure 18: Age of LPA donors registered as at end of December 2016
Family Court Statistics Quarterly: Annual 2016 including October to December 2016
28
Section 11 – The Probate Service
When a person dies, somebody has to deal with their estate (money, property and possessions) by collecting it together, paying any debts and distributing the remainder to those who are entitled to receive it. The Probate Service gives a person or persons the authority to do this by issuing a document called a Grant of Representation7.
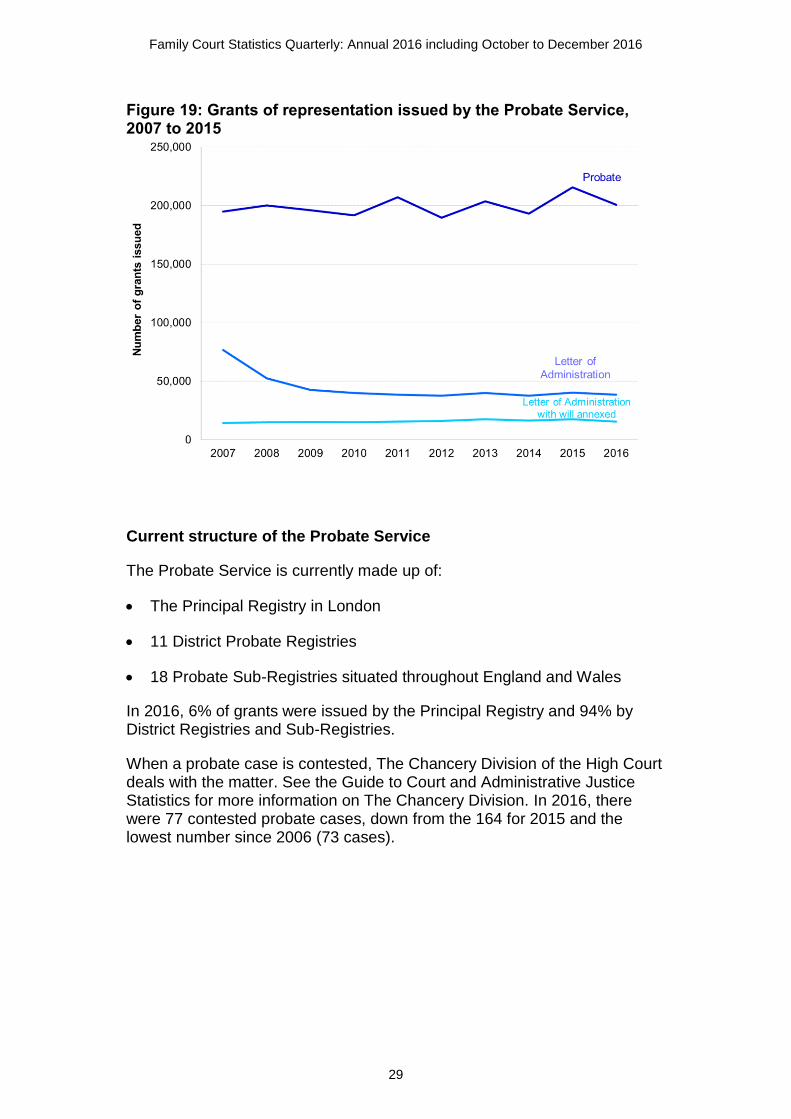
In 2016, 254,738 grants of representation were issued (Table 24). Grants of representation are known as either:
Probate (when the deceased person left a valid will and an executor is acting). These made up 79% of grants in 2016.
Letters of administration with will (when a person has left a valid will but no executor is acting). These made up 6% of grants in 2016.
Letters of administration (usually when there is no valid will). These made up 15% of grants in 2016.
These different types of grants of representation appoint people known as personal representatives to administer the deceased person’s estate.
Over a quarter of a million grants of representation were issued in 2016, down 7% on the previous year (Table 24). As Figure 19 shows, this was primarily driven by a fall in the number of probate grants, which account for more than three-quarters of grants made.
Overall for 2016, 63% of the applications were made by solicitors and 37% were personal applications.
7 http://www.justice.gov.uk/courts/probate/gor
Family Court Statistics Quarterly: Annual 2016 including October to December 2016
29
Figure 19: Grants of representation issued by the Probate Service, 2007 to 2015
Current structure of the Probate Service
The Probate Service is currently made up of:
The Principal Registry in London
11 District Probate Registries
18 Probate Sub-Registries situated throughout England and Wales
In 2016, 6% of grants were issued by the Principal Registry and 94% by District Registries and Sub-Registries.
When a probate case is contested, The Chancery Division of the High Court deals with the matter. See the Guide to Court and Administrative Justice Statistics for more information on The Chancery Division. In 2016, there were 77 contested probate cases, down from the 164 for 2015 and the lowest number since 2006 (73 cases).
Family Court Statistics Quarterly: Annual 2016 including October to December 2016
30
Contacts
Press enquiries on the contents of this bulletin should be directed to the MoJ or HMCTS press offices:
Sebastian Walters Tel: 020 3334 3529 Email: [email protected]
Camilla Marshall Tel: 0203 334 3531 Email: [email protected]
Other enquiries about these statistics should be directed to the Justice Statistics Analytical Services division of the MoJ:
Bridgette Miles Ministry of Justice 102 Petty France London SW1H 9AJ Tel: 07809 405481 Email: [email protected]
General enquiries about the statistics work of the MoJ can be emailed to [email protected]
General information about the official statistics system of the UK is available from http://statisticsauthority.gov.uk/about-the-authority/uk-statistical-system
© Crown copyright Produced by the Ministry of Justice
Alternative formats are available on request from [email protected]