Embed Size (px)
Citation preview
Family Business or Social Problem?
The Cost of Unreported Domestic Violence
Scott E. Carrell*
UC Davis and NBER Mark Hoekstra*
Texas A&M University and NBER
August 3, 2011
Abstract
Social interest in problems such as domestic violence is typically motivated by concerns regarding equity, rather than efficiency. However, we document that taking steps to reduce domestic violence by reporting it yields substantial benefits to external parties. Specifically, we find that while children exposed to as-yet-unreported domestic violence reduce the achievement of their classroom peers, these costs disappear completely once the parent reports the violence to the court. This suggests the public has an interest in helping families overcome their problems in general, and to report domestic violence in particular. It also suggests that social and judicial interventions may help combat negative peer effects in schools.
JEL Codes: J12 (Domestic Abuse), D62 (Externalities), I21 (Analysis of Education)
Keywords: Peer Effects, Externalities, Domestic Violence, Education
_________________
*Scott E. Carrell: UC Davis, Department of Economics, One Shields Ave., Davis, CA 95616 (email: [email protected]). Mark Hoekstra: Texas A&M University, College Station, TX 77843 (email: [email protected]). We would like to thank Kasey Buckles, Susan Carrell, Joe Cummins, Hilary Hoynes, Christopher Knittel, Doug Miller, and seminar participants at the University of California-Santa Barbara and University of Kentucky for their helpful comments and suggestions.
This project was supported with a grant from the University of Kentucky Center for Poverty Research Center (UKCPRC) through the U.S. Department of Health and Human Services, Office of the Assistant Secretary for planning and evaluation, grant no. 2U01 PE000002-07. The opinions and conclusions expressed herein are solely those of the authors and should not be construed as representing the opinions or policy of the UKCPRC or any agency of the Federal government.
1
1. Introduction
Domestic violence is a significant problem facing families in the United States. A study by
the US Department of Justice found that 1.3 million women are physically assaulted by an
intimate partner annually in the United States, and 22 percent of women have been physically
assaulted by an intimate partner in the past (Tjaden and Thoennes, 2000). Exposure to domestic
violence imposes significant costs on both the victimized adult and her children. Adult women
abused by their partners incur $4.1 billion per year in direct costs for medical and mental health
services, in addition to lost productivity and psychological costs (CDC, 2003). Children exposed
to domestic violence experience a number of social and emotional problems such as aggressive
behavior, depression, anxiety, decreased social competence, and diminished academic
performance (Edleson, 1999; Wolfe, Crooks, Lee, McIntyre-Smith, and Jaffe, 2003; Fantuzzo &
Mohr, 1999; Koenen, Moffitt, Caspi, Taylor, and Purcell, 2003).
Perhaps the most obvious policy intervention to help the victimized families is to
encourage victims to report the violence and enlist the help of the judicial and/or social systems.
This is potentially very important, as it enables the victim to get protection enforced by the
police, as well as access other support such as women’s shelters, etc. In addition, children
exposed to domestic violence may also benefit from reporting: school counselors with whom we
have spoken say that they often first learn that a child was exposed to domestic violence once it
was reported, which helps them better address the student’s needs.
In fact, encouraging reporting is a major goal of current policy; the Federal Government
encourages reporting domestic violence as a step toward resolving the problems in the home
(USDA, 2009), and established a website and telephone hotline that offers counseling and
2
referrals to shelters, among other things.1 However, underreporting is still believed to be
widespread, with fear of retribution being the primary reason (Rodriguez, Bauer, McLoughlin,
and Grumbach, 1999). Consequently, there is considerable debate over other policy options such
as mandatory reporting by education and health professionals (e.g., Rodriguez, McLoughlin,
Nah, and Campbell, 2001).
Importantly, the motivation behind nearly all policy responses to domestic violence is to
provide justice for the victims of the violence. However, a broader policy question is whether
outside parties have an interest beyond altruism in helping families overcome domestic problems
in general, and violence in particular. In this study, we examine whether taking steps to reduce
domestic violence by reporting it to the court reduces the negative peer effects caused by
children exposed to family violence. Thus, we seek to provide for a more complete accounting
of the social costs of unreported domestic violence.
To do so, we exploit a unique dataset in which a panel of administrative school records
containing performance on annual math and reading standardized exams is linked to public
records on domestic violence. This enables us to examine how the parental reporting of
domestic violence affects classmates’ performance. These panel data also allow us to identify
peer effects from reported versus unreported domestic violence by exploiting the within-school
variation in exposure to children from violent homes. Following the methodology of Carrell and
Hoekstra (2009), we perform several robustness tests and falsification exercises to demonstrate
that the within-school variation in peer domestic violence is exogenous to own achievement and
uncorrelated with other individual and cohort characteristics.
1 See http://www.ndvh.org/.

3
Results indicate that the social costs of unreported domestic violence extend well beyond
the immediate family. Specifically, we show that while children exposed to as-yet-unreported
domestic violence significantly reduce the reading and math achievement of their peers in
school, these negative spillovers are virtually eliminated once the parent reports the domestic
violence to the court. Thus, our results suggest that reporting domestic violence is likely a
critical link to undoing the negative spillovers caused by children from troubled families.
Our findings have two important policy implications. While an increasing amount of
evidence has focused on credibly estimating peer effects in education (e.g., Lavy, Paserman, and
Schlosser, 2007; Carrell and Hoekstra, 2010), little is known regarding how to combat negative
peer effects caused by disruptive students.2 This is important for several reasons. First, research
suggests that the magnitude of negative classroom spillovers is large: estimates presented in this
paper indicate that adding two disruptive children to a classroom of twenty students causes the
same negative effect on classmates as being assigned to a teacher who is one standard deviation
below average quality. Second, survey evidence shows that classroom disruptions are correlated
with low teacher morale and turnover,3 which is an especially critical issue for urban schools
found to have greater difficulty in attracting and retaining quality teachers (Hanushek, Kain, and
Rivkin, 2004; Lankford, Loeb, and Wyckoff, 2002). Finally, a major criticism of education
policies such as tracking and school choice is that such policies may leave some disadvantaged
students even more exposed to disruptive students. While recent work on tracking has raised
doubt regarding this concern (e.g., Duflo, Dupas, and Kremer, 2008; Figlio and Page, 2002), the
2 An important exception is Aizer (2008), who shows that treating Attention Deficit Disorder improves peer test
scores.
3 For example, teachers in the 1999-2000 Schools and Staffing Survey who reported disruption as a problem in their
school are more than three times as likely to also say they “definitely plan to leave teaching as soon as I can.”
4
crux of our study is that solutions to these concerns need not be limited to the scope of education
policy. Instead, our results suggest that social and judicial policy may be effective at reducing
the negative spillovers caused by disruptive students.
Perhaps even more importantly, our results also suggest that the public has a compelling
interest in helping troubled families overcome domestic problems in general, and to report
domestic violence in particular. Our findings also help bolster the case of those who favor laws
mandating that health care or other professionals report evidence of domestic abuse.
2. Data
We use a confidential student-level dataset containing a panel of annual test scores
provided by the School Board of Alachua County (SBAC) in Florida. The data cover every 3rd
through 5th grader in the twenty-two elementary schools in the county from the 1995-1996
academic year through 2002-2003. Alachua County is a large school district containing nearly
30,000 students, making it the 192nd largest school district in the county in 1999-2000 among the
nearly 15,000 districts nationwide. The school system is also demographically diverse: 38
percent of students are black and 53 percent are eligible for free or reduced lunches.
The test score measure reflects the percentile ranking on the Iowa Test of Basic Skills and
Stanford 9 exams.4 Specifically, we use the average percentile ranking on the math and reading
sections of the test, though we note that separate results for reading and math are qualitatively
similar and are available in the web appendix Table A2. Over ninety percent of students took the
4 In the 1999-2000 school year, the district changed from the Iowa Test of Basic Skills to the Stanford 9 exam. Both
exams test reading and math skills and both report how the student ranks relative to students taking the same exam
nationwide.
5
test in a given year. Additional variables include student race, gender, subsidized lunch status,
neighborhood family income (from the Census using zip codes), school attended, and the number
of counselors at the school.5
These school data were then linked to public records on domestic violence. To do so, the
petitioner’s name and first three digits of the student’s residential address were matched to the
student address and parent name from the administrative school data. These civil cases are filed
when a parent (typically the mother) requests a temporary injunction for protection against
another member of the family (most often the father or boyfriend). The judge then decides
whether to issue a temporary 15-day injunction against the alleged perpetrator and schedules a
date at which time both parties appear in court. While there is significant judicial discretion in
how the case proceeds, it is worth noting that DeJong and Burgess-Proctor (2006) rate Florida in
the top 18 percent of states in terms of having victim-friendly personal protection order laws.
Table 1 shows summary statistics of the data. Just less than 5 percent of the children in
our sample had a parent who filed a domestic violence case at some point; 60 percent of those
students are observed after the domestic violence was reported while 40 percent lived in a
household that had not yet reported domestic violence when the student-level observation was
recorded.
5 While we also observe the number of disciplinary infractions committed by each student, for brevity these results
can be found in web appendix Table A2. Additionally, reporting of disciplinary infractions may be endogenous to
knowledge of domestic violence. That is, we are concerned that the threshold for reporting an infraction may be
affected by knowledge (i.e., reporting) of peer domestic violence in the classroom.
6
3. Identification Strategy and Methodology
In assessing whether parental reporting of domestic violence yields external benefits, we
extend the analysis of Carrell and Hoekstra (2010), who show significant negative peer effects
associated with children ever exposed to domestic violence. To do so, we must overcome the
difficulties with credibly estimating peer effects in general. The first identification challenge is
that because child and peer outcomes are determined simultaneously, a "reflection" problem
arises because it is difficult to distinguish the effect the child’s classmates have on her from the
effect she has on her classmates (Manski, 1993). We overcome reflection by using a measure of
peer quality—exposure to reported or as-yet-unreported domestic violence—that is unlikely to
be caused by a child’s peers.6
The second identification problem is self-selection, which is caused by students and their
families sorting themselves into neighborhoods and schools based on observed and unobserved
characteristics. Thus, it can be difficult to distinguish whether a child’s performance is due to
her peers or to the reasons that caused the individuals to join that group. While researchers
studying peer effects in higher education have exploited the randomization of peer groups,7 like
other papers using elementary school data, we utilize the natural population variation in cohort
composition within a given school by utilizing school and time fixed effects.8 Importantly, this
6 Other researchers have used different preexisting measures such as peer race and gender (Hoxby & Weingarth,
2006; Hoxby, 2000b; Lavy & Schlosser, 2007), peers who relocated from low socioeconomic regions (Angrist and
Lang, 2004; Imberman, Kugler, and Sacerdote, 2009), boy peers with feminine names (Figlio, 2007), and peers who
had previously been retained (Lavy, Paserman, and Schlosser, 2007).
7 For example, see Foster, 2006; Sacerdote, 2001; Zimmerman, 2003; Lyle, 2007; Stinebrickner & Stinebrickner,
2006; Kremer & Levy, 2008; Carrell, Fullerton, & West, 2009; Carrell, Malmstrom, & West (2008).
8 This approach was first used by Hoxby (2000a) to examine the impact of class size on achievement. It has
subsequently been used by several papers to examine peer effects, including Aizer (2008); Hoxby (2000b); Hoxby
7
approach overcomes bias that may arise due to nonrandom sorting into classrooms. This is
critical, as it implies any difference in the effect of peer reported versus unreported domestic
violence is not confounded by a systematic change in classroom assignments once the violence is
reported.
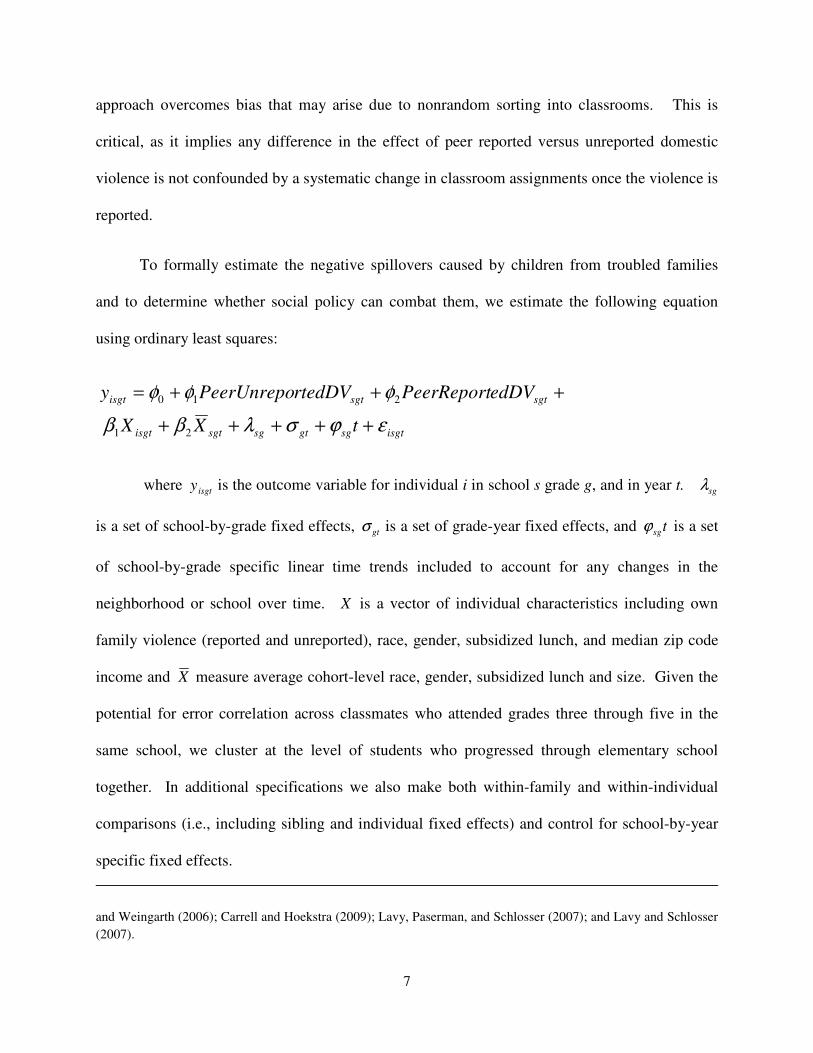
To formally estimate the negative spillovers caused by children from troubled families
and to determine whether social policy can combat them, we estimate the following equation
using ordinary least squares:
isgtsggtsgsgtisgt
sgtsgtisgt
tXX
edDVPeerReportrtedDVPeerUnrepoy
εϕσλββ
φφφ
+++++
+++=
21
210
where y isgt is the outcome variable for individual i in school s grade g, and in year t. λsg
is a set of school-by-grade fixed effects, σ gt is a set of grade-year fixed effects, and ϕ sgt is a set
of school-by-grade specific linear time trends included to account for any changes in the
neighborhood or school over time. X is a vector of individual characteristics including own
family violence (reported and unreported), race, gender, subsidized lunch, and median zip code
income and X measure average cohort-level race, gender, subsidized lunch and size. Given the
potential for error correlation across classmates who attended grades three through five in the
same school, we cluster at the level of students who progressed through elementary school
together. In additional specifications we also make both within-family and within-individual
comparisons (i.e., including sibling and individual fixed effects) and control for school-by-year
specific fixed effects.
and Weingarth (2006); Carrell and Hoekstra (2009); Lavy, Paserman, and Schlosser (2007); and Lavy and Schlosser
(2007).

8
The primary variables of interest are PeerReportedDV and PeerUnreportedDV, which
measure the proportion of a student’s peers in the same grade, school, and year whose parents
had and had not yet reported domestic violence, respectively. Our primary identification
assumption is that the within-school variation in peer domestic violence, and in particular the
timing of the reporting, is exogenous to own achievement. Results in Table A1 in the web
appendix provide evidence to support this assumption; peer domestic violence is uncorrelated
with own domestic violence, cohort size, race, gender, household income, attrition,9 and missing
test scores once we condition on school-grade fixed effects. These tests also indicate that there is
no evidence of selection into or out of cohorts with idiosyncratically high or low proportions of
children from troubled families. In addition, if reflection were present, one would expect to
observe a positive correlation between own domestic violence and peer domestic violence.
Results show this is not the case.10
In addition, while there is a general concern in the literature that peer effect estimates can
be biased by “common shocks” that arise when students and their peers are subjected to the same
influences (Lyle, 2007), there are several reasons to believe this is not a problem in our study.
First, since our study compares cohorts within the same school and grade, it is not obvious how
peer exposure to reported or unreported domestic violence could be correlated with, say, below-
9 In addition to testing for whether students subject to peer reported or unreported domestic violence are
differentially likely to leave the sample or not take the exam, we also test whether children from troubled families
are themselves any more or less likely to leave the sample once the violence is reported. We find there is only a
small and insignificant difference (0.6 percentage points) in the likelihood of leaving the sample after 3rd and 4th
grade for children with reported versus unreported domestic violence. The attrition rates of both groups are
significantly lower (2.3 and 2.9 percentage points) than those of students from more stable homes. Thus, our results
do not appear to be driven by systematic attrition of children exposed to domestic violence or by their peers.
10 To overcome the mechanical negative bias that arises in performing this test, we apply the technique proposed by
Guryan, Kroft, and Notowidigdo (2009) in which we additionally control for the proportion of peers exposed to
domestic violence at the school-grade level.

9
average teacher quality. In addition, we show the results are robust to school-by-year specific
fixed effects, which suggests that any confounding common shock must differentially affect the
cohort with the highest proportion of troubled children but not the children in the other grades in
that school in that year. Furthermore, in some specifications we also include school-by-grade
specific linear time trends to account for the fact that some schools and neighborhoods may be
worsening over time, affecting both domestic violence and achievement. Finally, we show that
the results are robust to within-family comparisons, which rules out the possibility that family-
specific common shocks correlated with peer domestic violence are biasing our results.
Finally, we also need to know that any differences in the peer effects of children exposed
to unreported and reported domestic violence are not due to compositional changes. For
example, one might worry that families who report domestic violence when the child is older are
different in unobserved ways than families who report the violence when the child is younger.
To test for this, we note that this type of selection story should cause smooth changes over time
in the size of the negative peer effect. In contrast, if the act of filing itself matters, one would
expect a sharp break in the estimated peer effect at the time of reporting. Consequently, we also
estimate a more flexible specification where we estimate separate peer variables for the years
leading up to, during, and after the reporting of the violence. By observing whether the peer
effect changes abruptly at the time of the reporting, we can distinguish the effect of reporting
from the effect of confounding factors such as compositional changes.
However, one might also be concerned that peer composition changes in a less gradual
way. For example, perhaps when a child’s parent reports domestic violence, the child is placed
in a different peer group. Thus, we test whether own exogenous characteristics are correlated
with either peer reported or peer unreported domestic violence. We also test whether selection
10
into or out of schools is correlated with peer reported and unreported domestic violence. Results
are in Table A1 in the Appendix. In short, we find no evidence that exposure to children with
reported or unreported domestic violence is correlated with own student and family
characteristics such as race, sex, family income, or own domestic violence status.
4. Results
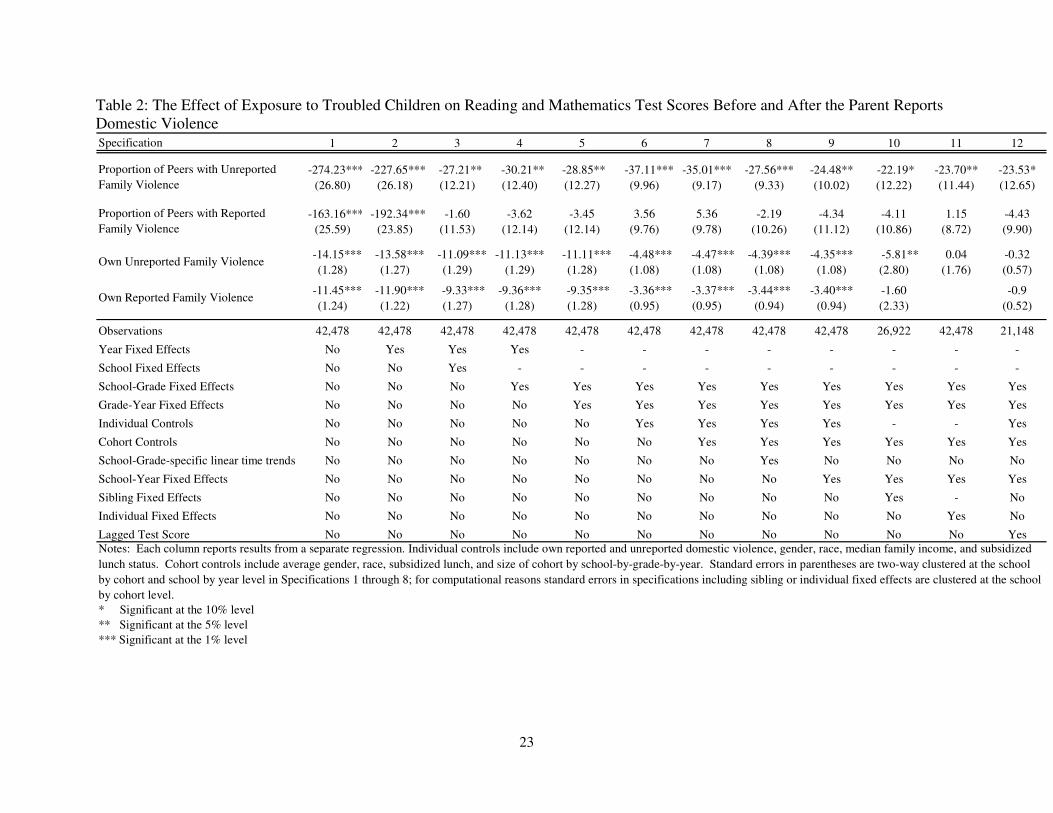
Estimates of the effects of peers exposed to reported and as-yet-unreported domestic
violence are shown in Table 2. Specifications 1 through 8 start with a simple regression and
progressively add controls as shown in equation (1). We posit that if the within-school variation
in peer domestic violence over time is exogenous to own achievement, then the magnitude of the
estimated peer effects should remain unchanged as we progressively add more covariates that are
known to impact own achievement. In contrast, if adding individual and cohort-level controls or
grade-year fixed effects affects the peer coefficient after including school fixed effects, then one
might be concerned that our identification strategy does not fully overcome the problems of self-
selection and/or common shocks.11
Specification 1 shows results from regressing math and reading test score on only the
own and peer domestic violence variables, while Specification 2 additionally controls for year
fixed effects. While both specifications indicate that unreported and reported peer domestic
violence are associated with a very large decrease in student test scores, the coefficients are
reduced substantially once we control for school fixed effects in Specification 3. This
demonstrates the extent of the selection problem; on average, lower-achieving students select
11 See Carrell & Hoekstra (2009) for an in-depth discussion of selection and common shocks when estimating peer
effects.
11
into schools with higher proportions of peers exposed to reported and unreported domestic
violence.
Importantly, the effects remain quite stable as school-grade fixed effects, grade-year
fixed effects, individual controls, cohort controls, and school-grade specific linear time trends are
added to the model in Specifications 4 through 8. This provides evidence that the within-school
variation in exposure to peers from troubled families is exogenous to own achievement and
implies that the resulting estimates are causal rather than being driven by selection or common
shocks.
Across Specifications 3 through 8 that utilize within-school population variation, the
pattern is striking: while exposure to children from families with as-yet-unreported domestic
violence reduces achievement significantly, the negative peer effect disappears once the parent
reports the domestic violence. Our estimated effects from our preferred Specification 8 imply
that adding one child whose parent has not yet reported the domestic violence to a class of
twenty causes peer achievement to fall by a statistically significant 1.4 percentile points (-
27.56*0.05).12,13 In contrast, we find virtually no evidence of negative spillovers from children
from families who previously reported the domestic violence and can reject the null hypothesis
that the effects of peers with reported and unreported domestic violence are equal at the 5 percent
level.
12 This is approximately one-twentieth of a standard deviation. This effect is relatively large; estimates from the
teacher quality literature imply that a one-standard deviation increase in teacher quality causes one-tenth of a
standard deviation increase in achievement (Kane, Rockoff, and Staiger 2008; Kane and Staiger, 2009; Rivkin,
Hanushek, and Kain, 2005).
13 This effect is twice as large as the 0.7 percentile point decline caused by adding a peer who was ever exposed to
domestic violence, as reported in Carrell and Hoekstra (2009).
12
In Specifications 9 through 11, we examine the robustness of this result by progressively
including school-year fixed effects, sibling fixed effects, and individual fixed effects. While
these specifications substantially reduce the within-school variation in peer domestic violence
over time, they also provide rigorous tests of whether the spillovers from domestic violence end
once the violence is reported.
Results shown in Specification 9 that control for school-year fixed effects indicate that
our results are not driven by school-by-year specific common shocks, such as changes in the
administration. In Specification 10, including a family fixed effect reduces the estimated effect
of peer as-yet-reported violence only slightly14, while there remains no effect of exposure to
children from families that reported domestic violence in the past. The robustness of the result to
the inclusion of family fixed effects indicates that the results are not being driven by either the
selection of certain families into cohorts with idiosyncratically high proportions of domestic
violence or by shocks common to a family.
We next examine whether the change in the peer effect is driven by differences in the
types of students exposed to children from families with unreported versus reported violence
rather than by the judicial intervention. To do so, in Specification 11 we control for individual
fixed effects. Consequently, this estimate is identified primarily by comparing how children
perform before and after their peers’ parent report the domestic violence. Results show that
while children from families with unreported domestic violence cause a statistically significant
1.2 percentile point decline in peer achievement, children from families where the domestic
14 This result is consistent with the likelihood that within-family spillovers may be biased toward zero. That is, one
child’s exposure to disruptive peers at school may well spill over to the child’s siblings through their interactions at
home, biasing the within-family estimates toward zero.
13
violence was previously reported cause no such decline. Since these effects are identified using
only within-student exposure to troubled peers, it rules out the possibility that our results are
driven by different types of children being exposed to peers from families with reported
violence.
Finally, in Specification 12, we show results from a value-added model, in which we
control for lagged test score. Results are consistent with the other results: adding one student
with unreported domestic violence reduces scores by 1.2 percentile points, while adding a
student with reported domestic violence has no effect on peer achievement.
5. The Timing of Reporting and Further Sensitivity Analysis
While the results of Table 2 are robust to individual and family fixed effects, there may be
additional concerns regarding identification of the effect of reporting on peer achievement. For
example, one might be concerned that parental reporting of domestic violence may encourage
other parents to also report domestic violence within the home. While this type of scenario
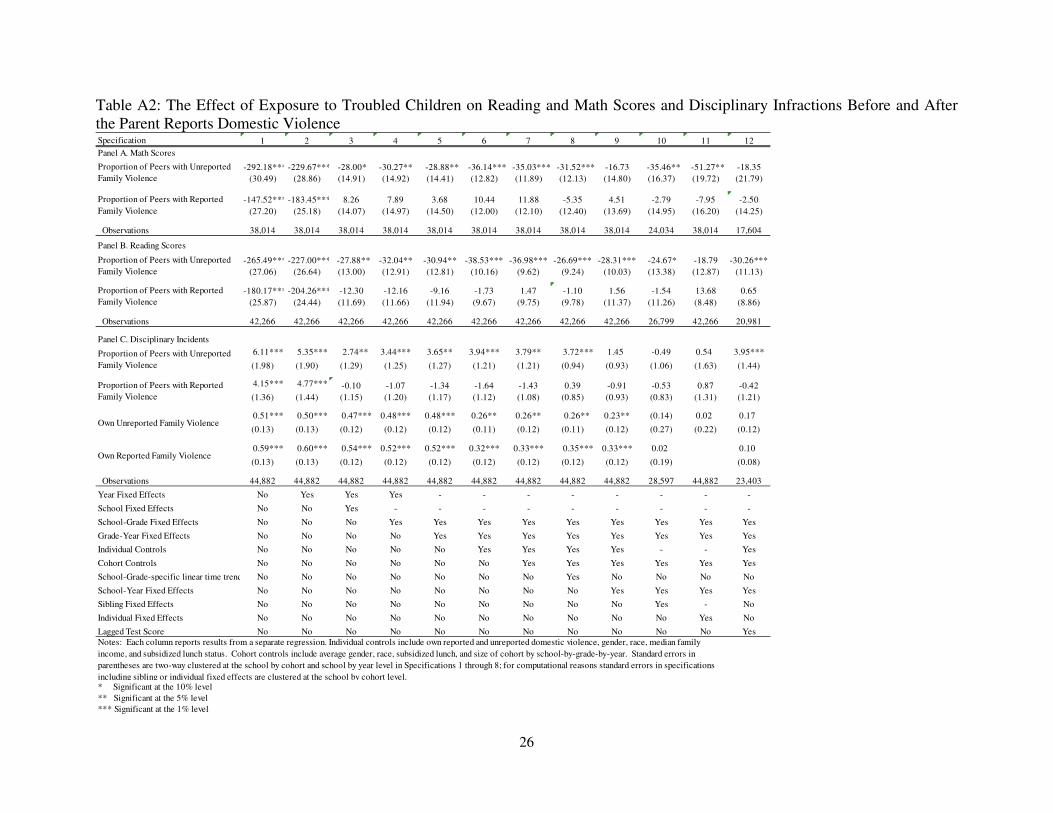
seems unlikely ex ante, we also note that it is inconsistent with our empirical findings. First, in
results available in the web appendix (Table A1, Specification 3) we find that own domestic
violence is uncorrelated with peer domestic violence. That is, there is no evidence of spillovers
in reporting. Second, in results available in Table A3, we find that the largest negative peer
effects are incurred by children from families who are not eligible for subsidized lunches.15
However, of the children linked to domestic violence in our sample, only 15 percent are from
15 Specifically, in the result corresponding to specification 8 from Table 2, we find that the effect of adding one child
with unreported domestic violence to a classroom of 20 reduces test scores by 1.89 points for higher-income
families and 1.61 points for lower-income families

14
these higher-income families. Thus, it is unlikely that spillovers in reporting of domestic
violence is the mechanism through which reporting domestic violence affects a child’s peers.
One might also worry that students in later grades—who are more likely to have had a
parent report domestic violence—may be less affected by disruptive peers than peers in earlier
grades. In that case, we could be confounding a heterogeneous treatment effect with a reporting
effect. Again, however, in results available in Table A3 of the web appendix, we find that if
anything, 5th-graders incur the largest negative peer effects.16
Perhaps the most serious remaining concern regarding identification is whether the time
at which the mother reports the domestic violence is correlated with other determinants of her
child's behavior. For example, if families that wait until their children are older before reporting
domestic violence have the most disruptive children for other unobserved reasons, then we may
mistakenly be attributing the reduction in the peer effect to reporting. To investigate this issue
directly, we estimate a more flexible form of equation (1) in which we include a larger set of
peer variables that allows the peer effect to vary across the years before and after the domestic
violence is reported. If heterogeneous treatment effects or selection is responsible for the
change, we would expect the change in the peer effect to be gradual. In contrast, if reporting
itself matters for the peer effect, we would expect an abrupt change in the peer effect.
Results are shown in Table 3. Estimates indicate that even four years before the parent
reported domestic violence, there is evidence that her child causes negative spillovers. This
negative effect is largest and most precisely estimated in the year in which the restraining order
16 Specifically, in the result corresponding to specification 8 from Table 2, we find that the effect of adding one child
with unreported domestic violence to a classroom of 20 reduces test scores for 3rd, 4th, and 5th graders by at
statistically significant 1.5, 1.6, and 2.3 points, respectively.
15
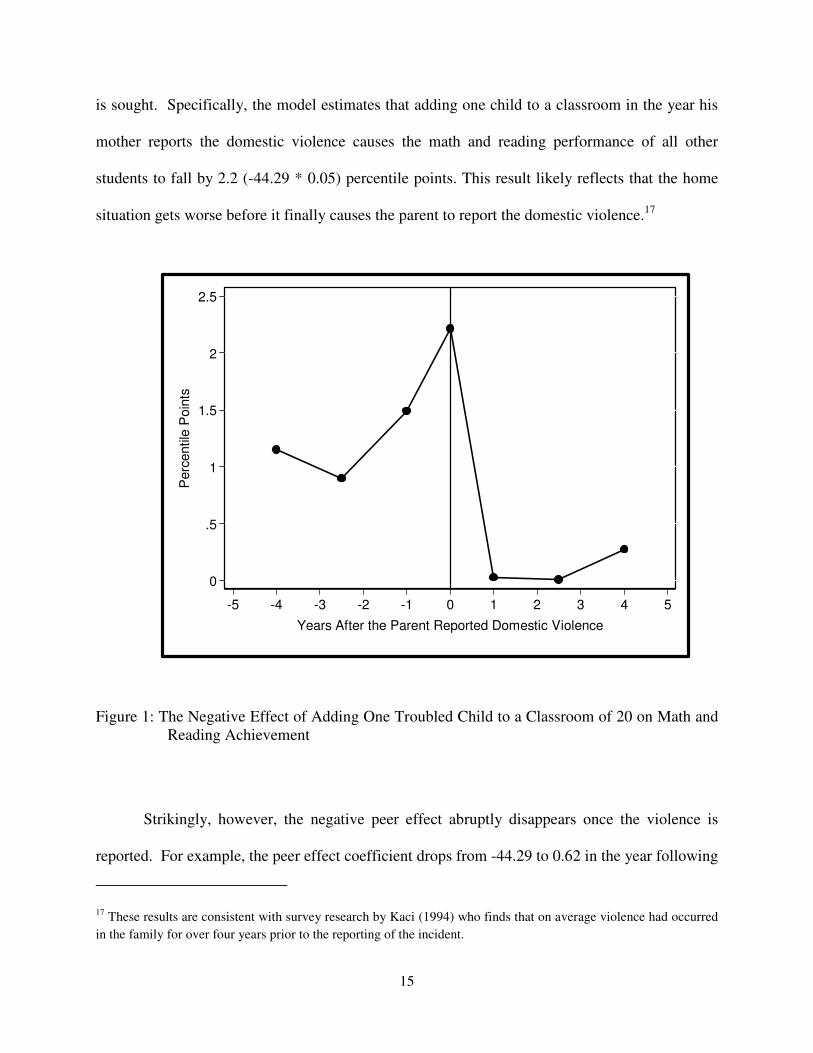
is sought. Specifically, the model estimates that adding one child to a classroom in the year his
mother reports the domestic violence causes the math and reading performance of all other
students to fall by 2.2 (-44.29 * 0.05) percentile points. This result likely reflects that the home
situation gets worse before it finally causes the parent to report the domestic violence.17
0
.5
1
1.5
2
2.5
Perc
entile
Poin
ts
-5 -4 -3 -2 -1 0 1 2 3 4 5
Years After the Parent Reported Domestic Violence
Figure 1: The Negative Effect of Adding One Troubled Child to a Classroom of 20 on Math and Reading Achievement
Strikingly, however, the negative peer effect abruptly disappears once the violence is
reported. For example, the peer effect coefficient drops from -44.29 to 0.62 in the year following
17 These results are consistent with survey research by Kaci (1994) who finds that on average violence had occurred
in the family for over four years prior to the reporting of the incident.
16
the reporting and then remains near zero (0.21 and -5.54) in subsequent years. The full pattern is
shown graphically in Figure 1 below, which illustrates how the effect of adding one child from a
domestic violence family to a classroom of twenty drops off dramatically once the parent reports
the domestic violence.
6. Discussion
There are multiple explanations for why filing could cause the negative peer effect to
disappear so abruptly. Perhaps the simplest and most plausible explanation is that by reporting
the domestic violence, the parent takes the first step in resolving the problems in the home. This
interpretation is supported by Kaci (1994), who reports that 87 percent of surveyed respondents
indicated that reporting domestic violence “helped stop physical abuse.” Moreover, the pattern
of estimates in Table 3 and Figure 1 is consistent with the problem getting worse within the
family over time before improving substantially once the domestic violence is reported.
Similarly, it could also be that the parent who reports the abuse simultaneously takes
other steps that could themselves be responsible for the reduction of the negative peer effect.
Indeed, it is possible that other actions, such as ending the relationship or moving out of the
household, would have successfully attenuated the negative peer effect even without the help of
the legal system. While this seems inconsistent with the findings of Kaci (1994), we cannot rule
out this possibility completely. However, we note that the policy implications are quite similar:
in either case, there is a substantial social benefit to encouraging victims of domestic violence to
take steps to reduce the violence.
On the other hand, we note that while reporting the domestic violence appears to improve
own performance by one percentile point (see Table 2), this difference is not statistically
17
significant. Similarly, in results available in the web appendix, we find little evidence that
reporting the domestic violence causes students from those households to commit fewer
disciplinary infractions.18 This is not what one might expect if reporting improved the family
situation. However, this result could be due to path dependence; students may have difficulty
catching up if they missed crucial lessons earlier, even if the family problems have since been
resolved.
Alternatively, it could be that the judicial system triggers other interventions that help
mitigate the negative spillovers caused by children from troubled homes. For example, upon
seeking an injunction from the court to stop domestic violence, the school is often notified of the
temporary restraining order. It may be that the knowledge of family problems at home better
enables the school staff to remedy disruptions caused by children exposed to the violence. The
school could also allocate existing resources toward the affected children upon learning of the
family problems. While one might expect either of these things to improve the achievement of
the children from the troubled family, the lack of a statistically significant change in the effect of
reporting on own test scores in Table 2 need not be at odds with this interpretation. In addition
to the potential for path dependence mentioned earlier, it could also be because according to the
counselors with whom we spoke, the primary emphasis of counseling for these students is to
improve their emotional well-being, not their performance in school. Thus, this type of
intervention could well reduce classroom disruption without directly improving the child’s math
and reading scores.
18 This result appears to contrast somewhat with the findings of Currie and Tekin (2006), who find that child abuse
increases crime later on. We emphasize, however, that the majority of violence in our study may well be directed at
other family members, such as the mother, and thus is not necessarily inconsistent with this result.

18
7. Conclusions
This paper examines whether the social benefits to reporting domestic violence extend
beyond the family. We do so by investigating whether reporting the violence to the court lessens
negative peer effects caused by children exposed to as-yet-unreported domestic violence. Our
findings show this is indeed the case: the negative peer effect drops significantly from 2.2
percentile points to zero in the year after the parent reports the domestic violence. Furthermore,
this pattern is robust to school by grade specific linear time trends, grade by year specific shocks,
controls for both individual and cohort characteristics, school by grade specific shocks, family
fixed effects, and individual fixed effects.
Our findings have important policy implications. While the primary motivation for
combating domestic violence has been the welfare of the direct victims, evidence here suggests
that the social benefits are larger than that. By encouraging battered women to take steps to
reduce domestic violence, benefits accrue to children outside the home through classroom
interactions.
19
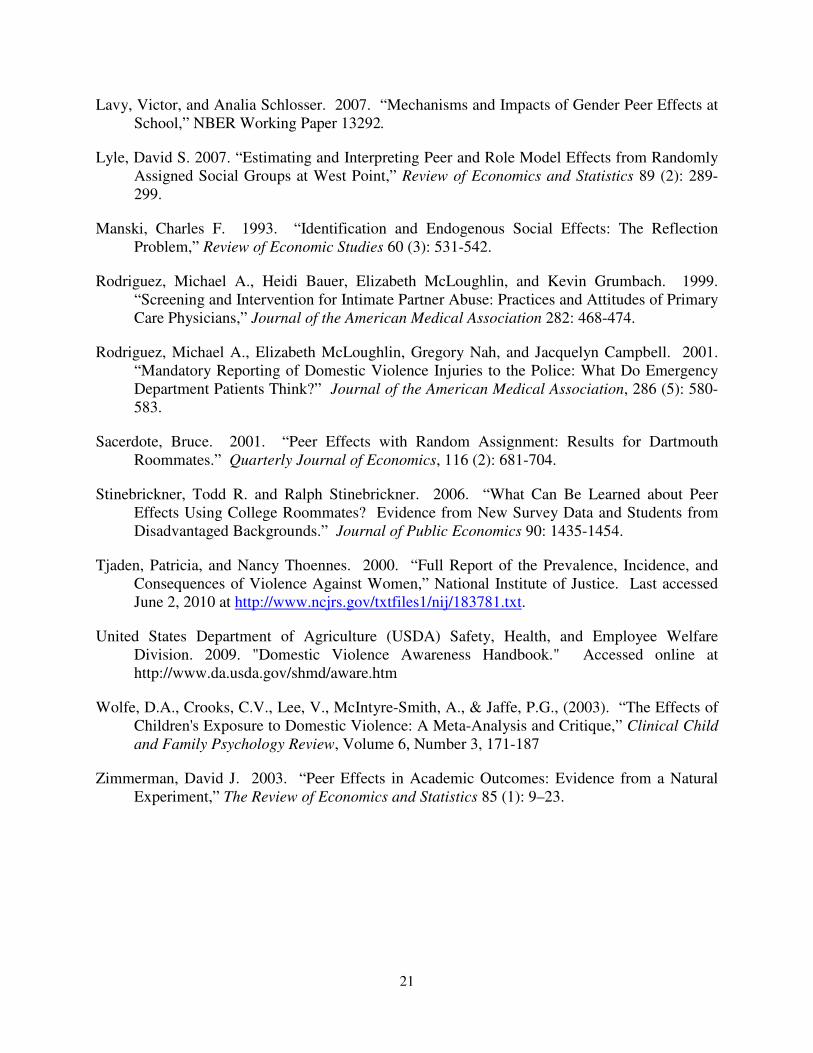
References
Aizer, Anna. 2008. "Peer Effects and Human Capital Accumulation: the Externalities of ADD," NBER Working Paper 14354.
Angrist, Joshua D. & Kevin Lang. 2004. “Does School Integration Generate Peer Effects? Evidence from Boston's Metco Program,” The American Economic Review 94 (5): 1613-1634.
Carrell, Scott E., and Mark Hoekstra. 2009. “Externalities in the Classroom: How Children Exposed to Domestic Violence Affect Everyone’s Kids.” American Economic Journal:
Applied Economics 2 (1): 211-228.
Carrell, Scott E., Richard L. Fullerton, and James E. West. 2009. Does Your Cohort Matter? Measuring Peer Effects in College Achievement. Journal of Labor Economics, Volume 27, Number 3.
Carrell, Scott E., Frederick V. Malmstrom, and James E. West. 2008. “Peer Effects in Academic Cheating,” Journal of Human Resources 43 (1): 173-207.
Center for Disease Control and Prevention (CDC). 2003. “Costs of Intimate Partner Violence Against Women in the United States.” Last accessed on June 3, 2010 at http://www.cdc.gov/violenceprevention/pdf/IPVBook-a.pdf.
Currie, Janet, and Erdal Tekin. 2006. “Does Child Abuse Cause Crime?” NBER Working Paper No. 12171.
DeJong, Christina, and Amanda Burgess-Proctor. 2006. “A Summary of Personal Proection Order Statutes in the United States.” Violence Against Women, 12: 68-88.
Duflo, Esther, Pascaline Dupas, and Michael Kremer. 2008. “Peer Effects, Teacher Incentives, and the Impact of Tracking: Evidence from a Randomized Evaluation in Kenya.” NBER Working Paper No. 14475.
Edleson, J.L. 1999. “Children's Witnessing of Adult Domestic Violence,” Journal of
Interpersonal Violence, 14 (8): 839-870.
Fantuzzo, J.W., Boruch, R., Beriama, A., Atkins, M., and Marcus, S., 1997. “Domestic Violence and Children: Prevalence and Risk in Five Major U.S. Cities,” Journal of the American
Academy of Child & Adolescent Psychiatry, 36 (1): 116-122.
Figlio, David N. 2007. “Boys Named Sue: Disruptive Children and Their Peers,” Education
Finance and Policy 2 (4): 376-394.
Figlio, David N., and Marianne Page. 2002. “School Choice and the Distributional Effects of Ability Tracking: Does Separation Increase Inequality?” Journal of Urban Economics 51: 497-514.

20
Foster, Gigi, (2006). “It’s Not Your Peers, and It’s Not Your Friends: Some Progress Toward Understanding Educational Peer Effects,” Journal of Public Economics 90 (8-9): 1455-1475.
Guryan, Jonathan, Kory Kroft, and Matt Notowidigdo. 2009. “Peer Effects in the Workplace: Evidence from Random Groupings in Professional Golf Tournaments,” American
Economic Journal: Applied Economics 1 (4): 34-68.
Hanushek, Eric A, John F. Kain and Steven G. Rivkin. 2004. “Why Public Schools Lose Teachers,” Journal of Human Resources 39 (2): 326-354.
Hoxby, Caroline M. 2000a. “The Effects of Class Size on Student Achievement: New Evidence From Population Variation,” Quarterly Journal of Economics 15 (4): 1239-1285.
Hoxby, Caroline M. 2000b. “Peer Effects in the Classroom: Learning from Gender and Race Variation,” NBER Working Paper 7867.
Hoxby, Caroline M. and Weingarth, Gretchen. 2006. “Taking Race Out of the Equation: School Reassignment and the Structure of Peer Effects.” Working Paper.
Imberman, Scott, Adriana D. Kugler, and Bruce Sacerdote. 2009. “Katrina’s Children: Evidence on the Structure of Peer Effects from Hurricane Evacuees,” NBER Working Paper 15291.
Kane, Thomas J., Jonah E. Rockoff, and Douglas O. Staiger. 2008. “What does certification tell us about teacher effectiveness? Evidence from New York City.” Economics of Education
Review 27 (6):615 631.
Kane, Thomas J. and Douglas O. Staiger. 2008. “Estimating Teacher Impacts on Student Achievement: An Experimental Evaluation.” Working Paper 14607, National Bureau of Economic Re- search. URL http://www.nber.org/papers/w14607.
Kaci, Judy Hails. 1994. “Aftermath of Seeking Domestic Violence Protective Orders: The Victim’s Perspective,” Journal of Contemporary Criminal Justice 10 (3): 204-219.
Koenen, K.C., Moffitt, T.E., Caspi, A., Taylor, A., and Purcell, S. 2003. “Domestic violence is associated with environmental suppression of IQ in young children,” Development and
Psychopathology 15: 297-311
Kremer, Michael, and Dan Levy. 2008. “Peer Effects and Alcohol Use Among College Students,” Journal of Economic Perspectives, Vol 23, Issue 3, Summer 2008, 189-206.
Lankford, Hamilton, Susanna Loeb, and James Wyckoff. 2002. “Teacher Sorting and the Plight of Urban Schools,” Education Evaluation and Policy Analysis 24 (1): 37-62.
Lavy, Victor, M. Daniele Paserman, and Analia Schlosser. 2007. “Inside the Black of Box of Ability Peer Effects: Evidence from Variation in High and Low Achievers in the Classroom,” Working Paper.
21
Lavy, Victor, and Analia Schlosser. 2007. “Mechanisms and Impacts of Gender Peer Effects at School,” NBER Working Paper 13292.
Lyle, David S. 2007. “Estimating and Interpreting Peer and Role Model Effects from Randomly Assigned Social Groups at West Point,” Review of Economics and Statistics 89 (2): 289-299.
Manski, Charles F. 1993. “Identification and Endogenous Social Effects: The Reflection Problem,” Review of Economic Studies 60 (3): 531-542.
Rodriguez, Michael A., Heidi Bauer, Elizabeth McLoughlin, and Kevin Grumbach. 1999. “Screening and Intervention for Intimate Partner Abuse: Practices and Attitudes of Primary Care Physicians,” Journal of the American Medical Association 282: 468-474.
Rodriguez, Michael A., Elizabeth McLoughlin, Gregory Nah, and Jacquelyn Campbell. 2001. “Mandatory Reporting of Domestic Violence Injuries to the Police: What Do Emergency Department Patients Think?” Journal of the American Medical Association, 286 (5): 580-583.
Sacerdote, Bruce. 2001. “Peer Effects with Random Assignment: Results for Dartmouth Roommates.” Quarterly Journal of Economics, 116 (2): 681-704.
Stinebrickner, Todd R. and Ralph Stinebrickner. 2006. “What Can Be Learned about Peer Effects Using College Roommates? Evidence from New Survey Data and Students from Disadvantaged Backgrounds.” Journal of Public Economics 90: 1435-1454.
Tjaden, Patricia, and Nancy Thoennes. 2000. “Full Report of the Prevalence, Incidence, and Consequences of Violence Against Women,” National Institute of Justice. Last accessed June 2, 2010 at http://www.ncjrs.gov/txtfiles1/nij/183781.txt.
United States Department of Agriculture (USDA) Safety, Health, and Employee Welfare Division. 2009. "Domestic Violence Awareness Handbook." Accessed online at http://www.da.usda.gov/shmd/aware.htm
Wolfe, D.A., Crooks, C.V., Lee, V., McIntyre-Smith, A., & Jaffe, P.G., (2003). “The Effects of Children's Exposure to Domestic Violence: A Meta-Analysis and Critique,” Clinical Child
and Family Psychology Review, Volume 6, Number 3, 171-187
Zimmerman, David J. 2003. “Peer Effects in Academic Outcomes: Evidence from a Natural Experiment,” The Review of Economics and Statistics 85 (1): 9–23.

22
Table 1: Summary Statistics
Variable Subgroup Obs Mean Std. Dev. Min Max
42,478 52.9 29.0 1 99
Subsidized Lunch 22,674 39.7 26.1 1 99
Unsubsidized Lunch 19,804 68.0 24.5 1 99
All Boys 20,859 51.0 29.4 1 99
All Girls 21,619 54.8 28.5 1 99
Reported Family Violence 1,152 40.2 25.8 1 99
Unreported Family Violence 785 36.4 25.7 1 99
44,882 0.046 0.210 0 1
Unreported: Filing Occurred 4+ Years After Current Academic Year 44,882 0.005 0.070 0 1
Unreported: Filing Occurred 2-3 Years After Current Academic Year 44,882 0.007 0.082 0 1
Unreported: Filing Occurred 1 Year After Current Academic Year 44,882 0.004 0.066 0 1
Unreported: Filing Occurred During the Current Academic Year 44,882 0.004 0.067 0 1
Reported: Filing Occurred 1 Year Before the Current Academic Year 44,882 0.005 0.067 0 1
Reported: Filing Occurred 2-3 Years Before the Current Academic Year 44,882 0.010 0.101 0 1
Reported: Filing Occurred 4+ Years Before the Current Academic Year 44,882 0.011 0.104 0 1
44,882 0.38 0.48 0 1
44,882 0.49 0.50 0 1
44,882 0.53 0.50 0 1
514 87.30 32.70 23 222
Notes: Cohort refers to a group of children in the same grade in the same school in the same year.
Free/Reduced Lunch
Cohort Size
Ever Exposed to Family Violence
Reading and Math Composite Score
Black
Male
23
Table 2: The Effect of Exposure to Troubled Children on Reading and Mathematics Test Scores Before and After the Parent Reports Domestic Violence Specification 1 2 3 4 5 6 7 8 9 10 11 12
-274.23*** -227.65*** -27.21** -30.21** -28.85** -37.11*** -35.01*** -27.56*** -24.48** -22.19* -23.70** -23.53*
(26.80) (26.18) (12.21) (12.40) (12.27) (9.96) (9.17) (9.33) (10.02) (12.22) (11.44) (12.65)
-163.16*** -192.34*** -1.60 -3.62 -3.45 3.56 5.36 -2.19 -4.34 -4.11 1.15 -4.43
(25.59) (23.85) (11.53) (12.14) (12.14) (9.76) (9.78) (10.26) (11.12) (10.86) (8.72) (9.90)
-14.15*** -13.58*** -11.09*** -11.13*** -11.11*** -4.48*** -4.47*** -4.39*** -4.35*** -5.81** 0.04 -0.32
(1.28) (1.27) (1.29) (1.29) (1.28) (1.08) (1.08) (1.08) (1.08) (2.80) (1.76) (0.57)
-11.45*** -11.90*** -9.33*** -9.36*** -9.35*** -3.36*** -3.37*** -3.44*** -3.40*** -1.60 -0.9
(1.24) (1.22) (1.27) (1.28) (1.28) (0.95) (0.95) (0.94) (0.94) (2.33) (0.52)
Observations 42,478 42,478 42,478 42,478 42,478 42,478 42,478 42,478 42,478 26,922 42,478 21,148
Year Fixed Effects No Yes Yes Yes - - - - - - - -
School Fixed Effects No No Yes - - - - - - - - -
School-Grade Fixed Effects No No No Yes Yes Yes Yes Yes Yes Yes Yes Yes
Grade-Year Fixed Effects No No No No Yes Yes Yes Yes Yes Yes Yes Yes
Individual Controls No No No No No Yes Yes Yes Yes - - Yes
Cohort Controls No No No No No No Yes Yes Yes Yes Yes Yes
School-Grade-specific linear time trends No No No No No No No Yes No No No No
School-Year Fixed Effects No No No No No No No No Yes Yes Yes Yes
Sibling Fixed Effects No No No No No No No No No Yes - No
Individual Fixed Effects No No No No No No No No No No Yes No
Lagged Test Score No No No No No No No No No No No Yes
* Significant at the 10% level
** Significant at the 5% level
*** Significant at the 1% level
Proportion of Peers with Unreported
Family Violence
Proportion of Peers with Reported
Family Violence
Own Unreported Family Violence
Own Reported Family Violence
Notes: Each column reports results from a separate regression. Individual controls include own reported and unreported domestic violence, gender, race, median family income, and subsidized
lunch status. Cohort controls include average gender, race, subsidized lunch, and size of cohort by school-by-grade-by-year. Standard errors in parentheses are two-way clustered at the school
by cohort and school by year level in Specifications 1 through 8; for computational reasons standard errors in specifications including sibling or individual fixed effects are clustered at the school
by cohort level.

24
Table 3: The Effect of Exposure to Troubled Children in the Years Before and After the Parent Reports Domestic Violence
Specification
Dependent Variable: Reading and Math ScorePeer Effect
Coefficients
Own DV
Coefficients
Peer Effect
Coefficients
Own DV
Coefficients
-39.57* -5.10*** -23.04 -4.91***
(23.12) (1.88) (22.21) (1.90)
-31.43** -6.17*** -18.00 -6.04***
(14.86) (1.65) (15.47) (1.64)
-27.24 -2.73 -29.85* -2.78
(17.23) (1.75) (16.10) (1.75)
-45.09** -3.14* -44.29** -3.11*
(19.53) (1.81) (18.90) (1.81)
5.59 -3.83** 0.62 -3.90**
(20.96) (1.77) (18.96) (1.76)
9.47 -1.86 0.21 -1.91
(13.18) (1.45) (13.37) (1.44)
1.22 -4.52*** -5.54 -4.60***
(13.28) (1.10) (13.42) (1.11)
Observations
School-Grade Fixed Effects
Grade-Year Fixed Effects
Individual Controls
Cohort Controls
School-Grade-specific linear time trends
* Significant at the 10% level
** Significant at the 5% level
*** Significant at the 1% level
Family Violence Occurred During the Current Academic Year
Reported Family Violence -- 1 Year
(filing occurred in the year before the current AY)
NoNotes: Each numbered column represents a different regression. Standard errors clustered at the school by cohort level are in
parentheses. All specifications control for individual gender, race, median family income, subsidized lunch status, and the
number of counselors as well as a full set of cohort -level controls include mean gender, race, median family income,
subsidized lunch, and size by school/grade/year.
42,478
Yes
Yes
Yes
Yes
Yes
1
Unreported Family Violence -- 4+ Years
(filing occurred 4 or more years after the current AY)
Unreported Family Violence -- 2-3 Years
(filing occurred more than 2-3 years before the current AY)
Unreported Family Violence -- 1 Year
(filing occurred in the year before the current AY)
Yes
Yes
Reported Family Violence -- 2-3 Years
(filing occurred 2-3 years after the current AY)
Reported Family Violence -- 4+ Years
(filing occurred 4+ years after the current AY)
2
42,478
Yes
Yes

25
Web-Only Appendix
Table A1: Falsification Tests
Specification 1 2 3 4 5 6
Black -0.0004 0.0001 - - - -
(0.0003) (0.0003)
Boy 0.0000 0.0001 - - - -
(0.0002) (0.0002)
Counselors -0.0014 0.0035 - - - -
(0.0018) (0.0021)
Neighborhood Income 0.0000 0.0000 - - - -
(0.0000) (0.0000)
Subsidized Lunch 0.0000 0.0000 - - - -
(0.0002) (0.0002)
- - -0.0115 -0.0067 -0.1138 15.9900
(0.0383) (0.1872) (0.2719) (43.4604)
- - 0.0051 0.1817 -0.0815 -43.0885
(0.0226) (0.1628) (0.2351) (32.4705)
0.85 1.30 0.09 0.65 0.17 1.08
(0.52) (0.26) (0.91) (0.53) (0.84) (0.34)
Observations 44,882 44,882 44,882 44,882 44,882 44,882
* Significant at the 10% level
** Significant at the 5% level
*** Significant at the 1% level
Cohort
Size
F-Test of Joint
Significance (p-value)
Notes: Each column represents a different regression. Standard errors clustered at the school by cohort level are in
parentheses. All specifications control for school by grade fixed effects and year fixed effects. Specification 3
additionally controls for the set of possible peers exposed to domestic violence in order to overcome the negative
mechanical bias of that randomization test, as proposed by Guryan et al. (2009).
Own
Domestic
Violence
Proportion of Peers
with Unreported
Proportion of Peers
with Reported Family
Proportion of Peers
with Unreported
Family Violence
Proportion of
Peers with
Reported Family
Dependent Variable
Dropout of
Sample after 3rd
or 4th Grade
Missing
Test Score
26
Table A2: The Effect of Exposure to Troubled Children on Reading and Math Scores and Disciplinary Infractions Before and After the Parent Reports Domestic Violence Specification 1 2 3 4 5 6 7 8 9 10 11 12
Panel A. Math Scores
-292.18*** -229.67*** -28.00* -30.27** -28.88** -36.14*** -35.03*** -31.52*** -16.73 -35.46** -51.27** -18.35
(30.49) (28.86) (14.91) (14.92) (14.41) (12.82) (11.89) (12.13) (14.80) (16.37) (19.72) (21.79)
-147.52*** -183.45*** 8.26 7.89 3.68 10.44 11.88 -5.35 4.51 -2.79 -7.95 -2.50
(27.20) (25.18) (14.07) (14.97) (14.50) (12.00) (12.10) (12.40) (13.69) (14.95) (16.20) (14.25)
Observations 38,014 38,014 38,014 38,014 38,014 38,014 38,014 38,014 38,014 24,034 38,014 17,604
Panel B. Reading Scores
-265.49*** -227.00*** -27.88** -32.04** -30.94** -38.53*** -36.98*** -26.69*** -28.31*** -24.67* -18.79 -30.26***
(27.06) (26.64) (13.00) (12.91) (12.81) (10.16) (9.62) (9.24) (10.03) (13.38) (12.87) (11.13)
-180.17*** -204.26*** -12.30 -12.16 -9.16 -1.73 1.47 -1.10 1.56 -1.54 13.68 0.65
(25.87) (24.44) (11.69) (11.66) (11.94) (9.67) (9.75) (9.78) (11.37) (11.26) (8.48) (8.86)
Observations 42,266 42,266 42,266 42,266 42,266 42,266 42,266 42,266 42,266 26,799 42,266 20,981
Panel C. Disciplinary Incidents
6.11*** 5.35*** 2.74** 3.44*** 3.65** 3.94*** 3.79** 3.72*** 1.45 -0.49 0.54 3.95***
(1.98) (1.90) (1.29) (1.25) (1.27) (1.21) (1.21) (0.94) (0.93) (1.06) (1.63) (1.44)
4.15*** 4.77*** -0.10 -1.07 -1.34 -1.64 -1.43 0.39 -0.91 -0.53 0.87 -0.42
(1.36) (1.44) (1.15) (1.20) (1.17) (1.12) (1.08) (0.85) (0.93) (0.83) (1.31) (1.21)
0.51*** 0.50*** 0.47*** 0.48*** 0.48*** 0.26** 0.26** 0.26** 0.23** (0.14) 0.02 0.17
(0.13) (0.13) (0.12) (0.12) (0.12) (0.11) (0.12) (0.11) (0.12) (0.27) (0.22) (0.12)
0.59*** 0.60*** 0.54*** 0.52*** 0.52*** 0.32*** 0.33*** 0.35*** 0.33*** 0.02 0.10
(0.13) (0.13) (0.12) (0.12) (0.12) (0.12) (0.12) (0.12) (0.12) (0.19) (0.08)
Observations 44,882 44,882 44,882 44,882 44,882 44,882 44,882 44,882 44,882 28,597 44,882 23,403
Year Fixed Effects No Yes Yes Yes - - - - - - - -
School Fixed Effects No No Yes - - - - - - - - -
School-Grade Fixed Effects No No No Yes Yes Yes Yes Yes Yes Yes Yes Yes
Grade-Year Fixed Effects No No No No Yes Yes Yes Yes Yes Yes Yes Yes
Individual Controls No No No No No Yes Yes Yes Yes - - Yes
Cohort Controls No No No No No No Yes Yes Yes Yes Yes Yes
School-Grade-specific linear time trends No No No No No No No Yes No No No No
School-Year Fixed Effects No No No No No No No No Yes Yes Yes Yes
Sibling Fixed Effects No No No No No No No No No Yes - No
Individual Fixed Effects No No No No No No No No No No Yes No
Lagged Test Score No No No No No No No No No No No Yes
* Significant at the 10% level
** Significant at the 5% level
*** Significant at the 1% level
Proportion of Peers with Unreported
Family Violence
Proportion of Peers with Reported
Family Violence
Notes: Each column reports results from a separate regression. Individual controls include own reported and unreported domestic violence, gender, race, median family
income, and subsidized lunch status. Cohort controls include average gender, race, subsidized lunch, and size of cohort by school-by-grade-by-year. Standard errors in
parentheses are two-way clustered at the school by cohort and school by year level in Specifications 1 through 8; for computational reasons standard errors in specifications
including sibling or individual fixed effects are clustered at the school by cohort level.
Proportion of Peers with Unreported
Family Violence
Proportion of Peers with Reported
Family Violence
Proportion of Peers with Unreported
Family Violence
Proportion of Peers with Reported
Family Violence
Own Unreported Family Violence
Own Reported Family Violence

27
Table A3: The Effect of Reported and Unreported Peer Domestic Violence on Reading and Math Scores by Subgroup
Specification 1 2 3 4 5
-37.83** -32.25*** -30.61** -32.00** -45.13***
(16.09) (10.55) (14.46) (15.73) (13.53)
-1.25 9.86 18.73 -1.79 -0.53
(17.94) (11.12) (16.09) (14.50) (12.30)
Sample High-Income Low-Income 3rd Graders 4th Graders 5th Graders
Year Fixed Effects - - - - -
School Fixed Effects - - - - -
School-Grade Fixed Effects Yes Yes Yes Yes Yes
Grade-Year Fixed Effects Yes Yes Yes Yes Yes
Individual Controls Yes Yes Yes Yes Yes
School-Grade-specific linear time trends No No No No No
* Significant at the 10% level
** Significant at the 5% level
*** Significant at the 1% level
Proportion of Peers with Unreported Family
Violence
Proportion of Peers with Reported Family
Violence
Notes: Each column reports results from a separate regression. High-income refers to families not eligible for subsidized lunches; low-income refers to families
that are. Individual controls include own reported and unreported domestic violence, gender, race, median family income, and subsidized lunch status. Cohort
controls include average gender, race, subsidized lunch, and size of cohort by school-by-grade-by-year. Standard errors in parentheses are two-way clustered at the
school by cohort and school by year level in Specifications 1 through 8.