Embed Size (px)
DESCRIPTION
Endia (2014)
Citation preview

Learning and Individual Differences 32 (2014) 287–293
Contents lists available at ScienceDirect
Learning and Individual Differences
j ourna l homepage: www.e lsev ie r .com/ locate / l ind i f
Family background as a predictor of reading comprehensionperformance: An examination of the contributions of human,financial, and social capital
Endia J. LindoUniversity of North Texas, 1155 Union Circle #311335, Denton, TX 76203-5017, United States
E-mail address: [email protected].
http://dx.doi.org/10.1016/j.lindif.2014.03.0211041-6080/© 2014 Elsevier Inc. All rights reserved.
a b s t r a c t
a r t i c l e i n f oArticle history:Received 6 August 2013Received in revised form 30 January 2014Accepted 24 March 2014
Keywords:Social factorsPredictorsReading comprehensionAt-risk
This study examines the relationship between students' family background, (i.e., human, social and financial cap-ital), and the comprehension of struggling readers in grades 2–6. Decades of research haveworked to further un-derstand the relationship between background factors and achievement. However, few studies have focused oncomprehension outcomes, or accounted for parent cognitive ability and intergenerational effects. Family back-ground surveys and assessments of cognitive and reading skills were administered to the parents of strugglingreaders (N = 51). Correlation and regression analyses examined the relationship between family backgroundvariables and students' comprehension scores, identifying a significant relationship accounting for as much ormore variability than the traditional socioeconomic measures. These findings have implications regarding howwe currently examine the influence of socioeconomic status in intervention research and its role in identifyingstudents at-risk for reading failure and their differential response to intervention.
© 2014 Elsevier Inc. All rights reserved.
The ability to understand and gain knowledge from text is vital forsuccess in school and everyday life. As students progress throughschool, the demand for independent reading and extraction of informa-tion increases (Snow, Porche, Tabors, & Harris, 2007); placing thoseexperiencing comprehension difficulties at a serious disadvantage. The2011 Nation's Report Card found 63% of U.S. fourth graders werenot proficient in reading comprehension, a number that increased to83% for low-income students and 89% for students with disabilities(National Center for Educational Statistics, 2011). Unfortunately, re-search has shown that these early reading difficulties often plaguestudents throughout their academic careers (Lee & Burkam, 2002;Nation, Cocksey, Taylor, & Bishop, 2010; Snow et al., 2007),highlighting the need to better understand and address the factorsleading to reading difficulties and disabilities.
Discussion regarding effective predictors of reading outcomes hasbeen on-going on for several decades. However, legislation such as theElementary and Secondary Education Act (2002) and the Individualswith Disabilities Education Improvement Act and its reauthorization(IDEIA, 2004, 2006) placed the need for effective predictive measuresand interventions at the forefront of the educational research agenda.There is mounting evidence that early intervention can prevent readingdifficulties in many children (Denton et al., 2010; Yell, Shriner, &Katsiyannis, 2006). However, in order to effectively intervene we mustbe able to accurately identify those students in need of intervention.
Elbro and Scarborough (2003) note that 25–69% of students identifiedas at-risk for reading failure never develop reading difficulties and upto 9%of thosewhoare not identified as at-risk display readingproblems.This suggests that there is still work to be done in regard to developingefficient measures for identifying those at-risk for reading failure.
1. Socioeconomic status as a predictor of reading achievement
Low family income is frequently used in education to identifystudents at-risk for reading difficulty (Lubienski & Crane, 2010;Weinstein, Stiefel, Schwartz, & Chalico, 2009). Billions of dollars arespent annually on educational programming targeting children inpoverty (e.g., Title 1 programs) with questionable results (see McDill& Natriello, 1998; Weinstein et al., 2009). Though social scientistshave emphasized the link between parental socioeconomic status(SES) and student achievement (Berliner, 2005; Callahan & Eyberg,2010; Lee & Burkam, 2002; Sirin, 2005) questions remain about the na-ture and magnitude of the relationship (Jeynes, 2002; Kieffer, 2012;Sirin, 2005). Sirin's (2005) and White's (1982) meta-analytic reviewsreported a moderate, mean correlation between SES and achievement— .29 and .35, respectively. However, both meta-analyses note thatstudies have found the relationship between these variables to rangefrom having no significant relation to a strong correlation. One explana-tion for the wide discrepancy is the lack of consensus with regard tohow best to conceptualize and measure SES (Oakes & Rossi, 2003).White's (1982) review found that over 70 different variables employedindividually or in combinationwere used as indicators of SES. In order to
288 E.J. Lindo / Learning and Individual Differences 32 (2014) 287–293
successfully intervene and decrease the risk of reading failure forstudents of low SESwe need to better understandwhat SES factors con-tribute to reading difficulty (Kieffer, 2012; Lubienski & Crane, 2010).
2. Indicators of socioeconomic status
Although there are a variety of conceptualizations of SES, threemajor indicators have garnered thewidest acceptance: parental income,education, and occupation (Callahan & Eyberg, 2010; Hauser, 1994;Sirin, 2005). However, Duncan and Magnuson (2003) caution against“an aggregate, simplified, or superficial, treatment of SES (p. 83)”based on these indicators, calling instead for an emphasis on totalwealth. Yet, when SES is reported in educational intervention researchit is most often based on simple measures of parent education, income,occupation, or some combination of them (Author, 2007; Callahan &Eyberg, 2010).
In addition to the three primary indicators, many studies alsoincorporate measures of home resource into their definition ofSES. Home resources refer to the possessions and activities avail-able in the home (e.g., computers and books), as well as having aphysical space to work and access to other educational activities(e.g., after school and summer courses or outings). Sirin(2005)found that measures involving home resources had the strongestcorrelation (r= .51) with academic achievement, compared to tra-ditional measures of SES (r = .28–.30); and White (1982) foundthat they accounted for between 4 and 11 times more achievementvariation than traditional SES measures. These findings suggestthat we should expand the traditional approaches to determiningSES to take into account resources beyond parent education,income, or occupation.
Few guidelines for the examination and reporting of SES exist.Research evaluating the validity of current measures, as well as a focuson the conceptualization and development of other valid and reliablemeasures of SES is needed (Oakes&Rossi, 2003).While SES is not a causalfactor in itself, increasing our understanding of this construct and its rela-tions to reading performance may help unveil the social factors involvedin reading comprehension ability, and guide in the development ofmore intensive interventions and the identification of those in need ofthem. The current study attempts to add to this body of knowledge by ex-amining the predictive validity of family background as an enhancementon traditional SES measures for students most at-risk for reading failure.
3. Family background
Coleman'smodel of family background (Coleman, 1988) serves as anexpansion on the traditional measures of SES in that it focuses on boththe resources available to individuals or families and their transmission(Havenman & Wolfe, 1995). Coleman's theory suggests that there aremultiple forms of resources or ‘capital’ that serve to make achievementof certain ends possible, that would not be in their absence. Familybackground consists of three components: financial, human, and socialcapital (Coleman, 1988). Financial capital refers to a family's incomeor wealth, and speaks to the physical resources a family can provide toassist in development and achievement. Human capital is generallymeasured using parental education and refers to the provision of tacitknowledge, social competence, and a cognitive environment that pro-motes a child's learning. Social capital refers to approximated resources,such as time and individuals, available for support and intellectual tasks;aswell as social norms and values (Coleman, 1988). Aswith SES, there issignificant empirical data suggesting that family backgroundmay serveas an early predictor of student academic performance, attainment, andresponse to instruction (Berliner, 2005; Ferguson & Ready, 2011;Foorman et al., 1997; Petrill, Deater-Deckard, Schatschneider, & Davis,2005; Snow, Barnes, Chandler, Goodman, & Hemphill, 1991).
4. Purpose of the present study
The purpose of this study is to assess the family background of strug-gling readers in grades 2–6 and examine how background factors influ-ence their reading comprehension performance. This study addressesthe following questions: (a) how does family background and itscomponents (i.e., human,financial, and social capital) relate to student'sreading comprehension?, (b) does one's social capital mediate therelations between comprehension and human or financial capital?,(c) does the relation between family background and reading com-prehension vary by level of total capital?, (d) is family backgroundmore predictive of reading comprehension ability than traditionalsocioeconomic measures? and e) what does the examination offamily background add to the prediction of reading comprehensionability above traditional cognitive and linguistic measures? An-swers to these questions may guide in the development of a morerefined tool for socioeconomic categorization in schools andaccurately identifying those students most at-risk prior to formalreading instruction.
While numerous studies have considered components of familybackground as factors predicting academic achievement (Lubienski &Crane, 2010), few have attempted to examine all components of familybackground or to investigate their relations to the reading comprehen-sion performance of struggling readers in the elementary grades. Thisstudy also adds to the existing research by including an examinationof intergenerational influence of capital, controlling for parent generalcognitive and reading ability, and bymeasuring social status atmultipleperiods in the child's development (e.g., birth, entry into first grade, andcurrent status); all factors found to add to the prediction of readingachievement beyond traditional SES variables (Bowles, Gintis, &Groves, 2008; Ferguson & Ready, 2011).
5. Method
5.1. Participants
Study participants were 51 students assessed for participation inreading interventions conducted at a university in the southeasternUnited States and their primary caregivers. Of the 51 students, 57%were male. To identify students whose comprehension skills were lowin comparison to their reading fluency, students included in the largerstudy scored at least one SD below themean on two ormore reading as-sessments and read more than 45 words per minute on second-gradepassage fluency measures. The caregivers were 25–71 years old(M=40), 96% were female (N=49) with 86% (N=44) identifyingthemselves as the students biological mother. See Table 1 for addi-tional descriptive information on the participants.
5.2. Procedures
During initial assessment or intervention sessions parents were of-fered the opportunity to participate in this study. Of the 62 parentsapproached, 89% (N=55) agreed to participate, with 93% of those par-ticipants completing all portions of the study.
Parents took part in two data collection sessions. During the first35 minute session parents signed consent forms, completed a cogni-tive assessment (i.e., Wonderlic Personnel Test), reading measure(i.e., TOWRE), and received two take-home surveys regarding familyresources and practices. During the second session the take-homesurveys were collected and a one-to-one, 60 minute structured in-terview was conducted to gather information regarding the families'capital. All sessions were audiotaped, and conducted by the author ora trained research assistant. Completed measures were scored bytwo members of the research team, and all data were entered induplicate to ensure accuracy. Agreement on the initial scoring ofmeasures ranged from 86 to 95%. Discrepancies were examined a
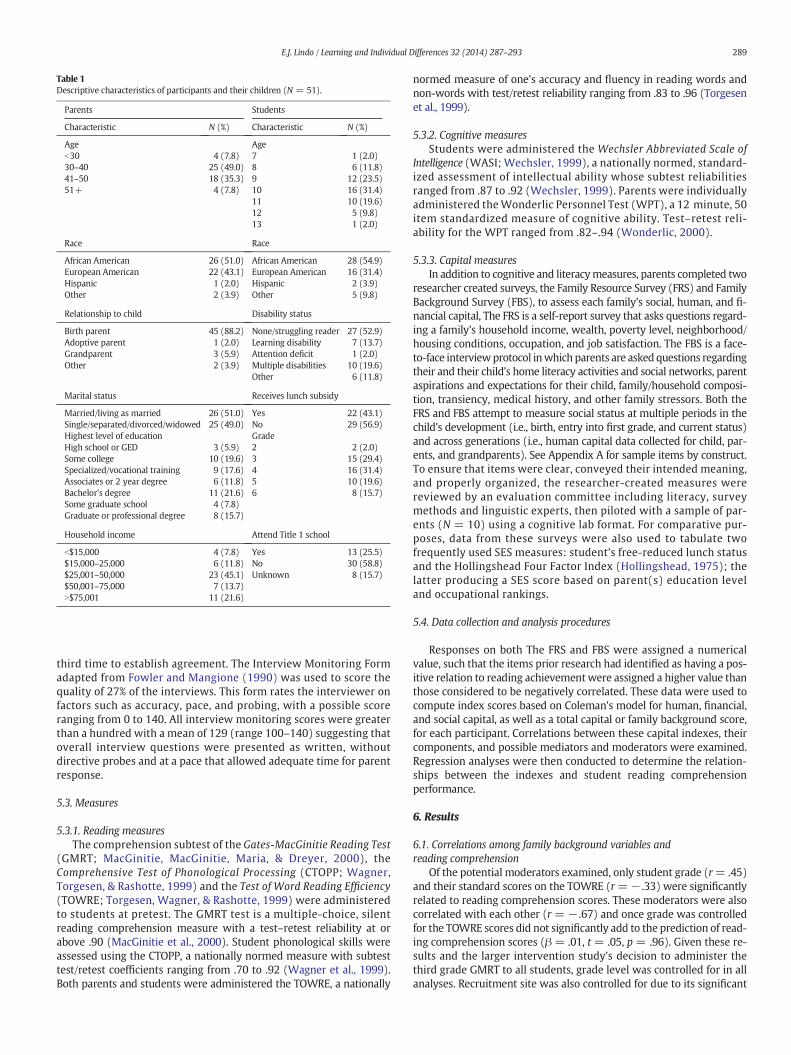
Table 1Descriptive characteristics of participants and their children (N = 51).
Parents Students
Characteristic N (%) Characteristic N (%)
Age Ageb30 4 (7.8) 7 1 (2.0)30–40 25 (49.0) 8 6 (11.8)41–50 18 (35.3) 9 12 (23.5)51+ 4 (7.8) 10 16 (31.4)
11 10 (19.6)12 5 (9.8)13 1 (2.0)
Race Race
African American 26 (51.0) African American 28 (54.9)European American 22 (43.1) European American 16 (31.4)Hispanic 1 (2.0) Hispanic 2 (3.9)Other 2 (3.9) Other 5 (9.8)
Relationship to child Disability status
Birth parent 45 (88.2) None/struggling reader 27 (52.9)Adoptive parent 1 (2.0) Learning disability 7 (13.7)Grandparent 3 (5.9) Attention deficit 1 (2.0)Other 2 (3.9) Multiple disabilities 10 (19.6)
Other 6 (11.8)
Marital status Receives lunch subsidy
Married/living as married 26 (51.0) Yes 22 (43.1)Single/separated/divorced/widowed 25 (49.0) No 29 (56.9)Highest level of education GradeHigh school or GED 3 (5.9) 2 2 (2.0)Some college 10 (19.6) 3 15 (29.4)Specialized/vocational training 9 (17.6) 4 16 (31.4)Associates or 2 year degree 6 (11.8) 5 10 (19.6)Bachelor's degree 11 (21.6) 6 8 (15.7)Some graduate school 4 (7.8)Graduate or professional degree 8 (15.7)
Household income Attend Title 1 school
b$15,000 4 (7.8) Yes 13 (25.5)$15,000–25,000 6 (11.8) No 30 (58.8)$25,001–50,000 23 (45.1) Unknown 8 (15.7)$50,001–75,000 7 (13.7)N$75,001 11 (21.6)
289E.J. Lindo / Learning and Individual Differences 32 (2014) 287–293
third time to establish agreement. The Interview Monitoring Formadapted from Fowler and Mangione (1990) was used to score thequality of 27% of the interviews. This form rates the interviewer onfactors such as accuracy, pace, and probing, with a possible scoreranging from 0 to 140. All interview monitoring scores were greaterthan a hundred with a mean of 129 (range 100–140) suggesting thatoverall interview questions were presented as written, withoutdirective probes and at a pace that allowed adequate time for parentresponse.
5.3. Measures
5.3.1. Reading measuresThe comprehension subtest of the Gates-MacGinitie Reading Test
(GMRT; MacGinitie, MacGinitie, Maria, & Dreyer, 2000), theComprehensive Test of Phonological Processing (CTOPP; Wagner,Torgesen, & Rashotte, 1999) and the Test of Word Reading Efficiency(TOWRE; Torgesen, Wagner, & Rashotte, 1999) were administeredto students at pretest. The GMRT test is a multiple-choice, silentreading comprehension measure with a test–retest reliability at orabove .90 (MacGinitie et al., 2000). Student phonological skills wereassessed using the CTOPP, a nationally normed measure with subtesttest/retest coefficients ranging from .70 to .92 (Wagner et al., 1999).Both parents and students were administered the TOWRE, a nationally
normed measure of one's accuracy and fluency in reading words andnon-words with test/retest reliability ranging from .83 to .96 (Torgesenet al., 1999).
5.3.2. Cognitive measuresStudents were administered the Wechsler Abbreviated Scale of
Intelligence (WASI; Wechsler, 1999), a nationally normed, standard-ized assessment of intellectual ability whose subtest reliabilitiesranged from .87 to .92 (Wechsler, 1999). Parents were individuallyadministered theWonderlic Personnel Test (WPT), a 12 minute, 50item standardized measure of cognitive ability. Test–retest reli-ability for the WPT ranged from .82–.94 (Wonderlic, 2000).
5.3.3. Capital measuresIn addition to cognitive and literacymeasures, parents completed two
researcher created surveys, the Family Resource Survey (FRS) and FamilyBackground Survey (FBS), to assess each family's social, human, and fi-nancial capital, The FRS is a self-report survey that asks questions regard-ing a family's household income, wealth, poverty level, neighborhood/housing conditions, occupation, and job satisfaction. The FBS is a face-to-face interviewprotocol inwhich parents are asked questions regardingtheir and their child's home literacy activities and social networks, parentaspirations and expectations for their child, family/household composi-tion, transiency, medical history, and other family stressors. Both theFRS and FBS attempt to measure social status at multiple periods in thechild's development (i.e., birth, entry into first grade, and current status)and across generations (i.e., human capital data collected for child, par-ents, and grandparents). See Appendix A for sample items by construct.To ensure that items were clear, conveyed their intended meaning,and properly organized, the researcher-created measures werereviewed by an evaluation committee including literacy, surveymethods and linguistic experts, then piloted with a sample of par-ents (N = 10) using a cognitive lab format. For comparative pur-poses, data from these surveys were also used to tabulate twofrequently used SES measures: student's free-reduced lunch statusand the Hollingshead Four Factor Index (Hollingshead, 1975); thelatter producing a SES score based on parent(s) education leveland occupational rankings.
5.4. Data collection and analysis procedures
Responses on both The FRS and FBS were assigned a numericalvalue, such that the items prior research had identified as having a pos-itive relation to reading achievementwere assigned a higher value thanthose considered to be negatively correlated. These data were used tocompute index scores based on Coleman's model for human, financial,and social capital, as well as a total capital or family background score,for each participant. Correlations between these capital indexes, theircomponents, and possible mediators and moderators were examined.Regression analyses were then conducted to determine the relation-ships between the indexes and student reading comprehensionperformance.
6. Results
6.1. Correlations among family background variables andreading comprehension
Of the potential moderators examined, only student grade (r= .45)and their standard scores on the TOWRE (r=− .33) were significantlyrelated to reading comprehension scores. These moderators were alsocorrelated with each other (r = − .67) and once grade was controlledfor the TOWRE scores did not significantly add to the prediction of read-ing comprehension scores (β = .01, t = .05, p = .96). Given these re-sults and the larger intervention study's decision to administer thethird grade GMRT to all students, grade level was controlled for in allanalyses. Recruitment site was also controlled for due to its significant

290 E.J. Lindo / Learning and Individual Differences 32 (2014) 287–293
correlation with financial capital (r = − .31). This analysis identifiedsignificant correlations between reading comprehension and the finan-cial, human, and total capital indexes (r = .33, .31, & .34, respectively)and a marginally positive association between reading comprehensionand social capital (r = .26, p b .08). In addition, given the moderate tostrong correlations (r= .38–.63) between the human, financial, and so-cial capital indices, a check for multicollinearity was conducted. Eachform of capital was regressed on the other components of family back-ground. The largest R2 from these equations was .40, a value far enoughfrom one to suggest that multicollinearity is not a problem (see Lewis-Beck, 1980).
6.2. Regression models
6.2.1. Does family background help predict struggling readers'comprehension performance?. Total capital and each sub-index was inde-pendently entered into regression equations, after controlling for gradelevel and recruitment site, to determine whether family backgroundand its components accounted for a significant portion of the variabilityin reading comprehension performance (see Table 2). Family background(i.e., total capital), as well as its human and financial capital components,each added significantly (p b .05) to the regression equation when en-tered independently. Social capital however resulted in an insignificantF change.
6.2.2. Are certain forms of capitalmore predictive of reading comprehensionperformance, and/or serve to mediate the effect of family background?.Each of the three components of family background was also enteredinto the same regression analyses. When human capital was enteredfirst the other components failed to add anything significant to theprediction of reading comprehension (R2 = .36; significant f Δ = .03).The same was true when financial capital was the first form of capitalentered (R2 = .36; significant f Δ = .02), yet when social capital wasaccounted for first no significant change in f occurred for any of thecapital indexes. Though social capital was not a significant predictor,its inclusion prior to human and financial capital seemed to inhibittheir predictive abilities. However, further examination of the variablesthat comprise human, financial, and social capital showed that only fourcomposites were significant predictors of reading comprehension per-formance in this sample — education, occupation, income and wealth(ordered by strength of relationship).
Table 2Summary of regression statistics for family background variables predicting students'reading comprehension performance (N = 51).
Capital indexes β T R2 Sig. fΔ
Financial capital 0.30 2.40⁎ 0.36 0.02Wealth 0.28 2.10⁎ 0.35 0.04Income 0.28 2.41⁎ 0.36 0.02Poverty 0.23 1.80` 0.33 0.08Employment 0.11 0.84 0.30 0.41Human capital 0.27 2.25⁎ 0.36 0.03Education 0.39 3.58⁎ 0.44 0.00Occupation 0.37 3.34⁎ 0.42 0.00Home literacy environment 0.10 0.80 0.30 0.43Cognitive/reading ability 0.18 1.49 0.32 0.14Social capital 0.22 1.80` 0.33 0.08Social network 0.20 1.60 0.32 0.12Family composition 0.18 1.48 0.32 0.15Parent aspirations/expectations 0.03 0.27 0.29 0.79Parenting practices/involvement 0.10 0.79 0.30 0.43Total capital 0.29 2.48⁎ 0.37 0.02
Note. Data is based on amodel inwhich grade and recruitment site are entered in step 1 ofequation. Each index was entered in a separate regression equation.
` p b .1.⁎ p b .05.
6.2.3. Does the relation between family background and readingcomprehension vary by level of total capital?. In order to determine if thesame patterns held at various levels of capital the total capital scoreswere divided into 4 groups representing more than 1 SD below themean (group 1), within 1 SD below mean (group 2), less than 1 SDabove mean (group 3), or more than 1 SD above mean (group 4).Groupmean reading comprehension scores increased with level of cap-ital (i.e., group 1= 16.25, group 2= 19.00, group 3= 20.67, and group4 = 25.80); however there was a significant overlap in the range ofscores by group. An ANCOVA comparing means between groups 1 and4, while allowing grade to covary, showed no significant difference be-tween groups (F (3, 46) = 2.13, p = 0.11).
6.2.4. Is family backgroundmore predictive than traditional SESmeasures?.Another question this study purported to answer was whether familybackground was more predictive of reading comprehension abilitythan traditional socioeconomic measures, specifically the Hollingsheadand lunch subsidy status. When included in the regression equationcontrolling for grade and site, the total capital and Hollingshead scorewere nearly equal in what they added to the prediction equation(β = .29 and .28, p b .01, respectively), yet lunch status (β = .16,p = .20) did not significantly account for any of the variability inreading comprehension performance.
6.2.5. Does the examination of family background add to the prediction ofreading comprehension ability above traditional cognitive and linguisticmeasures?. When parent and student cognitive scores (measured bythe WPT and WASI) were each added to prediction equation they didnot account for a significant amount of variance in student comprehen-sion scores, however total capital remained a significant predictor. Thesame was true when the parents' and children's sight word and phone-mic decoding skills were included. Controlling for student race, genderor respondent's age did not aid in predicting student outcomes either.
6.3. Post hoc analysisThe family background surveys assessed a broad range of back-
ground factors in hopes of detecting the few that might be the mostpredictive. Unfortunately, the sample obtained did not afford the abilityto run more advanced statistical analyses to determine how individualitems loaded together or what variables contributed the most within afull model. As a result it was decided to recalculate each index includingonly items with significant (p b .05) zero-order correlations withreading comprehension. Regression analyses were then conductedemploying the revised indexes in order to determine whether a signifi-cant amount of variability in reading comprehension performance couldbe accounted for using fewer variables; thereby requiring less time andfewer resources. A summary of these analyses is presented in Table 3.
6.4. Revised modelEach of the revised indexes was found to explain a significant
amount of variability in reading comprehension performance (p b .01)when entered independently in a regression controlling for recruitmentsite and grade level. As expected, within human and financial capital,income, wealth, education and occupation were each significantpredictors. Parent aspirations and expectations were also found tohave a significant, yet surprisingly negative relationship with readingcomprehension. Of the components of family background, humancapital accounted for the largest amount of variability (β = .45).When the revised capital values were all entered in the equationhuman capital was the only variable to add anything significant (β =.35, t = 2.92, p b .01), regardless of order entered. The revised socialcapital index also showed no signs of mediating the relationship be-tween revised human/financial capital composite and reading compre-hension. Unlike the full model, when the revised capital indexes weredivided into four levels of capital, there was a significant group meandifference in reading comprehension scores (F (3, 46) = 3.08, p b .04)
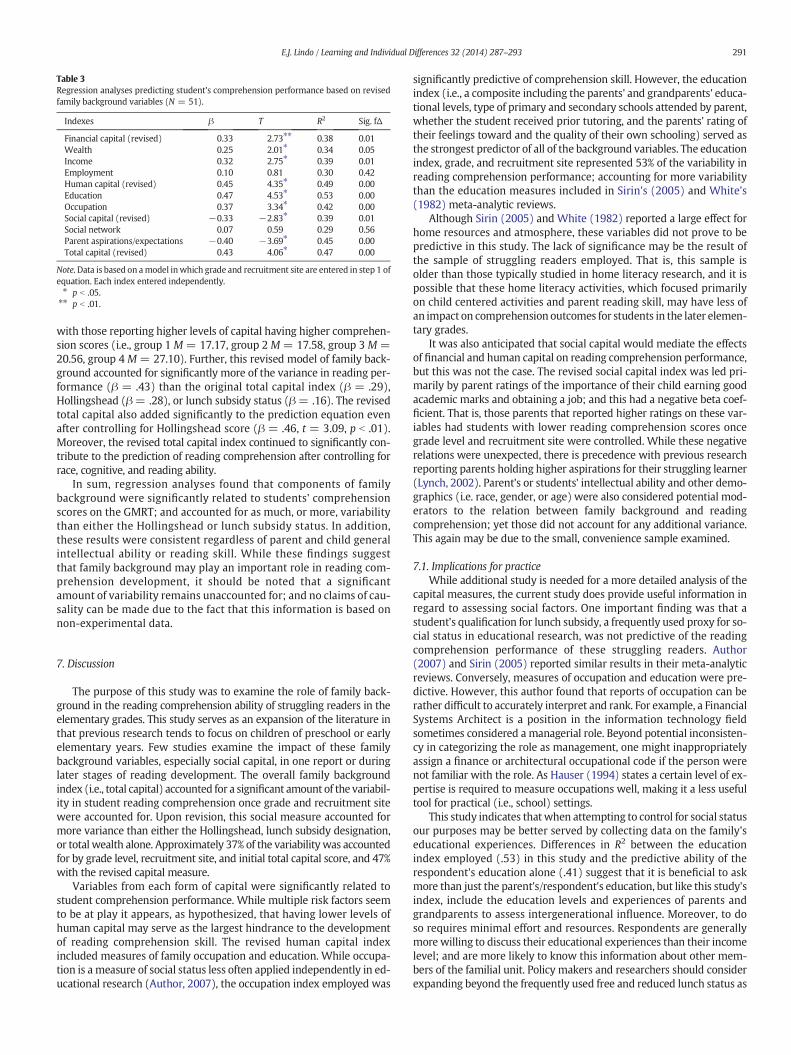
Table 3Regression analyses predicting student's comprehension performance based on revisedfamily background variables (N = 51).
Indexes β T R2 Sig. fΔ
Financial capital (revised) 0.33 2.73⁎⁎ 0.38 0.01Wealth 0.25 2.01⁎ 0.34 0.05Income 0.32 2.75⁎ 0.39 0.01Employment 0.10 0.81 0.30 0.42Human capital (revised) 0.45 4.35⁎ 0.49 0.00Education 0.47 4.53⁎ 0.53 0.00Occupation 0.37 3.34⁎ 0.42 0.00Social capital (revised) −0.33 −2.83⁎ 0.39 0.01Social network 0.07 0.59 0.29 0.56Parent aspirations/expectations −0.40 −3.69⁎ 0.45 0.00Total capital (revised) 0.43 4.06⁎ 0.47 0.00
Note. Data is based on amodel inwhich grade and recruitment site are entered in step 1 ofequation. Each index entered independently.⁎ p b .05.⁎⁎ p b .01.
291E.J. Lindo / Learning and Individual Differences 32 (2014) 287–293
with those reporting higher levels of capital having higher comprehen-sion scores (i.e., group 1 M = 17.17, group 2 M = 17.58, group 3 M =20.56, group 4 M = 27.10). Further, this revised model of family back-ground accounted for significantly more of the variance in reading per-formance (β = .43) than the original total capital index (β = .29),Hollingshead (β= .28), or lunch subsidy status (β= .16). The revisedtotal capital also added significantly to the prediction equation evenafter controlling for Hollingshead score (β = .46, t = 3.09, p b .01).Moreover, the revised total capital index continued to significantly con-tribute to the prediction of reading comprehension after controlling forrace, cognitive, and reading ability.
In sum, regression analyses found that components of familybackground were significantly related to students' comprehensionscores on the GMRT; and accounted for as much, or more, variabilitythan either the Hollingshead or lunch subsidy status. In addition,these results were consistent regardless of parent and child generalintellectual ability or reading skill. While these findings suggestthat family background may play an important role in reading com-prehension development, it should be noted that a significantamount of variability remains unaccounted for; and no claims of cau-sality can be made due to the fact that this information is based onnon-experimental data.
7. Discussion
The purpose of this study was to examine the role of family back-ground in the reading comprehension ability of struggling readers in theelementary grades. This study serves as an expansion of the literature inthat previous research tends to focus on children of preschool or earlyelementary years. Few studies examine the impact of these familybackground variables, especially social capital, in one report or duringlater stages of reading development. The overall family backgroundindex (i.e., total capital) accounted for a significant amount of the variabil-ity in student reading comprehension once grade and recruitment sitewere accounted for. Upon revision, this social measure accounted formore variance than either the Hollingshead, lunch subsidy designation,or total wealth alone. Approximately 37% of the variabilitywas accountedfor by grade level, recruitment site, and initial total capital score, and 47%with the revised capital measure.
Variables from each form of capital were significantly related tostudent comprehension performance. While multiple risk factors seemto be at play it appears, as hypothesized, that having lower levels ofhuman capital may serve as the largest hindrance to the developmentof reading comprehension skill. The revised human capital indexincluded measures of family occupation and education. While occupa-tion is a measure of social status less often applied independently in ed-ucational research (Author, 2007), the occupation index employed was
significantly predictive of comprehension skill. However, the educationindex (i.e., a composite including the parents' and grandparents' educa-tional levels, type of primary and secondary schools attended by parent,whether the student received prior tutoring, and the parents' rating oftheir feelings toward and the quality of their own schooling) served asthe strongest predictor of all of the background variables. The educationindex, grade, and recruitment site represented 53% of the variability inreading comprehension performance; accounting for more variabilitythan the education measures included in Sirin's (2005) and White's(1982) meta-analytic reviews.
Although Sirin (2005) and White (1982) reported a large effect forhome resources and atmosphere, these variables did not prove to bepredictive in this study. The lack of significance may be the result ofthe sample of struggling readers employed. That is, this sample isolder than those typically studied in home literacy research, and it ispossible that these home literacy activities, which focused primarilyon child centered activities and parent reading skill, may have less ofan impact on comprehension outcomes for students in the later elemen-tary grades.
It was also anticipated that social capital would mediate the effectsof financial and human capital on reading comprehension performance,but this was not the case. The revised social capital index was led pri-marily by parent ratings of the importance of their child earning goodacademic marks and obtaining a job; and this had a negative beta coef-ficient. That is, those parents that reported higher ratings on these var-iables had students with lower reading comprehension scores oncegrade level and recruitment site were controlled. While these negativerelations were unexpected, there is precedence with previous researchreporting parents holding higher aspirations for their struggling learner(Lynch, 2002). Parent's or students' intellectual ability and other demo-graphics (i.e. race, gender, or age) were also considered potential mod-erators to the relation between family background and readingcomprehension; yet those did not account for any additional variance.This again may be due to the small, convenience sample examined.
7.1. Implications for practiceWhile additional study is needed for a more detailed analysis of the
capital measures, the current study does provide useful information inregard to assessing social factors. One important finding was that astudent's qualification for lunch subsidy, a frequently used proxy for so-cial status in educational research, was not predictive of the readingcomprehension performance of these struggling readers. Author(2007) and Sirin (2005) reported similar results in their meta-analyticreviews. Conversely, measures of occupation and education were pre-dictive. However, this author found that reports of occupation can berather difficult to accurately interpret and rank. For example, a FinancialSystems Architect is a position in the information technology fieldsometimes considered a managerial role. Beyond potential inconsisten-cy in categorizing the role as management, one might inappropriatelyassign a finance or architectural occupational code if the person werenot familiar with the role. As Hauser (1994) states a certain level of ex-pertise is required to measure occupations well, making it a less usefultool for practical (i.e., school) settings.
This study indicates thatwhen attempting to control for social statusour purposes may be better served by collecting data on the family'seducational experiences. Differences in R2 between the educationindex employed (.53) in this study and the predictive ability of therespondent's education alone (.41) suggest that it is beneficial to askmore than just the parent's/respondent's education, but like this study'sindex, include the education levels and experiences of parents andgrandparents to assess intergenerational influence. Moreover, to doso requires minimal effort and resources. Respondents are generallymore willing to discuss their educational experiences than their incomelevel; and are more likely to know this information about other mem-bers of the familial unit. Policy makers and researchers should considerexpanding beyond the frequently used free and reduced lunch status as
292 E.J. Lindo / Learning and Individual Differences 32 (2014) 287–293
a measure of socioeconomic, and accompanying risk, status. Further-more, given its limited predictive validity findings based on free or re-duced lunch status should be interpreted with caution (Lubienski &Crane, 2010; Sirin, 2005). As Lubienski and Crane (2010) note, evenwhen social status is not the primary objective of the study, researchersneed to account for the possible confounds it may have on the relation-ship being examined.
7.2. Limitations and need for further researchResearch has shown that parents' education influences their
children's development but the question remains, is it the educationalexperience of parents itself, or is it something about the individualswho achieve certain levels of education that correspond to higher read-ing scores in their children? Unfortunately, the measures of parents'cognitive ability, reading skill, and parenting practices/involvementemployed in this study did not shed any light on the situation. One plau-sible theory proposed by Snow et al. (1991) is that parents who haveattended school for fewer years may lack the knowledge necessary tosuccessful assist their child's navigation through educational systems(e.g., understanding tracking, seeking and taking advantage of specialprograms). It is also likely that parentswith higher education levels sim-ply provide richer literacy environments for their children and aremoreinvolved in their children's education (see Dickinson & Tabors, 2001).Yet, we know that across levels of SES, students of certain ethnic groupscontinue to underperform (Ferguson, 2002). Hopefully with moreresearch we will better understand these aspects and provide targetedintervention for children and families in need.
More research is needed, employing a larger sample, in order to bet-ter understand these relations and the possible interactions that occuramong the variables examined. This study's limited sample resulted inan inability to examine the reliability of the survey measures created,or include all desired variables in one regression equation. One reassur-ance regarding the validity of the total capital index is that itwas strong-ly correlated with the Hollingshead, an established, albeit controversial,measure of social status. While quality controls were employed to en-sure best practice for survey implementation, the potential for receivingsocially desirable responses remains. A longitudinal examination offamily background, including observations, would serve to confirmthese relations.
It is important to improve our ability to identify those students mostat-risk for reading difficulty, not only for their sakes, but also to betterallocate the generally limited resources available to schools. The strate-gy of focusing on average income levels or racial groupings has notproven to be the most efficient and effective tool for identification ofthose who will experience reading failure (Elbro & Scarborough, 2003;Lubienski & Crane, 2010). With themajority (60–70%) of the variabilityin achievement attributed to factors beyond the school house(Scheerens & Bosker, 1997) it is important that we seek a better under-standing of family background factors and the role they play in academ-ic development. Doing so may afford better tools for identifying andserving those most in need, and allow for earlier intervention in orderto prevent serious reading delays.
Acknowledgments
Special thanks to Drs. Donald Compton, Mark Berends, Doug Fuchs,and Lynn Fuchs for their guidance and support in the developmentand completion of this study; and Drs. Bertina Combes and Brian Bryantfor their feedback on this manuscript.
Appendix A. Supplementary data
Supplementary data to this article can be found online at http://dx.doi.org/10.1016/j.lindif.2014.03.021.
References
Berliner, D. C. (2005). Our impoverished view of educational reform. Teachers CollegeRecord, 108(6), 949–995 (Retrieved from http://www.asu.edu/educ/epsl/EPRU/documents/EPSL-0508-116-EPRU.pdf).
Bowles, S., Gintis, H., & Groves, M. (2008). Unequal chances: Family background and eco-nomic success. Princeton, NJ: Princeton University Press.
Callahan, C. L., & Eyberg, S. M. (2010). Relations between parenting behavior and SES in aclinical sample: Validity of SES measures. Child & Family Behavior Therapy, 32(2),125–138. http://dx.doi.org/10.1080/07317101003776456.
Coleman, J. S. (1988). Social capital in the creation of human capital. The American Journalof Sociology, 94, S95–S120. http://dx.doi.org/10.1086/228943 (Supplement).
Denton, C. A., Kethley, C., Nimon, K., Kurz, T. B., Mathes, P. G., Shih, M., et al. (2010). Effec-tiveness of a supplemental early reading intervention scaled up in multiple schools.Exceptional Children, 76(4), 394–416.
Dickinson, D., & Tabors, P. O. (2001). Beginning literacy with language. Baltimore, MD:Brookes.
Duncan, G. J., & Magnuson, K. A. (2003). Off with Hollingshead: Socioeconomic resources,parenting, and child development. InM. H. Bornstein, & R. H. Bradley (Eds.), Socioeco-nomic status, parenting, and child development (pp. 83–106). Mahwah, NJ: LawrenceErlbaum Associates.
Elbro, C., & Scarborough, H. S. (2003). Early identification. In P. Bryant, & T. Nunes (Eds.),Handbook of children's reading (pp. 361–381). Dordrech: Kluwer Academic Publishing.
Elementary and Secondary Education Act (2002). (Amended as No Child Left Behind,2002). Pub. L. 107-110, 115. Stat., 1425 Retrieved from http://www2.ed.gov/policy/elsec/leg/esea02/index.html.
Ferguson, R. F. (2002). Why racial integration and other policies since Brown v. Board ofEducation have only partially succeeded at narrowing the achievement gap. In T.Ready, C. Edley, & C. Snow (Eds.), Achieving high standards for all (pp. 183–217).Washington, DC: National Academy Press.
Ferguson, J. L., & Ready, D.D. (2011). Expanding notions of social reproduction: Grandpar-ents' educational attainment and grandchildren's cognitive skills. Early ChildhoodResearch Quarterly, 26(2), 216–226.
Foorman, B. R., Francis, D. J., Winikates, D., Mehta, P., Schatschneider, C., & Fletcher, J. M.(1997). Early interventions for children with reading disabilities. Scientific Studies ofReading, 1(3), 255–276.
Fowler, F. J., Jr., & Mangione, T. W. (1990). Standardized survey interviewing: Minimizinginterviewer-related error. Newbury Park, CA: Sage Publications, Inc.
Hauser, R. M. (1994). Measuring socioeconomic status in studies in studies of child devel-opment. Child Development, 65, 1541–1545. http://dx.doi.org/10.2307/1131279.
Havenman, R., & Wolfe, B. (1995). The determinants of children's attainments: A reviewof methods and findings. Journal of Economic Literature, 33, 1829–1878.
Hollingshead, A. B. (1975). Four factor index of social status. Unpublished manuscript.Department of Sociology, Yale University, New Haven, CT. Retrieved from http://www.yale.edu/sociology/faculty/docs/hollingshead_socStat4factor.pdf
Individuals with Disabilities Education Improvement Act of 2004, Pub. L. No. 108–446,118 Stat. 2647 (2004).
Individuals with Disabilities Education Improvement Act of 2004, Pub. L. No. 108-446,Part B Regulations (2006).
Jeynes,W. H. (2002). The challenge of controlling for SES in social science and educationalresearch. Educational Psychology Review, 14(2), 205–221 (G).
Kieffer, M. J. (2012). Before and after third grade: Longitudinal evidence for the shiftingrole of socioeconomic status in reading growth. Reading and Writing, 25,1725–1746. http://dx.doi.org/10.1007/s11145-011-9339-2.
Lee, V. E., & Burkam, D. T. (2002). Inequality at the starting gate: Social backgrounddifferences in achievement as children begin school. Washington, D.C.: Economic PolicyInstitute.
Lewis-Beck, M. S. (1980). Applied regression: An introduction. Newbury Park, CA: Sage.Lindo, E. J. (2007). Does socioeconomic status play a role in the reading comprehension per-
formance of students in the elementary grades? Vanderbilt University, Nashville, TN:Unpublished manuscript.
Lubienski, S. T., & Crane, C. C. (2010). Beyond free lunch: Which family backgroundmeasures matter? Education Policy Analysis Archives, 18(11) (Retrieved [10/13/12],from http://epaa.asu.edu/ojs/article/view/756).
Lynch, J. (2002). Parents' self-efficacy beliefs, parents' gender, children's reader self-perceptions, reading achievement and gender. Journal of Research in Reading, 25(1),54–67. http://dx.doi.org/10.1111/1467-9817.00158.
MacGinitie, W. H., MacGinitie, R. K., Maria, K., & Dreyer, L. G. (2000). Gates-MacGinitiereading tests (4th ed.). Itasca, IL: Riverside Publishing.
McDill, E. L., & Natriello, G. (1998). The effectiveness of the Title I CompensatoryEducation Program: 1965–1997. Journal of Education for Students Placed at-risk,3(4), 317–335. http://dx.doi.org/10.1207/s15327671espr0304_3.
Nation, K., Cocksey, J., Taylor, J. S. H., & Bishop, D.V. M. (2010). A longitudinal investigationof early reading and language skills in children with poor reading comprehension.The Journal of Child Psychology and Psychiatry, 51(9), 1031–1039. http://dx.doi.org/10.111/j.1469-7610.2010.02254.x.
National Center for Educational Statistics (2011). The Nation's Report Card: Reading 2011(NCES 2012–457). Institue of Educational Sciences, U.S. Washington, D.C.: Departmentof Education.
Oakes, J. M., & Rossi, P. H. (2003). The measurement of SES in health research: Currentpractice and steps toward a new approach. Social Science and Medicine, 56,769–784. http://dx.doi.org/10.1016/S0277-9536(02)00073-4.
Petrill, S. A., Deater-Deckard, K., Schatschneider, C., & Davis, C. (2005). Measuringenvironmental influences on early reading: Evidence from an adoptionstudy. Scientific Studies of Reading, 9(3), 237–259. http://dx.doi.org/10.1207/s1532799xssr0903_4.
293E.J. Lindo / Learning and Individual Differences 32 (2014) 287–293
Scheerens, J., & Bosker, R. (1997). The foundations of educational effectiveness. New York:Pergamon.
Sirin, S. R. (2005). Socioeconomic status and academic achievement: A meta-analytic re-view of research. Review of Educational Research, 75(3), 417–453. http://dx.doi.org/10.3102/00346543075003417.
Snow, C., Barnes, W. S., Chandler, J., Goodman, I. F., & Hemphill, L. (1991). Unfulfilled expec-tations: Home and school influences on literacy. Cambridge, MA: Harvard University Press.
Snow, C. E., Porche, M. V., Tabors, P. O., & Harris, S. R. (2007). Is literacy enough? Pathwaysto academic success for adolescents. Baltimore, MD: Brookes Publishing.
Torgesen, J. K., Wagner, R. K., & Rashotte, C. A. (1999). Test of Word Reading Efficiency(TOWRE). Austin, TX: PRO-ED.
Wagner, R. K., Torgesen, J. K., & Rashotte, C. A. (1999). Comprehensive test of phonologicalprocesses. Austin, TX: PRO-ED.
Wechsler, D. (1999).Wechsler Abbreviated Scale of Intelligence. San Antonio, TX: HartcourtAssessment.
Weinstein,M. G., Stiefel, L., Schwartz, A. E., & Chalico, L. (2009). Does Title I increase spendingand improve performance? Evidence from New York City. Unpublished manuscript,Institute for Education and Social Policy, New York University, New York: NY.
White, K. R. (1982). The relation between socioeconomic status and academic achieve-ment. Psychological Bulletin, 91(3), 461–481. http://dx.doi.org/10.1037//0033-2909.91.3.461.
Wonderlic, C. (2000). Wonderlic Personnel Test. Libertyville, IL: Wonderlic, Inc.Yell, M. L., Shriner, J. G., & Katsiyannis, A. (2006). Individuals with disabilities ed-
ucation improvement act of 2004 and IDEA regulations of 2006: Implicationsfor educators, administrators, and teacher trainers. Focus on ExceptionalChildren, 39(1), 1–24.
Dr. Endia Lindo is an Assistant Professor of Special Education at the University ofNorth Texas. Her research focus revolves around improving the reading perfor-mance of students at risk for reading failure in the elementary and middle grades.Of particular interest are approaches to teaching reading comprehension, and thesocial and familial factors that predict student's responsiveness to generally effec-tive instruction.