Embed Size (px)
Citation preview
Families First Universal Screeningin Manitoba
Lessons Learned in Manitoba
Mariette Chartier, Ph.D., Healthy Child ManitobaEarly Development Imperative Conference, Nov 17, 2009

Overview of Presentation
• Measuring ECD in Manitoba• Families First Universal Screening at
Birth• Results from Universal Screening

Acknowledgements
• Public Health Nurses• Healthy Child Manitoba Team
– Teresa Mayer– Andrea Friesen– Heather Shaffer– Jill Isbister– Leanne Boyd– Dr. Rob Santos– Jan Sanderson
• Healthy Child Committee of Cabinet

• All (almost) mothers who deliver a baby in hospital receive a visit from a public health nurse (PHN)
• PHNs engage families in a dialogue about supports and challenges forthe family in raising their new child and screen for 38 risk factors (eg. Premature baby, pregnancy or labour complications, history of mental illness, social isolation, relationship distress, substance use etc.)
• The screen serves a dual purpose: – PHN provides clinical support to families; those needing extra support may be
offered a home visitation program and/or referral to community services– Opportunity for data collection to inform policy and programming decisions
• In 2003, detailed follow-up questions were added to the screen if a woman identified alcohol use during pregnancy.
Universal Screening Process


Increased Awareness of Risk Factors Associated with Poor Child Outcomes
- Maternal Age (and also maternal age at birth of first child)
- Socio-Economic (education, income, employment)
- Mental Health Problems (depression, substance abuse)
- Parental Attachment- Marital Discord- Social Isolation

Family Income and Children’s Vulnerability in Canada (ages 0-11), 1998/99
Source: National Longitudinal Survey of Children and Youth, 1998/99Human Resources Development Canada - Applied Research Branch
421,
000
338,
000
290,
000
246,
000
36%
29%25%
21%
Although the largest proportion of vulnerable children are in low-income families, the largest number of vulnerable
(838,000 of 1.26 million) children are from middle- to high-income families. Providing programs only to low-income
families would miss 67% of children that need them.

Manitoba Centre for Health Policy (MCHP)
Population-Based Research
Registry
Hospital
Home Care
Pharmaceuticals
Immunize Vital Statistics
Costs
Nursing Home
Physician
FamilyServices Education
Key health databases start in 1970
Census Data at area level National surveys
Healthy Child Program Data

Manitoba Centre for Health PolicyFamilies First Evaluation Report
(using 2000-2002 data)
- Of all babies born in hospital, 76% had been screened. - Families not screened were more vulnerable than
families that were screened.- The agreement between items on the Families First
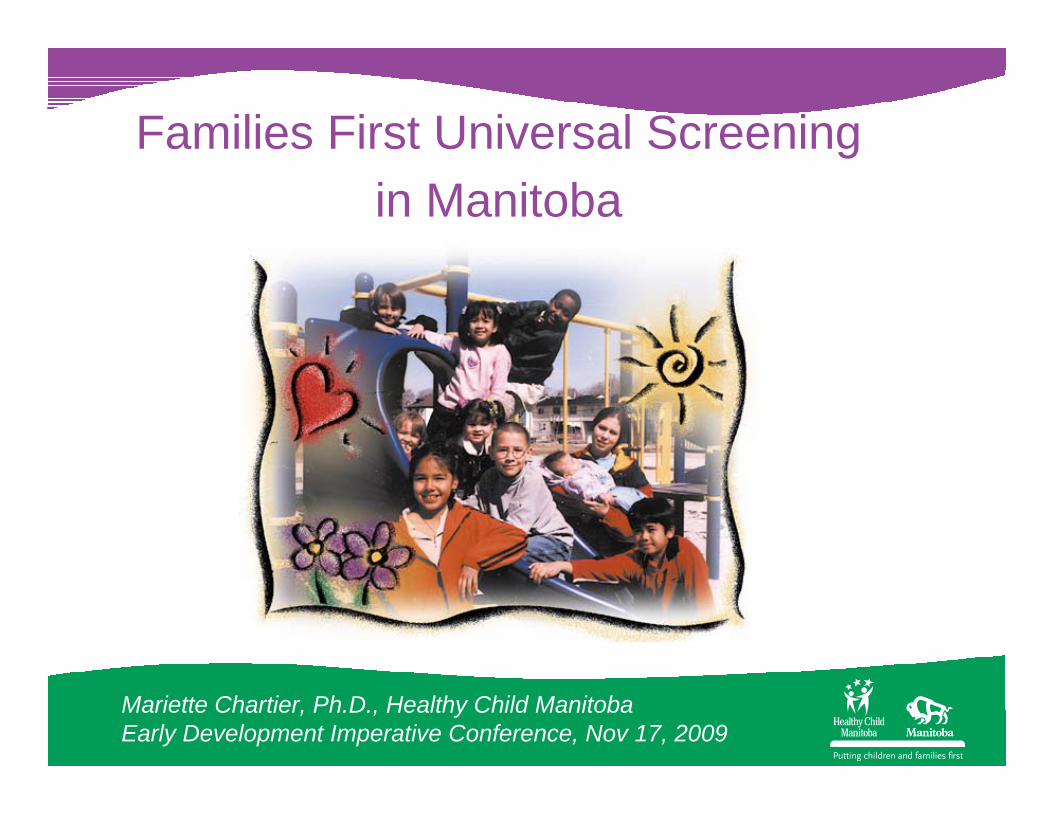
screening and administrative data was mostly high.- Sensitivity – 77% - Specificity – 83%
Note: Screening is now up to 85% of all births
Manitoba Centre for Health Policy, 2007
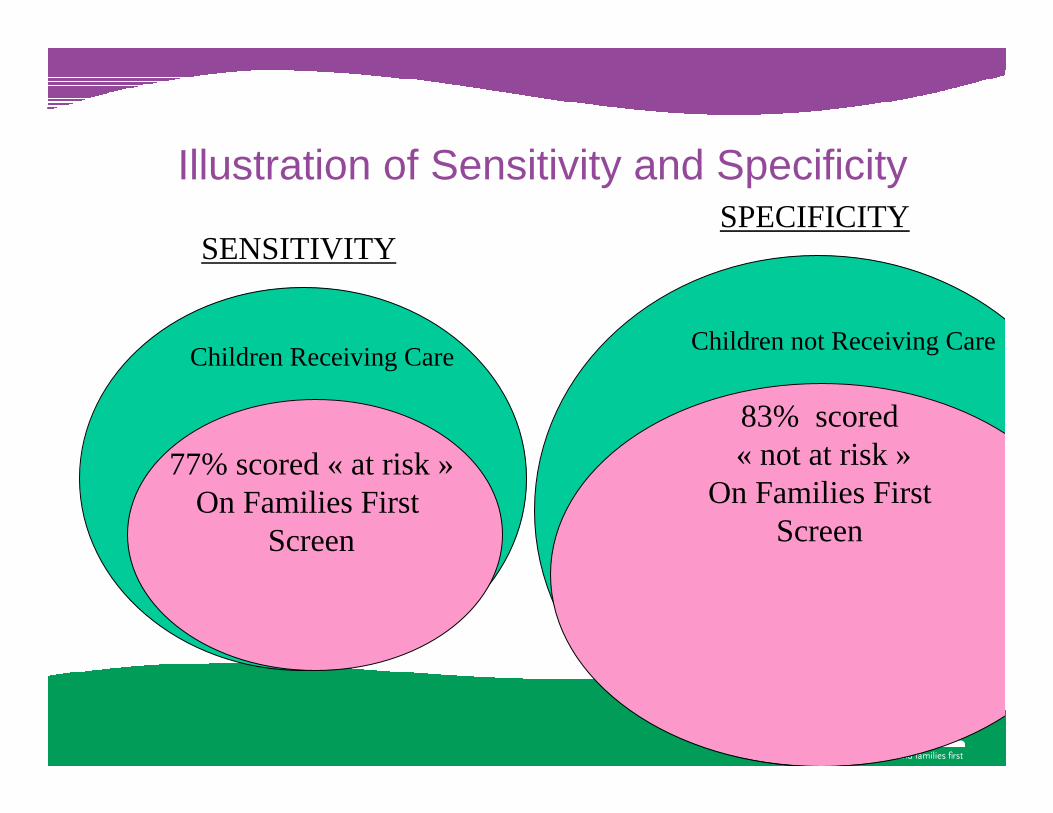
Illustration of Sensitivity and Specificity
Children Receiving Care
77% scored « at risk »On Families First
Screen
Children not Receiving Care
83% scored« not at risk »
On Families FirstScreen
SENSITIVITYSPECIFICITY

“Empirical evidence can tell us HOW to do an intervention…
The HOW will be a variety of strategies determined by the specific needs and characteristics of the population being served and community in which they live.”
Daro, D. (2005) Letter to the Editor, Child Abuse and Nelgect, 29
Having 3 or more Risk Factors
With every risk factor in the child’s environment there isgreater risk of poor childdevelopment
« There is no point beyond which services for children are hopeless… everyrisk factor we can reducematters » Appleyard et al. 2008
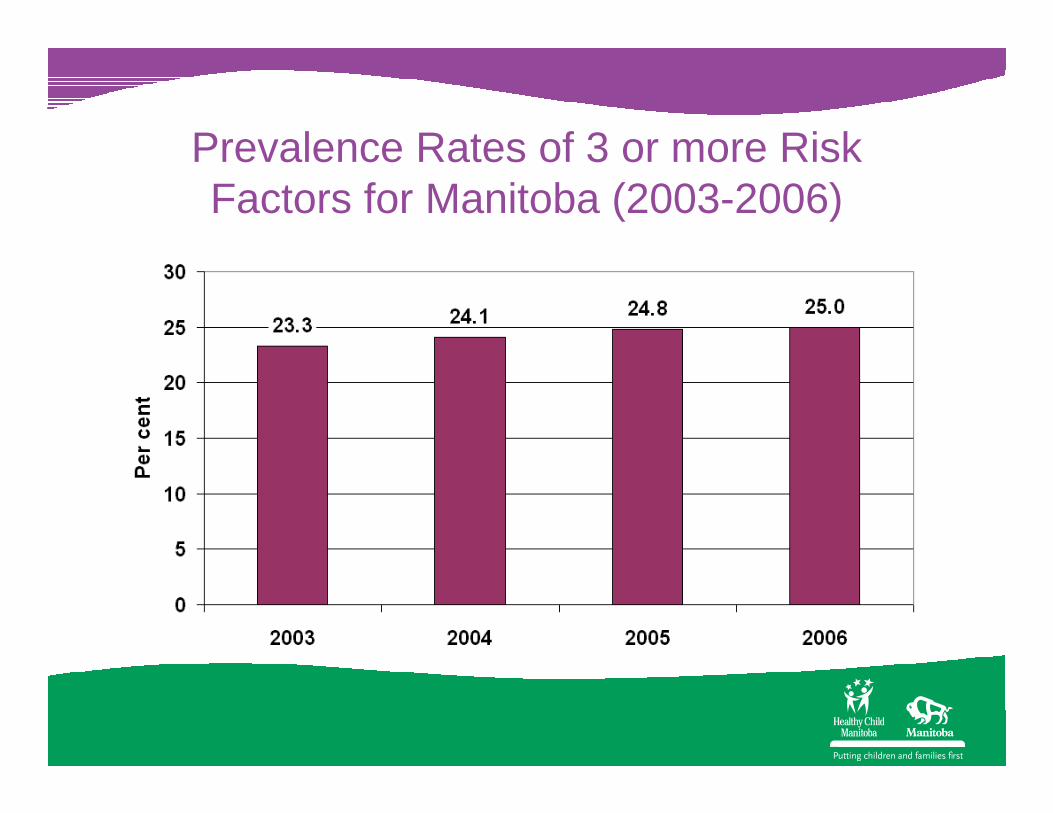
Prevalence Rates of 3 or more Risk Factors for Manitoba (2003-2006)

Prevalence Rates of 3 or more Risk Factors by Regional Heath Authority (RHA)

Figure 1. Prevalence Rates of Three or More Risk Factors 2003-2006 By Region
24.6
44.6
21.5 21.2
26.5
35.3
6,301
836
3,447
0
5
10
15
20
25
30
35
40
45
50
Winnipeg Southern Northern
Per c
ent
0
1,000
2,000
3,000
4,000
5,000
6,000
7,000
Cou
nt
Actual per centAdjusted per centNumber of births
Maternal Smoking During Pregnancy

Prevalence Rates of Smoking During Pregnancy for Manitoba (2003-2006)

Figure 3. Prevalence Rates of Smoking During Pregnancy 2003-2006 By Region
21.5
41.1
17.7 17
21.6
34.8
5,308
762
2,785
0
5
10
15
20
25
30
35
40
45
Winnipeg Southern Northern
Per c
ent
0
1,000
2,000
3,000
4,000
5,000
6,000
Cou
nt
Actual per centAdjusted per centNumber of births

Social Assistance or Financial Difficulties
- On social assistance or income support.- Financial difficulties are defined as having insufficient monies available to meet basic needs after meeting financial commitments.

Prevalence Rates of Social Assistance or Financial Difficulties
for Manitoba (2003-2006)

Prevalence Rates of Social Assistance or Financial Difficulties by RHA

Teenage PregnancyMother was less than 18 years old
at birth of child

Prevalence Rates Teenage Pregnancy for Manitoba (2003-2006)

Figure 4. Prevalence Rates of Teenage Mothers 2003-2006 By Region
2.8
5.1
1.6259
703
96
0
1
2
3
4
5
6
Winnipeg Southern Northern
Per c
ent
0
100
200
300
400
500
600
700
800
Cou
nt
Actual per centNumber of births

Premature Births
- Child was born at less than 37 weeks gestation.

Prevalence Rates of Premature Births for Manitoba 2003-2006

Prevalence Rates of Premature Births by RHA

Maternal Depression & Anxiety
- Public Health Nurse has knowledge of professional diagnosis. - This is sometimes determined by noting medication use.
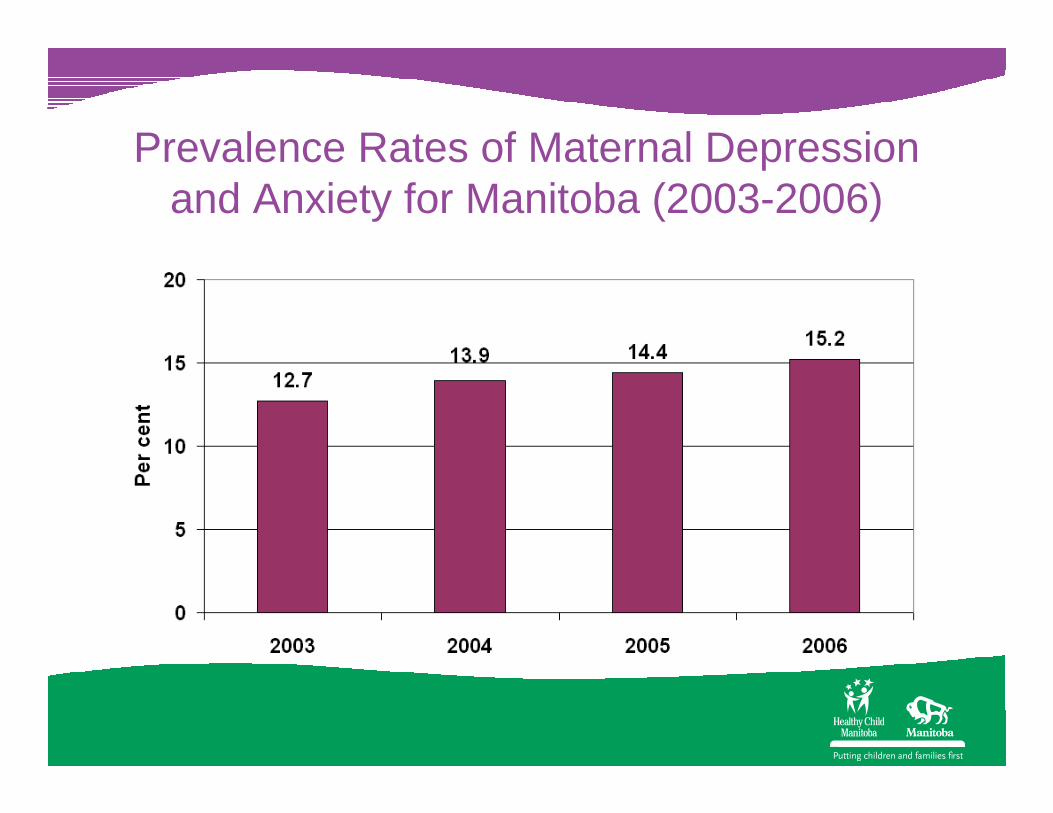
Prevalence Rates of Maternal Depression and Anxiety for Manitoba (2003-2006)
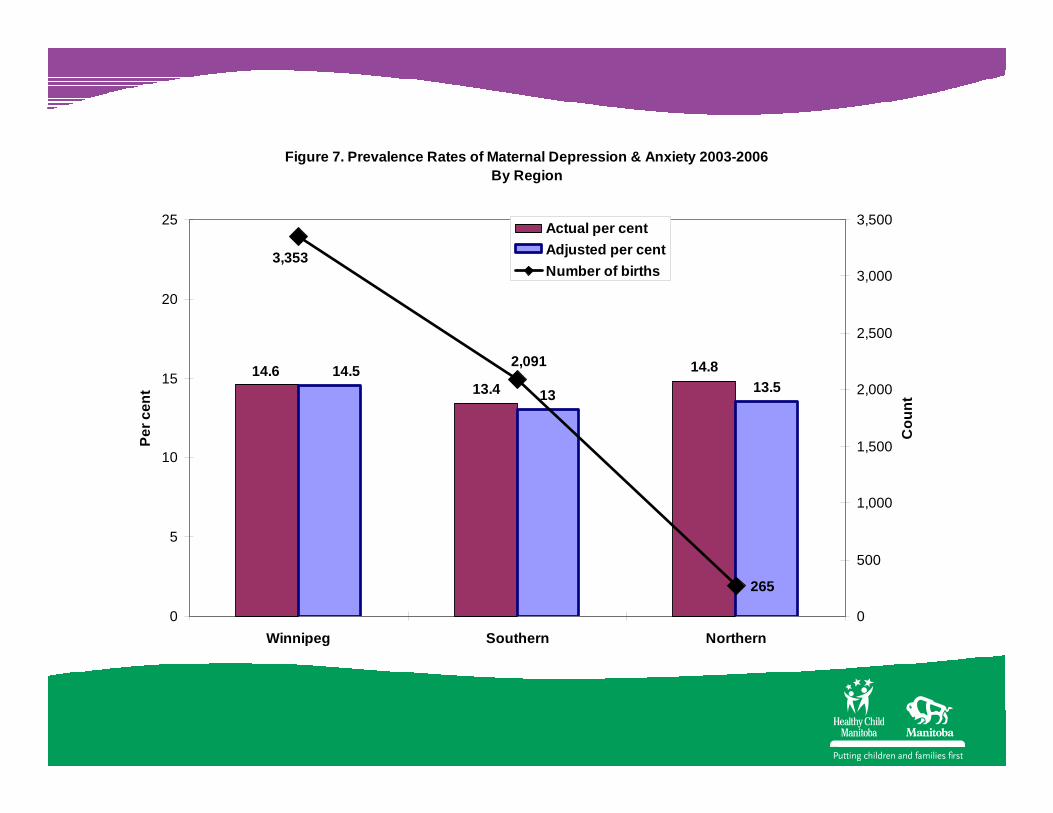
Figure 7. Prevalence Rates of Maternal Depression & Anxiety 2003-2006 By Region
13.414.814.6
1314.5
13.5
265
3,353
2,091
0
5
10
15
20
25
Winnipeg Southern Northern
Per c
ent
0
500
1,000
1,500
2,000
2,500
3,000
3,500
Cou
nt
Actual per centAdjusted per centNumber of births

Family Social Isolation
- Mother says she has no support. - Isolation can also be due to culture, language or geography.

Prevalence Rates of Social Isolationfor Manitoba (2003-2006)

Figure 8. Prevalence Rates of Maternal Social Isolation 2003-2006 By Region
4.5
6.36.0
5.1
4.3
5.8
111
1,032936
0.0
1.0
2.0
3.0
4.0
5.0
6.0
7.0
Winnipeg Southern Northern
Per c
ent
0
200
400
600
800
1,000
1,200
Cou
nt
Actual per centAdjusted per centNumber of births

Alcohol Use During Pregnancy
Every mother is asked about her alcohol use during pregnancy.

Prevalence Rates of Alcohol Use During Pregnancy for Manitoba 2003-2006

Figure 2. Prevalence Rates of Alcohol Use During Pregnancy 2003-2006 By Region
11.913.2
24.2
13.512.5
20.5
446
2,860
2,068
0
5
10
15
20
25
30
Winnipeg Southern Northern
Per c
ent
0
500
1,000
1,500
2,000
2,500
3,000
3,500
Cou
nt
Actual per centAdjusted per centNumber of births
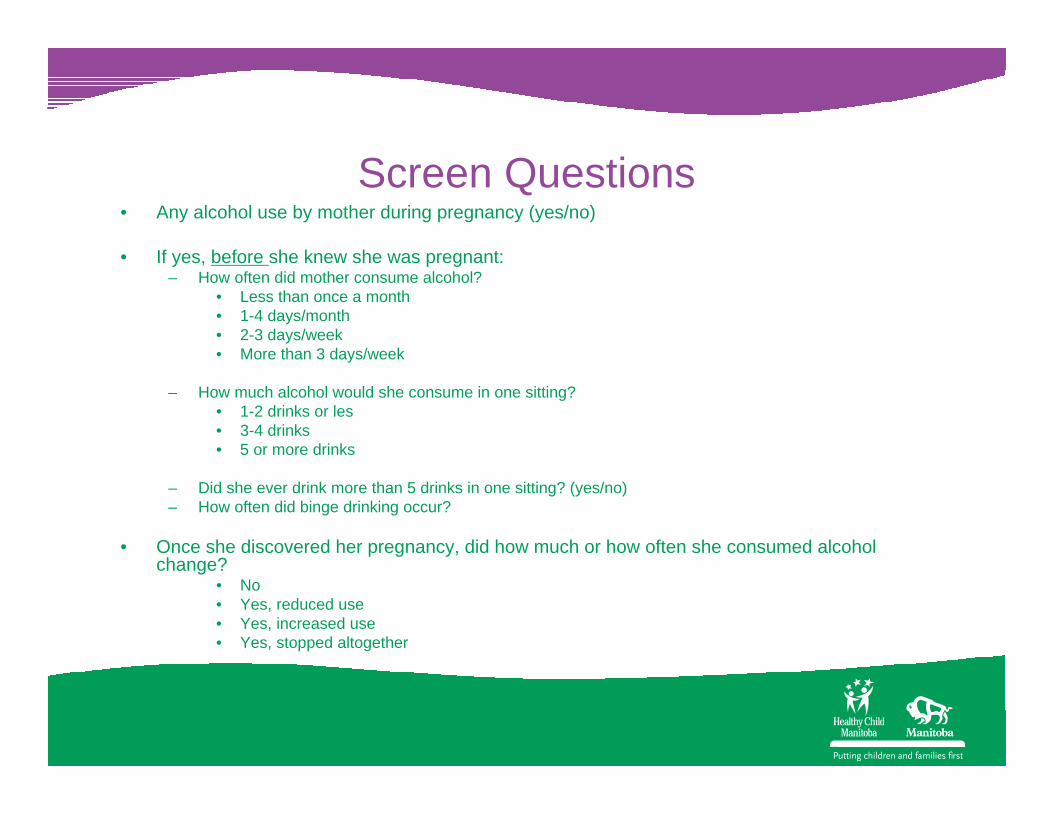
Screen Questions• Any alcohol use by mother during pregnancy (yes/no)
• If yes, before she knew she was pregnant:– How often did mother consume alcohol?
• Less than once a month• 1-4 days/month• 2-3 days/week• More than 3 days/week
– How much alcohol would she consume in one sitting?• 1-2 drinks or les• 3-4 drinks• 5 or more drinks
– Did she ever drink more than 5 drinks in one sitting? (yes/no)– How often did binge drinking occur?
• Once she discovered her pregnancy, did how much or how often she consumed alcohol change?
• No• Yes, reduced use• Yes, increased use• Yes, stopped altogether

Frequency of alcohol useAmong women who reported using alcohol during
prenatal period
47%43%
6% 4%

Alcohol consumed at one sittingAmong women who reported using alcohol
during prenatal period
50%
23%
27%
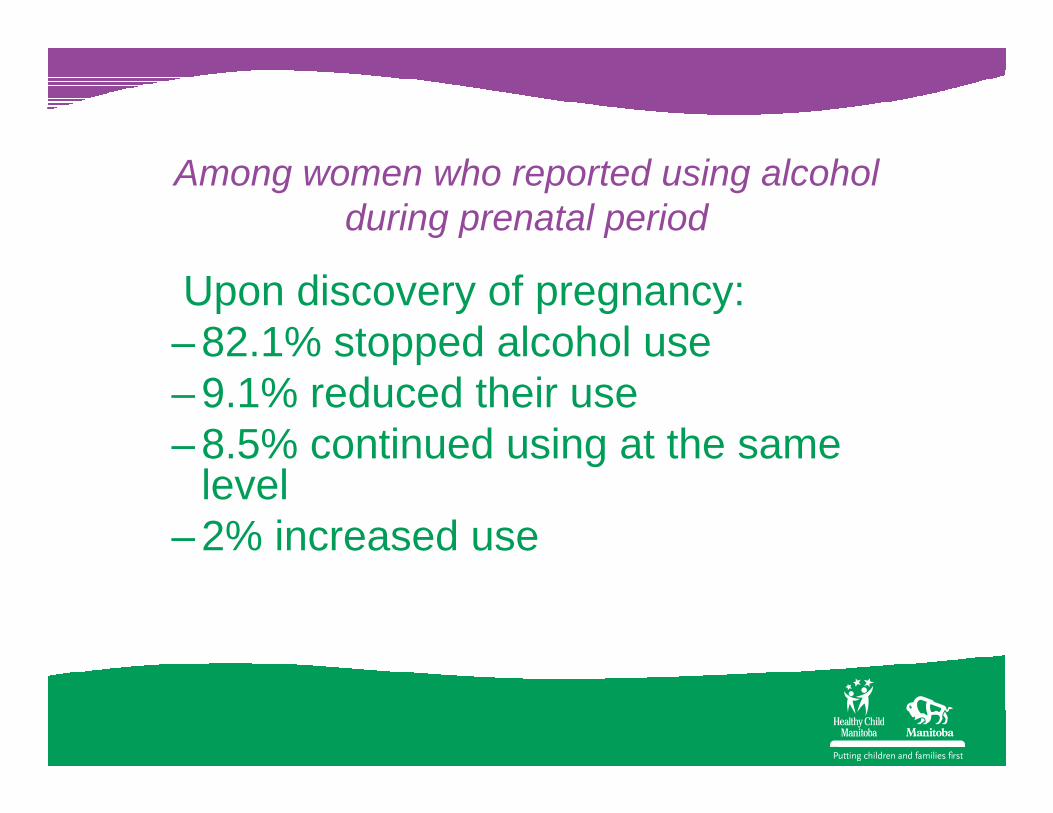
Among women who reported using alcohol during prenatal period
Upon discovery of pregnancy:– 82.1% stopped alcohol use– 9.1% reduced their use– 8.5% continued using at the same
level– 2% increased use

Summary: risk factors experienced by “high-risk” users
50.547.8
29.525.5
23.621.7 20.4
0
10
20
30
40
50
60
finan
cial d
ifficu
lties
no h
igh sc
hool
depr
essio
n
drug
use
abus
e hist
ory
relat
ionsh
ip dis
tress
adole
scent
pare
nt
Per
cen
tag
e

Strengths• Screen is administered by public health nurses
– Viewed as trusted professionals – Have professional training on discussing sensitive topics
with women– Receive ongoing training in the administration of the alcohol
use questions• Screen universally applied• Screening process is accepted and embedding in Manitoba
nursing practice (eg. There is buy-in)• Response rate to the alcohol use questions of those screened is
94% - excellent! • Ability to link with other risk factor data (eg: alcohol use)

Limitations
• Not all women are screened. Those missed are:– women living in First Nation reserve communities– extremely vulnerable women
• Some questions have higher missing values than others. Some nurses remain uncomfortable discussing some topics, other pressing issues may take precedence during the visit, other people in the home may limit the appropriateness of some questions (eg. Intimate partner violence)
• The detailed alcohol questions were revised in 2007, so results are still preliminary
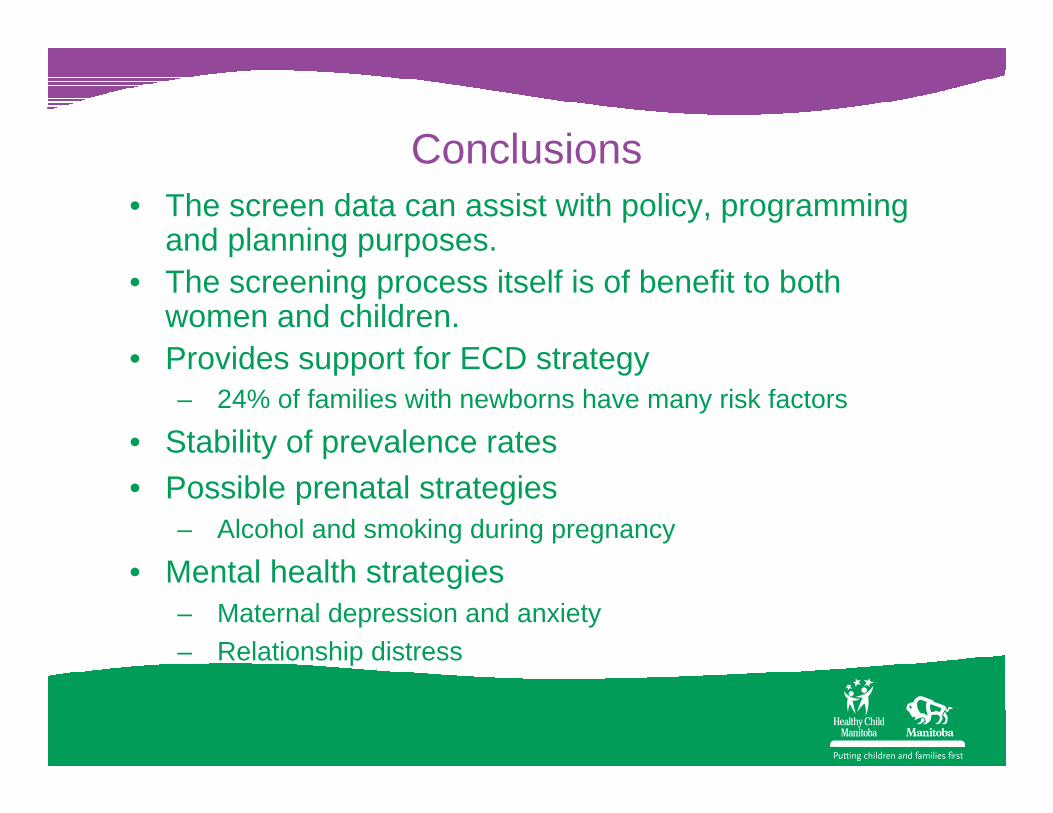
Conclusions• The screen data can assist with policy, programming
and planning purposes. • The screening process itself is of benefit to both
women and children. • Provides support for ECD strategy
– 24% of families with newborns have many risk factors
• Stability of prevalence rates• Possible prenatal strategies
– Alcohol and smoking during pregnancy
• Mental health strategies – Maternal depression and anxiety– Relationship distress