Embed Size (px)
Citation preview
whose son Robert Stevenson (1772± 1850) wasThomas Stevenson’s father. The story of the ori-gins and building of the Scottish lighthouses,mostly by successive members of the Stevensonfamily in their roles as Chief Engineer to theNorthern Lighthouse Board of Scotland, is mar-vellously told in The lighthouse Stevensons by BellaBathurst. It has to be said that there is littlemeteorology as such, but an abundance of wildweather in the story of the construction of,amongst others, the Bell Rock and MuckleFlugga lighthouses. It is a fascinating story of theemergence of engineering as a discipline and itspractical application to the safety of seafarersaround the highly dangerous coasts of Scotland.
This little book provides lots of human detail tothe family story and fills in the backgroundbehind Thomas Stevenson. To my amazement,however, his practical application of engineeringsense realised in the Stevenson screen (as itbecame known, and which is still used today intens of thousands of locations throughout theworld) does not even merit a mention! But it’s avery good read, nonetheless ± highly recom-mended.
Stephen BurtStratfield Mortimer,West Berkshire
Books received
The following books were received by Weather. A fullreview will not be published but some details are givenbelow.
Agro-meteorological modelling ± principles, data andapplications edited by Nicholas M. Holden, pub-
lished by the Joint Working Group on AppliedAgricultural Meteorology, Dublin, 2001, 254 pp.,ISBN 0 951155 17 2, provides an explanation ofthe principles of scientific modelling, an overviewof useful tools, information on available data, andillustrations of some of the ideas presented withpractical examples from Irish research.
Under the whirlwind by Arjen and Jerrine Verkaik,published by Whirlwind Books, Elmwood,Ontario, Canada, second edition 2001, 224 pp.,£18.99 (paperback), ISBN 0 9681537 4 7, is sub-titled ` Everything you need to know about torna-does but didn’ t know who to ask’’. The firstedition was reviewed in Weather, February 1998,p. 60. This edition is available from GazelleBooks (tel: 01524 68765, www.gazellebooks.co.uk).
Science into policy: Global lessons from Antarctica byPaul Arthur Berkman, published by AcademicPress, 2002, xxv+252 pp., £39.95 (hardback),ISBN 0 12 091560 X, reveals a unique model forintegrating earth system science with environmen-tal and resource policies to balance economic, gov-ernmental, and societal interests. Beyond merelypresenting information, this book integrates con-tent and concepts in a manner that will appeal toindividuals with interests in the natural and thesocial sciences.
Statistical analysis in climate research by Hans vonStorch and Francis W. Zwiers, published by Cam-bridge University Press, 2002, x+484 pp., £32.95(paperback), ISBN 0 521 01230 9, is written tohelp the climatologist understand the basic pre-cepts of the statistician’s art and to provide someof the background needed to apply statisticalmethodology correctly and usefully.
Letters to the EditorReaders are encouraged to submit letters by e-mailto: [email protected]. Letters sent bypost should be typed on one side of the page only.The Editor reserves the right to edit any letter toconform to house style and/or fit available space.
The twenty-first century?
As part of last year’s Symons Memorial Lecture, Itried to make the point, somewhat light-heartedly,that whilst in the twentieth century, new universityrecruits to the Met Office were often loath to dirtytheir hands with industrial’ applications, in thetwenty-first century, such graduates are often
quite excited by the prospect of working on com-mercial utilisation of weather and climate fore-casts. No doubt some of this has arisen from theapparent glamour of the recently developedweather derivative market. To illustrate this appar-ent change of attitude, I showed a series of car-toons (opposite) of typical’ twentieth- andtwenty-first-century graduate recruits, and ima-gined what they were thinking the night beforetheir postings-board interview (notwithstandingthe fact that such boards no longer exist!). Eachhas a `dream’ and a `nightmare’ scenario. Anumber of people came up to me after the talkand urged me to include the cartoons in thewrite-up of the paper. I am grateful to Weather forallowing me to present them here instead. Mythanks to Rob Hine for the excellent artwork.
ECMWF, Reading Tim Palmer
Weather Vol. 57 June 2002
226

227
Weather Vol. 57 June 2002
Summer weather on Snowdon
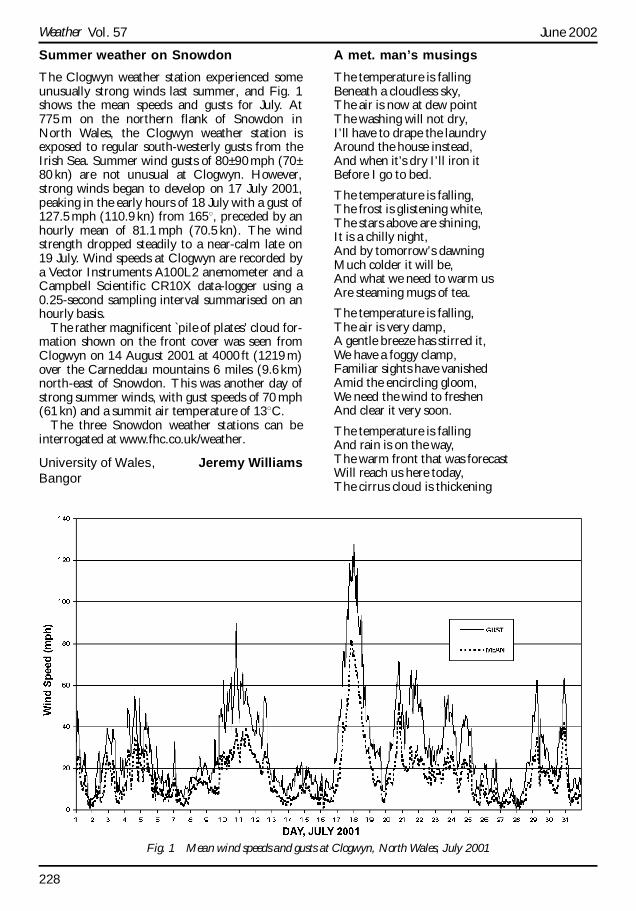
The Clogwyn weather station experienced someunusually strong winds last summer, and Fig. 1shows the mean speeds and gusts for July. At775m on the northern flank of Snowdon inNorth Wales, the Clogwyn weather station isexposed to regular south-westerly gusts from theIrish Sea. Summer wind gusts of 80± 90mph (70±80 kn) are not unusual at Clogwyn. However,strong winds began to develop on 17 July 2001,peaking in the early hours of 18 July with a gust of127.5mph (110.9 kn) from 1658, preceded by anhourly mean of 81.1 mph (70.5 kn). The windstrength dropped steadily to a near-calm late on19 July. Wind speeds at Clogwyn are recorded bya Vector Instruments A100L2 anemometer and aCampbell Scientific CR10X data-logger using a0.25-second sampling interval summarised on anhourly basis.
The rather magnificent `pile of plates’ cloud for-mation shown on the front cover was seen fromClogwyn on 14 August 2001 at 4000ft (1219m)over the Carneddau mountains 6 miles (9.6km)north-east of Snowdon. This was another day ofstrong summer winds, with gust speeds of 70 mph(61kn) and a summit air temperature of 138C.
The three Snowdon weather stations can beinterrogated at www.fhc.co.uk/weather.
University of Wales, Jeremy WilliamsBangor
A met. man’s musings
The temperature is fallingBeneath a cloudless sky,The air is now at dew pointThe washing will not dry,I’ ll have to drape the laundryAround the house instead,And when it’s dry I’ ll iron itBefore I go to bed.
The temperature is falling,The frost is glistening white,The stars above are shining,It is a chilly night,And by tomorrow’s dawningMuch colder it will be,And what we need to warm usAre steaming mugs of tea.
The temperature is falling,The air is very damp,A gentle breeze has stirred it,We have a foggy clamp,Familiar sights have vanishedAmid the encircling gloom,We need the wind to freshenAnd clear it very soon.
The temperature is fallingAnd rain is on the way,The warm front that was forecastWill reach us here today,The cirrus cloud is thickening
Fig. 1 Mean wind speeds and gusts at Clogwyn, North Wales, July 2001
Weather Vol. 57 June 2002
228
To stratus very soon,I’m sure it will be rainingBy early afternoon.
The temperature is falling,The rain has turned to snow,The roads are very slipperyWhichever way we go,The hills and dales are covered,Whatever shall we do?Retreat into the gardenAnd build a large igloo.
The temperature is risingBeneath a brilliant sun,Its warmth is very hearteningAnd gladdens everyone,The little lambs are gambolling,The birds are singing too,But what this heat is doingIs melting our igloo.
(May be sung to the tune of ` The Church’s onefoundation’’ .)
Twickenham, Arthur DoughtyMiddlesex
Sea-level rise at TuvaluThe news item in the September 2001 issue,regarding the rise in sea-level causing alarm to theislanders of Tuvalu (` Leaving a flooding island’’ ,Weather, 56, p. 286), demonstrates the divergence,so often apparent, between what is hypotheticaland what is empirical regarding climate change.
Despite the accepted statistical evidence ofglobal warming during the past century, particu-larly over the 1980± 2000 period, there has beenno apparent sea-level rise at Tuvalu. In actualfact, there has recently been a reduction whichhas caused local fishermen some difficulty in boathandling and crossing the encircling reef to reachtheir fishing grounds (report by a Tuvalu corre-spondent in the Sunday Telegraph, 6 August2001). This situation has been confirmed by anofficial of the Tuvalu Ministry of NaturalResources, Energy and Environment who haspublicly deplored the exaggerated case use ofTuvalu by some environmentalists to promotetheir political programme (reported in the Globeand Mail, Toronto, 18 November 2001).
Scientific input on this subject, issued by theAustralian National Tidal Facility, Adelaide,which monitors sea-level in the Tuvalu region,shows that the rise in sea-level over the past 22years has been insignificant overall. However,there have been temporary anomalies, as may beexpected due to wind variability occurring during
spring tides and El NinÄ o Southern Oscillationevents.
The erosion of the beaches of Tuvalu by sandremoval for building and construction workseems more likely to be the anthropogenic hazardcausing its sea-level problems than that due toregional climate change in the near future.
M. R. MorganDartmouth,Nova Scotia, Canada
Dust rain in Essex, 2 May 2001I refer to the letter by Charlie Davison and reply byGeoff Monk in the October 2001 issue (` Sandfrom the Sahara?’’ , Weather, 56, pp. 381± 382).
That deposits of ` pale, gritty sand’’ were leftunderneath cars following the heavy rain on theday in question is beyond dispute, and Fig. 1shows this clearly. It is also quite possible thatsome dust from the Sahara was transportedtowards the British Isles on the day in question.However, I suggest that the vast majority of thegritty material deposited underneath the vehicleswas present on the vehicles before the heavy rain-fall started, and was simply washed off during thethunderstorm.
I have observed the phenomenon of `dust/gritsilhouettes’ around parked cars during heavy rain-fall on a number of occasions. In my experiencetwo conditions are required for it to occur ± firstly,a moderately dirty car and, secondly, a period ofsteady heavy rainfall lasting an hour or two. Asteady fall of typically 10mm in an hour seems todo the trick ± I expect the threshold would varyaccording to the dirtiness of the cars, and howfirmly the road film/mud was dried on. The dura-tion as well as the intensity of the rain appears tobe important, in that steady rain serves to moistendried-on dirt which is then progressively washedaway by the continued heavy rainfall; steadyheavy rainfall (rather than one or more bursts ofshort-period intense rainfall) probably results inless dispersion of washed-off material by rapidwater drainage, leaving a visible silhouette. (Thephenomenon can be replicated when washing adirty car using a garden hose, provided the car isallowed to drain freely.)
From Mr Davison’s account of a period ofsteady heavy rainfall prior to the observation ofthe deposits underneath the cars, we know thefirst condition was satisfied. As to the dirtiness ofthe cars, we have no direct information but asApril 2001 was cool and wet in Essex, and theeighth consecutive wet month in that district, it isreasonable to assume that cars were more muddythan not.
229
Weather Vol. 57 June 2002
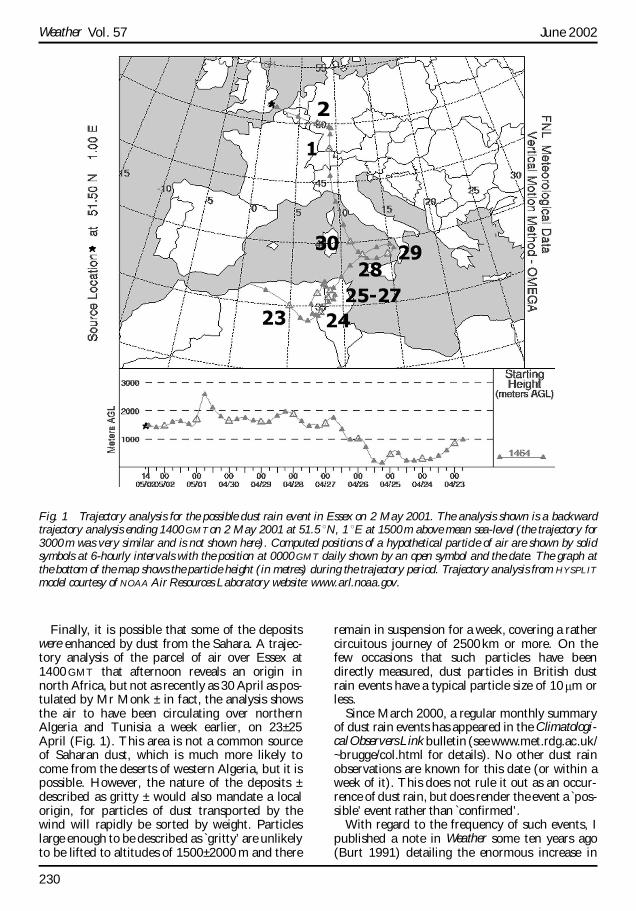
Finally, it is possible that some of the depositswere enhanced by dust from the Sahara. A trajec-tory analysis of the parcel of air over Essex at1400GMT that afternoon reveals an origin innorth Africa, but not as recently as 30 April as pos-tulated by Mr Monk ± in fact, the analysis showsthe air to have been circulating over northernAlgeria and Tunisia a week earlier, on 23± 25April (Fig. 1). This area is not a common sourceof Saharan dust, which is much more likely tocome from the deserts of western Algeria, but it ispossible. However, the nature of the deposits ±described as gritty ± would also mandate a localorigin, for particles of dust transported by thewind will rapidly be sorted by weight. Particleslarge enough to be described as `gritty’ are unlikelyto be lifted to altitudes of 1500± 2000 m and there
remain in suspension for a week, covering a rathercircuitous journey of 2500km or more. On thefew occasions that such particles have beendirectly measured, dust particles in British dustrain events have a typical particle size of 10mm orless.
Since March 2000, a regular monthly summaryof dust rain events has appeared in the Climatologi-calObservers Linkbulletin (seewww.met.rdg.ac.uk/~brugge/col.html for details). No other dust rainobservations are known for this date (or within aweek of it). This does not rule it out as an occur-rence of dust rain, but does render theevent a `pos-sible’ event rather than `confirmed’.
With regard to the frequency of such events, Ipublished a note in Weather some ten years ago(Burt 1991) detailing the enormous increase in
Fig. 1 Trajectory analysis for the possible dust rain event in Essex on 2 May 2001. The analysis shown is a backwardtrajectory analysis ending 1400 GMTon 2 May 2001 at 51.5 8N, 1 8E at 1500m above mean sea-level (the trajectory for3000m was very similar and is not shown here). Computed positions of a hypothetical particle of air are shown by solidsymbols at 6-hourly intervals with the position at 0000 GMT daily shown by an open symbol and the date. The graph atthe bottom of the map shows the particle height (in metres) during the trajectory period. Trajectory analysis from HYSPLIT
model courtesy of NOAA Air Resources Laboratory website: www.arl.noaa.gov.
Weather Vol. 57 June 2002
230
frequency of such events in the British Isles since1977. Only four occasions of `dust rain’ areknown in the 75 years to 1977; since then, the fre-quency of events has increased from two or threeper year in the 1980s and 1990s, to about 20 daysin 2000, and to almost that number in 2001 at thetime of writing (November). Some of this is clearlydue to reporting bias, as more observers becomeaware of the phenomenon, particularly now that achannel exists to report and document thoseobservations; but that the increase is real and dueto changes in circulation patterns is now beyondreasonable doubt. This will form the basis of anupdated paper to Weather, ten years on, to be sub-mitted after the close of 2001 calendar year’s data.
ReferenceBurt, S. (1991) Falls of dust rain within the British
Isles. Weather, 46, pp. 347± 353
Stephen BurtStratfield Mortimer,West Berkshire
Floods in East Anglia – a correctionWith reference to the ` Floods in East Anglia’’news item in the December 2001 issue of Weather(p. 418), I think the dates quoted may be incorrectsince the really heavy rainfall occurred on 21October, not the 22nd and 23rd as stated. In the17-hour period from 0400 to 2100 GMT on 21October a total of 86.9 mm of rainfall wasrecorded at this station. This was attributable totwo `rainfall days’ ± the 20th (51.8 mm) and 21st(35.1 mm). No thunder was heard during thisrainfall. Rainfall was 4.0 mm on the 22nd and1.6mm on the 23rd.
Royston, Richard BarkerHertfordshire
`Falsetto’ thunder and tubular hail
I agree fully with the comments of RichardNicholls in the November 2001 issue (` Unpre-dicted thunderstorms’’ , Weather, 56, p. 414).Even as Michael Fish (I think it was him but Imay be wrong) was speaking at 2230BST on thepossibility of thunderstorms crossing the Channel,lightning was already playing over Wrotham Hill.What followed was probably one of the mostfrightening thunderstorms I have experienced in50+ years. Between 2330 and 0000BST the light-ning and thunder were almost continuous and
close (<500m), causing a local power failure; butthe strangest occurrence of all came at about2350 BST. I can only describe it as a sort of high-pitched (falsetto) thunder, rather like very loud,high-pitched laughter or like an intermittentmechanical saw, lasting about 5 seconds. Thunderrather like loud tearing is not uncommon but thiswas much higher in tone. Could it be due to somesort of unusual atmospheric structure in theimmediate locality at that moment?
Gareth Harvey’s letter in the December issue(` Thunderstorms in Kent, 26 June 2001’’,Weather, 56, pp. 454± 455) reminded me to com-ment on the second incident; 26 June was one ofthe hottest days of the year, the temperaturerising to 32 8C in parts of London. When I gothome to South Darenth at around 2000 BST, thesky was dappled with altocumulus castellanus. At2230 BST (as the weather presenter was mention-ing the possibility of thunder towards dawn) light-ning was already playing around Wrotham Hillradio mast. There were long, booming rolls ofthunder. A slight rain shower came and passed. Iwent to bed. At about midnight a very violentwind came, gusting to about 20ms-1. There wasmore lightning. Then I heard the clatter of hailagainst my window. I looked out at the patio. Thehailstones were up to 2cm in diameter, but therewere also chunks of ice 1cm 6 4 cm, which musthave been fragments of larger stones. Some of thefragments seemed to be hollow tubes. The hailgave way to heavy rain, with almost continuouslightning to the east. The storm passed away atabout 0020BST.
As I was walking to the station the followingmorning I noticed that the ground was strewnwith leaves stripped from the trees. There was aconversation by two men at the station over thefact that their cars had been damaged by golf-ballsize hail. Another mentioned that his roof hadbeen damaged by a freak wind gust. It wouldseem that not much happened west of Swanleyand my London-dwelling colleagues seemed tohave had an uneventful night; but I wonderedwhat sort of process produces tubular hail!
South Darenth, Nick BakerKent
Thunderstorms in Kent
With reference to the letter from Gareth Harvey inthe December 2001 issue (` Thunderstorms inKent, 26 June 2001 (Weather, 56, pp.454± 455), Ithink he may be interested in the storm whichstruck Cranbrook on that day. It was a very hot
231
Weather Vol. 57 June 2002
day on 26 June and my thermometer registered ahigh of 33 8C in the late afternoon; the wind wassouth-westerly, light; lightning was first observedat 2345BST; and the storm lasted about half anhour before moving off. The flashes were veryintense and accompanied by heavy rain, and on
checking my raingauge I found that 9 mm hadbeen recorded.
Cranbrook, E. J. VeryardKent
Weather image
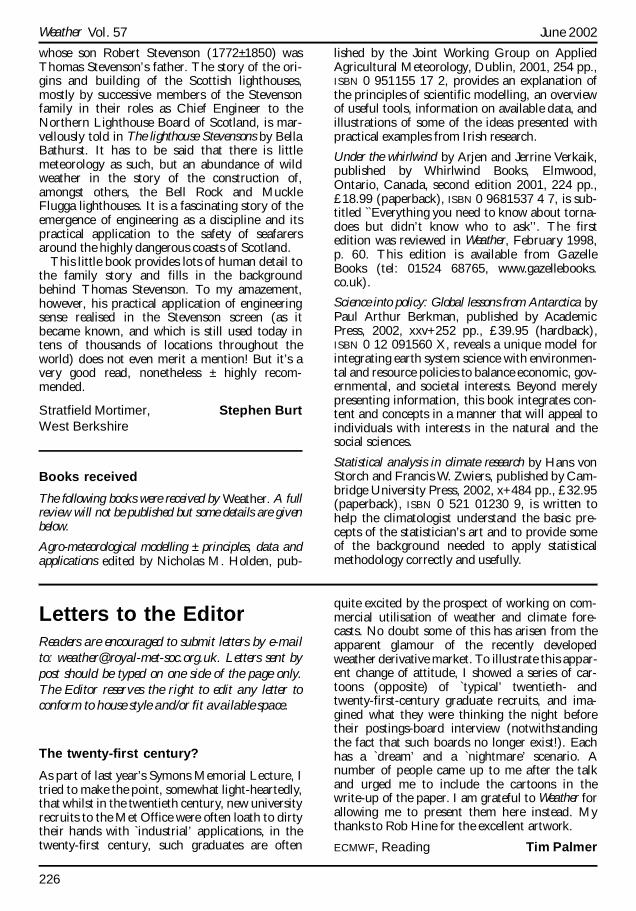
Ships’ trails in a region of cellularconvection in the eastern Atlantic
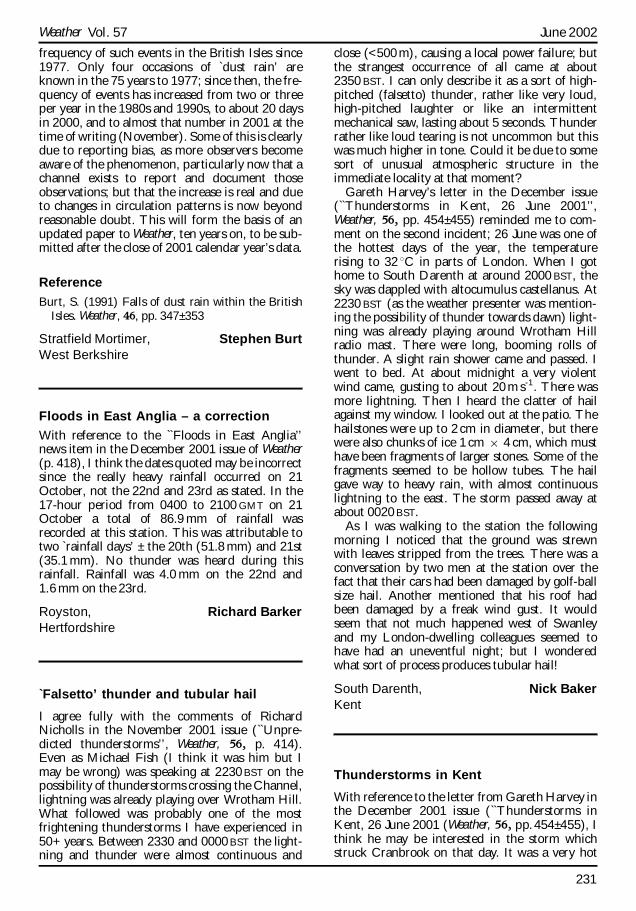
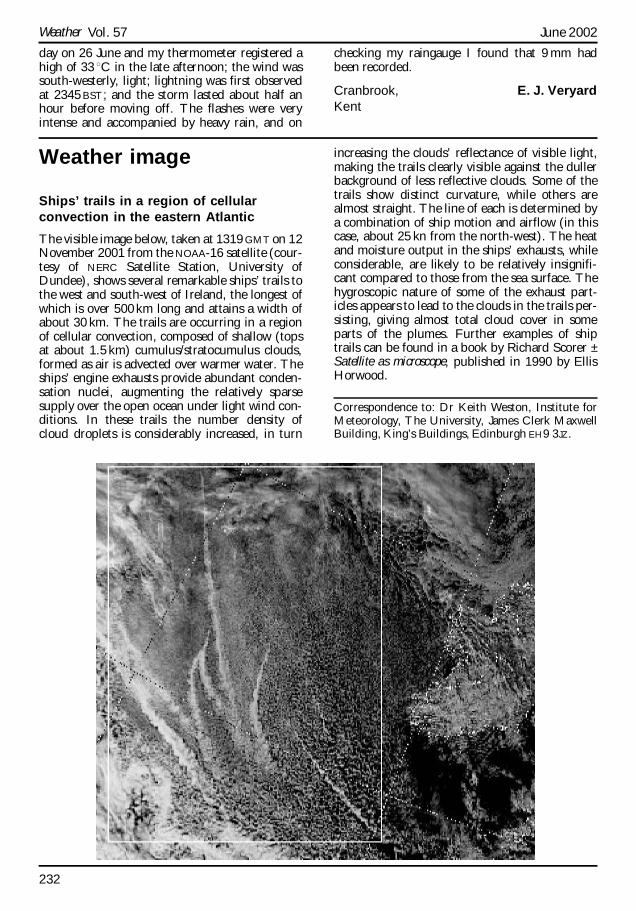
The visible image below, taken at 1319GMTon 12November 2001 from the NOAA-16 satellite (cour-tesy of NERC Satellite Station, University ofDundee), shows several remarkable ships’ trails tothe west and south-west of Ireland, the longest ofwhich is over 500km long and attains a width ofabout 30 km. The trails are occurring in a regionof cellular convection, composed of shallow (topsat about 1.5km) cumulus/stratocumulus clouds,formed as air is advected over warmer water. Theships’ engine exhausts provide abundant conden-sation nuclei, augmenting the relatively sparsesupply over the open ocean under light wind con-ditions. In these trails the number density ofcloud droplets is considerably increased, in turn
increasing the clouds’ reflectance of visible light,making the trails clearly visible against the dullerbackground of less reflective clouds. Some of thetrails show distinct curvature, while others arealmost straight. The line of each is determined bya combination of ship motion and airflow (in thiscase, about 25 kn from the north-west). The heatand moisture output in the ships’ exhausts, whileconsiderable, are likely to be relatively insignifi-cant compared to those from the sea surface. Thehygroscopic nature of some of the exhaust part-icles appears to lead to the clouds in the trails per-sisting, giving almost total cloud cover in someparts of the plumes. Further examples of shiptrails can be found in a book by Richard Scorer ±Satellite as microscope, published in 1990 by EllisHorwood.
Correspondence to: Dr Keith Weston, Institute forMeteorology, The University, James Clerk MaxwellBuilding, King’s Buildings, Edinburgh EH9 3JZ.
Weather Vol. 57 June 2002
232