Embed Size (px)
Citation preview

Methodology – Falls & Fractures Outcomes Framework – v1.1 January 2018 Page 1 of 15
Falls and fractures outcomes framework Indicator methodology for dashboard v1.1 released January 2018
Indicator methodology
General notes All sub-analyses that return a value of four or less, and their corresponding rates, are
suppressed for privacy reasons.
Dollar amounts are rounded to the nearest $100.
Ethnicity data is presented as prioritised ethnic group (Māori, Pacific, Asian and Other). Other
includes unknown ethnicities.
All indicators are for people aged 50+ only, unless otherwise specified.
Data requests Please contact [email protected] to request the data underlying the dashboard.
Feedback We welcome your feedback on the dashboard and the indicator methodology. Please send any
feedback to [email protected].

Methodology – Falls & Fractures Outcomes Framework – v1.1 January 2018 Page 2 of 15
Domain 1: Fewer falls injuries
1a: ACC claims for falls, forecast
Rationale This indicator shows the number and rate of older people who had ACC claims accepted for an injury
caused by a fall. This indicator includes minor injuries through to more serious injuries like fractures
(some of which may result in a hospital admission). ACC claims are made across a range of health care
settings, so this indicator is our broadest available measure of the number of falls among older
people.
Detailed methodology
Description Number and rate of ACC claims due to a fall, forecast vs actual
Current status Implemented in April 2017. Minor changes in January 2018: The national total now includes claims with an unknown DHB, data is available as a rolling twelve-month total, and the forecasting method has been revised.
Numerator Total number of new and accepted ACC claims due to a fall
Denominator Number: None Rate per 1,000 population: Population estimates, smoothed across quarters
Data source(s) ACC; Stats NZ
Collection period Quarterly and rolling twelve months, based on the date of the fall
Inclusions Total accepted new claims from ACC45 form, with a cause of any of the following: - Slipping, Skidding on Foot, - Tripping or Stumbling, - Loss of Consciousness/Sleep, - Something Giving Way Underfoot, - Misjudgement of Support, - Loss Balance/Personal Control
Exclusions This indicator excludes falls that did not result in an ACC claim being made or accepted.
Analysis Sub analysis: - DHB of domicile - Age: 50-64, 65-74, 75-84, 85+ years - Ethnicity: Māori, Pacific, Asian and Other (including unknown) - Gender Forecasts: Forecasts are available at DHB level only, and are calculated from quarterly data points between 2011 and 2015. Quarterly forecasts use Holt-Winters method (AAA). Rolling twelve month forecasts use Holt’s linear method (AAN). The national total is currently calculated as the sum of DHB forecast values.

Methodology – Falls & Fractures Outcomes Framework – v1.1 January 2018 Page 3 of 15
Description Number and rate of ACC claims due to a fall, forecast vs actual
Notes This indicator differs from the HQSC Falls Atlas Indicator 1, as it is counts all new and accepted claims, rather than people with more than one claim only counted once per year.

Methodology – Falls & Fractures Outcomes Framework – v1.1 January 2018 Page 4 of 15
1b: ACC new falls claims by fracture type
Rationale This indicator replicates Indicator 1a, but separates claims for falls by whether they did or did not
result in a fracture. It is assumed that fractures cause more serious harm, and are more likely to lead
to hospital admission, than non-fractures.
Detailed methodology
Description Number and rate of new ACC claims for falls, by fracture type
Current status Implemented in April 2017. Minor changes in January 2018: The national total now includes claims with an unknown DHB, and data is available as a rolling twelve-month total.
Numerator Total number of new and accepted ACC claims due to a fall
Denominator Number: None Rate per 1,000 population: Population estimates, smoothed across quarters
Data source(s) ACC; Stats NZ
Collection period Quarterly, based on the date of the fall
Inclusions Total accepted, new claims from ACC45 form, with a cause of any of the following: - Slipping, Skidding on Foot, - Tripping or Stumbling, - Loss of Consciousness/Sleep, - Something Giving Way Underfoot, - Misjudgement of Support, - Loss Balance/Personal Control
Exclusions This indicator excludes falls that did not result in an ACC claim being made or accepted.
Analysis Sub analysis: - Type of fracture: fracture, non-fracture - Repeat faller: The person making the claim had made another falls claim in the
prior 12 months - DHB of domicile - Age: 50-64, 65-74, 75-84, 85+ years - Ethnicity: Māori, Pacific, Asian and Other (including unknown) - Gender

Methodology – Falls & Fractures Outcomes Framework – v1.1 January 2018 Page 5 of 15
1c: ACC active falls claims cost
Rationale This indicator shows the cost of ACC claims due to a fall. This is a complementary measure to show
impact when viewed alongside outcome data. For ACC it is also a measure of benefit and contribution
to sustaining the wider ACC scheme.
Detailed methodology
Description Cost of active ACC claims due to a fall injury, by claim type
Current status Implemented in October 2017. Minor changes in January 2018: The national total now includes claims with an unknown DHB, and data is available as a rolling twelve-month total.
Numerator Cost (excluding GST) of accepted and active ACC claims due to a fall. Costs are separated into the following groups: - Entitlement claims
Claims considered to cover moderate to serious injuries requiring entitlement beyond medical treatment only. Examples of these payments include compensation for loss of earnings, allowances for attendant care and childcare, provision of wheelchairs and other equipment, and modifications to home and vehicles. Claims are recorded as an entitlement claim if they have previously received an entitlement, at any point in the lifetime of the claim. They did not necessarily receive an entitlement during the corresponding period. The figures are subject to change as some claims which to date have not received an entitlement may do so in the future.
- Medical fees only claims Where ACC has made payments to cover medical treatment costs such as those provided by a GP, physiotherapist or dentist in the period but the client has not received entitlements or Other payments in the period. These claims may be counted as entitlement claims in future periods, if an entitlement is received after medical fees.
- Other claims Claims which have received payments from the category Other (such as death benefits, independence allowances, lump sums or miscellaneous expenses) or both Medical fees and Other payments.
Denominator Rate per 1,000 population: Population estimates, smoothed across quarters
Data source(s) ACC; Stats NZ
Collection period Quarterly and rolling twelve months, based on the date of the payment

Methodology – Falls & Fractures Outcomes Framework – v1.1 January 2018 Page 6 of 15
Description Cost of active ACC claims due to a fall injury, by claim type
Inclusions Costs of accepted claims from ACC45 form. This includes the cost to ACC of all treatment and entitlements incurred for that claim, except for acute care at public hospitals (see exclusions). Cause was any of the following: - Slipping, Skidding on Foot, - Tripping or Stumbling, - Loss of Consciousness/Sleep, - Something Giving Way Underfoot, - Misjudgement of Support, - Loss Balance/Personal Control
Exclusions The cost of emergency treatment at public hospitals is not included, as this is bulk funded. As a result, the costs of emergency treatment are not allocated to individual claims. This indicator does not include falls that did not result in an accepted ACC claim.
Analysis Sub analysis: - Claim type: Entitlement, Medical fees, Other - DHB of domicile - Age: 50-64, 65-74, 75-84, 85+ years - Ethnicity: Māori, Pacific, Asian and Other (including unknown) - Gender

Methodology – Falls & Fractures Outcomes Framework – v1.1 January 2018 Page 7 of 15
Domain 2: Fewer serious harm falls and fractures
2a: Acute falls hospital admissions by fracture type
Rationale This indicator shows the number of hospital admissions for fractured neck of femur (NOF), other
fractures, and non-fractures. This indicator provides further insight into the relative levels of harm of
falls.
Detailed methodology
Description Number and rate of acute/arranged falls hospital admissions, by fracture type
Current status This measure was first implemented in April 2017. Changes in October 2017: Methodology updated to identify stays more consistently with the Ministry of Health’s methodology, and to include stays that started with an acute or arranged admission only. Minor changes in January 2018: Data is available as a rolling twelve-month total, date is now the date of admission rather than the date of discharge, and the national total now includes events with an unknown DHB.
Numerator The number of acute and arranged admissions (stays) to hospital as the result of a fall, by type of injury. Type of fall injury is based on the first event in the stay. Fractured neck of femur: ICD10 code S720* to S722* in diag 1-30 Other fracture: ICD code S*2*, T02* and T12* and excluding fractured neck of femur in diag 1-30 Non-fracture: No fracture code recorded in diag 1-30 Calculating stays Consecutive events, that together make a stay, are calculated with similar methodology to the Ministry of Health’s System Level Measure ‘Acute Hospital Bed Days’. Events are considered part of the same stay if: - The NHI was the same - The previous event had a transfer end type (DA, DF, DO, DP, DT, DW, ET) - The end date of the previous event was prior to or within one day of the next
event
Denominator Number: None Rate per 1,000 population: Population estimates, smoothed across quarters
Data source(s) National minimum dataset (NMDS); Stats NZ
Collection period Quarterly, based on date of admission of the first event in the stay.

Methodology – Falls & Fractures Outcomes Framework – v1.1 January 2018 Page 8 of 15
Description Number and rate of acute/arranged falls hospital admissions, by fracture type
Inclusions Stays included in this measure are those that started with an acute or arranged event (Admission type codes AA, AC, ZA, or ZC). Events that had an external cause code of a fall (W00-W19) that occurred either on or before the event start date.
Exclusions Stays excluded from this measure are those that: - consisted of only non-casemix events (EXCLU purchase unit). Non-casemix
events are otherwise included, as long as there is a casemix event within the stay.
- started with a non-acute event code - had an external cause code of a fall (W00-W19) that occurred after the
admission date (ie, excluding falls that clearly occur in hospitals, like those measured in the HQSC QSM).
Analysis All sub-analyses are based on the information recorded in the first event of the stay. Sub analysis: - Injury type: Fractured NOF, other fracture, non-fracture - DHB of domicile - Age: 50-64, 65-74, 75-84, 85+ years - Gender: Male, Female - Ethnicity: Māori, Pacific, Asian and Other (including unknown)
Other notes This indicator differs from the HQSC Falls Atlas Indicator 2, as it is counts all acute/arranged hospital admissions (stays), rather than people with more than one fall only counted once per year.

Methodology – Falls & Fractures Outcomes Framework – v1.1 January 2018 Page 9 of 15
2b: Acute falls hospital admissions by place of occurrence
Rationale The falls that result in the most serious harm may require a hospital admission, especially for older
people. It is important to know where these falls occur to guide service development and quality
improvement. People in aged residential care will tend to be more frail and vulnerable than those not,
and the potential approaches to reducing falls in different settings vary.
Detailed methodology
Description Number and rate of acute/arranged falls hospital admissions, by place of occurrence
Current status This measure was first implemented in April 2017. Changes in October 2017: Methodology updated to identify stays more consistently with the Ministry of Health’s methodology, and to include stays that started with an acute or arranged admission only. Minor changes in January 2018: Data is available as a rolling twelve-month total, date is now the date of admission rather than the date of discharge, and the national total now includes events with an unknown DHB.
Numerator This indicator replicates the one above (2a), but shows place of occurrence instead of type of injury. Place of occurrence is based on the first event in the stay. Aged residential care: ICD10 code Y92.14 present in ecode set Community: ICD10 code Y92.14 not present
Denominator No rate calculated, as the place of occurrence code in NMDS does not correspond with ARC residents.
Data source(s) National minimum dataset (NMDS)
Collection period Quarterly, based on date of discharge of the last event in the stay.
Inclusions As per indicator 2a.
Exclusions As per indicator 2a.
Analysis All sub-analyses are based on the information recorded in the first event in the stay. Sub analysis: - Place of occurrence: ARC, community - DHB of domicile - Age: 50-64, 65-74, 75-84, 85+ - Gender: Male, Female - Ethnicity: Māori, Pacific, Asian and Other (including unknown)
Other notes This indicator differs from the HQSC Falls Atlas Indicator 2, as it is counts all acute/arranged hospital admissions (stays), rather than people with more than one fall only counted once per year.

Methodology – Falls & Fractures Outcomes Framework – v1.1 January 2018 Page 10 of 15
Domain 3: Improved recovery
3a: Falls hospital bed days, by fracture type
Rationale This indicator replicates 2a, but shows bed days (ie, the total amount of time spent in hospital)
instead of admissions. It is a proxy for the hospital resources that are used by different types of fall
admissions. Improving the rehabilitation process inside hospital can reduce the time spent in a
hospital bed.
This indicator aligns closely with the System Level Measure Framework contributory measure for
Acute Hospital Bed Days.
Detailed methodology
Description Number of hospital bed days due to a fall injury, by fracture type
Current status This measure was first implemented in April 2017. Changes in October 2017: Methodology updated to identify stays more consistently with the Ministry of Health’s methodology, and to include stays that started with an acute or arranged admission only. Minor changes in January 2018: Data is available as a rolling twelve-month total, date is now the date of admission rather than the date of discharge, and the national total now includes events with an unknown DHB.
Numerator This indicator replicates the one above (2a), but shows the total bed days for fall injury type instead of place of occurrence. The total bed days for all events in acute and arranged admissions (stays) in hospital as the result of a fall, by type of injury. Type of fall injury is based on the first event in the stay. - Fractured neck of femur: ICD10 code S720* to S722* in diag 1-30 - Other fracture: ICD code S*2*, T02* and T12* and excluding fractured neck of
femur in diag 1-30 - Non-fracture: No fracture code recorded in diag 1-30
Denominator Number: None Rate per 1,000 population: Population estimates, smoothed across quarters
Data source(s) National minimum dataset (NMDS); Stats NZ
Collection period Quarterly, based on date of discharge of the last event in the stay.
Inclusions As per indicator 2a.
Exclusions As per indicator 2a. Additionally, total bed days excludes: - Bed days for residential care (health speciality code D10-D19, D30-39, D50-59,
or D70-79) - Leave days

Methodology – Falls & Fractures Outcomes Framework – v1.1 January 2018 Page 11 of 15
Description Number of hospital bed days due to a fall injury, by fracture type
Analysis All sub-analyses are based on the information recorded in the first event in the stay. Sub analysis: - Injury type: Fractured NOF, other fracture, non-fracture - DHB of domicile - Age: 50-64, 65-74, 75-84, 85+ - Gender: Male, Female - Ethnicity: Māori, Pacific, Asian and Other (including unknown)
Methodology – Falls & Fractures Outcomes Framework – v1.1 January 2018 Page 12 of 15
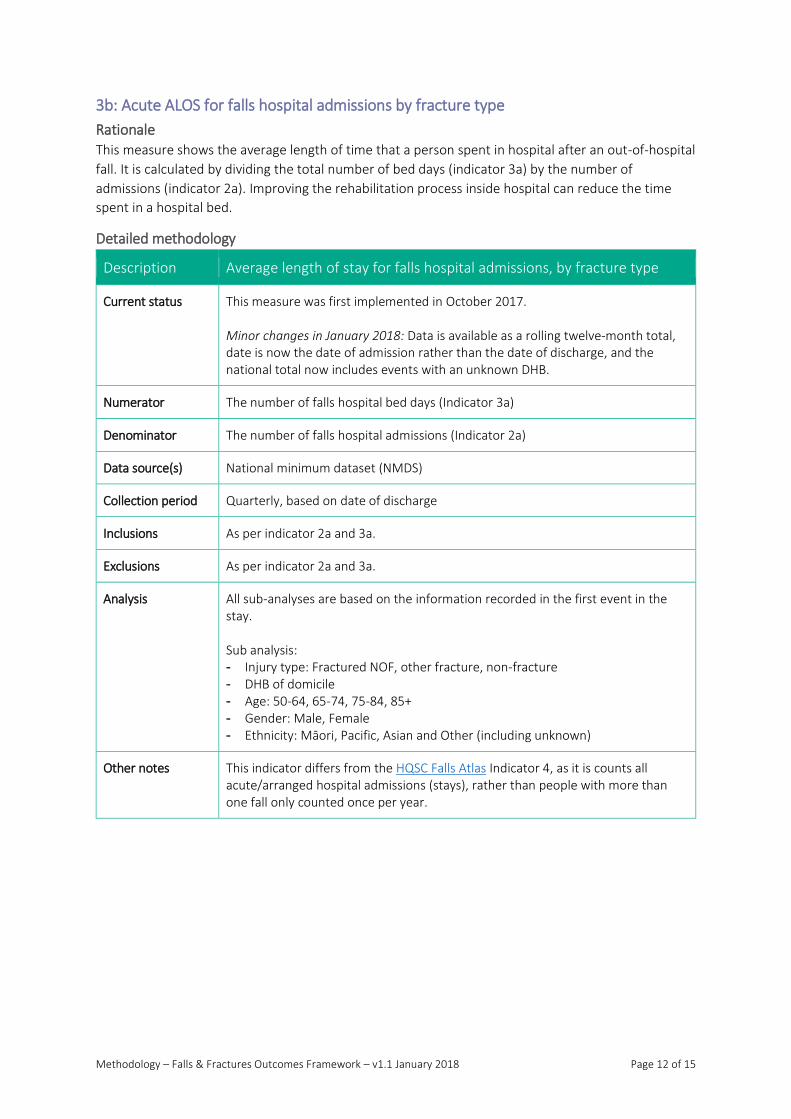
3b: Acute ALOS for falls hospital admissions by fracture type
Rationale This measure shows the average length of time that a person spent in hospital after an out-of-hospital
fall. It is calculated by dividing the total number of bed days (indicator 3a) by the number of
admissions (indicator 2a). Improving the rehabilitation process inside hospital can reduce the time
spent in a hospital bed.
Detailed methodology
Description Average length of stay for falls hospital admissions, by fracture type
Current status This measure was first implemented in October 2017. Minor changes in January 2018: Data is available as a rolling twelve-month total, date is now the date of admission rather than the date of discharge, and the national total now includes events with an unknown DHB.
Numerator The number of falls hospital bed days (Indicator 3a)
Denominator The number of falls hospital admissions (Indicator 2a)
Data source(s) National minimum dataset (NMDS)
Collection period Quarterly, based on date of discharge
Inclusions As per indicator 2a and 3a.
Exclusions As per indicator 2a and 3a.
Analysis All sub-analyses are based on the information recorded in the first event in the stay. Sub analysis: - Injury type: Fractured NOF, other fracture, non-fracture - DHB of domicile - Age: 50-64, 65-74, 75-84, 85+ - Gender: Male, Female - Ethnicity: Māori, Pacific, Asian and Other (including unknown)
Other notes This indicator differs from the HQSC Falls Atlas Indicator 4, as it is counts all acute/arranged hospital admissions (stays), rather than people with more than one fall only counted once per year.

Methodology – Falls & Fractures Outcomes Framework – v1.1 January 2018 Page 13 of 15
3c: Percentage of fractured neck of femur patients operated on the same or next day of
admission
Rationale Pain is a significant factor in a hip fracture and surgery is one of the best ways to address the root
cause of the pain. The postponement of surgery prolongs pain, and increases the risk of complications
and the need for repeated pre-operative fasting.
The Hip Fracture Care Clinical Care Standard recommends that surgery is performed within 48 hours
of the patient presenting to hospital, if no clinical contraindication exists and the patient prefers
surgery.
Our goal is to report 48 hours. However, due to a lack of complete and accurate time being captured
in the National Minimum Dataset (NMDS), only ‘same or next day’ can be reported at present.
When interpreting this indicator, it is important to remember there may be a number of reasons why
surgery was delayed, such as medical instability, or a need for further investigation.
Detailed methodology
Description Fractured NOF operated on the same or next day of admission
Current status Implemented in April 2017.
Numerator The number of people with a fractured NOF who were operated on the same or next day of admission.
Denominator Admissions with any diagnosis of fractured NOF, an external cause code of fall, and who had a hip operation in the year.
Data source(s) NMDS
Collection period Annual, by date of operation.
Inclusions Fractured NOF: ICD10 S72.0, S72.1, S72.2 Hip operation codes: fixation, hip joint (4930600), application of external fixator device (5013000, 4748300), implantation of internal device, hip joint (4792100), fixation, femur (4751900, 4753700, 4753400, 4758800, 4759100, 4753100), implantation of internal device, hip joint (4792100), closed reduction of fracture with internal fixation (4753100, 4751900), open reduction of fracture with internal fixation (4752801), total hip replacement (4931800, 4931900, 9060700, 9060701), partial hip replacement (4931500, 4752200).
Exclusions To avoid double counting, only one fracture per person in one year was counted. Excludes falls and fractures that occurred after the admission date.
Analysis Sub analysis: - DHB of service - Age: 50-64, 65-74, 75-84, 85+ - Gender: Male, Female - Ethnicity: Māori, Pacific, Asian and Other (including unknown)
Other notes This measure is the same as the HQSC Falls Atlas – Indicator 6

Methodology – Falls & Fractures Outcomes Framework – v1.1 January 2018 Page 14 of 15
3d: Number of new starts on bisphosphonates
Rationale Bisphosphonates are a class of drugs that reduce bone density loss. Bisphosphonates should be
considered for older people who have fallen and fractured, to reduce their future risk of fracture.
‘New starts’ identifies people who were not covered by bisphosphonates in the previous two years.
Detailed methodology
Description Number of new starts on bisphosphonates
Current status Implemented in January 2018.
Numerator The number of people newly started on bisphosphonates. A new start is defined as when a bisphosphonate was dispensed to person who was not covered by a bisphosphonate in the previous two years. Two years is the recommended duration for a drug holiday from bisphosphonates. Calculating coverage Different bisphosphonate drugs have different dosing intervals. For example, zoledronic acid is typically administered annually. To account for this, the median gap between dispensations for each person and each bisphosphonate chemical ID was calculated. This median was calculated from all bisphosphonates dispensed between 2011 and 2017 to the population aged 50+ years. Then, for each person, coverage was approximated by adding the drug’s median dispense gap to the date that the drug was dispensed for that person. For example, if a person was dispensed zoledronic acid on 1 January 2017, they were covered for 400 days (the median dispense interval for zoledronic acid), until 5 February 2018.
Denominator Volume: None Rate: The number of ACC claims for a fracture
Data source(s) Pharmaceutical Claims Collection; ACC
Collection period Quarterly
Inclusions All bisphosphonates dispensed (chemical IDs: 1037, 3938, 4015, 3868, 3939, 6033, 1487, 3913) for people aged 50+ years.
Exclusions This measure does not include bisphosphonates that were dispensed in hospital. Interpretation of this measure should consider local practice for bisphosphonate dispensing.
Analysis All sub-analyses are based on the information recorded in the first event in the stay. Sub analysis: - DHB of domicile - Age: 50-64, 65-74, 75-84, 85+ - Gender: Male, Female - Ethnicity: Māori, Pacific, Asian and Other (including unknown)

Methodology – Falls & Fractures Outcomes Framework – v1.1 January 2018 Page 15 of 15
Description Number of new starts on bisphosphonates
Other notes The methodology for bisphosphonate coverage was initially developed by Rodney Jones, Data Scientist at Healthshare Ltd.
3e: Percentage of ARC residents on vitamin D
Rationale Internationally, Vitamin D is widely recommended for reducing falls and fall-related injuries in older
people. Vitamin D supplements are thought to prevent falls by improving muscle strength and
psychomotor performance in older people who are at risk of Vitamin D deficiency. Nationally, there
has been a long-established programme to increase the uptake of prescribed Vitamin D supplements
to older people in aged residential care (ARC).
Detailed methodology
Description Percentage of ARC residents who were dispensed vitamin D
Current status Implemented in April 2017.
Numerator The number of ARC residents dispensed vitamin D.
Denominator The ARC resident population.
Data source(s) Pharmaceutical Claims Collection; Client Claims Processing System.
Collection period Quarterly
Inclusions TBC
Exclusions TBC
Analysis DHB of domicile
Other notes This measure is currently provided by the Ministry of Health to ACC on a quarterly basis.