Embed Size (px)
Citation preview
0 | P a g e
Fall 2017 Report
As Adopted by the Legislative Budget Commission
1 | P a g e
Table of Contents
The Outlook: Production and Development ................................................................................................ 3
Summary and Findings .................................................................................................................................. 7
Tier 1 Table – Critical Needs ....................................................................................................................... 20
Tier 2 Table – Critical Needs and Other High Priority Needs ...................................................................... 21
Tier 3 Table – Critical Needs, Other High Priority Needs, and Revenue Adjustments ................................ 22
Fiscal Strategies ........................................................................................................................................... 24
Significant Risks to the Forecast ................................................................................................................. 29
Potential Constitutional Issues ................................................................................................................... 34
Florida Economic Outlook ........................................................................................................................... 37
Florida Demographic Projections ................................................................................................................ 45
Revenue Projections ................................................................................................................................... 53
I. General Revenue Fund ......................................................................................................................... 53
A. Forecast Overview........................................................................................................................... 53
B. Article V Fees & Transfers ............................................................................................................... 54
C. Documentary Stamp Tax ................................................................................................................. 55
D. Highway Safety Fees ....................................................................................................................... 57
E. Indian Gaming Revenues ................................................................................................................. 58
F. Tobacco Tax and Surcharge ............................................................................................................ 59
II. Educational Enhancement Trust Fund, Lottery, and Slots .................................................................. 61
III. State School Trust Fund and Unclaimed Property ............................................................................. 63
IV. Tobacco Settlement Trust Fund ......................................................................................................... 64
V. State Transportation Trust Fund and Transportation Revenue ......................................................... 65
VI. Other Revenue Sources that Primarily Support Education ............................................................... 66
A. Ad Valorem Assessments (Property Tax Roll) ................................................................................. 66
B. Gross Receipts Tax and Communications Services Tax ................................................................... 67
Public Education Capital Outlay and Debt Service (PECO) Trust Fund ...................................... 69
Florida Debt Analysis ................................................................................................................................... 71
Planned Expenditures from Estimated Funds ............................................................................................. 75
Key Budget Driver Worksheet ..................................................................................................................... 76
2 | P a g e
Key Budget Drivers ...................................................................................................................................... 79
Critical Needs .......................................................................................................................................... 79
Pre K-12 Education (Drivers #1 - #4) ................................................................................................... 79
Higher Education (Drivers #5 & #6) ..................................................................................................... 83
Human Services (Drivers #7 - #11) ...................................................................................................... 85
Criminal Justice (Driver #12) ............................................................................................................... 92
Transportation and Economic Development (Driver #13)................................................................... 93
General Government (Drivers #14 & #15) ........................................................................................... 94
Administered Funds and Statewide Issues (Drivers #16 - #18) ........................................................... 95
Other High Priority Needs ....................................................................................................................... 97
Pre K-12 Education (Drivers #19 - #23) ............................................................................................... 97
Higher Education (Drivers #24 - #30) .................................................................................................. 99
Education Fixed Capital Outlay (Driver #31) ..................................................................................... 103
Human Services (Drivers #32 - #38) .................................................................................................. 104
Criminal Justice (Drivers #39 - #43) ................................................................................................... 107
Transportation and Economic Development (Drivers #44 - #47) ...................................................... 108
Natural Resources (Drivers #48 & #49) ............................................................................................. 113
General Government (Drivers #50 & #51) ......................................................................................... 121
Administered Funds & Statewide Issues (Drivers #52 & #53) ........................................................... 122
Tier 3 Adjustments to the General Revenue Fund.................................................................................... 125
Key Revenue Adjustments to the General Revenue Fund Worksheet ..................................................... 126
Key Revenue Adjustments to the General Revenue Fund ........................................................................ 127
Tax and Significant Fee Changes ....................................................................................................... 127
Trust Fund Transfers (GAA) ............................................................................................................... 128
3 | P a g e
Long-Range Financial Outlook
The Outlook: Production and Development
What is the Outlook?
In 2006, Florida voters adopted a constitutional amendment that requires the development of a
Long-Range Financial Outlook, setting out recommended fiscal strategies for the state and its
departments in order to assist the Legislature in making budget decisions. The Legislative
Budget Commission is required to issue the Outlook by September 15th of each year. The 2017
Outlook is the eleventh document developed in accordance with the provisions of article III,
section 19(c)(1) of the Florida Constitution.
Ultimately, the Outlook is a tool that provides an opportunity to both avoid future budget
problems and maintain financial stability between state fiscal years. The Outlook accomplishes
this by providing a longer-range picture of the state’s fiscal position that integrates projections of
the major programs driving Florida’s annual budget requirements with the revenue estimates. In
this regard, the budget projections primarily reflect current-law spending requirements. The
Outlook does not purport to predict the overall funding levels of future state budgets or the final
amount of funds to be allocated to the respective budget areas. This is because very few
assumptions are made regarding future legislative policy decisions on discretionary spending,
making this document simply a reasonable baseline.
Estimated revenues and tax provisions are generally treated in the same way; however, a section
was added for the first time in 2015 that shows the effects of continuing to make revenue
adjustments similar in scope to those that have been made over the past three years.
The Outlook also includes economic, demographic, and debt analyses to provide a framework
for the financial projections and covers the upcoming three state fiscal years: in this version,
2018-19, 2019-20, and 2020-21. It does this by using anticipated revenues and expenditures in
the current year (2017-18) as the baseline. Within each table, all funds remaining after the budget
drivers and other key issues are fully funded for each year are carried forward into the following
fiscal year. In contrast, negative ending balances are assumed to be resolved within the fiscal
year in which they occur, as constitutionally required.
Who produced it?
The Outlook was developed jointly by the Senate Committee on Appropriations, the House
Appropriations Committee, and the Legislative Office of Economic and Demographic Research.
4 | P a g e
How was the Outlook developed?
All major programs that have historically driven significant increases in the state’s budget
like Medicaid and the Florida Education Finance Program, as well as constitutional
requirements such as the Land Acquisition Trust Fund, were reviewed and individually
analyzed.
Forecasts of future workload increases were developed for each of the major cost drivers
using a variety of methods including projections from Consensus Estimating Conferences
and historical funding averages. An additional round of Summer Estimating Conferences
was established specifically to facilitate the availability of up-to-date information.
Costs were applied to the projected workload requirements based on recent legislative
budget decisions.
Exceptional funding needs—the fiscal impact of special issues outside of normal
workload and caseload requirements—were identified and addressed when necessary for
state operations.
Official forecasts of available revenues were used with one exception. Separate tables
and narrative discussion identify the impact of historical revenue adjustments affecting
the General Revenue Fund (tax and fee changes, and trust fund transfers), assuming they
are undertaken in the future at the same pace as the recent past.
The various cost requirements were then aggregated by major fund type and compared to
the final revenue estimates for those funds.
How is the Outlook structured?
The Outlook contains budget drivers that are grouped by policy areas that roughly
correspond to the appropriations bill format required by the Florida Constitution. Also
included are separate sections for Potential Constitutional Issues, Significant Risks to the
Forecast, Revenue Projections, Florida’s Economic Outlook, Florida’s Demographic
Projections, Debt Analysis, Key Revenue Adjustments to the General Revenue Fund, and
comparisons of costs versus revenues.
The descriptions for the various budget drivers contain projections for the applicable
major state-supported programs, an identification of the assumptions behind the
projections, and a description of any significant policy issues associated with the
projections.
Emphasis is placed on recurring budget programs, those programs that the state is
expected or required to continue from year to year.
Estimates for several ongoing programs historically funded with nonrecurring funds are
also included in the Outlook. Even though funded with nonrecurring funds, these
5 | P a g e
programs are viewed as annual “must funds” by most legislators and are therefore
identified as major cost drivers. Similarly, several of the identified revenue adjustments
assume that past levels of nonrecurring revenue adjustments (one-time tax holidays and
trust fund transfers) continue each year.
Revenue projections specifically cover the General Revenue Fund, the Educational
Enhancement Trust Fund (Lottery and Slot Machine proceeds devoted to education), the
State School Trust Fund, and the Tobacco Settlement Trust Fund. Other trust funds have
been estimated and discussed in the areas where they are relevant to the expenditure
forecast.
All revenue projections separately identify recurring and nonrecurring amounts.
The tables used to project fund balances (General Revenue, Educational Enhancement,
State School, and Tobacco Settlement) include estimates for both anticipated revenue
collections and expenditures. They summarize the information contained in and discussed
throughout the document.
Budget drivers have been categorized as either “Critical Needs” (mandatory increases
based on estimating conferences, and other essential needs) or “Other High Priority
Needs” (historically funded issues). Critical Needs can be thought of as the absolute
minimum the state must do absent significant law or structural changes, and Other High
Priority Needs in combination with the Critical Needs form a highly conservative
continuation budget. The budget drivers do not include any assumptions regarding
funding for new programs, expansion of current programs, or new funding levels for
community-based initiatives.
Any future revenue adjustments that differ from the current forecasts adopted by the
Revenue Estimating Conference would require law changes or specific recognition in the
appropriations-related budget documents.
For the purposes of this Outlook, prior expenditures from depleted trust funds have been
redirected to the General Revenue Fund when the underlying activities are ongoing in
nature.
The Fiscal Strategies section demonstrates the impact of different policy responses to
identified problems and issues. The unique assumptions used for these scenarios are not
built into the remainder of the Outlook.
What have previous Outlooks shown?
Each of the Outlooks provided the first look at the likely scenario facing the Legislature in its
preparation of the budget for the following fiscal year. Because the initial projections are updated
and refined through subsequent estimating conferences, the final projections used by the
Legislature have differed from the initial results. Each succeeding Outlook is also affected by the
decisions made in the preceding Session(s).
6 | P a g e
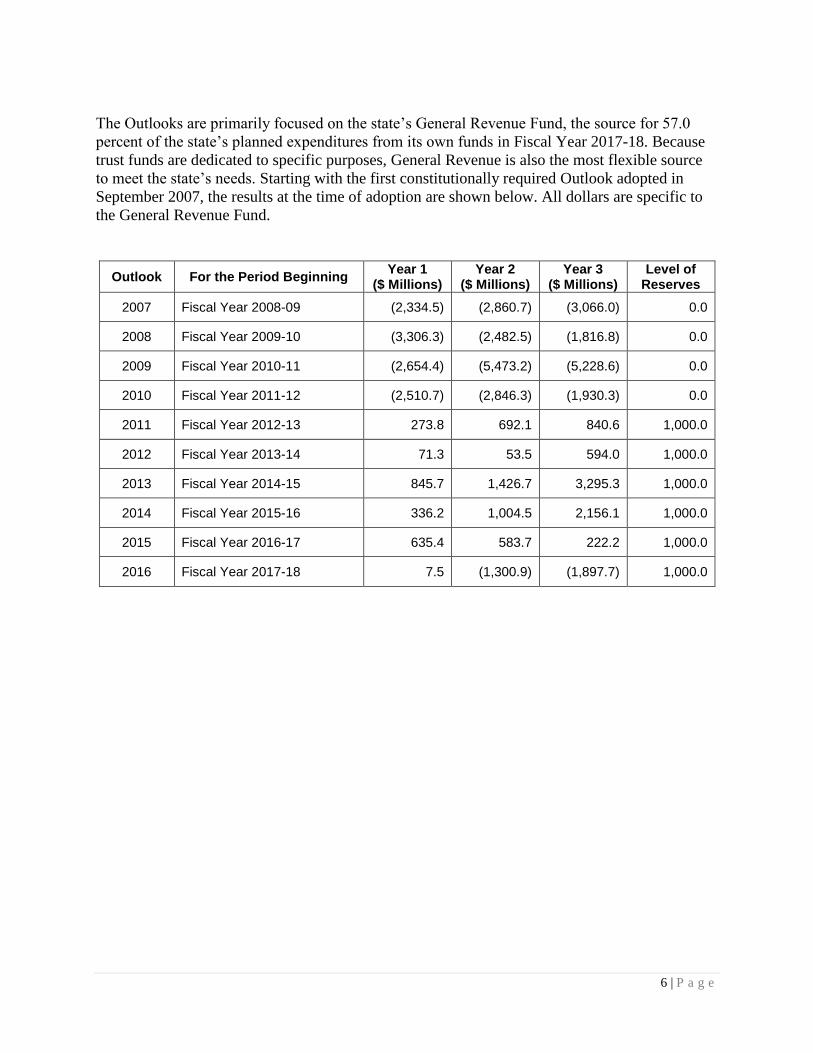
The Outlooks are primarily focused on the state’s General Revenue Fund, the source for 57.0
percent of the state’s planned expenditures from its own funds in Fiscal Year 2017-18. Because
trust funds are dedicated to specific purposes, General Revenue is also the most flexible source
to meet the state’s needs. Starting with the first constitutionally required Outlook adopted in
September 2007, the results at the time of adoption are shown below. All dollars are specific to
the General Revenue Fund.
Outlook For the Period Beginning Year 1
($ Millions) Year 2
($ Millions) Year 3
($ Millions) Level of
Reserves
2007 Fiscal Year 2008-09 (2,334.5) (2,860.7) (3,066.0) 0.0
2008 Fiscal Year 2009-10 (3,306.3) (2,482.5) (1,816.8) 0.0
2009 Fiscal Year 2010-11 (2,654.4) (5,473.2) (5,228.6) 0.0
2010 Fiscal Year 2011-12 (2,510.7) (2,846.3) (1,930.3) 0.0
2011 Fiscal Year 2012-13 273.8 692.1 840.6 1,000.0
2012 Fiscal Year 2013-14 71.3 53.5 594.0 1,000.0
2013 Fiscal Year 2014-15 845.7 1,426.7 3,295.3 1,000.0
2014 Fiscal Year 2015-16 336.2 1,004.5 2,156.1 1,000.0
2015 Fiscal Year 2016-17 635.4 583.7 222.2 1,000.0
2016 Fiscal Year 2017-18 7.5 (1,300.9) (1,897.7) 1,000.0
7 | P a g e
Summary and Findings
A. Key Aspects of the Revenue Estimates
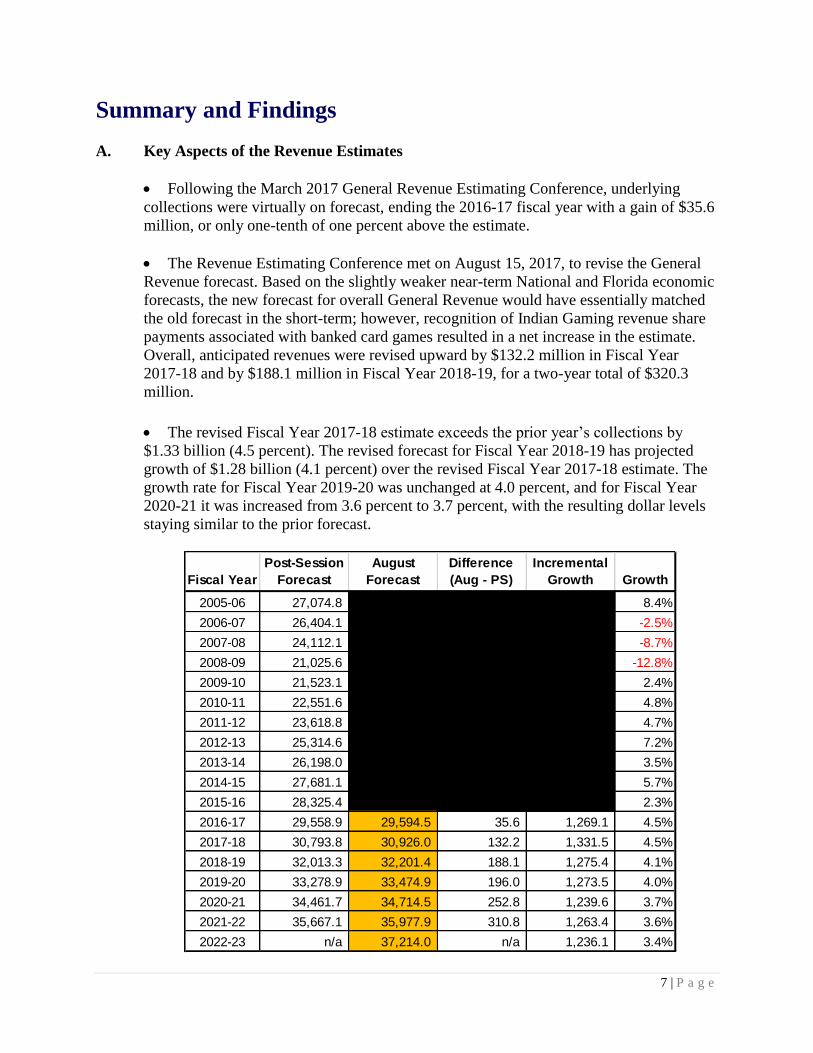
Following the March 2017 General Revenue Estimating Conference, underlying
collections were virtually on forecast, ending the 2016-17 fiscal year with a gain of $35.6
million, or only one-tenth of one percent above the estimate.
The Revenue Estimating Conference met on August 15, 2017, to revise the General
Revenue forecast. Based on the slightly weaker near-term National and Florida economic
forecasts, the new forecast for overall General Revenue would have essentially matched
the old forecast in the short-term; however, recognition of Indian Gaming revenue share
payments associated with banked card games resulted in a net increase in the estimate.
Overall, anticipated revenues were revised upward by $132.2 million in Fiscal Year
2017-18 and by $188.1 million in Fiscal Year 2018-19, for a two-year total of $320.3
million.
The revised Fiscal Year 2017-18 estimate exceeds the prior year’s collections by
$1.33 billion (4.5 percent). The revised forecast for Fiscal Year 2018-19 has projected
growth of $1.28 billion (4.1 percent) over the revised Fiscal Year 2017-18 estimate. The
growth rate for Fiscal Year 2019-20 was unchanged at 4.0 percent, and for Fiscal Year
2020-21 it was increased from 3.6 percent to 3.7 percent, with the resulting dollar levels
staying similar to the prior forecast.
Fiscal Year
Post-Session
Forecast
August
Forecast
Difference
(Aug - PS)
Incremental
Growth Growth
2005-06 27,074.8 8.4%
2006-07 26,404.1 -2.5%
2007-08 24,112.1 -8.7%
2008-09 21,025.6 -12.8%
2009-10 21,523.1 2.4%
2010-11 22,551.6 4.8%
2011-12 23,618.8 4.7%
2012-13 25,314.6 7.2%
2013-14 26,198.0 3.5%
2014-15 27,681.1 5.7%
2015-16 28,325.4 2.3%
2016-17 29,558.9 29,594.5 35.6 1,269.1 4.5%
2017-18 30,793.8 30,926.0 132.2 1,331.5 4.5%
2018-19 32,013.3 32,201.4 188.1 1,275.4 4.1%
2019-20 33,278.9 33,474.9 196.0 1,273.5 4.0%
2020-21 34,461.7 34,714.5 252.8 1,239.6 3.7%
2021-22 35,667.1 35,977.9 310.8 1,263.4 3.6%
2022-23 n/a 37,214.0 n/a 1,236.1 3.4%
8 | P a g e
The changes to the General Revenue estimate also affect the constitutionally required
transfers to the Budget Stabilization Fund (BSF). Based on the August 2017 forecast,
transfers of $68.2 million in Fiscal Year 2018-19, $72.9 million in Fiscal Year 2019-20,
and $53.8 million in Fiscal Year 2020-21 will be required.
The most recent official Financial Outlook Statement for the General Revenue Fund
was adopted August 15, 2017, by the Revenue Estimating Conference. This document
embeds changes that have altered the bottom line from what the Legislature knew at the
time it adopted the General Appropriations Act for Fiscal Year 2017-18 (see Post-Session
Outlook Statement dated July 11, 2017, for reference).
o The Funds Available for Fiscal Year 2016-17 have been increased to account for
the additional revenue collections.
o The Funds Available for Fiscal Years 2017-18 through 2020-21 have been
adjusted to account for the results of the revenue estimating conferences that were
held during the Summer Conference Season.
o The Funds Available for Fiscal Year 2017-18 have been adjusted to include the
release of the Indian Gaming reserve.
The 2018-19 starting point for the Long-Range Financial Outlook reflects additional
adjustments for issues identified since the release of the official Financial Outlook
Statement for the General Revenue Fund. Funds totaling $29.6 million have been set
aside to address projected current-year operating deficits identified by estimating
conferences, including:
Special Note to General Revenue Forecast and Financial Outlook Statement:
In addition to recognizing Indian Gaming revenue share payments associated with banked card games
in the forecast, the Revenue Estimating Conference also released the payments already received by the
state that were held in reserve. Of the total $233.8 million held in reserve at the end of July 2017,
$226.8 million belongs solely to the state and was recognized on the General Revenue Financial
Outlook Statement that was adopted on August 15, 2017. The combined two-year total of the Indian
Gaming forecast change ($323.9 million) and reserve release ($226.8 million) is $550.7 million.
Although the combined forecast change and reserve release for Indian Gaming increased the overall
total for General Revenue, it had the opposite effect on recurring revenue. The future revenue share
payments, including those formerly placed in reserve, have been treated as nonrecurring revenues
because the continuation of these payments depends on actions by the state and the Seminole Tribe that
cannot be anticipated with sufficient certainty. Since the entire amount is now nonrecurring, the
General Revenue Outlook loses between $113.7 million and $117.7 million that were formerly shown as
recurring for each year of the period covered by the Long-Range Financial Outlook.
9 | P a g e
o $0.3 million to offset a projected deficit in the Kidcare program; and
o $29.3 million to offset a projected revenue deficit in the State School Trust Fund.
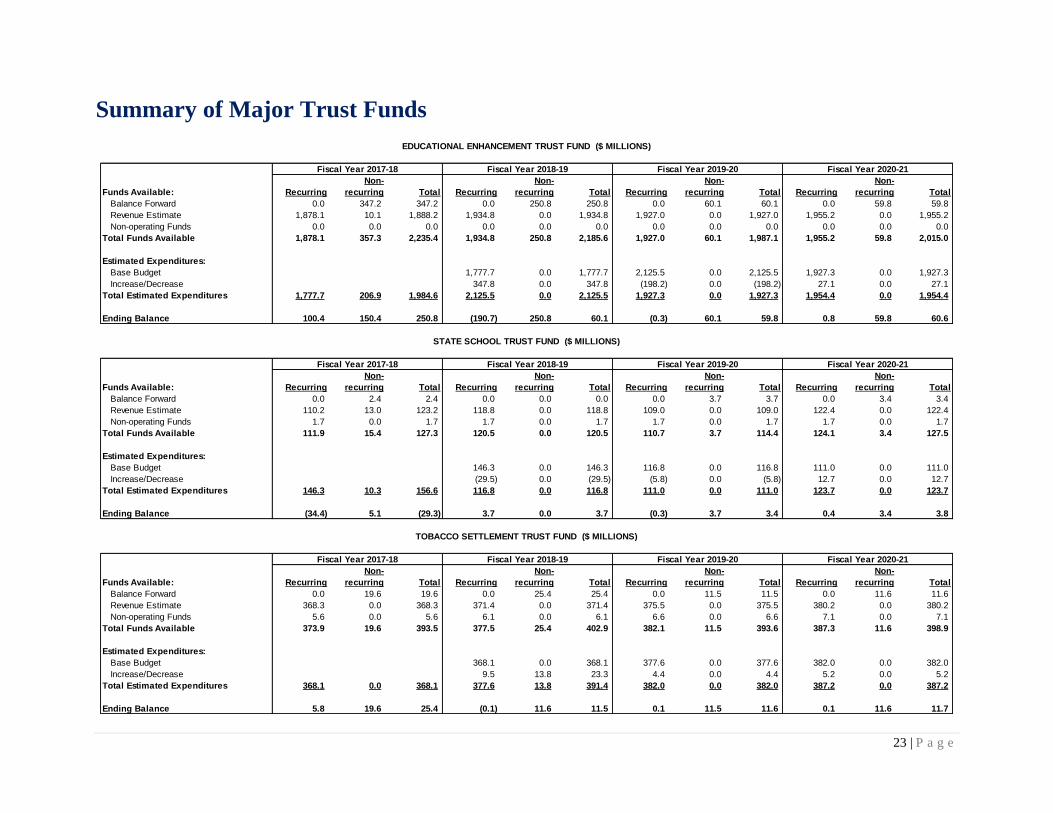
The revenue sources for the Educational Enhancement Trust Fund will have modest
long-term growth and mixed results in the near-term. Because of a large one-time balance
forward of unspent funds from Fiscal Year 2017-18 into Fiscal Year 2018-19 ($250.8
million), the trust fund will have more funds available for expenditure in Fiscal Year
2018-19 than in Fiscal Year 2019-20 or Fiscal Year 2020-21. This is particularly
important because some nonrecurring funds were spent on recurring purposes in the
current year.
The State School Trust Fund is projected to have a deficit of $29.3 million in Fiscal
Year 2017-18. The deficit is the result of both lower than expected transfers from the
Unclaimed Property Trust Fund in the 2016-17 fiscal year, which reduced the balance
forward into Fiscal Year 2017-18, and a reduction to the forecast. The projected funds
available for each year of the forecast are well below the current year level of recurring
appropriations; thus, reductions to the base budget will be required.
The Tobacco Settlement Trust Fund is projected to have modest long-term growth.
Because of a large one-time balance forward of unspent funds from Fiscal Year 2017-18
into Fiscal Year 2018-19 ($25.4 million), the trust fund will have more funds available
for expenditure in Fiscal Year 2018-19 than in Fiscal Years 2019-20 and 2020-21.
B. Key Aspects of State Reserves
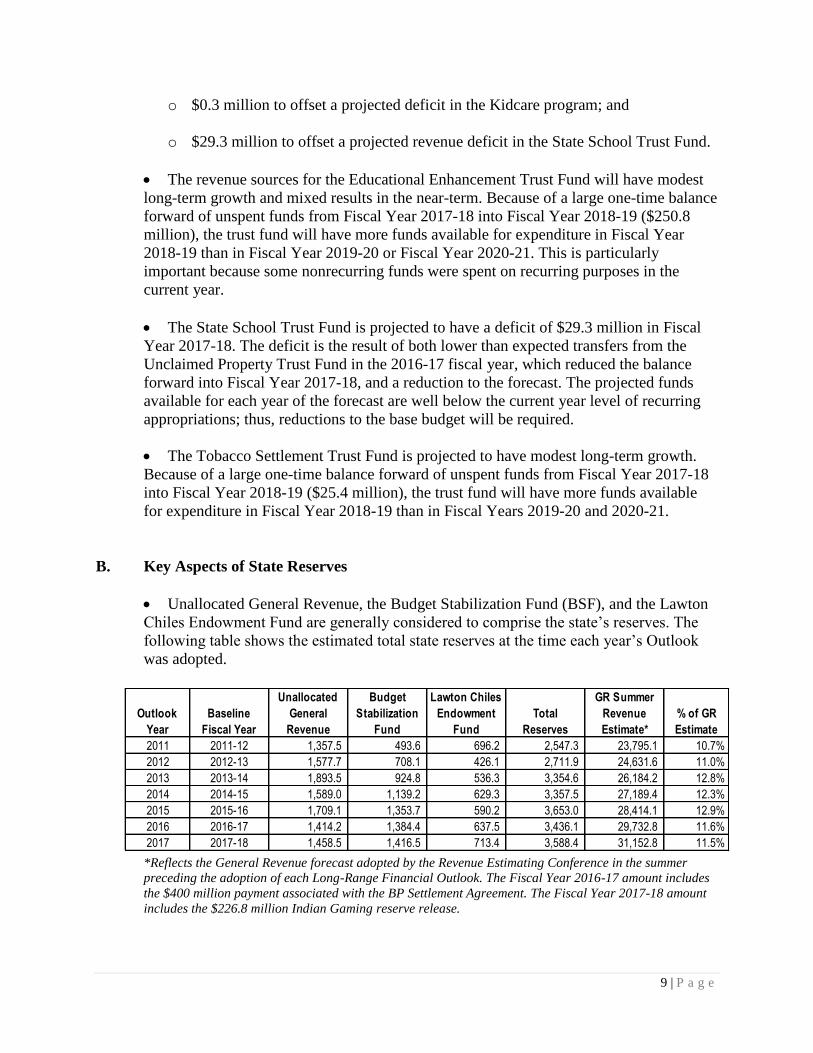
Unallocated General Revenue, the Budget Stabilization Fund (BSF), and the Lawton
Chiles Endowment Fund are generally considered to comprise the state’s reserves. The
following table shows the estimated total state reserves at the time each year’s Outlook
was adopted.
*Reflects the General Revenue forecast adopted by the Revenue Estimating Conference in the summer
preceding the adoption of each Long-Range Financial Outlook. The Fiscal Year 2016-17 amount includes
the $400 million payment associated with the BP Settlement Agreement. The Fiscal Year 2017-18 amount
includes the $226.8 million Indian Gaming reserve release.
Outlook
Year
Baseline
Fiscal Year
Unallocated
General
Revenue
Budget
Stabilization
Fund
Lawton Chiles
Endowment
Fund
Total
Reserves
GR Summer
Revenue
Estimate*
% of GR
Estimate
2011 2011-12 1,357.5 493.6 696.2 2,547.3 23,795.1 10.7%
2012 2012-13 1,577.7 708.1 426.1 2,711.9 24,631.6 11.0%
2013 2013-14 1,893.5 924.8 536.3 3,354.6 26,184.2 12.8%
2014 2014-15 1,589.0 1,139.2 629.3 3,357.5 27,189.4 12.3%
2015 2015-16 1,709.1 1,353.7 590.2 3,653.0 28,414.1 12.9%
2016 2016-17 1,414.2 1,384.4 637.5 3,436.1 29,732.8 11.6%
2017 2017-18 1,458.5 1,416.5 713.4 3,588.4 31,152.8 11.5%
10 | P a g e
The Long-Range Financial Outlook only addresses the General Revenue portion of
total state reserves. As has been done in each of the past six plans, this year's Outlook sets
aside a $1.0 billion General Revenue reserve in each year.
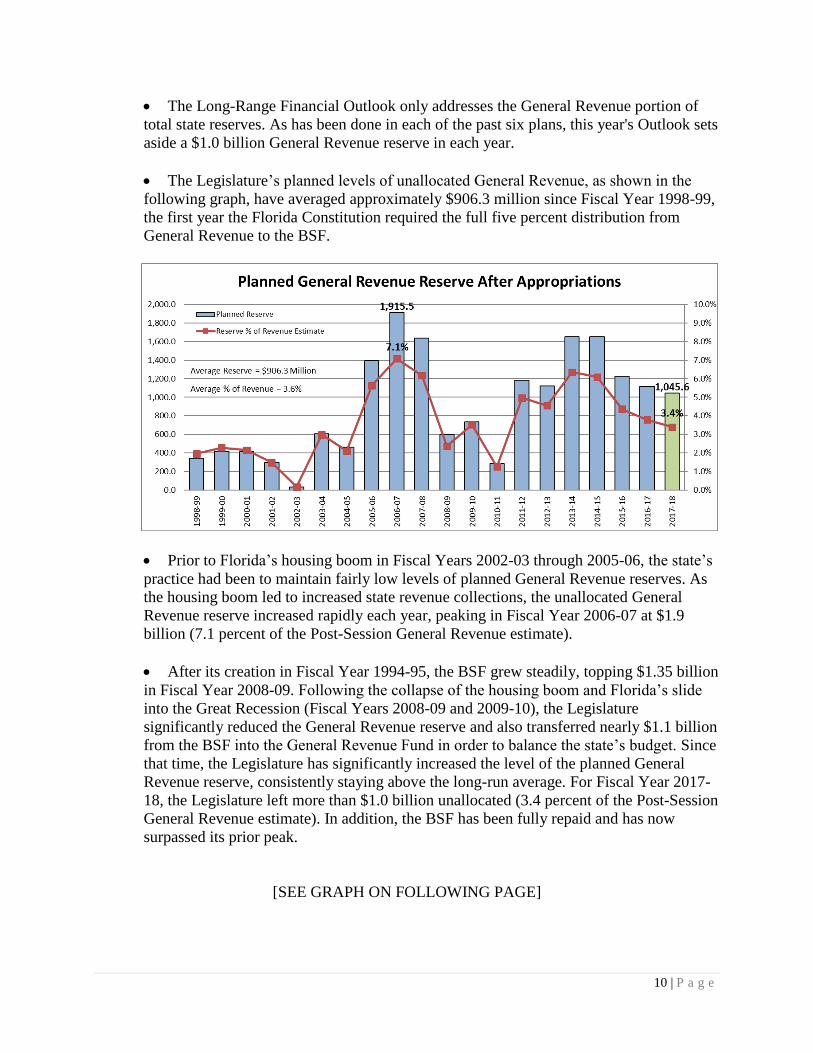
The Legislature’s planned levels of unallocated General Revenue, as shown in the
following graph, have averaged approximately $906.3 million since Fiscal Year 1998-99,
the first year the Florida Constitution required the full five percent distribution from
General Revenue to the BSF.
Prior to Florida’s housing boom in Fiscal Years 2002-03 through 2005-06, the state’s
practice had been to maintain fairly low levels of planned General Revenue reserves. As
the housing boom led to increased state revenue collections, the unallocated General
Revenue reserve increased rapidly each year, peaking in Fiscal Year 2006-07 at $1.9
billion (7.1 percent of the Post-Session General Revenue estimate).
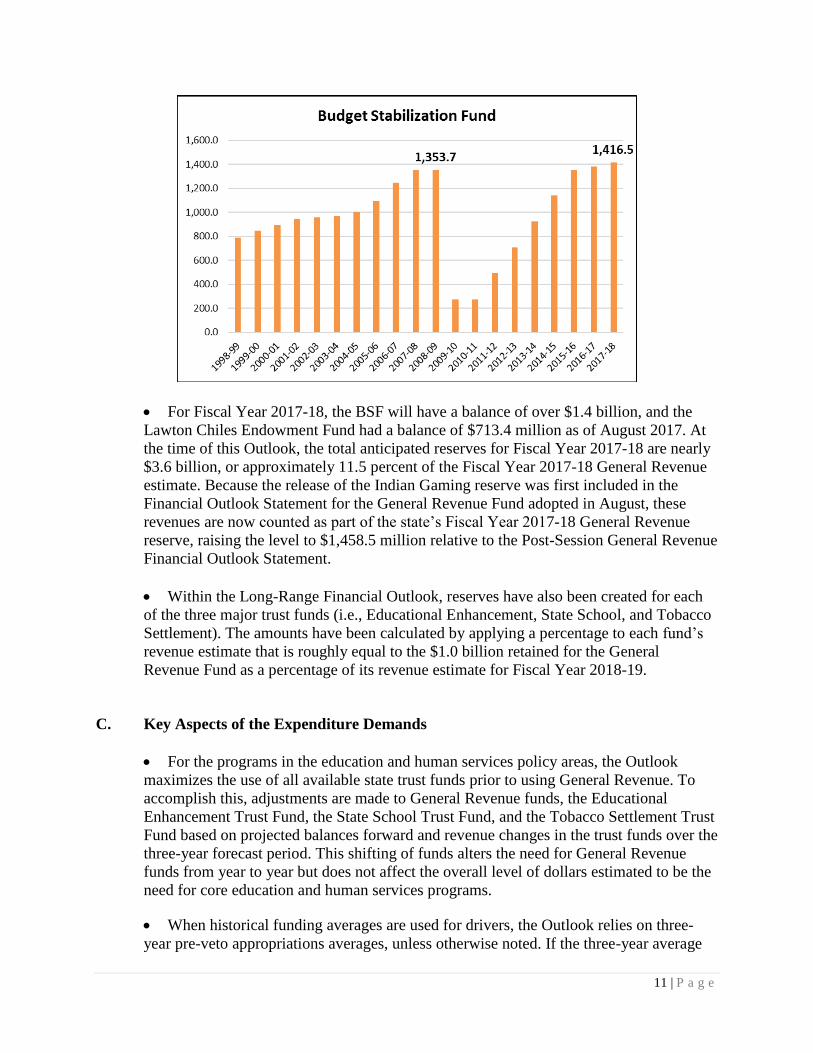
After its creation in Fiscal Year 1994-95, the BSF grew steadily, topping $1.35 billion
in Fiscal Year 2008-09. Following the collapse of the housing boom and Florida’s slide
into the Great Recession (Fiscal Years 2008-09 and 2009-10), the Legislature
significantly reduced the General Revenue reserve and also transferred nearly $1.1 billion
from the BSF into the General Revenue Fund in order to balance the state’s budget. Since
that time, the Legislature has significantly increased the level of the planned General
Revenue reserve, consistently staying above the long-run average. For Fiscal Year 2017-
18, the Legislature left more than $1.0 billion unallocated (3.4 percent of the Post-Session
General Revenue estimate). In addition, the BSF has been fully repaid and has now
surpassed its prior peak.
[SEE GRAPH ON FOLLOWING PAGE]
11 | P a g e
For Fiscal Year 2017-18, the BSF will have a balance of over $1.4 billion, and the
Lawton Chiles Endowment Fund had a balance of $713.4 million as of August 2017. At
the time of this Outlook, the total anticipated reserves for Fiscal Year 2017-18 are nearly
$3.6 billion, or approximately 11.5 percent of the Fiscal Year 2017-18 General Revenue
estimate. Because the release of the Indian Gaming reserve was first included in the
Financial Outlook Statement for the General Revenue Fund adopted in August, these
revenues are now counted as part of the state’s Fiscal Year 2017-18 General Revenue
reserve, raising the level to $1,458.5 million relative to the Post-Session General Revenue
Financial Outlook Statement.
Within the Long-Range Financial Outlook, reserves have also been created for each
of the three major trust funds (i.e., Educational Enhancement, State School, and Tobacco
Settlement). The amounts have been calculated by applying a percentage to each fund’s
revenue estimate that is roughly equal to the $1.0 billion retained for the General
Revenue Fund as a percentage of its revenue estimate for Fiscal Year 2018-19.
C. Key Aspects of the Expenditure Demands
For the programs in the education and human services policy areas, the Outlook
maximizes the use of all available state trust funds prior to using General Revenue. To
accomplish this, adjustments are made to General Revenue funds, the Educational
Enhancement Trust Fund, the State School Trust Fund, and the Tobacco Settlement Trust
Fund based on projected balances forward and revenue changes in the trust funds over the
three-year forecast period. This shifting of funds alters the need for General Revenue
funds from year to year but does not affect the overall level of dollars estimated to be the
need for core education and human services programs.
When historical funding averages are used for drivers, the Outlook relies on three-
year pre-veto appropriations averages, unless otherwise noted. If the three-year average
12 | P a g e
was negative, no change in funding was made. An exception was made for Fiscal Year
2017-18 to accommodate the appropriations made in Special Session A. In this case, the
results for both the Regular and Special Sessions were combined to achieve the
appropriate net result.
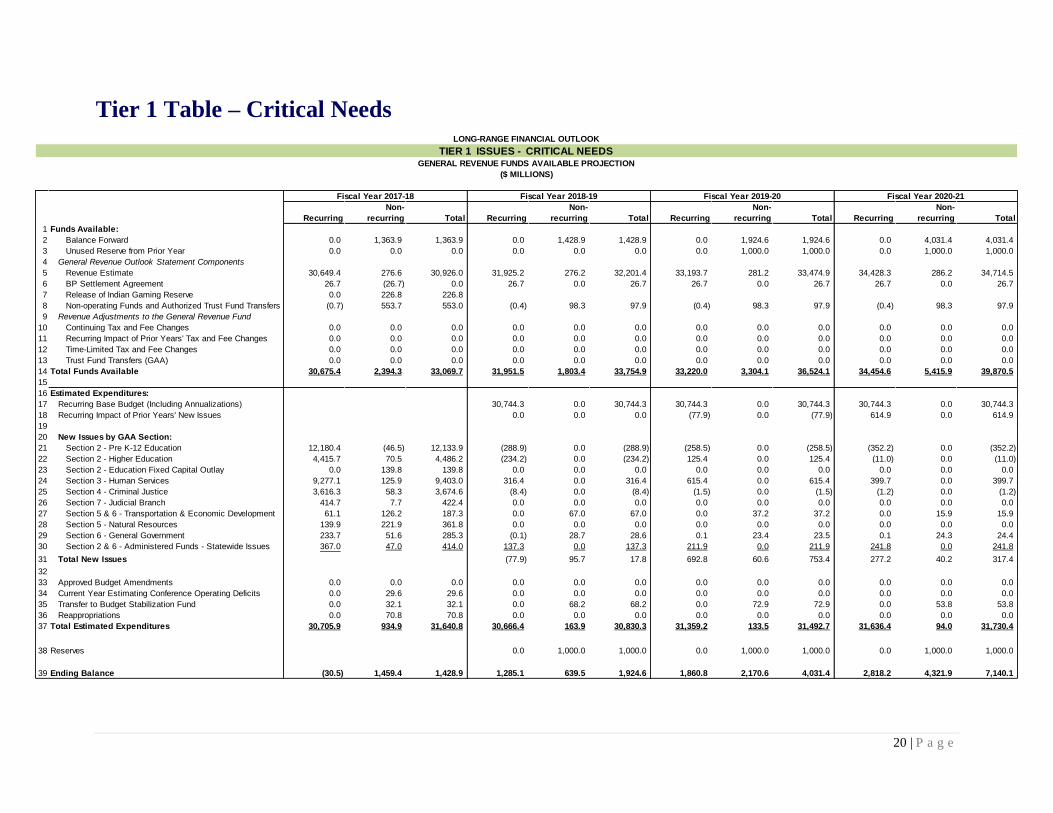
In the Tier 1 Table on page 20, only Critical Needs are shown. Critical Needs reflect
mandatory increases based on estimating conferences and other essential items. The 18
Critical Needs drivers represent the minimum cost to fund the budget without significant
programmatic changes. For the General Revenue Fund, the greatest burden occurs in
Fiscal Year 2019-20 when projected expenditures jump sharply from Fiscal Year 2018-
19. In part, this is due to the depletion of large one-time trust fund balances that
ameliorated the recurring General Revenue need in Fiscal Year 2018-19. It is also caused
by the scheduled reduction in the federal match rate for the Kidcare program beginning
October 1, 2019.
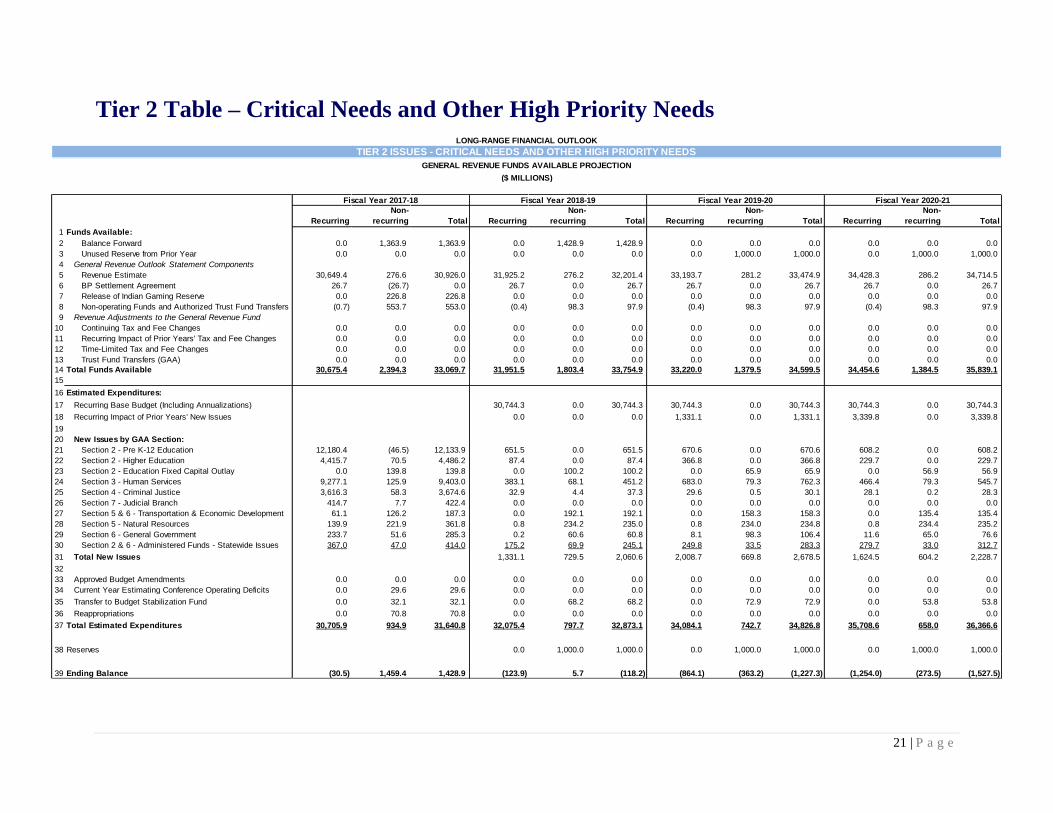
In the Tier 2 Table on page 21, Other High Priority Needs are added to the Critical
Needs. Other High Priority Needs reflect issues that have been funded in most, if not all,
of the recent budget years. Both types of drivers are combined to represent a more
complete, yet still conservative, approach to estimating future expenditures. In contrast to
Critical Needs, the General Revenue burden for the 35 Other High Priority Needs is
spread fairly evenly across the fiscal years, but declines slightly over time.
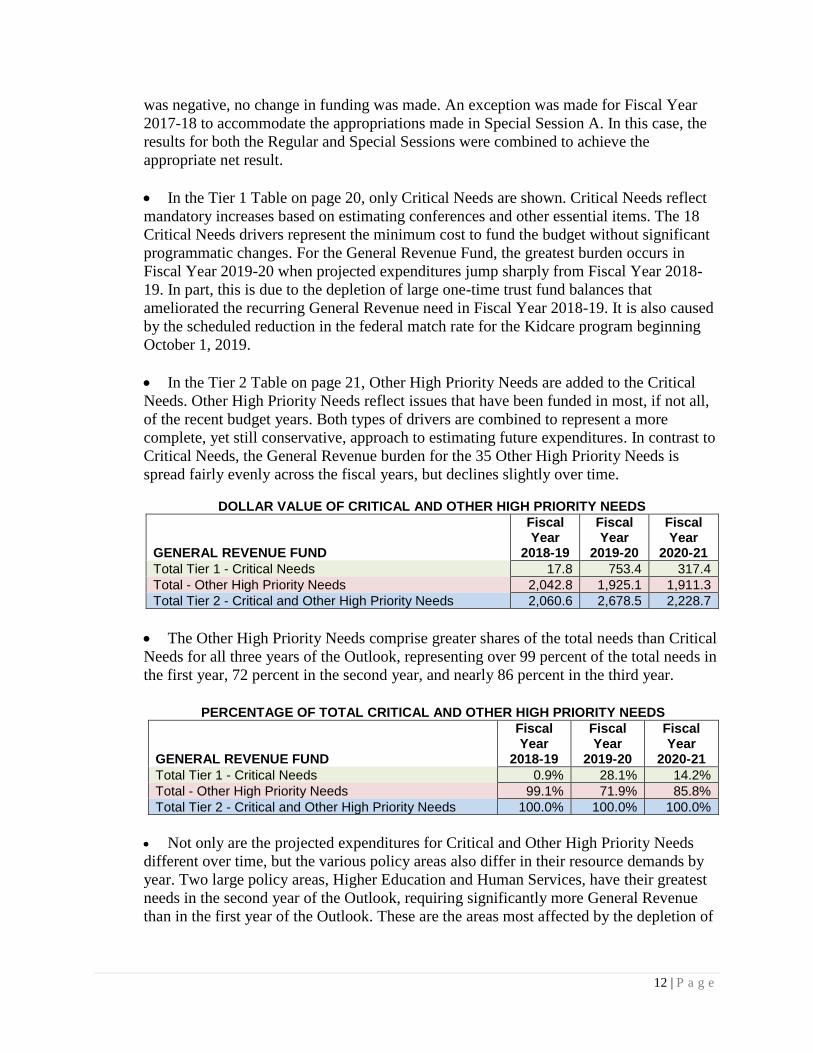
DOLLAR VALUE OF CRITICAL AND OTHER HIGH PRIORITY NEEDS
GENERAL REVENUE FUND
Fiscal Year
2018-19
Fiscal Year
2019-20
Fiscal Year
2020-21
Total Tier 1 - Critical Needs 17.8 753.4 317.4
Total - Other High Priority Needs 2,042.8 1,925.1 1,911.3
Total Tier 2 - Critical and Other High Priority Needs 2,060.6 2,678.5 2,228.7
The Other High Priority Needs comprise greater shares of the total needs than Critical
Needs for all three years of the Outlook, representing over 99 percent of the total needs in
the first year, 72 percent in the second year, and nearly 86 percent in the third year.
PERCENTAGE OF TOTAL CRITICAL AND OTHER HIGH PRIORITY NEEDS
GENERAL REVENUE FUND
Fiscal Year
2018-19
Fiscal Year
2019-20
Fiscal Year
2020-21
Total Tier 1 - Critical Needs 0.9% 28.1% 14.2%
Total - Other High Priority Needs 99.1% 71.9% 85.8%
Total Tier 2 - Critical and Other High Priority Needs 100.0% 100.0% 100.0%
Not only are the projected expenditures for Critical and Other High Priority Needs
different over time, but the various policy areas also differ in their resource demands by
year. Two large policy areas, Higher Education and Human Services, have their greatest
needs in the second year of the Outlook, requiring significantly more General Revenue
than in the first year of the Outlook. These are the areas most affected by the depletion of
13 | P a g e
the trust fund balances. Other areas, including Natural Resources and Administered
Funds-Statewide Issues, have more balanced needs across the three years of the Outlook.
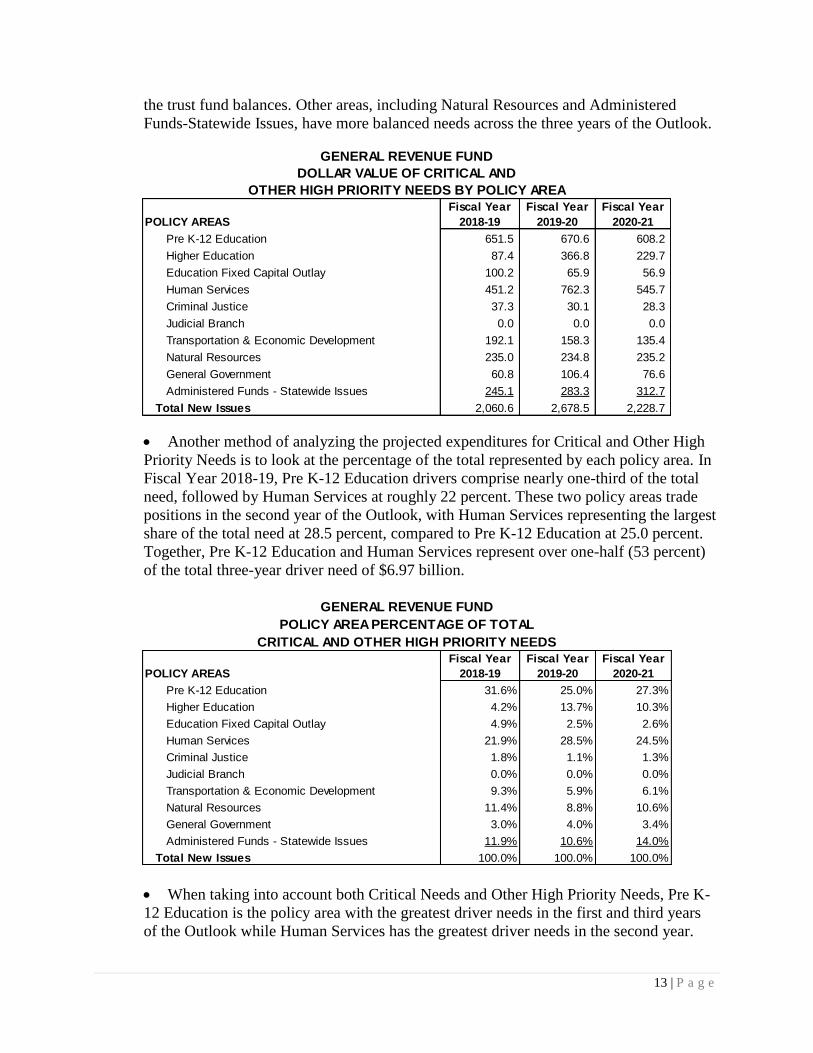
Another method of analyzing the projected expenditures for Critical and Other High
Priority Needs is to look at the percentage of the total represented by each policy area. In
Fiscal Year 2018-19, Pre K-12 Education drivers comprise nearly one-third of the total
need, followed by Human Services at roughly 22 percent. These two policy areas trade
positions in the second year of the Outlook, with Human Services representing the largest
share of the total need at 28.5 percent, compared to Pre K-12 Education at 25.0 percent.
Together, Pre K-12 Education and Human Services represent over one-half (53 percent)
of the total three-year driver need of $6.97 billion.
When taking into account both Critical Needs and Other High Priority Needs, Pre K-
12 Education is the policy area with the greatest driver needs in the first and third years
of the Outlook while Human Services has the greatest driver needs in the second year.
POLICY AREAS
Fiscal Year
2018-19
Fiscal Year
2019-20
Fiscal Year
2020-21
Pre K-12 Education 651.5 670.6 608.2
Higher Education 87.4 366.8 229.7
Education Fixed Capital Outlay 100.2 65.9 56.9
Human Services 451.2 762.3 545.7
Criminal Justice 37.3 30.1 28.3
Judicial Branch 0.0 0.0 0.0
Transportation & Economic Development 192.1 158.3 135.4
Natural Resources 235.0 234.8 235.2
General Government 60.8 106.4 76.6
Administered Funds - Statewide Issues 245.1 283.3 312.7
Total New Issues 2,060.6 2,678.5 2,228.7
OTHER HIGH PRIORITY NEEDS BY POLICY AREA
DOLLAR VALUE OF CRITICAL AND
GENERAL REVENUE FUND
POLICY AREAS
Fiscal Year
2018-19
Fiscal Year
2019-20
Fiscal Year
2020-21
Pre K-12 Education 31.6% 25.0% 27.3%
Higher Education 4.2% 13.7% 10.3%
Education Fixed Capital Outlay 4.9% 2.5% 2.6%
Human Services 21.9% 28.5% 24.5%
Criminal Justice 1.8% 1.1% 1.3%
Judicial Branch 0.0% 0.0% 0.0%
Transportation & Economic Development 9.3% 5.9% 6.1%
Natural Resources 11.4% 8.8% 10.6%
General Government 3.0% 4.0% 3.4%
Administered Funds - Statewide Issues 11.9% 10.6% 14.0%
Total New Issues 100.0% 100.0% 100.0%
GENERAL REVENUE FUND
POLICY AREA PERCENTAGE OF TOTAL
CRITICAL AND OTHER HIGH PRIORITY NEEDS
14 | P a g e
Focusing only on Critical Needs, the Medicaid program is the largest single driver in
all three years of the Outlook; however, this result is largely due to the structure of
education funding. The interaction between state and local funds for the Florida
Education Finance Program (FEFP) requires an evaluation across multiple drivers; focus
on any one driver in isolation is misleading.
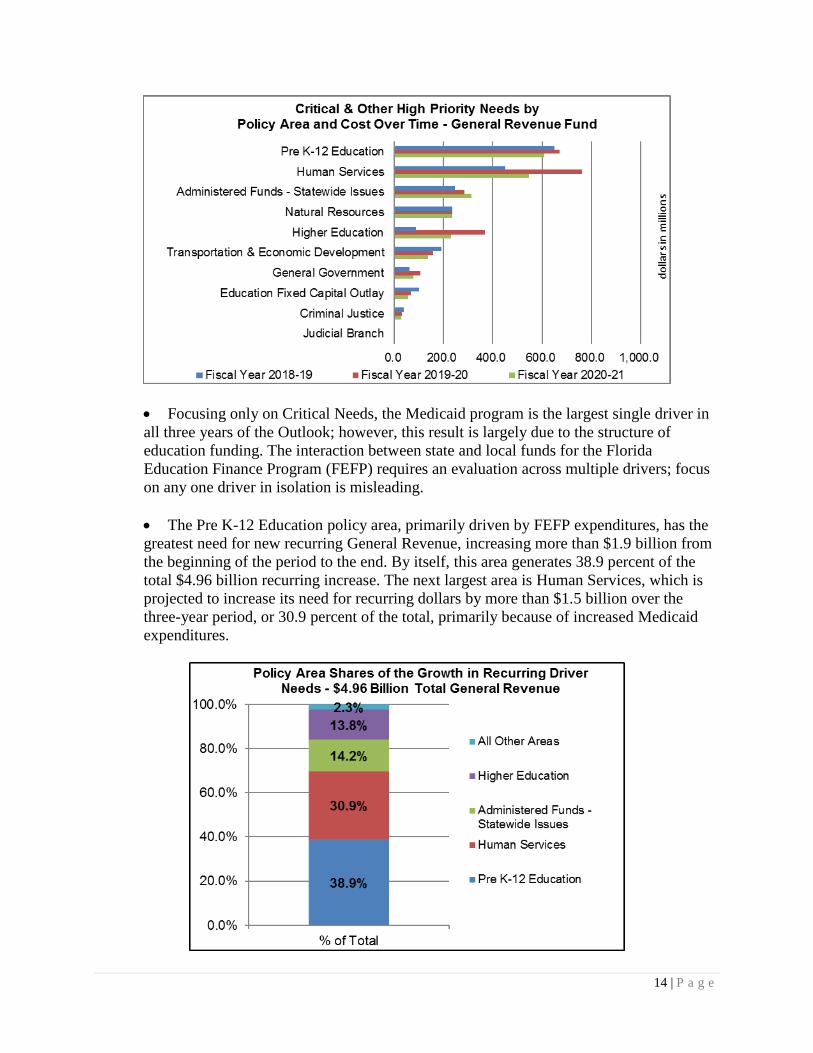
The Pre K-12 Education policy area, primarily driven by FEFP expenditures, has the
greatest need for new recurring General Revenue, increasing more than $1.9 billion from
the beginning of the period to the end. By itself, this area generates 38.9 percent of the
total $4.96 billion recurring increase. The next largest area is Human Services, which is
projected to increase its need for recurring dollars by more than $1.5 billion over the
three-year period, or 30.9 percent of the total, primarily because of increased Medicaid
expenditures.
15 | P a g e
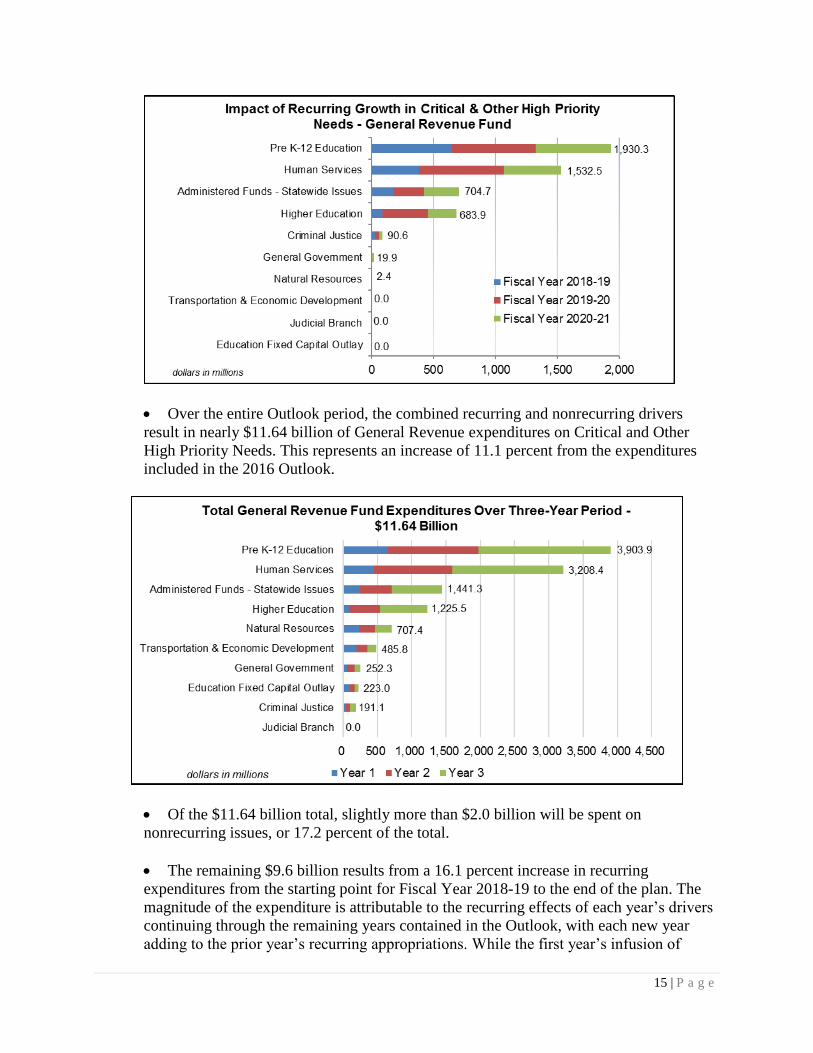
Over the entire Outlook period, the combined recurring and nonrecurring drivers
result in nearly $11.64 billion of General Revenue expenditures on Critical and Other
High Priority Needs. This represents an increase of 11.1 percent from the expenditures
included in the 2016 Outlook.
Of the $11.64 billion total, slightly more than $2.0 billion will be spent on
nonrecurring issues, or 17.2 percent of the total.
The remaining $9.6 billion results from a 16.1 percent increase in recurring
expenditures from the starting point for Fiscal Year 2018-19 to the end of the plan. The
magnitude of the expenditure is attributable to the recurring effects of each year’s drivers
continuing through the remaining years contained in the Outlook, with each new year
adding to the prior year’s recurring appropriations. While the first year’s infusion of
16 | P a g e
recurring dollars is displayed in the recurring column for the driver, the associated funds
for the following years are combined and shown as the Recurring Impact of Prior Years’
New Issues on the tables displayed on pages 20, 21, and 22.
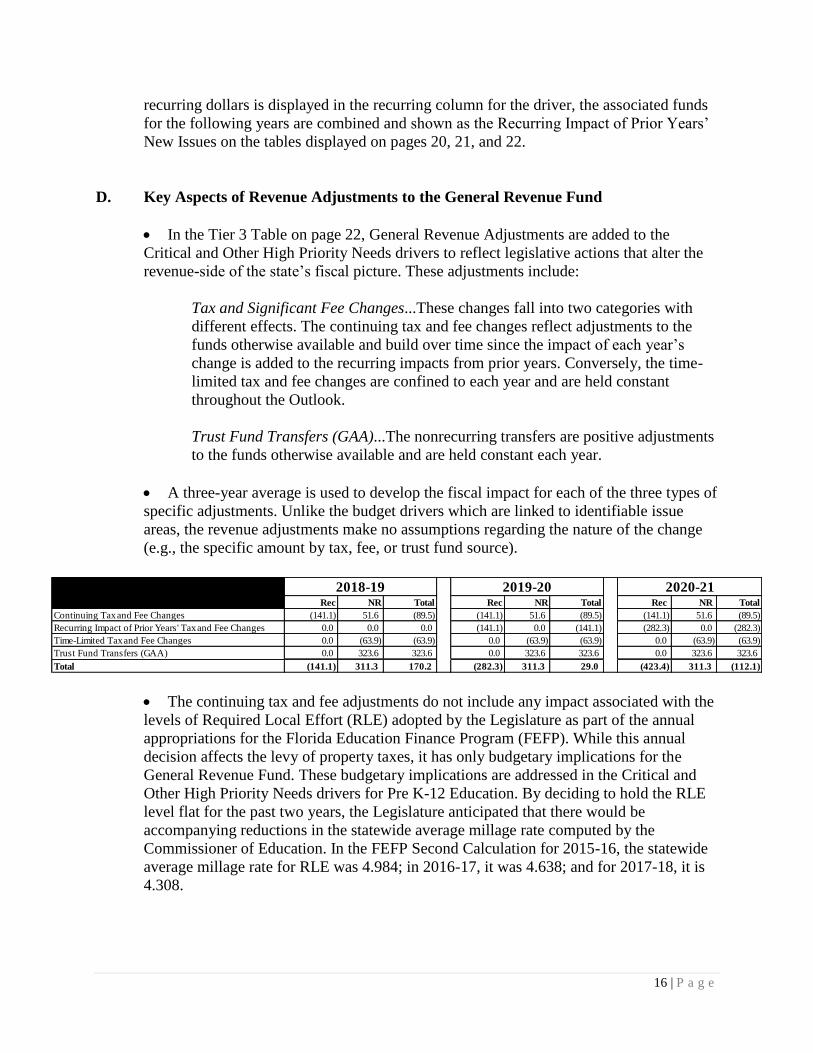
D. Key Aspects of Revenue Adjustments to the General Revenue Fund
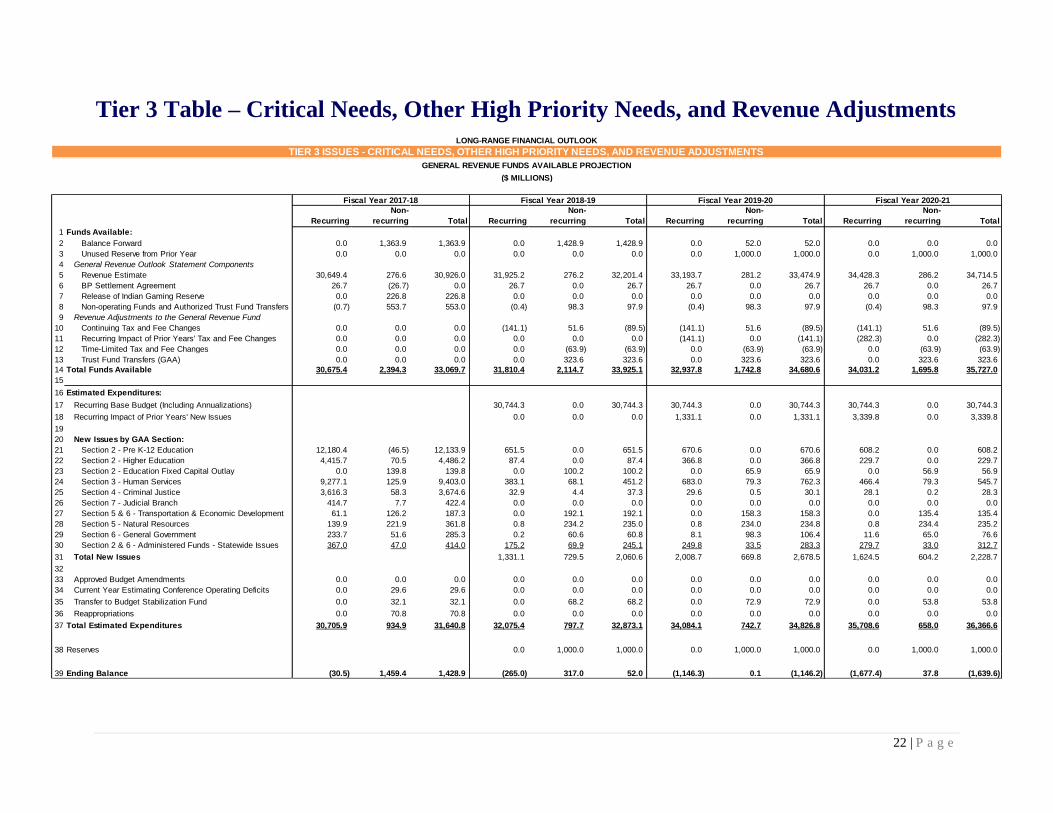
In the Tier 3 Table on page 22, General Revenue Adjustments are added to the
Critical and Other High Priority Needs drivers to reflect legislative actions that alter the
revenue-side of the state’s fiscal picture. These adjustments include:
Tax and Significant Fee Changes...These changes fall into two categories with
different effects. The continuing tax and fee changes reflect adjustments to the
funds otherwise available and build over time since the impact of each year’s
change is added to the recurring impacts from prior years. Conversely, the time-
limited tax and fee changes are confined to each year and are held constant
throughout the Outlook.
Trust Fund Transfers (GAA)...The nonrecurring transfers are positive adjustments
to the funds otherwise available and are held constant each year.
A three-year average is used to develop the fiscal impact for each of the three types of
specific adjustments. Unlike the budget drivers which are linked to identifiable issue
areas, the revenue adjustments make no assumptions regarding the nature of the change
(e.g., the specific amount by tax, fee, or trust fund source).
The continuing tax and fee adjustments do not include any impact associated with the
levels of Required Local Effort (RLE) adopted by the Legislature as part of the annual
appropriations for the Florida Education Finance Program (FEFP). While this annual
decision affects the levy of property taxes, it has only budgetary implications for the
General Revenue Fund. These budgetary implications are addressed in the Critical and
Other High Priority Needs drivers for Pre K-12 Education. By deciding to hold the RLE
level flat for the past two years, the Legislature anticipated that there would be
accompanying reductions in the statewide average millage rate computed by the
Commissioner of Education. In the FEFP Second Calculation for 2015-16, the statewide
average millage rate for RLE was 4.984; in 2016-17, it was 4.638; and for 2017-18, it is
4.308.
Rec NR Total Rec NR Total Rec NR Total
Continuing Tax and Fee Changes (141.1) 51.6 (89.5) (141.1) 51.6 (89.5) (141.1) 51.6 (89.5)
Recurring Impact of Prior Years' Tax and Fee Changes 0.0 0.0 0.0 (141.1) 0.0 (141.1) (282.3) 0.0 (282.3)
Time-Limited Tax and Fee Changes 0.0 (63.9) (63.9) 0.0 (63.9) (63.9) 0.0 (63.9) (63.9)
Trust Fund Transfers (GAA) 0.0 323.6 323.6 0.0 323.6 323.6 0.0 323.6 323.6
Total (141.1) 311.3 170.2 (282.3) 311.3 29.0 (423.4) 311.3 (112.1)
2018-19 2019-20 2020-21
17 | P a g e
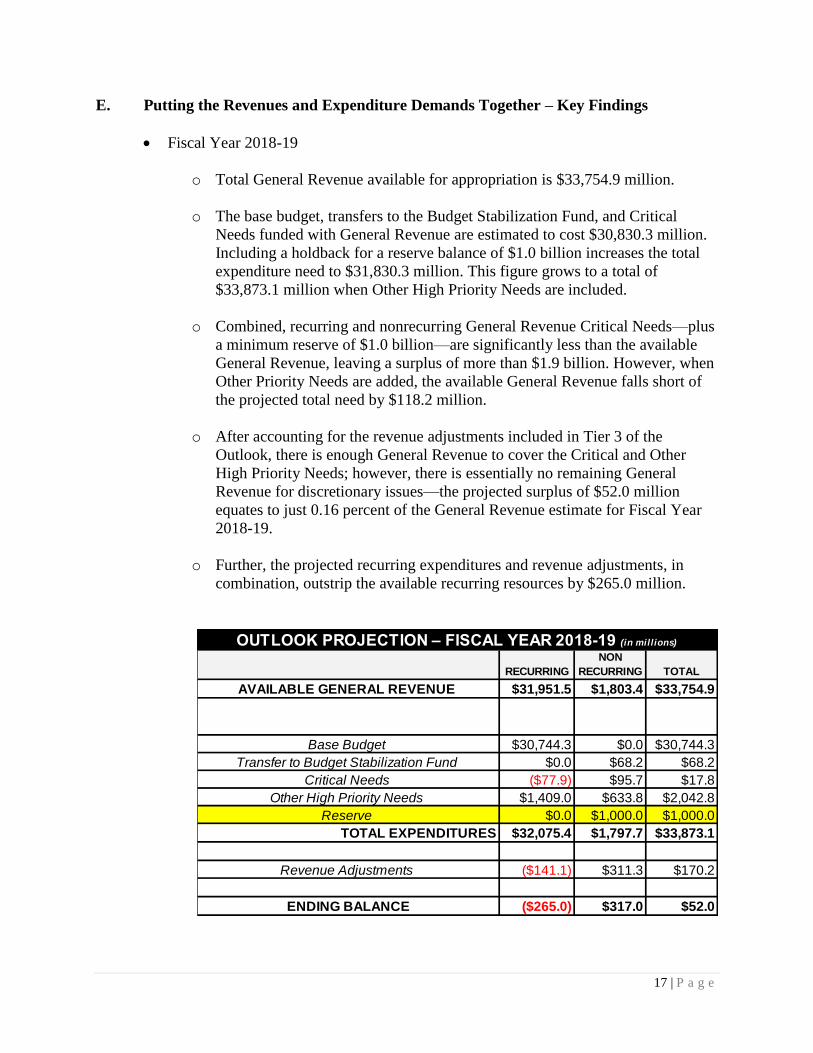
E. Putting the Revenues and Expenditure Demands Together – Key Findings
Fiscal Year 2018-19
o Total General Revenue available for appropriation is $33,754.9 million.
o The base budget, transfers to the Budget Stabilization Fund, and Critical
Needs funded with General Revenue are estimated to cost $30,830.3 million.
Including a holdback for a reserve balance of $1.0 billion increases the total
expenditure need to $31,830.3 million. This figure grows to a total of
$33,873.1 million when Other High Priority Needs are included.
o Combined, recurring and nonrecurring General Revenue Critical Needs—plus
a minimum reserve of $1.0 billion—are significantly less than the available
General Revenue, leaving a surplus of more than $1.9 billion. However, when
Other Priority Needs are added, the available General Revenue falls short of
the projected total need by $118.2 million.
o After accounting for the revenue adjustments included in Tier 3 of the
Outlook, there is enough General Revenue to cover the Critical and Other
High Priority Needs; however, there is essentially no remaining General
Revenue for discretionary issues—the projected surplus of $52.0 million
equates to just 0.16 percent of the General Revenue estimate for Fiscal Year
2018-19.
o Further, the projected recurring expenditures and revenue adjustments, in
combination, outstrip the available recurring resources by $265.0 million.
RECURRING
NON
RECURRING TOTAL
AVAILABLE GENERAL REVENUE $31,951.5 $1,803.4 $33,754.9
Base Budget $30,744.3 $0.0 $30,744.3
Transfer to Budget Stabilization Fund $0.0 $68.2 $68.2
Critical Needs ($77.9) $95.7 $17.8
Other High Priority Needs $1,409.0 $633.8 $2,042.8
Reserve $0.0 $1,000.0 $1,000.0
TOTAL EXPENDITURES $32,075.4 $1,797.7 $33,873.1
Revenue Adjustments ($141.1) $311.3 $170.2
ENDING BALANCE ($265.0) $317.0 $52.0
OUTLOOK PROJECTION – FISCAL YEAR 2018-19 (in millions)
18 | P a g e
Fiscal Years 2019-20 and 2020-21
o Fiscal Years 2019-20 and 2020-21 both show projected budget needs
significantly in excess of available revenue for Critical and Other High
Priority Needs. The recurring shortfalls are even greater when factoring in the
potential revenue adjustments.
o This means that the available General Revenue is insufficient to meet budget
demands related to Tier 2 and Tier 3 in the second and third years of the
planning horizon unless prior corrective actions are taken.
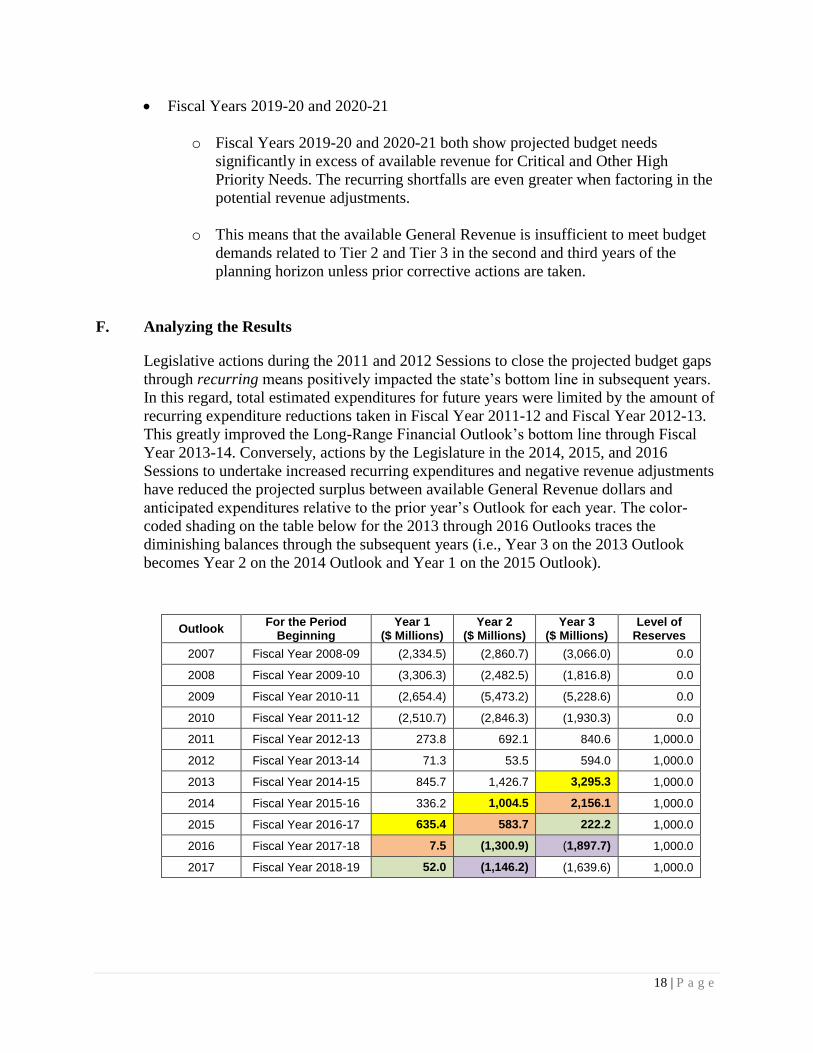
F. Analyzing the Results
Legislative actions during the 2011 and 2012 Sessions to close the projected budget gaps
through recurring means positively impacted the state’s bottom line in subsequent years.
In this regard, total estimated expenditures for future years were limited by the amount of
recurring expenditure reductions taken in Fiscal Year 2011-12 and Fiscal Year 2012-13.
This greatly improved the Long-Range Financial Outlook’s bottom line through Fiscal
Year 2013-14. Conversely, actions by the Legislature in the 2014, 2015, and 2016
Sessions to undertake increased recurring expenditures and negative revenue adjustments
have reduced the projected surplus between available General Revenue dollars and
anticipated expenditures relative to the prior year’s Outlook for each year. The color-
coded shading on the table below for the 2013 through 2016 Outlooks traces the
diminishing balances through the subsequent years (i.e., Year 3 on the 2013 Outlook
becomes Year 2 on the 2014 Outlook and Year 1 on the 2015 Outlook).
Outlook For the Period
Beginning Year 1
($ Millions) Year 2
($ Millions) Year 3
($ Millions) Level of
Reserves
2007 Fiscal Year 2008-09 (2,334.5) (2,860.7) (3,066.0) 0.0
2008 Fiscal Year 2009-10 (3,306.3) (2,482.5) (1,816.8) 0.0
2009 Fiscal Year 2010-11 (2,654.4) (5,473.2) (5,228.6) 0.0
2010 Fiscal Year 2011-12 (2,510.7) (2,846.3) (1,930.3) 0.0
2011 Fiscal Year 2012-13 273.8 692.1 840.6 1,000.0
2012 Fiscal Year 2013-14 71.3 53.5 594.0 1,000.0
2013 Fiscal Year 2014-15 845.7 1,426.7 3,295.3 1,000.0
2014 Fiscal Year 2015-16 336.2 1,004.5 2,156.1 1,000.0
2015 Fiscal Year 2016-17 635.4 583.7 222.2 1,000.0
2016 Fiscal Year 2017-18 7.5 (1,300.9) (1,897.7) 1,000.0
2017 Fiscal Year 2018-19 52.0 (1,146.2) (1,639.6) 1,000.0
19 | P a g e
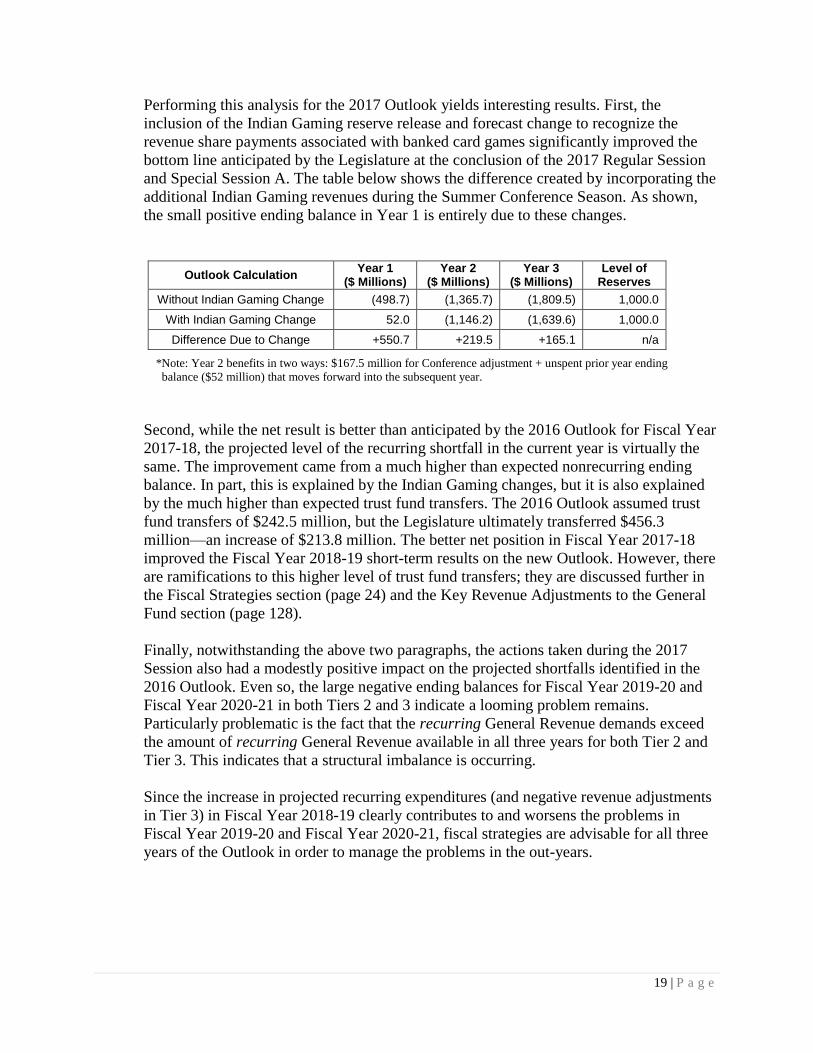
Performing this analysis for the 2017 Outlook yields interesting results. First, the
inclusion of the Indian Gaming reserve release and forecast change to recognize the
revenue share payments associated with banked card games significantly improved the
bottom line anticipated by the Legislature at the conclusion of the 2017 Regular Session
and Special Session A. The table below shows the difference created by incorporating the
additional Indian Gaming revenues during the Summer Conference Season. As shown,
the small positive ending balance in Year 1 is entirely due to these changes.
Outlook Calculation Year 1
($ Millions) Year 2
($ Millions) Year 3
($ Millions) Level of
Reserves
Without Indian Gaming Change (498.7) (1,365.7) (1,809.5) 1,000.0
With Indian Gaming Change 52.0 (1,146.2) (1,639.6) 1,000.0
Difference Due to Change +550.7 +219.5 +165.1 n/a
*Note: Year 2 benefits in two ways: $167.5 million for Conference adjustment + unspent prior year ending
balance ($52 million) that moves forward into the subsequent year.
Second, while the net result is better than anticipated by the 2016 Outlook for Fiscal Year
2017-18, the projected level of the recurring shortfall in the current year is virtually the
same. The improvement came from a much higher than expected nonrecurring ending
balance. In part, this is explained by the Indian Gaming changes, but it is also explained
by the much higher than expected trust fund transfers. The 2016 Outlook assumed trust
fund transfers of $242.5 million, but the Legislature ultimately transferred $456.3
million—an increase of $213.8 million. The better net position in Fiscal Year 2017-18
improved the Fiscal Year 2018-19 short-term results on the new Outlook. However, there
are ramifications to this higher level of trust fund transfers; they are discussed further in
the Fiscal Strategies section (page 24) and the Key Revenue Adjustments to the General
Fund section (page 128).
Finally, notwithstanding the above two paragraphs, the actions taken during the 2017
Session also had a modestly positive impact on the projected shortfalls identified in the
2016 Outlook. Even so, the large negative ending balances for Fiscal Year 2019-20 and
Fiscal Year 2020-21 in both Tiers 2 and 3 indicate a looming problem remains.
Particularly problematic is the fact that the recurring General Revenue demands exceed
the amount of recurring General Revenue available in all three years for both Tier 2 and
Tier 3. This indicates that a structural imbalance is occurring.
Since the increase in projected recurring expenditures (and negative revenue adjustments
in Tier 3) in Fiscal Year 2018-19 clearly contributes to and worsens the problems in
Fiscal Year 2019-20 and Fiscal Year 2020-21, fiscal strategies are advisable for all three
years of the Outlook in order to manage the problems in the out-years.
20 | P a g e
Tier 1 Table – Critical Needs
Recurring
Non-
recurring Total Recurring
Non-
recurring Total Recurring
Non-
recurring Total Recurring
Non-
recurring Total
1 Funds Available:
2 Balance Forward 0.0 1,363.9 1,363.9 0.0 1,428.9 1,428.9 0.0 1,924.6 1,924.6 0.0 4,031.4 4,031.4
3 Unused Reserve from Prior Year 0.0 0.0 0.0 0.0 0.0 0.0 0.0 1,000.0 1,000.0 0.0 1,000.0 1,000.0
4 General Revenue Outlook Statement Components
5 Revenue Estimate 30,649.4 276.6 30,926.0 31,925.2 276.2 32,201.4 33,193.7 281.2 33,474.9 34,428.3 286.2 34,714.5
6 BP Settlement Agreement 26.7 (26.7) 0.0 26.7 0.0 26.7 26.7 0.0 26.7 26.7 0.0 26.7
7 Release of Indian Gaming Reserve 0.0 226.8 226.8
8 Non-operating Funds and Authorized Trust Fund Transfers (0.7) 553.7 553.0 (0.4) 98.3 97.9 (0.4) 98.3 97.9 (0.4) 98.3 97.9
9 Revenue Adjustments to the General Revenue Fund
10 Continuing Tax and Fee Changes 0.0 0.0 0.0 0.0 0.0 0.0 0.0 0.0 0.0 0.0 0.0 0.0
11 Recurring Impact of Prior Years' Tax and Fee Changes 0.0 0.0 0.0 0.0 0.0 0.0 0.0 0.0 0.0 0.0 0.0 0.0
12 Time-Limited Tax and Fee Changes 0.0 0.0 0.0 0.0 0.0 0.0 0.0 0.0 0.0 0.0 0.0 0.0
13 Trust Fund Transfers (GAA) 0.0 0.0 0.0 0.0 0.0 0.0 0.0 0.0 0.0 0.0 0.0 0.0
14 Total Funds Available 30,675.4 2,394.3 33,069.7 31,951.5 1,803.4 33,754.9 33,220.0 3,304.1 36,524.1 34,454.6 5,415.9 39,870.5
15
16 Estimated Expenditures:
17 Recurring Base Budget (Including Annualizations) 30,744.3 0.0 30,744.3 30,744.3 0.0 30,744.3 30,744.3 0.0 30,744.3
18 Recurring Impact of Prior Years' New Issues 0.0 0.0 0.0 (77.9) 0.0 (77.9) 614.9 0.0 614.9
19
20 New Issues by GAA Section:
21 Section 2 - Pre K-12 Education 12,180.4 (46.5) 12,133.9 (288.9) 0.0 (288.9) (258.5) 0.0 (258.5) (352.2) 0.0 (352.2)
22 Section 2 - Higher Education 4,415.7 70.5 4,486.2 (234.2) 0.0 (234.2) 125.4 0.0 125.4 (11.0) 0.0 (11.0)
23 Section 2 - Education Fixed Capital Outlay 0.0 139.8 139.8 0.0 0.0 0.0 0.0 0.0 0.0 0.0 0.0 0.0
24 Section 3 - Human Services 9,277.1 125.9 9,403.0 316.4 0.0 316.4 615.4 0.0 615.4 399.7 0.0 399.7
25 Section 4 - Criminal Justice 3,616.3 58.3 3,674.6 (8.4) 0.0 (8.4) (1.5) 0.0 (1.5) (1.2) 0.0 (1.2)
26 Section 7 - Judicial Branch 414.7 7.7 422.4 0.0 0.0 0.0 0.0 0.0 0.0 0.0 0.0 0.0
27 Section 5 & 6 - Transportation & Economic Development 61.1 126.2 187.3 0.0 67.0 67.0 0.0 37.2 37.2 0.0 15.9 15.9
28 Section 5 - Natural Resources 139.9 221.9 361.8 0.0 0.0 0.0 0.0 0.0 0.0 0.0 0.0 0.0
29 Section 6 - General Government 233.7 51.6 285.3 (0.1) 28.7 28.6 0.1 23.4 23.5 0.1 24.3 24.4
30 Section 2 & 6 - Administered Funds - Statewide Issues 367.0 47.0 414.0 137.3 0.0 137.3 211.9 0.0 211.9 241.8 0.0 241.8
31 Total New Issues (77.9) 95.7 17.8 692.8 60.6 753.4 277.2 40.2 317.4
32
33 Approved Budget Amendments 0.0 0.0 0.0 0.0 0.0 0.0 0.0 0.0 0.0 0.0 0.0 0.0
34 Current Year Estimating Conference Operating Deficits 0.0 29.6 29.6 0.0 0.0 0.0 0.0 0.0 0.0 0.0 0.0 0.0
35 Transfer to Budget Stabilization Fund 0.0 32.1 32.1 0.0 68.2 68.2 0.0 72.9 72.9 0.0 53.8 53.8
36 Reappropriations 0.0 70.8 70.8 0.0 0.0 0.0 0.0 0.0 0.0 0.0 0.0 0.0
37 Total Estimated Expenditures 30,705.9 934.9 31,640.8 30,666.4 163.9 30,830.3 31,359.2 133.5 31,492.7 31,636.4 94.0 31,730.4
38 Reserves 0.0 1,000.0 1,000.0 0.0 1,000.0 1,000.0 0.0 1,000.0 1,000.0
39 Ending Balance (30.5) 1,459.4 1,428.9 1,285.1 639.5 1,924.6 1,860.8 2,170.6 4,031.4 2,818.2 4,321.9 7,140.1
LONG-RANGE FINANCIAL OUTLOOK
GENERAL REVENUE FUNDS AVAILABLE PROJECTION
($ MILLIONS)
Fiscal Year 2017-18 Fiscal Year 2018-19 Fiscal Year 2019-20 Fiscal Year 2020-21
TIER 1 ISSUES - CRITICAL NEEDS
21 | P a g e
Tier 2 Table – Critical Needs and Other High Priority Needs
Recurring
Non-
recurring Total Recurring
Non-
recurring Total Recurring
Non-
recurring Total Recurring
Non-
recurring Total
1 Funds Available:
2 Balance Forward 0.0 1,363.9 1,363.9 0.0 1,428.9 1,428.9 0.0 0.0 0.0 0.0 0.0 0.0
3 Unused Reserve from Prior Year 0.0 0.0 0.0 0.0 0.0 0.0 0.0 1,000.0 1,000.0 0.0 1,000.0 1,000.0
4 General Revenue Outlook Statement Components
5 Revenue Estimate 30,649.4 276.6 30,926.0 31,925.2 276.2 32,201.4 33,193.7 281.2 33,474.9 34,428.3 286.2 34,714.5
6 BP Settlement Agreement 26.7 (26.7) 0.0 26.7 0.0 26.7 26.7 0.0 26.7 26.7 0.0 26.7
7 Release of Indian Gaming Reserve 0.0 226.8 226.8 0.0 0.0 0.0 0.0 0.0 0.0 0.0 0.0 0.0
8 Non-operating Funds and Authorized Trust Fund Transfers (0.7) 553.7 553.0 (0.4) 98.3 97.9 (0.4) 98.3 97.9 (0.4) 98.3 97.9
9 Revenue Adjustments to the General Revenue Fund
10 Continuing Tax and Fee Changes 0.0 0.0 0.0 0.0 0.0 0.0 0.0 0.0 0.0 0.0 0.0 0.0
11 Recurring Impact of Prior Years' Tax and Fee Changes 0.0 0.0 0.0 0.0 0.0 0.0 0.0 0.0 0.0 0.0 0.0 0.0
12 Time-Limited Tax and Fee Changes 0.0 0.0 0.0 0.0 0.0 0.0 0.0 0.0 0.0 0.0 0.0 0.0
13 Trust Fund Transfers (GAA) 0.0 0.0 0.0 0.0 0.0 0.0 0.0 0.0 0.0 0.0 0.0 0.0
14 Total Funds Available 30,675.4 2,394.3 33,069.7 31,951.5 1,803.4 33,754.9 33,220.0 1,379.5 34,599.5 34,454.6 1,384.5 35,839.1
15
16 Estimated Expenditures:
17 Recurring Base Budget (Including Annualizations) 30,744.3 0.0 30,744.3 30,744.3 0.0 30,744.3 30,744.3 0.0 30,744.3
18 Recurring Impact of Prior Years' New Issues 0.0 0.0 0.0 1,331.1 0.0 1,331.1 3,339.8 0.0 3,339.8
19
20 New Issues by GAA Section:
21 Section 2 - Pre K-12 Education 12,180.4 (46.5) 12,133.9 651.5 0.0 651.5 670.6 0.0 670.6 608.2 0.0 608.2
22 Section 2 - Higher Education 4,415.7 70.5 4,486.2 87.4 0.0 87.4 366.8 0.0 366.8 229.7 0.0 229.7
23 Section 2 - Education Fixed Capital Outlay 0.0 139.8 139.8 0.0 100.2 100.2 0.0 65.9 65.9 0.0 56.9 56.9
24 Section 3 - Human Services 9,277.1 125.9 9,403.0 383.1 68.1 451.2 683.0 79.3 762.3 466.4 79.3 545.7
25 Section 4 - Criminal Justice 3,616.3 58.3 3,674.6 32.9 4.4 37.3 29.6 0.5 30.1 28.1 0.2 28.3
26 Section 7 - Judicial Branch 414.7 7.7 422.4 0.0 0.0 0.0 0.0 0.0 0.0 0.0 0.0 0.0
27 Section 5 & 6 - Transportation & Economic Development 61.1 126.2 187.3 0.0 192.1 192.1 0.0 158.3 158.3 0.0 135.4 135.4
28 Section 5 - Natural Resources 139.9 221.9 361.8 0.8 234.2 235.0 0.8 234.0 234.8 0.8 234.4 235.2
29 Section 6 - General Government 233.7 51.6 285.3 0.2 60.6 60.8 8.1 98.3 106.4 11.6 65.0 76.6
30 Section 2 & 6 - Administered Funds - Statewide Issues 367.0 47.0 414.0 175.2 69.9 245.1 249.8 33.5 283.3 279.7 33.0 312.7
31 Total New Issues 1,331.1 729.5 2,060.6 2,008.7 669.8 2,678.5 1,624.5 604.2 2,228.7
32
33 Approved Budget Amendments 0.0 0.0 0.0 0.0 0.0 0.0 0.0 0.0 0.0 0.0 0.0 0.0
34 Current Year Estimating Conference Operating Deficits 0.0 29.6 29.6 0.0 0.0 0.0 0.0 0.0 0.0 0.0 0.0 0.0
35 Transfer to Budget Stabilization Fund 0.0 32.1 32.1 0.0 68.2 68.2 0.0 72.9 72.9 0.0 53.8 53.8
36 Reappropriations 0.0 70.8 70.8 0.0 0.0 0.0 0.0 0.0 0.0 0.0 0.0 0.0
37 Total Estimated Expenditures 30,705.9 934.9 31,640.8 32,075.4 797.7 32,873.1 34,084.1 742.7 34,826.8 35,708.6 658.0 36,366.6
38 Reserves 0.0 1,000.0 1,000.0 0.0 1,000.0 1,000.0 0.0 1,000.0 1,000.0
39 Ending Balance (30.5) 1,459.4 1,428.9 (123.9) 5.7 (118.2) (864.1) (363.2) (1,227.3) (1,254.0) (273.5) (1,527.5)
LONG-RANGE FINANCIAL OUTLOOK
GENERAL REVENUE FUNDS AVAILABLE PROJECTION
($ MILLIONS)
Fiscal Year 2017-18 Fiscal Year 2018-19 Fiscal Year 2019-20 Fiscal Year 2020-21
TIER 2 ISSUES - CRITICAL NEEDS AND OTHER HIGH PRIORITY NEEDS
22 | P a g e
Tier 3 Table – Critical Needs, Other High Priority Needs, and Revenue Adjustments
Recurring
Non-
recurring Total Recurring
Non-
recurring Total Recurring
Non-
recurring Total Recurring
Non-
recurring Total
1 Funds Available:
2 Balance Forward 0.0 1,363.9 1,363.9 0.0 1,428.9 1,428.9 0.0 52.0 52.0 0.0 0.0 0.0
3 Unused Reserve from Prior Year 0.0 0.0 0.0 0.0 0.0 0.0 0.0 1,000.0 1,000.0 0.0 1,000.0 1,000.0
4 General Revenue Outlook Statement Components
5 Revenue Estimate 30,649.4 276.6 30,926.0 31,925.2 276.2 32,201.4 33,193.7 281.2 33,474.9 34,428.3 286.2 34,714.5
6 BP Settlement Agreement 26.7 (26.7) 0.0 26.7 0.0 26.7 26.7 0.0 26.7 26.7 0.0 26.7
7 Release of Indian Gaming Reserve 0.0 226.8 226.8 0.0 0.0 0.0 0.0 0.0 0.0 0.0 0.0 0.0
8 Non-operating Funds and Authorized Trust Fund Transfers (0.7) 553.7 553.0 (0.4) 98.3 97.9 (0.4) 98.3 97.9 (0.4) 98.3 97.9
9 Revenue Adjustments to the General Revenue Fund
10 Continuing Tax and Fee Changes 0.0 0.0 0.0 (141.1) 51.6 (89.5) (141.1) 51.6 (89.5) (141.1) 51.6 (89.5)
11 Recurring Impact of Prior Years' Tax and Fee Changes 0.0 0.0 0.0 0.0 0.0 0.0 (141.1) 0.0 (141.1) (282.3) 0.0 (282.3)
12 Time-Limited Tax and Fee Changes 0.0 0.0 0.0 0.0 (63.9) (63.9) 0.0 (63.9) (63.9) 0.0 (63.9) (63.9)
13 Trust Fund Transfers (GAA) 0.0 0.0 0.0 0.0 323.6 323.6 0.0 323.6 323.6 0.0 323.6 323.6
14 Total Funds Available 30,675.4 2,394.3 33,069.7 31,810.4 2,114.7 33,925.1 32,937.8 1,742.8 34,680.6 34,031.2 1,695.8 35,727.0
15
16 Estimated Expenditures:
17 Recurring Base Budget (Including Annualizations) 30,744.3 0.0 30,744.3 30,744.3 0.0 30,744.3 30,744.3 0.0 30,744.3
18 Recurring Impact of Prior Years' New Issues 0.0 0.0 0.0 1,331.1 0.0 1,331.1 3,339.8 0.0 3,339.8
19
20 New Issues by GAA Section:
21 Section 2 - Pre K-12 Education 12,180.4 (46.5) 12,133.9 651.5 0.0 651.5 670.6 0.0 670.6 608.2 0.0 608.2
22 Section 2 - Higher Education 4,415.7 70.5 4,486.2 87.4 0.0 87.4 366.8 0.0 366.8 229.7 0.0 229.7
23 Section 2 - Education Fixed Capital Outlay 0.0 139.8 139.8 0.0 100.2 100.2 0.0 65.9 65.9 0.0 56.9 56.9
24 Section 3 - Human Services 9,277.1 125.9 9,403.0 383.1 68.1 451.2 683.0 79.3 762.3 466.4 79.3 545.7
25 Section 4 - Criminal Justice 3,616.3 58.3 3,674.6 32.9 4.4 37.3 29.6 0.5 30.1 28.1 0.2 28.3
26 Section 7 - Judicial Branch 414.7 7.7 422.4 0.0 0.0 0.0 0.0 0.0 0.0 0.0 0.0 0.0
27 Section 5 & 6 - Transportation & Economic Development 61.1 126.2 187.3 0.0 192.1 192.1 0.0 158.3 158.3 0.0 135.4 135.4
28 Section 5 - Natural Resources 139.9 221.9 361.8 0.8 234.2 235.0 0.8 234.0 234.8 0.8 234.4 235.2
29 Section 6 - General Government 233.7 51.6 285.3 0.2 60.6 60.8 8.1 98.3 106.4 11.6 65.0 76.6
30 Section 2 & 6 - Administered Funds - Statewide Issues 367.0 47.0 414.0 175.2 69.9 245.1 249.8 33.5 283.3 279.7 33.0 312.7
31 Total New Issues 1,331.1 729.5 2,060.6 2,008.7 669.8 2,678.5 1,624.5 604.2 2,228.7
32
33 Approved Budget Amendments 0.0 0.0 0.0 0.0 0.0 0.0 0.0 0.0 0.0 0.0 0.0 0.0
34 Current Year Estimating Conference Operating Deficits 0.0 29.6 29.6 0.0 0.0 0.0 0.0 0.0 0.0 0.0 0.0 0.0
35 Transfer to Budget Stabilization Fund 0.0 32.1 32.1 0.0 68.2 68.2 0.0 72.9 72.9 0.0 53.8 53.8
36 Reappropriations 0.0 70.8 70.8 0.0 0.0 0.0 0.0 0.0 0.0 0.0 0.0 0.0
37 Total Estimated Expenditures 30,705.9 934.9 31,640.8 32,075.4 797.7 32,873.1 34,084.1 742.7 34,826.8 35,708.6 658.0 36,366.6
38 Reserves 0.0 1,000.0 1,000.0 0.0 1,000.0 1,000.0 0.0 1,000.0 1,000.0
39 Ending Balance (30.5) 1,459.4 1,428.9 (265.0) 317.0 52.0 (1,146.3) 0.1 (1,146.2) (1,677.4) 37.8 (1,639.6)
LONG-RANGE FINANCIAL OUTLOOK
TIER 3 ISSUES - CRITICAL NEEDS, OTHER HIGH PRIORITY NEEDS, AND REVENUE ADJUSTMENTS
GENERAL REVENUE FUNDS AVAILABLE PROJECTION
($ MILLIONS)
Fiscal Year 2017-18 Fiscal Year 2018-19 Fiscal Year 2019-20 Fiscal Year 2020-21
23 | P a g e
Summary of Major Trust Funds
Funds Available: Recurring
Non-
recurring Total Recurring
Non-
recurring Total Recurring
Non-
recurring Total Recurring
Non-
recurring Total
Balance Forward 0.0 347.2 347.2 0.0 250.8 250.8 0.0 60.1 60.1 0.0 59.8 59.8
Revenue Estimate 1,878.1 10.1 1,888.2 1,934.8 0.0 1,934.8 1,927.0 0.0 1,927.0 1,955.2 0.0 1,955.2
Non-operating Funds 0.0 0.0 0.0 0.0 0.0 0.0 0.0 0.0 0.0 0.0 0.0 0.0
Total Funds Available 1,878.1 357.3 2,235.4 1,934.8 250.8 2,185.6 1,927.0 60.1 1,987.1 1,955.2 59.8 2,015.0
Estimated Expenditures:
Base Budget 1,777.7 0.0 1,777.7 2,125.5 0.0 2,125.5 1,927.3 0.0 1,927.3
Increase/Decrease 347.8 0.0 347.8 (198.2) 0.0 (198.2) 27.1 0.0 27.1
Total Estimated Expenditures 1,777.7 206.9 1,984.6 2,125.5 0.0 2,125.5 1,927.3 0.0 1,927.3 1,954.4 0.0 1,954.4
Ending Balance 100.4 150.4 250.8 (190.7) 250.8 60.1 (0.3) 60.1 59.8 0.8 59.8 60.6
Funds Available: Recurring
Non-
recurring Total Recurring
Non-
recurring Total Recurring
Non-
recurring Total Recurring
Non-
recurring Total
Balance Forward 0.0 2.4 2.4 0.0 0.0 0.0 0.0 3.7 3.7 0.0 3.4 3.4
Revenue Estimate 110.2 13.0 123.2 118.8 0.0 118.8 109.0 0.0 109.0 122.4 0.0 122.4
Non-operating Funds 1.7 0.0 1.7 1.7 0.0 1.7 1.7 0.0 1.7 1.7 0.0 1.7
Total Funds Available 111.9 15.4 127.3 120.5 0.0 120.5 110.7 3.7 114.4 124.1 3.4 127.5
Estimated Expenditures:
Base Budget 146.3 0.0 146.3 116.8 0.0 116.8 111.0 0.0 111.0
Increase/Decrease (29.5) 0.0 (29.5) (5.8) 0.0 (5.8) 12.7 0.0 12.7
Total Estimated Expenditures 146.3 10.3 156.6 116.8 0.0 116.8 111.0 0.0 111.0 123.7 0.0 123.7
Ending Balance (34.4) 5.1 (29.3) 3.7 0.0 3.7 (0.3) 3.7 3.4 0.4 3.4 3.8
Funds Available: Recurring
Non-
recurring Total Recurring
Non-
recurring Total Recurring
Non-
recurring Total Recurring
Non-
recurring Total
Balance Forward 0.0 19.6 19.6 0.0 25.4 25.4 0.0 11.5 11.5 0.0 11.6 11.6
Revenue Estimate 368.3 0.0 368.3 371.4 0.0 371.4 375.5 0.0 375.5 380.2 0.0 380.2
Non-operating Funds 5.6 0.0 5.6 6.1 0.0 6.1 6.6 0.0 6.6 7.1 0.0 7.1
Total Funds Available 373.9 19.6 393.5 377.5 25.4 402.9 382.1 11.5 393.6 387.3 11.6 398.9
Estimated Expenditures:
Base Budget 368.1 0.0 368.1 377.6 0.0 377.6 382.0 0.0 382.0
Increase/Decrease 9.5 13.8 23.3 4.4 0.0 4.4 5.2 0.0 5.2
Total Estimated Expenditures 368.1 0.0 368.1 377.6 13.8 391.4 382.0 0.0 382.0 387.2 0.0 387.2
Ending Balance 5.8 19.6 25.4 (0.1) 11.6 11.5 0.1 11.5 11.6 0.1 11.6 11.7
Fiscal Year 2017-18 Fiscal Year 2018-19 Fiscal Year 2019-20 Fiscal Year 2020-21
EDUCATIONAL ENHANCEMENT TRUST FUND ($ MILLIONS)
Fiscal Year 2017-18 Fiscal Year 2018-19 Fiscal Year 2019-20 Fiscal Year 2020-21
STATE SCHOOL TRUST FUND ($ MILLIONS)
Fiscal Year 2017-18 Fiscal Year 2018-19 Fiscal Year 2019-20 Fiscal Year 2020-21
TOBACCO SETTLEMENT TRUST FUND ($ MILLIONS)
24 | P a g e
Fiscal Strategies
The Tier 1, Tier 2, and Tier 3 tables shown on pages 20, 21, and 22 of the Long-Range Financial
Outlook simply summarize the information contained and discussed within the rest of the
Outlook document. In essence, each Tier presents a prognosis of the state’s financial situation as
a result of that scenario. As such, none of the Tiers purport to show the specific details of the
final budget that the Legislature will ultimately pass in any given year. However, they do
illuminate several issues facing the Legislature in the upcoming years since the levels are
reasonable approximations of total expected spending under current law and administration.
The first issue has to do with the importance of shoring up the projections that currently exist. As
discussed, the Outlook’s results for all three years depend greatly on the Indian Gaming revenue
changes and the heightened level of future trust fund transfers. If either of these assumptions fails
to come to pass, the current results will significantly deteriorate. In this regard, the Settlement
Agreement and Stipulation entered into between the Seminole Tribe of Florida and the State of
Florida in July 2017 requires that “...the state takes aggressive enforcement action against the
continued operation of banked card games, including Designated Player Games that are operated
in a banked game manner...” Assuming that this happens, the Revenue Estimating Conference
recognized all revenue share payments associated with banked card game activity. However, the
Conference lacked sufficient certainty to make any of the payments recurring and converted the
entire future stream of annual payments to nonrecurring dollars. In addition, the heightened level
of expected trust fund transfers may necessitate future budget reductions in the affected trust-
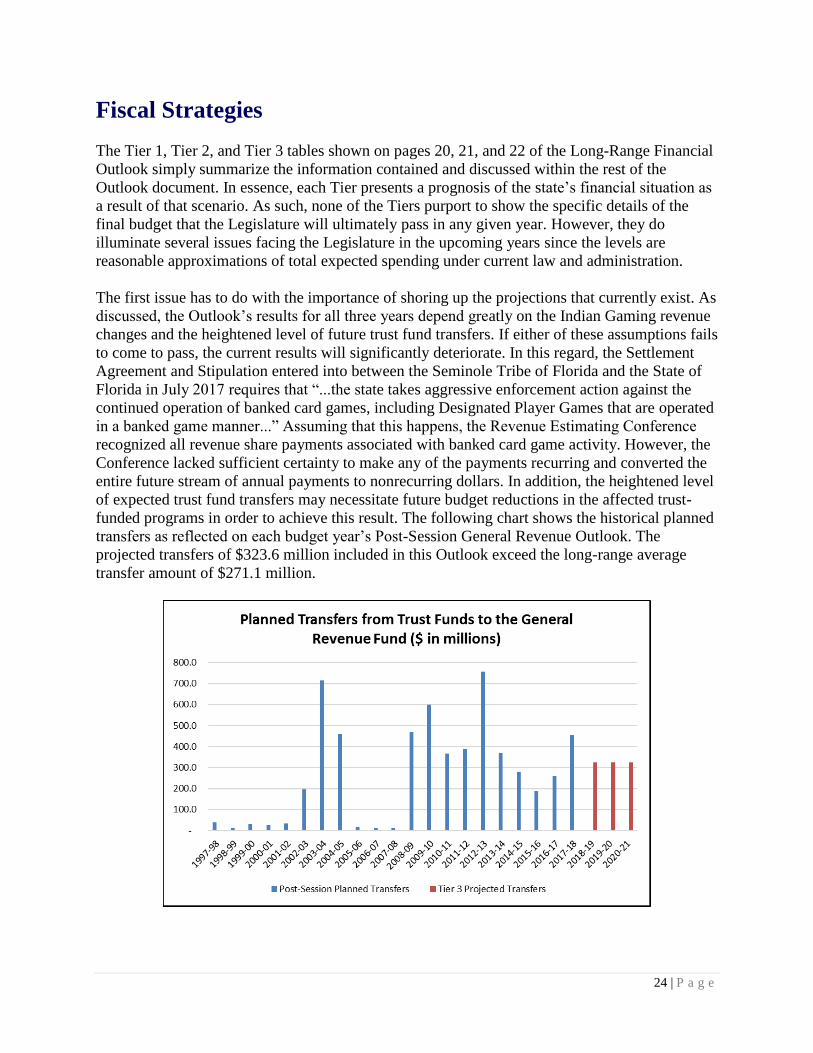
funded programs in order to achieve this result. The following chart shows the historical planned
transfers as reflected on each budget year’s Post-Session General Revenue Outlook. The
projected transfers of $323.6 million included in this Outlook exceed the long-range average
transfer amount of $271.1 million.
25 | P a g e
The second issue addresses the recurring problem that remains from last year. Although the
projected bottom line result for the Fiscal Year 2018-19 Tier 3 scenario is slightly positive, the
projections for the Tier 2 and Tier 3 scenarios both show recurring expenditures that outstrip the
available recurring funds, indicating that a structural imbalance is occurring. Since the increase
in projected recurring expenditures and negative revenue adjustments1 in Fiscal Year 2018-19
clearly contributes to and worsens the problems in Fiscal Year 2019-20 and Fiscal Year 2020-21,
fiscal strategies are advisable for all three years of the Outlook to manage the problems in the
out-years.
To meet the constitutional requirements for this document, appropriate strategies are required to
be both identified and discussed. When budget gaps between revenues and expenditures occurred
in the first four years of the published Outlooks, each of the three years of the plan was affected,
and they displayed negatives of similar magnitude. This had the practical effect of limiting the
number of potential strategies because any strategy deployed to cure the problem in the first year
had ripple effects throughout the remaining years of the plan. In those instances, the strategies
were discretely identified and laid out. In this case—like last year—only the two outer years
reveal actual shortfalls. This necessitates a different treatment because the number of possible
permutations is too great to allow specific identification of each one. Among the many variables
that should be considered is the timing of the corrective action. While a fiscal strategy is required
no later than Fiscal Year 2019-20 to address the projected gap between revenues and
expenditures, less disruptive courses of action would argue for at least some level of deployment
beginning in Fiscal Year 2018-19. Otherwise, there is the potential to increase funding for
programs in Year 1 that would not survive Year 2.
Conceptually, there are five options to eliminate a proposed budget gap in any given year of the
Outlook. With the exception of trust fund transfers or sweeps and reserve reductions, these
options can be deployed on either a recurring or nonrecurring basis. When they are used to bring
about a recurring change, they also have an impact on the following fiscal years.
Budget Reductions and Reduced Program Growth
Reduction or Elimination of the Revenue Adjustments Affecting Taxes and Fees in Tier 3
Revenue Enhancements and Redirections
Trust Fund Transfers or Sweeps
Reserve Reductions
While the level of the state’s total reserves2 could be reduced, the problem in this case is that the
recurring General Revenue demands exceed the amount of recurring General Revenue available
in all three years for Tiers 2 and 3. This recurring problem cannot be fixed by a simple reduction
in the level of total reserves since a reserve can only be spent one time; once the reserve has been
1 Revenue adjustments only exist in Tier 3. 2 The term “total reserves” refers to the combined dollar total of Unallocated General Revenue, the Budget Stabilization Fund, and the Lawton Chiles Endowment Fund. See the discussion entitled “Key Aspects of State Reserves” beginning on page 9. For the purpose of this paragraph, if the total reserve percentage of 11.5 percent of General Revenue collections in Fiscal Year 2017-18 were reduced to the 10.7 percent level used in Fiscal Year 2011-12, $253.4 million of Unallocated General Revenue could be redirected to other purposes in Fiscal Year 2017-18.
26 | P a g e
spent, it is gone. Further, by law, the Budget Stabilization Fund (BSF) cannot be used to address
a budget gap prospectively and, therefore, is not available at the time the budget is developed and
adopted. It can only be accessed when revenues fall below actual appropriations within a fiscal
year.
Trust fund transfers or sweeps operate similarly to a drawdown of reserves. Once the money has
been spent, it is not automatically replenished. Since Tier 3 already contemplates $323.6 million
in transfers each year, transfers above this heightened level would have to be identified to have
any effect on Tier 3’s bottom line.
Since the effectiveness of trust fund transfers and reserve reductions is limited to closing a gap in
a particular year and, as such, do not solve the recurring problem, the three remaining options
will become the basis of the more meaningful strategies: (1) budget reductions and reduced
program growth; (2) reduction or elimination of the revenue adjustments affecting taxes and fees
in Tier 3; and (3) revenue enhancements and redirections. For the purpose of this discussion, (1)
and (2) above are assumed to produce the same bottom-line results, although (1) achieves this
effect through expenditures and (2) achieves it through revenues. Since the Legislature has
undertaken no significant revenue enhancements and only limited redirections over the past three
years, the likely path of this option is not clear. Enhancements and redirections both affect
revenues and the ability to make expenditures, but the consequences are different. At a
minimum, revenue redirections require foregone expenditures elsewhere in the budget.
Only one scenario related to the overall timing of the strategies is explored below. It takes full
advantage of the upcoming Session to improve the outlook for the two subsequent years. Other
scenarios that focus on the second year are also feasible, but to the extent the corrective actions
are delayed, they will result in a more intense and concentrated effort to produce the required
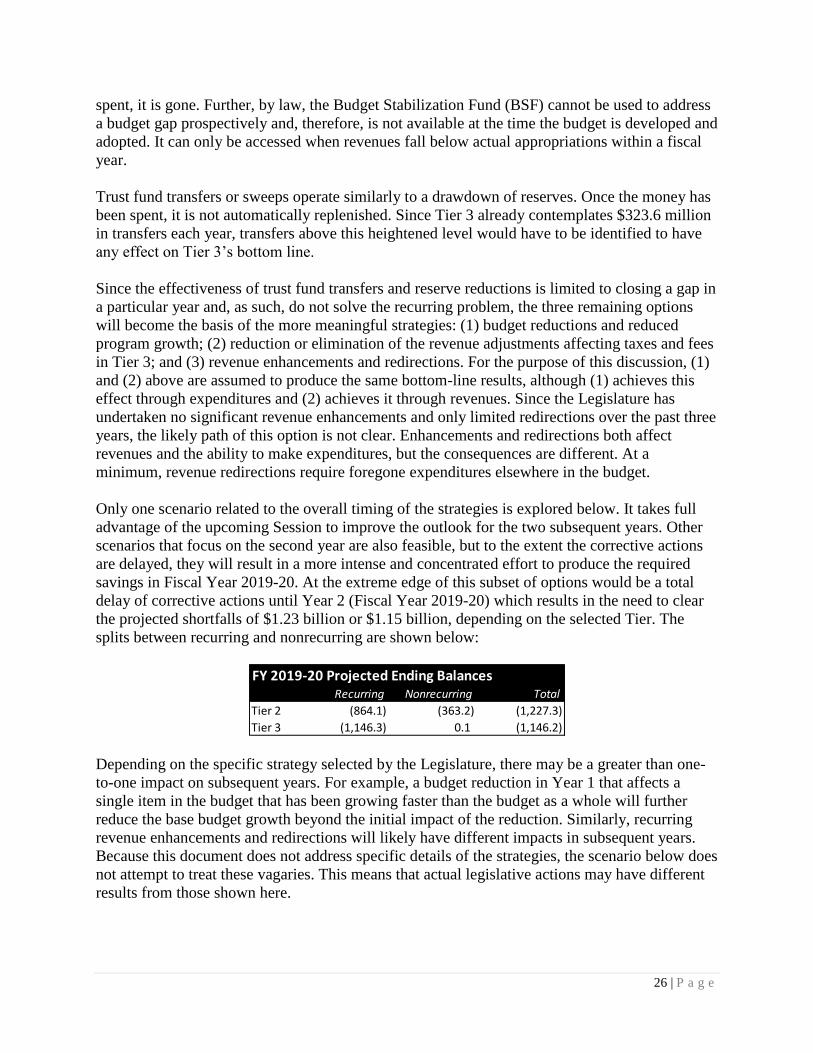
savings in Fiscal Year 2019-20. At the extreme edge of this subset of options would be a total
delay of corrective actions until Year 2 (Fiscal Year 2019-20) which results in the need to clear
the projected shortfalls of $1.23 billion or $1.15 billion, depending on the selected Tier. The
splits between recurring and nonrecurring are shown below:
Depending on the specific strategy selected by the Legislature, there may be a greater than one-
to-one impact on subsequent years. For example, a budget reduction in Year 1 that affects a
single item in the budget that has been growing faster than the budget as a whole will further
reduce the base budget growth beyond the initial impact of the reduction. Similarly, recurring
revenue enhancements and redirections will likely have different impacts in subsequent years.
Because this document does not address specific details of the strategies, the scenario below does
not attempt to treat these vagaries. This means that actual legislative actions may have different
results from those shown here.
FY 2019-20 Projected Ending BalancesRecurring Nonrecurring Total
Tier 2 (864.1) (363.2) (1,227.3)
Tier 3 (1,146.3) 0.1 (1,146.2)
27 | P a g e
The timing scenario discussed below addresses the projected shortfalls shown in Tier 3. Tier 2
adjustments would be similar, but of lesser recurring amounts, since the decision to forego future
revenue adjustments is inherent in that Tier.
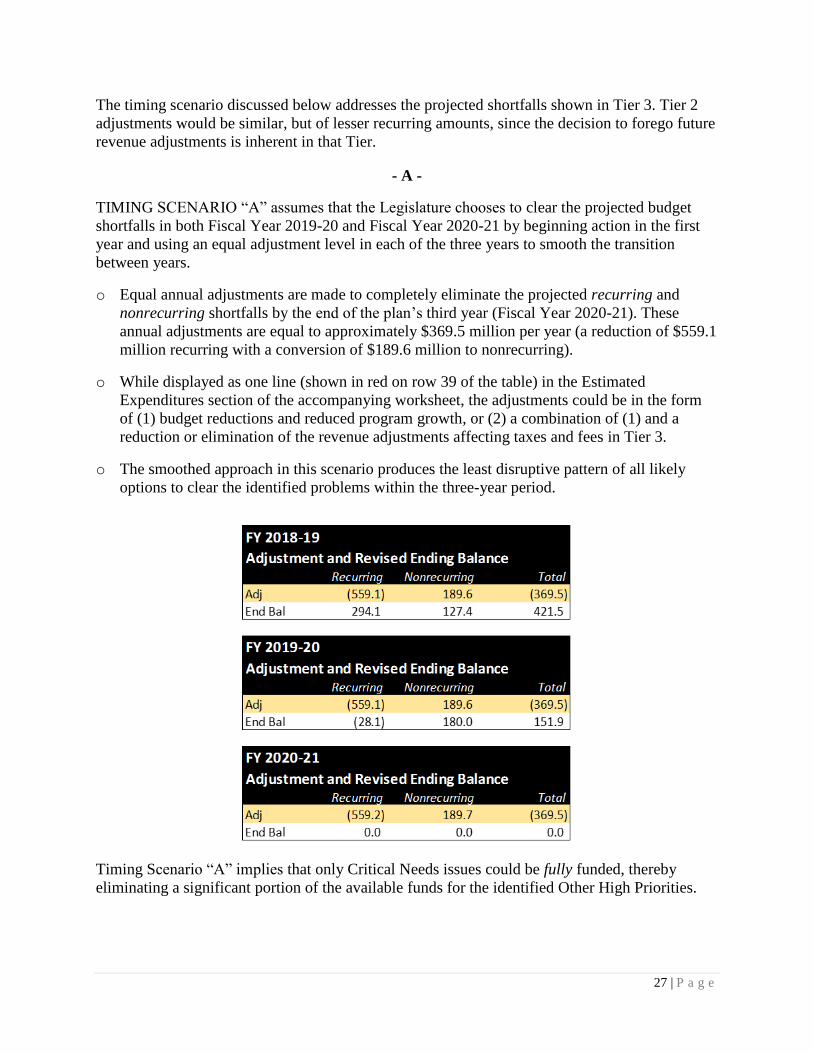
- A -
TIMING SCENARIO “A” assumes that the Legislature chooses to clear the projected budget
shortfalls in both Fiscal Year 2019-20 and Fiscal Year 2020-21 by beginning action in the first
year and using an equal adjustment level in each of the three years to smooth the transition
between years. o Equal annual adjustments are made to completely eliminate the projected recurring and
nonrecurring shortfalls by the end of the plan’s third year (Fiscal Year 2020-21). These
annual adjustments are equal to approximately $369.5 million per year (a reduction of $559.1
million recurring with a conversion of $189.6 million to nonrecurring).
o While displayed as one line (shown in red on row 39 of the table) in the Estimated
Expenditures section of the accompanying worksheet, the adjustments could be in the form
of (1) budget reductions and reduced program growth, or (2) a combination of (1) and a
reduction or elimination of the revenue adjustments affecting taxes and fees in Tier 3.
o The smoothed approach in this scenario produces the least disruptive pattern of all likely
options to clear the identified problems within the three-year period.
Timing Scenario “A” implies that only Critical Needs issues could be fully funded, thereby
eliminating a significant portion of the available funds for the identified Other High Priorities.
28 | P a g e
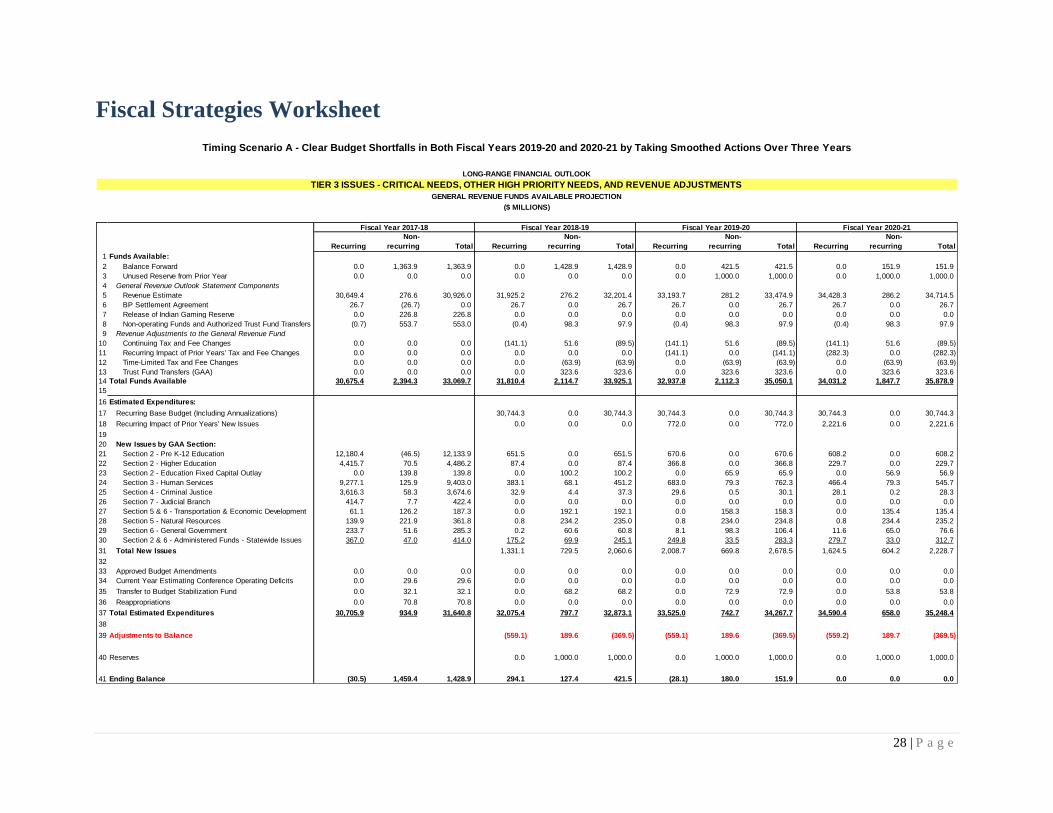
Fiscal Strategies Worksheet
Recurring
Non-
recurring Total Recurring
Non-
recurring Total Recurring
Non-
recurring Total Recurring
Non-
recurring Total
1 Funds Available:
2 Balance Forward 0.0 1,363.9 1,363.9 0.0 1,428.9 1,428.9 0.0 421.5 421.5 0.0 151.9 151.9
3 Unused Reserve from Prior Year 0.0 0.0 0.0 0.0 0.0 0.0 0.0 1,000.0 1,000.0 0.0 1,000.0 1,000.0
4 General Revenue Outlook Statement Components
5 Revenue Estimate 30,649.4 276.6 30,926.0 31,925.2 276.2 32,201.4 33,193.7 281.2 33,474.9 34,428.3 286.2 34,714.5
6 BP Settlement Agreement 26.7 (26.7) 0.0 26.7 0.0 26.7 26.7 0.0 26.7 26.7 0.0 26.7
7 Release of Indian Gaming Reserve 0.0 226.8 226.8 0.0 0.0 0.0 0.0 0.0 0.0 0.0 0.0 0.0
8 Non-operating Funds and Authorized Trust Fund Transfers (0.7) 553.7 553.0 (0.4) 98.3 97.9 (0.4) 98.3 97.9 (0.4) 98.3 97.9
9 Revenue Adjustments to the General Revenue Fund
10 Continuing Tax and Fee Changes 0.0 0.0 0.0 (141.1) 51.6 (89.5) (141.1) 51.6 (89.5) (141.1) 51.6 (89.5)
11 Recurring Impact of Prior Years' Tax and Fee Changes 0.0 0.0 0.0 0.0 0.0 0.0 (141.1) 0.0 (141.1) (282.3) 0.0 (282.3)
12 Time-Limited Tax and Fee Changes 0.0 0.0 0.0 0.0 (63.9) (63.9) 0.0 (63.9) (63.9) 0.0 (63.9) (63.9)
13 Trust Fund Transfers (GAA) 0.0 0.0 0.0 0.0 323.6 323.6 0.0 323.6 323.6 0.0 323.6 323.6
14 Total Funds Available 30,675.4 2,394.3 33,069.7 31,810.4 2,114.7 33,925.1 32,937.8 2,112.3 35,050.1 34,031.2 1,847.7 35,878.9
15
16 Estimated Expenditures:
17 Recurring Base Budget (Including Annualizations) 30,744.3 0.0 30,744.3 30,744.3 0.0 30,744.3 30,744.3 0.0 30,744.3
18 Recurring Impact of Prior Years' New Issues 0.0 0.0 0.0 772.0 0.0 772.0 2,221.6 0.0 2,221.6
19
20 New Issues by GAA Section:
21 Section 2 - Pre K-12 Education 12,180.4 (46.5) 12,133.9 651.5 0.0 651.5 670.6 0.0 670.6 608.2 0.0 608.2
22 Section 2 - Higher Education 4,415.7 70.5 4,486.2 87.4 0.0 87.4 366.8 0.0 366.8 229.7 0.0 229.7
23 Section 2 - Education Fixed Capital Outlay 0.0 139.8 139.8 0.0 100.2 100.2 0.0 65.9 65.9 0.0 56.9 56.9
24 Section 3 - Human Services 9,277.1 125.9 9,403.0 383.1 68.1 451.2 683.0 79.3 762.3 466.4 79.3 545.7
25 Section 4 - Criminal Justice 3,616.3 58.3 3,674.6 32.9 4.4 37.3 29.6 0.5 30.1 28.1 0.2 28.3
26 Section 7 - Judicial Branch 414.7 7.7 422.4 0.0 0.0 0.0 0.0 0.0 0.0 0.0 0.0 0.0
27 Section 5 & 6 - Transportation & Economic Development 61.1 126.2 187.3 0.0 192.1 192.1 0.0 158.3 158.3 0.0 135.4 135.4
28 Section 5 - Natural Resources 139.9 221.9 361.8 0.8 234.2 235.0 0.8 234.0 234.8 0.8 234.4 235.2
29 Section 6 - General Government 233.7 51.6 285.3 0.2 60.6 60.8 8.1 98.3 106.4 11.6 65.0 76.6
30 Section 2 & 6 - Administered Funds - Statewide Issues 367.0 47.0 414.0 175.2 69.9 245.1 249.8 33.5 283.3 279.7 33.0 312.7
31 Total New Issues 1,331.1 729.5 2,060.6 2,008.7 669.8 2,678.5 1,624.5 604.2 2,228.7
32
33 Approved Budget Amendments 0.0 0.0 0.0 0.0 0.0 0.0 0.0 0.0 0.0 0.0 0.0 0.0
34 Current Year Estimating Conference Operating Deficits 0.0 29.6 29.6 0.0 0.0 0.0 0.0 0.0 0.0 0.0 0.0 0.0
35 Transfer to Budget Stabilization Fund 0.0 32.1 32.1 0.0 68.2 68.2 0.0 72.9 72.9 0.0 53.8 53.8
36 Reappropriations 0.0 70.8 70.8 0.0 0.0 0.0 0.0 0.0 0.0 0.0 0.0 0.0
37 Total Estimated Expenditures 30,705.9 934.9 31,640.8 32,075.4 797.7 32,873.1 33,525.0 742.7 34,267.7 34,590.4 658.0 35,248.4
38
39 Adjustments to Balance (559.1) 189.6 (369.5) (559.1) 189.6 (369.5) (559.2) 189.7 (369.5)
40 Reserves 0.0 1,000.0 1,000.0 0.0 1,000.0 1,000.0 0.0 1,000.0 1,000.0
41 Ending Balance (30.5) 1,459.4 1,428.9 294.1 127.4 421.5 (28.1) 180.0 151.9 0.0 0.0 0.0
Fiscal Year 2017-18 Fiscal Year 2018-19 Fiscal Year 2019-20 Fiscal Year 2020-21
Timing Scenario A - Clear Budget Shortfalls in Both Fiscal Years 2019-20 and 2020-21 by Taking Smoothed Actions Over Three Years
LONG-RANGE FINANCIAL OUTLOOK
TIER 3 ISSUES - CRITICAL NEEDS, OTHER HIGH PRIORITY NEEDS, AND REVENUE ADJUSTMENTS
GENERAL REVENUE FUNDS AVAILABLE PROJECTION
($ MILLIONS)
29 | P a g e
Significant Risks to the Forecast
While the Long-Range Financial Outlook uses the most current estimates and data
available, there are risks that have the potential of altering key assumptions (both
positively and negatively) were they to come to pass. Some of the more significant issues
are described below; however, they are not included in the official projections used
throughout the Outlook.
State Costs for Hurricanes, the Florida Hurricane Catastrophe Fund, and Citizens
Property Insurance Corporation
Florida’s economic stability is vulnerable to the potential impacts of natural disasters, especially
major hurricanes. This vulnerability can take several different forms, but one of the most
immediate is to the state’s long-term financial health.
After the 2004 and 2005 hurricanes, the Legislative Office of Economic and Demographic
Research undertook an in-depth analysis of the revenue and budgetary impact on state
government from weather events of this magnitude. Popular belief has spread the misconception
that hurricanes are somehow beneficial to the state from an economic perspective. However, the
reality is much more complicated. From past events, there appear to be four distinct phases of
activity related to hurricanes—each of which has unique economic responses. The table on the
following page describes each of these phases.
Contrary to the oft-repeated myth that government makes money during hurricanes, state
government typically has expenditures greater than the incremental increase in the revenue
estimate and becomes a net loser when all expenditures are taken into account. In reviewing the
final impact of the 2004 and 2005 hurricanes, after the state’s hurricane-related expenditures
were subtracted from the estimated additional revenues, the bottom line for both years was
clearly negative. This means that the state had to spend more than the generated revenues.
In addition to the budgetary and revenue effects associated with hurricanes, there is an impact on
state debt. Besides the direct tax-supported or self-supported debt normally undertaken by the
state, Florida has indirect debt that represents debt either secured by revenues not appropriated
by the state or debt obligations of a legal entity other than the state. A major component of the
state’s current indirect debt is associated with the Florida Hurricane Catastrophe Fund (FHCF)
and the Citizens Property Insurance Corporation’s (Citizens) ability to cover possible future
hurricane-related losses. According to the 2016 Debt Report prepared by the Division of Bond
Finance, these special purpose insurance entities comprised $5.9 billion or 50 percent of the
state’s total indirect debt on June 30, 2016. This particular debt consisted of pre-event financings
to provide cash to pay potential losses incurred following a hurricane.
[SEE TABLE ON FOLLOWING PAGE]
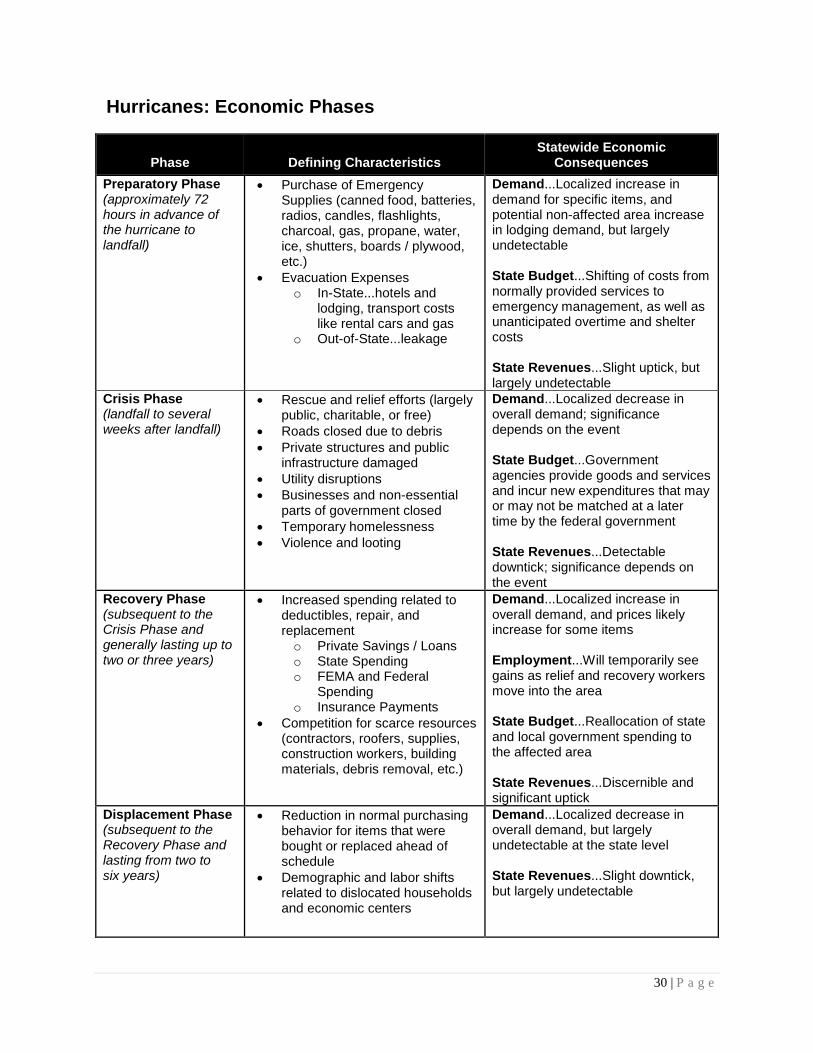
30 | P a g e
Hurricanes: Economic Phases
Phase
Defining Characteristics
Statewide Economic Consequences
Preparatory Phase (approximately 72 hours in advance of the hurricane to landfall)
Purchase of Emergency Supplies (canned food, batteries, radios, candles, flashlights, charcoal, gas, propane, water, ice, shutters, boards / plywood, etc.)
Evacuation Expenses o In-State...hotels and
lodging, transport costs like rental cars and gas
o Out-of-State...leakage
Demand...Localized increase in demand for specific items, and potential non-affected area increase in lodging demand, but largely undetectable State Budget...Shifting of costs from normally provided services to emergency management, as well as unanticipated overtime and shelter costs State Revenues...Slight uptick, but largely undetectable
Crisis Phase (landfall to several weeks after landfall)
Rescue and relief efforts (largely public, charitable, or free)
Roads closed due to debris
Private structures and public infrastructure damaged
Utility disruptions
Businesses and non-essential parts of government closed
Temporary homelessness
Violence and looting
Demand...Localized decrease in overall demand; significance depends on the event State Budget...Government agencies provide goods and services and incur new expenditures that may or may not be matched at a later time by the federal government State Revenues...Detectable downtick; significance depends on the event
Recovery Phase (subsequent to the Crisis Phase and generally lasting up to two or three years)
Increased spending related to deductibles, repair, and replacement o Private Savings / Loans o State Spending o FEMA and Federal
Spending o Insurance Payments
Competition for scarce resources (contractors, roofers, supplies, construction workers, building materials, debris removal, etc.)
Demand...Localized increase in overall demand, and prices likely increase for some items Employment...Will temporarily see gains as relief and recovery workers move into the area State Budget...Reallocation of state and local government spending to the affected area State Revenues...Discernible and significant uptick
Displacement Phase (subsequent to the Recovery Phase and lasting from two to six years)
Reduction in normal purchasing behavior for items that were bought or replaced ahead of schedule
Demographic and labor shifts related to dislocated households and economic centers
Demand...Localized decrease in overall demand, but largely undetectable at the state level State Revenues...Slight downtick, but largely undetectable
31 | P a g e
For the 2017 storm season, the FHCF’s maximum statutory obligation for mandatory coverage is
no more than $17.0 billion. However, the FHCF’s obligation by law is limited to the actual
claims-paying capacity. The FHCF currently projects liquidity of $18.6 billion, consisting of
$14.9 billion in projected cash by December 31, 2017, $1.0 billion of reinsurance, and $2.7
billion in projected pre-event bonds. Given recent financial market conditions, it is estimated the
FHCF would be able to bond for approximately $8.1 billion during the next 12 months if a large
event occurs during the contract year. This estimated claims paying capacity is $9.7 billion above
the total potential statutory maximum claims paying obligation of $17.0 billion.
The maximum statutory limit of coverage that could have been purchased by insurers for the
2017 contract year was approximately $17.0 billion. The $17.0 billion in capacity selected
translates to an approximate 1-in-46 year event (2.0 percent probability) or an event that causes
$28.7 billion in insurance industry residential losses for the 2017 season. Because of the
differences in the levels of coverage and where those FHCF coverages begin, the FHCF’s
probability of exhausting its $17.0 billion maximum limit would be much smaller, implying that
the FHCF could survive a much larger event. In order for all insurance companies to exhaust the
$17.0 billion maximum limit, the aggregate loss would have to be significantly larger than $17
billion.
For the 2017 storm season, Citizens’ probable maximum loss for a 100-year storm event is $6.4
billion. Citizens currently has claims paying ability of approximately $11.0 billion consisting of
a cash surplus of $7.4 billion, as well as funds from private market reinsurance and FHCF
reimbursements. In addition, Citizens has the ability to levy broad-based assessments to support
debt financing.
The ability of these quasi-governmental insurance entities to fulfill their financial responsibilities
in the event of major hurricanes is highly dependent upon market conditions at the time that
bonds would need to be issued. Though the FHCF and Citizens serve significant roles in
Florida’s property insurance market, their ultimate dependence on public assessments and access
to credit markets may expose the state to a much greater potential financial liability for
hurricane-related costs.
Disproportionate Share Hospital Program
Medicaid Disproportionate Share Hospital (DSH) payments were established by the federal
Omnibus Budget Reconciliation Act of 1981 (P.L. 97-35) and are intended to provide additional
reimbursement to hospitals serving disproportionate shares of Medicaid and uninsured
individuals. While most federal Medicaid funding is provided on an open-ended basis, DSH
allotments have been capped since 1993 and represent the maximum federal matching payments
a state is permitted to claim. In Fiscal Year 2017-18, $310 million in DSH funding was
appropriated by the Legislature with $219 million being Florida’s Federal DSH allotment and the
balance being the required state matching funds.
The federal Patient Protection and Affordable Care Act of 2010 (PPACA) addressed DSH
allotments, requiring the Secretary of the U.S. Department of Health and Human Services to
develop a methodology to reduce the state allotments. The reductions were originally to have
32 | P a g e
begun taking effect October 1, 2013, but were delayed by the Centers for Medicaid and Medicare
Services (CMS) after the U.S. Supreme Court ruled in June 2012 that the federal government
could not require states to expand Medicaid eligibility to include persons up to 138 percent of the
federal poverty level, as was required in the PPACA. The CMS expects states that do not
implement Medicaid expansion will have higher rates of uninsured and uncompensated care.
Assuming this is the case, the reductions to the DSH allotments in the non-expanding states are
required to be smaller than those for states that implement Medicaid expansion and have lower
percentages of uninsured individuals.
The DSH reductions have been delayed several times, either by CMS or by changes in federal
law. Most recently, the CMS has proposed a new rule to delineate the DSH Health Reform
methodology (DHRM) that will be used to implement the annual Medicaid allotment reductions
identified in section 1923(f)(7) of the Social Security Act. The proposed DHRM relies on
statutorily identified factors to determine the state-specific DSH allotment reductions. The
methodology imposes larger reductions on states that have lower percentages of uninsured
individuals; states that do not target their DSH payments to hospitals with high volumes of
Medicaid inpatients; and states that do not target their DSH payments to hospitals with high
levels of uncompensated care. Additional reduction factors include whether a state is currently a
low-DSH or high-DSH state, as well as the extent to which a state’s DSH allotment was included
in the budget neutrality calculation for Medicaid coverage expansion as of July 2009. The
proposed rule also limits the reduction to be applied to each state to 90 percent of its original
unreduced allotment. Any excess reduction amounts called for by the reduction factors will be
redistributed to other states’ reduction amounts that do not exceed the reduction cap. The
aggregate reduction amounts are set to begin in Federal Fiscal Year 2018 and will run through
Federal Fiscal Year 2025.
The rule proposed by CMS was published on July 28, 2017, and the public had until August 28,
2017, to submit comments on the proposed methodology. When the public comment period has
concluded, CMS may make further changes to the proposed rule based on these comments. No
adjustments have been included in the Outlook to reduce the DSH funding allocated to Florida
because it is unknown how the proposed CMS rule will ultimately affect Florida, nor how the
Legislature will respond to any loss of these federal funds.
Litigation Against the State
Numerous lawsuits against the state exist at any point in time. Some have the capacity to disrupt
specific programs and services and to force changes and adjustments to the Outlook. These
lawsuits relate to a broad cross-section of the state’s activities including, but not limited to,
education funding, environmental matters, Medicaid, agricultural programs, and state revenue
sources. The state’s Comprehensive Annual Financial Report (CAFR) (Note 16) contains a list of
those legal matters which have significant associated loss contingencies.
In addition, a summary of the claimed fiscal impact of significant litigation filed against the state
is annually reported by the agencies in their legislative budget requests. Significant litigation
includes cases where the amount claimed is more than $1.0 million and cases challenging
significant statutory policies. In some cases, those summaries are based on the amount claimed
33 | P a g e
by the plaintiffs, which is typically higher than the amount to which the plaintiffs would actually
be entitled if they won.
Two areas of litigation warrant specific mention. First, cases seeking compensation for
residential citrus trees removed under the former Citrus Canker Eradication Program in Broward,
Lee, Palm Beach, and Orange counties referenced in the state’s 2016 CAFR could be fiscally
material. The judgments for compensation and attorney’s fees for these cases are final. During
the 2017 Session, the Legislature appropriated $20,941,328 for the Broward County judgments
and $16,475,000 for the Lee County judgments. These appropriations were subsequently vetoed
by the Governor. The homeowners in Broward and Lee counties filed a petition for writ of
mandamus in the Florida Supreme Court seeking to invalidate the Governor’s line item veto of
these appropriations. The Supreme Court denied the petition and remanded the cases to the trial
courts for further litigation relating to the homeowners’ attempts to compel payment by the state.
In Miami-Dade County, a liability trial took place in 2016 and on August 5, 2017, the trial judge
issued an order finding that the Department of Agriculture and Consumers was not liable for the
trees removed in that county.
Second, the Florida Department of Corrections is involved in various, though sometimes routine,
legal actions. However, some of the current lawsuits dealing with mental health facilities and
prisoners with the hepatitis C virus could have a significant fiscal impact depending upon the
outcome of the legal proceedings. These proceedings are in various stages of the legal process
and may be resolved within the Outlook period.
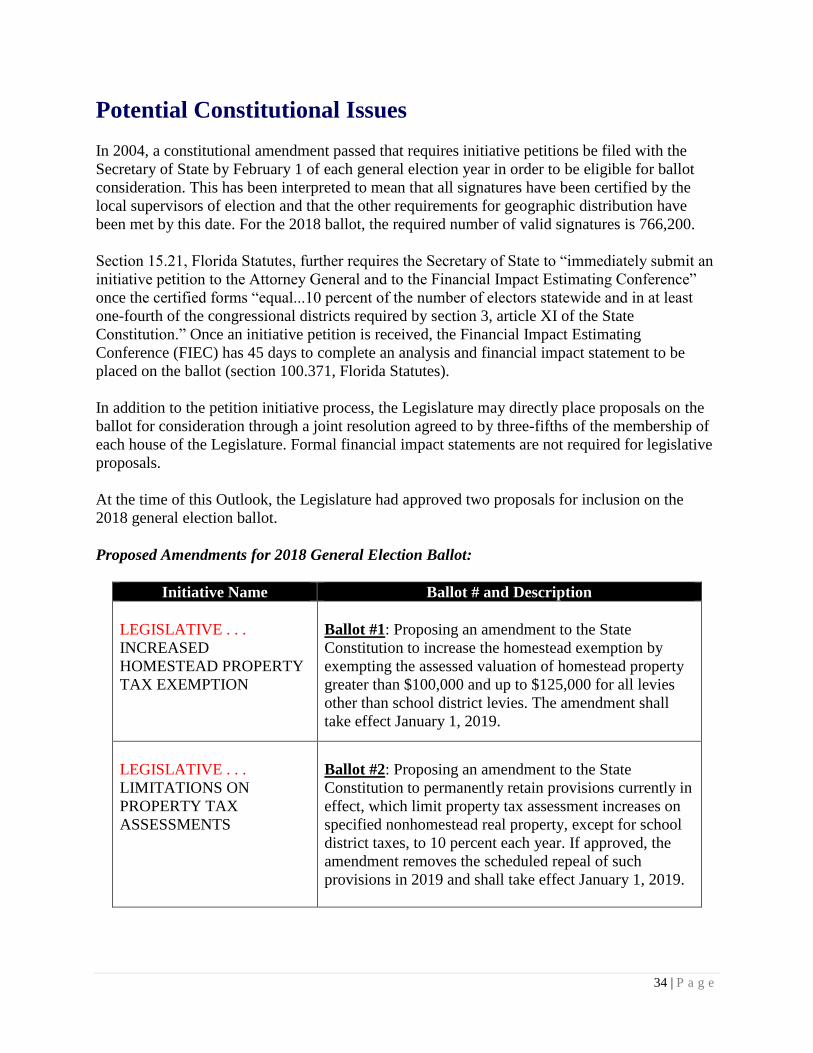
34 | P a g e
Potential Constitutional Issues
In 2004, a constitutional amendment passed that requires initiative petitions be filed with the
Secretary of State by February 1 of each general election year in order to be eligible for ballot
consideration. This has been interpreted to mean that all signatures have been certified by the
local supervisors of election and that the other requirements for geographic distribution have
been met by this date. For the 2018 ballot, the required number of valid signatures is 766,200.
Section 15.21, Florida Statutes, further requires the Secretary of State to “immediately submit an
initiative petition to the Attorney General and to the Financial Impact Estimating Conference”
once the certified forms “equal...10 percent of the number of electors statewide and in at least
one-fourth of the congressional districts required by section 3, article XI of the State
Constitution.” Once an initiative petition is received, the Financial Impact Estimating
Conference (FIEC) has 45 days to complete an analysis and financial impact statement to be
placed on the ballot (section 100.371, Florida Statutes).
In addition to the petition initiative process, the Legislature may directly place proposals on the
ballot for consideration through a joint resolution agreed to by three-fifths of the membership of
each house of the Legislature. Formal financial impact statements are not required for legislative
proposals.
At the time of this Outlook, the Legislature had approved two proposals for inclusion on the
2018 general election ballot.
Proposed Amendments for 2018 General Election Ballot:
Initiative Name Ballot # and Description
LEGISLATIVE . . .
INCREASED
HOMESTEAD PROPERTY
TAX EXEMPTION
Ballot #1: Proposing an amendment to the State
Constitution to increase the homestead exemption by
exempting the assessed valuation of homestead property
greater than $100,000 and up to $125,000 for all levies
other than school district levies. The amendment shall
take effect January 1, 2019.
LEGISLATIVE . . .
LIMITATIONS ON
PROPERTY TAX
ASSESSMENTS
Ballot #2: Proposing an amendment to the State
Constitution to permanently retain provisions currently in
effect, which limit property tax assessment increases on
specified nonhomestead real property, except for school
district taxes, to 10 percent each year. If approved, the
amendment removes the scheduled repeal of such
provisions in 2019 and shall take effect January 1, 2019.
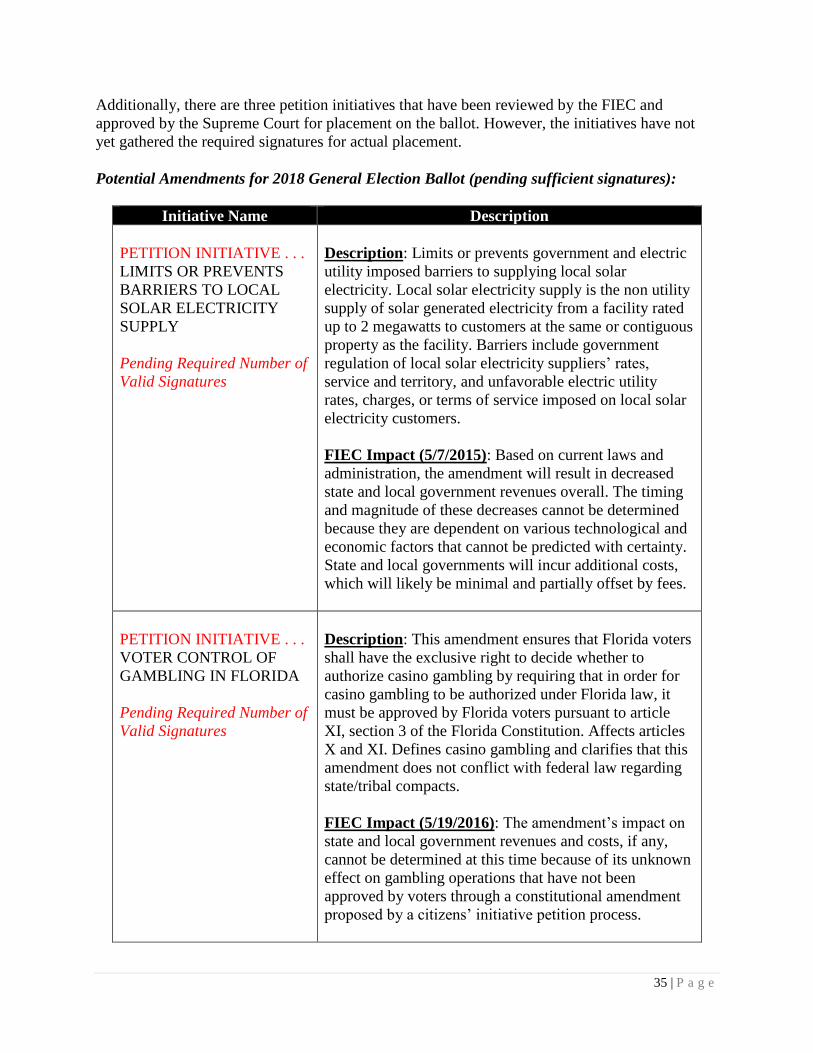
35 | P a g e
Additionally, there are three petition initiatives that have been reviewed by the FIEC and
approved by the Supreme Court for placement on the ballot. However, the initiatives have not
yet gathered the required signatures for actual placement.
Potential Amendments for 2018 General Election Ballot (pending sufficient signatures):
Initiative Name Description
PETITION INITIATIVE . . .
LIMITS OR PREVENTS
BARRIERS TO LOCAL
SOLAR ELECTRICITY
SUPPLY
Pending Required Number of
Valid Signatures
Description: Limits or prevents government and electric
utility imposed barriers to supplying local solar
electricity. Local solar electricity supply is the non utility
supply of solar generated electricity from a facility rated
up to 2 megawatts to customers at the same or contiguous
property as the facility. Barriers include government
regulation of local solar electricity suppliers’ rates,
service and territory, and unfavorable electric utility
rates, charges, or terms of service imposed on local solar
electricity customers.
FIEC Impact (5/7/2015): Based on current laws and
administration, the amendment will result in decreased
state and local government revenues overall. The timing
and magnitude of these decreases cannot be determined
because they are dependent on various technological and
economic factors that cannot be predicted with certainty.
State and local governments will incur additional costs,
which will likely be minimal and partially offset by fees.
PETITION INITIATIVE . . .
VOTER CONTROL OF
GAMBLING IN FLORIDA
Pending Required Number of
Valid Signatures
Description: This amendment ensures that Florida voters
shall have the exclusive right to decide whether to
authorize casino gambling by requiring that in order for
casino gambling to be authorized under Florida law, it
must be approved by Florida voters pursuant to article
XI, section 3 of the Florida Constitution. Affects articles
X and XI. Defines casino gambling and clarifies that this
amendment does not conflict with federal law regarding
state/tribal compacts.
FIEC Impact (5/19/2016): The amendment’s impact on
state and local government revenues and costs, if any,
cannot be determined at this time because of its unknown
effect on gambling operations that have not been
approved by voters through a constitutional amendment
proposed by a citizens’ initiative petition process.
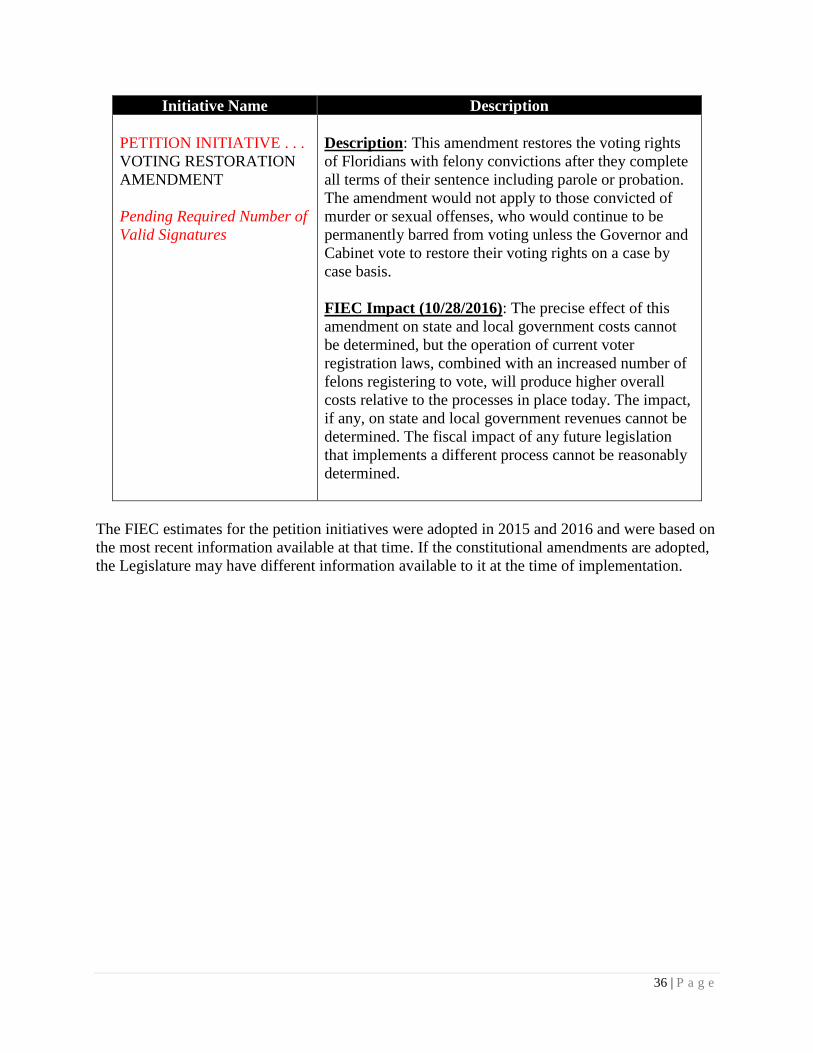
36 | P a g e
Initiative Name Description
PETITION INITIATIVE . . .
VOTING RESTORATION
AMENDMENT
Pending Required Number of
Valid Signatures
Description: This amendment restores the voting rights
of Floridians with felony convictions after they complete
all terms of their sentence including parole or probation.
The amendment would not apply to those convicted of
murder or sexual offenses, who would continue to be
permanently barred from voting unless the Governor and
Cabinet vote to restore their voting rights on a case by
case basis.
FIEC Impact (10/28/2016): The precise effect of this
amendment on state and local government costs cannot
be determined, but the operation of current voter
registration laws, combined with an increased number of
felons registering to vote, will produce higher overall
costs relative to the processes in place today. The impact,
if any, on state and local government revenues cannot be
determined. The fiscal impact of any future legislation
that implements a different process cannot be reasonably
determined.
The FIEC estimates for the petition initiatives were adopted in 2015 and 2016 and were based on
the most recent information available at that time. If the constitutional amendments are adopted,
the Legislature may have different information available to it at the time of implementation.
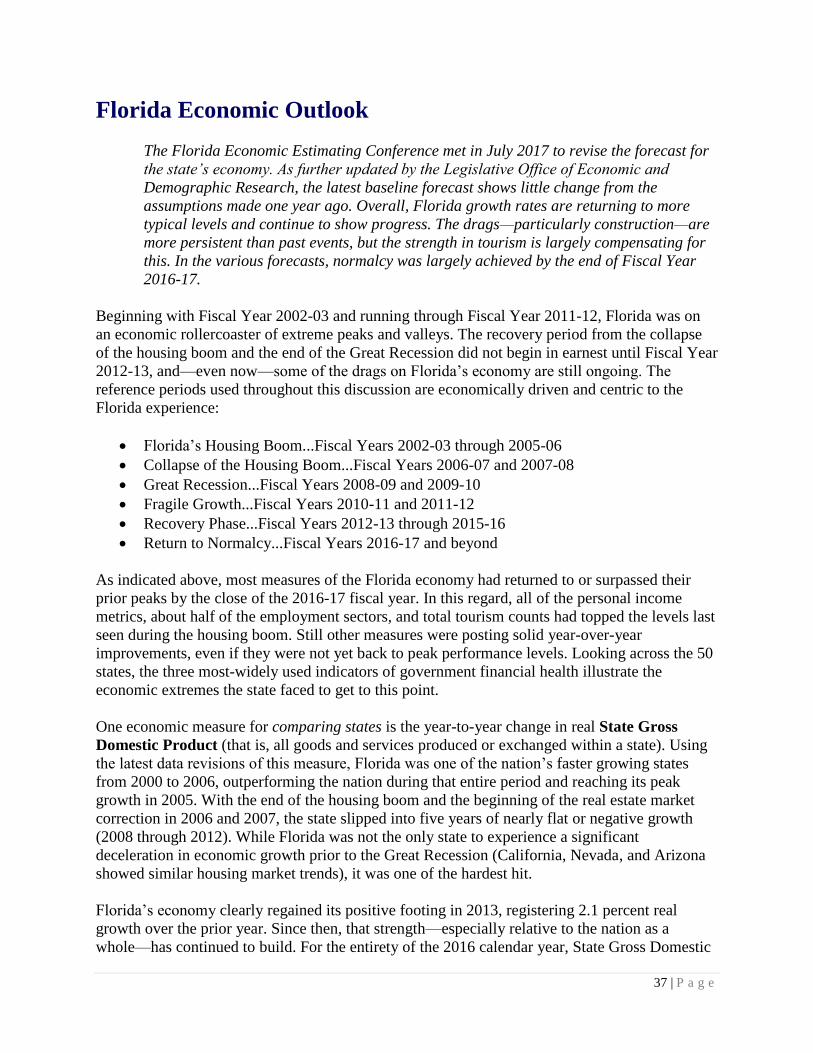
37 | P a g e
Florida Economic Outlook
The Florida Economic Estimating Conference met in July 2017 to revise the forecast for
the state’s economy. As further updated by the Legislative Office of Economic and
Demographic Research, the latest baseline forecast shows little change from the
assumptions made one year ago. Overall, Florida growth rates are returning to more
typical levels and continue to show progress. The drags—particularly construction—are
more persistent than past events, but the strength in tourism is largely compensating for
this. In the various forecasts, normalcy was largely achieved by the end of Fiscal Year
2016-17.
Beginning with Fiscal Year 2002-03 and running through Fiscal Year 2011-12, Florida was on
an economic rollercoaster of extreme peaks and valleys. The recovery period from the collapse
of the housing boom and the end of the Great Recession did not begin in earnest until Fiscal Year
2012-13, and—even now—some of the drags on Florida’s economy are still ongoing. The
reference periods used throughout this discussion are economically driven and centric to the
Florida experience:
Florida’s Housing Boom...Fiscal Years 2002-03 through 2005-06
Collapse of the Housing Boom...Fiscal Years 2006-07 and 2007-08
Great Recession...Fiscal Years 2008-09 and 2009-10
Fragile Growth...Fiscal Years 2010-11 and 2011-12
Recovery Phase...Fiscal Years 2012-13 through 2015-16
Return to Normalcy...Fiscal Years 2016-17 and beyond
As indicated above, most measures of the Florida economy had returned to or surpassed their
prior peaks by the close of the 2016-17 fiscal year. In this regard, all of the personal income
metrics, about half of the employment sectors, and total tourism counts had topped the levels last
seen during the housing boom. Still other measures were posting solid year-over-year
improvements, even if they were not yet back to peak performance levels. Looking across the 50
states, the three most-widely used indicators of government financial health illustrate the
economic extremes the state faced to get to this point.
One economic measure for comparing states is the year-to-year change in real State Gross
Domestic Product (that is, all goods and services produced or exchanged within a state). Using
the latest data revisions of this measure, Florida was one of the nation’s faster growing states
from 2000 to 2006, outperforming the nation during that entire period and reaching its peak
growth in 2005. With the end of the housing boom and the beginning of the real estate market
correction in 2006 and 2007, the state slipped into five years of nearly flat or negative growth
(2008 through 2012). While Florida was not the only state to experience a significant
deceleration in economic growth prior to the Great Recession (California, Nevada, and Arizona
showed similar housing market trends), it was one of the hardest hit.
Florida’s economy clearly regained its positive footing in 2013, registering 2.1 percent real
growth over the prior year. Since then, that strength—especially relative to the nation as a
whole—has continued to build. For the entirety of the 2016 calendar year, State Gross Domestic
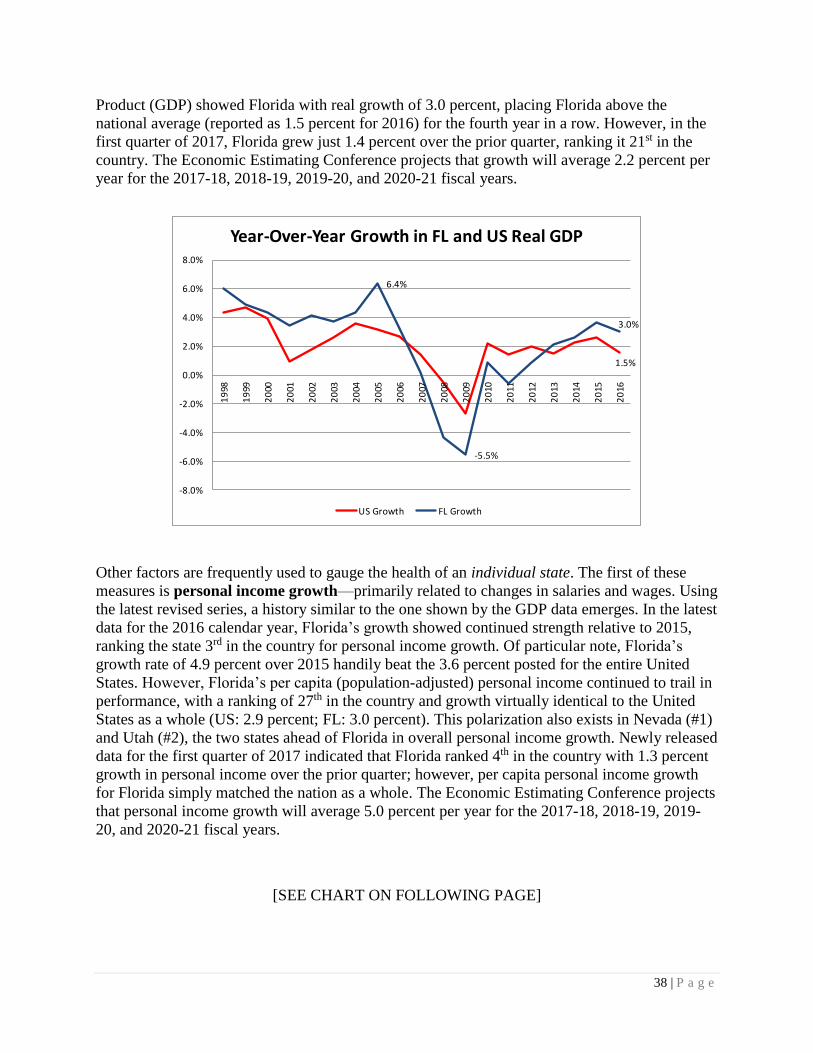
38 | P a g e
Product (GDP) showed Florida with real growth of 3.0 percent, placing Florida above the
national average (reported as 1.5 percent for 2016) for the fourth year in a row. However, in the
first quarter of 2017, Florida grew just 1.4 percent over the prior quarter, ranking it 21st in the
country. The Economic Estimating Conference projects that growth will average 2.2 percent per
year for the 2017-18, 2018-19, 2019-20, and 2020-21 fiscal years.
Other factors are frequently used to gauge the health of an individual state. The first of these
measures is personal income growth—primarily related to changes in salaries and wages. Using
the latest revised series, a history similar to the one shown by the GDP data emerges. In the latest
data for the 2016 calendar year, Florida’s growth showed continued strength relative to 2015,
ranking the state 3rd in the country for personal income growth. Of particular note, Florida’s
growth rate of 4.9 percent over 2015 handily beat the 3.6 percent posted for the entire United
States. However, Florida’s per capita (population-adjusted) personal income continued to trail in
performance, with a ranking of 27th in the country and growth virtually identical to the United
States as a whole (US: 2.9 percent; FL: 3.0 percent). This polarization also exists in Nevada (#1)
and Utah (#2), the two states ahead of Florida in overall personal income growth. Newly released
data for the first quarter of 2017 indicated that Florida ranked 4th in the country with 1.3 percent
growth in personal income over the prior quarter; however, per capita personal income growth
for Florida simply matched the nation as a whole. The Economic Estimating Conference projects
that personal income growth will average 5.0 percent per year for the 2017-18, 2018-19, 2019-
20, and 2020-21 fiscal years.
[SEE CHART ON FOLLOWING PAGE]
1.5%
6.4%
-5.5%
3.0%
-8.0%
-6.0%
-4.0%
-2.0%
0.0%
2.0%
4.0%
6.0%
8.0%
19
98
19
99
20
00
20
01
20
02
20
03
20
04
20
05
20
06
20
07
20
08
20
09
20
10
20
11
20
12
20
13
20
14
20
15
20
16
Year-Over-Year Growth in FL and US Real GDP
US Growth FL Growth
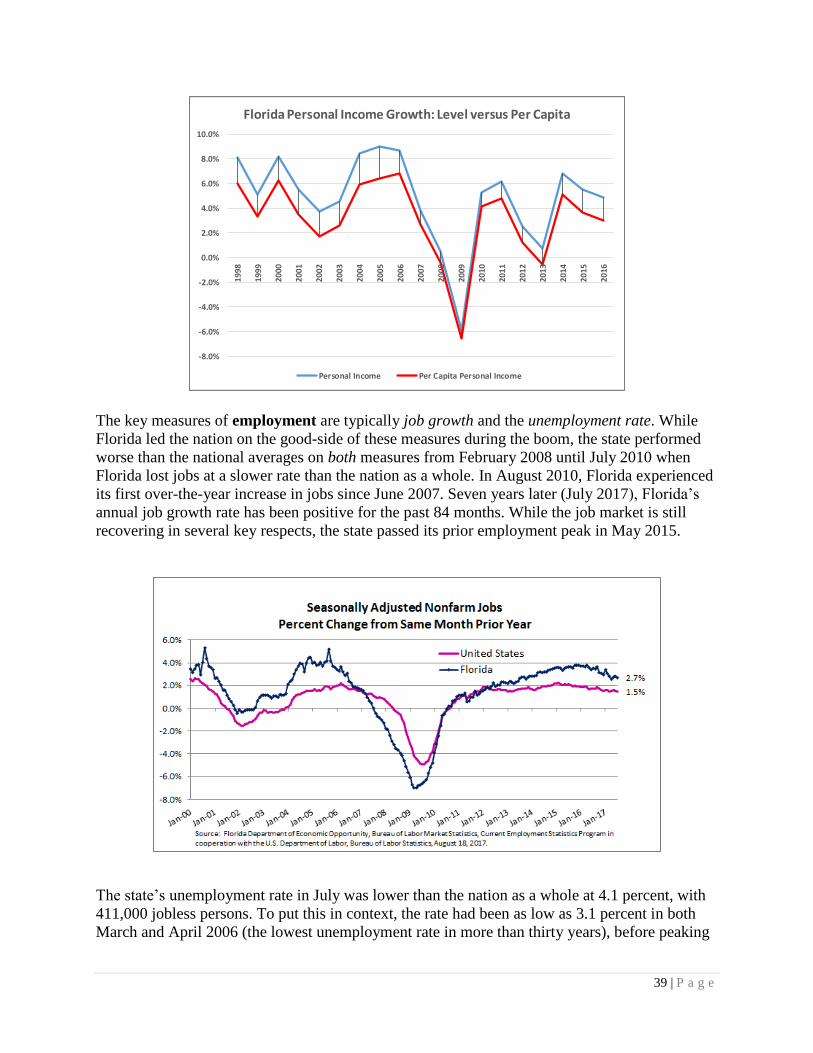
39 | P a g e
The key measures of employment are typically job growth and the unemployment rate. While
Florida led the nation on the good-side of these measures during the boom, the state performed
worse than the national averages on both measures from February 2008 until July 2010 when
Florida lost jobs at a slower rate than the nation as a whole. In August 2010, Florida experienced
its first over-the-year increase in jobs since June 2007. Seven years later (July 2017), Florida’s
annual job growth rate has been positive for the past 84 months. While the job market is still
recovering in several key respects, the state passed its prior employment peak in May 2015.
The state’s unemployment rate in July was lower than the nation as a whole at 4.1 percent, with
411,000 jobless persons. To put this in context, the rate had been as low as 3.1 percent in both
March and April 2006 (the lowest unemployment rate in more than thirty years), before peaking
-8.0%
-6.0%
-4.0%
-2.0%
0.0%
2.0%
4.0%
6.0%
8.0%
10.0%
19
98
19
99
20
00
20
01
20
02
20
03
20
04
20
05
20
06
20
07
20
08
20
09
20
10
20
11
20
12
20
13
20
14
20
15
20
16
Florida Personal Income Growth: Level versus Per Capita
Personal Income Per Capita Personal Income
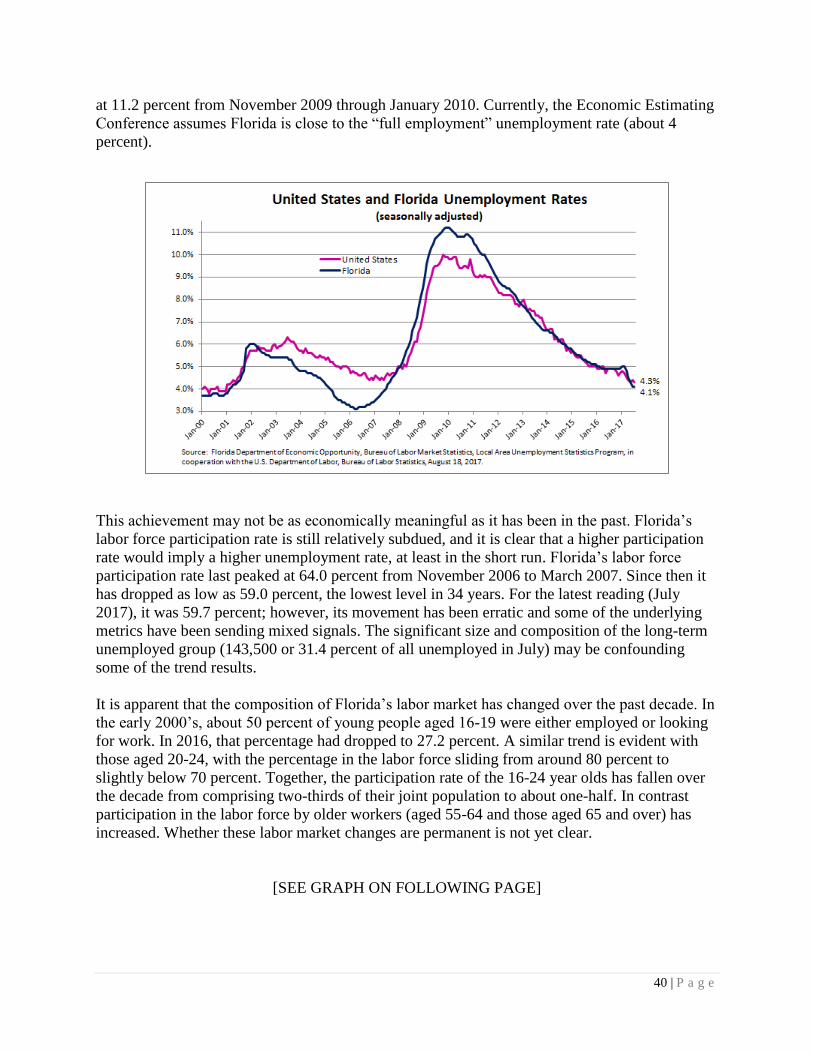
40 | P a g e
at 11.2 percent from November 2009 through January 2010. Currently, the Economic Estimating
Conference assumes Florida is close to the “full employment” unemployment rate (about 4
percent).
This achievement may not be as economically meaningful as it has been in the past. Florida’s
labor force participation rate is still relatively subdued, and it is clear that a higher participation
rate would imply a higher unemployment rate, at least in the short run. Florida’s labor force
participation rate last peaked at 64.0 percent from November 2006 to March 2007. Since then it
has dropped as low as 59.0 percent, the lowest level in 34 years. For the latest reading (July
2017), it was 59.7 percent; however, its movement has been erratic and some of the underlying
metrics have been sending mixed signals. The significant size and composition of the long-term
unemployed group (143,500 or 31.4 percent of all unemployed in July) may be confounding
some of the trend results.
It is apparent that the composition of Florida’s labor market has changed over the past decade. In
the early 2000’s, about 50 percent of young people aged 16-19 were either employed or looking
for work. In 2016, that percentage had dropped to 27.2 percent. A similar trend is evident with
those aged 20-24, with the percentage in the labor force sliding from around 80 percent to
slightly below 70 percent. Together, the participation rate of the 16-24 year olds has fallen over
the decade from comprising two-thirds of their joint population to about one-half. In contrast
participation in the labor force by older workers (aged 55-64 and those aged 65 and over) has
increased. Whether these labor market changes are permanent is not yet clear.
[SEE GRAPH ON FOLLOWING PAGE]
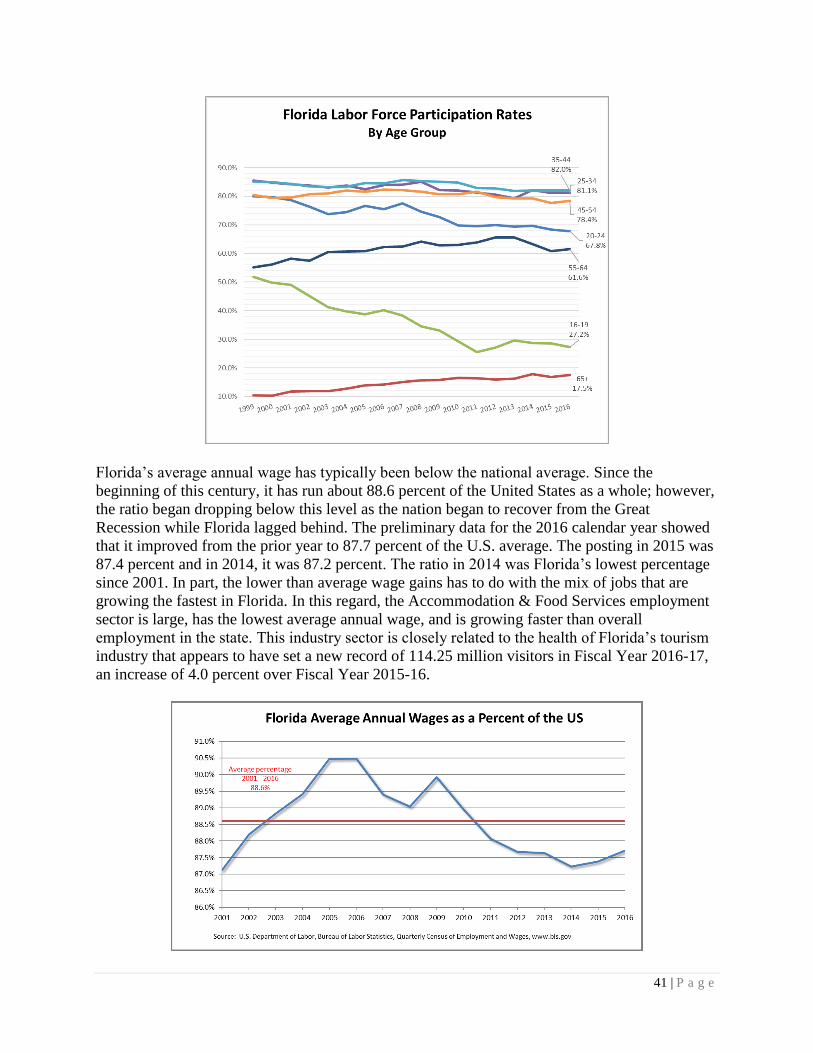
41 | P a g e
Florida’s average annual wage has typically been below the national average. Since the
beginning of this century, it has run about 88.6 percent of the United States as a whole; however,
the ratio began dropping below this level as the nation began to recover from the Great
Recession while Florida lagged behind. The preliminary data for the 2016 calendar year showed
that it improved from the prior year to 87.7 percent of the U.S. average. The posting in 2015 was
87.4 percent and in 2014, it was 87.2 percent. The ratio in 2014 was Florida’s lowest percentage
since 2001. In part, the lower than average wage gains has to do with the mix of jobs that are
growing the fastest in Florida. In this regard, the Accommodation & Food Services employment
sector is large, has the lowest average annual wage, and is growing faster than overall
employment in the state. This industry sector is closely related to the health of Florida’s tourism
industry that appears to have set a new record of 114.25 million visitors in Fiscal Year 2016-17,
an increase of 4.0 percent over Fiscal Year 2015-16.
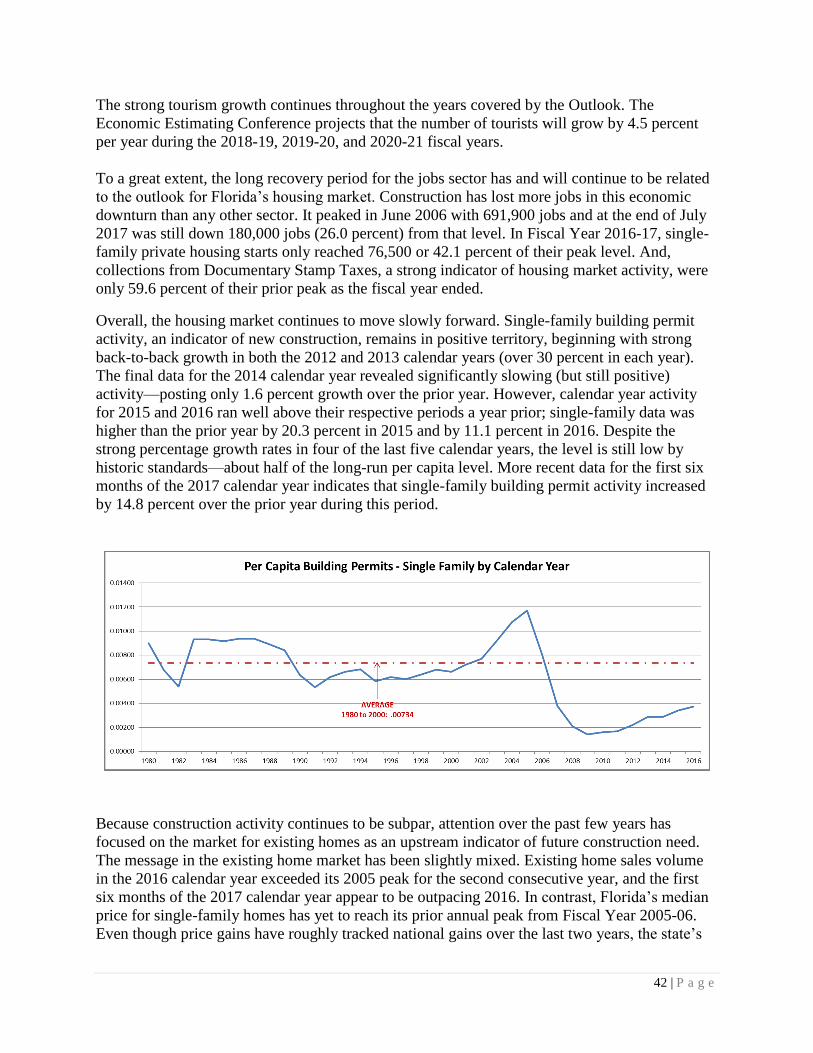
42 | P a g e
The strong tourism growth continues throughout the years covered by the Outlook. The
Economic Estimating Conference projects that the number of tourists will grow by 4.5 percent
per year during the 2018-19, 2019-20, and 2020-21 fiscal years.
To a great extent, the long recovery period for the jobs sector has and will continue to be related
to the outlook for Florida’s housing market. Construction has lost more jobs in this economic
downturn than any other sector. It peaked in June 2006 with 691,900 jobs and at the end of July
2017 was still down 180,000 jobs (26.0 percent) from that level. In Fiscal Year 2016-17, single-
family private housing starts only reached 76,500 or 42.1 percent of their peak level. And,
collections from Documentary Stamp Taxes, a strong indicator of housing market activity, were
only 59.6 percent of their prior peak as the fiscal year ended.
Overall, the housing market continues to move slowly forward. Single-family building permit
activity, an indicator of new construction, remains in positive territory, beginning with strong
back-to-back growth in both the 2012 and 2013 calendar years (over 30 percent in each year).
The final data for the 2014 calendar year revealed significantly slowing (but still positive)
activity—posting only 1.6 percent growth over the prior year. However, calendar year activity
for 2015 and 2016 ran well above their respective periods a year prior; single-family data was
higher than the prior year by 20.3 percent in 2015 and by 11.1 percent in 2016. Despite the
strong percentage growth rates in four of the last five calendar years, the level is still low by
historic standards—about half of the long-run per capita level. More recent data for the first six
months of the 2017 calendar year indicates that single-family building permit activity increased
by 14.8 percent over the prior year during this period.
Because construction activity continues to be subpar, attention over the past few years has
focused on the market for existing homes as an upstream indicator of future construction need.
The message in the existing home market has been slightly mixed. Existing home sales volume
in the 2016 calendar year exceeded its 2005 peak for the second consecutive year, and the first
six months of the 2017 calendar year appear to be outpacing 2016. In contrast, Florida’s median
price for single-family homes has yet to reach its prior annual peak from Fiscal Year 2005-06.
Even though price gains have roughly tracked national gains over the last two years, the state’s
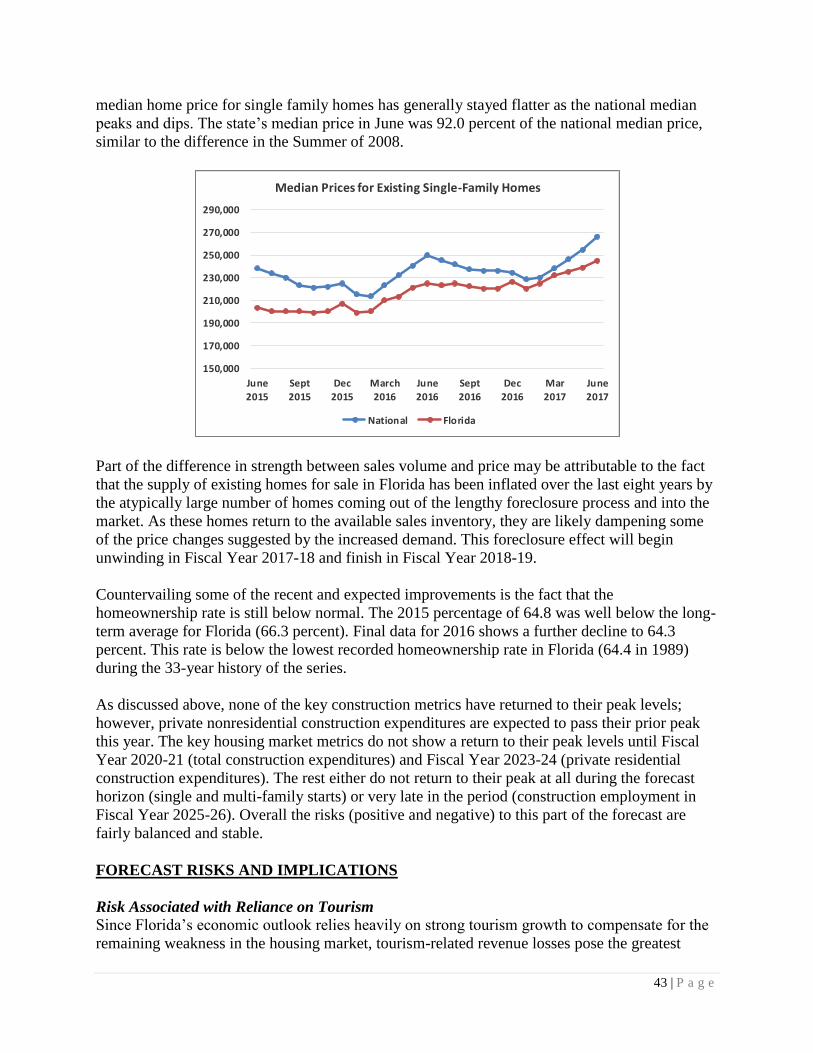
43 | P a g e
median home price for single family homes has generally stayed flatter as the national median
peaks and dips. The state’s median price in June was 92.0 percent of the national median price,
similar to the difference in the Summer of 2008.
Part of the difference in strength between sales volume and price may be attributable to the fact
that the supply of existing homes for sale in Florida has been inflated over the last eight years by
the atypically large number of homes coming out of the lengthy foreclosure process and into the
market. As these homes return to the available sales inventory, they are likely dampening some
of the price changes suggested by the increased demand. This foreclosure effect will begin
unwinding in Fiscal Year 2017-18 and finish in Fiscal Year 2018-19.
Countervailing some of the recent and expected improvements is the fact that the
homeownership rate is still below normal. The 2015 percentage of 64.8 was well below the long-
term average for Florida (66.3 percent). Final data for 2016 shows a further decline to 64.3
percent. This rate is below the lowest recorded homeownership rate in Florida (64.4 in 1989)
during the 33-year history of the series.
As discussed above, none of the key construction metrics have returned to their peak levels;
however, private nonresidential construction expenditures are expected to pass their prior peak
this year. The key housing market metrics do not show a return to their peak levels until Fiscal
Year 2020-21 (total construction expenditures) and Fiscal Year 2023-24 (private residential
construction expenditures). The rest either do not return to their peak at all during the forecast
horizon (single and multi-family starts) or very late in the period (construction employment in
Fiscal Year 2025-26). Overall the risks (positive and negative) to this part of the forecast are
fairly balanced and stable.
FORECAST RISKS AND IMPLICATIONS
Risk Associated with Reliance on Tourism
Since Florida’s economic outlook relies heavily on strong tourism growth to compensate for the
remaining weakness in the housing market, tourism-related revenue losses pose the greatest
150,000
170,000
190,000
210,000
230,000
250,000
270,000
290,000
June
2015
Sept
2015
Dec
2015
March
2016
June
2016
Sept
2016
Dec
2016
Mar
2017
June
2017
Median Prices for Existing Single-Family Homes
National Florida
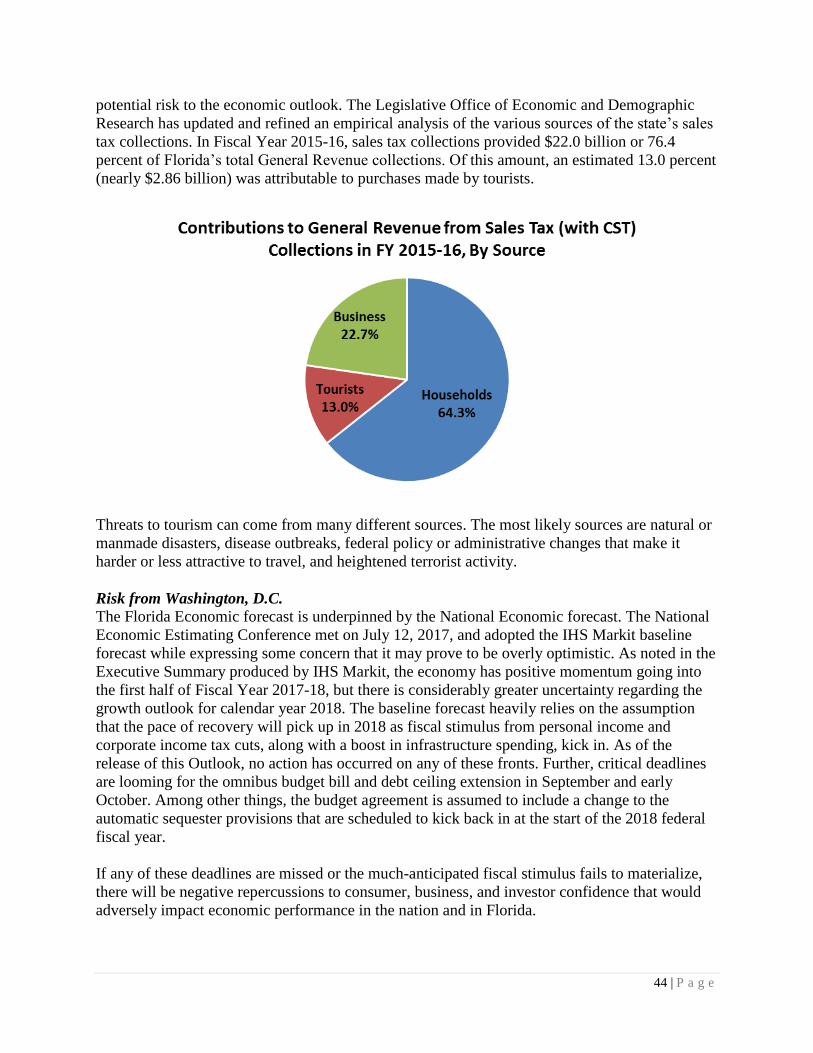
44 | P a g e
potential risk to the economic outlook. The Legislative Office of Economic and Demographic
Research has updated and refined an empirical analysis of the various sources of the state’s sales
tax collections. In Fiscal Year 2015-16, sales tax collections provided $22.0 billion or 76.4
percent of Florida’s total General Revenue collections. Of this amount, an estimated 13.0 percent
(nearly $2.86 billion) was attributable to purchases made by tourists.
Threats to tourism can come from many different sources. The most likely sources are natural or
manmade disasters, disease outbreaks, federal policy or administrative changes that make it
harder or less attractive to travel, and heightened terrorist activity.
Risk from Washington, D.C.
The Florida Economic forecast is underpinned by the National Economic forecast. The National
Economic Estimating Conference met on July 12, 2017, and adopted the IHS Markit baseline
forecast while expressing some concern that it may prove to be overly optimistic. As noted in the
Executive Summary produced by IHS Markit, the economy has positive momentum going into
the first half of Fiscal Year 2017-18, but there is considerably greater uncertainty regarding the
growth outlook for calendar year 2018. The baseline forecast heavily relies on the assumption
that the pace of recovery will pick up in 2018 as fiscal stimulus from personal income and
corporate income tax cuts, along with a boost in infrastructure spending, kick in. As of the
release of this Outlook, no action has occurred on any of these fronts. Further, critical deadlines
are looming for the omnibus budget bill and debt ceiling extension in September and early
October. Among other things, the budget agreement is assumed to include a change to the
automatic sequester provisions that are scheduled to kick back in at the start of the 2018 federal
fiscal year.
If any of these deadlines are missed or the much-anticipated fiscal stimulus fails to materialize,
there will be negative repercussions to consumer, business, and investor confidence that would
adversely impact economic performance in the nation and in Florida.
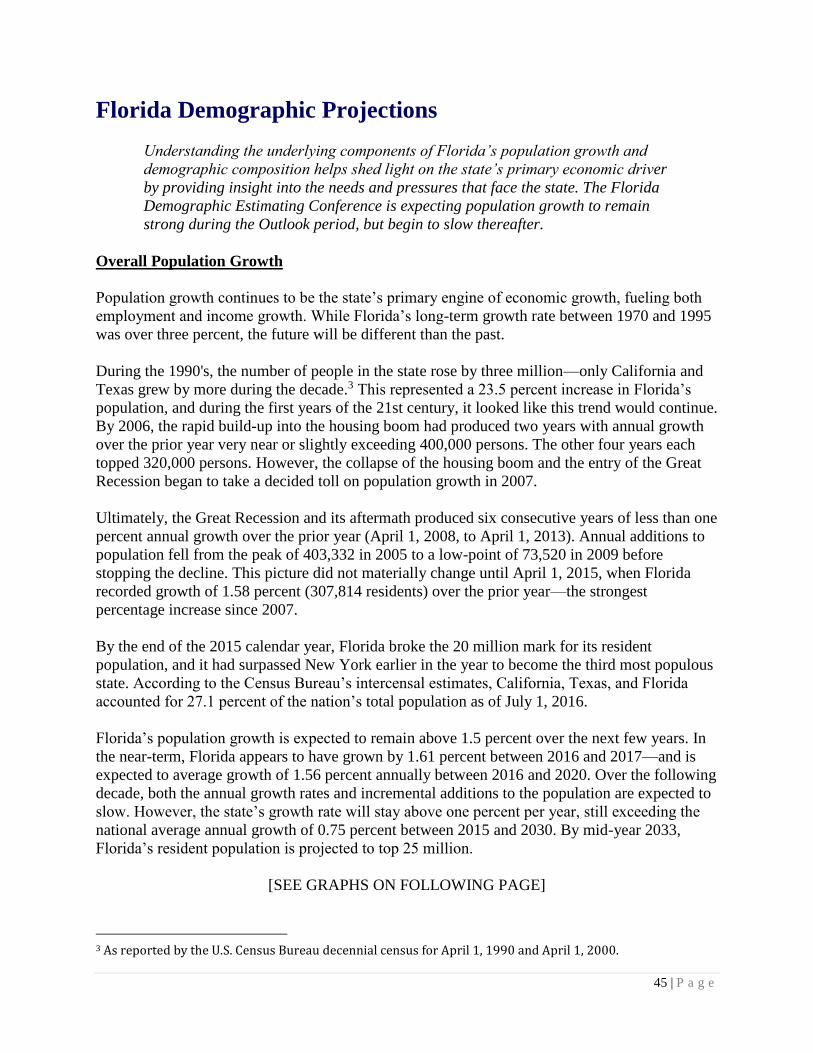
45 | P a g e
Florida Demographic Projections
Understanding the underlying components of Florida’s population growth and
demographic composition helps shed light on the state’s primary economic driver
by providing insight into the needs and pressures that face the state. The Florida
Demographic Estimating Conference is expecting population growth to remain
strong during the Outlook period, but begin to slow thereafter.
Overall Population Growth
Population growth continues to be the state’s primary engine of economic growth, fueling both
employment and income growth. While Florida’s long-term growth rate between 1970 and 1995
was over three percent, the future will be different than the past.
During the 1990's, the number of people in the state rose by three million—only California and
Texas grew by more during the decade.3 This represented a 23.5 percent increase in Florida’s
population, and during the first years of the 21st century, it looked like this trend would continue.
By 2006, the rapid build-up into the housing boom had produced two years with annual growth
over the prior year very near or slightly exceeding 400,000 persons. The other four years each
topped 320,000 persons. However, the collapse of the housing boom and the entry of the Great
Recession began to take a decided toll on population growth in 2007.
Ultimately, the Great Recession and its aftermath produced six consecutive years of less than one
percent annual growth over the prior year (April 1, 2008, to April 1, 2013). Annual additions to
population fell from the peak of 403,332 in 2005 to a low-point of 73,520 in 2009 before
stopping the decline. This picture did not materially change until April 1, 2015, when Florida
recorded growth of 1.58 percent (307,814 residents) over the prior year—the strongest
percentage increase since 2007.
By the end of the 2015 calendar year, Florida broke the 20 million mark for its resident
population, and it had surpassed New York earlier in the year to become the third most populous
state. According to the Census Bureau’s intercensal estimates, California, Texas, and Florida
accounted for 27.1 percent of the nation’s total population as of July 1, 2016.
Florida’s population growth is expected to remain above 1.5 percent over the next few years. In
the near-term, Florida appears to have grown by 1.61 percent between 2016 and 2017—and is
expected to average growth of 1.56 percent annually between 2016 and 2020. Over the following
decade, both the annual growth rates and incremental additions to the population are expected to
slow. However, the state’s growth rate will stay above one percent per year, still exceeding the
national average annual growth of 0.75 percent between 2015 and 2030. By mid-year 2033,
Florida’s resident population is projected to top 25 million.
[SEE GRAPHS ON FOLLOWING PAGE]
3 As reported by the U.S. Census Bureau decennial census for April 1, 1990 and April 1, 2000.
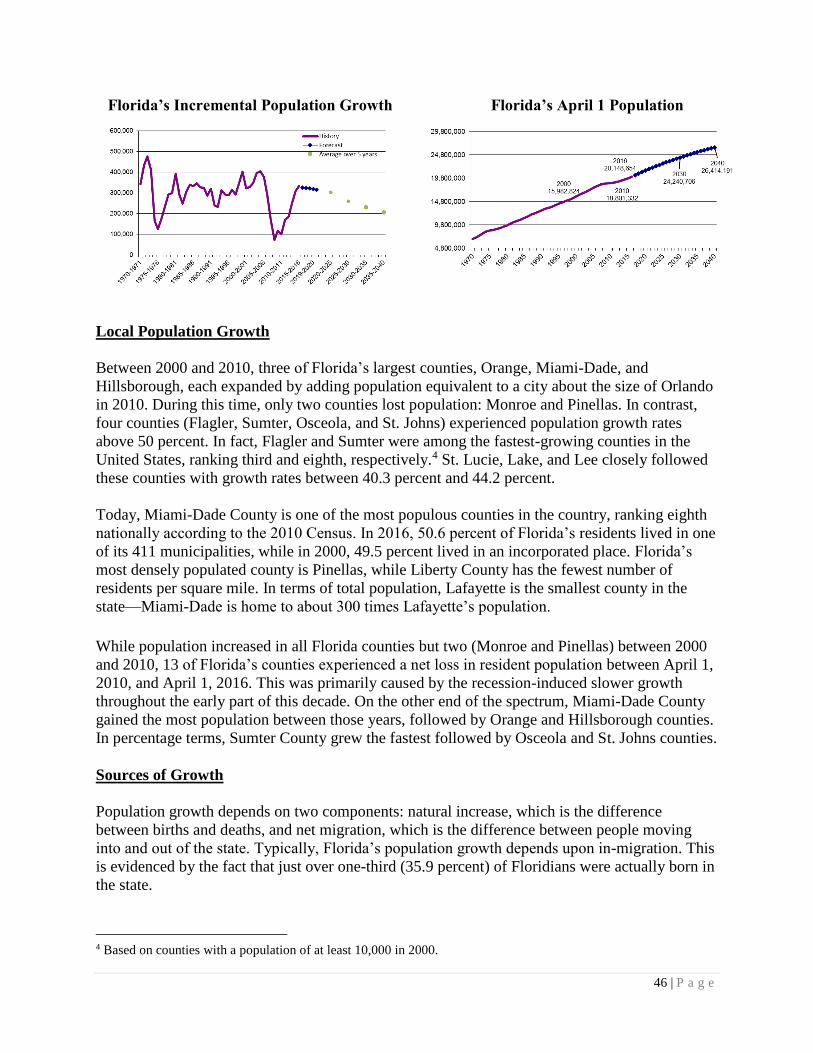
46 | P a g e
Florida’s Incremental Population Growth Florida’s April 1 Population
Local Population Growth
Between 2000 and 2010, three of Florida’s largest counties, Orange, Miami-Dade, and
Hillsborough, each expanded by adding population equivalent to a city about the size of Orlando
in 2010. During this time, only two counties lost population: Monroe and Pinellas. In contrast,
four counties (Flagler, Sumter, Osceola, and St. Johns) experienced population growth rates
above 50 percent. In fact, Flagler and Sumter were among the fastest-growing counties in the
United States, ranking third and eighth, respectively.4 St. Lucie, Lake, and Lee closely followed
these counties with growth rates between 40.3 percent and 44.2 percent.
Today, Miami-Dade County is one of the most populous counties in the country, ranking eighth
nationally according to the 2010 Census. In 2016, 50.6 percent of Florida’s residents lived in one
of its 411 municipalities, while in 2000, 49.5 percent lived in an incorporated place. Florida’s
most densely populated county is Pinellas, while Liberty County has the fewest number of
residents per square mile. In terms of total population, Lafayette is the smallest county in the
state—Miami-Dade is home to about 300 times Lafayette’s population.
While population increased in all Florida counties but two (Monroe and Pinellas) between 2000
and 2010, 13 of Florida’s counties experienced a net loss in resident population between April 1,
2010, and April 1, 2016. This was primarily caused by the recession-induced slower growth
throughout the early part of this decade. On the other end of the spectrum, Miami-Dade County
gained the most population between those years, followed by Orange and Hillsborough counties.
In percentage terms, Sumter County grew the fastest followed by Osceola and St. Johns counties.
Sources of Growth
Population growth depends on two components: natural increase, which is the difference
between births and deaths, and net migration, which is the difference between people moving
into and out of the state. Typically, Florida’s population growth depends upon in-migration. This
is evidenced by the fact that just over one-third (35.9 percent) of Floridians were actually born in
the state.
4 Based on counties with a population of at least 10,000 in 2000.
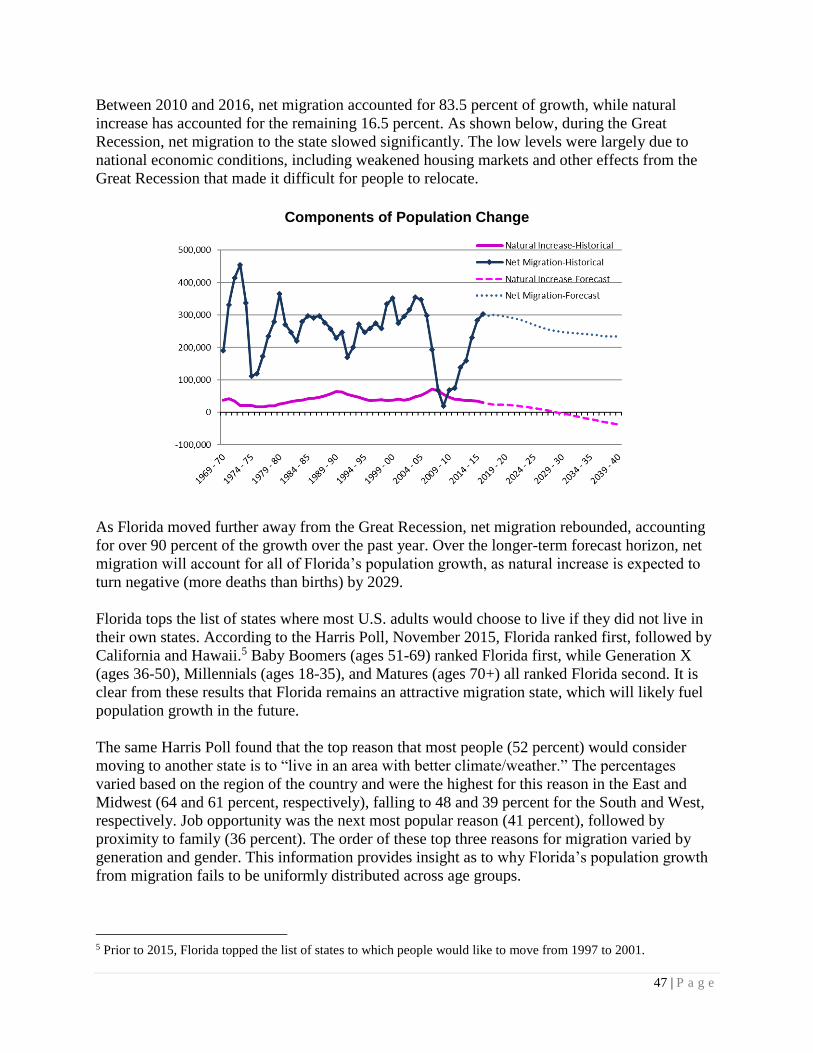
47 | P a g e
Between 2010 and 2016, net migration accounted for 83.5 percent of growth, while natural
increase has accounted for the remaining 16.5 percent. As shown below, during the Great
Recession, net migration to the state slowed significantly. The low levels were largely due to
national economic conditions, including weakened housing markets and other effects from the
Great Recession that made it difficult for people to relocate.
Components of Population Change
As Florida moved further away from the Great Recession, net migration rebounded, accounting
for over 90 percent of the growth over the past year. Over the longer-term forecast horizon, net
migration will account for all of Florida’s population growth, as natural increase is expected to
turn negative (more deaths than births) by 2029.
Florida tops the list of states where most U.S. adults would choose to live if they did not live in
their own states. According to the Harris Poll, November 2015, Florida ranked first, followed by
California and Hawaii.5 Baby Boomers (ages 51-69) ranked Florida first, while Generation X
(ages 36-50), Millennials (ages 18-35), and Matures (ages 70+) all ranked Florida second. It is
clear from these results that Florida remains an attractive migration state, which will likely fuel
population growth in the future.
The same Harris Poll found that the top reason that most people (52 percent) would consider
moving to another state is to “live in an area with better climate/weather.” The percentages
varied based on the region of the country and were the highest for this reason in the East and
Midwest (64 and 61 percent, respectively), falling to 48 and 39 percent for the South and West,
respectively. Job opportunity was the next most popular reason (41 percent), followed by
proximity to family (36 percent). The order of these top three reasons for migration varied by
generation and gender. This information provides insight as to why Florida’s population growth
from migration fails to be uniformly distributed across age groups.
5 Prior to 2015, Florida topped the list of states to which people would like to move from 1997 to 2001.
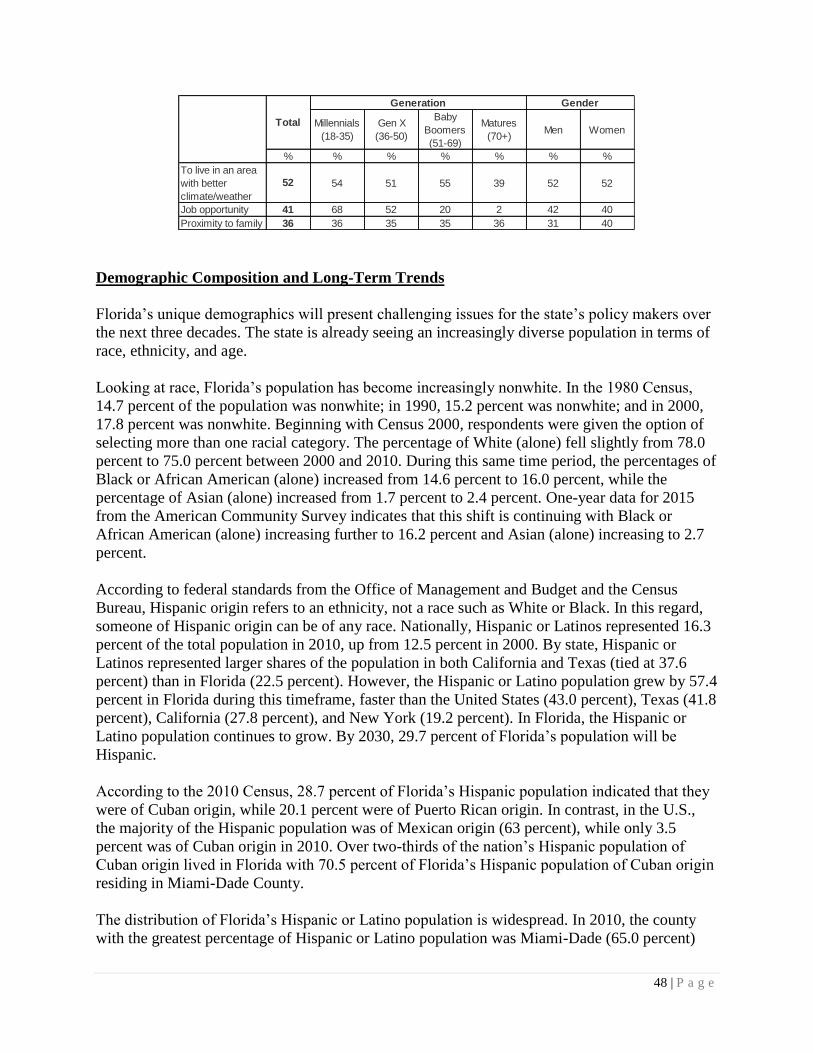
48 | P a g e
Demographic Composition and Long-Term Trends
Florida’s unique demographics will present challenging issues for the state’s policy makers over
the next three decades. The state is already seeing an increasingly diverse population in terms of
race, ethnicity, and age.
Looking at race, Florida’s population has become increasingly nonwhite. In the 1980 Census,
14.7 percent of the population was nonwhite; in 1990, 15.2 percent was nonwhite; and in 2000,
17.8 percent was nonwhite. Beginning with Census 2000, respondents were given the option of
selecting more than one racial category. The percentage of White (alone) fell slightly from 78.0
percent to 75.0 percent between 2000 and 2010. During this same time period, the percentages of
Black or African American (alone) increased from 14.6 percent to 16.0 percent, while the
percentage of Asian (alone) increased from 1.7 percent to 2.4 percent. One-year data for 2015
from the American Community Survey indicates that this shift is continuing with Black or
African American (alone) increasing further to 16.2 percent and Asian (alone) increasing to 2.7
percent.
According to federal standards from the Office of Management and Budget and the Census
Bureau, Hispanic origin refers to an ethnicity, not a race such as White or Black. In this regard,
someone of Hispanic origin can be of any race. Nationally, Hispanic or Latinos represented 16.3
percent of the total population in 2010, up from 12.5 percent in 2000. By state, Hispanic or
Latinos represented larger shares of the population in both California and Texas (tied at 37.6
percent) than in Florida (22.5 percent). However, the Hispanic or Latino population grew by 57.4
percent in Florida during this timeframe, faster than the United States (43.0 percent), Texas (41.8
percent), California (27.8 percent), and New York (19.2 percent). In Florida, the Hispanic or
Latino population continues to grow. By 2030, 29.7 percent of Florida’s population will be
Hispanic.
According to the 2010 Census, 28.7 percent of Florida’s Hispanic population indicated that they
were of Cuban origin, while 20.1 percent were of Puerto Rican origin. In contrast, in the U.S.,
the majority of the Hispanic population was of Mexican origin (63 percent), while only 3.5
percent was of Cuban origin in 2010. Over two-thirds of the nation’s Hispanic population of
Cuban origin lived in Florida with 70.5 percent of Florida’s Hispanic population of Cuban origin
residing in Miami-Dade County.
The distribution of Florida’s Hispanic or Latino population is widespread. In 2010, the county
with the greatest percentage of Hispanic or Latino population was Miami-Dade (65.0 percent)
Millennials
(18-35)
Gen X
(36-50)
Baby
Boomers
(51-69)
Matures
(70+)Men Women
% % % % % % %
To live in an area
with better
climate/weather
52 54 51 55 39 52 52
Job opportunity 41 68 52 20 2 42 40
Proximity to family 36 36 35 35 36 31 40
Total
Generation Gender
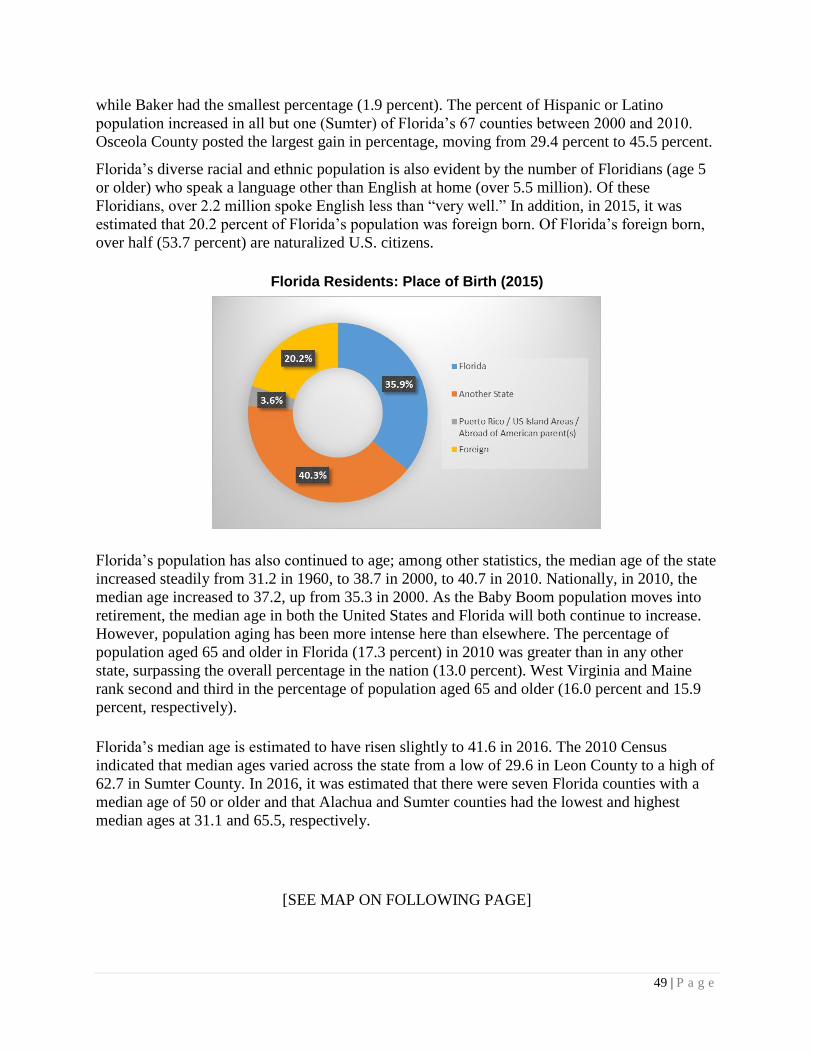
49 | P a g e
while Baker had the smallest percentage (1.9 percent). The percent of Hispanic or Latino
population increased in all but one (Sumter) of Florida’s 67 counties between 2000 and 2010.
Osceola County posted the largest gain in percentage, moving from 29.4 percent to 45.5 percent.
Florida’s diverse racial and ethnic population is also evident by the number of Floridians (age 5
or older) who speak a language other than English at home (over 5.5 million). Of these
Floridians, over 2.2 million spoke English less than “very well.” In addition, in 2015, it was
estimated that 20.2 percent of Florida’s population was foreign born. Of Florida’s foreign born,
over half (53.7 percent) are naturalized U.S. citizens.
Florida Residents: Place of Birth (2015)
Florida’s population has also continued to age; among other statistics, the median age of the state
increased steadily from 31.2 in 1960, to 38.7 in 2000, to 40.7 in 2010. Nationally, in 2010, the
median age increased to 37.2, up from 35.3 in 2000. As the Baby Boom population moves into
retirement, the median age in both the United States and Florida will both continue to increase.
However, population aging has been more intense here than elsewhere. The percentage of
population aged 65 and older in Florida (17.3 percent) in 2010 was greater than in any other
state, surpassing the overall percentage in the nation (13.0 percent). West Virginia and Maine
rank second and third in the percentage of population aged 65 and older (16.0 percent and 15.9
percent, respectively).
Florida’s median age is estimated to have risen slightly to 41.6 in 2016. The 2010 Census
indicated that median ages varied across the state from a low of 29.6 in Leon County to a high of
62.7 in Sumter County. In 2016, it was estimated that there were seven Florida counties with a
median age of 50 or older and that Alachua and Sumter counties had the lowest and highest
median ages at 31.1 and 65.5, respectively.
[SEE MAP ON FOLLOWING PAGE]
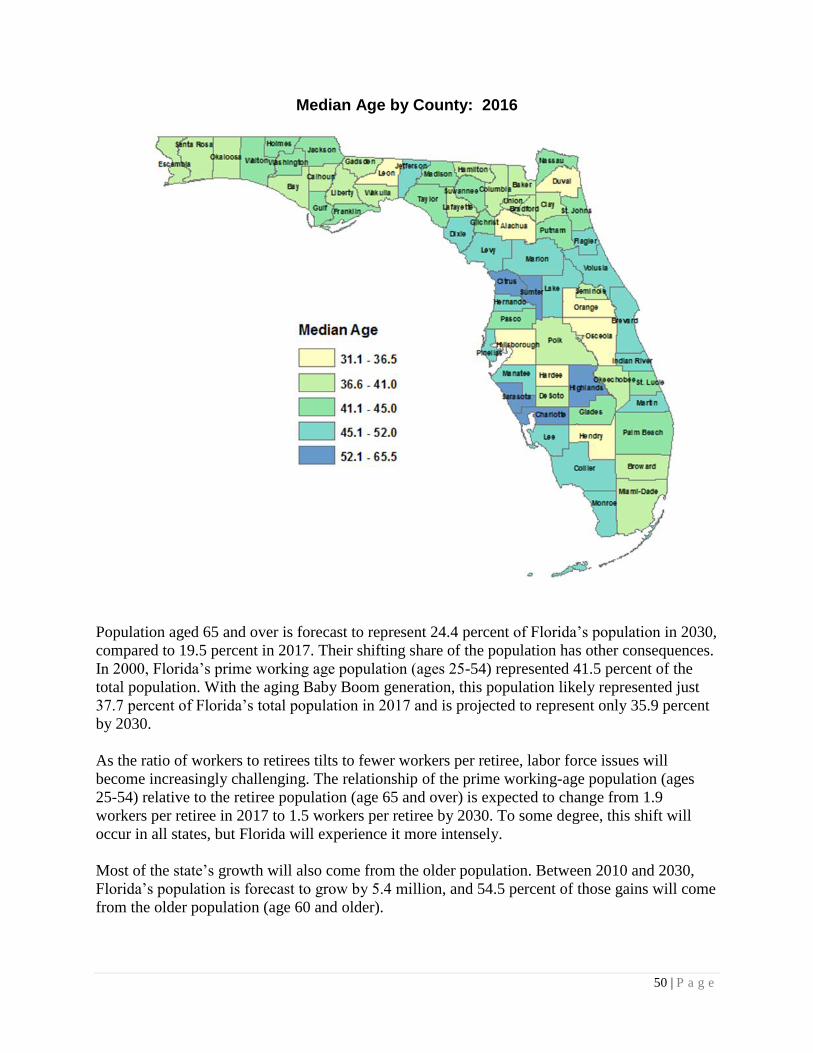
50 | P a g e
Median Age by County: 2016
Population aged 65 and over is forecast to represent 24.4 percent of Florida’s population in 2030,
compared to 19.5 percent in 2017. Their shifting share of the population has other consequences.
In 2000, Florida’s prime working age population (ages 25-54) represented 41.5 percent of the
total population. With the aging Baby Boom generation, this population likely represented just
37.7 percent of Florida’s total population in 2017 and is projected to represent only 35.9 percent
by 2030.
As the ratio of workers to retirees tilts to fewer workers per retiree, labor force issues will
become increasingly challenging. The relationship of the prime working-age population (ages
25-54) relative to the retiree population (age 65 and over) is expected to change from 1.9
workers per retiree in 2017 to 1.5 workers per retiree by 2030. To some degree, this shift will
occur in all states, but Florida will experience it more intensely.
Most of the state’s growth will also come from the older population. Between 2010 and 2030,
Florida’s population is forecast to grow by 5.4 million, and 54.5 percent of those gains will come
from the older population (age 60 and older).
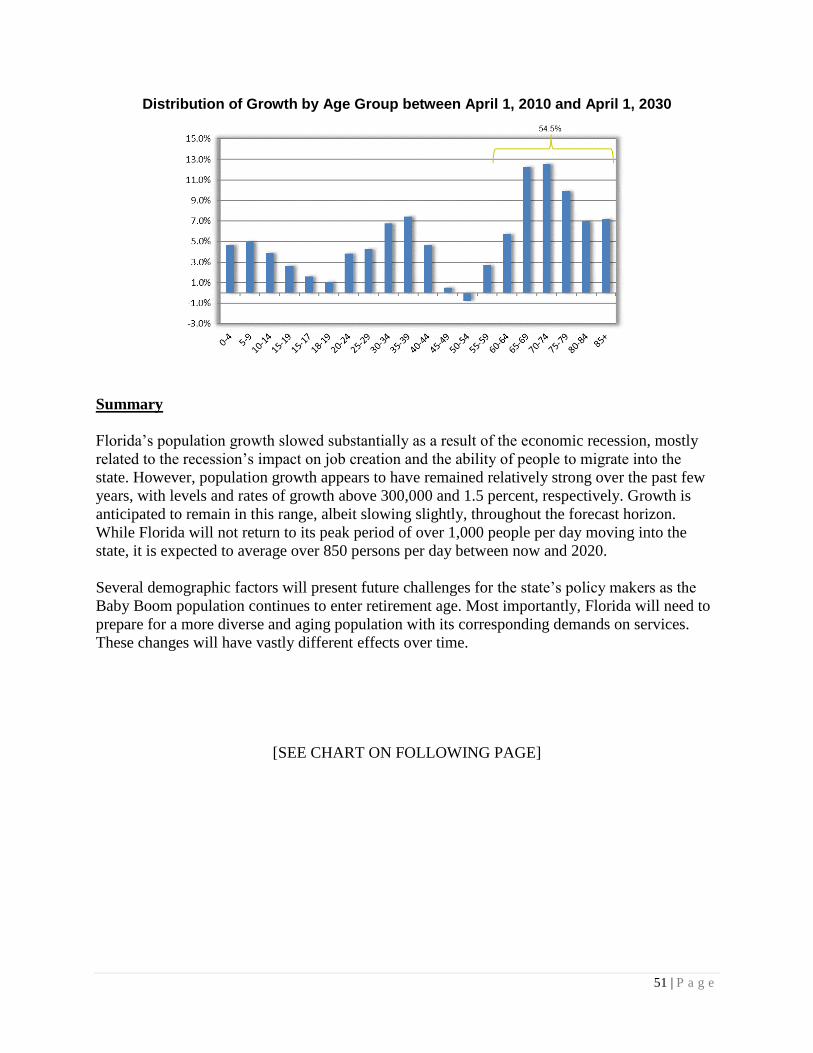
51 | P a g e
Distribution of Growth by Age Group between April 1, 2010 and April 1, 2030
Summary
Florida’s population growth slowed substantially as a result of the economic recession, mostly
related to the recession’s impact on job creation and the ability of people to migrate into the
state. However, population growth appears to have remained relatively strong over the past few
years, with levels and rates of growth above 300,000 and 1.5 percent, respectively. Growth is
anticipated to remain in this range, albeit slowing slightly, throughout the forecast horizon.
While Florida will not return to its peak period of over 1,000 people per day moving into the
state, it is expected to average over 850 persons per day between now and 2020.
Several demographic factors will present future challenges for the state’s policy makers as the
Baby Boom population continues to enter retirement age. Most importantly, Florida will need to
prepare for a more diverse and aging population with its corresponding demands on services.
These changes will have vastly different effects over time.
[SEE CHART ON FOLLOWING PAGE]
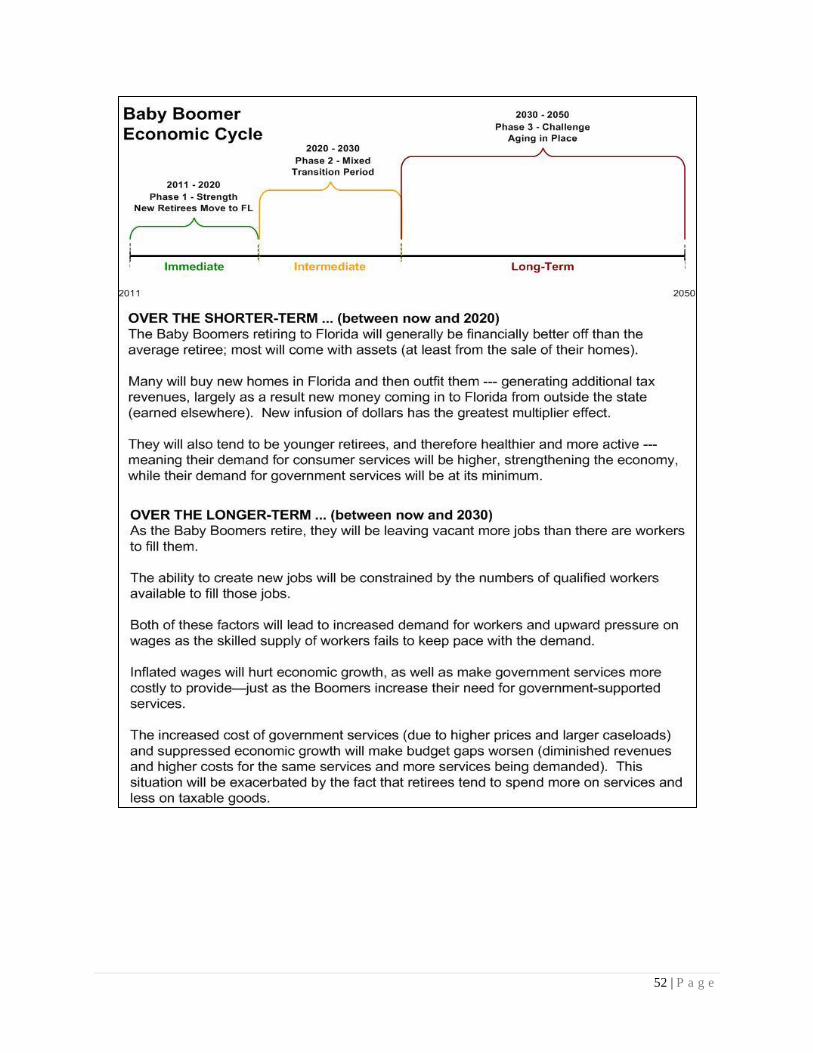
52 | P a g e
53 | P a g e
Revenue Projections
Throughout the summer, the Revenue Estimating Conference met to finalize numbers for
Fiscal Year 2016-17 and to develop new forecasts for the upcoming years. Overall
revenue projections continue to track closely to prior forecasts. By far, the most
significant change was to Indian Gaming revenues. It was unrelated to the natural
growth of the underlying source, but rather to a legal action and uncertainty regarding
future receipts.
I. General Revenue Fund
A. Forecast Overview
For the 2016-17 fiscal year, total collections exceeded the estimate by just $35.6 million or only
one-tenth of one percent. Based on the slightly weaker near-term National and Florida economic
forecasts, the new forecast for overall General Revenue would have essentially matched the old
forecast in the short-term; however, recognition of Indian Gaming revenue share payments
associated with banked card games resulted in a net increase in the estimate. Overall, anticipated
revenues were revised upward by $132.2 million in Fiscal Year 2017-18 and by $188.1 million
in Fiscal Year 2018-19, for a two-year total of $320.3 million.
The revised Fiscal Year 2017-18 estimate exceeds the prior year’s collections by $1.33 billion
(or 4.5 percent). The revised forecast for Fiscal Year 2018-19 has projected growth of $1.28
billion (or 4.1 percent) over the revised Fiscal Year 2017-18 estimate. The growth rate for Fiscal
Year 2019-20 was unchanged at 4.0 percent, and for Fiscal Year 2020-21 it was increased from
3.6 percent to 3.7 percent, with the resulting dollar levels staying similar to the prior forecast.
Most of the changes to the individual revenue sources were minor, with positives and negatives
across the sources largely offsetting each other. Only two adjustments were significant and
persistent over the forecast period. They are both discussed below:
Sales Tax... The annual estimates were reduced by $143.2 million in Fiscal Year 2017-18
and by $148.7 million in Fiscal Year 2018-19 to reflect the slightly weaker economic
drivers coming from other forecasts. Five of the six sales tax categories were adjusted
downwards, with the greatest two-year change to Tourism & Recreation.
Corporate Income Tax and Refunds... The forecast revisions of $65.2 million in Fiscal
Year 2017-18 and $90.4 million in Fiscal Year 2018-19 reflect higher-than-expected
recent collections and the slightly stronger corporate profit growth rates adopted by the
National Economic Estimating Conference in July.
Several of the revisions to the forecast (Tobacco Taxes, Article V Fees & Transfers, and
Highway Safety Licenses & Fees) were the results of earlier conferences. Most importantly, the
Revenue Estimating Conference for Indian Gaming made significant changes. In addition to
adopting an estimate of future revenue amounts, that Conference took two actions that affect the
treatment of past and future receipts. First, based on the Settlement Agreement and Stipulation
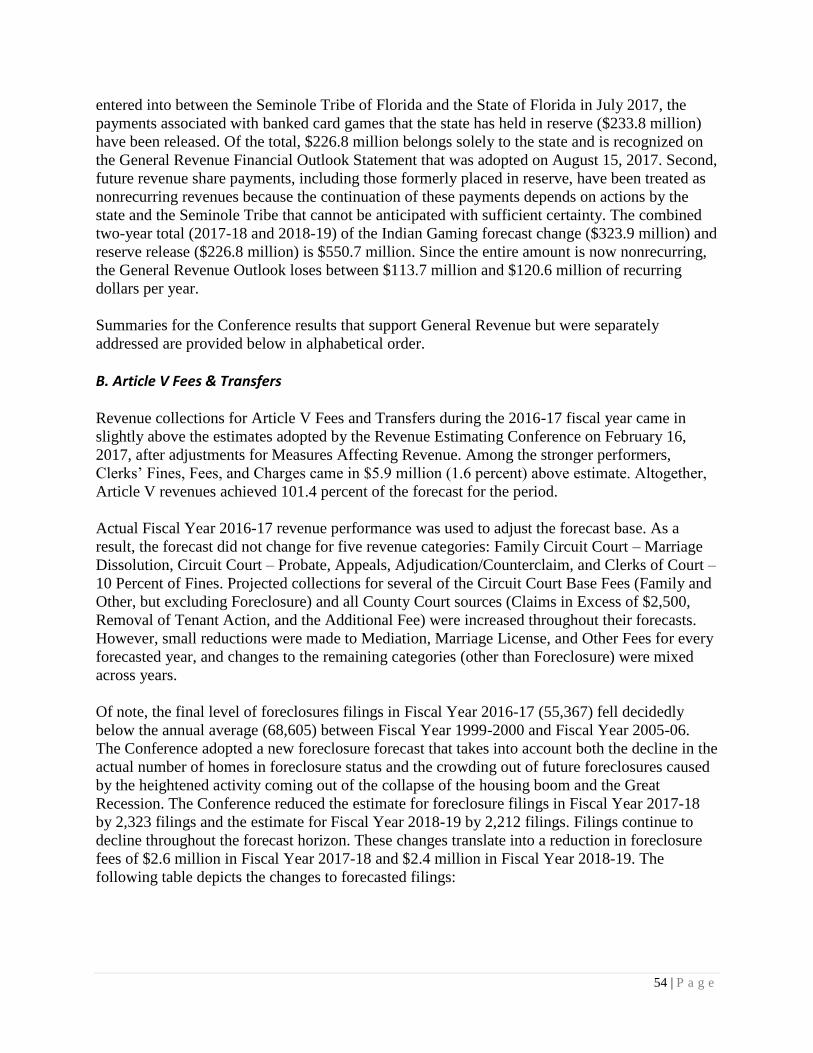
54 | P a g e
entered into between the Seminole Tribe of Florida and the State of Florida in July 2017, the
payments associated with banked card games that the state has held in reserve ($233.8 million)
have been released. Of the total, $226.8 million belongs solely to the state and is recognized on
the General Revenue Financial Outlook Statement that was adopted on August 15, 2017. Second,
future revenue share payments, including those formerly placed in reserve, have been treated as
nonrecurring revenues because the continuation of these payments depends on actions by the
state and the Seminole Tribe that cannot be anticipated with sufficient certainty. The combined
two-year total (2017-18 and 2018-19) of the Indian Gaming forecast change ($323.9 million) and
reserve release ($226.8 million) is $550.7 million. Since the entire amount is now nonrecurring,
the General Revenue Outlook loses between $113.7 million and $120.6 million of recurring
dollars per year.
Summaries for the Conference results that support General Revenue but were separately
addressed are provided below in alphabetical order.
B. Article V Fees & Transfers
Revenue collections for Article V Fees and Transfers during the 2016-17 fiscal year came in
slightly above the estimates adopted by the Revenue Estimating Conference on February 16,
2017, after adjustments for Measures Affecting Revenue. Among the stronger performers,
Clerks’ Fines, Fees, and Charges came in $5.9 million (1.6 percent) above estimate. Altogether,
Article V revenues achieved 101.4 percent of the forecast for the period.
Actual Fiscal Year 2016-17 revenue performance was used to adjust the forecast base. As a
result, the forecast did not change for five revenue categories: Family Circuit Court – Marriage
Dissolution, Circuit Court – Probate, Appeals, Adjudication/Counterclaim, and Clerks of Court –
10 Percent of Fines. Projected collections for several of the Circuit Court Base Fees (Family and
Other, but excluding Foreclosure) and all County Court sources (Claims in Excess of $2,500,
Removal of Tenant Action, and the Additional Fee) were increased throughout their forecasts.
However, small reductions were made to Mediation, Marriage License, and Other Fees for every
forecasted year, and changes to the remaining categories (other than Foreclosure) were mixed
across years.
Of note, the final level of foreclosures filings in Fiscal Year 2016-17 (55,367) fell decidedly
below the annual average (68,605) between Fiscal Year 1999-2000 and Fiscal Year 2005-06.
The Conference adopted a new foreclosure forecast that takes into account both the decline in the
actual number of homes in foreclosure status and the crowding out of future foreclosures caused
by the heightened activity coming out of the collapse of the housing boom and the Great
Recession. The Conference reduced the estimate for foreclosure filings in Fiscal Year 2017-18
by 2,323 filings and the estimate for Fiscal Year 2018-19 by 2,212 filings. Filings continue to
decline throughout the forecast horizon. These changes translate into a reduction in foreclosure
fees of $2.6 million in Fiscal Year 2017-18 and $2.4 million in Fiscal Year 2018-19. The
following table depicts the changes to forecasted filings:
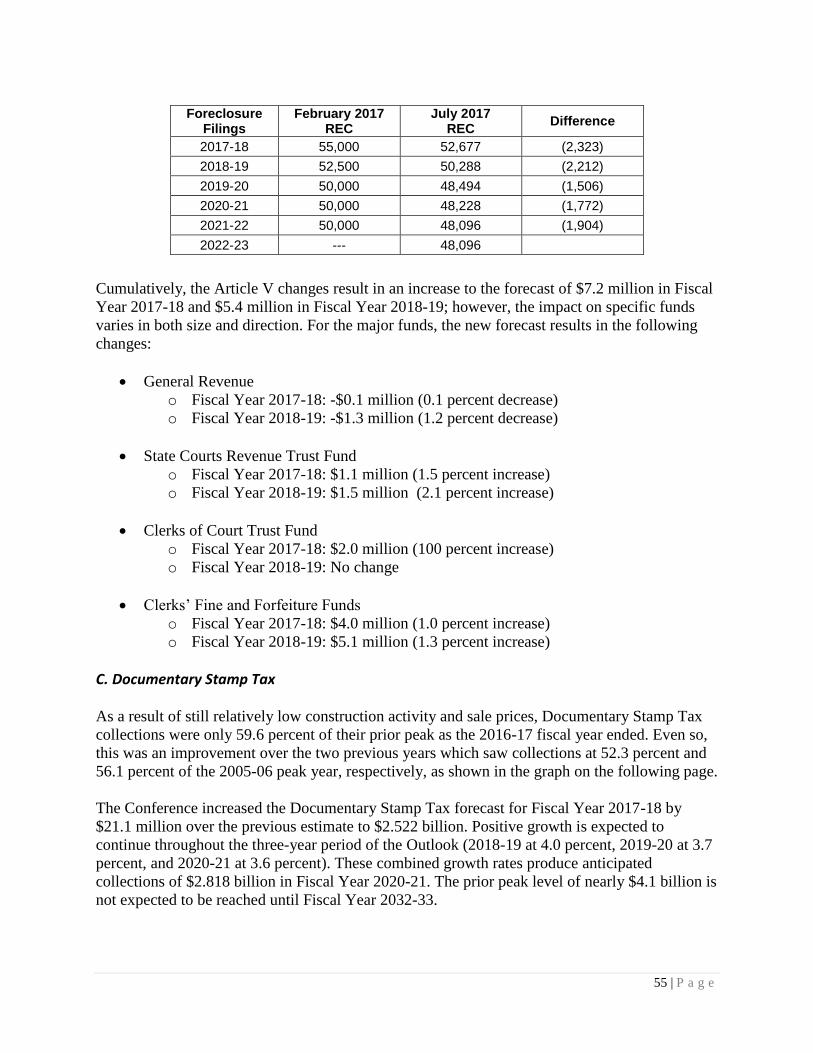
55 | P a g e
Cumulatively, the Article V changes result in an increase to the forecast of $7.2 million in Fiscal
Year 2017-18 and $5.4 million in Fiscal Year 2018-19; however, the impact on specific funds
varies in both size and direction. For the major funds, the new forecast results in the following
changes:
General Revenue
o Fiscal Year 2017-18: -$0.1 million (0.1 percent decrease)
o Fiscal Year 2018-19: -$1.3 million (1.2 percent decrease)
State Courts Revenue Trust Fund
o Fiscal Year 2017-18: $1.1 million (1.5 percent increase)
o Fiscal Year 2018-19: $1.5 million (2.1 percent increase)
Clerks of Court Trust Fund
o Fiscal Year 2017-18: $2.0 million (100 percent increase)
o Fiscal Year 2018-19: No change
Clerks’ Fine and Forfeiture Funds
o Fiscal Year 2017-18: $4.0 million (1.0 percent increase)
o Fiscal Year 2018-19: $5.1 million (1.3 percent increase)
C. Documentary Stamp Tax
As a result of still relatively low construction activity and sale prices, Documentary Stamp Tax
collections were only 59.6 percent of their prior peak as the 2016-17 fiscal year ended. Even so,
this was an improvement over the two previous years which saw collections at 52.3 percent and
56.1 percent of the 2005-06 peak year, respectively, as shown in the graph on the following page.
The Conference increased the Documentary Stamp Tax forecast for Fiscal Year 2017-18 by
$21.1 million over the previous estimate to $2.522 billion. Positive growth is expected to
continue throughout the three-year period of the Outlook (2018-19 at 4.0 percent, 2019-20 at 3.7
percent, and 2020-21 at 3.6 percent). These combined growth rates produce anticipated
collections of $2.818 billion in Fiscal Year 2020-21. The prior peak level of nearly $4.1 billion is
not expected to be reached until Fiscal Year 2032-33.
Foreclosure Filings
February 2017 REC
July 2017 REC
Difference
2017-18 55,000 52,677 (2,323)
2018-19 52,500 50,288 (2,212)
2019-20 50,000 48,494 (1,506)
2020-21 50,000 48,228 (1,772)
2021-22 50,000 48,096 (1,904)
2022-23 --- 48,096
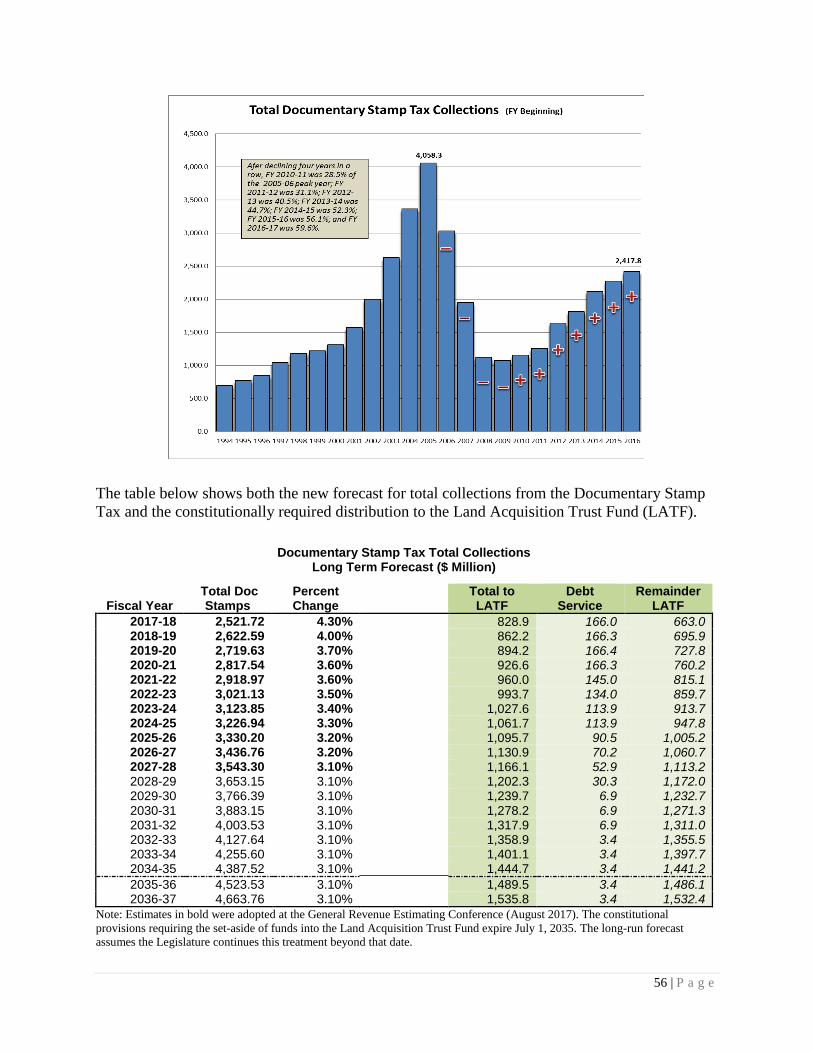
56 | P a g e
The table below shows both the new forecast for total collections from the Documentary Stamp
Tax and the constitutionally required distribution to the Land Acquisition Trust Fund (LATF).
Documentary Stamp Tax Total Collections
Long Term Forecast ($ Million)
Fiscal Year Total Doc
Stamps Percent Change
Total to LATF
Debt Service
Remainder LATF
2017-18 2,521.72 4.30% 828.9 166.0 663.0 2018-19 2,622.59 4.00% 862.2 166.3 695.9 2019-20 2,719.63 3.70% 894.2 166.4 727.8 2020-21 2,817.54 3.60% 926.6 166.3 760.2 2021-22 2,918.97 3.60% 960.0 145.0 815.1 2022-23 3,021.13 3.50% 993.7 134.0 859.7 2023-24 3,123.85 3.40% 1,027.6 113.9 913.7 2024-25 3,226.94 3.30% 1,061.7 113.9 947.8 2025-26 3,330.20 3.20% 1,095.7 90.5 1,005.2 2026-27 3,436.76 3.20% 1,130.9 70.2 1,060.7 2027-28 3,543.30 3.10% 1,166.1 52.9 1,113.2 2028-29 3,653.15 3.10% 1,202.3 30.3 1,172.0 2029-30 3,766.39 3.10% 1,239.7 6.9 1,232.7 2030-31 3,883.15 3.10% 1,278.2 6.9 1,271.3 2031-32 4,003.53 3.10% 1,317.9 6.9 1,311.0 2032-33 4,127.64 3.10% 1,358.9 3.4 1,355.5 2033-34 4,255.60 3.10% 1,401.1 3.4 1,397.7 2034-35 4,387.52 3.10% 1,444.7 3.4 1,441.2
2035-36 4,523.53 3.10% 1,489.5 3.4 1,486.1 2036-37 4,663.76 3.10% 1,535.8 3.4 1,532.4
Note: Estimates in bold were adopted at the General Revenue Estimating Conference (August 2017). The constitutional
provisions requiring the set-aside of funds into the Land Acquisition Trust Fund expire July 1, 2035. The long-run forecast
assumes the Legislature continues this treatment beyond that date.
57 | P a g e
D. Highway Safety Fees
Adopted July 28, 2017, the new forecast for Highway Safety Licenses and Fees (HSMV) is
mostly positive by fund relative to the previous forecast adopted in March 2017 and adjusted for
Measures Affecting Revenue. By variable, the positive changes in a few categories exceeded the
smaller downward adjustments across a larger number of categories, generating the overall
higher forecast. Each of the first four years of the forecast has an increase in total ranging from a
low of $10.6 million (Fiscal Year 2020-21) to a high of $16.7 million (Fiscal Year 2018-19).
Only the fifth year (Fiscal Year 2021-22) has an outright decline over the prior forecast (a
decrease of $5.2 million).
Five of the revenue categories were increased for each year of the forecast, with the largest
increase over the first two years occurring in the Reinstatements category. This change alone
amounts to $5.5 million in Fiscal Year 2017-18 and $5.9 million in Fiscal Year 2018-19. Other
categories whose estimates were raised throughout the forecast are Red Light Cameras,
Transcripts/ Records, MVL Ancillary Fees, and Vessel Ancillary Fees.
Revisions to the forecast for eight revenue categories were downward for each year of the
forecast period. The largest combined decrease to the forecast for the first two fiscal years came
in the For Hire category, which was reduced by $5.1 million in Fiscal Year 2017-18 and by $5.5
million in Fiscal Year 2018-19. There were also sizable decreases to the Titles and Initial
Registrations categories resulting from decreases in the assumed light vehicle sales. Five other
revenue categories – Miscellaneous Fees, CDL, PDL, Private Vehicles, and HSMV Plates – had
mixed results throughout the forecast horizon while two categories – DL Tests and DUI – had no
change to the forecast.
The revised estimates by category resulted in modestly changed revenues over the previous
forecast for two of the major benefiting funds: General Revenue and the State Transportation
Trust Fund. The Highway Safety Operating Trust Fund saw a relatively larger increase to its
forecast, mostly due to increased Reinstatements fees. The revisions are shown below:
General Revenue
o Fiscal Year 2017-18: -$3.6 million (0.7 percent decrease)
o Fiscal Year 2018-19: $3.4 million (0.6 percent increase)
Highway Safety Operating Trust Fund
o Fiscal Year 2017-18: $10.6 million (2.5 percent increase)
o Fiscal Year 2018-19: $9.3 million (2.1 percent increase)
State Transportation Trust Fund
o Fiscal Year 2017-18: $1.4 million (0.1 percent increase)
o Fiscal Year 2018-19: -$0.9 million (0.1 percent decrease)
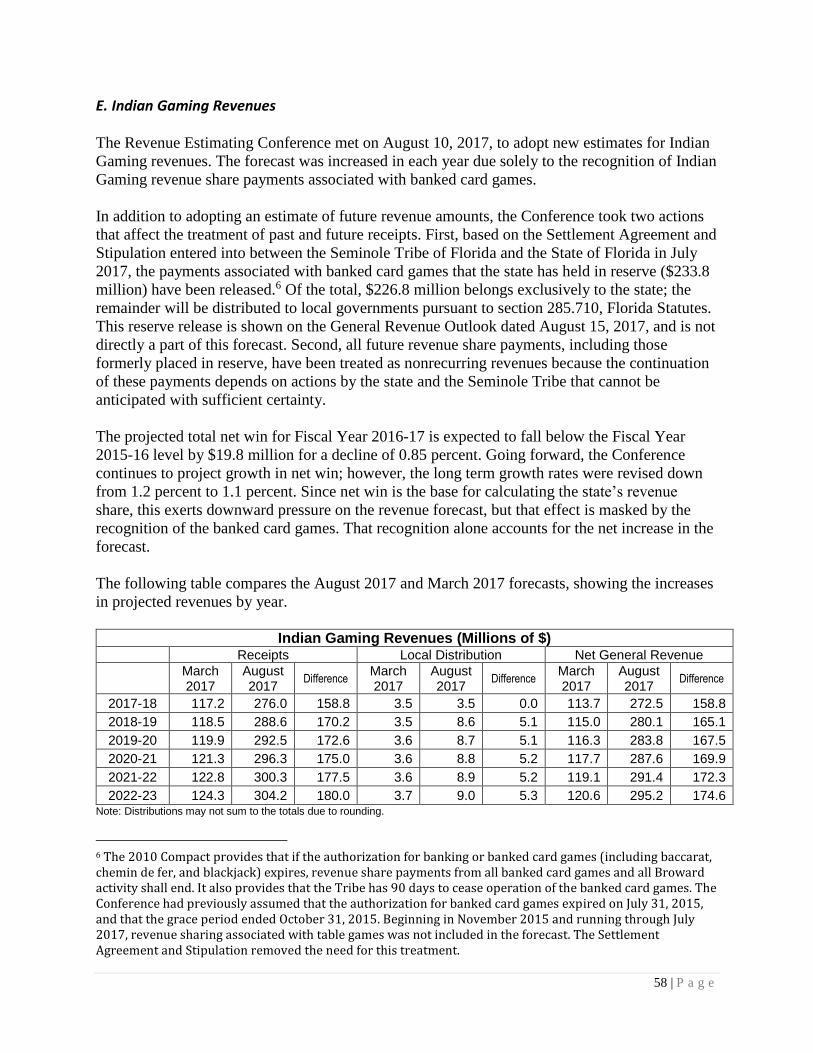
58 | P a g e
E. Indian Gaming Revenues
The Revenue Estimating Conference met on August 10, 2017, to adopt new estimates for Indian
Gaming revenues. The forecast was increased in each year due solely to the recognition of Indian
Gaming revenue share payments associated with banked card games.
In addition to adopting an estimate of future revenue amounts, the Conference took two actions
that affect the treatment of past and future receipts. First, based on the Settlement Agreement and
Stipulation entered into between the Seminole Tribe of Florida and the State of Florida in July
2017, the payments associated with banked card games that the state has held in reserve ($233.8
million) have been released.6 Of the total, $226.8 million belongs exclusively to the state; the
remainder will be distributed to local governments pursuant to section 285.710, Florida Statutes.
This reserve release is shown on the General Revenue Outlook dated August 15, 2017, and is not
directly a part of this forecast. Second, all future revenue share payments, including those
formerly placed in reserve, have been treated as nonrecurring revenues because the continuation
of these payments depends on actions by the state and the Seminole Tribe that cannot be
anticipated with sufficient certainty.
The projected total net win for Fiscal Year 2016-17 is expected to fall below the Fiscal Year
2015-16 level by $19.8 million for a decline of 0.85 percent. Going forward, the Conference
continues to project growth in net win; however, the long term growth rates were revised down
from 1.2 percent to 1.1 percent. Since net win is the base for calculating the state’s revenue
share, this exerts downward pressure on the revenue forecast, but that effect is masked by the
recognition of the banked card games. That recognition alone accounts for the net increase in the
forecast.
The following table compares the August 2017 and March 2017 forecasts, showing the increases
in projected revenues by year.
Indian Gaming Revenues (Millions of $)
Receipts Local Distribution Net General Revenue
March 2017
August 2017
Difference March 2017
August 2017
Difference March 2017
August 2017
Difference
2017-18 117.2 276.0 158.8 3.5 3.5 0.0 113.7 272.5 158.8
2018-19 118.5 288.6 170.2 3.5 8.6 5.1 115.0 280.1 165.1
2019-20 119.9 292.5 172.6 3.6 8.7 5.1 116.3 283.8 167.5
2020-21 121.3 296.3 175.0 3.6 8.8 5.2 117.7 287.6 169.9
2021-22 122.8 300.3 177.5 3.6 8.9 5.2 119.1 291.4 172.3
2022-23 124.3 304.2 180.0 3.7 9.0 5.3 120.6 295.2 174.6 Note: Distributions may not sum to the totals due to rounding.
6 The 2010 Compact provides that if the authorization for banking or banked card games (including baccarat, chemin de fer, and blackjack) expires, revenue share payments from all banked card games and all Broward activity shall end. It also provides that the Tribe has 90 days to cease operation of the banked card games. The Conference had previously assumed that the authorization for banked card games expired on July 31, 2015, and that the grace period ended October 31, 2015. Beginning in November 2015 and running through July 2017, revenue sharing associated with table games was not included in the forecast. The Settlement Agreement and Stipulation removed the need for this treatment.
59 | P a g e
F. Tobacco Tax and Surcharge
The Revenue Estimating Conference reviewed Tobacco Tax and Surcharge revenues on
August 10, 2017. The Conference increased the forecast for Cigarette Tax and Surcharge relative
to the estimates adopted in February 2017. Prior to adjusting for refunds, the underlying forecast
for Other Tobacco Products Tax and Surcharge was also adjusted upward; however, the
inclusion of anticipated refunds changed the net results.
Combined, Cigarette Tax and Surcharge revenues were $10.7 million over estimate for Fiscal
Year 2016-17. Based on this performance, the revenue forecast was increased from the prior
estimate. The Conference believes that the overall downward trend in cigarette consumption over
the past ten years is likely to continue in the out-years, but has moderated somewhat in the short
run.
Combined, Other Tobacco Products Tax and Surcharge revenues were approximately $0.6
million over estimate for Fiscal Year 2016-17. The Conference increased the expected growth
rates in Fiscal Year 2017-18 and Fiscal Year 2018-19, but did not change the longer term growth
rates from the February Conference for Fiscal Years 2019-20 through 2021-22. Despite the
upward adjustment to the tax base, the net revenue forecast was lower than the prior forecast. As
a result of litigation regarding the calculation of wholesale sales price before July 1, 2016, an
atypically large volume of refund payments is anticipated that has not been previously addressed
in the forecast. The Department of Business and Professional Regulation projects that the
maximum amount that could be refunded is currently $139.6 million. Of this amount, $44.8
million in refunds have been requested that may or may not be approved pending submission of
additional documentation. Based on experience with other tax sources, the Conference estimated
that approximately 70 percent of the $44.8 million will be refunded. Of the remaining $94.8
million, the Conference estimated that 50 percent will be refunded. This brings the total amount
of likely refund activity within the forecast period to $76 million. The Conference distributed
this amount across a four-year period, with a refund schedule of 35 percent in Fiscal Year 2017-
18, 25 percent in Fiscal Year 2018-19, 20 percent in Fiscal Year 2019-20, and 20 percent in
Fiscal Year 2020-21. These refunds were then deducted from the revenues otherwise projected
for Other Tobacco Products, resulting in lower revenue estimates.
The following table summarizes the changes in collections and distributions since the last forecast,
including the addition of Fiscal Year 2022-23 and the incorporation of anticipated refunds.
[SEE TABLE ON FOLLOWING PAGE]
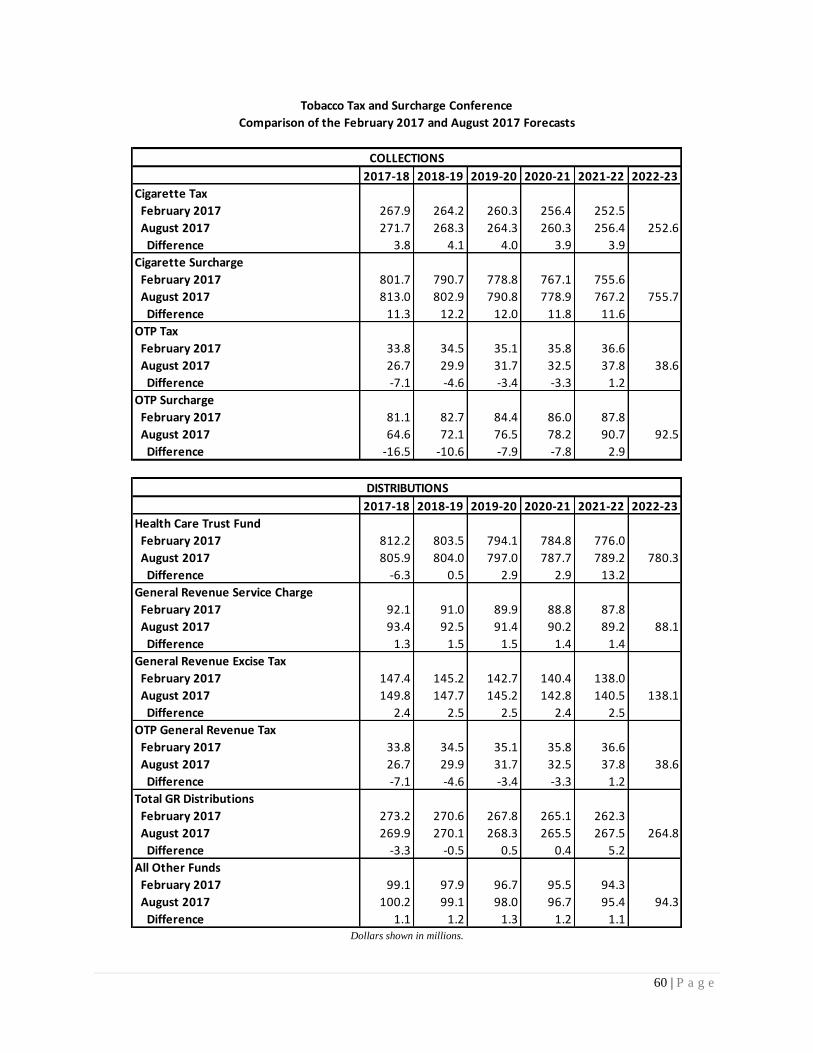
60 | P a g e
Dollars shown in millions.
2017-18 2018-19 2019-20 2020-21 2021-22 2022-23
Cigarette Tax
February 2017 267.9 264.2 260.3 256.4 252.5
August 2017 271.7 268.3 264.3 260.3 256.4 252.6
Difference 3.8 4.1 4.0 3.9 3.9
Cigarette Surcharge
February 2017 801.7 790.7 778.8 767.1 755.6
August 2017 813.0 802.9 790.8 778.9 767.2 755.7
Difference 11.3 12.2 12.0 11.8 11.6
OTP Tax
February 2017 33.8 34.5 35.1 35.8 36.6
August 2017 26.7 29.9 31.7 32.5 37.8 38.6
Difference -7.1 -4.6 -3.4 -3.3 1.2
OTP Surcharge
February 2017 81.1 82.7 84.4 86.0 87.8
August 2017 64.6 72.1 76.5 78.2 90.7 92.5
Difference -16.5 -10.6 -7.9 -7.8 2.9
2017-18 2018-19 2019-20 2020-21 2021-22 2022-23
Health Care Trust Fund
February 2017 812.2 803.5 794.1 784.8 776.0
August 2017 805.9 804.0 797.0 787.7 789.2 780.3
Difference -6.3 0.5 2.9 2.9 13.2
General Revenue Service Charge
February 2017 92.1 91.0 89.9 88.8 87.8
August 2017 93.4 92.5 91.4 90.2 89.2 88.1
Difference 1.3 1.5 1.5 1.4 1.4
General Revenue Excise Tax
February 2017 147.4 145.2 142.7 140.4 138.0
August 2017 149.8 147.7 145.2 142.8 140.5 138.1
Difference 2.4 2.5 2.5 2.4 2.5
OTP General Revenue Tax
February 2017 33.8 34.5 35.1 35.8 36.6
August 2017 26.7 29.9 31.7 32.5 37.8 38.6
Difference -7.1 -4.6 -3.4 -3.3 1.2
Total GR Distributions
February 2017 273.2 270.6 267.8 265.1 262.3
August 2017 269.9 270.1 268.3 265.5 267.5 264.8
Difference -3.3 -0.5 0.5 0.4 5.2
All Other Funds
February 2017 99.1 97.9 96.7 95.5 94.3
August 2017 100.2 99.1 98.0 96.7 95.4 94.3
Difference 1.1 1.2 1.3 1.2 1.1
COLLECTIONS
DISTRIBUTIONS
Tobacco Tax and Surcharge Conference
Comparison of the February 2017 and August 2017 Forecasts
61 | P a g e
II. Educational Enhancement Trust Fund, Lottery, and Slots
Dedicated to educational programs, the Educational Enhancement Trust Fund (EETF) contains
revenue primarily derived from Lottery ticket sales and taxes on Slot Machine revenues. Because
these sources are so different, they are estimated separately.
The Revenue Estimating Conference reviewed Lottery revenues on August 8, 2017. Total ticket
sales were $202.4 million over estimate for Fiscal Year 2016-17 primarily due to scratch-off
ticket sales and to a lesser extent Powerball. The strength of these games overcame the weaker-
than-expected performance of most other terminal games, but the performance of those games
was likely affected by the introduction of Cash 4 Life. Overall, terminal games (including Cash 4
Life) were $43.4 million above estimate, only slightly above the overage attributable to
Powerball even though Cash 4 Life sales were not a part of the prior forecast.
The Conference increased the overall sales forecast by $333.9 million in Fiscal Year 2017-18
and increased the forecast by $342.3 million to $354.2 million in subsequent fiscal years.
Primarily as a result of this, transfers to the EETF from ticket sales increase by roughly $100
million in each of the first four forecasted years. In regard to the specific games:
The Conference increased the Scratch-Off ticket sales by $279.0 million to $305.4
million each fiscal year. Scratch-Off sales were approximately $159.1 million over
estimate for Fiscal Year 2016-17.
Powerball ticket sales were increased by $30.4 million to $34.9 million throughout the
forecast. Powerball sales were about $36.0 million over estimate for Fiscal Year 2016-17,
primarily due to three large jackpots. Mega Millions ticket sales were also healthier than
anticipated, coming in $3.4 million over estimate for Fiscal Year 2016-17. The
Conference increased this part of the forecast between $16.4 million and $17.0 million
each year.
Lotto and Fantasy Five ticket sales were consistently under estimate each week. The
Conference reduced the forecast for Lotto ticket sales by $17.0 million to $26.3 million
per fiscal year and reduced the forecast for Fantasy Five ticket sales by about $32.5
million each fiscal year. Ticket sales for Lucky Money were slightly under estimate
ending Fiscal Year 2016-17; the Conference chose to keep the Fiscal Year 2016-17 sales
level of $89.9 million constant for each subsequent fiscal year.
Ticket sales for Pick Games – Pick 2, Pick 3 (formerly Cash 3), Pick 4 (formerly Play 4),
and Pick 5 – were virtually on estimate, only missing it by 0.5 percent. The Conference
reduced the forecast by approximately $3.3 million each fiscal year.
Cash 4 Life is a new game that came online in the middle of February 2017. Total ticket
sales for the partial year of Fiscal Year 2016-17 were $28.8 million. The Conference
annualized the partial year activity, resulting in forecasted levels of $65.0 million to
$69.9 million for each fiscal year.
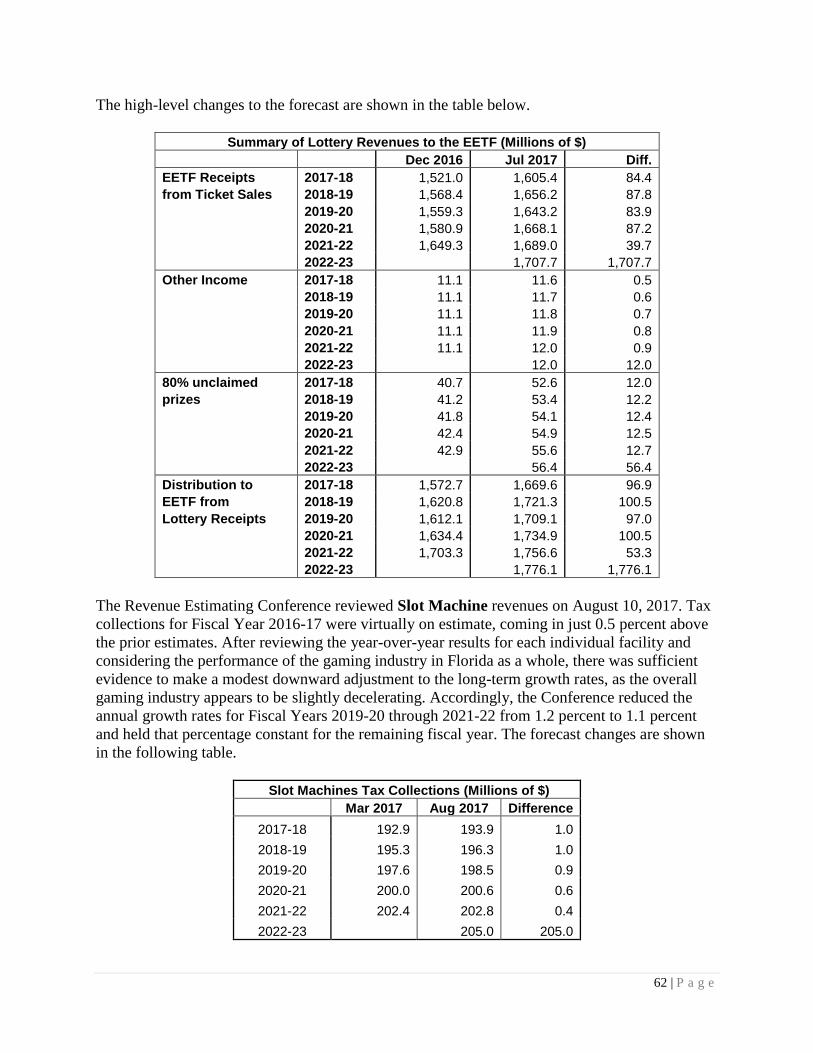
62 | P a g e
The high-level changes to the forecast are shown in the table below.
Summary of Lottery Revenues to the EETF (Millions of $)
Dec 2016 Jul 2017 Diff.
EETF Receipts 2017-18 1,521.0 1,605.4 84.4
from Ticket Sales 2018-19 1,568.4 1,656.2 87.8
2019-20 1,559.3 1,643.2 83.9
2020-21 1,580.9 1,668.1 87.2
2021-22 1,649.3 1,689.0 39.7
2022-23 1,707.7 1,707.7
Other Income 2017-18 11.1 11.6 0.5
2018-19 11.1 11.7 0.6
2019-20 11.1 11.8 0.7
2020-21 11.1 11.9 0.8
2021-22 11.1 12.0 0.9
2022-23 12.0 12.0
80% unclaimed 2017-18 40.7 52.6 12.0
prizes 2018-19 41.2 53.4 12.2
2019-20 41.8 54.1 12.4
2020-21 42.4 54.9 12.5
2021-22 42.9 55.6 12.7
2022-23 56.4 56.4
Distribution to 2017-18 1,572.7 1,669.6 96.9
EETF from 2018-19 1,620.8 1,721.3 100.5
Lottery Receipts 2019-20 1,612.1 1,709.1 97.0
2020-21 1,634.4 1,734.9 100.5
2021-22 1,703.3 1,756.6 53.3
2022-23 1,776.1 1,776.1
The Revenue Estimating Conference reviewed Slot Machine revenues on August 10, 2017. Tax
collections for Fiscal Year 2016-17 were virtually on estimate, coming in just 0.5 percent above
the prior estimates. After reviewing the year-over-year results for each individual facility and
considering the performance of the gaming industry in Florida as a whole, there was sufficient
evidence to make a modest downward adjustment to the long-term growth rates, as the overall
gaming industry appears to be slightly decelerating. Accordingly, the Conference reduced the
annual growth rates for Fiscal Years 2019-20 through 2021-22 from 1.2 percent to 1.1 percent
and held that percentage constant for the remaining fiscal year. The forecast changes are shown
in the following table.
Slot Machines Tax Collections (Millions of $)
Mar 2017 Aug 2017 Difference
2017-18 192.9 193.9 1.0
2018-19 195.3 196.3 1.0
2019-20 197.6 198.5 0.9
2020-21 200.0 200.6 0.6
2021-22 202.4 202.8 0.4
2022-23 205.0 205.0
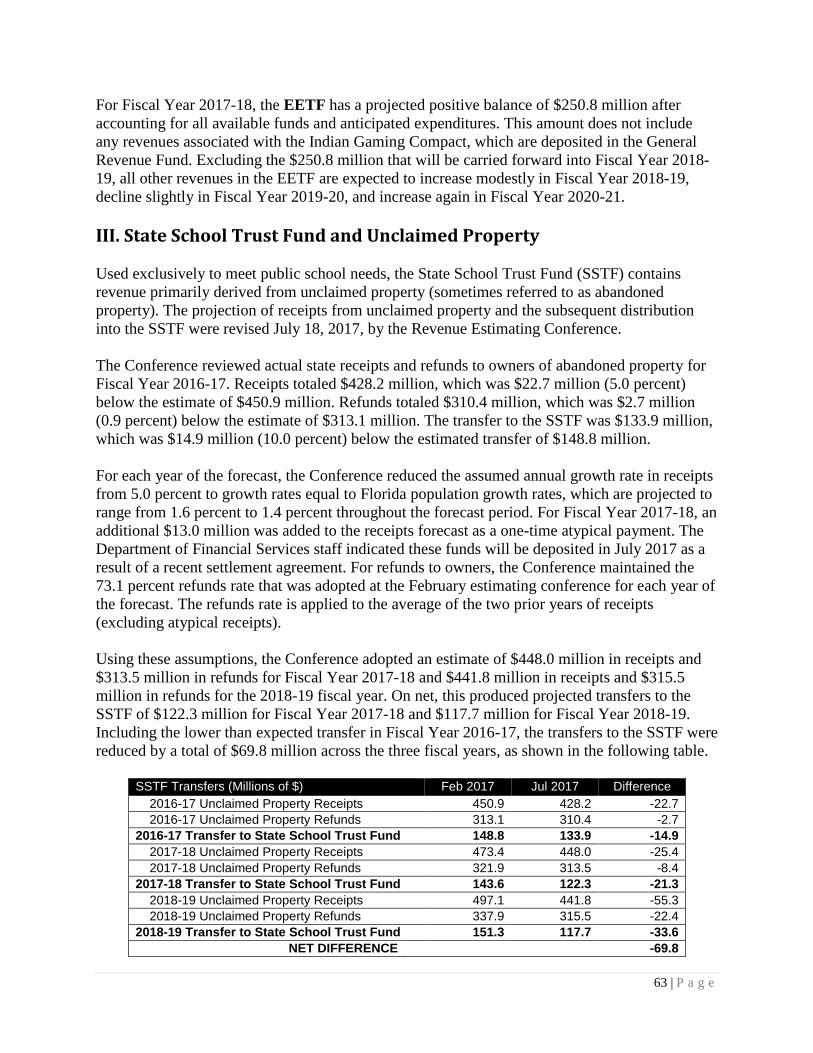
63 | P a g e
For Fiscal Year 2017-18, the EETF has a projected positive balance of $250.8 million after
accounting for all available funds and anticipated expenditures. This amount does not include
any revenues associated with the Indian Gaming Compact, which are deposited in the General
Revenue Fund. Excluding the $250.8 million that will be carried forward into Fiscal Year 2018-
19, all other revenues in the EETF are expected to increase modestly in Fiscal Year 2018-19,
decline slightly in Fiscal Year 2019-20, and increase again in Fiscal Year 2020-21.
III. State School Trust Fund and Unclaimed Property
Used exclusively to meet public school needs, the State School Trust Fund (SSTF) contains
revenue primarily derived from unclaimed property (sometimes referred to as abandoned
property). The projection of receipts from unclaimed property and the subsequent distribution
into the SSTF were revised July 18, 2017, by the Revenue Estimating Conference.
The Conference reviewed actual state receipts and refunds to owners of abandoned property for
Fiscal Year 2016-17. Receipts totaled $428.2 million, which was $22.7 million (5.0 percent)
below the estimate of $450.9 million. Refunds totaled $310.4 million, which was $2.7 million
(0.9 percent) below the estimate of $313.1 million. The transfer to the SSTF was $133.9 million,
which was $14.9 million (10.0 percent) below the estimated transfer of $148.8 million.
For each year of the forecast, the Conference reduced the assumed annual growth rate in receipts
from 5.0 percent to growth rates equal to Florida population growth rates, which are projected to
range from 1.6 percent to 1.4 percent throughout the forecast period. For Fiscal Year 2017-18, an
additional $13.0 million was added to the receipts forecast as a one-time atypical payment. The
Department of Financial Services staff indicated these funds will be deposited in July 2017 as a
result of a recent settlement agreement. For refunds to owners, the Conference maintained the
73.1 percent refunds rate that was adopted at the February estimating conference for each year of
the forecast. The refunds rate is applied to the average of the two prior years of receipts
(excluding atypical receipts).
Using these assumptions, the Conference adopted an estimate of $448.0 million in receipts and
$313.5 million in refunds for Fiscal Year 2017-18 and $441.8 million in receipts and $315.5
million in refunds for the 2018-19 fiscal year. On net, this produced projected transfers to the
SSTF of $122.3 million for Fiscal Year 2017-18 and $117.7 million for Fiscal Year 2018-19.
Including the lower than expected transfer in Fiscal Year 2016-17, the transfers to the SSTF were
reduced by a total of $69.8 million across the three fiscal years, as shown in the following table.
SSTF Transfers (Millions of $) Feb 2017 Jul 2017 Difference
2016-17 Unclaimed Property Receipts 450.9 428.2 -22.7
2016-17 Unclaimed Property Refunds 313.1 310.4 -2.7
2016-17 Transfer to State School Trust Fund 148.8 133.9 -14.9
2017-18 Unclaimed Property Receipts 473.4 448.0 -25.4
2017-18 Unclaimed Property Refunds 321.9 313.5 -8.4
2017-18 Transfer to State School Trust Fund 143.6 122.3 -21.3
2018-19 Unclaimed Property Receipts 497.1 441.8 -55.3
2018-19 Unclaimed Property Refunds 337.9 315.5 -22.4
2018-19 Transfer to State School Trust Fund 151.3 117.7 -33.6
NET DIFFERENCE -69.8
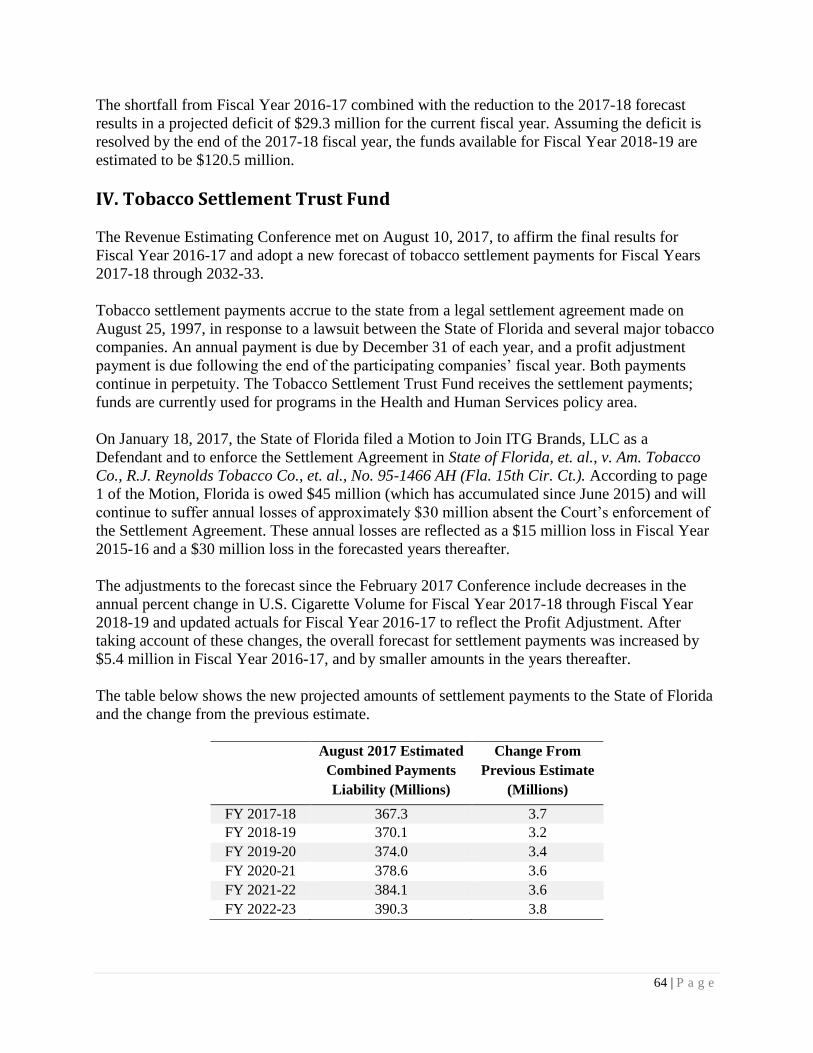
64 | P a g e
The shortfall from Fiscal Year 2016-17 combined with the reduction to the 2017-18 forecast
results in a projected deficit of $29.3 million for the current fiscal year. Assuming the deficit is
resolved by the end of the 2017-18 fiscal year, the funds available for Fiscal Year 2018-19 are
estimated to be $120.5 million.
IV. Tobacco Settlement Trust Fund
The Revenue Estimating Conference met on August 10, 2017, to affirm the final results for
Fiscal Year 2016-17 and adopt a new forecast of tobacco settlement payments for Fiscal Years
2017-18 through 2032-33.
Tobacco settlement payments accrue to the state from a legal settlement agreement made on
August 25, 1997, in response to a lawsuit between the State of Florida and several major tobacco
companies. An annual payment is due by December 31 of each year, and a profit adjustment
payment is due following the end of the participating companies’ fiscal year. Both payments
continue in perpetuity. The Tobacco Settlement Trust Fund receives the settlement payments;
funds are currently used for programs in the Health and Human Services policy area.
On January 18, 2017, the State of Florida filed a Motion to Join ITG Brands, LLC as a
Defendant and to enforce the Settlement Agreement in State of Florida, et. al., v. Am. Tobacco
Co., R.J. Reynolds Tobacco Co., et. al., No. 95-1466 AH (Fla. 15th Cir. Ct.). According to page
1 of the Motion, Florida is owed $45 million (which has accumulated since June 2015) and will
continue to suffer annual losses of approximately $30 million absent the Court’s enforcement of
the Settlement Agreement. These annual losses are reflected as a $15 million loss in Fiscal Year
2015-16 and a $30 million loss in the forecasted years thereafter.
The adjustments to the forecast since the February 2017 Conference include decreases in the
annual percent change in U.S. Cigarette Volume for Fiscal Year 2017-18 through Fiscal Year
2018-19 and updated actuals for Fiscal Year 2016-17 to reflect the Profit Adjustment. After
taking account of these changes, the overall forecast for settlement payments was increased by
$5.4 million in Fiscal Year 2016-17, and by smaller amounts in the years thereafter.
The table below shows the new projected amounts of settlement payments to the State of Florida
and the change from the previous estimate.
August 2017 Estimated
Combined Payments
Liability (Millions)
Change From
Previous Estimate
(Millions)
FY 2017-18 367.3 3.7
FY 2018-19 370.1 3.2
FY 2019-20 374.0 3.4
FY 2020-21 378.6 3.6
FY 2021-22 384.1 3.6
FY 2022-23 390.3 3.8
65 | P a g e
In Fiscal Year 2018-19, $370.1 million is expected from all payments and profit adjustments as
well as $6.1 million in transfers from the Lawton Chiles Endowment Fund. Including $25.4
million of unspent (nonrecurring) funds from Fiscal Year 2017-18 and $1.3 million in projected
interest earnings, a total of $402.9 million will be available for expenditure in Fiscal Year 2018-
19. These figures make no adjustment for the constitutionally required funding for tobacco
education and prevention. That financial obligation will be deducted from the trust fund as an
expenditure and is estimated to be $70.3 million for Fiscal Year 2018-19.
V. State Transportation Trust Fund and Transportation Revenue
The Revenue Estimating Conference met on August 4, 2017, to consider the forecast of revenues
flowing into the State Transportation Trust Fund (STTF). Including the estimates for Fiscal Year
2017-18, overall revenues to the STTF work program period ending in Fiscal Year 2022-23 were
decreased by $147.4 million or about 0.6 percent.
For revenues from fuel taxes, the overall forecast was shaped by recent changes in the
consumption of motor fuel and other fuels (diesel, aviation and off-highway fuel), changes in the
projected fuel tax rates, and changes to the Aviation Fuel Refund forecast for Fiscal Year 2017-
18 and forward. The projection for revenues from all types of fuel was decreased by $58.0
million or 0.4 percent over the entire work program period. Within the total for fuel-related
taxes, Highway Fuel Sales Tax saw the largest dollar decrease and represented most of the total
reduction; these revenues were reduced by $50.8 million or 0.5 percent, due to changes in the
fuel tax rate and final consumption data for Fiscal Year 2016-17. Revenues from the Aviation
Fuel Tax were also decreased relative to the previous forecast, while those from Off-Highway
Fuel Sales Tax were revised upward by $10.3 million or 15.6 percent.
The annual estimates for the Local Option Distribution were virtually unchanged from the
previous forecast. Conversely, the annual estimates for the Rental Car Surcharge experienced the
largest decline of any tax source in this conference, decreasing by $72.0 million or 7.7 percent
through the work program period. This decrease was prompted by lower than expected
collections for Fiscal Year 2016-17 and the increasing use of Uber and other transportation
network companies that are not subject to the Rental Car Surcharge.
For motor vehicle license and registration related fees, the forecasts were previously adopted by
the Highway Safety Licenses and Fees Conference held July 28, 2017. In this work program
period, receipts to the STTF from motor vehicle related licenses and fees were decreased by
$17.3 million or 0.2 percent. While Motor Vehicle Licenses are up by $33.1 million, all of the
other contributing sources are down: Initial Registrations by $40.1 million, Title Fees by $9.3
million, and Motor Carrier Compliance Penalties by $1.0 million during the work program
period.
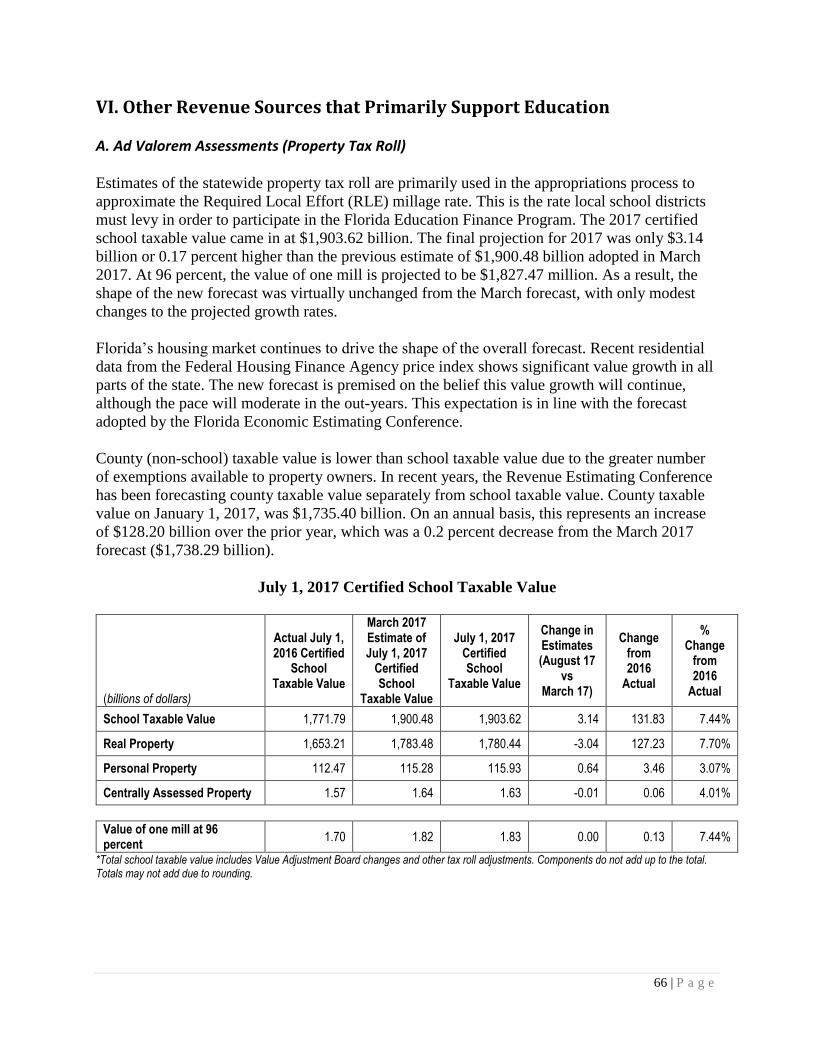
66 | P a g e
VI. Other Revenue Sources that Primarily Support Education
A. Ad Valorem Assessments (Property Tax Roll)
Estimates of the statewide property tax roll are primarily used in the appropriations process to
approximate the Required Local Effort (RLE) millage rate. This is the rate local school districts
must levy in order to participate in the Florida Education Finance Program. The 2017 certified
school taxable value came in at $1,903.62 billion. The final projection for 2017 was only $3.14
billion or 0.17 percent higher than the previous estimate of $1,900.48 billion adopted in March
2017. At 96 percent, the value of one mill is projected to be $1,827.47 million. As a result, the
shape of the new forecast was virtually unchanged from the March forecast, with only modest
changes to the projected growth rates.
Florida’s housing market continues to drive the shape of the overall forecast. Recent residential
data from the Federal Housing Finance Agency price index shows significant value growth in all
parts of the state. The new forecast is premised on the belief this value growth will continue,
although the pace will moderate in the out-years. This expectation is in line with the forecast
adopted by the Florida Economic Estimating Conference.
County (non-school) taxable value is lower than school taxable value due to the greater number
of exemptions available to property owners. In recent years, the Revenue Estimating Conference
has been forecasting county taxable value separately from school taxable value. County taxable
value on January 1, 2017, was $1,735.40 billion. On an annual basis, this represents an increase
of $128.20 billion over the prior year, which was a 0.2 percent decrease from the March 2017
forecast ($1,738.29 billion).
July 1, 2017 Certified School Taxable Value
(billions of dollars)
Actual July 1, 2016 Certified
School Taxable Value
March 2017 Estimate of July 1, 2017
Certified School
Taxable Value
July 1, 2017 Certified School
Taxable Value
Change in Estimates (August 17
vs March 17)
Change from 2016
Actual
% Change
from 2016
Actual
School Taxable Value 1,771.79 1,900.48 1,903.62 3.14 131.83 7.44%
Real Property 1,653.21 1,783.48 1,780.44 -3.04 127.23 7.70%
Personal Property 112.47 115.28 115.93 0.64 3.46 3.07%
Centrally Assessed Property 1.57 1.64 1.63 -0.01 0.06 4.01%
Value of one mill at 96 percent
1.70 1.82 1.83 0.00 0.13 7.44%
*Total school taxable value includes Value Adjustment Board changes and other tax roll adjustments. Components do not add up to the total. Totals may not add due to rounding.
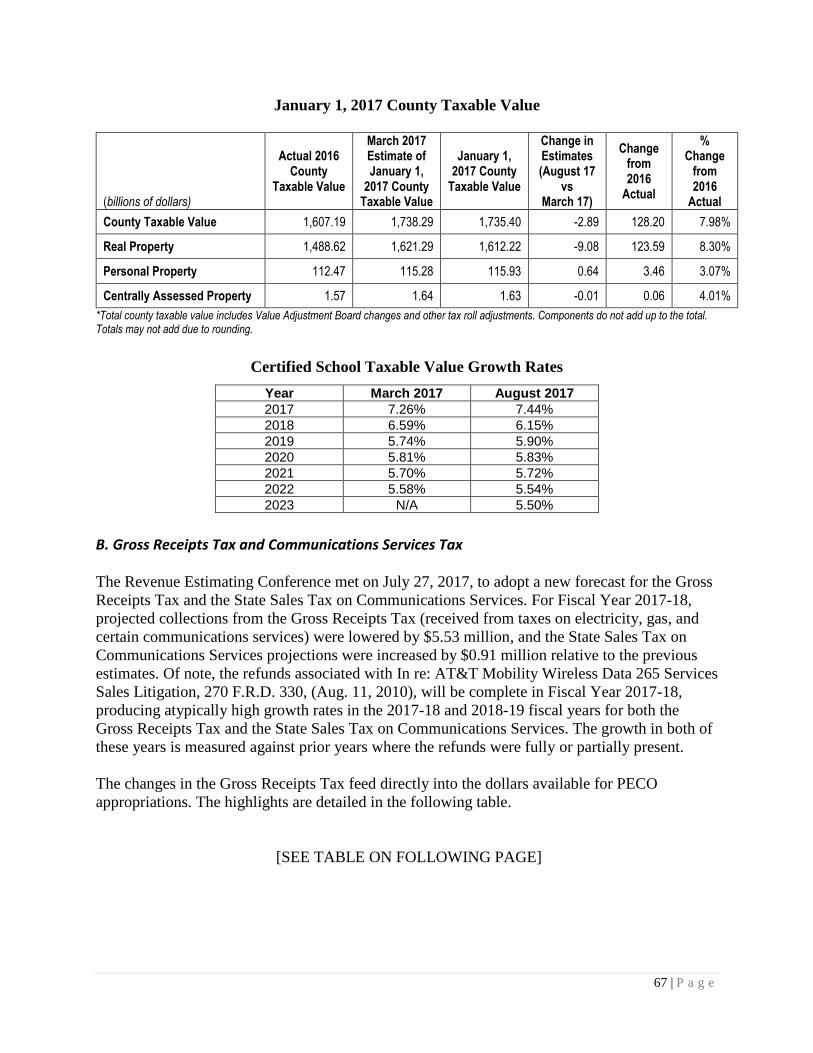
67 | P a g e
January 1, 2017 County Taxable Value
(billions of dollars)
Actual 2016 County
Taxable Value
March 2017 Estimate of January 1,
2017 County Taxable Value
January 1, 2017 County
Taxable Value
Change in Estimates (August 17
vs March 17)
Change from 2016
Actual
% Change
from 2016
Actual
County Taxable Value 1,607.19 1,738.29 1,735.40 -2.89 128.20 7.98%
Real Property 1,488.62 1,621.29 1,612.22 -9.08 123.59 8.30%
Personal Property 112.47 115.28 115.93 0.64 3.46 3.07%
Centrally Assessed Property 1.57 1.64 1.63 -0.01 0.06 4.01%
*Total county taxable value includes Value Adjustment Board changes and other tax roll adjustments. Components do not add up to the total. Totals may not add due to rounding.
Certified School Taxable Value Growth Rates
Year March 2017 August 2017
2017 7.26% 7.44%
2018 6.59% 6.15%
2019 5.74% 5.90%
2020 5.81% 5.83%
2021 5.70% 5.72%
2022 5.58% 5.54%
2023 N/A 5.50%
B. Gross Receipts Tax and Communications Services Tax
The Revenue Estimating Conference met on July 27, 2017, to adopt a new forecast for the Gross
Receipts Tax and the State Sales Tax on Communications Services. For Fiscal Year 2017-18,
projected collections from the Gross Receipts Tax (received from taxes on electricity, gas, and
certain communications services) were lowered by $5.53 million, and the State Sales Tax on
Communications Services projections were increased by $0.91 million relative to the previous
estimates. Of note, the refunds associated with In re: AT&T Mobility Wireless Data 265 Services
Sales Litigation, 270 F.R.D. 330, (Aug. 11, 2010), will be complete in Fiscal Year 2017-18,
producing atypically high growth rates in the 2017-18 and 2018-19 fiscal years for both the
Gross Receipts Tax and the State Sales Tax on Communications Services. The growth in both of
these years is measured against prior years where the refunds were fully or partially present.
The changes in the Gross Receipts Tax feed directly into the dollars available for PECO
appropriations. The highlights are detailed in the following table.
[SEE TABLE ON FOLLOWING PAGE]
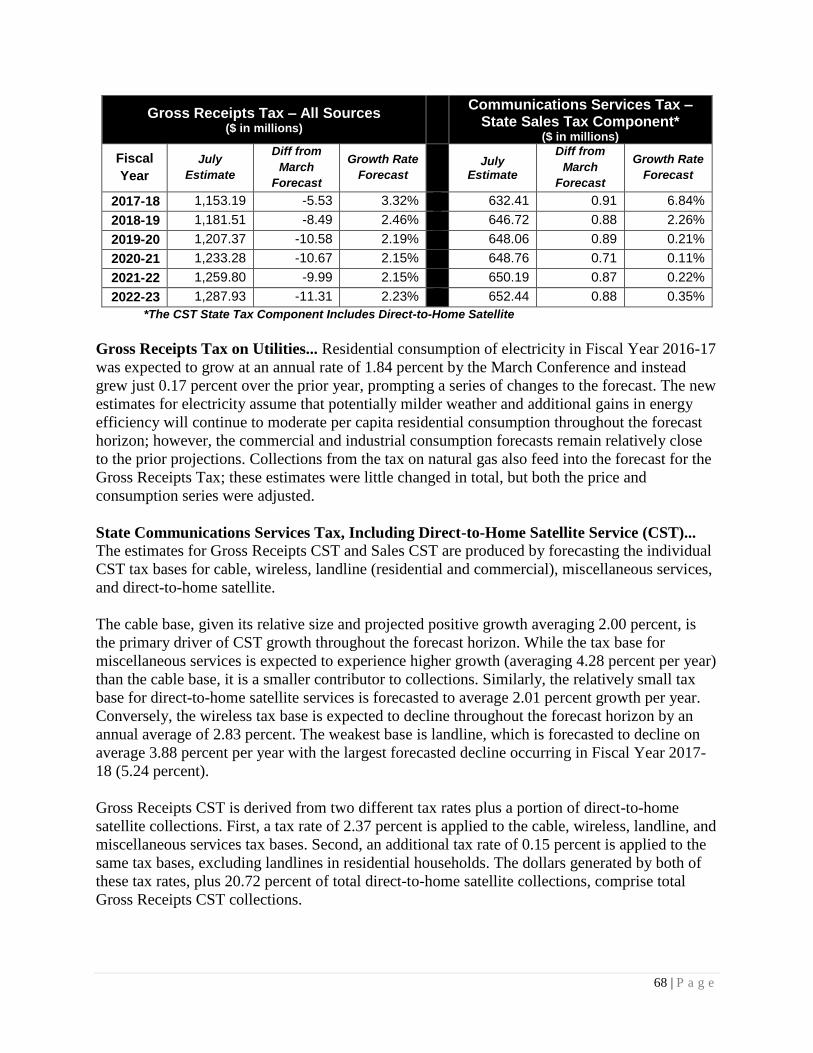
68 | P a g e
Gross Receipts Tax – All Sources ($ in millions)
Communications Services Tax –
State Sales Tax Component* ($ in millions)
Fiscal
Year
July
Estimate
Diff from
March
Forecast
Growth Rate
Forecast
July Estimate
Diff from
March
Forecast
Growth Rate
Forecast
2017-18 1,153.19 -5.53 3.32% 632.41 0.91 6.84%
2018-19 1,181.51 -8.49 2.46% 646.72 0.88 2.26%
2019-20 1,207.37 -10.58 2.19% 648.06 0.89 0.21%
2020-21 1,233.28 -10.67 2.15% 648.76 0.71 0.11%
2021-22 1,259.80 -9.99 2.15% 650.19 0.87 0.22%
2022-23 1,287.93 -11.31 2.23% 652.44 0.88 0.35%
*The CST State Tax Component Includes Direct-to-Home Satellite
Gross Receipts Tax on Utilities... Residential consumption of electricity in Fiscal Year 2016-17
was expected to grow at an annual rate of 1.84 percent by the March Conference and instead
grew just 0.17 percent over the prior year, prompting a series of changes to the forecast. The new
estimates for electricity assume that potentially milder weather and additional gains in energy
efficiency will continue to moderate per capita residential consumption throughout the forecast
horizon; however, the commercial and industrial consumption forecasts remain relatively close
to the prior projections. Collections from the tax on natural gas also feed into the forecast for the
Gross Receipts Tax; these estimates were little changed in total, but both the price and
consumption series were adjusted.
State Communications Services Tax, Including Direct-to-Home Satellite Service (CST)... The estimates for Gross Receipts CST and Sales CST are produced by forecasting the individual
CST tax bases for cable, wireless, landline (residential and commercial), miscellaneous services,
and direct-to-home satellite.
The cable base, given its relative size and projected positive growth averaging 2.00 percent, is
the primary driver of CST growth throughout the forecast horizon. While the tax base for
miscellaneous services is expected to experience higher growth (averaging 4.28 percent per year)
than the cable base, it is a smaller contributor to collections. Similarly, the relatively small tax
base for direct-to-home satellite services is forecasted to average 2.01 percent growth per year.
Conversely, the wireless tax base is expected to decline throughout the forecast horizon by an
annual average of 2.83 percent. The weakest base is landline, which is forecasted to decline on
average 3.88 percent per year with the largest forecasted decline occurring in Fiscal Year 2017-
18 (5.24 percent).
Gross Receipts CST is derived from two different tax rates plus a portion of direct-to-home
satellite collections. First, a tax rate of 2.37 percent is applied to the cable, wireless, landline, and
miscellaneous services tax bases. Second, an additional tax rate of 0.15 percent is applied to the
same tax bases, excluding landlines in residential households. The dollars generated by both of
these tax rates, plus 20.72 percent of total direct-to-home satellite collections, comprise total
Gross Receipts CST collections.
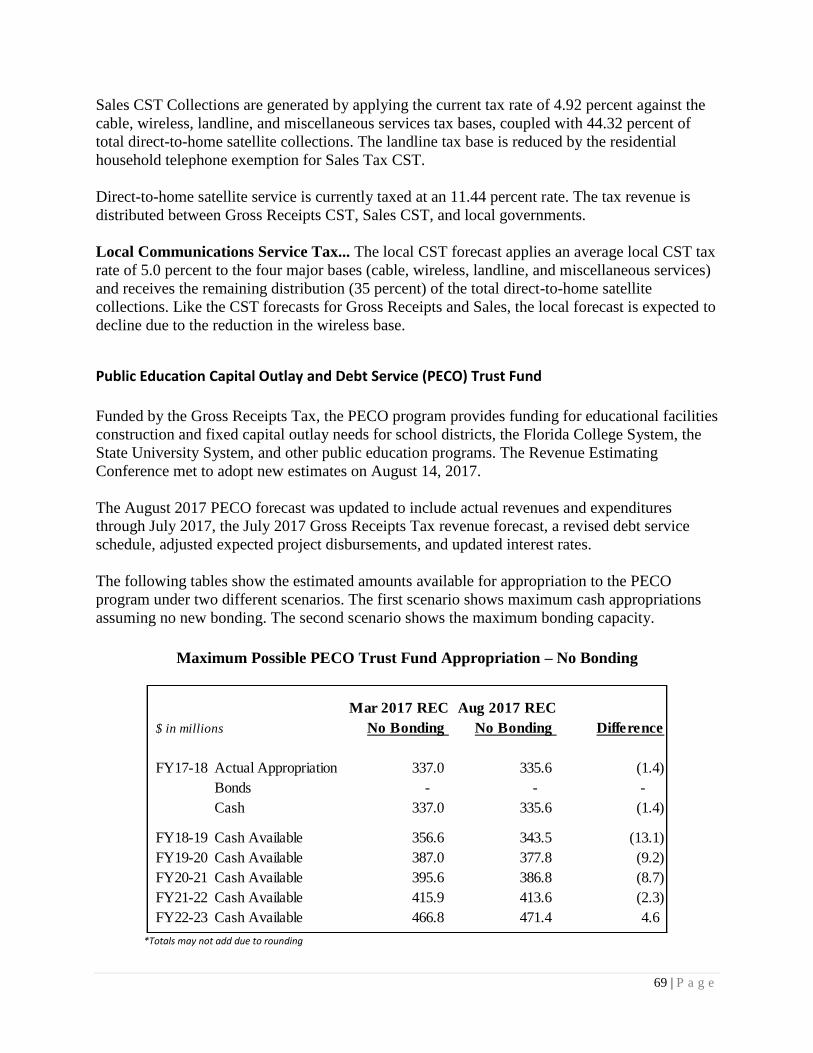
69 | P a g e
Sales CST Collections are generated by applying the current tax rate of 4.92 percent against the
cable, wireless, landline, and miscellaneous services tax bases, coupled with 44.32 percent of
total direct-to-home satellite collections. The landline tax base is reduced by the residential
household telephone exemption for Sales Tax CST.
Direct-to-home satellite service is currently taxed at an 11.44 percent rate. The tax revenue is
distributed between Gross Receipts CST, Sales CST, and local governments.
Local Communications Service Tax... The local CST forecast applies an average local CST tax
rate of 5.0 percent to the four major bases (cable, wireless, landline, and miscellaneous services)
and receives the remaining distribution (35 percent) of the total direct-to-home satellite
collections. Like the CST forecasts for Gross Receipts and Sales, the local forecast is expected to
decline due to the reduction in the wireless base.
Public Education Capital Outlay and Debt Service (PECO) Trust Fund
Funded by the Gross Receipts Tax, the PECO program provides funding for educational facilities
construction and fixed capital outlay needs for school districts, the Florida College System, the
State University System, and other public education programs. The Revenue Estimating
Conference met to adopt new estimates on August 14, 2017.
The August 2017 PECO forecast was updated to include actual revenues and expenditures
through July 2017, the July 2017 Gross Receipts Tax revenue forecast, a revised debt service
schedule, adjusted expected project disbursements, and updated interest rates.
The following tables show the estimated amounts available for appropriation to the PECO
program under two different scenarios. The first scenario shows maximum cash appropriations
assuming no new bonding. The second scenario shows the maximum bonding capacity.
Maximum Possible PECO Trust Fund Appropriation – No Bonding
*Totals may not add due to rounding
Mar 2017 REC Aug 2017 REC
$ in millions No Bonding No Bonding Difference
FY17-18 Actual Appropriation 337.0 335.6 (1.4)
Bonds - - -
Cash 337.0 335.6 (1.4)
FY18-19 Cash Available 356.6 343.5 (13.1)
FY19-20 Cash Available 387.0 377.8 (9.2)
FY20-21 Cash Available 395.6 386.8 (8.7)
FY21-22 Cash Available 415.9 413.6 (2.3)
FY22-23 Cash Available 466.8 471.4 4.6
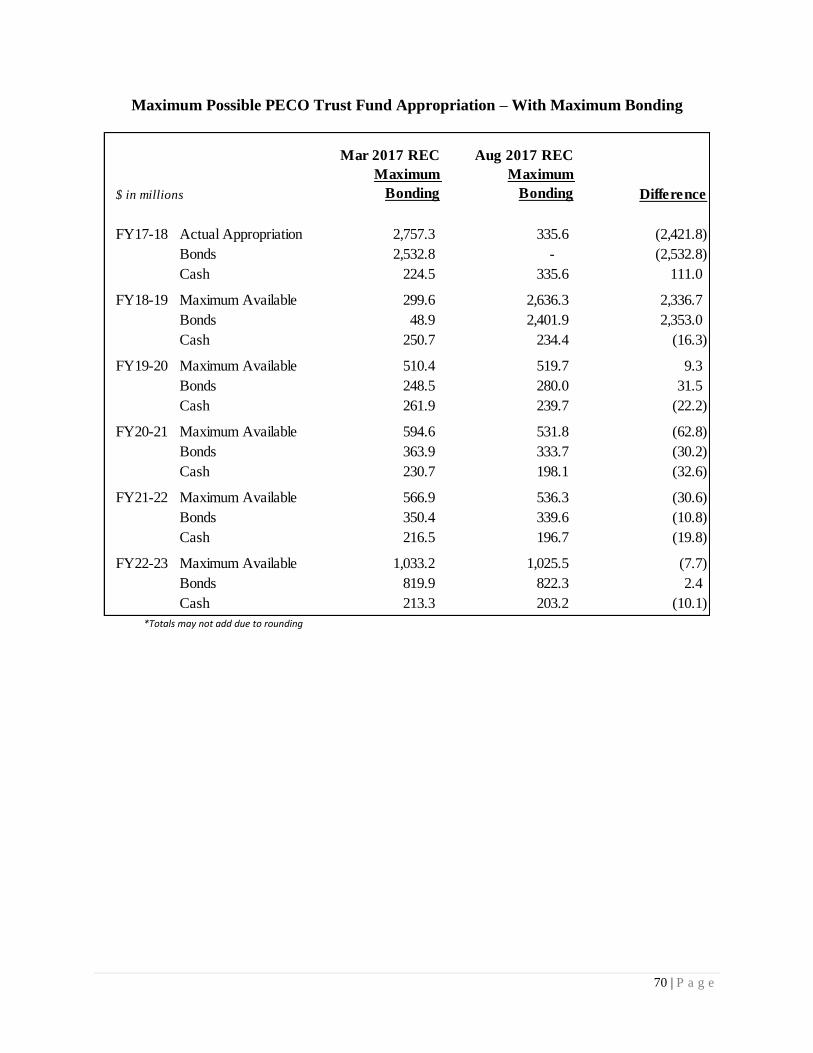
70 | P a g e
Maximum Possible PECO Trust Fund Appropriation – With Maximum Bonding
*Totals may not add due to rounding
Mar 2017 REC Aug 2017 REC
$ in millions
Maximum
Bonding
Maximum
Bonding Difference
FY17-18 Actual Appropriation 2,757.3 335.6 (2,421.8)
Bonds 2,532.8 - (2,532.8)
Cash 224.5 335.6 111.0
FY18-19 Maximum Available 299.6 2,636.3 2,336.7
Bonds 48.9 2,401.9 2,353.0
Cash 250.7 234.4 (16.3)
FY19-20 Maximum Available 510.4 519.7 9.3
Bonds 248.5 280.0 31.5
Cash 261.9 239.7 (22.2)
FY20-21 Maximum Available 594.6 531.8 (62.8)
Bonds 363.9 333.7 (30.2)
Cash 230.7 198.1 (32.6)
FY21-22 Maximum Available 566.9 536.3 (30.6)
Bonds 350.4 339.6 (10.8)
Cash 216.5 196.7 (19.8)
FY22-23 Maximum Available 1,033.2 1,025.5 (7.7)
Bonds 819.9 822.3 2.4
Cash 213.3 203.2 (10.1)
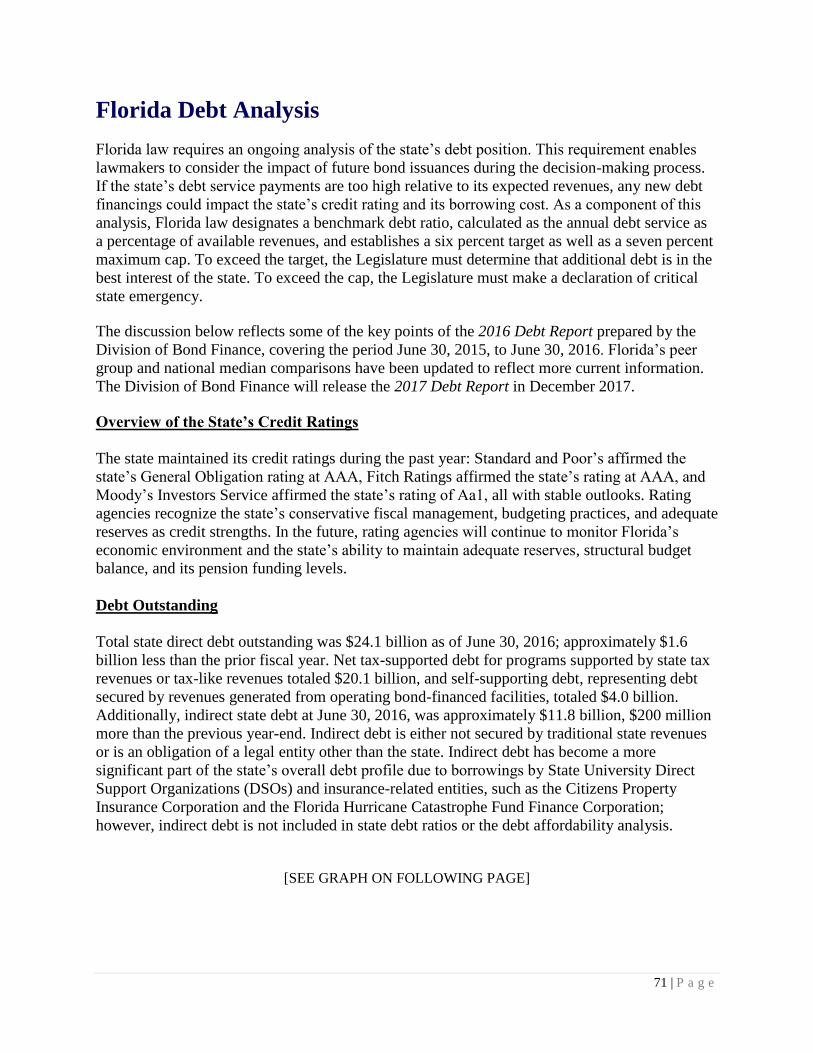
71 | P a g e
Florida Debt Analysis
Florida law requires an ongoing analysis of the state’s debt position. This requirement enables
lawmakers to consider the impact of future bond issuances during the decision-making process.
If the state’s debt service payments are too high relative to its expected revenues, any new debt
financings could impact the state’s credit rating and its borrowing cost. As a component of this
analysis, Florida law designates a benchmark debt ratio, calculated as the annual debt service as
a percentage of available revenues, and establishes a six percent target as well as a seven percent
maximum cap. To exceed the target, the Legislature must determine that additional debt is in the
best interest of the state. To exceed the cap, the Legislature must make a declaration of critical
state emergency.
The discussion below reflects some of the key points of the 2016 Debt Report prepared by the
Division of Bond Finance, covering the period June 30, 2015, to June 30, 2016. Florida’s peer
group and national median comparisons have been updated to reflect more current information.
The Division of Bond Finance will release the 2017 Debt Report in December 2017.
Overview of the State’s Credit Ratings
The state maintained its credit ratings during the past year: Standard and Poor’s affirmed the
state’s General Obligation rating at AAA, Fitch Ratings affirmed the state’s rating at AAA, and
Moody’s Investors Service affirmed the state’s rating of Aa1, all with stable outlooks. Rating
agencies recognize the state’s conservative fiscal management, budgeting practices, and adequate
reserves as credit strengths. In the future, rating agencies will continue to monitor Florida’s
economic environment and the state’s ability to maintain adequate reserves, structural budget
balance, and its pension funding levels.
Debt Outstanding
Total state direct debt outstanding was $24.1 billion as of June 30, 2016; approximately $1.6
billion less than the prior fiscal year. Net tax-supported debt for programs supported by state tax
revenues or tax-like revenues totaled $20.1 billion, and self-supporting debt, representing debt
secured by revenues generated from operating bond-financed facilities, totaled $4.0 billion.
Additionally, indirect state debt at June 30, 2016, was approximately $11.8 billion, $200 million
more than the previous year-end. Indirect debt is either not secured by traditional state revenues
or is an obligation of a legal entity other than the state. Indirect debt has become a more
significant part of the state’s overall debt profile due to borrowings by State University Direct
Support Organizations (DSOs) and insurance-related entities, such as the Citizens Property
Insurance Corporation and the Florida Hurricane Catastrophe Fund Finance Corporation;
however, indirect debt is not included in state debt ratios or the debt affordability analysis.
[SEE GRAPH ON FOLLOWING PAGE]
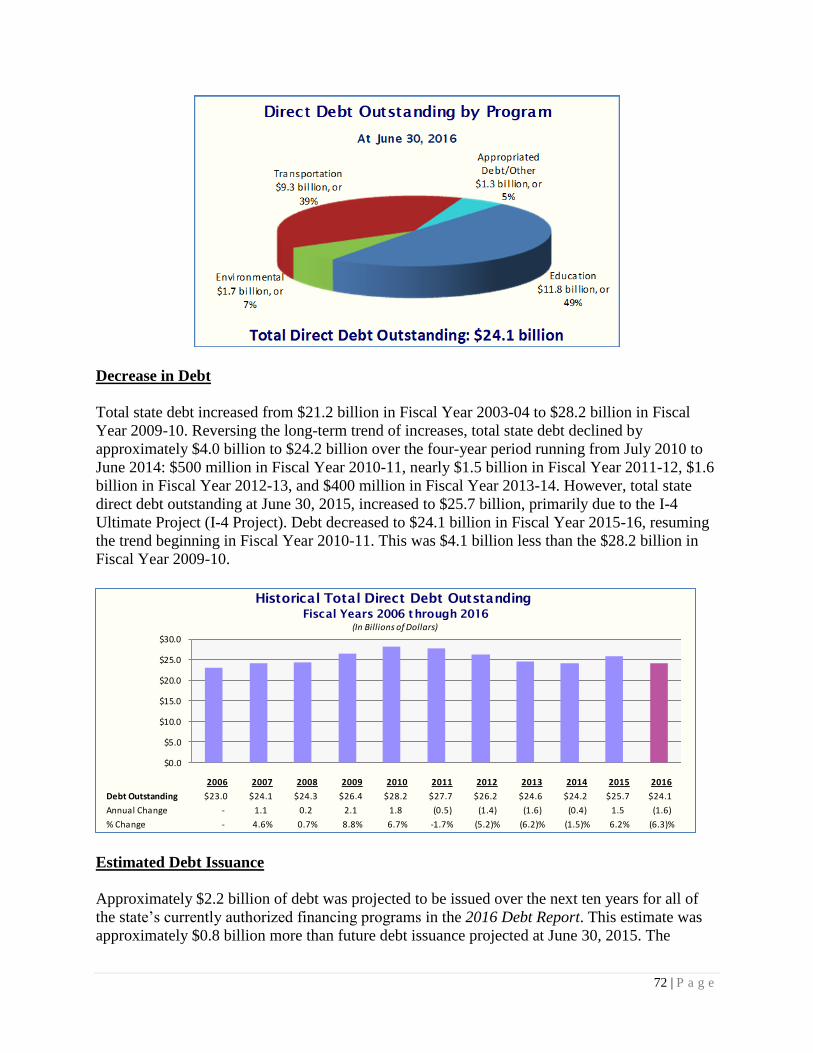
72 | P a g e
Decrease in Debt
Total state debt increased from $21.2 billion in Fiscal Year 2003-04 to $28.2 billion in Fiscal
Year 2009-10. Reversing the long-term trend of increases, total state debt declined by
approximately $4.0 billion to $24.2 billion over the four-year period running from July 2010 to
June 2014: $500 million in Fiscal Year 2010-11, nearly $1.5 billion in Fiscal Year 2011-12, $1.6
billion in Fiscal Year 2012-13, and $400 million in Fiscal Year 2013-14. However, total state
direct debt outstanding at June 30, 2015, increased to $25.7 billion, primarily due to the I-4
Ultimate Project (I-4 Project). Debt decreased to $24.1 billion in Fiscal Year 2015-16, resuming
the trend beginning in Fiscal Year 2010-11. This was $4.1 billion less than the $28.2 billion in
Fiscal Year 2009-10.
Estimated Debt Issuance
Approximately $2.2 billion of debt was projected to be issued over the next ten years for all of
the state’s currently authorized financing programs in the 2016 Debt Report. This estimate was
approximately $0.8 billion more than future debt issuance projected at June 30, 2015. The
2006 2007 2008 2009 2010 2011 2012 2013 2014 2015 2016
Debt Outstanding $23.0 $24.1 $24.3 $26.4 $28.2 $27.7 $26.2 $24.6 $24.2 $25.7 $24.1
Annual Change - 1.1 0.2 2.1 1.8 (0.5) (1.4) (1.6) (0.4) 1.5 (1.6)
% Change - 4.6% 0.7% 8.8% 6.7% -1.7% (5.2)% (6.2)% (1.5)% 6.2% (6.3)%
Fiscal Years 2006 through 2016
(In Billions of Dollars)
Historical Total Direct Debt Outstanding
$0.0
$5.0
$10.0
$15.0
$20.0
$25.0
$30.0
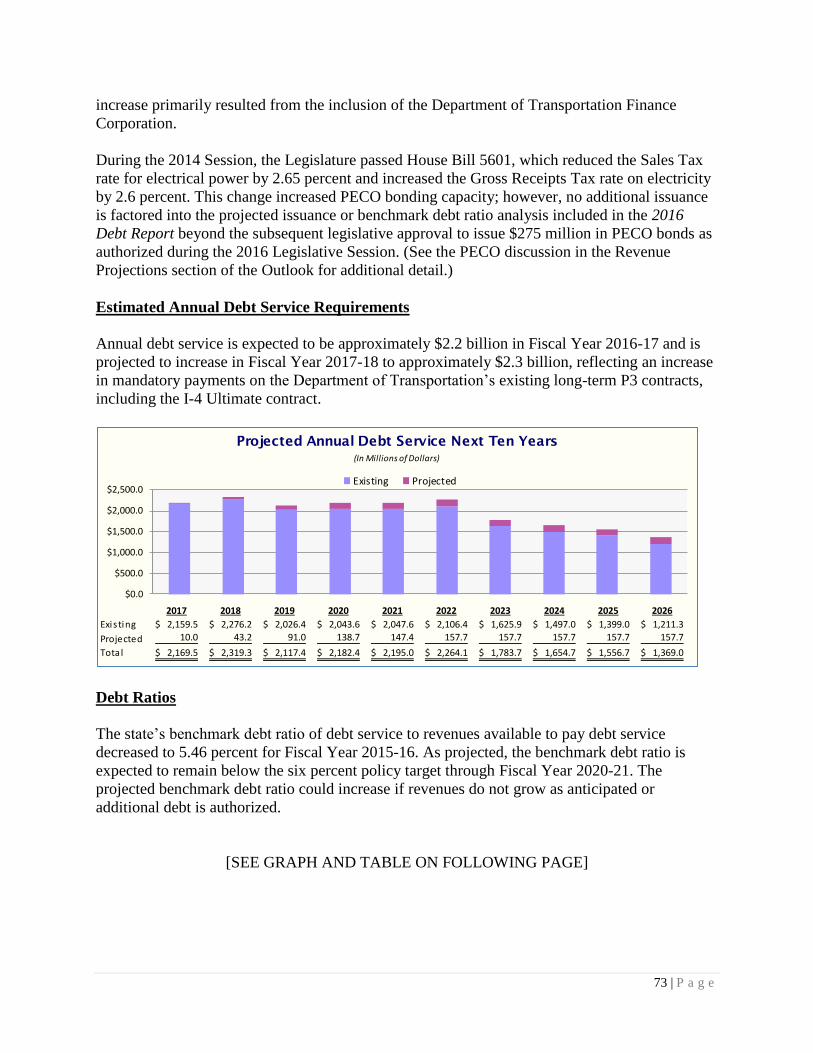
73 | P a g e
increase primarily resulted from the inclusion of the Department of Transportation Finance
Corporation.
During the 2014 Session, the Legislature passed House Bill 5601, which reduced the Sales Tax
rate for electrical power by 2.65 percent and increased the Gross Receipts Tax rate on electricity
by 2.6 percent. This change increased PECO bonding capacity; however, no additional issuance
is factored into the projected issuance or benchmark debt ratio analysis included in the 2016
Debt Report beyond the subsequent legislative approval to issue $275 million in PECO bonds as
authorized during the 2016 Legislative Session. (See the PECO discussion in the Revenue
Projections section of the Outlook for additional detail.)
Estimated Annual Debt Service Requirements
Annual debt service is expected to be approximately $2.2 billion in Fiscal Year 2016-17 and is
projected to increase in Fiscal Year 2017-18 to approximately $2.3 billion, reflecting an increase
in mandatory payments on the Department of Transportation’s existing long-term P3 contracts,
including the I-4 Ultimate contract.
Debt Ratios
The state’s benchmark debt ratio of debt service to revenues available to pay debt service
decreased to 5.46 percent for Fiscal Year 2015-16. As projected, the benchmark debt ratio is
expected to remain below the six percent policy target through Fiscal Year 2020-21. The
projected benchmark debt ratio could increase if revenues do not grow as anticipated or
additional debt is authorized.
[SEE GRAPH AND TABLE ON FOLLOWING PAGE]
2017 2018 2019 2020 2021 2022 2023 2024 2025 2026
Exis ting 2,159.5$ 2,276.2$ 2,026.4$ 2,043.6$ 2,047.6$ 2,106.4$ 1,625.9$ 1,497.0$ 1,399.0$ 1,211.3$
Projected 10.0 43.2 91.0 138.7 147.4 157.7 157.7 157.7 157.7 157.7
Total 2,169.5$ 2,319.3$ 2,117.4$ 2,182.4$ 2,195.0$ 2,264.1$ 1,783.7$ 1,654.7$ 1,556.7$ 1,369.0$
(In Millions of Dollars)
Projected Annual Debt Service Next Ten Years
$0.0
$500.0
$1,000.0
$1,500.0
$2,000.0
$2,500.0Existing Projected
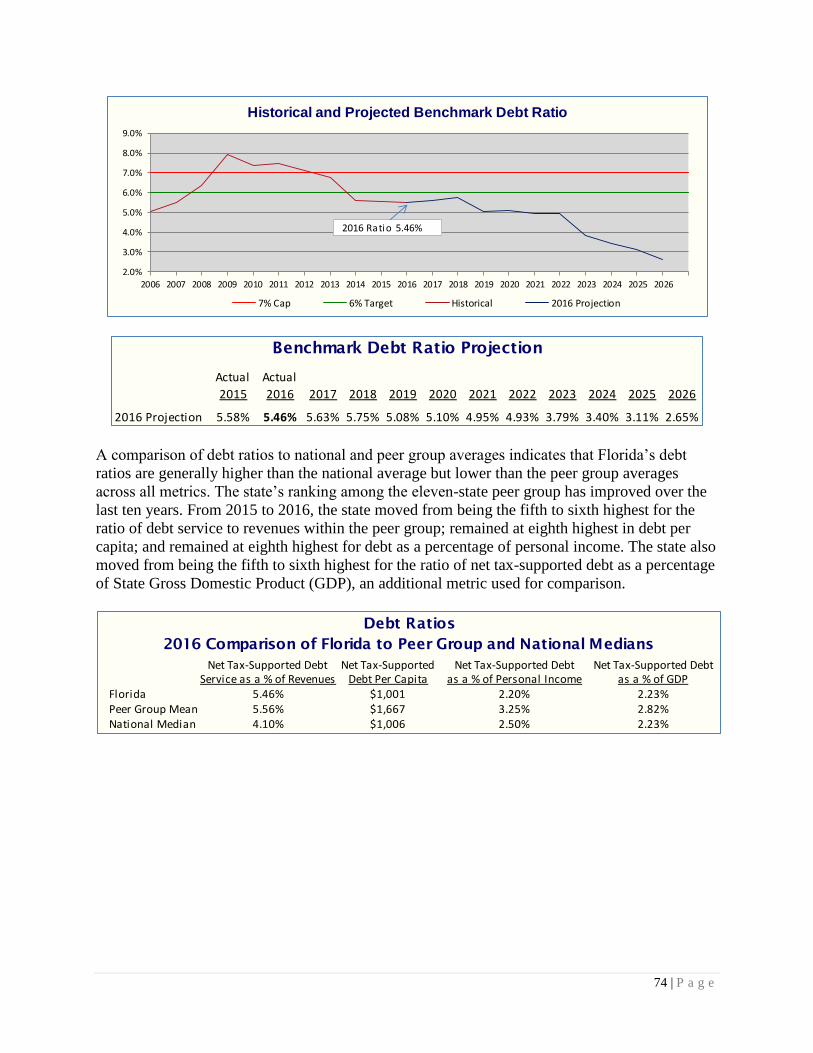
74 | P a g e
A comparison of debt ratios to national and peer group averages indicates that Florida’s debt
ratios are generally higher than the national average but lower than the peer group averages
across all metrics. The state’s ranking among the eleven-state peer group has improved over the
last ten years. From 2015 to 2016, the state moved from being the fifth to sixth highest for the
ratio of debt service to revenues within the peer group; remained at eighth highest in debt per
capita; and remained at eighth highest for debt as a percentage of personal income. The state also
moved from being the fifth to sixth highest for the ratio of net tax-supported debt as a percentage
of State Gross Domestic Product (GDP), an additional metric used for comparison.
Historical and Projected Benchmark Debt Ratio
2.0%
3.0%
4.0%
5.0%
6.0%
7.0%
8.0%
9.0%
2006 2007 2008 2009 2010 2011 2012 2013 2014 2015 2016 2017 2018 2019 2020 2021 2022 2023 2024 2025 2026
7% Cap 6% Target Historical 2016 Projection
2016 Ratio 5.46%
Actual Actual
2015 2016 2017 2018 2019 2020 2021 2022 2023 2024 2025 2026
2016 Projection 5.58% 5.46% 5.63% 5.75% 5.08% 5.10% 4.95% 4.93% 3.79% 3.40% 3.11% 2.65%
Benchmark Debt Ratio Projection
Net Tax-Supported Debt Net Tax-Supported Net Tax-Supported Debt Net Tax-Supported DebtService as a % of Revenues Debt Per Capita as a % of Personal Income as a % of GDP
Florida 5.46% $1,001 2.20% 2.23%Peer Group Mean 5.56% $1,667 3.25% 2.82%National Median 4.10% $1,006 2.50% 2.23%
2016 Comparison of Florida to Peer Group and National Medians
Debt Ratios
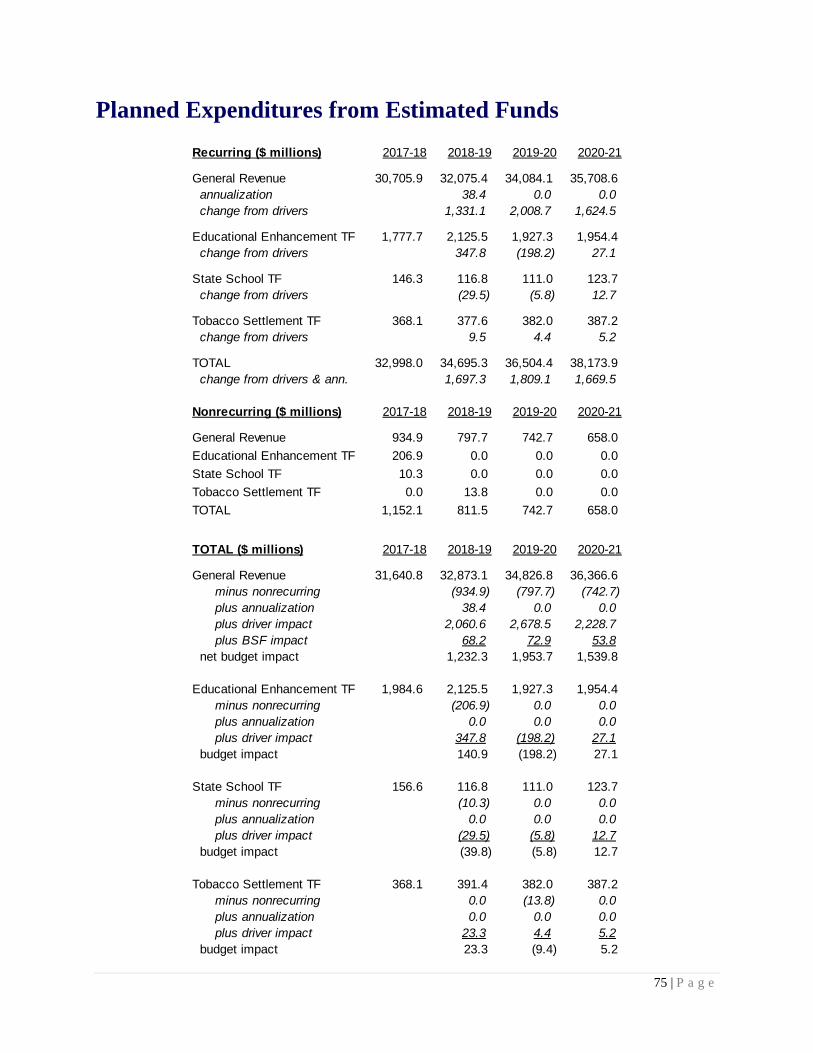
75 | P a g e
Planned Expenditures from Estimated Funds
Recurring ($ millions) 2017-18 2018-19 2019-20 2020-21
General Revenue 30,705.9 32,075.4 34,084.1 35,708.6
annualization 38.4 0.0 0.0
change from drivers 1,331.1 2,008.7 1,624.5
Educational Enhancement TF 1,777.7 2,125.5 1,927.3 1,954.4
change from drivers 347.8 (198.2) 27.1
State School TF 146.3 116.8 111.0 123.7
change from drivers (29.5) (5.8) 12.7
Tobacco Settlement TF 368.1 377.6 382.0 387.2
change from drivers 9.5 4.4 5.2
TOTAL 32,998.0 34,695.3 36,504.4 38,173.9
change from drivers & ann. 1,697.3 1,809.1 1,669.5
Nonrecurring ($ millions) 2017-18 2018-19 2019-20 2020-21
General Revenue 934.9 797.7 742.7 658.0
Educational Enhancement TF 206.9 0.0 0.0 0.0
State School TF 10.3 0.0 0.0 0.0
Tobacco Settlement TF 0.0 13.8 0.0 0.0
TOTAL 1,152.1 811.5 742.7 658.0
TOTAL ($ millions) 2017-18 2018-19 2019-20 2020-21
General Revenue 31,640.8 32,873.1 34,826.8 36,366.6
minus nonrecurring (934.9) (797.7) (742.7)
plus annualization 38.4 0.0 0.0
plus driver impact 2,060.6 2,678.5 2,228.7
plus BSF impact 68.2 72.9 53.8
net budget impact 1,232.3 1,953.7 1,539.8
Educational Enhancement TF 1,984.6 2,125.5 1,927.3 1,954.4
minus nonrecurring (206.9) 0.0 0.0
plus annualization 0.0 0.0 0.0
plus driver impact 347.8 (198.2) 27.1
budget impact 140.9 (198.2) 27.1
State School TF 156.6 116.8 111.0 123.7
minus nonrecurring (10.3) 0.0 0.0
plus annualization 0.0 0.0 0.0
plus driver impact (29.5) (5.8) 12.7
budget impact (39.8) (5.8) 12.7
Tobacco Settlement TF 368.1 391.4 382.0 387.2
minus nonrecurring 0.0 (13.8) 0.0
plus annualization 0.0 0.0 0.0
plus driver impact 23.3 4.4 5.2
budget impact 23.3 (9.4) 5.2
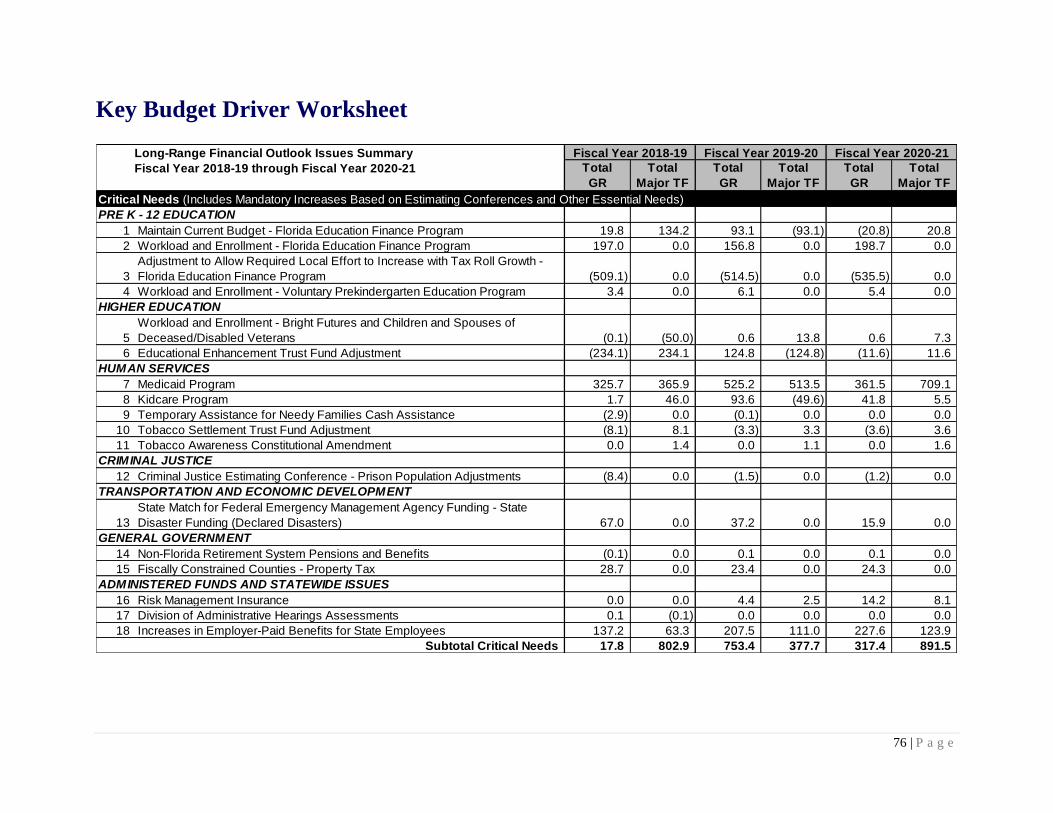
76 | P a g e
Key Budget Driver Worksheet
Long-Range Financial Outlook Issues Summary
Fiscal Year 2018-19 through Fiscal Year 2020-21 Total
GR
Total
Major TF
Total
GR
Total
Major TF
Total
GR
Total
Major TF
PRE K - 12 EDUCATION
1 Maintain Current Budget - Florida Education Finance Program 19.8 134.2 93.1 (93.1) (20.8) 20.8
2 Workload and Enrollment - Florida Education Finance Program 197.0 0.0 156.8 0.0 198.7 0.0
3
Adjustment to Allow Required Local Effort to Increase with Tax Roll Growth -
Florida Education Finance Program (509.1) 0.0 (514.5) 0.0 (535.5) 0.0
4 Workload and Enrollment - Voluntary Prekindergarten Education Program 3.4 0.0 6.1 0.0 5.4 0.0
HIGHER EDUCATION
5
Workload and Enrollment - Bright Futures and Children and Spouses of
Deceased/Disabled Veterans (0.1) (50.0) 0.6 13.8 0.6 7.3
6 Educational Enhancement Trust Fund Adjustment (234.1) 234.1 124.8 (124.8) (11.6) 11.6
HUMAN SERVICES
7 Medicaid Program 325.7 365.9 525.2 513.5 361.5 709.1
8 Kidcare Program 1.7 46.0 93.6 (49.6) 41.8 5.5
9 Temporary Assistance for Needy Families Cash Assistance (2.9) 0.0 (0.1) 0.0 0.0 0.0
10 Tobacco Settlement Trust Fund Adjustment (8.1) 8.1 (3.3) 3.3 (3.6) 3.6
11 Tobacco Awareness Constitutional Amendment 0.0 1.4 0.0 1.1 0.0 1.6
CRIMINAL JUSTICE
12 Criminal Justice Estimating Conference - Prison Population Adjustments (8.4) 0.0 (1.5) 0.0 (1.2) 0.0
TRANSPORTATION AND ECONOMIC DEVELOPMENT
13
State Match for Federal Emergency Management Agency Funding - State
Disaster Funding (Declared Disasters) 67.0 0.0 37.2 0.0 15.9 0.0
GENERAL GOVERNMENT
14 Non-Florida Retirement System Pensions and Benefits (0.1) 0.0 0.1 0.0 0.1 0.0
15 Fiscally Constrained Counties - Property Tax 28.7 0.0 23.4 0.0 24.3 0.0
ADMINISTERED FUNDS AND STATEWIDE ISSUES
16 Risk Management Insurance 0.0 0.0 4.4 2.5 14.2 8.1
17 Division of Administrative Hearings Assessments 0.1 (0.1) 0.0 0.0 0.0 0.0
18 Increases in Employer-Paid Benefits for State Employees 137.2 63.3 207.5 111.0 227.6 123.9
Subtotal Critical Needs 17.8 802.9 753.4 377.7 317.4 891.5
Fiscal Year 2018-19 Fiscal Year 2019-20
Critical Needs (Includes Mandatory Increases Based on Estimating Conferences and Other Essential Needs)
Fiscal Year 2020-21
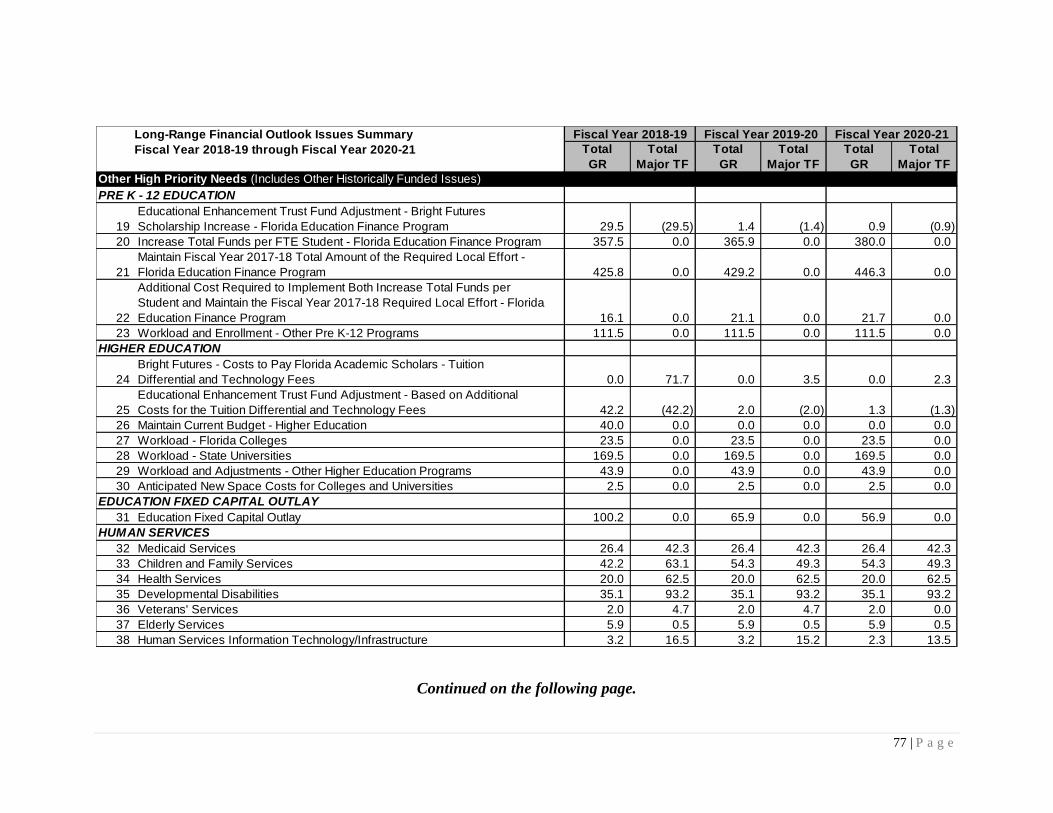
77 | P a g e
Continued on the following page.
Long-Range Financial Outlook Issues Summary
Fiscal Year 2018-19 through Fiscal Year 2020-21 Total
GR
Total
Major TF
Total
GR
Total
Major TF
Total
GR
Total
Major TF
PRE K - 12 EDUCATION
19
Educational Enhancement Trust Fund Adjustment - Bright Futures
Scholarship Increase - Florida Education Finance Program 29.5 (29.5) 1.4 (1.4) 0.9 (0.9)
20 Increase Total Funds per FTE Student - Florida Education Finance Program 357.5 0.0 365.9 0.0 380.0 0.0
21
Maintain Fiscal Year 2017-18 Total Amount of the Required Local Effort -
Florida Education Finance Program 425.8 0.0 429.2 0.0 446.3 0.0
22
Additional Cost Required to Implement Both Increase Total Funds per
Student and Maintain the Fiscal Year 2017-18 Required Local Effort - Florida
Education Finance Program 16.1 0.0 21.1 0.0 21.7 0.0
23 Workload and Enrollment - Other Pre K-12 Programs 111.5 0.0 111.5 0.0 111.5 0.0
HIGHER EDUCATION
24
Bright Futures - Costs to Pay Florida Academic Scholars - Tuition
Differential and Technology Fees 0.0 71.7 0.0 3.5 0.0 2.3
25
Educational Enhancement Trust Fund Adjustment - Based on Additional
Costs for the Tuition Differential and Technology Fees 42.2 (42.2) 2.0 (2.0) 1.3 (1.3)
26 Maintain Current Budget - Higher Education 40.0 0.0 0.0 0.0 0.0 0.0
27 Workload - Florida Colleges 23.5 0.0 23.5 0.0 23.5 0.0
28 Workload - State Universities 169.5 0.0 169.5 0.0 169.5 0.0
29 Workload and Adjustments - Other Higher Education Programs 43.9 0.0 43.9 0.0 43.9 0.0
30 Anticipated New Space Costs for Colleges and Universities 2.5 0.0 2.5 0.0 2.5 0.0
EDUCATION FIXED CAPITAL OUTLAY
31 Education Fixed Capital Outlay 100.2 0.0 65.9 0.0 56.9 0.0
HUMAN SERVICES
32 Medicaid Services 26.4 42.3 26.4 42.3 26.4 42.3
33 Children and Family Services 42.2 63.1 54.3 49.3 54.3 49.3
34 Health Services 20.0 62.5 20.0 62.5 20.0 62.5
35 Developmental Disabilities 35.1 93.2 35.1 93.2 35.1 93.2
36 Veterans' Services 2.0 4.7 2.0 4.7 2.0 0.0
37 Elderly Services 5.9 0.5 5.9 0.5 5.9 0.5
38 Human Services Information Technology/Infrastructure 3.2 16.5 3.2 15.2 2.3 13.5
Fiscal Year 2018-19 Fiscal Year 2019-20
Other High Priority Needs (Includes Other Historically Funded Issues)
Fiscal Year 2020-21
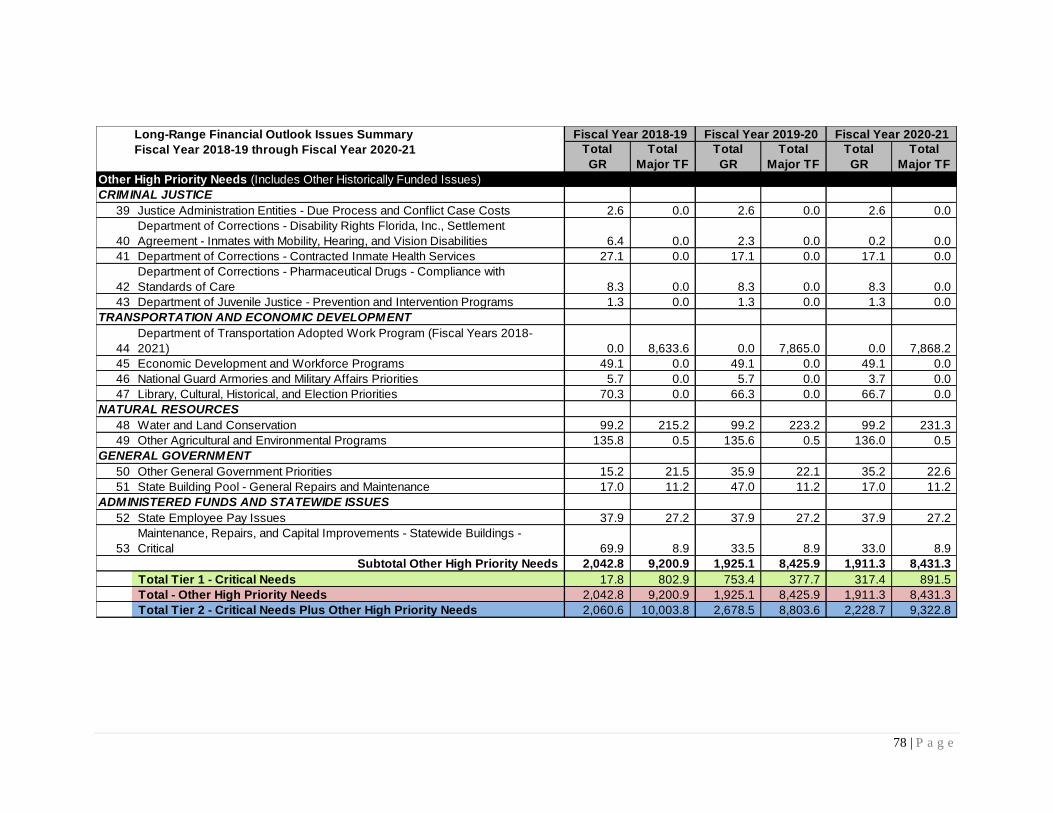
78 | P a g e
Long-Range Financial Outlook Issues Summary
Fiscal Year 2018-19 through Fiscal Year 2020-21 Total
GR
Total
Major TF
Total
GR
Total
Major TF
Total
GR
Total
Major TF
CRIMINAL JUSTICE
39 Justice Administration Entities - Due Process and Conflict Case Costs 2.6 0.0 2.6 0.0 2.6 0.0
40
Department of Corrections - Disability Rights Florida, Inc., Settlement
Agreement - Inmates with Mobility, Hearing, and Vision Disabilities 6.4 0.0 2.3 0.0 0.2 0.0
41 Department of Corrections - Contracted Inmate Health Services 27.1 0.0 17.1 0.0 17.1 0.0
42
Department of Corrections - Pharmaceutical Drugs - Compliance with
Standards of Care 8.3 0.0 8.3 0.0 8.3 0.0
43 Department of Juvenile Justice - Prevention and Intervention Programs 1.3 0.0 1.3 0.0 1.3 0.0
TRANSPORTATION AND ECONOMIC DEVELOPMENT
44
Department of Transportation Adopted Work Program (Fiscal Years 2018-
2021) 0.0 8,633.6 0.0 7,865.0 0.0 7,868.2
45 Economic Development and Workforce Programs 49.1 0.0 49.1 0.0 49.1 0.0
46 National Guard Armories and Military Affairs Priorities 5.7 0.0 5.7 0.0 3.7 0.0
47 Library, Cultural, Historical, and Election Priorities 70.3 0.0 66.3 0.0 66.7 0.0
NATURAL RESOURCES
48 Water and Land Conservation 99.2 215.2 99.2 223.2 99.2 231.3
49 Other Agricultural and Environmental Programs 135.8 0.5 135.6 0.5 136.0 0.5
GENERAL GOVERNMENT
50 Other General Government Priorities 15.2 21.5 35.9 22.1 35.2 22.6
51 State Building Pool - General Repairs and Maintenance 17.0 11.2 47.0 11.2 17.0 11.2
ADMINISTERED FUNDS AND STATEWIDE ISSUES
52 State Employee Pay Issues 37.9 27.2 37.9 27.2 37.9 27.2
53
Maintenance, Repairs, and Capital Improvements - Statewide Buildings -
Critical 69.9 8.9 33.5 8.9 33.0 8.9
Subtotal Other High Priority Needs 2,042.8 9,200.9 1,925.1 8,425.9 1,911.3 8,431.3
Total Tier 1 - Critical Needs 17.8 802.9 753.4 377.7 317.4 891.5
Total - Other High Priority Needs 2,042.8 9,200.9 1,925.1 8,425.9 1,911.3 8,431.3
Total Tier 2 - Critical Needs Plus Other High Priority Needs 2,060.6 10,003.8 2,678.5 8,803.6 2,228.7 9,322.8
Fiscal Year 2018-19 Fiscal Year 2019-20
Other High Priority Needs (Includes Other Historically Funded Issues)
Fiscal Year 2020-21
79 | P a g e
Key Budget Drivers
For each policy area, a specific analysis is provided for each of the key budget drivers.
The numbering convention used below matches the numbers applied to each of the
drivers on the Key Budget Driver Worksheet. As on the Worksheet, Critical Needs are
discussed first. They are followed by the Other High Priority Needs.
Critical Needs
Pre K-12 Education (Drivers #1 - #4)
For Fiscal Year 2017-18, the Florida Education Finance Program (FEFP) provides $7,297.087 in
total funds per unweighted full-time equivalent (FTE) student. Together, Key Budget Drivers #1
through #3 reflect the total state funding necessary to maintain the Fiscal Year 2017-18 level of
funding per FTE student throughout the forecast period, assuming that the Required Local Effort
and Discretionary Taxes from the 0.748 levy are allowed to increase with tax roll growth.
1. Maintain Current Budget – Florida Education Finance Program
The Florida Education Finance Program (FEFP) is the state’s formula to allocate funds
appropriated to school districts for K-12 public school operations. The FEFP implements the
constitutional requirement for a uniform system of free public education and is an allocation
model based on student enrollment in educational programs. In order to ensure equalized funding
per student, the FEFP is composed of state and local funds and takes into account the individual
educational needs of students; the local property tax base; the costs of educational programs;
district cost differentials; and sparsity of student population.
State FEFP revenues are derived from three fund sources:
General Revenue Fund – comprised of several state taxes and selected fees; the state’s
sales tax is the biggest source of revenue.
Educational Enhancement Trust Fund (EETF) – comprised of net proceeds from lottery
ticket sales and slot machine revenues appropriated for both the public K-12 and higher
education systems.
State School Trust Fund (SSTF) – comprised primarily of revenue from unclaimed
property in Florida appropriated exclusively for the public K-12 education system.
Local FEFP revenues are derived from property taxes levied by Florida’s 67 counties. To
participate in the state allocation of FEFP funds, a school district must levy the millage rate set
for its Required Local Effort (RLE) from property taxes. The Legislature sets the aggregate
amount of the RLE in the General Appropriations Act. Each school district’s share of this
7 As of the 2017-18 FEFP 2nd Calculation which is available here: http://www.fldoe.org/core/fileparse.php/7507/urlt/17182ndCalc.pdf
80 | P a g e
amount is based on the school district’s certified property tax valuations and each school
district’s required millage rate as established by the Commissioner of Education. In addition to
the RLE millage, each school district board may levy a nonvoted current operating discretionary
millage. The Legislature annually prescribes in the General Appropriations Act the maximum
amount of millage a district may levy; the current maximum amount is 0.748 mills.
Recurring state funds are provided as Critical Needs funding in Fiscal Year 2018-19 to restore
$154.0 million in nonrecurring funds appropriated for the FEFP in Fiscal Year 2017-18.
In addition, the July and August 2017 revenue estimating conferences projected an increase in
revenue in the EETF and a decrease in revenue in the SSTF. When compared to the recurring
appropriations from both trust funds, a surplus of $134.2 million is available to restore the
nonrecurring funds ($163.7 million surplus in EETF plus a $29.5 million shortfall in SSTF
funds). With the overall increase in available trust funds, an additional $19.8 million is needed
over the $134.2 million to restore the total $154.0 million needed to maintain the level of the
Fiscal Year 2018-19 FEFP appropriation. (See Driver #6 for additional details.)
2. Workload and Enrollment – Florida Education Finance Program
General Revenue funds are provided as Critical Needs funding for projected enrollment growth
in the Florida Education Finance Program.
Enrollment growth for the three forecast years is based on estimates from the July 2017
Education Estimating Conference. For Fiscal Year 2018-19, the projected enrollment growth is
an additional 27,184 FTE; which results in an estimated $197.0 million necessary to maintain the
current level of $7,297.08 in total funds per student. For the additional 21,482 FTE in Fiscal
Year 2019-20, an estimated $156.8 million is needed, and $198.7 million is needed for the
additional 27,231 FTE in Fiscal Year 2020-21. Enrollment over the three-year forecast period is
estimated to increase in total by 75,898 FTE.
Fiscal Year 2018-19
Fiscal Year 2019-20
Fiscal Year 2020-21
Workload and Enrollment – FEFP $197.0 million $156.8 million $198.7 million
3. Adjustment to Allow Required Local Effort to Increase with Tax Roll Growth – Florida
Education Finance Program
The Florida Education Finance Program (FEFP) allocates funding to school districts for K-12
public school operations based on shares of state funds and local funds generated from ad
valorem revenues. In order to ensure equalized funding, the FEFP takes into account the local
property tax base while adjusting state funding to each district based on the district’s ability to
generate local ad valorem revenues. As discussed in Driver #1, each school district participating
in the state allocation of funds for the current operation of schools must levy the millage rate set
for its Required Local Effort (RLE) from property taxes. The Legislature establishes the total
statewide amount for the RLE annually in the General Appropriations Act. Each district’s
millage rate is subsequently determined by the Commissioner of Education based on the
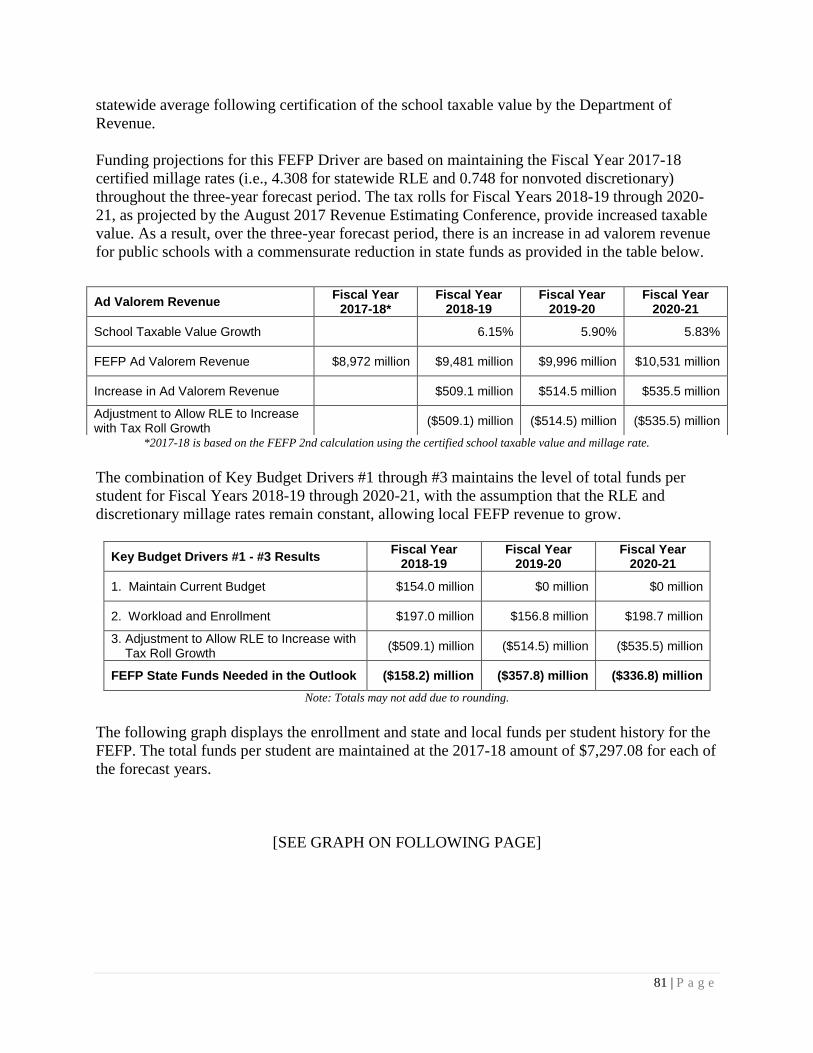
81 | P a g e
statewide average following certification of the school taxable value by the Department of
Revenue.
Funding projections for this FEFP Driver are based on maintaining the Fiscal Year 2017-18
certified millage rates (i.e., 4.308 for statewide RLE and 0.748 for nonvoted discretionary)
throughout the three-year forecast period. The tax rolls for Fiscal Years 2018-19 through 2020-
21, as projected by the August 2017 Revenue Estimating Conference, provide increased taxable
value. As a result, over the three-year forecast period, there is an increase in ad valorem revenue
for public schools with a commensurate reduction in state funds as provided in the table below.
*2017-18 is based on the FEFP 2nd calculation using the certified school taxable value and millage rate.
The combination of Key Budget Drivers #1 through #3 maintains the level of total funds per
student for Fiscal Years 2018-19 through 2020-21, with the assumption that the RLE and
discretionary millage rates remain constant, allowing local FEFP revenue to grow.
Key Budget Drivers #1 - #3 Results Fiscal Year
2018-19 Fiscal Year
2019-20 Fiscal Year
2020-21
1. Maintain Current Budget $154.0 million $0 million $0 million
2. Workload and Enrollment $197.0 million $156.8 million $198.7 million
3. Adjustment to Allow RLE to Increase with Tax Roll Growth
($509.1) million ($514.5) million ($535.5) million
FEFP State Funds Needed in the Outlook ($158.2) million ($357.8) million ($336.8) million
Note: Totals may not add due to rounding.
The following graph displays the enrollment and state and local funds per student history for the
FEFP. The total funds per student are maintained at the 2017-18 amount of $7,297.08 for each of
the forecast years.
[SEE GRAPH ON FOLLOWING PAGE]
Ad Valorem Revenue Fiscal Year
2017-18* Fiscal Year
2018-19 Fiscal Year
2019-20 Fiscal Year
2020-21
School Taxable Value Growth 6.15% 5.90% 5.83%
FEFP Ad Valorem Revenue $8,972 million $9,481 million $9,996 million $10,531 million
Increase in Ad Valorem Revenue $509.1 million $514.5 million $535.5 million
Adjustment to Allow RLE to Increase with Tax Roll Growth
($509.1) million ($514.5) million ($535.5) million
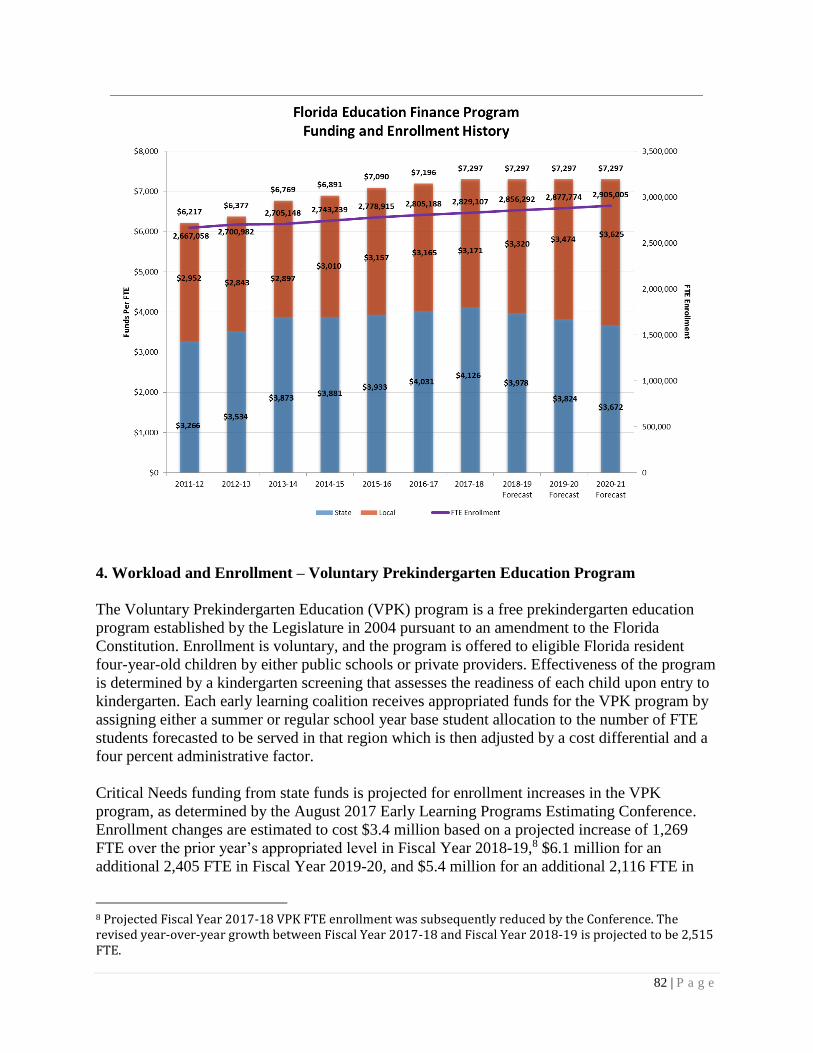
82 | P a g e
4. Workload and Enrollment – Voluntary Prekindergarten Education Program
The Voluntary Prekindergarten Education (VPK) program is a free prekindergarten education
program established by the Legislature in 2004 pursuant to an amendment to the Florida
Constitution. Enrollment is voluntary, and the program is offered to eligible Florida resident
four-year-old children by either public schools or private providers. Effectiveness of the program
is determined by a kindergarten screening that assesses the readiness of each child upon entry to
kindergarten. Each early learning coalition receives appropriated funds for the VPK program by
assigning either a summer or regular school year base student allocation to the number of FTE
students forecasted to be served in that region which is then adjusted by a cost differential and a
four percent administrative factor.
Critical Needs funding from state funds is projected for enrollment increases in the VPK
program, as determined by the August 2017 Early Learning Programs Estimating Conference.
Enrollment changes are estimated to cost $3.4 million based on a projected increase of 1,269
FTE over the prior year’s appropriated level in Fiscal Year 2018-19,8 $6.1 million for an
additional 2,405 FTE in Fiscal Year 2019-20, and $5.4 million for an additional 2,116 FTE in
8 Projected Fiscal Year 2017-18 VPK FTE enrollment was subsequently reduced by the Conference. The revised year-over-year growth between Fiscal Year 2017-18 and Fiscal Year 2018-19 is projected to be 2,515 FTE.
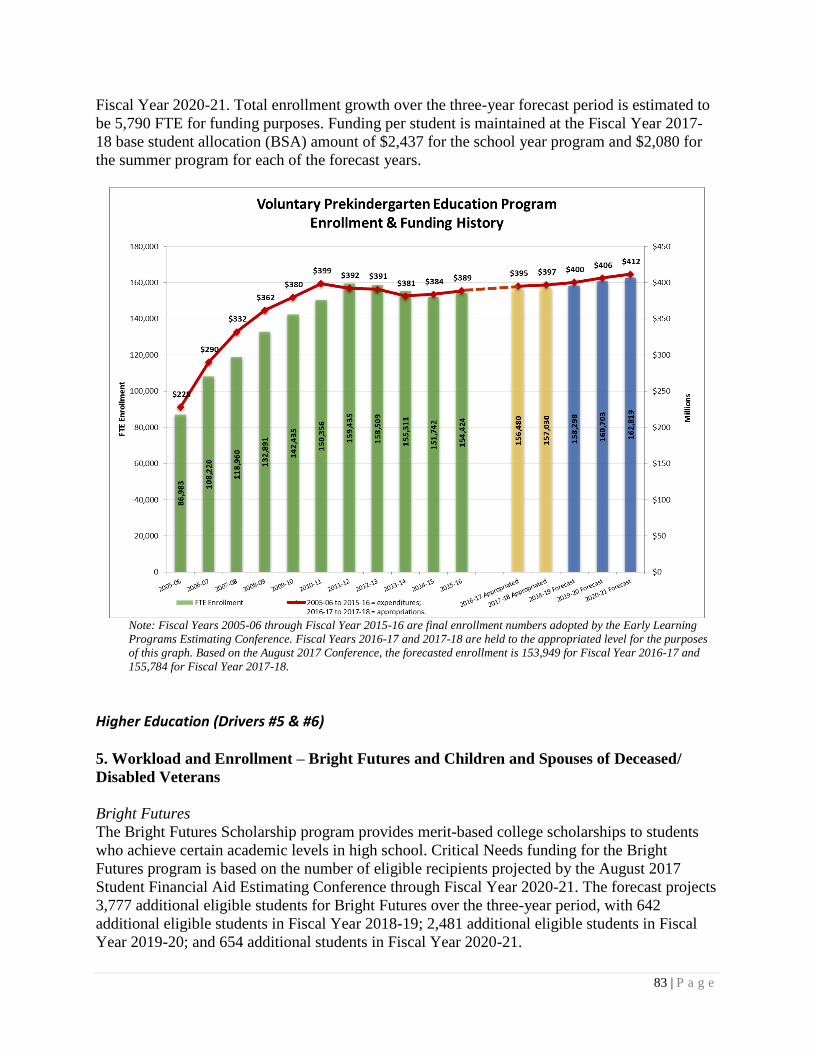
83 | P a g e
Fiscal Year 2020-21. Total enrollment growth over the three-year forecast period is estimated to
be 5,790 FTE for funding purposes. Funding per student is maintained at the Fiscal Year 2017-
18 base student allocation (BSA) amount of $2,437 for the school year program and $2,080 for
the summer program for each of the forecast years.
Note: Fiscal Years 2005-06 through Fiscal Year 2015-16 are final enrollment numbers adopted by the Early Learning
Programs Estimating Conference. Fiscal Years 2016-17 and 2017-18 are held to the appropriated level for the purposes
of this graph. Based on the August 2017 Conference, the forecasted enrollment is 153,949 for Fiscal Year 2016-17 and
155,784 for Fiscal Year 2017-18.
Higher Education (Drivers #5 & #6)
5. Workload and Enrollment – Bright Futures and Children and Spouses of Deceased/
Disabled Veterans
Bright Futures
The Bright Futures Scholarship program provides merit-based college scholarships to students
who achieve certain academic levels in high school. Critical Needs funding for the Bright
Futures program is based on the number of eligible recipients projected by the August 2017
Student Financial Aid Estimating Conference through Fiscal Year 2020-21. The forecast projects
3,777 additional eligible students for Bright Futures over the three-year period, with 642
additional eligible students in Fiscal Year 2018-19; 2,481 additional eligible students in Fiscal
Year 2019-20; and 654 additional students in Fiscal Year 2020-21.
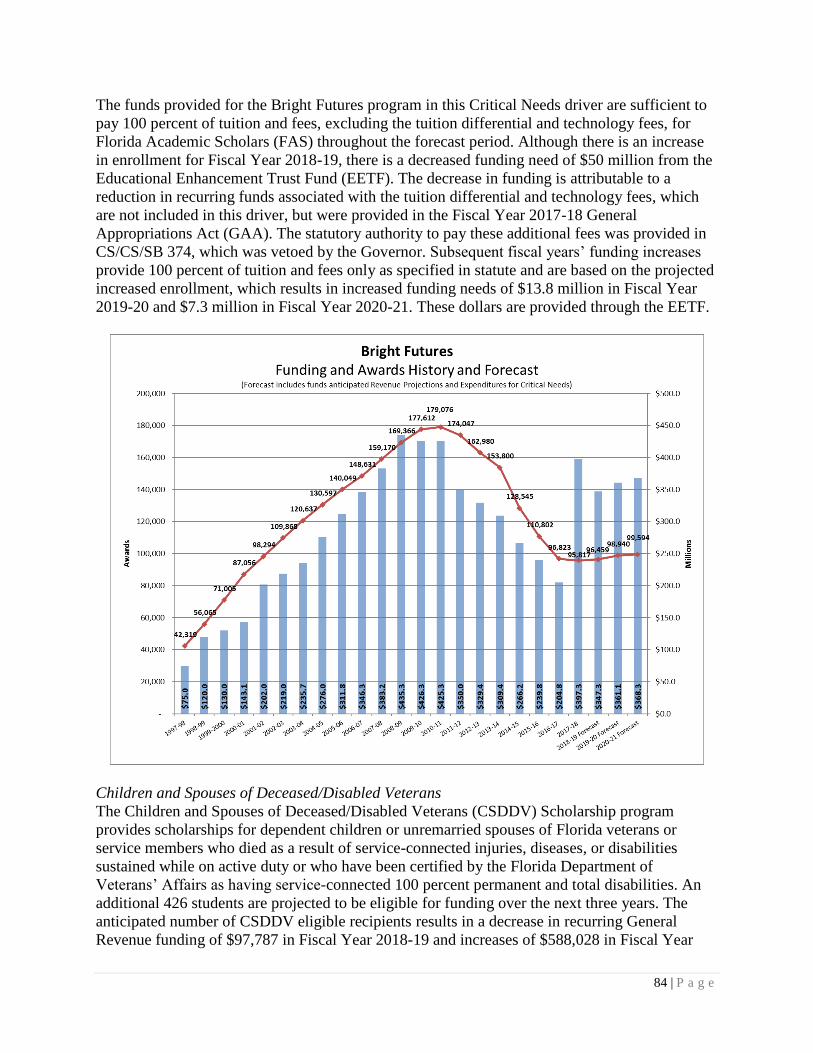
84 | P a g e
The funds provided for the Bright Futures program in this Critical Needs driver are sufficient to
pay 100 percent of tuition and fees, excluding the tuition differential and technology fees, for
Florida Academic Scholars (FAS) throughout the forecast period. Although there is an increase
in enrollment for Fiscal Year 2018-19, there is a decreased funding need of $50 million from the
Educational Enhancement Trust Fund (EETF). The decrease in funding is attributable to a
reduction in recurring funds associated with the tuition differential and technology fees, which
are not included in this driver, but were provided in the Fiscal Year 2017-18 General
Appropriations Act (GAA). The statutory authority to pay these additional fees was provided in
CS/CS/SB 374, which was vetoed by the Governor. Subsequent fiscal years’ funding increases
provide 100 percent of tuition and fees only as specified in statute and are based on the projected
increased enrollment, which results in increased funding needs of $13.8 million in Fiscal Year
2019-20 and $7.3 million in Fiscal Year 2020-21. These dollars are provided through the EETF.
Children and Spouses of Deceased/Disabled Veterans
The Children and Spouses of Deceased/Disabled Veterans (CSDDV) Scholarship program
provides scholarships for dependent children or unremarried spouses of Florida veterans or
service members who died as a result of service-connected injuries, diseases, or disabilities
sustained while on active duty or who have been certified by the Florida Department of
Veterans’ Affairs as having service-connected 100 percent permanent and total disabilities. An
additional 426 students are projected to be eligible for funding over the next three years. The
anticipated number of CSDDV eligible recipients results in a decrease in recurring General
Revenue funding of $97,787 in Fiscal Year 2018-19 and increases of $588,028 in Fiscal Year
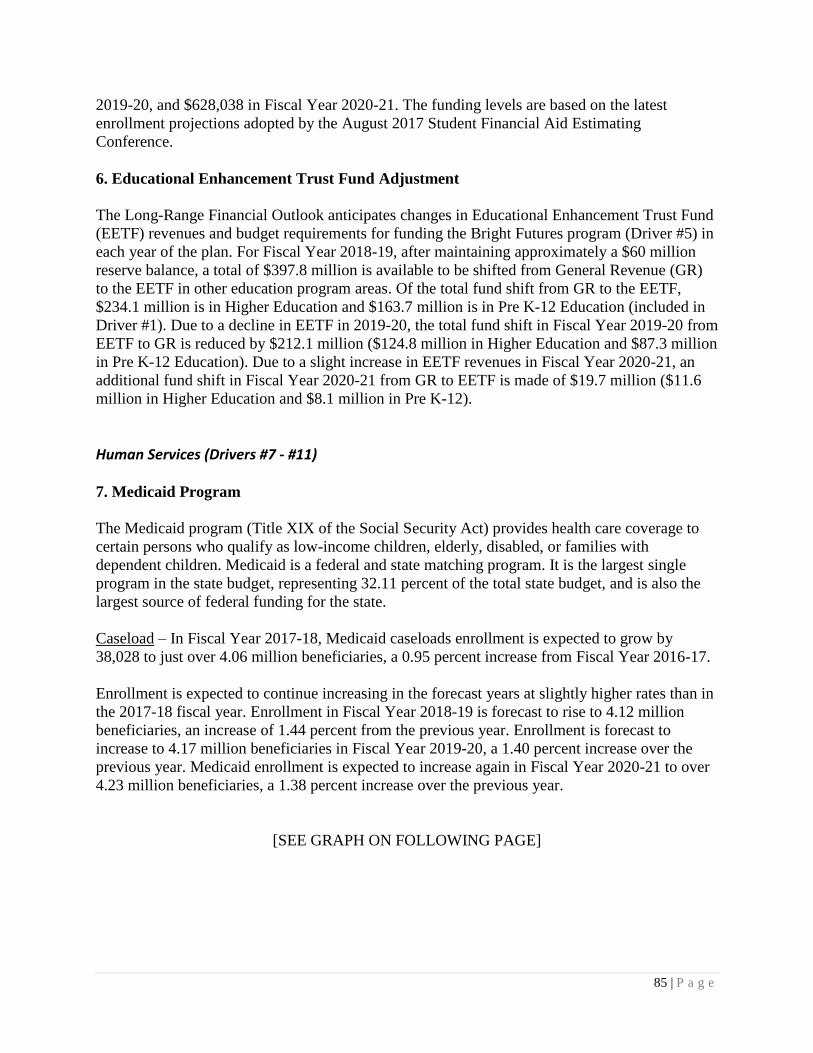
85 | P a g e
2019-20, and $628,038 in Fiscal Year 2020-21. The funding levels are based on the latest
enrollment projections adopted by the August 2017 Student Financial Aid Estimating
Conference.
6. Educational Enhancement Trust Fund Adjustment
The Long-Range Financial Outlook anticipates changes in Educational Enhancement Trust Fund
(EETF) revenues and budget requirements for funding the Bright Futures program (Driver #5) in
each year of the plan. For Fiscal Year 2018-19, after maintaining approximately a $60 million
reserve balance, a total of $397.8 million is available to be shifted from General Revenue (GR)
to the EETF in other education program areas. Of the total fund shift from GR to the EETF,
$234.1 million is in Higher Education and $163.7 million is in Pre K-12 Education (included in
Driver #1). Due to a decline in EETF in 2019-20, the total fund shift in Fiscal Year 2019-20 from
EETF to GR is reduced by $212.1 million ($124.8 million in Higher Education and $87.3 million
in Pre K-12 Education). Due to a slight increase in EETF revenues in Fiscal Year 2020-21, an
additional fund shift in Fiscal Year 2020-21 from GR to EETF is made of $19.7 million ($11.6
million in Higher Education and $8.1 million in Pre K-12).
Human Services (Drivers #7 - #11)
7. Medicaid Program
The Medicaid program (Title XIX of the Social Security Act) provides health care coverage to
certain persons who qualify as low-income children, elderly, disabled, or families with
dependent children. Medicaid is a federal and state matching program. It is the largest single
program in the state budget, representing 32.11 percent of the total state budget, and is also the
largest source of federal funding for the state.
Caseload – In Fiscal Year 2017-18, Medicaid caseloads enrollment is expected to grow by
38,028 to just over 4.06 million beneficiaries, a 0.95 percent increase from Fiscal Year 2016-17.
Enrollment is expected to continue increasing in the forecast years at slightly higher rates than in
the 2017-18 fiscal year. Enrollment in Fiscal Year 2018-19 is forecast to rise to 4.12 million
beneficiaries, an increase of 1.44 percent from the previous year. Enrollment is forecast to
increase to 4.17 million beneficiaries in Fiscal Year 2019-20, a 1.40 percent increase over the
previous year. Medicaid enrollment is expected to increase again in Fiscal Year 2020-21 to over
4.23 million beneficiaries, a 1.38 percent increase over the previous year.
[SEE GRAPH ON FOLLOWING PAGE]
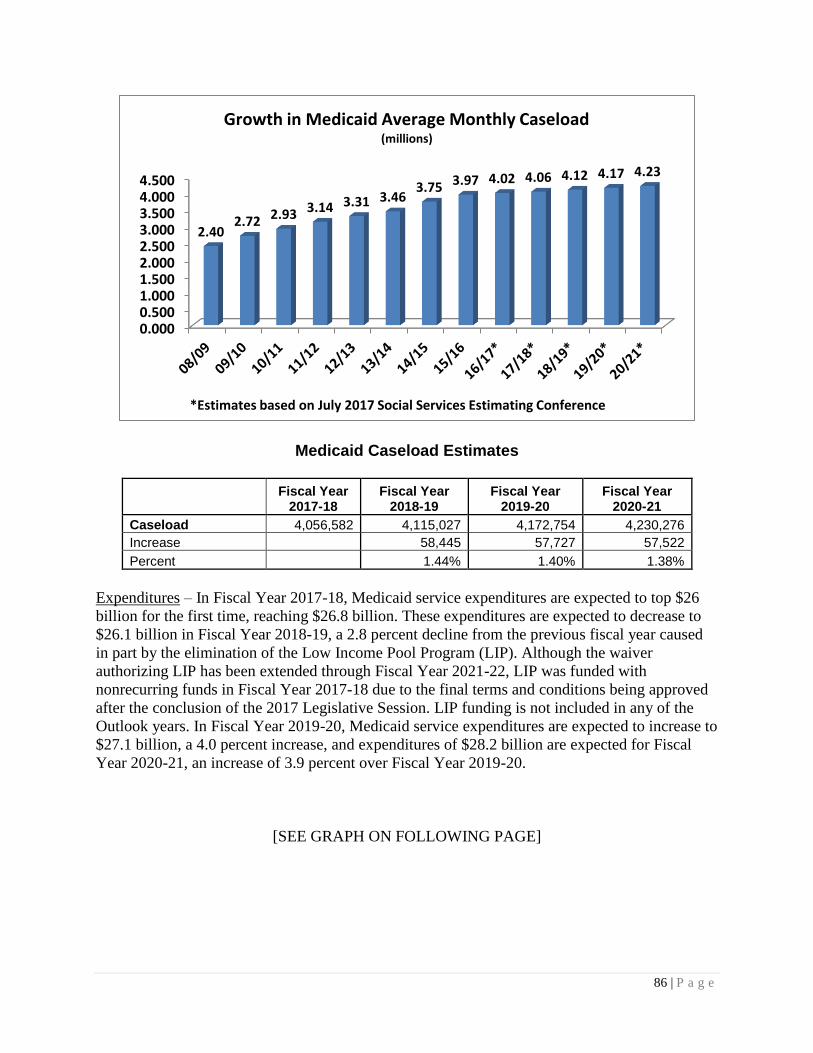
86 | P a g e
Medicaid Caseload Estimates
Fiscal Year
2017-18 Fiscal Year
2018-19 Fiscal Year
2019-20 Fiscal Year
2020-21
Caseload 4,056,582 4,115,027 4,172,754 4,230,276
Increase 58,445 57,727 57,522
Percent 1.44% 1.40% 1.38%
Expenditures – In Fiscal Year 2017-18, Medicaid service expenditures are expected to top $26
billion for the first time, reaching $26.8 billion. These expenditures are expected to decrease to
$26.1 billion in Fiscal Year 2018-19, a 2.8 percent decline from the previous fiscal year caused
in part by the elimination of the Low Income Pool Program (LIP). Although the waiver
authorizing LIP has been extended through Fiscal Year 2021-22, LIP was funded with
nonrecurring funds in Fiscal Year 2017-18 due to the final terms and conditions being approved
after the conclusion of the 2017 Legislative Session. LIP funding is not included in any of the
Outlook years. In Fiscal Year 2019-20, Medicaid service expenditures are expected to increase to
$27.1 billion, a 4.0 percent increase, and expenditures of $28.2 billion are expected for Fiscal
Year 2020-21, an increase of 3.9 percent over Fiscal Year 2019-20.
[SEE GRAPH ON FOLLOWING PAGE]
0.0000.5001.0001.5002.0002.5003.0003.5004.0004.500
2.402.72 2.93 3.14 3.31 3.46
3.75 3.97 4.02 4.06 4.12 4.17 4.23
Growth in Medicaid Average Monthly Caseload(millions)
*Estimates based on July 2017 Social Services Estimating Conference
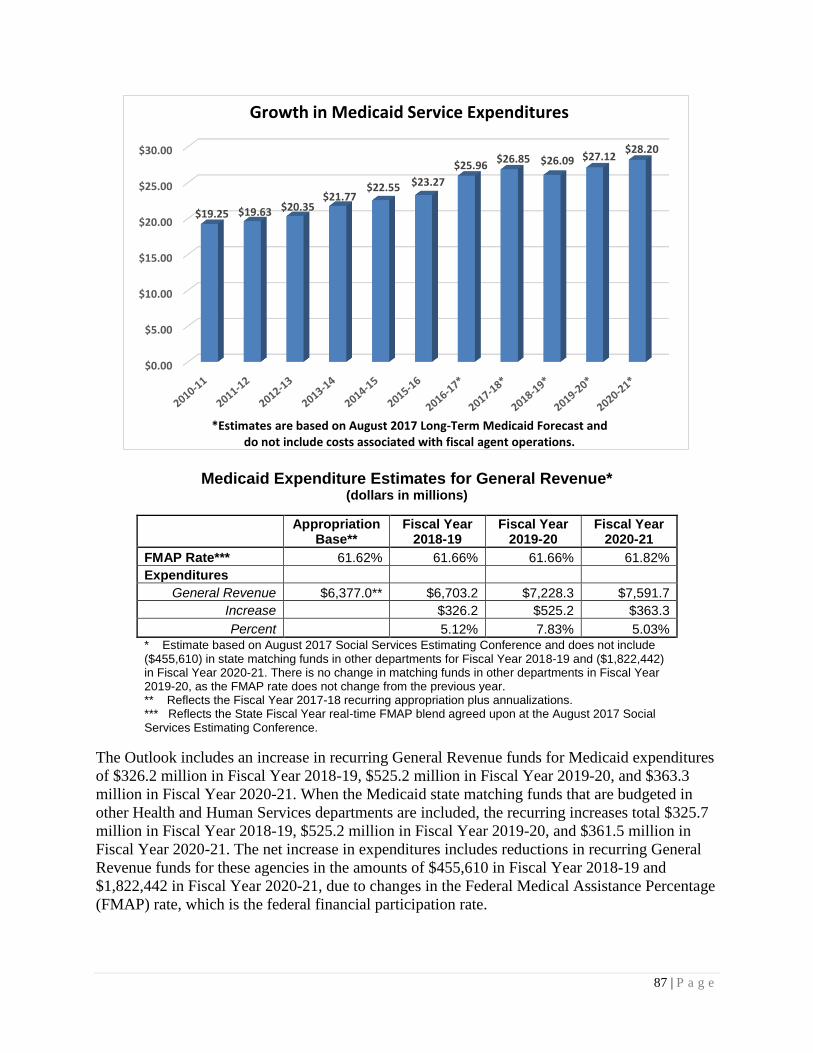
87 | P a g e
Medicaid Expenditure Estimates for General Revenue* (dollars in millions)
Appropriation
Base** Fiscal Year
2018-19 Fiscal Year
2019-20 Fiscal Year
2020-21
FMAP Rate*** 61.62% 61.66% 61.66% 61.82%
Expenditures
General Revenue $6,377.0** $6,703.2 $7,228.3 $7,591.7
Increase $326.2 $525.2 $363.3
Percent 5.12% 7.83% 5.03% * Estimate based on August 2017 Social Services Estimating Conference and does not include ($455,610) in state matching funds in other departments for Fiscal Year 2018-19 and ($1,822,442) in Fiscal Year 2020-21. There is no change in matching funds in other departments in Fiscal Year 2019-20, as the FMAP rate does not change from the previous year. ** Reflects the Fiscal Year 2017-18 recurring appropriation plus annualizations. *** Reflects the State Fiscal Year real-time FMAP blend agreed upon at the August 2017 Social Services Estimating Conference.
The Outlook includes an increase in recurring General Revenue funds for Medicaid expenditures
of $326.2 million in Fiscal Year 2018-19, $525.2 million in Fiscal Year 2019-20, and $363.3
million in Fiscal Year 2020-21. When the Medicaid state matching funds that are budgeted in
other Health and Human Services departments are included, the recurring increases total $325.7
million in Fiscal Year 2018-19, $525.2 million in Fiscal Year 2019-20, and $361.5 million in
Fiscal Year 2020-21. The net increase in expenditures includes reductions in recurring General
Revenue funds for these agencies in the amounts of $455,610 in Fiscal Year 2018-19 and
$1,822,442 in Fiscal Year 2020-21, due to changes in the Federal Medical Assistance Percentage
(FMAP) rate, which is the federal financial participation rate.
$0.00
$5.00
$10.00
$15.00
$20.00
$25.00
$30.00
$19.25 $19.63 $20.35$21.77
$22.55 $23.27
$25.96$26.85 $26.09 $27.12
$28.20
*Estimates are based on August 2017 Long-Term Medicaid Forecast and do not include costs associated with fiscal agent operations.
Growth in Medicaid Service Expenditures
88 | P a g e
Major policy assumptions and projections for Critical Needs related to Medicaid expenditures for
the forecast period are described below:
Social Services Estimating Conference – The estimated costs for caseload growth,
utilization, FMAP, fiscal agent operations, and medical inflation are projected based on
historical trends and methodologies used by the August 2017 Social Services Estimating
Conference (SSEC). The use of managed care arrangements in Florida Medicaid, as
required under the Statewide Medicaid Managed Care program pursuant to Part IV of
chapter 409, Florida Statutes, presents unique challenges to forecasting Medicaid
caseloads and expenditures. The SSEC utilized methodologies for caseload and
expenditure forecasts that included:
o Forecasting caseload at a sub-state or super-region level and expenditures at granular
level to capture the effects of regional variations in caseload growth, case mix, and
managed care contracted rates.
o Realigning caseload eligibility categories and consolidating expenditure categories to
recognize the increase in managed care, as well as the decrease in the fee-for-service
population.
o Refining the methodology for forecasting managed care rate increases in out-years.
8. Kidcare Program
The federal Children’s Health Insurance Program (CHIP – Title XXI of the Social Security Act)
has been implemented in Florida as the Kidcare program, which provides health insurance
primarily targeted to uninsured, low-income children under age 19 whose family income is at or
below 200 percent of the Family Poverty Level (FPL). In 2017, FPL is $48,600 for a family of
four. The CHIP is a federal and state matching program. The required state financial
participation for Florida is 3.75 percent for Fiscal Year 2017-18, generating a federal share of
96.25 percent for each dollar spent. The Title XXI caseload as of June 2017 was 195,725. There
were 18,925 additional children enrolled in the program who are non-Title XXI eligible, for a
total program enrollment of 214,650.
The Patient Protection and Affordable Care Act (PPACA) provides that, effective October 1,
2015, through September 30, 2019, the FMAP for children enrolled in the Kidcare program is
increased by 23 percentage points but will not exceed 100 percent. This causes Florida’s
weighted Kidcare FMAP to be an estimated 96.16 percent in Fiscal Year 2018-19. However, the
weighted Kidcare FMAP will decrease to 78.91 percent in Fiscal Year 2019-20 and 73.28
percent in Fiscal Year 2020-21. A weighted FMAP is used because the months of the state fiscal
years do not comport with the months of federal fiscal years. The increased Kidcare FMAP has
been in place since Fiscal Year 2015-16, causing a significant reduction in the state funds
required for the Kidcare program. This reduction continues through Fiscal Year 2018-19.
However, in Fiscal Year 2019-20, the PPACA’s increase to the Kidcare FMAP will expire after
the first quarter of the state’s fiscal year, which will cause the federal share to decrease to an
estimated 78.91 percent for that year, accompanied by a corresponding increase in state
expenditures. The following chart reflects caseload numbers as of June 30 of each year, while the
expenditures shown in the table reflect estimates adopted by the SSEC.
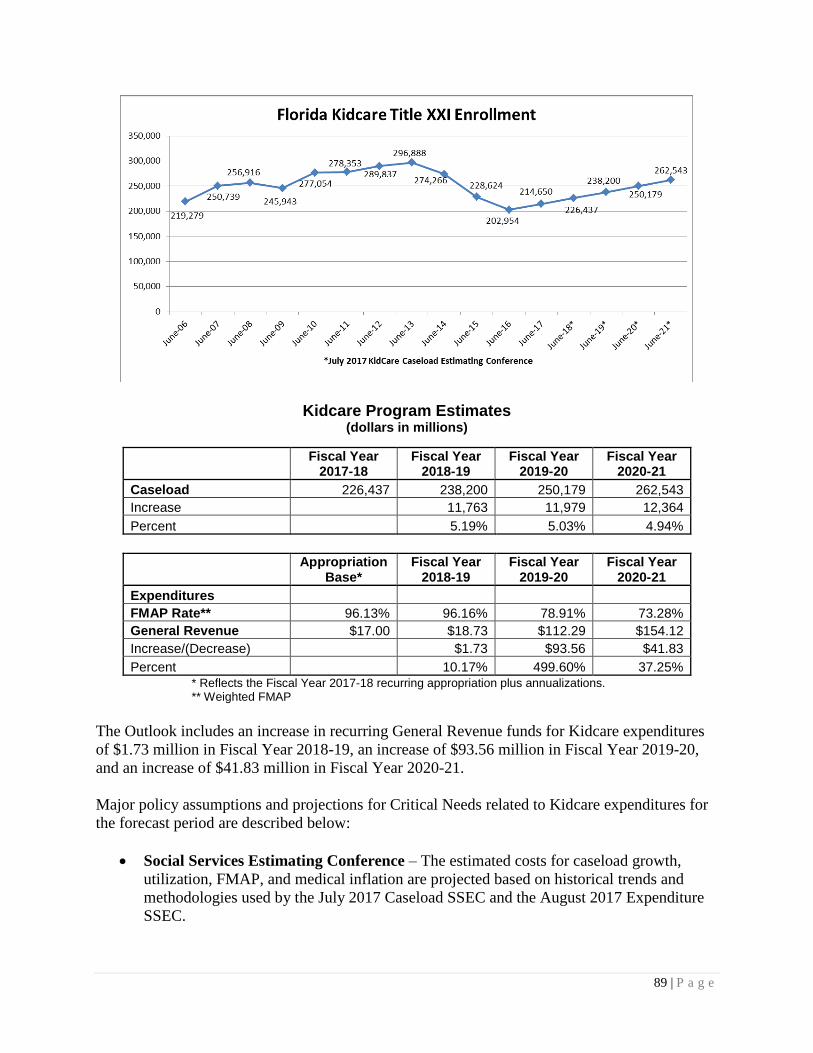
89 | P a g e
Kidcare Program Estimates (dollars in millions)
Fiscal Year
2017-18 Fiscal Year
2018-19 Fiscal Year
2019-20 Fiscal Year
2020-21
Caseload 226,437 238,200 250,179 262,543
Increase 11,763 11,979 12,364
Percent 5.19% 5.03% 4.94%
Appropriation
Base* Fiscal Year
2018-19 Fiscal Year
2019-20 Fiscal Year
2020-21
Expenditures
FMAP Rate** 96.13% 96.16% 78.91% 73.28%
General Revenue $17.00 $18.73 $112.29 $154.12
Increase/(Decrease) $1.73 $93.56 $41.83
Percent 10.17% 499.60% 37.25% * Reflects the Fiscal Year 2017-18 recurring appropriation plus annualizations.
** Weighted FMAP
The Outlook includes an increase in recurring General Revenue funds for Kidcare expenditures
of $1.73 million in Fiscal Year 2018-19, an increase of $93.56 million in Fiscal Year 2019-20,
and an increase of $41.83 million in Fiscal Year 2020-21.
Major policy assumptions and projections for Critical Needs related to Kidcare expenditures for
the forecast period are described below:
Social Services Estimating Conference – The estimated costs for caseload growth,
utilization, FMAP, and medical inflation are projected based on historical trends and
methodologies used by the July 2017 Caseload SSEC and the August 2017 Expenditure
SSEC.
90 | P a g e
CHIP Reauthorization – The CHIP is currently authorized under federal law through
September 30, 2019, but funding expires September 30, 2017. Absent congressional
action, Florida will exhaust federal funds during Fiscal Year 2017-18. Even if
congressional action is taken to continue the program at current allotment levels, Florida
will not have sufficient federal funds to continue the program at forecasted enrollment
levels. In this regard, if federal funding is only authorized at the 2017 federal grant award
amount of $686.6 million, Florida would likely experience federal funds deficits of $33.7
million in Fiscal Year 2019-20, $126.5 million in Fiscal Year 2020-21, and $260.1
million in Fiscal Year 2021-22. Depending upon the policy response adopted by the
Legislature, this lack of federal funding would also reduce the need for the state matching
funds. The forecast for Kidcare expenditures assumes that the program will be
reauthorized prior to September 30, 2017, and continue throughout the remainder of the
forecast with sufficient federal funding to support the forecasted enrollments and federal
matching at the Enhanced FMAP rate.
9. Temporary Assistance for Needy Families Cash Assistance
The welfare reform legislation of 1996 ended the federal entitlement to assistance and created the
Temporary Assistance for Needy Families (TANF) block grant that provides assistance and work
opportunities to needy families. Florida’s federal block grant allotment is $560.5 million for
Fiscal Year 2018-19, which represents a $1.9 million decrease due to federal budgetary action
included in the Consolidated Appropriations Act of 2017 (P.L. 115-31). This legislation develops
a new component of the TANF program for projects that move welfare recipients into work
activities, and transfers 0.33 percent of the total TANF appropriation (referred to as the “state
family assistance grant” – SFAG) to fund this new initiative. Florida’s share of the transfer from
SFAG is $1.9 million. The next TANF reauthorization, or extension, will determine whether the
reductions in SFAG continue beyond Fiscal Year 2018-19.
The Outlook includes a decrease in recurring General Revenue funds for TANF expenditures of
$2.9 million in Fiscal Year 2018-19 and $0.1 million in Fiscal Year 2019-20, with an
insignificant change in Fiscal Year 2020-21. These fluctuations are due to minimal adjustments
in projected caseloads.
[SEE GRAPH ON FOLLOWING PAGE]
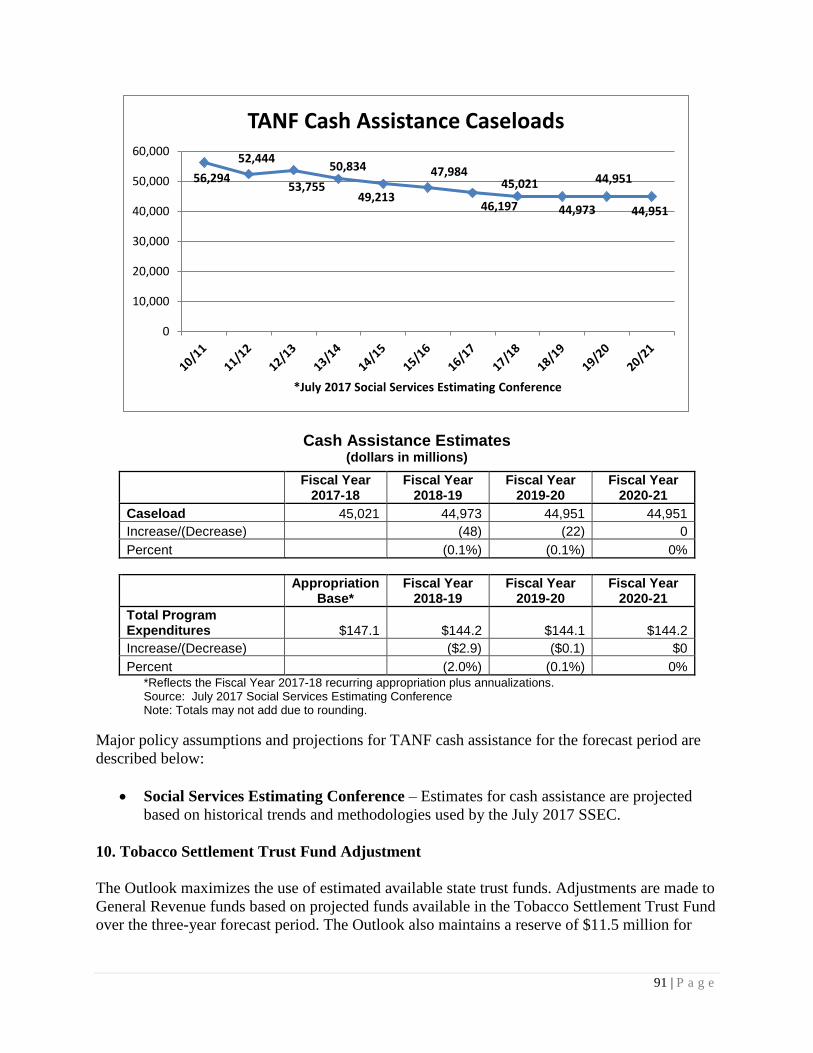
91 | P a g e
Cash Assistance Estimates (dollars in millions)
Fiscal Year
2017-18 Fiscal Year
2018-19 Fiscal Year
2019-20 Fiscal Year
2020-21
Caseload 45,021 44,973 44,951 44,951
Increase/(Decrease) (48) (22) 0
Percent (0.1%) (0.1%) 0%
Appropriation
Base* Fiscal Year
2018-19 Fiscal Year
2019-20 Fiscal Year
2020-21
Total Program Expenditures $147.1 $144.2 $144.1 $144.2
Increase/(Decrease) ($2.9) ($0.1) $0
Percent (2.0%) (0.1%) 0% *Reflects the Fiscal Year 2017-18 recurring appropriation plus annualizations.
Source: July 2017 Social Services Estimating Conference Note: Totals may not add due to rounding.
Major policy assumptions and projections for TANF cash assistance for the forecast period are
described below:
Social Services Estimating Conference – Estimates for cash assistance are projected
based on historical trends and methodologies used by the July 2017 SSEC.
10. Tobacco Settlement Trust Fund Adjustment
The Outlook maximizes the use of estimated available state trust funds. Adjustments are made to
General Revenue funds based on projected funds available in the Tobacco Settlement Trust Fund
over the three-year forecast period. The Outlook also maintains a reserve of $11.5 million for
56,294
52,444
53,755
50,834
49,213
47,984
46,197
45,021
44,973
44,951
44,951
0
10,000
20,000
30,000
40,000
50,000
60,000
*July 2017 Social Services Estimating Conference
TANF Cash Assistance Caseloads
92 | P a g e
Fiscal Year 2018-19, $11.6 million for Fiscal Year 2019-20, and $11.7 million for Fiscal Year
2020-21. This adjustment is distributed within the Health and Human Services policy area.
11. Tobacco Awareness Constitutional Amendment
A constitutional amendment passed during the November 2006 General Election that required
the Florida Legislature to annually fund a comprehensive, statewide tobacco education and
prevention program. The program uses tobacco settlement money primarily to target youth and
other at-risk Floridians. The annual funding requirement is 15 percent of the 2005 Tobacco
Settlement payments to Florida, adjusted annually for inflation using the Consumer Price Index.
The 2007 Legislature enacted chapter 2007-65, Laws of Florida, which requires the Department
of Health to operate the tobacco program.
Tobacco Education and Use Prevention Program Estimates (dollars in millions)
Fiscal Year
2017-18 Fiscal Year
2018-19 Fiscal Year
2019-20 Fiscal Year
2020-21
Expenditures $69.0 $70.3 $71.5 $73.0
Increase $1.4 $1.1 $1.6
Percent 2.0% 1.6% 2.2% Note: Totals may not add due to rounding.
Major policy assumptions and projections for the forecast period are described below:
National Economic Estimating Conference – The estimated tobacco expenditures from
the August 2017 Revenue Estimating Conference are adjusted by applying the Consumer
Price Index from the July 2017 National Economic Estimating Conference. Criminal Justice (Driver #12)
12. Criminal Justice Estimating Conference – Prison Population Adjustments
The Criminal Justice Estimating Conference (CJEC) provides various estimates related to
Florida’s prison population. Averaging the estimated number of prisoners for each month
produces an average monthly prison population for the year. This metric shows that Florida’s
prison population will decrease by approximately 1.1 percent over the next three fiscal years.
[SEE GRAPH ON FOLLOWING PAGE]
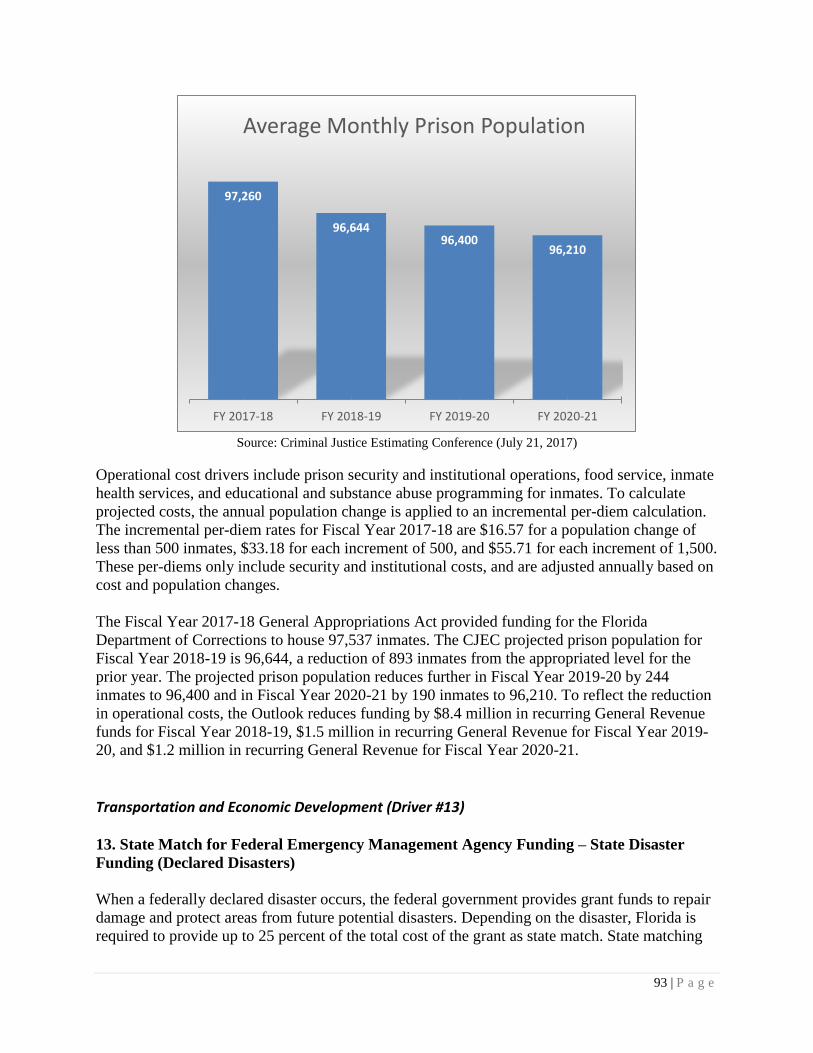
93 | P a g e
Source: Criminal Justice Estimating Conference (July 21, 2017)
Operational cost drivers include prison security and institutional operations, food service, inmate
health services, and educational and substance abuse programming for inmates. To calculate
projected costs, the annual population change is applied to an incremental per-diem calculation.
The incremental per-diem rates for Fiscal Year 2017-18 are $16.57 for a population change of
less than 500 inmates, $33.18 for each increment of 500, and $55.71 for each increment of 1,500.
These per-diems only include security and institutional costs, and are adjusted annually based on
cost and population changes.
The Fiscal Year 2017-18 General Appropriations Act provided funding for the Florida
Department of Corrections to house 97,537 inmates. The CJEC projected prison population for
Fiscal Year 2018-19 is 96,644, a reduction of 893 inmates from the appropriated level for the
prior year. The projected prison population reduces further in Fiscal Year 2019-20 by 244
inmates to 96,400 and in Fiscal Year 2020-21 by 190 inmates to 96,210. To reflect the reduction
in operational costs, the Outlook reduces funding by $8.4 million in recurring General Revenue
funds for Fiscal Year 2018-19, $1.5 million in recurring General Revenue for Fiscal Year 2019-
20, and $1.2 million in recurring General Revenue for Fiscal Year 2020-21.
Transportation and Economic Development (Driver #13)
13. State Match for Federal Emergency Management Agency Funding – State Disaster
Funding (Declared Disasters)
When a federally declared disaster occurs, the federal government provides grant funds to repair
damage and protect areas from future potential disasters. Depending on the disaster, Florida is
required to provide up to 25 percent of the total cost of the grant as state match. State matching
97,260
96,64496,400
96,210
FY 2017-18 FY 2018-19 FY 2019-20 FY 2020-21
Average Monthly Prison Population
94 | P a g e
funds for federally declared disasters vary tremendously from one year to the next. The amount
of General Revenue funds required in any given year is dependent on the number and severity of
disasters, as well as the federally required percentage of state participation. Based on the most
recent quarterly estimate from the Division of Emergency Management, the Outlook includes
$67.0 million of nonrecurring General Revenue in Fiscal Year 2018-19, $37.2 million in Fiscal
Year 2019-20, and $15.9 million in Fiscal Year 2020-21, to meet the outstanding state obligation
for all open federally declared disasters.
Not included in the Outlook calculations are estimates for natural disasters yet to occur, or for
which damage assessments have not been conducted as of the date this Outlook was written.
Damage assessments and claims processing through the Division of Emergency Management
can span several fiscal years. Due to the volatility of natural disasters, in terms of both frequency
and severity, it is not possible to estimate the costs to the state for these future events.
General Government (Drivers #14 & #15)
14. Non-Florida Retirement System Pensions and Benefits
In addition to the Florida Retirement System (FRS), the Department of Management Services
(DMS) is responsible for administering non-FRS pension and benefit programs, such as those for
the Florida National Guard and disabled justices and judges. The funding adjustments included
in the Outlook are related to the Florida National Guard and are based upon changes to the
federal military pay scales, cost-of-living adjustments on federal retirement benefits, and growth
in the number of participants. The Outlook includes funds for the non-FRS pension and benefit
programs based on estimates provided by the DMS, Division of Retirement, as follows: a
reduction of $0.1 million in recurring General Revenue for Fiscal Year 2018-19, an increase of
$0.1 million in recurring General Revenue for Fiscal Year 2019-20, and an additional $0.1
million in recurring General Revenue for Fiscal Year 2020-21.
15. Fiscally Constrained Counties – Property Tax
Section 218.12, Florida Statutes, directs the Legislature to provide funds to fiscally constrained
counties to offset the reductions in ad valorem tax revenue as a result of the constitutional
amendment approved in the Special Election held in January 2008. In addition, section 218.125,
Florida Statutes, provides a distribution to fiscally constrained counties to offset the
constitutional amendment approved in November 2008 authorizing an ad valorem tax exemption
for real property dedicated in perpetuity for conservation purposes. The Outlook includes funds
for the fiscally constrained counties based on the Revenue Estimating Conference held on
August 11, 2017; $28.7 million in nonrecurring General Revenue for Fiscal Year 2018-19; $23.4
million for Fiscal Year 2019-20; and $24.3 million for Fiscal Year 2020-21.
95 | P a g e
Administered Funds and Statewide Issues (Drivers #16 - #18) 16. Risk Management Insurance
The Outlook includes funds for the state’s Risk Management Insurance Program. The program is
administered by the Department of Financial Services and provides workers’ compensation,
general liability, federal civil rights, auto liability, off-duty law enforcement vehicle property
damage, and property insurance coverage to state agencies. The state is self-insured for these
types of coverage, and agencies are assessed premiums on an annual basis for the coverage. The
Outlook uses data available from the Self-Insurance Estimating Conference held on July 28,
2017, to estimate costs and determine General Revenue and trust fund allocations to the various
agencies. Additional funds are not needed for the 2018-19 fiscal year; however, an additional
$4.4 million in recurring General Revenue and $2.5 million from recurring trust funds for Fiscal
Year 2019-20 and $14.2 million in recurring General Revenue and $8.1 million from recurring
trust funds for Fiscal Year 2020-21 are included in the Outlook.
17. Division of Administrative Hearings Assessments
The Outlook includes funds to support the operations of the Division of Administrative Hearings.
The division resolves disputes brought by individuals and groups such as state agencies and
contracted entities for hearing by an administrative law judge. The division’s funding is derived
by assessing state agencies and other entities for services based on the prior year’s hearing hours.
The hours vary from year to year, and each agency has different funding sources. Agencies range
from paying all of the assessments with trust funds to agencies paying all with General Revenue,
with a few agencies using a mix of both General Revenue and trust funds to pay the assessment.
Based on actual hearing hours utilized by agencies in Fiscal Year 2016-17, an increase of
$50,264 of recurring General Revenue and a decrease of $50,264 of recurring trust funds are
included in the Outlook for Fiscal Year 2018-19.
18. Increases in Employer-Paid Benefits for State Employees
Health Insurance – Total expenses associated with the state employee health insurance program
are expected to increase by $209.0 million in Fiscal Year 2018-19, $296.3 million in Fiscal Year
2019-20, and $345.5 million in Fiscal Year 2020-21. When the Legislature appropriates
additional funds to maintain the solvency of the program, approximately 61 percent of employer-
funded premium increases are funded from the General Revenue Fund and 39 percent from
various trust funds.
The increases in expenses are based on assumptions that the plan will experience a 4.3 percent
average annual increase in Health Maintenance Organization (HMO) premium payments, 7.6
percent average annual growth in HMO medical claims, 14.8 percent average annual growth in
HMO pharmacy claims, 7.6 percent average annual growth in Preferred Provider Organization
(PPO) medical claims, and 15.0 percent average annual growth in PPO pharmacy claims.
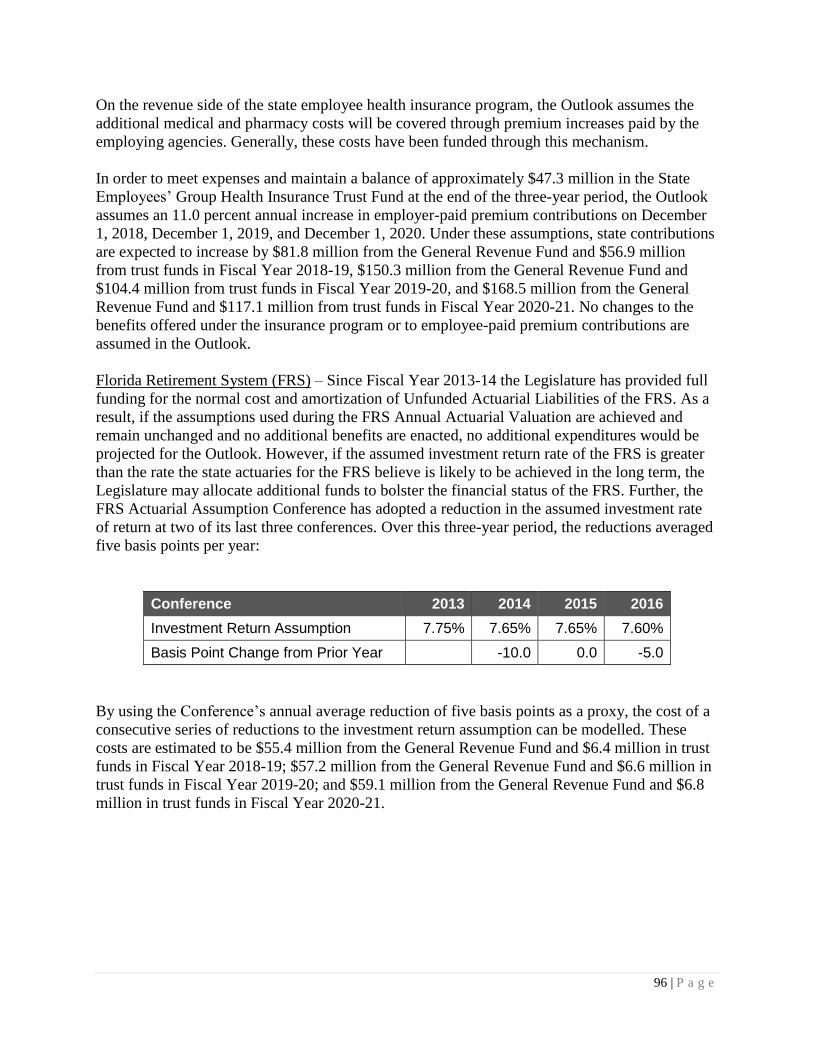
96 | P a g e
On the revenue side of the state employee health insurance program, the Outlook assumes the
additional medical and pharmacy costs will be covered through premium increases paid by the
employing agencies. Generally, these costs have been funded through this mechanism.
In order to meet expenses and maintain a balance of approximately $47.3 million in the State
Employees’ Group Health Insurance Trust Fund at the end of the three-year period, the Outlook
assumes an 11.0 percent annual increase in employer-paid premium contributions on December
1, 2018, December 1, 2019, and December 1, 2020. Under these assumptions, state contributions
are expected to increase by $81.8 million from the General Revenue Fund and $56.9 million
from trust funds in Fiscal Year 2018-19, $150.3 million from the General Revenue Fund and
$104.4 million from trust funds in Fiscal Year 2019-20, and $168.5 million from the General
Revenue Fund and $117.1 million from trust funds in Fiscal Year 2020-21. No changes to the
benefits offered under the insurance program or to employee-paid premium contributions are
assumed in the Outlook.
Florida Retirement System (FRS) – Since Fiscal Year 2013-14 the Legislature has provided full
funding for the normal cost and amortization of Unfunded Actuarial Liabilities of the FRS. As a
result, if the assumptions used during the FRS Annual Actuarial Valuation are achieved and
remain unchanged and no additional benefits are enacted, no additional expenditures would be
projected for the Outlook. However, if the assumed investment return rate of the FRS is greater
than the rate the state actuaries for the FRS believe is likely to be achieved in the long term, the
Legislature may allocate additional funds to bolster the financial status of the FRS. Further, the
FRS Actuarial Assumption Conference has adopted a reduction in the assumed investment rate
of return at two of its last three conferences. Over this three-year period, the reductions averaged
five basis points per year:
Conference 2013 2014 2015 2016
Investment Return Assumption 7.75% 7.65% 7.65% 7.60%
Basis Point Change from Prior Year -10.0 0.0 -5.0
By using the Conference’s annual average reduction of five basis points as a proxy, the cost of a
consecutive series of reductions to the investment return assumption can be modelled. These
costs are estimated to be $55.4 million from the General Revenue Fund and $6.4 million in trust
funds in Fiscal Year 2018-19; $57.2 million from the General Revenue Fund and $6.6 million in
trust funds in Fiscal Year 2019-20; and $59.1 million from the General Revenue Fund and $6.8
million in trust funds in Fiscal Year 2020-21.
97 | P a g e
Other High Priority Needs Pre K-12 Education (Drivers #19 - #23)
19. Educational Enhancement Trust Fund Adjustment – Bright Futures Scholarship
Increase – Florida Education Finance Program
In Driver #24, Other High Priority Needs funding is provided to increase Bright Futures awards
to cover annual scholarship increases. This increase in Bright Futures awards results in less
Educational Enhancement Trust Fund (EETF) dollars being available for the Florida Education
Finance Program (FEFP), resulting in fund shifts of $29.5 million, $1.4 million, and $0.9 million
of General Revenue funds for Fiscal Years 2018-19, 2019-20, and 2020-21, respectively, to
replace the EETF funds in the FEFP.
20. Increase Total Funds per FTE Student – Florida Education Finance Program
Other High Priority Needs funding is provided for the Florida Education Finance Program
(FEFP) based on the appropriated three-year average percent increase in funds per FTE student
excluding Florida Retirement System adjustments, which is an increase of 1.79 percent per FTE
student. The 1.79 percent increase requires $357.5 million, $365.9 million, and $380.0 million of
recurring General Revenue funds for the FEFP for Fiscal Years 2018-19, 2019-20, and 2020-21,
respectively. This funding supplements the Critical Needs funding for the FEFP in Drivers #1
through #3 (see results table in Driver #3).
21. Maintain Fiscal Year 2017-18 Total Amount of the Required Local Effort – Florida
Education Program
As Florida’s economy has rebounded, property values have increased, resulting in the same
Required Local Effort (RLE) millage rate generating more in property tax revenue in subsequent
years. For the past two years, the Legislature has adopted a funding policy to maintain the total
RLE at $7.6 billion by providing additional state funds in lieu of allowing the RLE to increase
due to the increased property valuations. Other High Priority Needs funding is provided for the
Florida Education Finance Program (FEFP) based on maintaining the Fiscal Year 2017-18 total
RLE amount, which requires an estimated $425.8 million, $429.2 million, and $446.3 million of
recurring state funds for Fiscal Years 2018-19, 2019-20, and 2020-21, respectively. This funding
supplements the Critical Needs funding for the FEFP in Drivers #1 through #3 (see results table
in Driver #3).
22. Additional Cost Required to Implement Both Increase Total Funds per Student and
Maintain the Fiscal Year 2017-18 Required Local Effort – Florida Education Finance
Program
Other High Priority Needs funding is provided for the Florida Education Finance Program
(FEFP) based on implementing both Driver #20 (increasing the total funds per FTE student) and
Driver #21 (maintaining the Fiscal Year 2017-18 total Required Local Effort [RLE]). The
amount of state funds needed to increase the total funds per FTE student, in part, is a function of
98 | P a g e
the amount of the RLE. The cost to increase total funds per FTE student is higher to the state if
the RLE is held constant. As a result, there is an additional amount of state funds needed for
Driver #20 when maintaining the Fiscal Year 2017-18 total amount of the RLE. Driver #22
provides the additional $16.1 million, $21.1 million, and $21.7 million of recurring state funds
for Fiscal Years 2018-19, 2019-20, and 2020-21, respectively, to implement both Drivers #20
and #21. This funding supplements the Critical Needs funding for the FEFP in Drivers #1
through #3 (see results table in Driver #3).
23. Workload and Enrollment – Other Pre K-12 Programs
Other High Priority Needs funding is provided for the Florida School for the Deaf and the Blind.
The school is a fully accredited state public school located in St. Augustine for approximately
1,000 PreK through grade 12 deaf/hard of hearing, blind/visually impaired, and special needs
students who are either residential, day, or out-reach students. Funds are provided based on the
three-year average increase of appropriations for school operations in the amount of $554,257 of
recurring General Revenue funds for each of the three forecast years.
In addition, Other High Priority Needs funding is provided for the Gardiner Scholarship
Program, the Standard Student Attire Incentive Program, and the Florida Best and Brightest
Scholarship Program.
The Gardiner Scholarship Program allows parents to personalize the education of their children
with unique abilities by enabling them to use the funds for a combination of services and
programs. These may include tuition and fees, therapy, curriculum, technology, and college
savings accounts. Funds are provided based on the three-year average increase of appropriations
for scholarships in the amount of $28.3 million of recurring General Revenue funds for each of
the three forecast years.
The Standard Student Attire Incentive Program provides incentive payments to school districts
for public schools implementing a standard attire policy for all students in kindergarten through
grade 8. Funds are provided based on the three-year average increase of appropriations for the
program in the amount of $4.7 million of recurring General Revenue funds for each of the three
forecast years.
Florida’s Best and Brightest Scholarship Program provides: (1) scholarships to teachers based on
high academic achievement and highly effective classroom instruction; (2) yearly bonuses for
classroom teachers rated highly effective and effective; and (3) scholarships to principals serving
at least two consecutive years at a school with a required percentage of best and brightest
classroom teachers. Funds are provided based on the three-year average increase of
appropriations for scholarships in the amount of $78.0 million of recurring General Revenue
funds for each of the three forecast years.
99 | P a g e
Higher Education (Drivers #24 - #30)
24. Bright Futures – Costs to Pay Florida Academic Scholars – Tuition Differential and
Technology Fees
In Fiscal Year 2018-19, additional Educational Enhancement Trust Fund (EETF) budget
authority of $71.7 million is needed over the amount provided in Driver #5 to continue to fund
scholarships provided to Bright Futures Florida Academic Scholars (FAS) recipients at the level
funded in the Fiscal Year 2017-18 General Appropriations Act (GAA). The Fiscal Year 2017-18
GAA provided funding for scholarship payments at 100 percent of tuition and fees, including
payment of the tuition differential charged at state universities, and payment of the technology
fees charged at all public postsecondary institutions. Critical Needs Driver #5 provided for 100
percent of tuition and fees, excluding the tuition differential and the technology fees. Driver #24
provides additional funding to continue the tuition differential and the technology fees. Although
funding for these additional fees was included in the Fiscal Year 2017-18 GAA and not vetoed,
legislation containing provisions authorizing their payment (CS/CS/SB 374) was vetoed by the
Governor. Based on the Department of Education’s memorandum regarding 2017-18 Bright
Futures Scholarship Program Award Amounts,9 FAS students’ scholarship payments for Fiscal
Year 2017-18 will include the tuition differential and the technology fees. Additional funding
provided in Driver #24 assumes legislation will be enacted that maintains FAS scholarship
payments at levels consistent with the Fiscal Year 2017-18 implementation. The incremental
costs for Fiscal Years 2019-20 and 2020-21 are $3.5 million and $2.3 million, respectively.
25. Educational Enhancement Trust Fund Adjustment – Based on Additional Costs for the
Tuition Differential and Technology Fees
The $71.7 million increase in Educational Enhancement Trust Funds (EETF) for the Bright
Futures program required by Driver #24 requires an incremental redistribution of EETF funding
among the other education program entities. The $71.7 million increase in Bright Futures
requires a like amount to be reduced from those other entities (as previously distributed by
Driver #6) and replaced with General Revenue (GR). In summary, for Fiscal Years 2018-19,
2019-20, and 2020-21, respectively, $42.2 million, $2 million, and $1.3 million in EETF are
reduced from other Higher Education entities and replaced with GR. In Pre K-12 Education for
Fiscal Years 2018-19, 2019-20, and 2020-21, respectively, $29.5 million, $1.4 million, and $0.9
million are reduced and replaced with GR (see Driver #19).
26. Maintain Current Budget – Higher Education
Other High Priority Needs funding includes $40 million in recurring General Revenue funds to
restore nonrecurring appropriations provided in Fiscal Year 2017-18 for performance incentive
funding at Florida College System institutions in order to maintain the Fiscal Year 2017-18
budget. Of this funding, $10 million is provided to college institutions as performance funding
9 Department of Education Memorandum OSFA-STATE: #17-18:07 (July 12, 2017). Available here: http://edr.state.fl.us/Content/conferences/financialaid/DOEMemorandum.pdf.
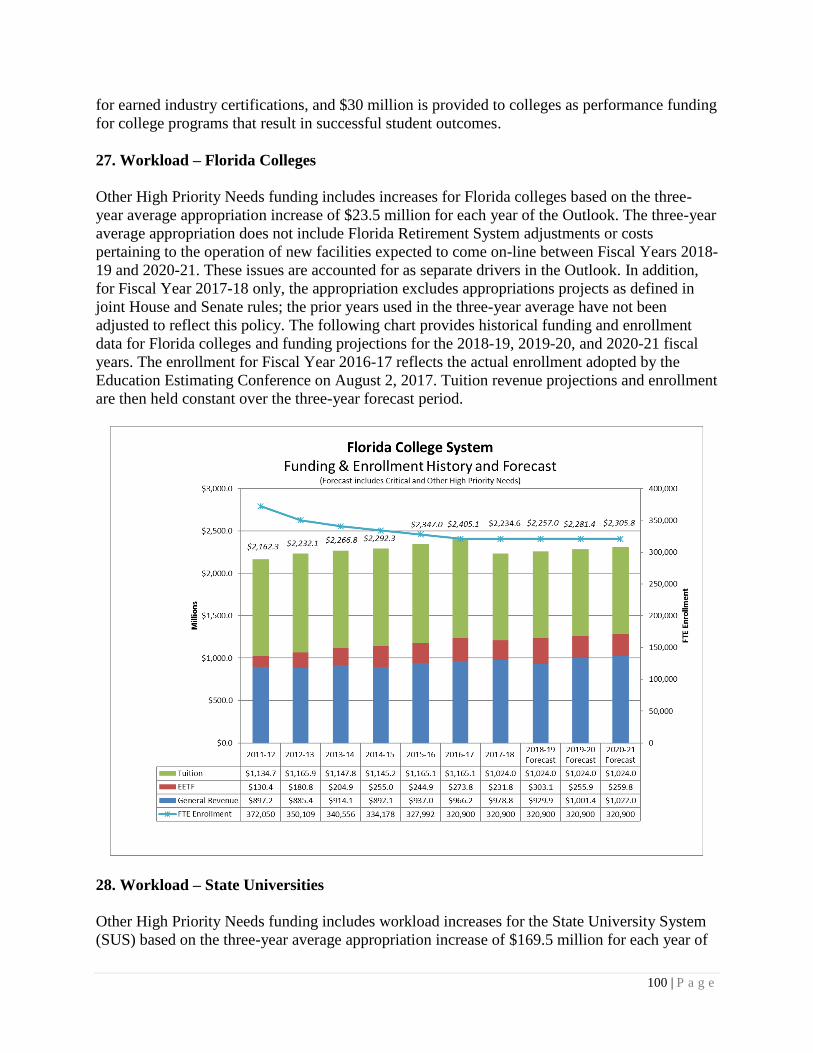
100 | P a g e
for earned industry certifications, and $30 million is provided to colleges as performance funding
for college programs that result in successful student outcomes.
27. Workload – Florida Colleges
Other High Priority Needs funding includes increases for Florida colleges based on the three-
year average appropriation increase of $23.5 million for each year of the Outlook. The three-year
average appropriation does not include Florida Retirement System adjustments or costs
pertaining to the operation of new facilities expected to come on-line between Fiscal Years 2018-
19 and 2020-21. These issues are accounted for as separate drivers in the Outlook. In addition,
for Fiscal Year 2017-18 only, the appropriation excludes appropriations projects as defined in
joint House and Senate rules; the prior years used in the three-year average have not been
adjusted to reflect this policy. The following chart provides historical funding and enrollment
data for Florida colleges and funding projections for the 2018-19, 2019-20, and 2020-21 fiscal
years. The enrollment for Fiscal Year 2016-17 reflects the actual enrollment adopted by the
Education Estimating Conference on August 2, 2017. Tuition revenue projections and enrollment
are then held constant over the three-year forecast period.
28. Workload – State Universities
Other High Priority Needs funding includes workload increases for the State University System
(SUS) based on the three-year average appropriation increase of $169.5 million for each year of
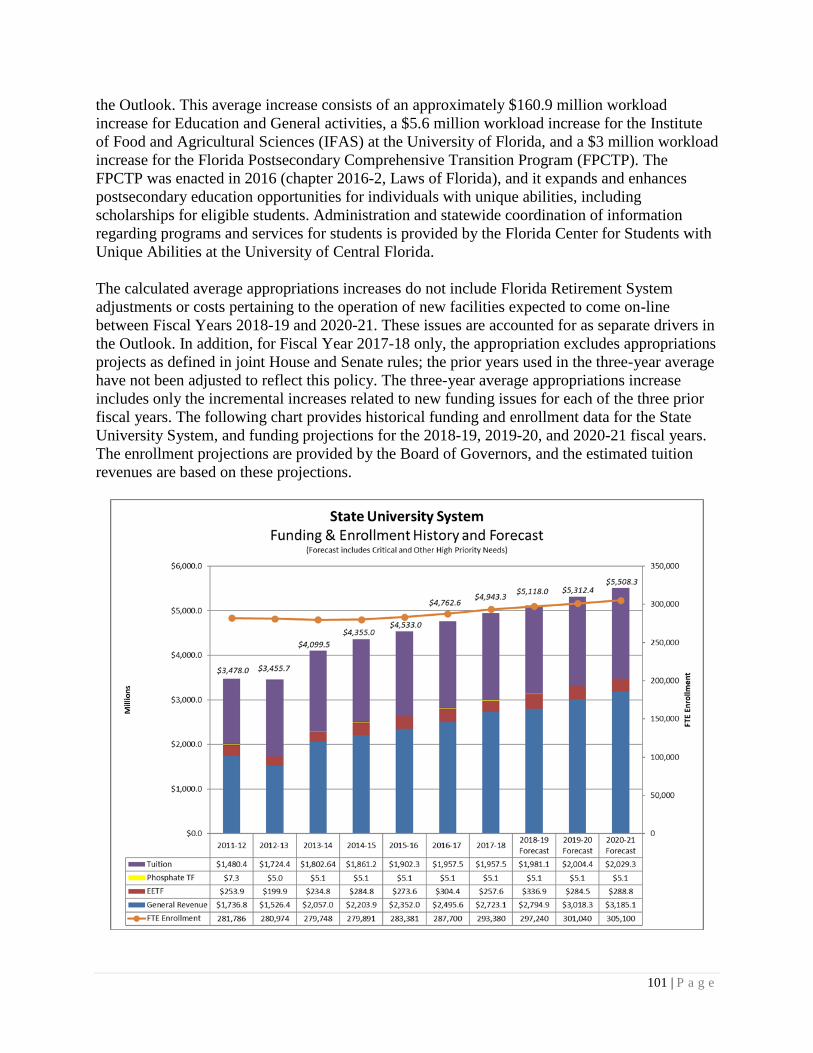
101 | P a g e
the Outlook. This average increase consists of an approximately $160.9 million workload
increase for Education and General activities, a $5.6 million workload increase for the Institute
of Food and Agricultural Sciences (IFAS) at the University of Florida, and a $3 million workload
increase for the Florida Postsecondary Comprehensive Transition Program (FPCTP). The
FPCTP was enacted in 2016 (chapter 2016-2, Laws of Florida), and it expands and enhances
postsecondary education opportunities for individuals with unique abilities, including
scholarships for eligible students. Administration and statewide coordination of information
regarding programs and services for students is provided by the Florida Center for Students with
Unique Abilities at the University of Central Florida.
The calculated average appropriations increases do not include Florida Retirement System
adjustments or costs pertaining to the operation of new facilities expected to come on-line
between Fiscal Years 2018-19 and 2020-21. These issues are accounted for as separate drivers in
the Outlook. In addition, for Fiscal Year 2017-18 only, the appropriation excludes appropriations
projects as defined in joint House and Senate rules; the prior years used in the three-year average
have not been adjusted to reflect this policy. The three-year average appropriations increase
includes only the incremental increases related to new funding issues for each of the three prior
fiscal years. The following chart provides historical funding and enrollment data for the State
University System, and funding projections for the 2018-19, 2019-20, and 2020-21 fiscal years.
The enrollment projections are provided by the Board of Governors, and the estimated tuition
revenues are based on these projections.
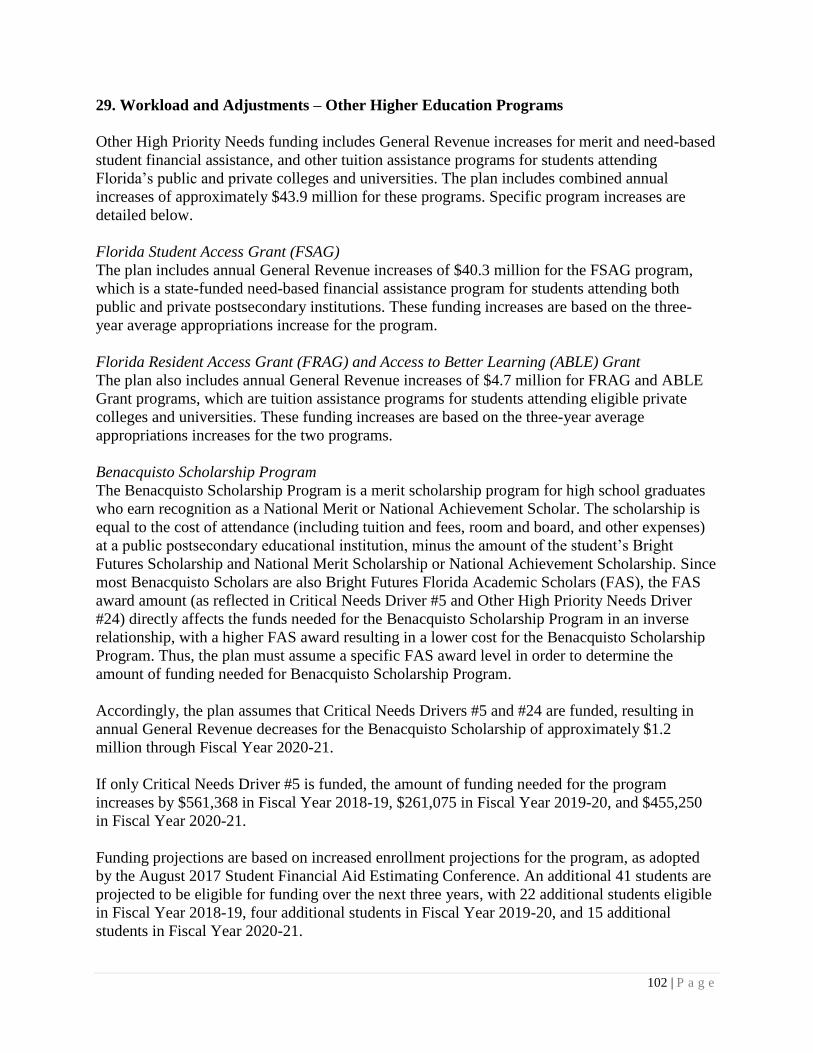
102 | P a g e
29. Workload and Adjustments – Other Higher Education Programs
Other High Priority Needs funding includes General Revenue increases for merit and need-based
student financial assistance, and other tuition assistance programs for students attending
Florida’s public and private colleges and universities. The plan includes combined annual
increases of approximately $43.9 million for these programs. Specific program increases are
detailed below.
Florida Student Access Grant (FSAG)
The plan includes annual General Revenue increases of $40.3 million for the FSAG program,
which is a state-funded need-based financial assistance program for students attending both
public and private postsecondary institutions. These funding increases are based on the three-
year average appropriations increase for the program.
Florida Resident Access Grant (FRAG) and Access to Better Learning (ABLE) Grant
The plan also includes annual General Revenue increases of $4.7 million for FRAG and ABLE
Grant programs, which are tuition assistance programs for students attending eligible private
colleges and universities. These funding increases are based on the three-year average
appropriations increases for the two programs.
Benacquisto Scholarship Program
The Benacquisto Scholarship Program is a merit scholarship program for high school graduates
who earn recognition as a National Merit or National Achievement Scholar. The scholarship is
equal to the cost of attendance (including tuition and fees, room and board, and other expenses)
at a public postsecondary educational institution, minus the amount of the student’s Bright
Futures Scholarship and National Merit Scholarship or National Achievement Scholarship. Since
most Benacquisto Scholars are also Bright Futures Florida Academic Scholars (FAS), the FAS
award amount (as reflected in Critical Needs Driver #5 and Other High Priority Needs Driver
#24) directly affects the funds needed for the Benacquisto Scholarship Program in an inverse
relationship, with a higher FAS award resulting in a lower cost for the Benacquisto Scholarship
Program. Thus, the plan must assume a specific FAS award level in order to determine the
amount of funding needed for Benacquisto Scholarship Program.
Accordingly, the plan assumes that Critical Needs Drivers #5 and #24 are funded, resulting in
annual General Revenue decreases for the Benacquisto Scholarship of approximately $1.2
million through Fiscal Year 2020-21.
If only Critical Needs Driver #5 is funded, the amount of funding needed for the program
increases by $561,368 in Fiscal Year 2018-19, $261,075 in Fiscal Year 2019-20, and $455,250
in Fiscal Year 2020-21.
Funding projections are based on increased enrollment projections for the program, as adopted
by the August 2017 Student Financial Aid Estimating Conference. An additional 41 students are
projected to be eligible for funding over the next three years, with 22 additional students eligible
in Fiscal Year 2018-19, four additional students in Fiscal Year 2019-20, and 15 additional
students in Fiscal Year 2020-21.
103 | P a g e
30. Anticipated New Space Costs for Colleges and Universities
General Revenue funds are provided in Other High Priority Needs for operational costs
associated with the phase-in of new physical space operations, which include costs related to
utilities and janitorial services. Facility construction projects approved by the Legislature through
the education capital outlay process are anticipated to come on-line during the Outlook period.
An estimated $2.5 million, including $930,626 for Florida colleges and approximately $1.5
million for state universities, is included for each year of the Outlook based on a three-year
appropriations average.
Education Fixed Capital Outlay (Driver #31) 31. Education Fixed Capital Outlay
The Public Education Capital Outlay and Debt Service (PECO) Trust Fund is established in the
Florida Constitution for the purpose of funding education capital outlay. The PECO Trust Fund
derives its revenues from Gross Receipts Taxes on Utilities and Telecommunications.
Historically, the PECO program has used PECO Trust Funds (a mix of bonding proceeds and
cash from Gross Receipts Taxes) and cash from General Revenue and the Educational
Enhancement Trust Fund to fund projects.
In Fiscal Year 2008-09, Gross Receipts revenues began to decline until flattening out in Fiscal
Year 2013-14. In Fiscal Year 2014-15, revenues then increased $147 million primarily due to
legislation which redirected certain utility related sales tax revenues from General Revenue into
the PECO Trust Fund. Bonding has been used only once in the past three fiscal years and, prior
to that, not since Fiscal Year 2010-11. Given the state’s recent practice of not bonding any
portion of the available revenue, this Outlook assumes a supplemental need for General Revenue
to continue similar levels of PECO program funding over the course of the forecast period.
Estimates of General Revenue needed over each year of the forecast period are based on a three-
year average of totals for projects funded that would not have been defined as appropriations
projects pursuant to joint House and Senate rules. This funding level is then compared to the
August 11, 2017, PECO cash estimates for maximum appropriation over the three years of the
forecast, assuming no bonding. The gap between the two identifies a need for additional
nonrecurring General Revenue of $100.2 million in Fiscal Year 2018-19, $65.9 million in Fiscal
Year 2019-20, and $56.9 million in Fiscal Year 2020-21.
[SEE GRAPH ON FOLLOWING PAGE]
104 | P a g e
Human Services (Drivers #32 - #38)
32. Medicaid Services
The Outlook includes additional funding for Medicaid Waiver slots for the elderly, for
individuals with brain and spinal cord injuries, for Medicaid consulting and actuarial services,
and for Medicaid provider rate increases based on three-year averages. These Other High Priority
Needs provide the Agency for Health Care Administration and the Department of Elder Affairs
with $26.4 million ($17.8 million nonrecurring) in General Revenue funds each year for Fiscal
Years 2018-19, 2019-20, and 2020-21.
33. Children and Family Services
The Outlook uses three-year appropriations averages to determine the funding needs for the
anticipated growth of the following: central receiving facilities grant program; maintenance
adoption subsidies; Community-Based Care (CBC) lead agencies that provide child welfare
services; grants to sheriffs that perform child abuse investigations in lieu of the department; cost-
of-living increases for foster care parents and mental health facilities; homeless coalitions
providing direct services to transient populations; state mental health facilities initiatives;
prevention efforts and services to victims of domestic violence; child welfare legal services; the
remaining obligation of a claims bill; and substance abuse and mental health initiatives
administered through community-based providers.
These Other High Priority Needs increase General Revenue funds for the Department of
Children and Families by $42.2 million ($11.6 million nonrecurring) for Fiscal Year 2018-19.
The Outlook also includes $13.8 million in nonrecurring Tobacco Settlement Trust Funds for
Fiscal Year 2018-19. For Fiscal Year 2019-20 and Fiscal Year 2020-21, the General Revenue
amount increases to $54.3 million ($23.7 million nonrecurring), which includes $13.8 million to
replace the nonrecurring Tobacco Settlement Trust Funds and a reduction of $1.7 million
associated with a claims bill that has no further funding obligations beyond Fiscal Year 2018-19.
1,126 1,098 1,071 1,034 1,003 1,0051,152 1,158 1,112 1,153 1,182 1,207 1,233
mill
ion
sTotal Gross Receipts Revenues
105 | P a g e
34. Health Services
The Outlook includes additional funding for the Early Steps program, the Mary Brogan Breast
and Cervical Cancer Early Detection program, the Women, Infants, and Children (WIC)
program, the Federal Child Care Nutrition program, the Office of Medical Marijuana Use, the
Newborn Screening program, the Division of Disability Determinations, and biomedical research
based on three-year appropriations averages. The Outlook also restores nonrecurring funding for
poison control centers and federally qualified health centers based on three-year appropriations
averages for these programs. All of these programs are described below:
The Early Steps program is Florida's early intervention system that offers support
services to families and caregivers with infants and toddlers with significant delays or a
condition likely to result in a developmental delay.
The Mary Brogan Breast and Cervical Cancer Early Detection program provides cancer
screenings for medically underserved women between the ages of 50 and 64 whose
incomes are below 200 percent of the federal poverty level.
WIC is a federally funded nutrition program for women, infants, and children that
provides healthy foods, nutrition education and counseling, and breastfeeding support at
no cost.
The Federal Child Care Nutrition program is a federally funded food public assistance
program that administers the Afterschool Meals Program to 941 Florida public schools.
The Office of Medical Marijuana Use is the state’s regulatory office charged with writing
and implementing the rules for medical marijuana including licensure of dispensaries and
registering qualified patients and caregivers.
The Newborn Screening program screens all newborns born in this state for metabolic,
hereditary, and congenital disorders known to result in significant impairment of health
or intellect.
The Division of Disability Determinations is a federally funded program responsible for
determining the medical eligibility for Florida citizens who apply for disability benefits
under Social Security Administration disability programs.
The biomedical research funding encompasses several statewide initiatives through grant
opportunities and supplemental funding. These programs include the James and Esther
King Biomedical Research Program, Bankhead-Coley Cancer Research Program, Torrey
Pines Institute for Molecular Studies, and the Live Like Bella Pediatric Cancer Research
Initiative.
The Poison Control Centers provide poison prevention and confidential management
information through a toll-free hotline at three poison control centers located in
Jacksonville, Miami, and Tampa.
Florida’s Federally Qualified Health Centers are non-profit health care organizations that
serve all populations and provide primary and preventive medical, dental, and behavioral
services throughout the state.
These Other High Priority Needs increase General Revenue funds for the Department of Health
by $20.0 million ($15.4 million nonrecurring) each year for Fiscal Years 2018-19, 2019-20, and
2020-21.
106 | P a g e
35. Developmental Disabilities
The Outlook uses three-year appropriations averages to determine the funding needs for reducing
the wait list for Developmental Disabilities Waiver services provided by the Agency for Persons
with Disabilities, additional administrative resources to manage growth in Waiver services, the
agency’s supported employment and internship programs, and rate increases for Medicaid
Waiver providers, including nonrecurring funding to address the U.S. Department of Labor Fair
Standards Act. These Other High Priority Needs increase General Revenue funds for the Agency
for Persons with Disabilities by $35.1 million ($17.0 million nonrecurring) each year for Fiscal
Years 2018-19, 2019-20, and 2020-21.
36. Veterans’ Services
The Outlook includes funding for Florida is for Veterans, Inc., for the Entrepreneurship Program
designed to connect business leaders with veterans seeking to become entrepreneurs, and the
Veterans Training Grants Program which provides funding for educational programs to
businesses hiring and training veterans. These Other High Priority Needs are based on three-year
appropriations averages and increase General Revenue funds for the Department of Veterans’
Affairs by $2.0 million nonrecurring each year for Fiscal Years 2018-19, 2019-20, and 2020-21.
The Outlook also includes funding for initial staffing operations at two state veterans nursing
homes currently in the planning phase. The Outlook includes an increase of $4.7 million in trust
fund authority for the Lake Baldwin State Veterans Nursing Home for Fiscal Year 2018-19 and
$4.7 million in trust fund authority for the Ardie Copas State Veterans Nursing Home for Fiscal
Year 2019-20.
37. Elderly Services
The Outlook includes funding for reducing the wait list for the Community Care for the Elderly
program within the Department of Elder Affairs and respite services for the department’s
Alzheimer’s clients based on the three-year appropriations averages. Additionally, the Outlook
includes funding for Public Guardianship services and Aging Resource Centers to assist the
elderly. These Other High Priority Needs increase General Revenue funds for the Department of
Elder Affairs by $5.9 million ($1.1 million nonrecurring) each year for Fiscal Years 2018-19,
2019-20, and 2020-21.
38. Human Services Information Technology/Infrastructure
The Outlook includes funding for Other High Priority Needs for human services information
technology and infrastructure. Included are costs for the completion of the Agency for Persons
with Disabilities’ Client Management System, the Florida Medicaid Management Information
System (FMMIS) transition, new equipment and an upgrade of the Department of Veterans’
Affairs electronic health record wireless system in veteran nursing homes, facility regulation
issues in the Agency for Health Care Administration, and restoration of nonrecurring funds for
the Department of Children and Families to perform automated income verification of welfare
recipients. The Outlook provides $3.2 million of nonrecurring General Revenue funds for Fiscal
107 | P a g e
Year 2018-19, $3.2 million of General Revenue funds ($2.3 million nonrecurring) for Fiscal
Year 2019-20, and $2.3 million of nonrecurring General Revenue funds for Fiscal Year 2020-21.
Criminal Justice (Drivers #39 - #43)
39. Justice Administration Entities – Due Process and Conflict Case Costs
The Justice Administration Commission is responsible for administering funds provided for due
process and conflict case costs for the judicial system totaling over $85 million annually. These
costs include court-appointed attorneys’ fees in criminal conflict, child dependency and civil
conflict cases, attorney payments over the flat fees established for those cases, legal
representation for dependent children with special needs, registry attorneys for post-conviction
capital collateral cases and due process costs for state attorneys and public defenders. Due
process costs include court reporting and interpreting services, expert witness fees, and costs
associated with medical/mental health evaluations. The Outlook includes an increase of $2.6
million in recurring General Revenue funds each year based on the average increase in due
process and conflict case appropriations over the last three fiscal years.
40. Department of Corrections – Disability Rights Florida, Inc., Settlement Agreement –
Inmates with Mobility, Hearing, and Vision Disabilities
The Florida Department of Corrections (FDC) entered into a settlement agreement with
Disability Rights Florida, Inc., to end a lawsuit relating to the accommodations for inmates with
mobility, hearing, and vision disabilities. Under the settlement, inmates with a mobility disability
will be placed in prisons that comply with the Americans with Disabilities Act (ADA) standards.
The FDC will provide inmates with hearing disabilities increased access to interpreters and
hearing aids, as well as provide video remote interpreting. Inmates with vision disabilities will
receive probing canes and other accommodations to enable them to participate in FDC services
and programs. Finally, inmates who need services will be evaluated when they enter the
correctional system and reevaluated annually for changes in the inmate’s condition. The Outlook
includes an increase of $6.4 million in General Revenue ($2.0 million recurring and $4.4 million
nonrecurring) for Fiscal Year 2018-19; $2.3 million ($1.8 million recurring and $519,588
nonrecurring) for Fiscal Year 2019-20; and $150,000 nonrecurring General Revenue for Fiscal
Year 2020-21.
41. Department of Corrections – Contracted Inmate Health Services
Today, the Florida Department of Corrections (FDC) provides comprehensive health care
services for the 97,537 inmates in its custody. Centurion of Florida currently provides inmate
medical services for all four regions of the state. Centurion replaced Corizon Healthcare in April
2016 after Corizon terminated its contract that was expected to run until January 2018. Centurion
also replaced Wexford Health Services in April 2017 in Region 4 and two institutions in Region
3 after FDC executed an at-will termination of the contract that was to run until December 20,
2017. The department has issued Invitations to Negotiate for all of the health care services and
expects to award contracts in March of 2018. The Outlook includes an increase of $17.1 million
in recurring General Revenue funds each year based on a projected 5.2 percent increase in
108 | P a g e
contracted inmate health services over the Fiscal Year 2017-18 funding level, based on three-
year average percentage changes in appropriations: Fiscal Year 2015-16 (-0.2 percent); Fiscal
Year 2016-17 (14.4 percent); and Fiscal Year 2017-18 (1.4 percent). In addition, the Outlook
includes an increase of $10.0 million of recurring General Revenue funds in Fiscal Year 2018-19
to annualize mental health services at Wakulla Correctional Institution, which was funded in
Fiscal Year 2017-18 at $14.4 million ($5.7 million recurring and $8.7 million nonrecurring) to
establish a Mental Health Unit at the institution.
42. Department of Corrections – Pharmaceutical Drugs – Compliance with Standards of
Care
Today, the Florida Department of Corrections provides health care services for more than 97,500
inmates in its custody. Services provided to inmates must meet or exceed the level of care
available to individuals in the community. The department must adopt new treatment protocols
for inmates as those protocols change in the community. New drugs are continually coming to
market to treat illnesses. The cost of the newer pharmaceuticals, such as biologicals (a vaccine or
drug derived from biological sources), HIV, and flu vaccines, is greater than that of the older
treatments, while the cost of insulin and thyroid medication has increased due to price increases
by the pharmaceutical manufacturers. The Outlook includes an increase of $8.3 million in
recurring General Revenue funds each year based on the funding shortfall for pharmaceutical
drugs in Fiscal Year 2016-17.
43. Department of Juvenile Justice – Prevention and Intervention Programs
The Department of Juvenile Justice provides a continuum of services designed to treat juveniles
in the most appropriate and least restrictive environment possible in order to provide the best
outcomes for the juveniles under its supervision. Those services range from community-based
prevention and intervention services to residential treatment services that remove a juvenile from
his or her community for three to 36 months. The department is making an effort to shift more
resources into the community-based services to avoid the costly residential services. In recent
years, the Legislature has increased funding for community-based prevention and intervention
services to mitigate the need for more costly residential services. The Outlook includes an
increase of $1.3 million in recurring General Revenue funds each year for these community-
based prevention and intervention programs based on the average increase for these programs
over the last three fiscal years.
Transportation and Economic Development (Drivers #44 - #47)
44. Department of Transportation Adopted Work Program (Fiscal Years 2018-2021)
The Department of Transportation develops a Work Program, which is the department’s list of
transportation projects planned for the following five years. It is supported by a balanced five-
year financial outlook with a three-year cash forecast of receipts and expenditures. Funding to
support the Work Program comes from a variety of trust fund sources, including federal, state,
local, bond proceeds, toll collections, and miscellaneous other receipts. Funding projections for
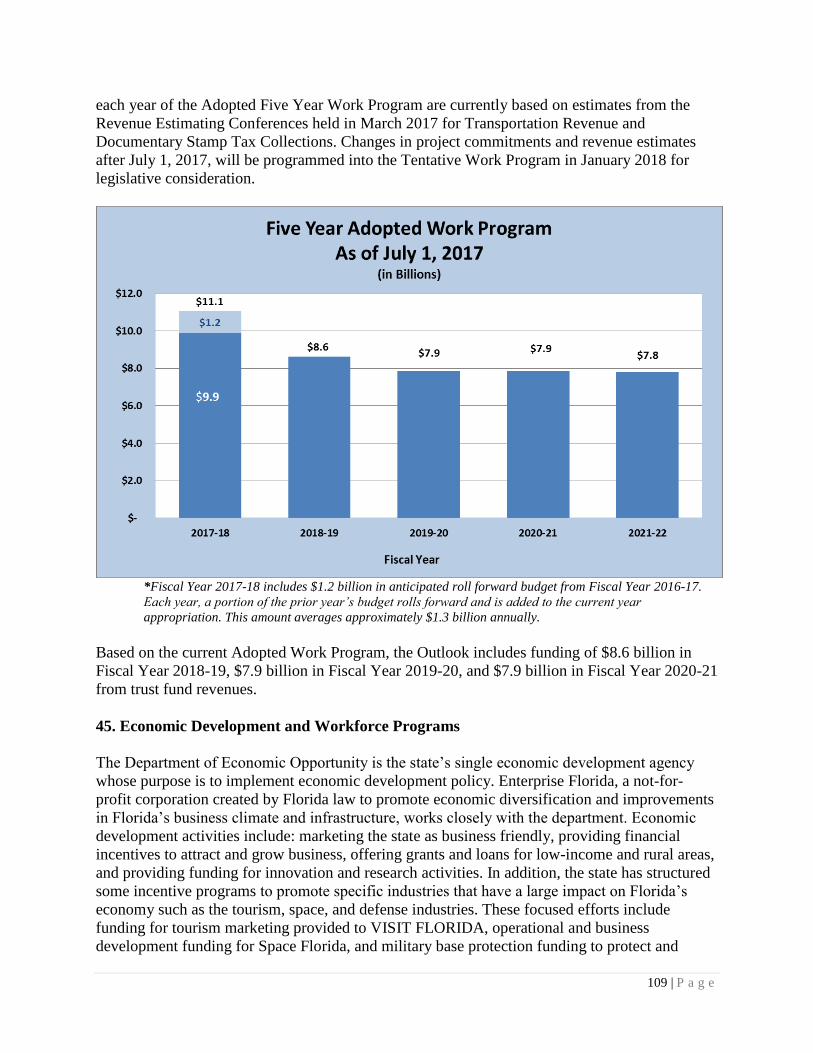
109 | P a g e
each year of the Adopted Five Year Work Program are currently based on estimates from the
Revenue Estimating Conferences held in March 2017 for Transportation Revenue and
Documentary Stamp Tax Collections. Changes in project commitments and revenue estimates
after July 1, 2017, will be programmed into the Tentative Work Program in January 2018 for
legislative consideration.
*Fiscal Year 2017-18 includes $1.2 billion in anticipated roll forward budget from Fiscal Year 2016-17.
Each year, a portion of the prior year’s budget rolls forward and is added to the current year
appropriation. This amount averages approximately $1.3 billion annually.
Based on the current Adopted Work Program, the Outlook includes funding of $8.6 billion in
Fiscal Year 2018-19, $7.9 billion in Fiscal Year 2019-20, and $7.9 billion in Fiscal Year 2020-21
from trust fund revenues.
45. Economic Development and Workforce Programs
The Department of Economic Opportunity is the state’s single economic development agency
whose purpose is to implement economic development policy. Enterprise Florida, a not-for-
profit corporation created by Florida law to promote economic diversification and improvements
in Florida’s business climate and infrastructure, works closely with the department. Economic
development activities include: marketing the state as business friendly, providing financial
incentives to attract and grow business, offering grants and loans for low-income and rural areas,
and providing funding for innovation and research activities. In addition, the state has structured
some incentive programs to promote specific industries that have a large impact on Florida’s
economy such as the tourism, space, and defense industries. These focused efforts include
funding for tourism marketing provided to VISIT FLORIDA, operational and business
development funding for Space Florida, and military base protection funding to protect and
110 | P a g e
expand the defense industry. Since the amount of future nonrecurring appropriations cannot be
predicted, the Outlook relies on three-year appropriations averages. The Outlook includes a total
projection of $49.1 million of nonrecurring General Revenue funds for economic development
and workforce programs for each year of the Outlook.
Chapter 2011-138, Laws of Florida, created the State Economic Enhancement and Development
(SEED) Trust Fund to fund: strategic transportation facility investments; affordable housing
programs and projects; economic development incentives for job creation and capital investment;
workforce training associated with attracting new businesses to the state and retaining existing
businesses; and tourism promotion and marketing. The SEED Trust Fund was appropriated for
the first time in Fiscal Year 2012-13 to fund a variety of economic development activities, either
in place of General Revenue or as a supplement. While both fund sources have been utilized for
these activities, the 2017 Legislature redirected half of the existing revenue stream to the General
Revenue Fund, leaving $75 million of annual deposits for the trust fund. Because the remaining
SEED Trust Fund revenues are currently obligated for recurring expenditures, the Outlook funds
economic development programs from nonrecurring General Revenue based upon the three-year
appropriations average of the total funding provided for these programs.
Traditional Economic Development Programs:
Qualified Targeted Industry and Qualified Defense Contractor and Space Flight Business
Programs - Provides cash awards equivalent to certain paid taxes for approved businesses
based on the number of new jobs created.
High-Impact Performance Incentives - Provides cash grants to business projects in
designated high-impact industries that make large capital investments within Florida.
Quick Action Closing Fund - Provides cash grants to business projects to help Florida
compete effectively for high-impact businesses that can provide widespread economic
benefits in the state. (No funding has been provided for this program since Fiscal Year
2015-16.)
Rural Community Development Grants and Loans - Provides grants and low-interest
loans to designated rural communities in Florida to assist them with economic
development efforts.
Military Base Protection - Provides grants and technical assistance to support Florida’s
Defense Industry and defense-dependent communities.
46. National Guard Armories and Military Affairs Priorities
The Florida Armory Revitalization Plan is intended to renovate Florida’s aging Readiness
Centers (armories) in accordance with the Capital Improvement Plan. The program concept is to
assess, design, and renovate as many facilities per year as possible using a prioritized list
contingent on the availability of state funding. The Legislature has provided $109.4 million of
General Revenue funding since Fiscal Year 2005-06 in support of the National Guard Armory
111 | P a g e
Renovations. To date, 52 of Florida’s 55 armories have received funding to begin the planned
repairs, and construction has been completed on 49 armories. (Three of the 55 armories are not
owned by the State of Florida.) The Legislature provided $6 million in Fiscal Year 2017-18.
With the Armory Renovation Priority List fully funded and nearing completion, the Legislature
also recognized the need for ongoing maintenance and repair for the renovated facilities and has
provided $1.7 million annually since Fiscal Year 2015-16.
Since the Legislature has provided all requested funds for the Armory Renovation Priority List,
the Outlook does not include any funds for further renovations; however, it does contain $1.7
million of nonrecurring General Revenue for ongoing maintenance and repairs to Florida
armories based upon three-year appropriations averages. In addition, the Outlook contains $2.0
million of nonrecurring General Revenue for Fiscal Years 2018-19 and 2019-20 to complete the
final two years of a four-year security enhancement plan. The Legislature has provided $2.0
million of General Revenue funding in both Fiscal Year 2016-17 and Fiscal Year 2017-18 in
support of the requested security enhancements.
The Department of Military Affairs receives funding for two statutorily-created Florida National
Guard community support programs that target at-risk youth and young adults; the Outlook
includes $1.9 million of nonrecurring General Revenue each year based on the three-year
appropriations average for these programs. The About Face program began in 1997 and is held at
local National Guard Armories throughout the state. This program provides life skills and drug
awareness training, including mentoring assistance to youth between the ages of 13 and 17. The
Forward March program began in 1999 and provides job readiness services for Florida Work and
Gain Economic Self-Sufficiency (WAGES) program participants. This is a life skills training
program in which clients participate in an activity-based curriculum designed for participants to
practice life skills in a real life setting. Participants must meet eligibility requirements for both
programs.
Section 250.34, Florida Statutes, provides for medical attention, necessary hospitalization, and
pay for troops who become injured while on state active duty, and specifies that the Department
of Financial Services, Division of Risk Management, process benefits to certain severely injured
or disabled troops who have claims past one year from the date of injury or disability. In January
each year, the Division of Risk Management provides the Department of Military Affairs with an
invoice for payments and associated legal costs made during the prior calendar year for this
purpose. The Outlook includes nearly $0.1 million based on the three-year appropriations
average for these claims.
47. Library, Cultural, Historical, and Election Priorities
The Outlook includes nonrecurring General Revenue funding for certain Department of State
programs based on three-year appropriations averages. Collectively, the Outlook includes
approximately $70.3 million of nonrecurring General Revenue funds for these programs in Fiscal
Year 2018-19, $66.3 million in Fiscal Year 2019-20, and $66.7 million in Fiscal Year 2020-21.
The Division of Library and Information Services administers grant programs to support the
establishment, expansion, and improvement of library service in Florida. Historically, the
program obtaining the most additional funding from the Legislature is State Aid to Libraries,
112 | P a g e
which encourages local governments to establish and continue development of free library
service to all residents of Florida. Recurring funding for State Aid to Libraries was reduced from
$22.3 million to $17.3 million in Fiscal Year 2017-18. The Outlook includes $6.0 million in
nonrecurring General Revenue for State Aid to Libraries based on a three-year appropriations
average of total General Revenue funding for this program. The Outlook also includes $2.0
million based on the three-year appropriations average for Public Library Construction Grants to
encourage the growth of public libraries.
The Division of Cultural Affairs administers four types of grant programs: Cultural and Museum
Grants, Specific Cultural Project Grants, Cultural Endowment Grants, and Cultural Facility
Grants. Cultural and Museum and Cultural Project grant programs provide funding for science
museums, youth and children’s museums, historical museums, local arts agencies, state service
organizations, and organizations that have cultural program activities. Cultural Endowment
grants create an endowment matching fund program to provide operating resources to not-for-
profit Florida corporations in good standing with the Florida Division of Corporations. In
addition, Cultural Facility grants provide state support for the acquisition, renovation, and
construction of cultural facilities such as performing art centers and museums. The three-year
appropriations average for cultural/museum and facility grants is approximately $43.8 million.
The Division of Historical Resources administers two grant programs that assist in the
identification, excavation, protection, and rehabilitation of historic and archaeological sites;
provide public information and museum exhibits on the history of Florida; and encourage
preservation in smaller cities and rural areas. The three-year appropriations average for these two
historic grant programs is approximately $13.6 million.
The Division of Elections administers the Florida Election Code, chapters 97 through 106,
Florida Statutes, which regulates all state and county elections. Portions of the election code also
pertain to municipalities and special districts in the state and to federal elections. Elections are
conducted in Florida almost every week of the year by county supervisors of elections or city
clerks. Major state and county elections are held in even-numbered years. The division is
required by law to pay for the costs of special elections; the costs of statewide litigation relating
to elections lawsuits; and the cost to advertise constitutional amendments. These costs are
considered in developing the Outlook. The three-year appropriations average funding for
statewide litigation issues is $0.2 million and an average of $0.4 million is included for
advertising constitutional amendments in even-numbered, election years. The Outlook also
includes $4.2 million in nonrecurring General Revenue in Fiscal Year 2018-19 for special
elections reimbursements based on the three-year average of $0.7 million, and current invoices
for Miami-Dade and Orange counties. The second and third years of the Outlook include only
the three-year average appropriation.
113 | P a g e
Natural Resources (Drivers #48 & #49)
48. Water and Land Conservation
In 2014, Florida voters approved a constitutional amendment to provide a dedicated funding
source for water and land conservation and restoration. The amendment created article X, section
28 of the Florida Constitution.
Article X, section 28 of the Florida Constitution requires that starting on July 1, 2015, for 20
years, 33 percent of the net revenues derived for the existing excise tax on documents must be
deposited into the Land Acquisition Trust Fund (LATF).
Article X, section 28 of the Florida Constitution also requires that funds in the LATF be
expended only for the following purposes:
1) As provided by law, to finance or refinance: the acquisition and improvement
of land, water areas, and related property interests, including conservation
easements, and resources for conservation lands including wetlands, forests,
and fish and wildlife habitat; wildlife management areas; lands that protect
water resources and drinking water sources, including lands protecting the
water quality and quantity of rivers, lakes, streams, springsheds, and lands
providing recharge for groundwater and aquifer systems; lands in the
Everglades Agricultural Area (EAA) and the Everglades Protection Area, as
defined in article II, section 7(b); beaches and shores; outdoor recreation
lands, including recreational trails, parks, and urban open space; rural
landscapes; working farms and ranches; historic or geologic sites; together
with management, restoration of natural systems, and the enhancement of
public access or recreational enjoyment of conservation lands.
2) To pay the debt service on bonds issued pursuant to article VII, section 11(e).
The 2015 Legislature amended section 201.15, Florida Statutes, (section 9, chapter 2015-229,
Laws of Florida), to provide the 33 percent distribution to the LATF required by the Florida
Constitution. Based on the August 2017 Revenue Estimating Conference, the revenue to be
distributed to the LATF over the three years of the Outlook is estimated to be $862.22 million for
Fiscal Year 2018-19, $894.24 million for Fiscal Year 2019-20, and $926.55 million for Fiscal
Year 2020-21 (see pages 55-56 for a more detailed discussion). The Outlook assumes a reserve
within the Fiscal Year 2018-19 LATF distribution similar to reserves established for the General
Revenue Fund and other trust funds.
The 2015 Legislature in chapter 2015-229, Laws of Florida, also eliminated the distributions to
other environmental trust funds whose purposes were consistent with the constitutional
amendment. These trust funds include the Conservation and Recreation Lands Trust Fund,
Conservation and Recreation Lands Program Trust Fund, Ecosystem Management and
Restoration Trust Fund, General Inspection Trust Fund, Invasive Plant Control Trust Fund, State
Game Trust Fund, Water Management Lands Trust Fund, and Water Quality Assurance Trust
114 | P a g e
Fund. In the Fiscal Year 2015-16 General Appropriations Act, the Legislature also shifted
appropriations from those trust funds to the LATF where appropriate, consistent with the
constitutional amendment.
In 2016, the Legislature passed House Bill 989 (chapter 2016-201, Laws of Florida), which
designated that a portion of funds deposited into the LATF be appropriated for Everglades
restoration projects. The provision requires that a minimum of the lesser of 25 percent or $200
million from the LATF be appropriated for Everglades restoration projects, which implement the
Comprehensive Everglades Restoration Plan (CERP), including the Central Everglades Planning
Project, the Long-Term Plan, and the Northern Everglades and Estuaries Protection Program.
The legislation also requires that a minimum of the lesser of 7.6 percent or $50 million be
appropriated annually for spring restoration, protection, and management projects. Finally, the
legislation requires that $5 million be appropriated annually through the 2025-26 fiscal year for
projects dedicated to the restoration of Lake Apopka.
In 2017, the Legislature passed Senate Bill 10 (chapter 2017-10, Laws of Florida), which
appropriates, beginning in Fiscal Year 2018-19, $64 million to the EAA reservoir project, which
is known as Component G of the Comprehensive Everglades Restoration Plan and is located in
the Everglades Agricultural Area. Any funds remaining in a fiscal year from that project are
made available for Phase II of the C-51 reservoir project or the Everglades restoration projects
passed in chapter 2016-201, Laws of Florida, in addition to the lesser of $200 million or 25
percent of LATF already available for Everglades restoration projects.
Components of water and land conservation include, but are not limited to, the Florida Forever
Program; Everglades restoration; springs protection, restoration, and preservation; Lake Apopka
restoration; and land management. Each of these areas is discussed below. Where the estimates
exceed the amounts available from the LATF for the various water and land conservation
programs, the Outlook assumes that the LATF projected shortfall will be supplemented by
General Revenue based on legislative appropriations in prior years.
Florida Forever Program – In 1998, voters amended the Florida Constitution by ratifying a
constitutional amendment that re-authorized bonds for land acquisition. The 1999 Legislature
responded by creating the 10-year $3.0 billion Florida Forever program to acquire and manage
land for conservation. In 2008, this program was extended. Funds appropriated to the Florida
Forever program are distributed as authorized in section 259.105, Florida Statutes, to various
agencies and programs. The statutory distribution is displayed on the following chart.
[SEE CHART ON FOLLOWING PAGE]
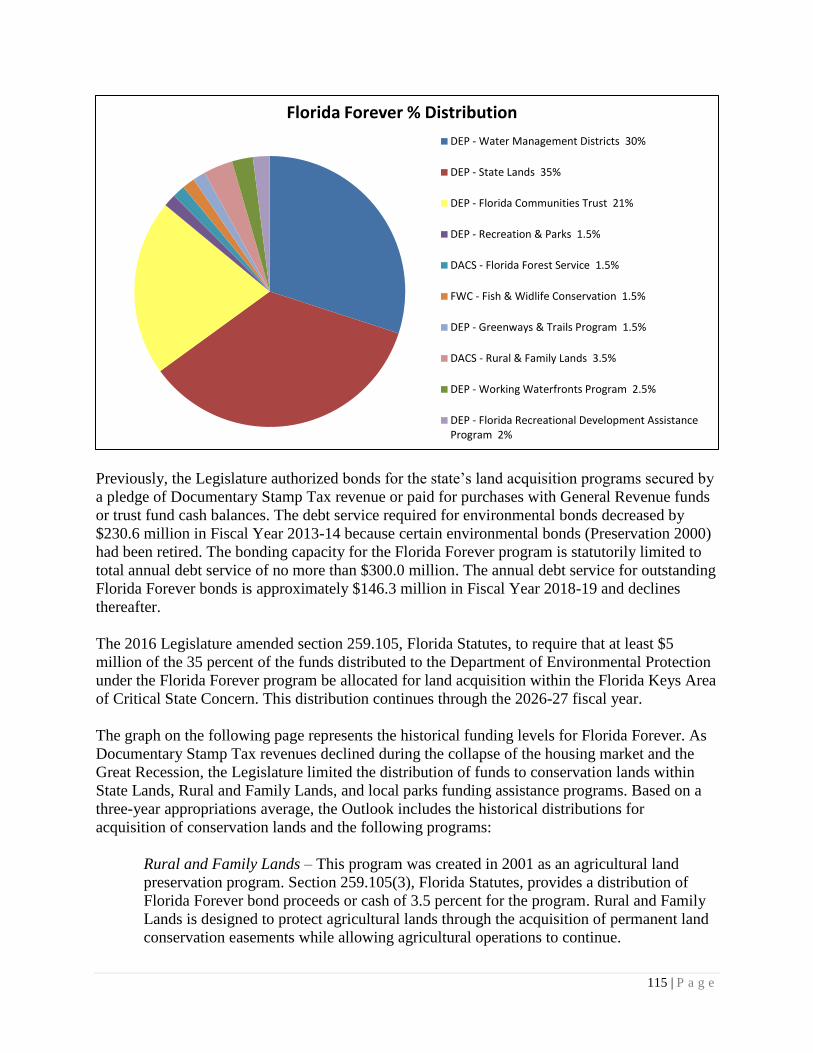
115 | P a g e
Previously, the Legislature authorized bonds for the state’s land acquisition programs secured by
a pledge of Documentary Stamp Tax revenue or paid for purchases with General Revenue funds
or trust fund cash balances. The debt service required for environmental bonds decreased by
$230.6 million in Fiscal Year 2013-14 because certain environmental bonds (Preservation 2000)
had been retired. The bonding capacity for the Florida Forever program is statutorily limited to
total annual debt service of no more than $300.0 million. The annual debt service for outstanding
Florida Forever bonds is approximately $146.3 million in Fiscal Year 2018-19 and declines
thereafter.
The 2016 Legislature amended section 259.105, Florida Statutes, to require that at least $5
million of the 35 percent of the funds distributed to the Department of Environmental Protection
under the Florida Forever program be allocated for land acquisition within the Florida Keys Area
of Critical State Concern. This distribution continues through the 2026-27 fiscal year.
The graph on the following page represents the historical funding levels for Florida Forever. As
Documentary Stamp Tax revenues declined during the collapse of the housing market and the
Great Recession, the Legislature limited the distribution of funds to conservation lands within
State Lands, Rural and Family Lands, and local parks funding assistance programs. Based on a
three-year appropriations average, the Outlook includes the historical distributions for
acquisition of conservation lands and the following programs:
Rural and Family Lands – This program was created in 2001 as an agricultural land
preservation program. Section 259.105(3), Florida Statutes, provides a distribution of
Florida Forever bond proceeds or cash of 3.5 percent for the program. Rural and Family
Lands is designed to protect agricultural lands through the acquisition of permanent land
conservation easements while allowing agricultural operations to continue.
Florida Forever % Distribution
DEP - Water Management Districts 30%
DEP - State Lands 35%
DEP - Florida Communities Trust 21%
DEP - Recreation & Parks 1.5%
DACS - Florida Forest Service 1.5%
FWC - Fish & Widlife Conservation 1.5%
DEP - Greenways & Trails Program 1.5%
DACS - Rural & Family Lands 3.5%
DEP - Working Waterfronts Program 2.5%
DEP - Florida Recreational Development AssistanceProgram 2%
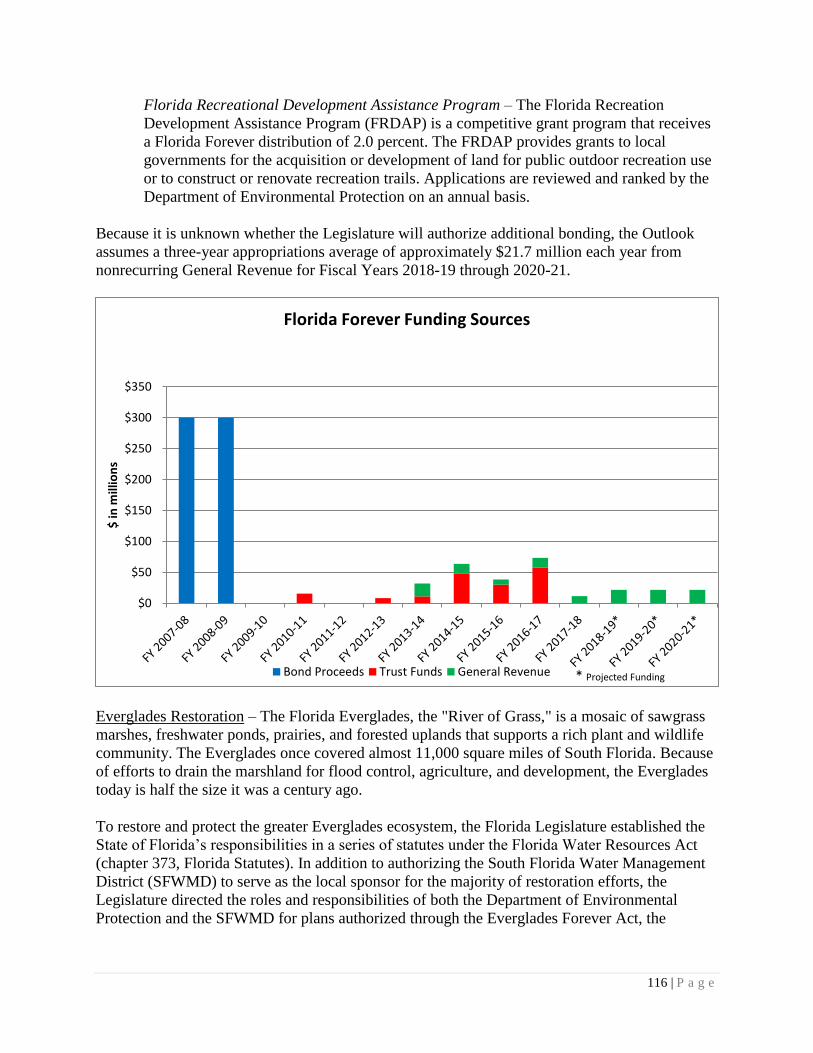
116 | P a g e
Florida Recreational Development Assistance Program – The Florida Recreation
Development Assistance Program (FRDAP) is a competitive grant program that receives
a Florida Forever distribution of 2.0 percent. The FRDAP provides grants to local
governments for the acquisition or development of land for public outdoor recreation use
or to construct or renovate recreation trails. Applications are reviewed and ranked by the
Department of Environmental Protection on an annual basis.
Because it is unknown whether the Legislature will authorize additional bonding, the Outlook
assumes a three-year appropriations average of approximately $21.7 million each year from
nonrecurring General Revenue for Fiscal Years 2018-19 through 2020-21.
Everglades Restoration – The Florida Everglades, the "River of Grass," is a mosaic of sawgrass
marshes, freshwater ponds, prairies, and forested uplands that supports a rich plant and wildlife
community. The Everglades once covered almost 11,000 square miles of South Florida. Because
of efforts to drain the marshland for flood control, agriculture, and development, the Everglades
today is half the size it was a century ago.
To restore and protect the greater Everglades ecosystem, the Florida Legislature established the
State of Florida’s responsibilities in a series of statutes under the Florida Water Resources Act
(chapter 373, Florida Statutes). In addition to authorizing the South Florida Water Management
District (SFWMD) to serve as the local sponsor for the majority of restoration efforts, the
Legislature directed the roles and responsibilities of both the Department of Environmental
Protection and the SFWMD for plans authorized through the Everglades Forever Act, the
$0
$50
$100
$150
$200
$250
$300
$350
$ in
mill
ion
s
Florida Forever Funding Sources
Bond Proceeds Trust Funds General Revenue * Projected Funding
117 | P a g e
Comprehensive Everglades Restoration Plan, the Northern Everglades and Estuaries Protection
Program, and the Everglades Restoration Investment Act.
The Comprehensive Everglades Restoration Program (CERP) is a large, comprehensive, long-
term 50-50 partnership with the federal government to restore the Everglades. The plan,
originally approved by the 2000 federal Water Resources Development Act, includes more than
60 projects that will take more than 30 years to complete and will cost an estimated $13.5 billion.
In 2000, the Legislature passed the Everglades Restoration Investment Act, which provided the
framework for the state to fund its share of the partnership, through cash or bonds to finance or
refinance the cost of acquisition and improvement of land and water areas necessary for
implementing CERP. In 2007 and 2008, the Legislature expanded the use of the Save Our
Everglades Trust Fund and bonds issued for Everglades Restoration to include the Lake
Okeechobee Watershed Protection Plan, the River Watershed Protection Plans, and the Keys
Wastewater Plan.
In 2007, the Legislature enacted the Northern Everglades and Estuaries Protection Act (NEEPA)
to restore and protect Lake Okeechobee and its downstream estuaries, the Caloosahatchee and St.
Lucie River watersheds. The Outlook includes funding for nutrient reduction and water retention
projects at the basin, sub-basin, and farm levels in the Lake Okeechobee watershed.
In 2012, the Department of Environmental Protection and the SFWMD, in consultation with U.S.
Environmental Protection Agency, developed a technical plan to meet water quality standards,
which includes additional stormwater treatment areas and storage reservoirs at a cost of $880
million over a 13-year period. A total of $500.7 million in funds will be provided by the
SFWMD with the balance to be provided by the state. The 2013 Legislature appropriated $32
million on a recurring basis to support the implementation of the technical water quality plan.
Excluding the technical water quality plan recurring funding initiated in the 2013-14 fiscal year,
the Legislature has authorized bond proceeds and appropriated General Revenue and trust funds
for Everglades Restoration projects as shown in the graph on the following page. Bonds may be
issued in an amount not to exceed $100.0 million per fiscal year, unless specifically approved by
the Legislature. The annual debt service for outstanding bonds is $24.0 million for Fiscal Years
2018-19 through 2024-25 and declines thereafter. It is unknown whether the Legislature will
authorize additional bonding. Based on the requirements of chapters 2016-201 and 2017-10,
Laws of Florida, the Outlook assumes funding from state trust funds of $172.8 million for Fiscal
Year 2018-19, $180.8 million for Fiscal Year 2019-20, and $188.9 million for Fiscal Year 2020-
21 for Everglades restoration projects. The Outlook also assumes a three-year average of $12.9
million in nonrecurring General Revenue funds for each year.
[SEE GRAPH ON FOLLOWING PAGE]
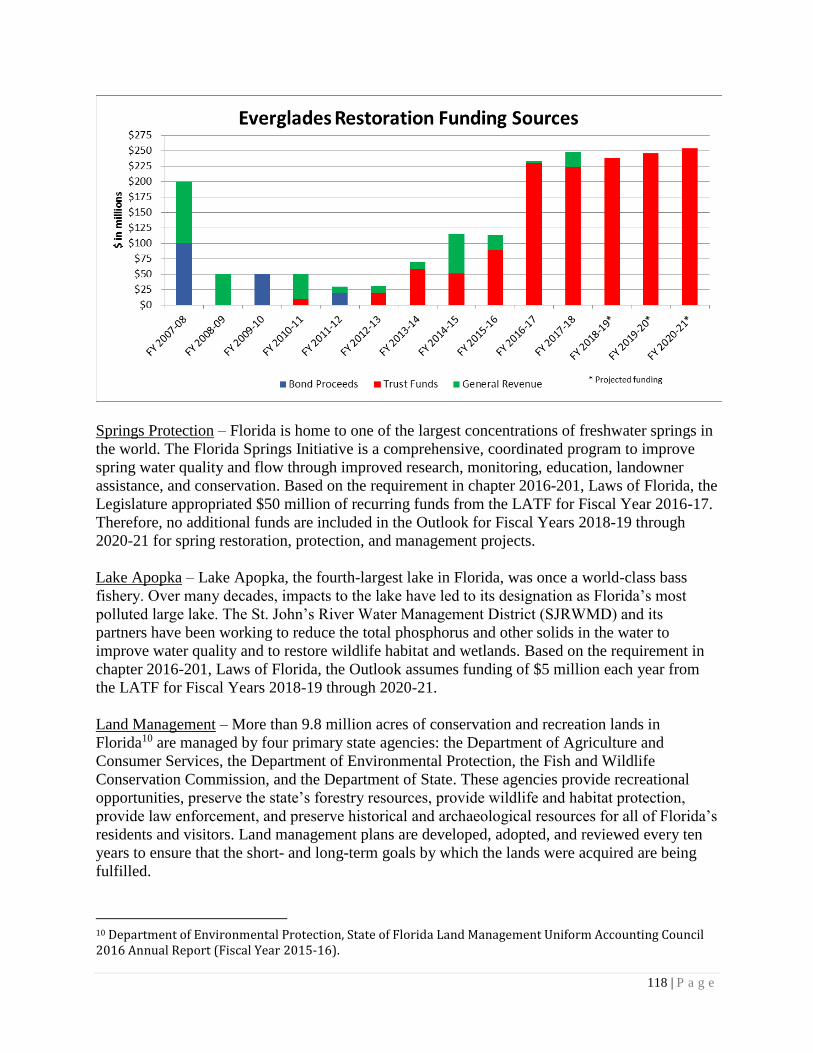
118 | P a g e
Springs Protection – Florida is home to one of the largest concentrations of freshwater springs in
the world. The Florida Springs Initiative is a comprehensive, coordinated program to improve
spring water quality and flow through improved research, monitoring, education, landowner
assistance, and conservation. Based on the requirement in chapter 2016-201, Laws of Florida, the
Legislature appropriated $50 million of recurring funds from the LATF for Fiscal Year 2016-17.
Therefore, no additional funds are included in the Outlook for Fiscal Years 2018-19 through
2020-21 for spring restoration, protection, and management projects.
Lake Apopka – Lake Apopka, the fourth-largest lake in Florida, was once a world-class bass
fishery. Over many decades, impacts to the lake have led to its designation as Florida’s most
polluted large lake. The St. John’s River Water Management District (SJRWMD) and its
partners have been working to reduce the total phosphorus and other solids in the water to
improve water quality and to restore wildlife habitat and wetlands. Based on the requirement in
chapter 2016-201, Laws of Florida, the Outlook assumes funding of $5 million each year from
the LATF for Fiscal Years 2018-19 through 2020-21.
Land Management – More than 9.8 million acres of conservation and recreation lands in
Florida10 are managed by four primary state agencies: the Department of Agriculture and
Consumer Services, the Department of Environmental Protection, the Fish and Wildlife
Conservation Commission, and the Department of State. These agencies provide recreational
opportunities, preserve the state’s forestry resources, provide wildlife and habitat protection,
provide law enforcement, and preserve historical and archaeological resources for all of Florida’s
residents and visitors. Land management plans are developed, adopted, and reviewed every ten
years to ensure that the short- and long-term goals by which the lands were acquired are being
fulfilled.
10 Department of Environmental Protection, State of Florida Land Management Uniform Accounting Council 2016 Annual Report (Fiscal Year 2015-16).
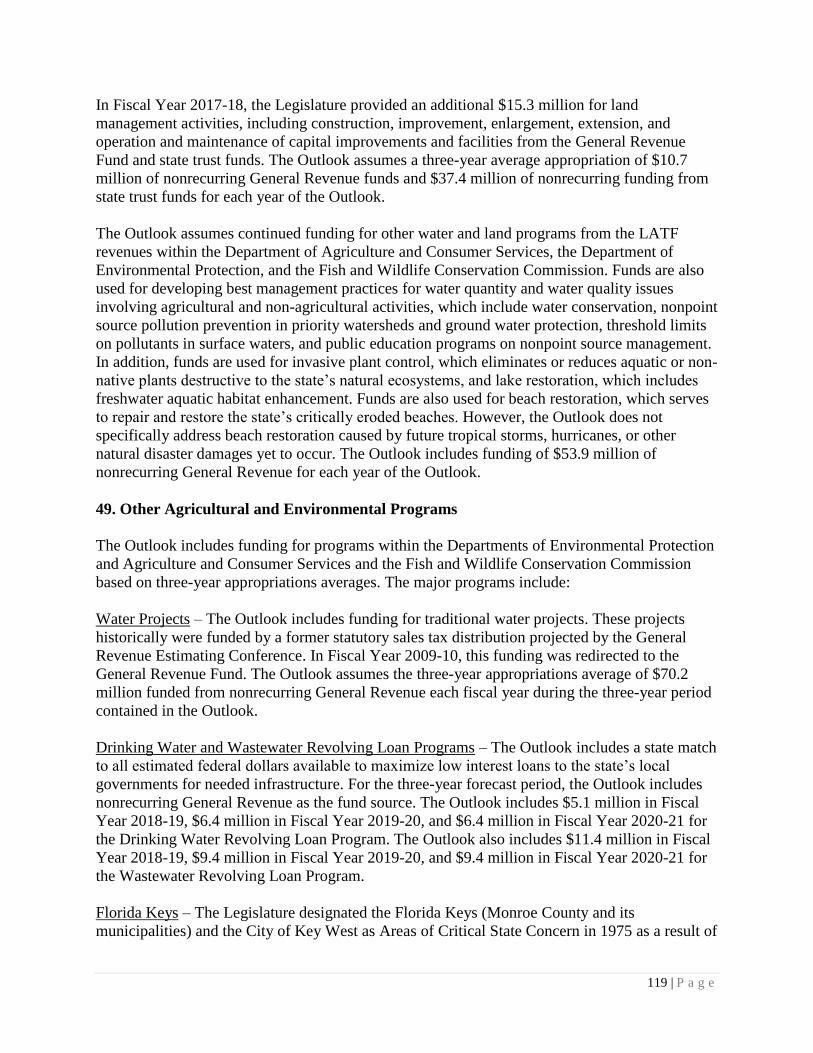
119 | P a g e
In Fiscal Year 2017-18, the Legislature provided an additional $15.3 million for land
management activities, including construction, improvement, enlargement, extension, and
operation and maintenance of capital improvements and facilities from the General Revenue
Fund and state trust funds. The Outlook assumes a three-year average appropriation of $10.7
million of nonrecurring General Revenue funds and $37.4 million of nonrecurring funding from
state trust funds for each year of the Outlook.
The Outlook assumes continued funding for other water and land programs from the LATF
revenues within the Department of Agriculture and Consumer Services, the Department of
Environmental Protection, and the Fish and Wildlife Conservation Commission. Funds are also
used for developing best management practices for water quantity and water quality issues
involving agricultural and non-agricultural activities, which include water conservation, nonpoint
source pollution prevention in priority watersheds and ground water protection, threshold limits
on pollutants in surface waters, and public education programs on nonpoint source management.
In addition, funds are used for invasive plant control, which eliminates or reduces aquatic or non-
native plants destructive to the state’s natural ecosystems, and lake restoration, which includes
freshwater aquatic habitat enhancement. Funds are also used for beach restoration, which serves
to repair and restore the state’s critically eroded beaches. However, the Outlook does not
specifically address beach restoration caused by future tropical storms, hurricanes, or other
natural disaster damages yet to occur. The Outlook includes funding of $53.9 million of
nonrecurring General Revenue for each year of the Outlook.
49. Other Agricultural and Environmental Programs
The Outlook includes funding for programs within the Departments of Environmental Protection
and Agriculture and Consumer Services and the Fish and Wildlife Conservation Commission
based on three-year appropriations averages. The major programs include:
Water Projects – The Outlook includes funding for traditional water projects. These projects
historically were funded by a former statutory sales tax distribution projected by the General
Revenue Estimating Conference. In Fiscal Year 2009-10, this funding was redirected to the
General Revenue Fund. The Outlook assumes the three-year appropriations average of $70.2
million funded from nonrecurring General Revenue each fiscal year during the three-year period
contained in the Outlook.
Drinking Water and Wastewater Revolving Loan Programs – The Outlook includes a state match
to all estimated federal dollars available to maximize low interest loans to the state’s local
governments for needed infrastructure. For the three-year forecast period, the Outlook includes
nonrecurring General Revenue as the fund source. The Outlook includes $5.1 million in Fiscal
Year 2018-19, $6.4 million in Fiscal Year 2019-20, and $6.4 million in Fiscal Year 2020-21 for
the Drinking Water Revolving Loan Program. The Outlook also includes $11.4 million in Fiscal
Year 2018-19, $9.4 million in Fiscal Year 2019-20, and $9.4 million in Fiscal Year 2020-21 for
the Wastewater Revolving Loan Program.
Florida Keys – The Legislature designated the Florida Keys (Monroe County and its
municipalities) and the City of Key West as Areas of Critical State Concern in 1975 as a result of
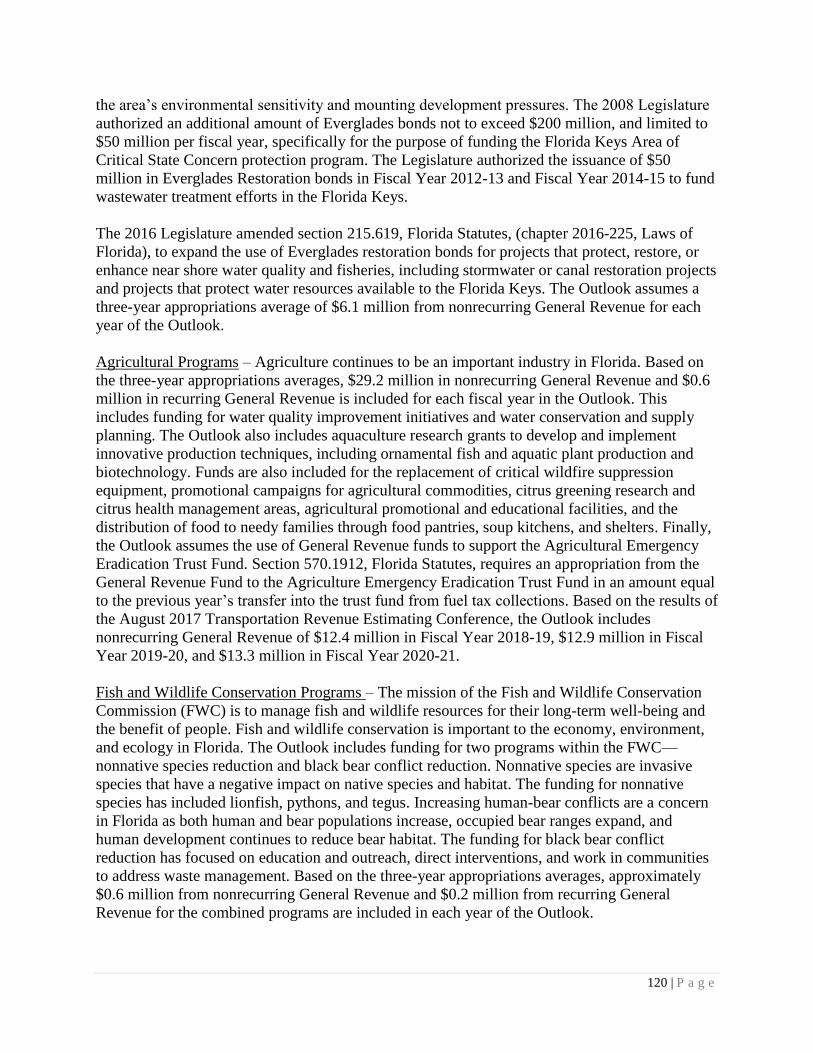
120 | P a g e
the area’s environmental sensitivity and mounting development pressures. The 2008 Legislature
authorized an additional amount of Everglades bonds not to exceed $200 million, and limited to
$50 million per fiscal year, specifically for the purpose of funding the Florida Keys Area of
Critical State Concern protection program. The Legislature authorized the issuance of $50
million in Everglades Restoration bonds in Fiscal Year 2012-13 and Fiscal Year 2014-15 to fund
wastewater treatment efforts in the Florida Keys.
The 2016 Legislature amended section 215.619, Florida Statutes, (chapter 2016-225, Laws of
Florida), to expand the use of Everglades restoration bonds for projects that protect, restore, or
enhance near shore water quality and fisheries, including stormwater or canal restoration projects
and projects that protect water resources available to the Florida Keys. The Outlook assumes a
three-year appropriations average of $6.1 million from nonrecurring General Revenue for each
year of the Outlook.
Agricultural Programs – Agriculture continues to be an important industry in Florida. Based on
the three-year appropriations averages, $29.2 million in nonrecurring General Revenue and $0.6
million in recurring General Revenue is included for each fiscal year in the Outlook. This
includes funding for water quality improvement initiatives and water conservation and supply
planning. The Outlook also includes aquaculture research grants to develop and implement
innovative production techniques, including ornamental fish and aquatic plant production and
biotechnology. Funds are also included for the replacement of critical wildfire suppression
equipment, promotional campaigns for agricultural commodities, citrus greening research and
citrus health management areas, agricultural promotional and educational facilities, and the
distribution of food to needy families through food pantries, soup kitchens, and shelters. Finally,
the Outlook assumes the use of General Revenue funds to support the Agricultural Emergency
Eradication Trust Fund. Section 570.1912, Florida Statutes, requires an appropriation from the
General Revenue Fund to the Agriculture Emergency Eradication Trust Fund in an amount equal
to the previous year’s transfer into the trust fund from fuel tax collections. Based on the results of
the August 2017 Transportation Revenue Estimating Conference, the Outlook includes
nonrecurring General Revenue of $12.4 million in Fiscal Year 2018-19, $12.9 million in Fiscal
Year 2019-20, and $13.3 million in Fiscal Year 2020-21.
Fish and Wildlife Conservation Programs – The mission of the Fish and Wildlife Conservation
Commission (FWC) is to manage fish and wildlife resources for their long-term well-being and
the benefit of people. Fish and wildlife conservation is important to the economy, environment,
and ecology in Florida. The Outlook includes funding for two programs within the FWC—
nonnative species reduction and black bear conflict reduction. Nonnative species are invasive
species that have a negative impact on native species and habitat. The funding for nonnative
species has included lionfish, pythons, and tegus. Increasing human-bear conflicts are a concern
in Florida as both human and bear populations increase, occupied bear ranges expand, and
human development continues to reduce bear habitat. The funding for black bear conflict
reduction has focused on education and outreach, direct interventions, and work in communities
to address waste management. Based on the three-year appropriations averages, approximately
$0.6 million from nonrecurring General Revenue and $0.2 million from recurring General
Revenue for the combined programs are included in each year of the Outlook.

121 | P a g e
General Government (Drivers #50 & #51)
50. Other General Government Priorities
Child Support Enforcement Annual Fee – The federal government requires an annual $25 fee
from each non-public assistance parent utilizing the services of the Department of Revenue’s
Child Support Enforcement program. Historically, the Legislature has provided General Revenue
funds to cover the cost of the annual $25 fee for parents utilizing child support enforcement
services. In Fiscal Year 2017-18, the General Appropriations Act included $2,080,000 in
recurring General Revenue to cover the cost of this annual fee. However, future projections
indicate a need for funding above this level. The Outlook includes $334,017 in recurring General
Revenue for Fiscal Year 2018-19, $350,030 in recurring General Revenue for Fiscal Year 2019-
20, and $82,929 in recurring General Revenue for Fiscal Year 2020-21 for this purpose.
Aerial Photography – The Department of Revenue assists small county property appraisers by
providing aerial photographs for counties with a population of 25,000 or less. Over the last
several years, the Legislature has directed the department to provide aerial photographs for
counties with a population of 50,000 or less. The Outlook assumes the continuation of this policy
and provides nonrecurring General Revenue of $1,174,040 in Fiscal Year 2018-19, $265,870 in
Fiscal Year 2019-20, and $167,299 in Fiscal Year 2020-21.
Florida Interoperability Network and Mutual Aid – The state has developed and implemented the
Florida Interoperability Network (FIN) and Mutual Aid (MA) channels. These systems provide
local public safety emergency responders the ability to communicate on the Statewide Law
Enforcement Radio Network, both in and outside their respective jurisdictions. Network
construction is complete, and the Outlook provides funding for continued operations.
Historically, funding for the development and maintenance of the FIN and MA systems has been
provided from federal domestic security grants; however, this funding source is no longer
available. For each year of the three-year forecast, the Outlook includes approximately $1.3
million for FIN and approximately $0.6 million for MA of nonrecurring General Revenue.
Florida Accounting Information Resource (FLAIR) Replacement – The Department of Financial
Services has begun the planning and design for the next generation accounting system to replace
FLAIR. This is a multi-year project, and $8.5 million from nonrecurring trust fund resources was
provided in Fiscal Year 2016-17. In Fiscal Year 2017-18, the department was provided $21.9
million in nonrecurring trust funds for the initial contract and system replacement and an
additional $3 million in recurring trust funds for FLAIR replacement staffing needs. Based upon
the department’s business case to replace the system, the Outlook includes $11.6 million
nonrecurring General Revenue and $21.5 million from nonrecurring trust funds in Fiscal Year
2018-19, $25.5 million nonrecurring General Revenue and $22.1 million from nonrecurring trust
funds for Fiscal Year 2019-20, and $21.4 million nonrecurring General Revenue and $22.6
million from nonrecurring trust funds for Fiscal Year 2020-21.
Compulsive Gambling – Section 551.118, Florida Statutes, requires the Department of Business
and Professional Regulation to contract with a private provider for a compulsive and addictive
gambling prevention program and funds the program from the annual $250,000 fee assessed to
122 | P a g e
each slot machine licensee. The Outlook includes a three-year average of $0.3 million from
nonrecurring General Revenue for each of the Fiscal Years 2018-19 through 2020-21 to continue
the funding level appropriated in Fiscal Year 2017-18.
Statewide Law Enforcement Radio System (SLERS) – The Department of Management Services
is responsible for the administration of the statewide radio communications system for law
enforcement and first responders. The current 20-year contract is set to expire in 2021. The
department is in the process of developing a procurement to replace the current system in
addition to implementing new mission critical P25 Phase 2 service delivery, resulting in
improved and expanded coverage, reliability, and audio clarity. It is anticipated that the
replacement of the current system will require a four-year transition period and include overlap
of costs. Based upon the department’s business case to replace the system, the Outlook includes
$7.6 million recurring General Revenue in Fiscal Year 2019-20 and $11.4 million in recurring
General Revenue in Fiscal Year 2020-21.
51. State Building Pool – General Repairs and Maintenance
The Outlook assumes funding for general repairs and maintenance of facilities in the Florida
Facilities Pool (state-owned facilities located throughout Florida). The Department of
Management Services is responsible for maintaining these facilities. The current list of general
building repair deficiencies totals approximately $287.9 million. General repairs and
maintenance projects include roofs, windows, doors, facades, HVAC, electrical, plumbing, and
office space renovations. The state facilities must be maintained in order to preserve the state’s
assets and for bond coverage purposes. The Outlook includes a three-year average of funding of
$17.0 million from nonrecurring General Revenue and $11.2 million from nonrecurring trust
fund resources for each of the Fiscal Years 2018-19 through 2020-21 for general building repairs
(see related Driver #53 that funds critical life safety deficiency repairs). In addition, the Fiscal
Year 2019-20 estimate includes $30.0 million from nonrecurring General Revenue for the
replacement of the Waller Park Plaza (Capitol Complex).
Administered Funds & Statewide Issues (Drivers #52 & #53)
52. State Employee Pay Issues
The Outlook includes funding for state employees pay issues of $37.9 million of recurring
General Revenue and $27.2 million of recurring trust fund expenditures based upon the three-
year average historical funding levels for competitive pay adjustments and merit and retention
pay adjustments, including adjustments for targeted groups of employees.
53. Maintenance, Repairs, and Capital Improvements – Statewide Buildings – Critical
Human Services – Maintenance and repair projects are based on critical life safety issues for
state-owned facilities, which include state laboratories and state institutions. The Outlook
includes funding for the Department of Health, the Department of Veterans’ Affairs, the
Department of Children and Families, and the Agency for Persons with Disabilities totaling $6.1
million each year from nonrecurring General Revenue and $3.1 million from trust funds for
123 | P a g e
Fiscal Year 2018-19 through Fiscal Year 2020-21, based on the three-year appropriations
average.
Criminal Justice – The Florida Department of Corrections is responsible for the major repair and
renovation needs of over 80 facilities statewide. Many of these facilities are old, and the physical
plant systems are well past their original operational life expectancy. The department’s
projection for the next five years identifies over $290 million in needs, which addresses major
maintenance issues as well as environmental concerns, Americans with Disabilities Act (ADA)
compliance, and security improvements. The Outlook includes $11.2 million each year from
nonrecurring General Revenue funds based on the average funding over the last three years.
The Department of Juvenile Justice is responsible for the upkeep and care of 94 residential and
detention facilities. The Legislature recognizes the importance of keeping these facilities safe
and functional. The department’s projection for the next five years includes an estimated need of
$55 million to address critical repairs and renovations for the safety and functionality of these
facilities. The Outlook includes $4.9 million each year from nonrecurring General Revenue
funds based on the average funding over the last three years.
Judicial Branch – The state is responsible for the facility needs of the Supreme Court and district
courts of appeal. The Outlook includes $4.6 million in nonrecurring General Revenue funds each
year based on the average funding over the last three years.
Department of Transportation – The Outlook includes funding for environmental site restoration
and capital renewal projects affecting critical life, health, and safety issues at various Department
of Transportation facilities located throughout the state. Environmental site restoration is a
remediation effort to restore facilities to an environmentally uncontaminated, clean, and safe
condition based on the Federal Resource Conservation and Recovery Act. Capital renewal
projects include repairs, replacement, renovation, and improvements to statewide facilities for
code compliance and mitigating health and welfare concerns. Based on a projection of code
correction issues for the coming year, and a three-year appropriations average for environmental
site restoration, the Outlook includes $5.4 million per year in State Transportation Trust Fund
revenues.
Natural Resources – The Outlook includes funding for life and safety repairs for agricultural and
wildlife conservation infrastructure located throughout the state. These improvements include
state offices and laboratories, forestry wildfire prevention facilities, and state farmers markets.
The Outlook includes nonrecurring General Revenue of $8.0 million for Fiscal Year 2018-19,
$1.6 million for Fiscal Year 2019-20, and $1.1 million for Fiscal Year 2020-21.
General Government – The Outlook includes funding for life safety and ADA repairs of facilities
in the Florida Facilities Pool (state-owned facilities located throughout Florida). The Department
of Management Services is responsible for maintaining these facilities. The current list of
deficiencies related to critical life safety and ADA issues is approximately $201.5 million. Life
safety projects include fire sprinklers, fire alarms, elevators, smoke control systems, and other
systems critical to the safety of occupants.
124 | P a g e
ADA compliance is dictated by standards set in the Code of Federal Regulations and is
administered by the U.S. Department of Justice. The most recent update in 2012 required
compliance surveys and transition plans for all public buildings. The current list of ADA
compliance projects for the Florida Facilities Pool is a result of updated surveys and serves as the
transition plan for the updated 2012 regulations. Projects include restroom renovations, elevator
lobby modifications, outdoor pavilion upgrades, sidewalk improvements, and any other project
needed to improve accessibility. The state facilities must be maintained in order to preserve the
state’s assets and for bond coverage purposes.
The Outlook includes a three-year average of funding of $5.1 million from nonrecurring General
Revenue and $0.4 million of nonrecurring trust fund resources for each of the Fiscal Years 2018-
19 through 2020-21, for life safety and ADA deficiencies. In addition, the Fiscal Year 2018-19
estimate includes $30.0 million from nonrecurring General Revenue for repairs needed to the
House Office Building garage.
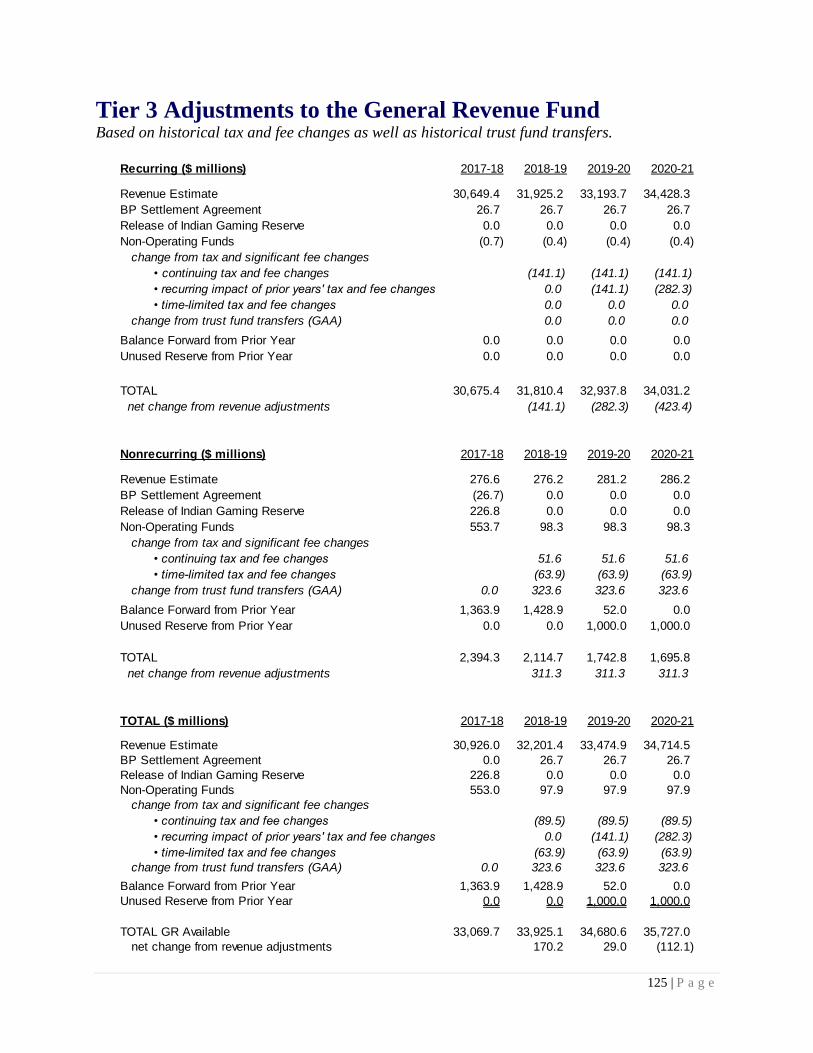
125 | P a g e
Tier 3 Adjustments to the General Revenue Fund Based on historical tax and fee changes as well as historical trust fund transfers.
Recurring ($ millions) 2017-18 2018-19 2019-20 2020-21
Revenue Estimate 30,649.4 31,925.2 33,193.7 34,428.3
BP Settlement Agreement 26.7 26.7 26.7 26.7
Release of Indian Gaming Reserve 0.0 0.0 0.0 0.0
Non-Operating Funds (0.7) (0.4) (0.4) (0.4)
change from tax and significant fee changes
• continuing tax and fee changes (141.1) (141.1) (141.1)
• recurring impact of prior years' tax and fee changes 0.0 (141.1) (282.3)
• time-limited tax and fee changes 0.0 0.0 0.0
change from trust fund transfers (GAA) 0.0 0.0 0.0
Balance Forward from Prior Year 0.0 0.0 0.0 0.0
Unused Reserve from Prior Year 0.0 0.0 0.0 0.0
TOTAL 30,675.4 31,810.4 32,937.8 34,031.2
net change from revenue adjustments (141.1) (282.3) (423.4)
Nonrecurring ($ millions) 2017-18 2018-19 2019-20 2020-21
Revenue Estimate 276.6 276.2 281.2 286.2
BP Settlement Agreement (26.7) 0.0 0.0 0.0
Release of Indian Gaming Reserve 226.8 0.0 0.0 0.0
Non-Operating Funds 553.7 98.3 98.3 98.3
change from tax and significant fee changes
• continuing tax and fee changes 51.6 51.6 51.6
• time-limited tax and fee changes (63.9) (63.9) (63.9)
change from trust fund transfers (GAA) 0.0 323.6 323.6 323.6
Balance Forward from Prior Year 1,363.9 1,428.9 52.0 0.0
Unused Reserve from Prior Year 0.0 0.0 1,000.0 1,000.0
TOTAL 2,394.3 2,114.7 1,742.8 1,695.8
net change from revenue adjustments 311.3 311.3 311.3
TOTAL ($ millions) 2017-18 2018-19 2019-20 2020-21
Revenue Estimate 30,926.0 32,201.4 33,474.9 34,714.5
BP Settlement Agreement 0.0 26.7 26.7 26.7
Release of Indian Gaming Reserve 226.8 0.0 0.0 0.0
Non-Operating Funds 553.0 97.9 97.9 97.9
change from tax and significant fee changes
• continuing tax and fee changes (89.5) (89.5) (89.5)
• recurring impact of prior years' tax and fee changes 0.0 (141.1) (282.3)
• time-limited tax and fee changes (63.9) (63.9) (63.9)
change from trust fund transfers (GAA) 0.0 323.6 323.6 323.6
Balance Forward from Prior Year 1,363.9 1,428.9 52.0 0.0
Unused Reserve from Prior Year 0.0 0.0 1,000.0 1,000.0
TOTAL GR Available 33,069.7 33,925.1 34,680.6 35,727.0
net change from revenue adjustments 170.2 29.0 (112.1)
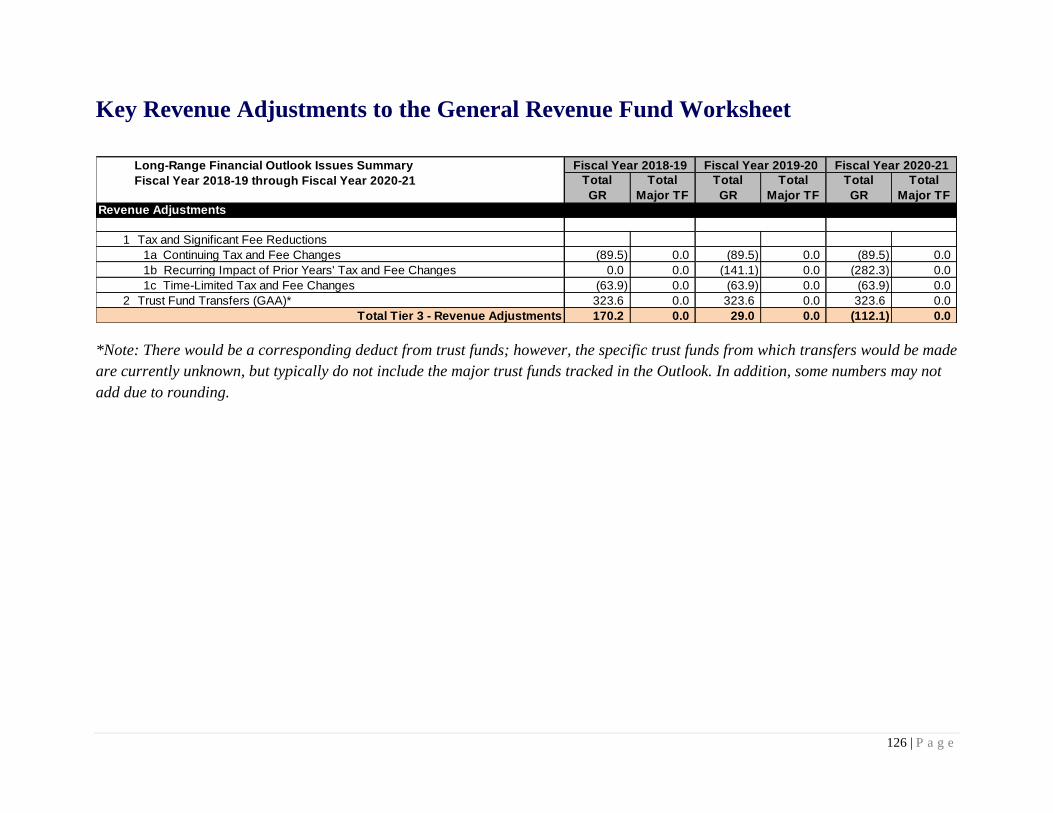
126 | P a g e
Key Revenue Adjustments to the General Revenue Fund Worksheet
*Note: There would be a corresponding deduct from trust funds; however, the specific trust funds from which transfers would be made
are currently unknown, but typically do not include the major trust funds tracked in the Outlook. In addition, some numbers may not
add due to rounding.
Long-Range Financial Outlook Issues Summary
Fiscal Year 2018-19 through Fiscal Year 2020-21 Total
GR
Total
Major TF
Total
GR
Total
Major TF
Total
GR
Total
Major TF
1 Tax and Significant Fee Reductions
1a Continuing Tax and Fee Changes (89.5) 0.0 (89.5) 0.0 (89.5) 0.0
1b Recurring Impact of Prior Years' Tax and Fee Changes 0.0 0.0 (141.1) 0.0 (282.3) 0.0
1c Time-Limited Tax and Fee Changes (63.9) 0.0 (63.9) 0.0 (63.9) 0.0
2 Trust Fund Transfers (GAA)* 323.6 0.0 323.6 0.0 323.6 0.0
Total Tier 3 - Revenue Adjustments 170.2 0.0 29.0 0.0 (112.1) 0.0
Revenue Adjustments
Fiscal Year 2018-19 Fiscal Year 2019-20 Fiscal Year 2020-21
127 | P a g e
Key Revenue Adjustments to the General Revenue Fund
Continuing the structural changes begun two years ago, this volume of the Long-Range
Financial Outlook includes revenue adjustments that reflect legislative actions which
alter the revenue-side of the state’s fiscal picture. They are identified on the Key Revenue
Adjustments to the General Revenue Fund Worksheet and described below.
Tax and Significant Fee Changes
Every year, the Legislature adopts a number of statutory changes that affect state and local
government revenues. Some increase or reduce revenues, while others transfer funds between
different funds or levels of government without affecting state revenue receipts. After the
Legislature adjourns, the Revenue Estimating Conference produces fiscal impacts for each
measure, and these are compiled in a document entitled Measures Affecting Revenues. The
document is published by the Legislative Office of Economic and Demographic Research and is
available on its website.11
The Outlook includes a three-year average of state tax and fee changes that affect the General
Revenue Fund. While a small number of these measures were positive, most resulted in savings
to the affected payers and reduced state revenues. The average is a net number and is used in the
Outlook to reflect the overall level of expected change.
Some of the impacts embedded in the measures were time-limited, nonrecurring changes that
only affected a single year (e.g., sales tax holidays), while others were continuing, recurring
changes that affect all future years. Because continuing changes to taxes usually have delayed
effective dates, the effect of the changes on the first fiscal year of implementation is less than a
full year’s effect. For example, a continuing $50 million tax reduction that affects revenue
collections for only half of the first year reduces state revenues by $50 million per year in the
out-years, but has less than the full effect in the first year. In that year, state revenues are only
reduced by $25 million. The remaining $25 million is converted into nonrecurring revenue and is
available to be spent on a one-time basis. This explains the directional difference (negative
recurring; positive nonrecurring) typically seen in the first year of tax breaks.
The first table on the following page shows the fiscal impact of tax and fee measures adopted by
the Legislature in the last three years. It separates those items that are continuing from those
items that are time-limited and shows them in two rows. The second table (immediately below
the first) calculates the three-year average for this period. Some of the numbers have been
rounded and may not add as displayed.
11 http://edr.state.fl.us/Content/revenues/reports/measures-affecting-revenues/index.cfm
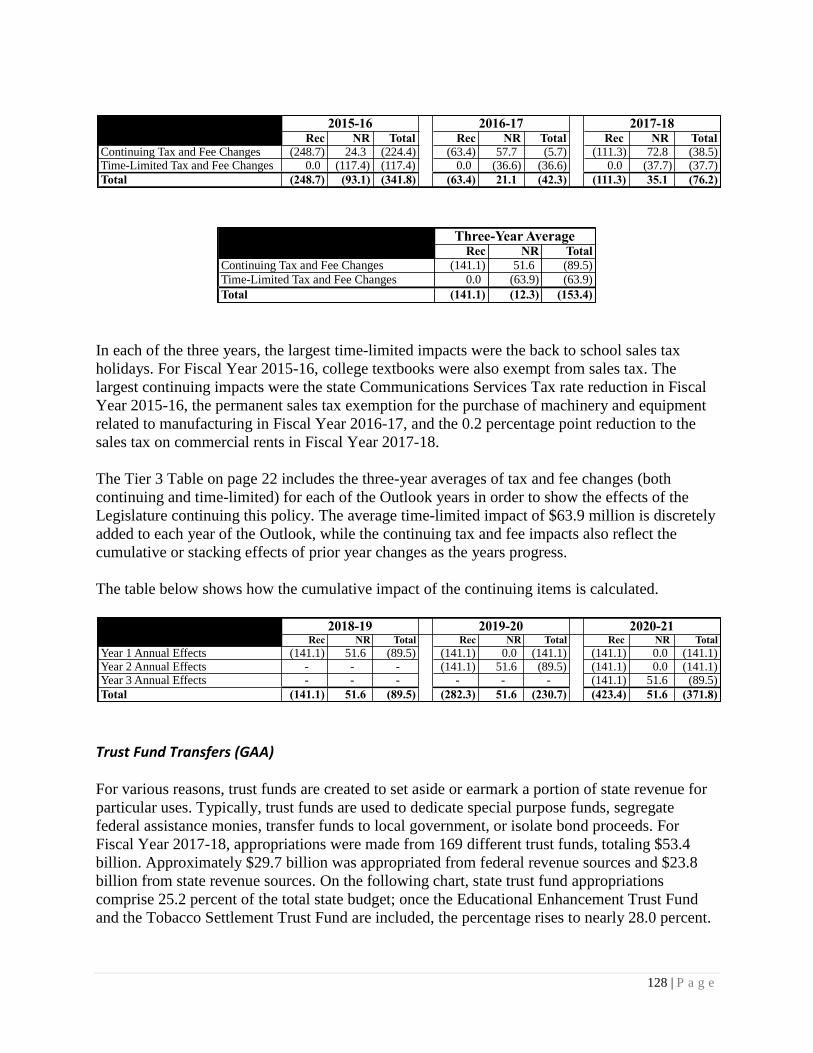
128 | P a g e
In each of the three years, the largest time-limited impacts were the back to school sales tax
holidays. For Fiscal Year 2015-16, college textbooks were also exempt from sales tax. The
largest continuing impacts were the state Communications Services Tax rate reduction in Fiscal
Year 2015-16, the permanent sales tax exemption for the purchase of machinery and equipment
related to manufacturing in Fiscal Year 2016-17, and the 0.2 percentage point reduction to the
sales tax on commercial rents in Fiscal Year 2017-18.
The Tier 3 Table on page 22 includes the three-year averages of tax and fee changes (both
continuing and time-limited) for each of the Outlook years in order to show the effects of the
Legislature continuing this policy. The average time-limited impact of $63.9 million is discretely
added to each year of the Outlook, while the continuing tax and fee impacts also reflect the
cumulative or stacking effects of prior year changes as the years progress.
The table below shows how the cumulative impact of the continuing items is calculated.
Trust Fund Transfers (GAA)
For various reasons, trust funds are created to set aside or earmark a portion of state revenue for
particular uses. Typically, trust funds are used to dedicate special purpose funds, segregate
federal assistance monies, transfer funds to local government, or isolate bond proceeds. For
Fiscal Year 2017-18, appropriations were made from 169 different trust funds, totaling $53.4
billion. Approximately $29.7 billion was appropriated from federal revenue sources and $23.8
billion from state revenue sources. On the following chart, state trust fund appropriations
comprise 25.2 percent of the total state budget; once the Educational Enhancement Trust Fund
and the Tobacco Settlement Trust Fund are included, the percentage rises to nearly 28.0 percent.
Rec NR Total Rec NR Total Rec NR Total
Continuing Tax and Fee Changes (248.7) 24.3 (224.4) (63.4) 57.7 (5.7) (111.3) 72.8 (38.5)Time-Limited Tax and Fee Changes 0.0 (117.4) (117.4) 0.0 (36.6) (36.6) 0.0 (37.7) (37.7)
Total (248.7) (93.1) (341.8) (63.4) 21.1 (42.3) (111.3) 35.1 (76.2)
2015-16 2016-17 2017-18
Rec NR Total
Continuing Tax and Fee Changes (141.1) 51.6 (89.5)
Time-Limited Tax and Fee Changes 0.0 (63.9) (63.9)
Total (141.1) (12.3) (153.4)
Three-Year Average
Rec NR Total Rec NR Total Rec NR Total
Year 1 Annual Effects (141.1) 51.6 (89.5) (141.1) 0.0 (141.1) (141.1) 0.0 (141.1)Year 2 Annual Effects - - - (141.1) 51.6 (89.5) (141.1) 0.0 (141.1)Year 3 Annual Effects - - - - - - (141.1) 51.6 (89.5)
Total (141.1) 51.6 (89.5) (282.3) 51.6 (230.7) (423.4) 51.6 (371.8)
2018-19 2019-20 2020-21
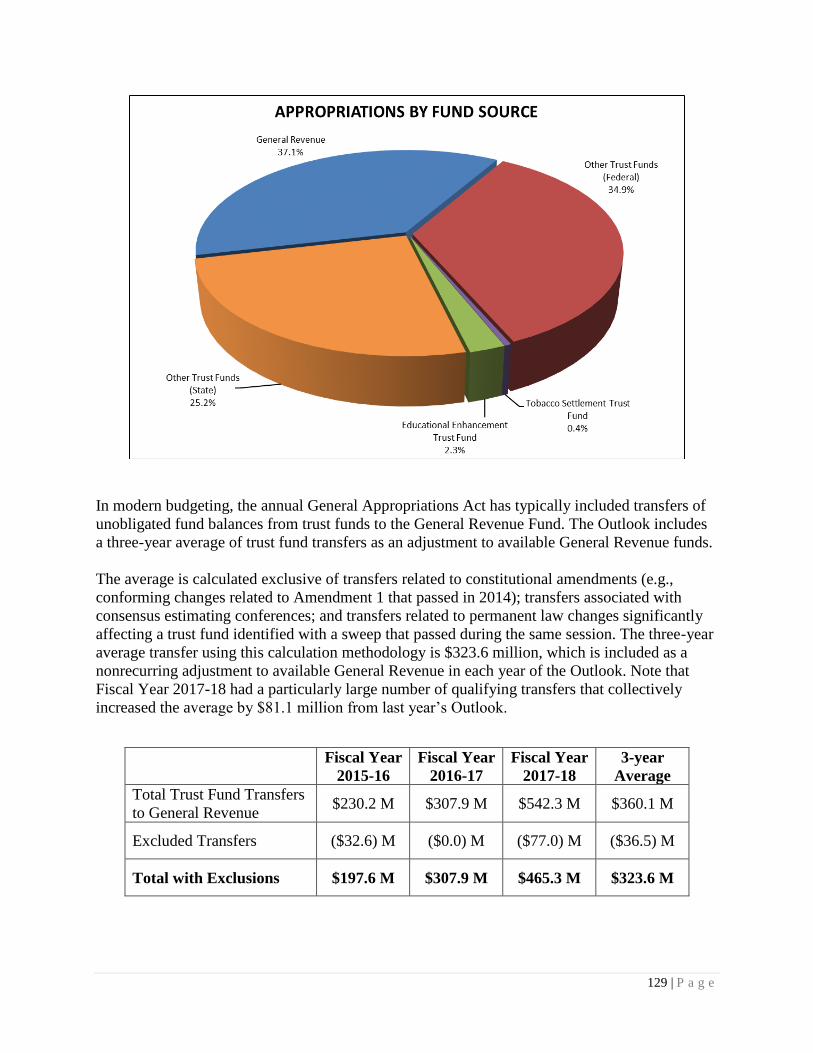
129 | P a g e
In modern budgeting, the annual General Appropriations Act has typically included transfers of
unobligated fund balances from trust funds to the General Revenue Fund. The Outlook includes
a three-year average of trust fund transfers as an adjustment to available General Revenue funds.
The average is calculated exclusive of transfers related to constitutional amendments (e.g.,
conforming changes related to Amendment 1 that passed in 2014); transfers associated with
consensus estimating conferences; and transfers related to permanent law changes significantly
affecting a trust fund identified with a sweep that passed during the same session. The three-year
average transfer using this calculation methodology is $323.6 million, which is included as a
nonrecurring adjustment to available General Revenue in each year of the Outlook. Note that
Fiscal Year 2017-18 had a particularly large number of qualifying transfers that collectively
increased the average by $81.1 million from last year’s Outlook.
Fiscal Year
2015-16
Fiscal Year
2016-17
Fiscal Year
2017-18
3-year
Average
Total Trust Fund Transfers
to General Revenue $230.2 M $307.9 M $542.3 M $360.1 M
Excluded Transfers ($32.6) M ($0.0) M ($77.0) M ($36.5) M
Total with Exclusions $197.6 M $307.9 M $465.3 M $323.6 M