Embed Size (px)
Citation preview

FALL 2017Enrollment Fact Book
Selected Information on Diversity
&
&
Dr. Glenn F. Boyce,Commissioner
Ten-Year Enrollment Comparison

Published By:
Eric S. Atchison Office of Strategic Research
3825 Ridgewood RoadJackson, MS 39211
Phone: (601) 432-6288www.mississippi.edu/research
FALL 2017Recommended APA Citation: Atchison, E. S. (2018). Fall 2017 Enrollment Fact Book and Ten-Year Enrollment Comparison and Selected Information on Diversity. Jackson, Mississippi: Mississippi Institutions of Higher Learning Office of Strategic Research.

BOARD OF TRUSTEESSTATE INSTITUTIONS of HIGHER LEARNING
C. D. Smith, Jr., PresidentMeridian
Shane Hooper, Vice PresidentTupelo
Karen L. CumminsOakland
Thomas DuffHattiesburg
Dr. Bradford J. Dye, IIIOxford
Dr. Alfred E. McNair, Jr.Ocean Springs
Chip MorganStoneville
Hal ParkerBolton
Alan W. Perry, PresidentJackson
Christine Lindsay PickeringBiloxi
Dr. Douglas W. Rouse, PresidentHattiesburg
Dr. J. Walt StarrColumbus
_____________________________
Dr. Glenn F. BoyceCommissioner of Higher Education
INSTITUTION EXECUTIVE OFFICERS
Dr. Alfred Rankins, Jr., PresidentAlcorn State University
Mr. William N. LaForge, PresidentDelta State University
Dr. William B. Bynum, Jr., PresidentJackson State University
Dr. Mark E. Keenum, PresidentMississippi State University
Dr. James B. Borsig, PresidentMississippi University for Women
Dr. Jerryl Briggs, PresidentMississippi Valley State University
Dr. Jeffrey S. Vitter, ChancellorUniversity of Mississippi
Dr. Rodney D. Bennett, PresidentUniversity of Southern Mississippi
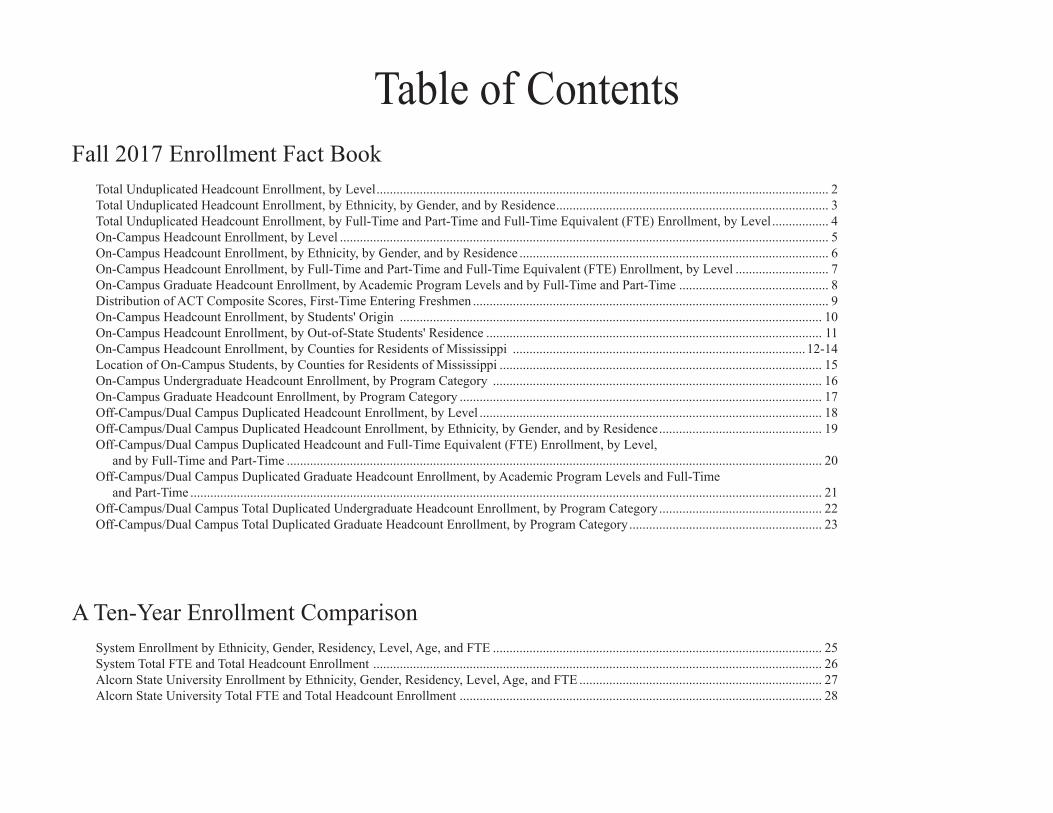
Table of Contents Fall 2017 Enrollment Fact Book Total Unduplicated Headcount Enrollment, by Level ........................................................................................................................................ 2 Total Unduplicated Headcount Enrollment, by Ethnicity, by Gender, and by Residence .................................................................................. 3 Total Unduplicated Headcount Enrollment, by Full-Time and Part-Time and Full-Time Equivalent (FTE) Enrollment, by Level ................. 4 On-Campus Headcount Enrollment, by Level ................................................................................................................................................... 5 On-Campus Headcount Enrollment, by Ethnicity, by Gender, and by Residence ............................................................................................. 6 On-Campus Headcount Enrollment, by Full-Time and Part-Time and Full-Time Equivalent (FTE) Enrollment, by Level ............................ 7 On-Campus Graduate Headcount Enrollment, by Academic Program Levels and by Full-Time and Part-Time ............................................. 8 Distribution of ACT Composite Scores, First-Time Entering Freshmen ........................................................................................................... 9 On-Campus Headcount Enrollment, by Students' Origin ............................................................................................................................... 10 On-Campus Headcount Enrollment, by Out-of-State Students' Residence ..................................................................................................... 11 On-Campus Headcount Enrollment, by Counties for Residents of Mississippi ........................................................................................ 12-14 Location of On-Campus Students, by Counties for Residents of Mississippi ................................................................................................. 15 On-Campus Undergraduate Headcount Enrollment, by Program Category ................................................................................................... 16 On-Campus Graduate Headcount Enrollment, by Program Category ............................................................................................................. 17 Off-Campus/Dual Campus Duplicated Headcount Enrollment, by Level ....................................................................................................... 18 Off-Campus/Dual Campus Duplicated Headcount Enrollment, by Ethnicity, by Gender, and by Residence ................................................. 19 Off-Campus/Dual Campus Duplicated Headcount and Full-Time Equivalent (FTE) Enrollment, by Level, and by Full-Time and Part-Time ................................................................................................................................................................. 20 Off-Campus/Dual Campus Duplicated Graduate Headcount Enrollment, by Academic Program Levels and Full-Time and Part-Time .............................................................................................................................................................................................. 21 Off-Campus/Dual Campus Total Duplicated Undergraduate Headcount Enrollment, by Program Category ................................................. 22 Off-Campus/Dual Campus Total Duplicated Graduate Headcount Enrollment, by Program Category .......................................................... 23
A Ten-Year Enrollment Comparison System Enrollment by Ethnicity, Gender, Residency, Level, Age, and FTE ................................................................................................... 25 System Total FTE and Total Headcount Enrollment ....................................................................................................................................... 26 Alcorn State University Enrollment by Ethnicity, Gender, Residency, Level, Age, and FTE ......................................................................... 27 Alcorn State University Total FTE and Total Headcount Enrollment ............................................................................................................. 28

Table of Contents, Continued
Selected Information on Diversity Unduplicated Enrollment by Race and Gender ........................................................................................................................................... 44-45
Delta State University Enrollment by Ethnicity, Gender, Residency, Level, Age, and FTE ............................................................................ 29 Delta State University Total FTE and Total Headcount Enrollment ............................................................................................................... 30 Jackson State University Enrollment by Ethnicity, Gender, Residency, Level, Age, and FTE ........................................................................ 31 Jackson State University Total FTE and Total Headcount Enrollment ........................................................................................................... 32 Mississippi State University Enrollment by Ethnicity, Gender, Residency, Level, Age, and FTE .................................................................. 33 Mississippi State University Total FTE and Total Headcount Enrollment ..................................................................................................... 34 Mississippi University for Women Enrollment by Ethnicity, Gender, Residency, Level, Age, and FTE ........................................................ 35 Mississippi University for Women Total FTE and Total Headcount Enrollment ............................................................................................ 36 Mississippi Valley State University Enrollment by Ethnicity, Gender, Residency, Level, Age, and FTE ....................................................... 37 Mississippi Valley State University Total FTE and Total Headcount Enrollment .......................................................................................... 38 University of Mississippi Enrollment by Ethnicity, Gender, Residency, Level, Age, and FTE ...................................................................... 39 University of Mississippi Total FTE and Total Headcount Enrollment .......................................................................................................... 40 University of Southern Mississippi Enrollment by Ethnicity, Gender, Residency, Level, Age, and FTE ...................................................... 41 University of Southern Mississippi Total FTE and Total Headcount Enrollment ........................................................................................... 42

Fall 2017 EnrollmEnt Fact Book

Fall Enrollment Book
Institution Certificate Freshman Sophomore Junior Senior Undergraduate Graduate Total
Alcorn State University 0 1,286 590 540 756 3,172 544 3,716Delta State University 0 1,151 400 568 922 3,041 748 3,789Jackson State University 0 1,504 1,249 1,488 2,259 6,500 2,058 8,558Mississippi State University 0 4,285 3,773 4,158 6,096 18,312 3,571 21,883Mississippi University for Women 0 563 399 747 868 2,577 212 2,789Mississippi Valley State University 0 874 369 328 406 1,977 408 2,385University of Mississippi* 0 4,705 4,034 4,531 5,467 18,737 5,043 23,780University of Southern Mississippi 0 2,396 1,899 2,879 4,641 11,815 2,663 14,478Total 0 16,764 12,713 15,239 21,415 66,131 15,247 81,378* Includes the University of Mississippi Medical Center.
2
25.3%
19.2%23.0%
32.4%
0.0%
10.0%
20.0%
30.0%
40.0%
Freshman Sophomore Junior Senior
Percent of Undergraduate EnrollmentGraduate
18.7%
Undergraduate81.3%
total UndUplicatEd HEadcoUnt EnrollmEnt
By lEvEl
Fall 2017

Fall Enrollment Book 3
White, 58.5%
Black, 32.7%
Other, 8.8%
Men, 41.8%
Women, 58.2%
Resident68.7%
Nonresident31.3%
total UndUplicatEd HEadcoUnt EnrollmEnt
By EtHnicity, By GEndEr, and By rEsidEncE
Fall 2017
Institution White Black Other Men Women Resident Nonresident Total
Alcorn State University 136 3.7% 3,477 93.6% 103 2.8% 1,300 35.0% 2,416 65.0% 2,683 72.2% 1,033 27.8% 3,716Delta State University 2,300 60.7% 1,240 32.7% 249 6.6% 1,471 38.8% 2,318 61.2% 3,152 83.2% 637 16.8% 3,789Jackson State University 544 6.4% 7,745 90.5% 269 3.1% 2,910 34.0% 5,648 66.0% 6,404 74.8% 2,154 25.2% 8,558Mississippi State University 15,613 71.3% 4,154 19.0% 2,116 9.7% 11,031 50.4% 10,852 49.6% 14,308 65.4% 7,575 34.6% 21,883Mississippi University for Women 1,668 59.8% 964 34.6% 157 5.6% 548 19.6% 2,241 80.4% 2,346 84.1% 443 15.9% 2,789Mississippi Valley State University 50 2.1% 2,172 91.1% 163 6.8% 912 38.2% 1,473 61.8% 1,835 76.9% 550 23.1% 2,385University of Mississippi* 18,197 76.5% 3,011 12.7% 2,572 10.8% 10,500 44.2% 13,280 55.8% 13,888 58.4% 9,892 41.6% 23,780University of Southern Mississippi 9,128 63.0% 3,818 26.4% 1,532 10.6% 5,311 36.7% 9,167 63.3% 11,283 77.9% 3,195 22.1% 14,478Total 47,636 58.5% 26,581 32.7% 7,161 8.8% 33,983 41.8% 47,395 58.2% 55,899 68.7% 25,479 31.3% 81,378* Includes the University of Mississippi Medical Center.

Fall Enrollment Book 4
17.0%
32.4%
21.1%
14.2%
20.0%
24.7%
7.2%
18.2%
0.0%
5.0%
10.0%
15.0%
20.0%
25.0%
30.0%
35.0%
ASU DSU JSU MSU MUW MVSU UM USM
Percent Part-Time
Full-time84.9%
Part-Time15.1%
total UndUplicatEd HEadcoUnt EnrollmEnt By FUll-timE and part-timE
and FUll-timE EqUivalEnt (FtE) EnrollmEnt By lEvEl
Fall 2017
Headcount Full-Time EquivalentPercent FTE Percent
Institution Full-Time Part-Time Total Part-Time Lower Upper Graduate Total of Headcount
Alcorn State University 3,083 633 3,716 17.0% 1,875.3 1,307.1 319.6 3,502.0 94.2%Delta State University 2,562 1,227 3,789 32.4% 1,068.6 1,449.2 455.9 2,973.7 78.5%Jackson State University 6,748 1,810 8,558 21.1% 2,784.0 3,557.0 1,221.5 7,562.5 88.4%Mississippi State University 18,775 3,108 21,883 14.2% 8,093.9 9,636.9 2,576.1 20,306.9 92.8%Mississippi University for Women 2,230 559 2,789 20.0% 760.7 1,486.1 156.1 2,402.9 86.2%Mississippi Valley State University 1,797 588 2,385 24.7% 1,060.7 733.9 247.1 2,041.7 85.6%University of Mississippi* 22,075 1,705 23,780 7.2% 8,734.4 9,600.7 4,615.7 22,950.8 96.5%University of Southern Mississippi 11,842 2,636 14,478 18.2% 4,377.1 6,908.2 1,791.2 13,076.5 90.3%Total 69,112 12,266 81,378 15.1% 28,754.7 34,679.1 11,383.2 74,817.0 91.9%* Includes the University of Mississippi Medical Center. Students enrolled in health professional programs are all considered full-time.
Note: Full-time equivalent enrollment data are rounded to the nearest tenth.

Fall Enrollment Book 5
25.6%
20.0%22.6%
31.8%
0.0%
5.0%
10.0%
15.0%
20.0%
25.0%
30.0%
35.0%
Freshman Sophomore Junior Senior
Undergraduate83.8%
Graduate16.2%
on-campUs HEadcoUnt EnrollmEnt
By lEvEl
Fall 2017
Institution Certificate Freshman Sophomore Junior Senior Undergraduate Graduate Total
Alcorn State University 0 1,229 533 465 648 2,875 518 3,393Delta State University 0 563 398 556 907 2,424 739 3,163Jackson State University 0 1,502 1,248 1,473 2,231 6,454 1,711 8,165Mississippi State University 0 4,276 3,743 4,008 5,832 17,859 3,494 21,353Mississippi University for Women 0 509 334 583 789 2,215 190 2,405Mississippi Valley State University 0 874 369 328 406 1,977 408 2,385University of Mississippi 0 4,699 4,004 4,020 4,922 17,645 2,706 20,351University of Southern Mississippi 0 2,304 1,833 2,644 4,099 10,880 2,302 13,182Total 0 15,956 12,462 14,077 19,834 62,329 12,068 74,397

Fall Enrollment Book 6
White, 57.9%
Black, 33.4%
Other, 8.8%
Men42.5%
Women57.5%
Resident66.9%
Nonresident33.1%
on-campUs HEadcoUnt EnrollmEnt
By EtHnicity, By GEndEr, and By rEsidEncE
Fall 2017
Institution White Black Other Men Women Resident Nonresident Total
Alcorn State University 112 3.3% 3,182 93.8% 99 2.9% 1,217 35.9% 2,176 64.1% 2,425 71.5% 968 28.5% 3,393Delta State University 1,839 58.1% 1,102 34.8% 222 7.0% 1,248 39.5% 1,915 60.5% 2,532 80.1% 631 19.9% 3,163Jackson State University 513 6.3% 7,397 90.6% 255 3.1% 2,820 34.5% 5,345 65.5% 6,067 74.3% 2,098 25.7% 8,165Mississippi State University 15,305 71.7% 3,973 18.6% 2,075 9.7% 10,852 50.8% 10,501 49.2% 13,794 64.6% 7,559 35.4% 21,353Mississippi University for Women 1,414 58.8% 840 34.9% 151 6.3% 481 20.0% 1,924 80.0% 2,000 83.2% 405 16.8% 2,405Mississippi Valley State University 50 2.1% 2,172 91.1% 163 6.8% 912 38.2% 1,473 61.8% 1,835 76.9% 550 23.1% 2,385University of Mississippi 15,647 76.9% 2,552 12.5% 2,152 10.6% 9,272 45.6% 11,079 54.4% 10,966 53.9% 9,385 46.1% 20,351University of Southern Mississippi 8,163 61.9% 3,612 27.4% 1,407 10.7% 4,822 36.6% 8,360 63.4% 10,189 77.3% 2,993 22.7% 13,182Total 43,043 57.9% 24,830 33.4% 6,524 8.8% 31,624 42.5% 42,773 57.5% 49,808 66.9% 24,589 33.1% 74,397

Fall Enrollment Book 7
Lower UG FTE
41.5%
Upper UG FTE
46.0%
Graduate FTE12.5%
17.5%20.6%
24.4%
13.8%
23.2%25.5%
10.0%
24.6%
0.0%
5.0%
10.0%
15.0%
20.0%
25.0%
30.0%
ASU DSU JSU MSU MUW MVSU UM USM
Percent Part-Time
on-campUs HEadcoUnt EnrollmEnt By FUll-timE and part-timE
and FUll-timE EqUivalEnt (FtE) EnrollmEnt By lEvEl
Fall 2017
Headcount Full-Time EquivalentPercent FTE Percent
Institution Full-Time Part-Time Total Part-Time Lower Upper Graduate Total of Headcount
Alcorn State University 2,800 593 3,393 17.5% 1,766.2 1,127.7 298.8 3,192.7 94.1%Delta State University 2,513 650 3,163 20.6% 910.8 1,407.0 449.9 2,767.7 87.5%Jackson State University 6,173 1,992 8,165 24.4% 2,766.4 3,361.5 959.0 7,086.9 86.8%Mississippi State University 18,406 2,947 21,353 13.8% 8,066.3 9,271.5 2,534.4 19,872.2 93.1%Mississippi University for Women 1,846 559 2,405 23.2% 665.3 1,221.0 140.1 2,026.4 84.3%Mississippi Valley State University 1,778 607 2,385 25.5% 1,057.1 727.5 247.1 2,031.7 85.2%University of Mississippi 18,321 2,030 20,351 10.0% 8,685.6 8,347.7 2,290.4 19,323.7 95.0%University of Southern Mississippi 9,935 3,247 13,182 24.6% 4,112.2 5,649.2 1,558.2 11,319.6 85.9%Total 61,772 12,625 74,397 17.0% 28,029.9 31,113.1 8,477.9 67,620.9 90.9%Note: Full-time equivalent enrollment data are rounded to the nearest tenth.

Fall Enrollment Book 8
Master's 60.6%
Specialist 2.7%
Doctoral 26.3%
First Professional
8.6%
Unclassified1.8%
on-campUs GradUatE HEadcoUnt EnrollmEnt
By acadEmic proGram lEvEls and By FUll-timE and part-timE
Fall 2017
Certificate Master’s Specialist Professional Doctoral Unclassified TotalFull Part Full Part Full Part Full Part Full Part Full Part All
Institution Time Time Total Time Time Total Time Time Total Time Time Total Time Time Total Time Time Total Programs
ASU 0 0 0 168 339 507 0 11 11 0 0 0 0 0 0 0 0 0 518DSU 0 0 0 325 203 528 19 89 108 0 0 0 16 67 83 3 17 20 739JSU 0 0 0 401 749 1,150 24 95 119 0 0 0 103 308 411 6 25 31 1,711MSU 0 0 0 899 1,067 1,966 15 14 29 352 9 361 685 453 1,138 0 0 0 3,494MUW 0 0 0 101 81 182 0 0 0 0 0 0 8 0 8 0 0 0 190MVSU 0 0 0 130 278 408 0 0 0 0 0 0 0 0 0 0 0 0 408UM 0 0 0 777 390 1,167 11 23 34 675 5 680 509 267 776 10 39 49 2,706USM 0 0 0 812 588 1,400 0 23 23 0 0 0 461 298 759 17 103 120 2,302Total 0 0 0 3,613 3,695 7,308 69 255 324 1,027 14 1,041 1,782 1,393 3,175 36 184 220 12,068

Fall Enrollment Book 9
distriBUtion oF act compositE scorEs total First-timE EntErinG FrEsHmEn
Fall 2017ACTScore ASU DSU JSU MSU MUW MVSU UM USM TOTAL
36 0 0 0 9 0 0 3 0 1235 0 0 0 39 0 0 21 2 6234 0 0 0 75 0 0 45 6 12633 1 1 1 92 0 0 120 9 22432 0 2 0 123 0 0 174 26 32531 0 5 2 159 0 0 146 47 35930 3 3 1 191 3 0 167 94 46229 7 9 3 182 2 1 218 58 48028 11 10 9 224 6 1 229 73 56327 17 8 16 225 7 1 242 68 58426 16 10 26 259 7 4 275 91 68825 30 14 21 254 18 6 294 131 76824 60 15 32 249 13 9 246 156 78023 29 28 40 245 21 16 322 157 85822 52 40 48 258 19 18 321 143 89921 24 29 64 229 21 14 276 182 83920 51 35 80 218 26 23 211 152 79619 67 29 129 159 20 43 139 168 75418 86 33 139 138 25 47 103 148 71917 115 21 149 66 22 59 82 97 61116 109 22 137 31 8 79 34 69 48915 22 3 18 5 1 38 17 13 11714 15 1 12 3 1 25 0 2 5913 11 0 6 0 0 16 0 1 3412 1 0 0 0 0 4 0 0 511 0 0 0 0 0 1 0 0 110 0 0 0 0 0 0 0 0 09 1 0 0 0 0 0 0 0 1
Total 728 318 933 3,433 220 405 3,685 1,893 11,615
Mean Score 19.6 21.4 19.3 25.1 21.2 17.8 25.0 22.8 23.5
Score Not Reported 14 3 0 2 0 0 8 10 37

Fall Enrollment Book 10
In-State, 66.9%
Other States, 29.5%
Foreign Countries,
3.6%
on-campUs HEadcoUnt EnrollmEnt
By stUdEnts' oriGin
Fall 2017
Percent PercentNumber of Number of Number of of In-State of In-StateStudents Number of Students Students Students to Students
from Students from from Total Total FromAdjacent from Other Foreign On-Campus On-Campus Adjacent
Institution Counties In-State States Countries Enrollment Enrollment Counties
Alcorn State University 1,012 2,425 822 146 3,393 71.5% 41.7%Delta State University 1,078 2,532 499 132 3,163 80.1% 42.6%Jackson State University 4,296 6,067 1,801 297 8,165 74.3% 70.8%Mississippi State University 2,208 13,794 6,758 801 21,353 64.6% 16.0%Mississippi University for Women 897 2,000 330 75 2,405 83.2% 44.9%Mississippi Valley State University 1,059 1,835 518 32 2,385 76.9% 57.7%University of Mississippi 2,726 10,966 8,586 799 20,351 53.9% 24.9%University of Southern Mississippi 3,633 10,189 2,617 376 13,182 77.3% 35.7%Total 16,909 49,808 21,931 2,658 74,397 66.9% 33.9%

Fall Enrollment Book 11
on-campUs HEadcoUnt EnrollmEnt
By oUt-oF-statE stUdEnts' rEsidEncE
Fall 2017
ASU DSU JSU MSU MUW MVSU UM USM Total
Total Enrollment 3,393 3,163 8,165 21,353 2,405 2,385 20,351 13,182 74,397
Total Nonresident 968 631 2,098 7,559 405 550 9,385 2,993 24,589
Nonresident Percent ofTotal Enrollment 28.5% 19.9% 25.7% 35.4% 16.8% 23.1% 46.1% 22.7% 33.1%
Nonresidents from SREB StatesAlabama 23 57 98 1,462 208 23 480 596 2,947Arkansas 8 54 95 199 3 13 216 35 623Delaware 6 1 0 19 1 0 8 2 37Florida 56 32 43 431 6 28 495 254 1,345Georgia 63 30 171 667 12 55 996 96 2,090Kentucky 3 4 2 42 1 2 141 16 211Louisiana 216 53 215 328 10 22 393 767 2,004Maryland 10 3 18 69 5 2 143 28 278North Carolina 5 7 14 117 3 2 296 37 481Oklahoma 3 4 9 26 3 2 22 15 84South Carolina 2 4 4 128 4 1 95 27 265Tennessee 67 65 189 1,357 37 143 1,109 98 3,065Texas 105 38 87 533 13 52 1,360 147 2,335Virginia 6 19 6 141 3 2 296 37 510West Virginia 0 1 0 39 0 0 8 4 52Total from SREB States 573 372 951 5,558 309 347 6,058 2,159 16,327
From Other U.S. States 249 127 850 1,200 21 171 2,528 458 5,604 (Includes U.S. territories)
From Foreign Countries 146 132 297 801 75 32 799 376 2,658
Foreign Countries Represented 35 45 59 74 12 9 77 62 136 (Total represents unique countries)

Fall Enrollment Book 12
on-campUs HEadcoUnt EnrollmEnt
By coUntiEs For rEsidEnts oF mississippi
Fall 2017
ASU DSU JSU MSU MUW MVSU UM USM Total
Adams 368 9 66 77 4 2 77 79 682Alcorn 6 5 6 155 19 1 171 24 387Amite 20 2 8 23 0 0 21 38 112Attala 4 12 40 134 18 3 68 16 295Benton 0 3 3 24 6 0 43 4 83Bolivar 34 534 76 128 21 78 86 27 984Calhoun 0 15 6 58 12 0 67 6 164Carroll 4 15 14 44 2 18 43 9 149Chickasaw 2 8 6 103 38 1 62 5 225Choctaw 0 2 2 82 9 0 19 1 115Claiborne 256 1 30 18 3 0 7 16 331Clarke 1 3 8 51 6 1 24 52 146Clay 2 3 18 196 86 4 35 23 367Coahoma 29 117 54 75 8 112 99 32 526Copiah 30 15 152 90 9 1 31 70 398Covington 10 2 18 65 2 1 26 155 279DeSoto 34 238 83 839 42 31 1139 170 2,576Forrest 33 11 53 237 10 3 120 1,449 1,916Franklin 34 4 8 30 3 0 8 36 123George 2 1 2 62 11 1 23 91 193Greene 1 0 4 20 1 0 14 53 93Grenada 2 70 17 117 14 24 134 22 400Hancock 2 5 1 160 4 1 110 290 573Harrison 54 28 63 650 29 4 405 1,307 2,540Hinds 267 79 2,981 850 91 30 654 550 5,502Holmes 19 17 94 65 16 96 29 27 363Humphreys 13 22 22 30 1 115 10 5 218Issaquena 3 2 7 4 0 0 2 2 20

Fall Enrollment Book 13
on-campUs HEadcoUnt EnrollmEnt
By coUntiEs For rEsidEnts oF mississippi
Fall 2017 (continUEd)
ASU DSU JSU MSU MUW MVSU UM USM Total
Itawamba 0 1 2 123 33 0 107 11 277Jackson 33 17 69 557 24 10 375 682 1,767Jasper 29 0 18 48 3 5 14 72 189Jefferson 234 3 34 19 1 0 2 15 308Jefferson Davis 21 1 30 26 0 0 14 57 149Jones 15 8 26 188 7 6 87 456 793Kemper 2 2 2 31 11 1 5 16 70Lafayette 2 48 11 108 13 6 1,699 20 1,907Lamar 9 3 13 249 14 0 181 1,047 1,516Lauderdale 22 15 60 378 31 5 196 186 893Lawrence 24 6 21 37 5 1 15 45 154Leake 7 11 49 99 8 3 19 29 225Lee 4 40 14 598 107 4 656 51 1,474Leflore 31 91 83 127 18 562 103 32 1,047Lincoln 37 17 55 156 5 4 65 149 488Lowndes 10 8 23 503 549 10 123 64 1,290Madison 58 76 485 1,056 38 17 875 336 2,941Marion 19 3 20 55 5 5 37 161 305Marshall 3 16 21 108 15 24 147 22 356Monroe 6 11 7 204 113 3 102 23 469Montgomery 5 11 8 83 18 11 49 7 192Neshoba 4 4 19 147 15 2 53 43 287Newton 6 8 24 104 24 3 36 53 258Noxubee 5 1 7 84 26 5 12 16 156Oktibbeha 6 11 14 1,085 123 2 62 30 1,333Panola 3 59 19 105 10 3 207 33 439Pearl River 10 15 9 148 10 0 63 362 617Perry 7 2 1 17 1 2 11 71 112

Fall Enrollment Book 14
on-campUs HEadcoUnt EnrollmEnt
By coUntiEs For rEsidEnts oF mississippi
Fall 2017 (continUEd)
ASU DSU JSU MSU MUW MVSU UM USM Total
Pike 60 6 69 91 8 0 56 183 473Pontotoc 0 10 2 141 19 0 177 11 360Prentiss 2 4 3 70 16 1 126 7 229Quitman 5 17 18 17 1 21 28 6 113Rankin 29 91 339 925 69 8 578 491 2,530Scott 5 9 40 106 11 1 29 42 243Sharkey 12 26 18 19 0 21 5 1 102Simpson 11 6 70 72 4 1 47 119 330Smith 6 5 11 54 1 0 17 89 183Stone 0 2 3 40 6 0 21 93 165Sunflower 19 136 36 82 17 196 42 24 552Tallahatchie 5 32 20 26 4 48 36 5 176Tate 3 46 7 86 9 3 175 12 341Tippah 0 10 1 54 7 0 84 3 159Tishomingo 0 11 0 81 10 0 68 5 175Tunica 7 17 17 34 0 14 27 8 124Union 1 18 0 112 16 0 186 7 340Walthall 10 1 14 28 1 0 4 61 119Warren 225 34 131 287 14 6 103 137 937Washington 53 291 128 207 20 214 120 53 1,086Wayne 3 3 8 41 4 0 16 93 168Webster 0 4 1 114 24 0 28 4 175Wilkinson 67 1 16 7 0 0 8 31 130Winston 10 4 11 144 35 2 19 19 244Yalobusha 8 16 10 30 2 4 68 4 142Yazoo 42 21 108 96 10 74 56 33 440Total 2,425 2,532 6,067 13,794 2,000 1,835 10,966 10,189 49,808

Fall Enrollment Book 15
location oF on-campUs stUdEnts
By coUntiEs For rEsidEnts oF mississippi
Fall 2017
Total 49,808
682
38783
984164
149
225
115
331146
367
526
398
279123
193
93
400
5732,540
5,502
363218
1,916
20
277
1,767
189
308149 793
70
1,907
1,516
893
154
225
1,474
1,047
488
1,290
2,941
305
356
469
192
287
2,576
258
156
1,333
439
617
112473
360
229
113
2,530243
102
330183
165
552
176
341
159 175124
340
119
937
1,086
168
175
130
244
142
440
295
112

Fall Enrollment Book 16
on-campUs UndErGradUatE HEadcoUnt EnrollmEnt By proGram catEGory
Fall 2017Two-Digit CIP Category ASU DSU JSU MSU MUW MVSU UM USM Total
Agriculture, Agriculture Operations, and Related Sciences - 01 261 0 0 1,021 0 0 0 0 1,282Architecture and Related Services - 04 0 0 0 431 0 0 0 40 471Area, Ethnic, Cultural and Gender Studies - 05 0 0 0 0 2 0 5 0 7Biological and Biomedical Sciences - 26 739 172 927 1,531 83 202 1,182 725 5,561Business, Management, Marketing, and Related Support Services - 52 344 358 879 2,592 418 252 4,281 1,870 10,994Communication, Journalism, and Related Programs - 09 82 0 217 540 43 76 1,504 315 2,777Computer and Information Sciences and Support Services - 11 95 0 159 295 0 77 328 336 1,290Education - 13 144 516 995 1,218 18 218 719 309 4,137Engineering - 14 0 0 498 3,557 0 0 1,241 83 5,379Engineering Technologies/Technicians - 15 16 0 142 261 0 104 0 636 1,159English Language and Literature/Letters - 23 36 21 121 108 51 37 227 153 754Family and Consumer Sciences/Human Sciences - 19 87 132 0 287 24 0 0 595 1,125Foreign Languages, Literatures, and Linguistics - 16 0 1 6 29 2 0 137 41 216Health Professions and Related Clinical Sciences - 51 18 217 442 216 696 17 1,427 868 3,901History - 54 19 20 46 82 29 7 136 146 485Legal Professions and Studies - 22 0 0 0 0 44 15 57 58 174Liberal Arts and Sciences, General Studies and Humanities - 24 133 0 0 52 17 8 447 207 864Library Science - 25 0 0 0 0 0 0 0 77 77Mathematics and Statistics - 27 19 23 48 81 19 23 76 62 351Military Technologies - 29 127 0 0 0 0 0 0 0 127Multi/Interdisciplinary Studies - 30 0 144 323 427 115 0 0 911 1,920Natural Resources and Conservation - 03 0 0 0 456 0 0 0 0 456Parks, Recreation, Leisure and Fitness Studies - 31 109 0 0 1,234 121 182 819 891 3,356Personal and Culinary Services - 12 0 0 0 20 74 0 0 0 94Philosophy and Religious Studies - 38 0 0 0 31 0 0 39 22 92Physical Sciences - 40 61 40 199 624 8 7 357 258 1,554Psychology - 42 150 82 249 645 80 0 735 467 2,408Public Administration and Social Service Professions - 44 135 77 385 159 1 211 415 75 1,458Science Technologies/Technicians - 41 0 25 0 0 0 0 0 0 25Security and Protective Services - 43 122 63 381 0 0 168 529 527 1,790Social Sciences - 45 58 26 121 577 13 43 728 231 1,797Transportation and Materials Moving - 49 0 96 0 0 0 0 0 0 96Undefined - 24.0199 82 191 90 1,091 250 283 1,884 187 4,058Visual and Performing Arts - 50 38 220 226 294 107 47 372 790 2,094Total 2,875 2,424 6,454 17,859 2,215 1,977 17,645 10,880 62,329

Fall Enrollment Book 17
on-campUs GradUatE HEadcoUnt EnrollmEnt By proGram catEGory
Fall 2017Two-Digit CIP Category ASU DSU JSU MSU MUW MVSU UM USM Total
Agriculture, Agriculture Operations, and Related Sciences - 01 34 0 0 96 0 0 0 0 130Architecture and Related Services - 04 0 0 32 11 0 0 0 0 43Area, Ethnic, Cultural and Gender Studies - 05 0 0 0 0 6 0 25 0 31Biological and Biomedical Sciences - 26 20 0 17 241 0 6 45 57 386Business, Management, Marketing, and Related Support Services - 52 66 147 111 334 15 71 337 130 1,211Communication, Journalism, and Related Programs - 09 0 0 11 0 0 27 52 67 157Computer and Information Sciences and Support Services - 11 24 0 68 83 0 0 0 54 229Education - 13 280 390 772 549 22 82 570 504 3,169Engineering - 14 0 0 48 623 0 0 150 71 892Engineering Technologies/Technicians - 15 0 0 31 0 0 0 0 0 31English Language and Literature/Letters - 23 0 0 20 27 28 0 74 68 217Family and Consumer Sciences/Human Sciences - 19 0 0 0 33 0 0 22 88 143Foreign Languages, Literatures, and Linguistics - 16 0 0 0 13 0 0 35 0 48Health Professions and Related Clinical Sciences - 51 10 36 135 410 106 8 535 444 1,684History - 54 0 0 29 58 0 0 48 33 168Legal Professions and Studies - 22 0 0 0 0 0 0 361 0 361Liberal Arts and Sciences, General Studies and Humanities - 24 0 10 0 0 0 0 0 0 10Library Science - 25 0 0 0 0 0 0 0 147 147Mathematics and Statistics - 27 0 0 5 43 0 0 26 6 80Military Technologies - 29 75 0 0 0 0 0 0 0 75Multi/Interdisciplinary Studies - 30 0 9 0 89 0 0 0 1 99Natural Resources and Conservation - 03 0 0 35 136 0 0 0 0 171Parks, Recreation, Leisure and Fitness Studies - 31 0 0 52 72 0 84 64 77 349Philosophy and Religious Studies - 38 0 0 0 0 0 0 7 0 7Physical Sciences - 40 0 0 37 352 0 0 100 47 536Psychology - 42 0 0 32 72 0 0 62 143 309Public Administration and Social Service Professions - 44 0 22 229 33 0 84 2 114 484Science Technologies/Technicians - 41 0 19 0 0 0 0 0 0 19Security and Protective Services - 43 0 27 17 0 0 46 44 19 153Social Sciences - 45 0 0 16 109 0 0 63 37 225Transportation and Materials Moving - 49 0 59 0 0 0 0 0 0 59Undefined - 24.0199 9 20 14 110 13 0 33 59 258Visual and Performing Arts - 50 0 0 0 0 0 0 51 136 187Total 518 739 1,711 3,494 190 408 2,706 2,302 12,068

Fall Enrollment Book 18
8.9%5.9%
20.4%
31.4%33.3%
0.0%
5.0%
10.0%
15.0%
20.0%
25.0%
30.0%
35.0%
Freshman Sophomore Junior Senior Graduate
Undergraduate66.7%
Graduate33.3%
oFF-campUs/dUal campUs dUplicatEd HEadcoUnt EnrollmEnt By lEvEl
Fall 2017Institution Certificate Freshman Sophomore Junior Senior Undergraduate Graduate TotalASU - Natchez 0 53 34 33 66 186 26 212ASU - Vicksburg 0 4 23 42 42 111 0 111DSU - Other Locations 0 588 5 20 30 643 18 661JSU - Universities Center 0 4 10 33 112 159 303 462JSU - Medical Mall 0 0 16 42 80 138 208 346JSU - E Center 0 0 10 56 76 142 98 240JSU - Community College 0 1 18 47 68 134 0 134JSU - Downtown Jackson 0 0 0 0 0 0 102 102MSU - Meridian 0 6 29 137 265 437 85 522MSU - Other Locations 0 3 8 31 44 86 0 86MUW - Tupelo 0 7 105 205 107 424 0 424MUW - Community College 0 0 0 5 3 8 0 8MUW - Other Locations 0 61 0 0 0 61 22 83MVSU - Community College 0 1 9 8 17 35 0 35UM - Tupelo 0 2 40 194 305 541 48 589UM - Booneville 0 0 5 31 42 78 0 78UM - Southaven 0 3 19 163 310 495 25 520UM - Grenada 0 2 9 12 36 59 15 74UM - Medical Center* 0 0 0 320 296 616 2,274 2,890UM - Other Locations 0 0 0 0 0 0 2 2USM - Gulf Park 0 220 321 903 1,606 3,050 404 3,454USM - Stennis Center 0 0 0 0 3 3 46 49USM - Gulf Coast Research Laboratory 0 0 0 0 0 0 45 45USM - Other Locations 0 39 0 0 0 39 0 39Total 0 994 661 2,282 3,508 7,445 3,721 11,166*Includes residents and fellows.

Fall Enrollment Book 19
White, 61.1%
Black, 30.5%
Other, 8.5% Men
32.6%
Women67.4% Resident,
87.1%
Nonresident, 12.9%
oFF-campUs/dUal campUs dUplicatEd HEadcoUnt EnrollmEnt By EtHnicity, By GEndEr, and By rEsidEncE
Fall 2017Institution White Black Other Men Women Resident Nonresident Total
ASU - Natchez 19 9.0% 190 89.6% 3 1.4% 45 21.2% 167 78.8% 169 79.7% 43 20.3% 212ASU - Vicksburg 5 4.5% 105 94.6% 1 0.9% 38 34.2% 73 65.8% 89 80.2% 22 19.8% 111DSU - Other Locations 488 73.8% 145 21.9% 28 4.2% 228 34.5% 433 65.5% 653 98.8% 8 1.2% 661JSU - Universities Center 30 6.5% 421 91.1% 11 2.4% 100 21.6% 362 78.4% 439 95.0% 23 5.0% 462JSU - Medical Mall 52 15.0% 284 82.1% 10 2.9% 39 11.3% 307 88.7% 287 82.9% 59 17.1% 346JSU - E Center 5 2.1% 225 93.8% 10 4.2% 101 42.1% 139 57.9% 168 70.0% 72 30.0% 240JSU - Community College 11 8.2% 122 91.0% 1 0.7% 17 12.7% 117 87.3% 122 91.0% 12 9.0% 134JSU - Downtown Jackson 10 9.8% 88 86.3% 4 3.9% 31 30.4% 71 69.6% 91 89.2% 11 10.8% 102MSU - Meridian 287 55.0% 192 36.8% 43 8.2% 135 25.9% 387 74.1% 506 96.9% 16 3.1% 522MSU - Other Locations 69 80.2% 7 8.1% 10 11.6% 75 87.2% 11 12.8% 81 94.2% 5 5.8% 86MUW - Tupelo 258 60.8% 162 38.2% 4 0.9% 49 11.6% 375 88.4% 400 94.3% 24 5.7% 424MUW - Community College 3 37.5% 5 62.5% 0 0.0% 1 12.5% 7 87.5% 8 100.0% 0 0.0% 8MUW - Other Locations 70 84.3% 10 12.0% 3 3.6% 35 42.2% 48 57.8% 60 72.3% 23 27.7% 83MVSU - Community College 1 2.9% 31 88.6% 3 8.6% 4 11.4% 31 88.6% 32 91.4% 3 8.6% 35UM - Tupelo 456 77.4% 102 17.3% 31 5.3% 202 34.3% 387 65.7% 545 92.5% 44 7.5% 589UM - Booneville 68 87.2% 10 12.8% 0 0.0% 25 32.1% 53 67.9% 76 97.4% 2 2.6% 78UM - Southaven 346 66.5% 127 24.4% 47 9.0% 183 35.2% 337 64.8% 472 90.8% 48 9.2% 520UM - Grenada 34 45.9% 40 54.1% 0 0.0% 17 23.0% 57 77.0% 72 97.3% 2 2.7% 74UM - Medical Center* 2,166 74.9% 344 11.9% 380 13.1% 1,071 37.1% 1,819 62.9% 2,414 83.5% 476 16.5% 2,890UM - Other Locations 2 100.0% 0 0.0% 0 0.0% 1 50.0% 1 50.0% 2 100.0% 0 0.0% 2USM - Gulf Park 2,331 67.5% 780 22.6% 343 9.9% 1,177 34.1% 2,277 65.9% 2,957 85.6% 497 14.4% 3,454USM - Stennis Center 37 75.5% 10 20.4% 2 4.1% 23 46.9% 26 53.1% 21 42.9% 28 57.1% 49USM - Gulf Coast Research Laboratory 35 77.8% 1 2.2% 9 20.0% 21 46.7% 24 53.3% 23 51.1% 22 48.9% 45USM - Other Locations 35 89.7% 3 7.7% 1 2.6% 18 46.2% 21 53.8% 39 100.0% 0 0.0% 39Total 6,818 61.1% 3,404 30.5% 944 8.5% 3,636 32.6% 7,530 67.4% 9,726 87.1% 1,440 12.9% 11,166*Includes residents and fellows.

Fall Enrollment Book 20
Full-Time49.9%
Part-Time50.1%
Lower UG FTE10.1%
Upper UG FTE49.6%
Graduate FTE40.3%
oFF-campUs/dUal campUs dUplicatEd HEadcoUnt EnrollmEnt By FUll-timE and part-timE and FUll-timE
EqUivalEnt (FtE) EnrollmEnt By lEvEl
Fall 2017Headcount Full-Time Equivalent
Percent FTE PercentInstitution Full-Time Part-Time Total Part-Time Lower Upper Graduate Total of Headcount
ASU - Natchez 182 30 212 14.2% 82.6 94.3 20.8 197.7 93.3%ASU - Vicksburg 101 10 111 9.0% 26.5 85.2 0.0 111.7 100.6%DSU - Other Locations 45 616 661 93.2% 157.8 42.2 6.0 206.0 31.2%JSU - Universities Center 44 418 462 90.5% 5.4 50.8 114.5 170.7 36.9%JSU - Medical Mall 70 276 346 79.8% 4.2 50.3 80.9 135.4 39.1%JSU - E Center 36 204 240 85.0% 3.2 62.4 36.4 102.0 42.5%JSU - Community College 0 134 134 100.0% 4.8 32.0 0.0 36.8 27.5%JSU - Downtown Jackson 5 97 102 95.1% 0.0 0.0 30.6 30.6 30.0%MSU - Meridian 301 221 522 42.3% 24.1 309.5 41.7 375.3 71.9%MSU - Other Locations 42 44 86 51.2% 3.6 55.9 0.0 59.5 69.2%MUW - Tupelo 328 96 424 22.6% 81.4 262.1 0.0 343.5 81.0%MUW - Community College 0 8 8 100.0% 0.0 3.0 0.0 3.0 37.5%MUW - Other Locations 8 75 83 90.4% 14.0 0.0 16.0 30.0 36.1%MVSU - Community College 0 35 35 100.0% 3.6 6.4 0.0 10.0 28.6%UM - Tupelo 220 369 589 62.6% 28.8 270.2 30.7 329.7 56.0%UM - Booneville 29 49 78 62.8% 2.8 42.8 0.0 45.6 58.5%UM - Southaven 230 290 520 55.8% 12.4 307.6 11.0 331.0 63.7%UM - Grenada 23 51 74 68.9% 6.0 26.4 9.2 41.6 56.2%UM - Medical Center* 2,890 0 2,890 0.0% 0.0 616.0 2,274.0 2,890.0 100.0%UM - Other Locations 0 2 2 100.0% 0.0 0.0 0.5 0.5 25.0%USM - Gulf Park 944 2,510 3,454 72.7% 257.1 1,258.2 168.5 1,683.8 48.7%USM - Stennis Center 35 14 49 28.6% 0.0 0.8 35.5 36.3 74.1%USM - Gulf Coast Research Laboratory 34 11 45 24.4% 0.0 0.0 29.1 29.1 64.7%USM - Other Locations 0 39 39 100.0% 7.8 0.0 0.0 7.8 20.0%Total 5,567 5,599 11,166 50.1% 726.1 3,576.1 2,905.4 7,207.6 64.5%* All Health Professional students are considered full-time. Includes residents and fellows.Note: Full-time equivalent enrollment data are rounded to the nearest tenth.

Fall Enrollment Book 21
oFF-campUs/dUal campUs dUplicatEd GradUatE HEadcoUnt EnrollmEnt
By acadEmic proGram lEvEls and By FUll-timE and part-timE
Fall 2017Certificate Master’s Specialist Professional Doctoral Unclassified Total
Full Part Full Part Full Part Full Part Full Part Full Part All Institution Time Time Total Time Time Total Time Time Total Time Time Total Time Time Total Time Time Total Programs
ASU - Natchez 0 0 0 22 4 26 0 0 0 0 0 0 0 0 0 0 0 0 26DSU - Other Locations 0 0 0 0 0 0 0 0 0 0 0 0 0 18 18 0 0 0 18JSU - Downtown Jackson 0 0 0 4 28 32 0 0 0 0 0 0 1 69 70 0 0 0 102JSU - E-Center 0 0 0 1 21 22 0 0 0 0 0 0 17 59 76 0 0 0 98JSU - Medical Mall 0 0 0 39 78 117 0 0 0 0 0 0 7 83 90 0 1 1 208JSU - Universities Center 0 0 0 34 167 201 0 0 0 0 0 0 2 98 100 1 1 2 303MSU - Meridian 0 0 0 16 58 74 5 6 11 0 0 0 0 0 0 0 0 0 85MUW - Other 0 0 0 8 14 22 0 0 0 0 0 0 0 0 0 0 0 0 22UM - Grenada 0 0 0 1 5 6 3 4 7 0 0 0 0 1 1 0 1 1 15UM - Southaven 0 0 0 0 15 15 0 8 8 0 0 0 0 2 2 0 0 0 25UM - Tupelo 0 0 0 22 19 41 2 4 6 0 0 0 0 1 1 0 0 0 48UM - Medical Center* 18 0 18 507 0 507 0 0 0 1,391 0 1,391 331 0 331 27 0 27 2,274UM - Other 0 0 0 0 1 1 0 0 0 0 0 0 0 0 0 0 1 1 2USM - Gulf Coast Research Laboratory 0 0 0 22 7 29 0 0 0 0 0 0 12 4 16 0 0 0 45USM - Gulf Park 0 0 0 48 201 249 0 0 0 0 0 0 23 120 143 0 12 12 404USM - Stennis Center 0 0 0 24 6 30 0 0 0 0 0 0 11 4 15 0 1 1 46Total 18 0 18 748 624 1,372 10 22 32 1,391 0 1,391 404 459 863 28 17 45 3,721*Includes residents and fellows.
Fall Enrollment Book 22
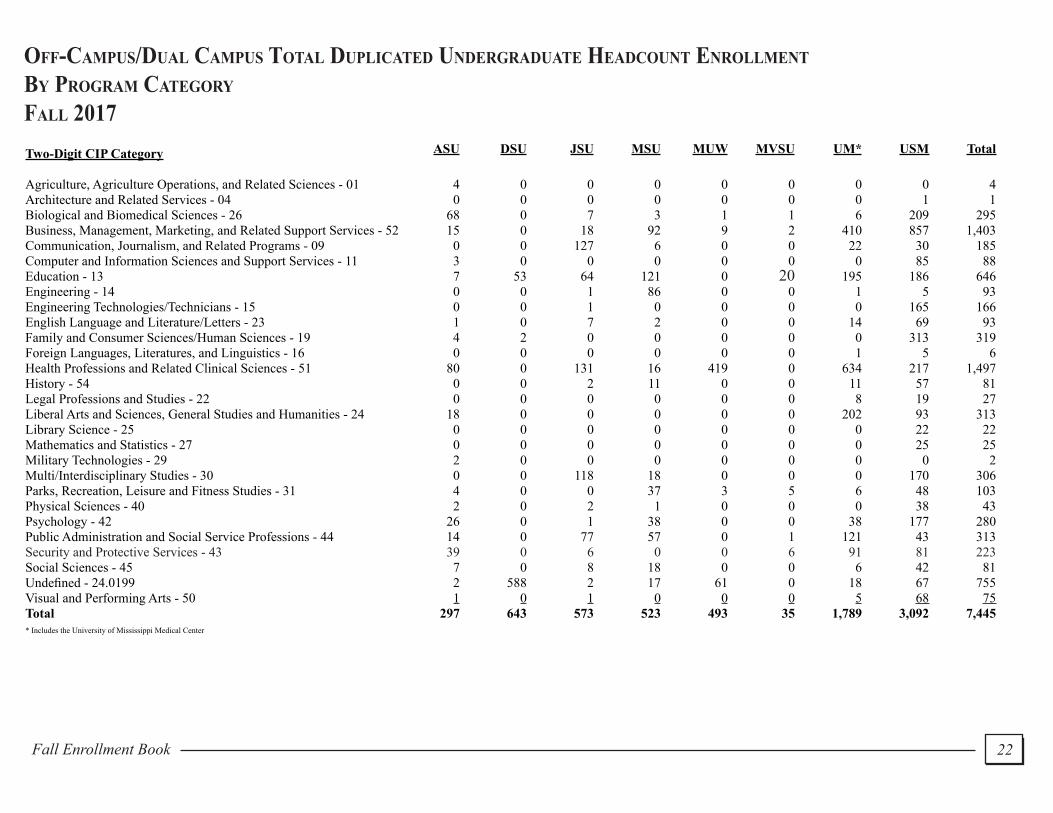
oFF-campUs/dUal campUs total dUplicatEd UndErGradUatE HEadcoUnt EnrollmEnt By proGram catEGory
Fall 2017Two-Digit CIP Category ASU DSU JSU MSU MUW MVSU UM* USM Total
Agriculture, Agriculture Operations, and Related Sciences - 01 4 0 0 0 0 0 0 0 4Architecture and Related Services - 04 0 0 0 0 0 0 0 1 1Biological and Biomedical Sciences - 26 68 0 7 3 1 1 6 209 295Business, Management, Marketing, and Related Support Services - 52 15 0 18 92 9 2 410 857 1,403Communication, Journalism, and Related Programs - 09 0 0 127 6 0 0 22 30 185Computer and Information Sciences and Support Services - 11 3 0 0 0 0 0 0 85 88Education - 13 7 53 64 121 0 20 195 186 646Engineering - 14 0 0 1 86 0 0 1 5 93Engineering Technologies/Technicians - 15 0 0 1 0 0 0 0 165 166English Language and Literature/Letters - 23 1 0 7 2 0 0 14 69 93Family and Consumer Sciences/Human Sciences - 19 4 2 0 0 0 0 0 313 319Foreign Languages, Literatures, and Linguistics - 16 0 0 0 0 0 0 1 5 6Health Professions and Related Clinical Sciences - 51 80 0 131 16 419 0 634 217 1,497History - 54 0 0 2 11 0 0 11 57 81Legal Professions and Studies - 22 0 0 0 0 0 0 8 19 27Liberal Arts and Sciences, General Studies and Humanities - 24 18 0 0 0 0 0 202 93 313Library Science - 25 0 0 0 0 0 0 0 22 22Mathematics and Statistics - 27 0 0 0 0 0 0 0 25 25Military Technologies - 29 2 0 0 0 0 0 0 0 2Multi/Interdisciplinary Studies - 30 0 0 118 18 0 0 0 170 306Parks, Recreation, Leisure and Fitness Studies - 31 4 0 0 37 3 5 6 48 103Physical Sciences - 40 2 0 2 1 0 0 0 38 43Psychology - 42 26 0 1 38 0 0 38 177 280Public Administration and Social Service Professions - 44 14 0 77 57 0 1 121 43 313Security and Protective Services - 43 39 0 6 0 0 6 91 81 223Social Sciences - 45 7 0 8 18 0 0 6 42 81Undefined - 24.0199 2 588 2 17 61 0 18 67 755Visual and Performing Arts - 50 1 0 1 0 0 0 5 68 75Total 297 643 573 523 493 35 1,789 3,092 7,445* Includes the University of Mississippi Medical Center

Fall Enrollment Book 23
oFF-campUs/dUal campUs total dUplicatEd GradUatE HEadcoUnt EnrollmEnt
By proGram catEGory
Fall 2017Two-Digit CIP Category ASU DSU JSU MSU MUW MVSU UM* USM Total
Architecture and Related Services - 04 0 0 77 0 0 0 0 0 77Biological and Biomedical Sciences - 26 0 0 0 0 0 0 141 45 186Business, Management, Marketing, and Related Support Services - 52 16 0 1 0 0 0 2 169 188Communication, Journalism, and Related Programs - 09 0 0 21 0 0 0 0 2 23Computer and Information Sciences and Support Services - 11 0 0 2 0 0 0 0 7 9Education - 13 0 18 84 78 0 0 76 18 274Engineering - 14 0 0 3 0 0 0 6 0 9English Language and Literature/Letters - 23 0 0 0 0 0 0 0 1 1Family and Consumer Sciences/Human Sciences - 19 0 0 0 0 0 0 0 27 27Health Professions and Related Clinical Sciences - 51 10 0 212 0 0 0 2,101 29 2,352History - 54 0 0 0 0 0 0 0 2 2Library Science - 25 0 0 0 0 0 0 0 1 1Natural Resources and Conservation - 03 0 0 9 0 0 0 0 0 9Parks, Recreation, Leisure, and Fitness Studies - 31 0 0 1 0 0 0 0 1 2Physical Sciences - 40 0 0 0 0 0 0 0 45 45Public Administration and Social Service Professions - 44 0 0 300 0 0 0 0 61 361Security and Protective Services - 43 0 0 0 0 0 0 9 0 9Social Sciences - 45 0 0 0 0 0 0 0 78 78Undefined - 24.0199 0 0 1 7 0 0 29 9 46Visual and Performing Arts - 50 0 0 0 0 22 0 0 0 22Total 26 18 711 85 22 0 2,364 495 3,721* Includes the University of Mississippi Medical Center

a tEn-yEar EnrollmEnt comparison

Fall Enrollment Book 25
systEm EnrollmEnt By EtHnicity, GEndEr, rEsidEncy, lEvEl, aGE and FtE
Non- Under- 25 and Age Total TotalFall Session White Black Other Men Women Resident Resident graduate Graduate Under 25 Over Unknown FTE Headcount2007 40,786 26,308 3,705 29,609 41,190 56,462 14,337 56,549 14,435 48,319 22,478 3 61,471.9 70,7992008 40,713 26,064 4,425 29,800 41,402 56,657 14,545 56,383 14,618 48,635 22,567 1 61,680.2 71,2022009 41,806 27,114 4,792 30,796 42,916 58,453 15,259 57,811 15,401 49,774 23,936 1 64,111.2 73,7122010 43,014 27,741 6,132 32,327 44,560 60,032 16,855 59,805 16,597 52,183 24,704 2 67,001.8 76,8872011 45,062 29,055 6,399 33,468 47,048 61,917 18,599 62,685 17,005 55,420 25,094 2 69,850.6 80,5162012 45,825 28,924 6,273 33,764 47,258 61,337 19,685 64,002 17,156 56,539 24,483 0 70,492.5 81,0222013 45,986 28,083 6,231 33,357 46,943 59,152 21,148 64,488 17,031 56,931 23,369 0 70,743.8 80,3002014 45,616 27,592 6,497 33,419 46,286 58,176 21,529 64,508 15,654 57,323 22,382 0 70,769.9 79,7052015 46,548 27,625 6,851 33,807 47,217 57,663 23,361 65,674 15,591 59,412 21,612 0 72,472.8 81,0242016 47,603 27,724 7,327 34,413 48,241 57,715 24,939 66,984 15,669 61,798 20,856 0 75,198.2 82,6542017 47,636 26,581 7,161 33,983 47,395 55,899 25,479 66,131 15,247 61,802 19,576 0 74,817.2 81,378%Change 2007 to 2012 12.4% 9.9% 69.3% 14.0% 14.7% 8.6% 37.3% 13.2% 18.9% 17.0% 8.9% -100.0% 14.7% 14.4%%Change 2012 to 2017 4.0% -8.1% 14.2% 0.6% 0.3% -8.9% 29.4% 3.3% -11.1% 9.3% -20.0% N/A 6.1% 0.4%%Change 2007 to 2017 16.8% 1.0% 93.3% 14.8% 15.1% -1.0% 77.7% 16.9% 5.6% 27.9% -12.9% -100.0% 21.7% 14.9%
Percent of TotalNon- Under- 25 and Total
Fall Session White Black Other Men Women Resident Resident graduate Graduate Under 25 Over FTE2007 57.6% 37.2% 5.2% 41.8% 58.2% 79.7% 20.3% 79.9% 20.4% 68.2% 31.7% 86.8%2008 57.2% 36.6% 6.2% 41.9% 58.1% 79.6% 20.4% 79.2% 20.5% 68.3% 31.7% 86.6%2009 56.7% 36.8% 6.5% 41.8% 58.2% 79.3% 20.7% 78.4% 20.9% 67.5% 32.5% 87.0%2010 55.9% 36.1% 8.0% 42.0% 58.0% 78.1% 21.9% 77.8% 21.6% 67.9% 32.1% 87.1%2011 56.0% 36.1% 7.9% 41.6% 58.4% 76.9% 23.1% 77.9% 21.1% 68.8% 31.2% 86.8%2012 56.6% 35.7% 7.7% 41.7% 58.3% 75.7% 24.3% 79.0% 21.2% 69.8% 30.2% 87.0%2013 57.3% 35.0% 7.8% 41.5% 58.5% 73.7% 26.3% 80.3% 21.2% 70.9% 29.1% 88.1%2014 57.2% 34.6% 8.2% 41.9% 58.1% 73.0% 27.0% 80.9% 19.6% 71.9% 28.1% 88.8%2015 57.4% 34.1% 8.5% 41.7% 58.3% 71.2% 28.8% 81.1% 19.2% 73.3% 26.7% 89.4%2016 57.6% 33.5% 8.9% 41.6% 58.4% 69.8% 30.2% 81.0% 19.0% 74.8% 25.2% 91.0%2017 58.5% 32.7% 8.8% 41.8% 58.2% 68.7% 31.3% 81.3% 18.7% 75.9% 24.1% 91.9%
Notes: Percents may not add to 100% due to rounding. Enrollment figures are unduplicated.

Fall Enrollment Book 26
70,799 71,202 73,712 76,887 80,516 81,022 80,300 79,705 81,024 82,654 81,378
010,00020,00030,00040,00050,00060,00070,00080,00090,000
100,000
2007 2008 2009 2010 2011 2012 2013 2014 2015 2016 2017
Total Headcount Enrollment for the Fall Semester
61,471.9 61,680.2 64,111.2 67,001.8 69,850.6 70,492.5 70,743.8 70,769.9 72,472.8 75,198.2 74,817.2
0.010,000.020,000.030,000.040,000.050,000.060,000.070,000.080,000.090,000.0
100,000.0
2007 2008 2009 2010 2011 2012 2013 2014 2015 2016 2017
Total FTE Enrollment for the Fall Semester
systEm total FtE and total HEadcoUnt EnrollmEnt

Fall Enrollment Book 27
alcorn statE UnivErsity EnrollmEnt By EtHnicity, GEndEr, rEsidEncy, lEvEl, aGE and FtE
Non- Under- 25 and Age Total TotalFall Session White Black Other Men Women Resident Resident graduate Graduate Under 25 Over Unknown FTE Headcount2007 312 3,315 41 1,198 2,470 3,186 482 3,004 664 2,355 1,313 0 3,259.2 3,6682008 238 2,967 47 1,036 2,216 2,866 386 2,626 626 2,113 1,139 0 2,891.9 3,2522009 214 3,066 54 1,055 2,279 2,933 401 2,700 634 2,092 1,242 0 2,913.3 3,3342010 240 3,378 64 1,172 2,510 3,217 465 2,980 702 2,319 1,363 0 3,240.4 3,6822011 212 3,741 65 1,288 2,730 3,535 483 3,296 722 2,530 1,488 0 3,463.5 4,0182012 193 3,694 63 1,302 2,648 3,451 499 3,208 742 2,513 1,437 0 3,454.9 3,9502013 173 3,621 54 1,285 2,563 3,368 480 3,157 691 2,452 1,396 0 3,332.0 3,8482014 132 3,445 62 1,244 2,395 3,169 470 3,006 633 2,427 1,212 0 3,154.0 3,6392015 130 3,229 159 1,226 2,292 2,838 680 2,911 607 2,474 1,044 0 3,138.6 3,5182016 144 3,168 108 1,208 2,212 2,591 829 2,825 595 2,520 900 0 3,152.8 3,4202017 136 3,477 103 1,300 2,416 2,683 1,033 3,172 544 2,861 855 0 3,502.1 3,716%Change 2007 to 2012 -38.1% 11.4% 53.7% 8.7% 7.2% 8.3% 3.5% 6.8% 11.7% 6.7% 9.4% N/A 6.0% 7.7%%Change 2012 to 2017 -29.5% -5.9% 63.5% -0.2% -8.8% -22.3% 107.0% -1.1% -26.7% 13.8% -40.5% N/A 1.4% -5.9%%Change 2007 to 2017 -56.4% 4.9% 151.2% 8.5% -2.2% -15.8% 114.3% 5.6% -18.1% 21.5% -34.9% N/A 7.5% 1.3%
Percent of TotalNon- Under- 25 and Total
Fall Session White Black Other Men Women Resident Resident graduate Graduate Under 25 Over FTE2007 8.5% 90.4% 1.1% 32.7% 67.3% 86.9% 13.1% 81.9% 18.1% 64.2% 35.8% 88.9%2008 7.3% 91.2% 1.4% 31.9% 68.1% 88.1% 11.9% 80.8% 19.2% 65.0% 35.0% 88.9%2009 6.4% 92.0% 1.6% 31.6% 68.4% 88.0% 12.0% 81.0% 19.0% 62.7% 37.3% 87.4%2010 6.5% 91.7% 1.7% 31.8% 68.2% 87.4% 12.6% 80.9% 19.1% 63.0% 37.0% 88.0%2011 5.3% 93.1% 1.6% 32.1% 67.9% 88.0% 12.0% 82.0% 18.0% 63.0% 37.0% 86.2%2012 4.9% 93.5% 1.6% 33.0% 67.0% 87.4% 12.6% 81.2% 18.8% 63.6% 36.4% 87.5%2013 4.5% 94.1% 1.4% 33.4% 66.6% 87.5% 12.5% 82.0% 18.0% 63.7% 36.3% 86.6%2014 3.6% 94.7% 1.7% 34.2% 65.8% 87.1% 12.9% 82.6% 17.4% 66.7% 33.3% 86.7%2015 3.7% 91.8% 4.5% 34.8% 65.2% 80.7% 19.3% 82.7% 17.3% 70.3% 29.7% 89.2%2016 4.2% 92.6% 3.2% 35.3% 64.7% 75.8% 24.2% 82.6% 17.4% 73.7% 26.3% 92.2%2017 3.7% 93.6% 2.8% 35.0% 65.0% 72.2% 27.8% 85.4% 14.6% 77.0% 23.0% 94.2%
Notes: Percents may not add to 100% due to rounding. Enrollment figures are unduplicated.

Fall Enrollment Book 28
3,6683,252 3,334
3,6824,018 3,950 3,848 3,639 3,518 3,420
3,716
0500
1,0001,5002,0002,5003,0003,5004,0004,5005,000
2007 2008 2009 2010 2011 2012 2013 2014 2015 2016 2017
Total Headcount Enrollment for the Fall Semester
3,259.22,891.9 2,913.3
3,240.43,463.5 3,454.9 3,332.0 3,154.0 3,138.6 3,152.8
3,502.1
0.0500.0
1,000.01,500.02,000.02,500.03,000.03,500.04,000.04,500.05,000.0
2007 2008 2009 2010 2011 2012 2013 2014 2015 2016 2017
Total FTE Enrollment for the Fall Semester
alcorn statE UnivErsity total FtE and total HEadcoUnt EnrollmEnt

Fall Enrollment Book 29
dElta statE UnivErsity EnrollmEnt By EtHnicity, GEndEr, rEsidEncy, lEvEl, aGE and FtE
Non- Under- 25 and Age Total TotalFall Session White Black Other Men Women Resident Resident graduate Graduate Under 25 Over Unknown FTE Headcount2007 2,312 1,709 70 1,437 2,654 3,744 347 3,356 735 2,700 1,390 1 3,365.7 4,0912008 2,377 1,619 68 1,506 2,558 3,708 356 3,212 852 2,605 1,459 0 3,271.0 4,0642009 2,299 1,642 90 1,475 2,556 3,621 410 3,115 916 2,486 1,545 0 3,201.7 4,0312010 2,574 1,623 130 1,565 2,762 3,405 922 2,948 1,379 2,875 1,452 0 3,334.2 4,3272011 2,779 1,590 255 1,584 3,040 3,354 1,270 2,880 1,744 3,127 1,495 2 3,625.9 4,6242012 2,870 1,566 327 1,674 3,089 3,237 1,526 2,756 2,007 3,339 1,424 0 3,754.4 4,7632013 2,852 1,550 383 1,649 3,136 3,097 1,688 2,638 2,147 3,356 1,429 0 3,753.9 4,7852014 2,102 1,340 172 1,370 2,244 3,116 498 2,778 836 2,454 1,160 0 2,955.8 3,6142015 2,016 1,242 202 1,306 2,154 2,923 537 2,659 801 2,363 1,097 0 2,876.4 3,4602016 2,118 1,221 249 1,414 2,174 2,972 616 2,766 822 2,507 1,081 0 2,986.1 3,5882017 2,300 1,240 249 1,471 2,318 3,152 637 3,041 748 2,795 994 0 2,973.7 3,789%Change 2007 to 2012 24.1% -8.4% 367.1% 16.5% 16.4% -13.5% 339.8% -17.9% 173.1% 23.7% 2.4% N/A 11.5% 16.4%%Change 2012 to 2017 -19.9% -20.8% -23.9% -12.1% -25.0% -2.6% -58.3% 10.3% -62.7% -16.3% -30.2% N/A -20.8% -20.4%%Change 2007 to 2017 -0.5% -27.4% 255.7% 2.4% -12.7% -15.8% 83.6% -9.4% 1.8% 3.5% -28.5% N/A -11.6% -7.4%
Percent of TotalNon- Under- 25 and Total
Fall Session White Black Other Men Women Resident Resident graduate Graduate Under 25 Over FTE2007 56.5% 41.8% 1.7% 35.1% 64.9% 91.5% 8.5% 82.0% 18.0% 66.0% 34.0% 82.3%2008 58.5% 39.8% 1.7% 37.1% 62.9% 91.2% 8.8% 79.0% 21.0% 64.1% 35.9% 80.5%2009 57.0% 40.7% 2.2% 36.6% 63.4% 89.8% 10.2% 77.3% 22.7% 61.7% 38.3% 79.4%2010 59.5% 37.5% 3.0% 36.2% 63.8% 78.7% 21.3% 68.1% 31.9% 66.4% 33.6% 77.1%2011 60.1% 34.4% 5.5% 34.3% 65.7% 72.5% 27.5% 62.3% 37.7% 67.6% 32.3% 78.4%2012 60.3% 32.9% 6.9% 35.1% 64.9% 68.0% 32.0% 57.9% 42.1% 70.1% 29.9% 78.8%2013 59.6% 32.4% 8.0% 34.5% 65.5% 64.7% 35.3% 55.1% 44.9% 70.1% 29.9% 78.5%2014 58.2% 37.1% 4.8% 37.9% 62.1% 86.2% 13.8% 76.9% 23.1% 67.9% 32.1% 81.8%2015 58.3% 35.9% 5.8% 37.7% 62.3% 84.5% 15.5% 76.8% 23.2% 68.3% 31.7% 83.1%2016 59.0% 34.0% 6.9% 39.4% 60.6% 82.8% 17.2% 77.1% 22.9% 69.9% 30.1% 83.2%2017 60.7% 32.7% 6.6% 38.8% 61.2% 83.2% 16.8% 80.3% 19.7% 73.8% 26.2% 78.5%
Notes: Percents may not add to 100% due to rounding. Enrollment figures are unduplicated.

Fall Enrollment Book 30
4,091 4,064 4,0314,327
4,624 4,763 4,785
3,614 3,460 3,588 3,789
0500
1,0001,5002,0002,5003,0003,5004,0004,5005,000
2007 2008 2009 2010 2011 2012 2013 2014 2015 2016 2017
Total Headcount Enrollment for the Fall Semester
3,365.7 3,271.0 3,201.7 3,334.23,625.9 3,754.4 3,753.9
2,955.8 2,876.4 2,986.1 2,973.7
0.0500.0
1,000.01,500.02,000.02,500.03,000.03,500.04,000.04,500.05,000.0
2007 2008 2009 2010 2011 2012 2013 2014 2015 2016 2017
Total FTE Enrollment for the Fall Semester
dElta statE UnivErsity total FtE and total HEadcoUnt EnrollmEnt
Fall Enrollment Book 31
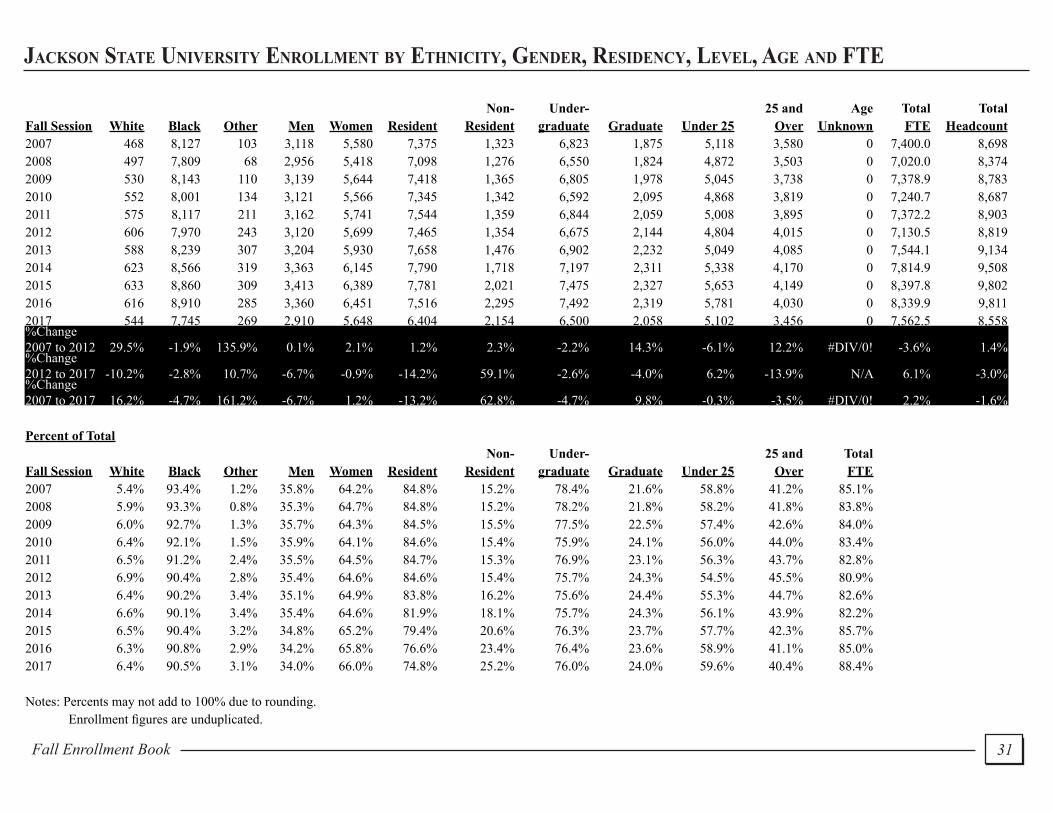
Jackson statE UnivErsity EnrollmEnt By EtHnicity, GEndEr, rEsidEncy, lEvEl, aGE and FtE
Non- Under- 25 and Age Total TotalFall Session White Black Other Men Women Resident Resident graduate Graduate Under 25 Over Unknown FTE Headcount2007 468 8,127 103 3,118 5,580 7,375 1,323 6,823 1,875 5,118 3,580 0 7,400.0 8,6982008 497 7,809 68 2,956 5,418 7,098 1,276 6,550 1,824 4,872 3,503 0 7,020.0 8,3742009 530 8,143 110 3,139 5,644 7,418 1,365 6,805 1,978 5,045 3,738 0 7,378.9 8,7832010 552 8,001 134 3,121 5,566 7,345 1,342 6,592 2,095 4,868 3,819 0 7,240.7 8,6872011 575 8,117 211 3,162 5,741 7,544 1,359 6,844 2,059 5,008 3,895 0 7,372.2 8,9032012 606 7,970 243 3,120 5,699 7,465 1,354 6,675 2,144 4,804 4,015 0 7,130.5 8,8192013 588 8,239 307 3,204 5,930 7,658 1,476 6,902 2,232 5,049 4,085 0 7,544.1 9,1342014 623 8,566 319 3,363 6,145 7,790 1,718 7,197 2,311 5,338 4,170 0 7,814.9 9,5082015 633 8,860 309 3,413 6,389 7,781 2,021 7,475 2,327 5,653 4,149 0 8,397.8 9,8022016 616 8,910 285 3,360 6,451 7,516 2,295 7,492 2,319 5,781 4,030 0 8,339.9 9,8112017 544 7,745 269 2,910 5,648 6,404 2,154 6,500 2,058 5,102 3,456 0 7,562.5 8,558%Change 2007 to 2012 29.5% -1.9% 135.9% 0.1% 2.1% 1.2% 2.3% -2.2% 14.3% -6.1% 12.2% #DIV/0! -3.6% 1.4%%Change 2012 to 2017 -10.2% -2.8% 10.7% -6.7% -0.9% -14.2% 59.1% -2.6% -4.0% 6.2% -13.9% N/A 6.1% -3.0%%Change 2007 to 2017 16.2% -4.7% 161.2% -6.7% 1.2% -13.2% 62.8% -4.7% 9.8% -0.3% -3.5% #DIV/0! 2.2% -1.6%
Percent of TotalNon- Under- 25 and Total
Fall Session White Black Other Men Women Resident Resident graduate Graduate Under 25 Over FTE2007 5.4% 93.4% 1.2% 35.8% 64.2% 84.8% 15.2% 78.4% 21.6% 58.8% 41.2% 85.1%2008 5.9% 93.3% 0.8% 35.3% 64.7% 84.8% 15.2% 78.2% 21.8% 58.2% 41.8% 83.8%2009 6.0% 92.7% 1.3% 35.7% 64.3% 84.5% 15.5% 77.5% 22.5% 57.4% 42.6% 84.0%2010 6.4% 92.1% 1.5% 35.9% 64.1% 84.6% 15.4% 75.9% 24.1% 56.0% 44.0% 83.4%2011 6.5% 91.2% 2.4% 35.5% 64.5% 84.7% 15.3% 76.9% 23.1% 56.3% 43.7% 82.8%2012 6.9% 90.4% 2.8% 35.4% 64.6% 84.6% 15.4% 75.7% 24.3% 54.5% 45.5% 80.9%2013 6.4% 90.2% 3.4% 35.1% 64.9% 83.8% 16.2% 75.6% 24.4% 55.3% 44.7% 82.6%2014 6.6% 90.1% 3.4% 35.4% 64.6% 81.9% 18.1% 75.7% 24.3% 56.1% 43.9% 82.2%2015 6.5% 90.4% 3.2% 34.8% 65.2% 79.4% 20.6% 76.3% 23.7% 57.7% 42.3% 85.7%2016 6.3% 90.8% 2.9% 34.2% 65.8% 76.6% 23.4% 76.4% 23.6% 58.9% 41.1% 85.0%2017 6.4% 90.5% 3.1% 34.0% 66.0% 74.8% 25.2% 76.0% 24.0% 59.6% 40.4% 88.4%
Notes: Percents may not add to 100% due to rounding. Enrollment figures are unduplicated.

Fall Enrollment Book 32
8,698 8,374 8,783 8,687 8,903 8,819 9,134 9,508 9,802 9,811
8,558
01,0002,0003,0004,0005,0006,0007,0008,0009,000
10,000
2007 2008 2009 2010 2011 2012 2013 2014 2015 2016 2017
Total Headcount Enrollment for the Fall Semester
7,400.0 7,020.0 7,378.9 7,240.7 7,372.2 7,130.5 7,544.1 7,814.98,397.8 8,339.9
7,562.5
0.01,000.02,000.03,000.04,000.05,000.06,000.07,000.08,000.09,000.0
10,000.0
2007 2008 2009 2010 2011 2012 2013 2014 2015 2016 2017
Total FTE Enrollment for the Fall Semester
Jackson statE UnivErsity total FtE and total HEadcoUnt EnrollmEnt

Fall Enrollment Book 33
mississippi statE UnivErsity EnrollmEnt By EtHnicity, GEndEr, rEsidEncy, lEvEl, aGE and FtE
Non- Under- 25 and Age Total TotalFall Session White Black Other Men Women Resident Resident graduate Graduate Under 25 Over Unknown FTE Headcount2007 12,491 3,351 1,197 8,834 8,205 13,084 3,955 13,208 3,831 12,330 4,709 0 14,496.7 17,0392008 12,851 3,622 1,351 9,126 8,698 13,571 4,253 13,991 3,833 13,145 4,679 0 15,274.2 17,8242009 13,267 3,676 1,658 9,544 9,057 13,959 4,642 14,602 3,999 13,752 4,849 0 16,068.2 18,6012010 13,704 3,893 2,047 10,157 9,487 14,412 5,232 15,543 4,101 14,659 4,985 0 16,999.1 19,6442011 14,114 4,232 2,078 10,504 9,920 14,856 5,568 16,312 4,112 15,495 4,929 0 17,828.4 20,4242012 14,230 4,168 1,967 10,492 9,873 14,619 5,746 16,390 3,975 15,597 4,768 0 17,871.1 20,3652013 14,261 3,948 1,952 10,406 9,755 14,186 5,975 16,399 3,762 15,756 4,405 0 17,833.5 20,1612014 14,209 3,871 2,058 10,352 9,786 13,871 6,267 16,536 3,602 16,036 4,102 0 17,927.2 20,1382015 14,744 4,022 2,107 10,633 10,240 14,096 6,777 17,421 3,452 16,833 4,040 0 18,669.0 20,8732016 15,276 4,148 2,198 10,917 10,705 14,349 7,273 18,090 3,532 17,654 3,968 0 20,012.4 21,6222017 15,613 4,154 2,116 11,031 10,852 14,308 7,575 18,312 3,571 17,864 4,019 0 20,307.0 21,883%Change 2007 to 2012 13.9% 24.4% 64.3% 18.8% 20.3% 11.7% 45.3% 24.1% 3.8% 26.5% 1.3% N/A 23.3% 19.5%%Change 2012 to 2017 9.7% -0.3% 7.6% 5.1% 9.9% -2.1% 31.8% 11.7% -10.2% 14.5% -15.7% N/A 13.6% 7.5%%Change 2007 to 2017 25.0% 24.0% 76.8% 24.9% 32.3% 9.4% 91.5% 38.6% -6.8% 44.9% -14.7% N/A 40.1% 28.4%
Percent of TotalNon- Under- 25 and Total
Fall Session White Black Other Men Women Resident Resident graduate Graduate Under 25 Over FTE2007 73.3% 19.7% 7.0% 51.8% 48.2% 76.8% 23.2% 77.5% 22.5% 72.4% 27.6% 85.1%2008 72.1% 20.3% 7.6% 51.2% 48.8% 76.1% 23.9% 78.5% 21.5% 73.7% 26.3% 85.7%2009 71.3% 19.8% 8.9% 51.3% 48.7% 75.0% 25.0% 78.5% 21.5% 73.9% 26.1% 86.4%2010 69.8% 19.8% 10.4% 51.7% 48.3% 73.4% 26.6% 79.1% 20.9% 74.6% 25.4% 86.5%2011 69.1% 20.7% 10.2% 51.4% 48.6% 72.7% 27.3% 79.9% 20.1% 75.9% 24.1% 87.3%2012 69.9% 20.5% 9.7% 51.5% 48.5% 71.8% 28.2% 80.5% 19.5% 76.6% 23.4% 87.8%2013 70.7% 19.6% 9.7% 51.6% 48.4% 70.4% 29.6% 81.3% 18.7% 78.2% 21.8% 88.5%2014 70.6% 19.2% 10.2% 51.4% 48.6% 68.9% 31.1% 82.1% 17.9% 79.6% 20.4% 89.0%2015 70.6% 19.3% 10.1% 50.9% 49.1% 67.5% 32.5% 83.5% 16.5% 80.6% 19.4% 89.4%2016 70.7% 19.2% 10.2% 50.5% 49.5% 66.4% 33.6% 83.7% 16.3% 81.6% 18.4% 92.6%2017 71.3% 19.0% 9.7% 50.4% 49.6% 65.4% 34.6% 83.7% 16.3% 81.6% 18.4% 92.8%
Notes: Percents may not add to 100% due to rounding. Enrollment figures are unduplicated.

Fall Enrollment Book 34
17,039 17,824 18,601 19,644 20,424 20,365 20,161 20,138 20,873 21,622 21,883
0
5,000
10,000
15,000
20,000
25,000
2007 2008 2009 2010 2011 2012 2013 2014 2015 2016 2017
Total Headcount Enrollment for the Fall Semester
14,496.7 15,274.2 16,068.2 16,999.1 17,828.4 17,871.1 17,833.5 17,927.2 18,669.020,012.4 20,307.0
0.0
5,000.0
10,000.0
15,000.0
20,000.0
25,000.0
2007 2008 2009 2010 2011 2012 2013 2014 2015 2016 2017
Total FTE Enrollment for the Fall Semester
mississippi statE UnivErsity total FtE and total HEadcoUnt EnrollmEnt

Fall Enrollment Book 35
mississippi UnivErsity For WomEn EnrollmEnt By EtHnicity, GEndEr, rEsidEncy, lEvEl, aGE and FtE
Non- Under- 25 and Age Total TotalFall Session White Black Other Men Women Resident Resident graduate Graduate Under 25 Over Unknown FTE Headcount2007 1,501 790 88 369 2,010 2,161 218 2,222 157 1,592 787 0 1,920.7 2,3792008 1,422 846 97 380 1,985 2,143 222 2,193 172 1,600 765 0 1,937.4 2,3652009 1,457 910 109 453 2,023 2,228 248 2,272 204 1,579 897 0 2,054.5 2,4762010 1,503 965 119 454 2,133 2,326 261 2,394 193 1,568 1,019 0 2,182.9 2,5872011 1,550 1,011 100 454 2,207 2,404 257 2,478 183 1,566 1,095 0 2,207.2 2,6612012 1,557 993 100 447 2,203 2,392 258 2,503 147 1,577 1,073 0 2,268.2 2,6502013 1,536 970 123 475 2,154 2,345 284 2,429 200 1,612 1,017 0 2,240.0 2,6292014 1,573 987 136 504 2,192 2,387 309 2,527 169 1,687 1,009 0 2,300.3 2,6962015 1,534 965 174 518 2,155 2,298 375 2,470 203 1,773 900 0 2,263.0 2,6732016 1,721 998 237 555 2,401 2,520 436 2,745 211 2,024 932 0 2,479.0 2,9562017 1,668 964 157 548 2,241 2,346 443 2,577 212 1,945 844 0 2,402.9 2,789%Change 2007 to 2012 3.7% 25.7% 13.6% 21.1% 9.6% 10.7% 18.3% 12.6% -6.4% -0.9% 36.3% N/A 18.1% 11.4%%Change 2012 to 2017 7.1% -2.9% 57.0% 22.6% 1.7% -1.9% 71.7% 3.0% 44.2% 23.3% -21.3% N/A 5.9% 5.2%%Change 2007 to 2017 11.1% 22.0% 78.4% 48.5% 11.5% 8.6% 103.2% 16.0% 35.0% 22.2% 7.2% N/A 25.1% 17.2%
Percent of TotalNon- Under- 25 and Total
Fall Session White Black Other Men Women Resident Resident graduate Graduate Under 25 Over FTE2007 63.1% 33.2% 3.7% 15.5% 84.5% 90.8% 9.2% 93.4% 6.6% 66.9% 33.1% 80.7%2008 60.1% 35.8% 4.1% 16.1% 83.9% 90.6% 9.4% 92.7% 7.3% 67.7% 32.3% 81.9%2009 58.8% 36.8% 4.4% 18.3% 81.7% 90.0% 10.0% 91.8% 8.2% 63.8% 36.2% 83.0%2010 58.1% 37.3% 4.6% 17.5% 82.5% 89.9% 10.1% 92.5% 7.5% 60.6% 39.4% 84.4%2011 58.2% 38.0% 3.8% 17.1% 82.9% 90.3% 9.7% 93.1% 6.9% 58.9% 41.1% 82.9%2012 58.8% 37.5% 3.8% 16.9% 83.1% 90.3% 9.7% 94.5% 5.5% 59.5% 40.5% 85.6%2013 58.4% 36.9% 4.7% 18.1% 81.9% 89.2% 10.8% 92.4% 7.6% 61.3% 38.7% 85.2%2014 58.3% 36.6% 5.0% 18.7% 81.3% 88.5% 11.5% 93.7% 6.3% 62.6% 37.4% 85.3%2015 57.4% 36.1% 6.5% 19.4% 80.6% 86.0% 14.0% 92.4% 7.6% 66.3% 33.7% 84.7%2016 58.2% 33.8% 8.0% 18.8% 81.2% 85.3% 14.7% 92.9% 7.1% 68.5% 31.5% 83.9%2017 59.8% 34.6% 5.6% 19.6% 80.4% 84.1% 15.9% 92.4% 7.6% 69.7% 30.3% 86.2%
Notes: Percents may not add to 100% due to rounding. Enrollment figures are unduplicated.

Fall Enrollment Book 36
2,379 2,365 2,476 2,587 2,661 2,650 2,629 2,696 2,6732,956 2,789
0500
1,0001,5002,0002,5003,0003,5004,0004,5005,000
2007 2008 2009 2010 2011 2012 2013 2014 2015 2016 2017
Total Headcount Enrollment for the Fall Semester
1,920.7 1,937.4 2,054.5 2,182.9 2,207.2 2,268.2 2,240.0 2,300.3 2,263.02,479.0 2,402.9
0.0500.0
1,000.01,500.02,000.02,500.03,000.03,500.04,000.04,500.05,000.0
2007 2008 2009 2010 2011 2012 2013 2014 2015 2016 2017
Total FTE Enrollment for the Fall Semester
mississippi UnivErsity For WomEn total FtE and total HEadcoUnt EnrollmEnt
Fall Enrollment Book 37
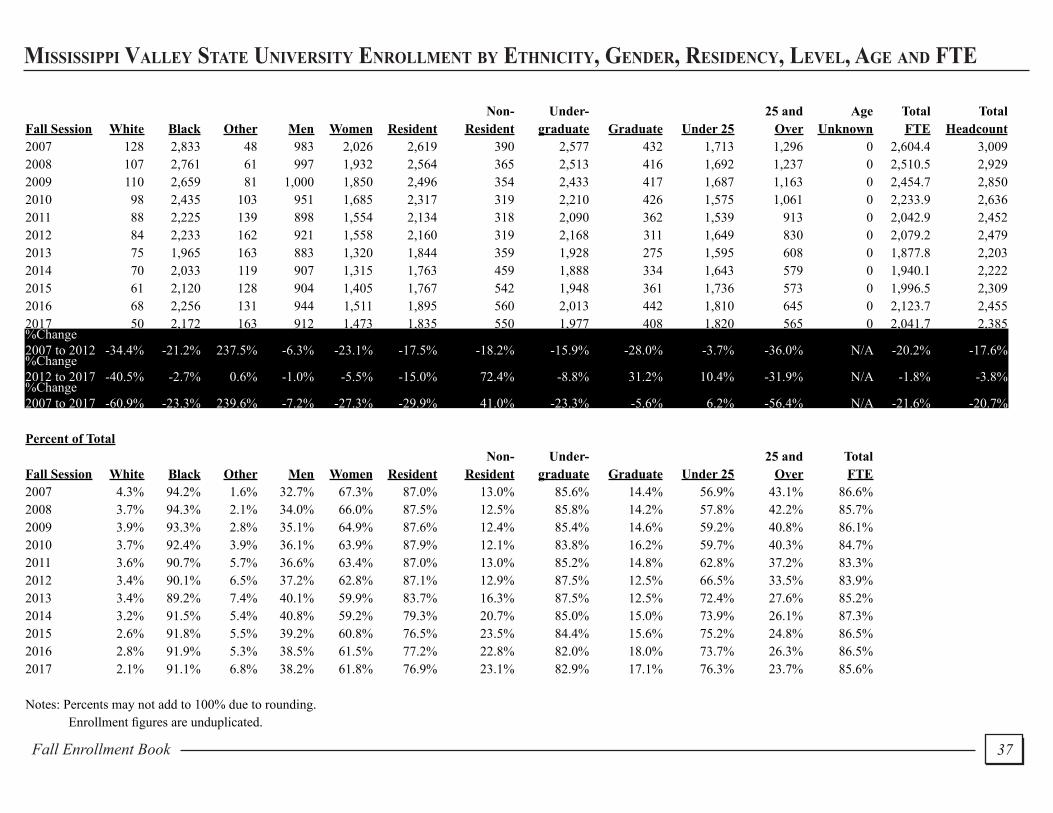
mississippi vallEy statE UnivErsity EnrollmEnt By EtHnicity, GEndEr, rEsidEncy, lEvEl, aGE and FtE
Non- Under- 25 and Age Total TotalFall Session White Black Other Men Women Resident Resident graduate Graduate Under 25 Over Unknown FTE Headcount2007 128 2,833 48 983 2,026 2,619 390 2,577 432 1,713 1,296 0 2,604.4 3,0092008 107 2,761 61 997 1,932 2,564 365 2,513 416 1,692 1,237 0 2,510.5 2,9292009 110 2,659 81 1,000 1,850 2,496 354 2,433 417 1,687 1,163 0 2,454.7 2,8502010 98 2,435 103 951 1,685 2,317 319 2,210 426 1,575 1,061 0 2,233.9 2,6362011 88 2,225 139 898 1,554 2,134 318 2,090 362 1,539 913 0 2,042.9 2,4522012 84 2,233 162 921 1,558 2,160 319 2,168 311 1,649 830 0 2,079.2 2,4792013 75 1,965 163 883 1,320 1,844 359 1,928 275 1,595 608 0 1,877.8 2,2032014 70 2,033 119 907 1,315 1,763 459 1,888 334 1,643 579 0 1,940.1 2,2222015 61 2,120 128 904 1,405 1,767 542 1,948 361 1,736 573 0 1,996.5 2,3092016 68 2,256 131 944 1,511 1,895 560 2,013 442 1,810 645 0 2,123.7 2,4552017 50 2,172 163 912 1,473 1,835 550 1,977 408 1,820 565 0 2,041.7 2,385%Change 2007 to 2012 -34.4% -21.2% 237.5% -6.3% -23.1% -17.5% -18.2% -15.9% -28.0% -3.7% -36.0% N/A -20.2% -17.6%%Change 2012 to 2017 -40.5% -2.7% 0.6% -1.0% -5.5% -15.0% 72.4% -8.8% 31.2% 10.4% -31.9% N/A -1.8% -3.8%%Change 2007 to 2017 -60.9% -23.3% 239.6% -7.2% -27.3% -29.9% 41.0% -23.3% -5.6% 6.2% -56.4% N/A -21.6% -20.7%
Percent of TotalNon- Under- 25 and Total
Fall Session White Black Other Men Women Resident Resident graduate Graduate Under 25 Over FTE2007 4.3% 94.2% 1.6% 32.7% 67.3% 87.0% 13.0% 85.6% 14.4% 56.9% 43.1% 86.6%2008 3.7% 94.3% 2.1% 34.0% 66.0% 87.5% 12.5% 85.8% 14.2% 57.8% 42.2% 85.7%2009 3.9% 93.3% 2.8% 35.1% 64.9% 87.6% 12.4% 85.4% 14.6% 59.2% 40.8% 86.1%2010 3.7% 92.4% 3.9% 36.1% 63.9% 87.9% 12.1% 83.8% 16.2% 59.7% 40.3% 84.7%2011 3.6% 90.7% 5.7% 36.6% 63.4% 87.0% 13.0% 85.2% 14.8% 62.8% 37.2% 83.3%2012 3.4% 90.1% 6.5% 37.2% 62.8% 87.1% 12.9% 87.5% 12.5% 66.5% 33.5% 83.9%2013 3.4% 89.2% 7.4% 40.1% 59.9% 83.7% 16.3% 87.5% 12.5% 72.4% 27.6% 85.2%2014 3.2% 91.5% 5.4% 40.8% 59.2% 79.3% 20.7% 85.0% 15.0% 73.9% 26.1% 87.3%2015 2.6% 91.8% 5.5% 39.2% 60.8% 76.5% 23.5% 84.4% 15.6% 75.2% 24.8% 86.5%2016 2.8% 91.9% 5.3% 38.5% 61.5% 77.2% 22.8% 82.0% 18.0% 73.7% 26.3% 86.5%2017 2.1% 91.1% 6.8% 38.2% 61.8% 76.9% 23.1% 82.9% 17.1% 76.3% 23.7% 85.6%
Notes: Percents may not add to 100% due to rounding. Enrollment figures are unduplicated.

Fall Enrollment Book 38
3,009 2,929 2,8502,636 2,452 2,479
2,203 2,222 2,309 2,455 2,385
0500
1,0001,5002,0002,5003,0003,5004,0004,5005,000
2007 2008 2009 2010 2011 2012 2013 2014 2015 2016 2017
Total Headcount Enrollment for the Fall Semester
2,604.4 2,510.5 2,454.72,233.9 2,042.9 2,079.2 1,877.8 1,940.1 1,996.5 2,123.7 2,041.7
0.0500.0
1,000.01,500.02,000.02,500.03,000.03,500.04,000.04,500.05,000.0
2007 2008 2009 2010 2011 2012 2013 2014 2015 2016 2017
Total FTE Enrollment for the Fall Semester
mississippi vallEy statE UnivErsity total FtE and total HEadcoUnt EnrollmEnt

Fall Enrollment Book 39
UnivErsity oF mississippi EnrollmEnt By EtHnicity, GEndEr, rEsidEncy, lEvEl, aGE and FtE
Non- Under- 25 and Age Total TotalFall Session White Black Other Men Women Resident Resident graduate Graduate Under 25 Over Unknown FTE Headcount2007 13,833 2,331 1,159 7,985 9,338 11,945 5,378 13,237 4,086 12,678 4,644 2 15,795.1 17,3232008 13,607 2,461 1,533 8,001 9,600 12,162 5,439 13,374 4,227 12,701 4,899 1 16,033.9 17,6012009 14,277 2,776 1,291 8,308 10,036 12,797 5,547 13,822 4,522 13,084 5,258 1 16,863.1 18,3442010 14,920 3,118 1,508 8,921 10,625 13,485 6,061 14,755 4,791 14,123 5,423 2 18,185.8 19,5462011 15,665 3,431 1,734 9,307 11,523 13,917 6,913 15,959 4,871 15,293 5,537 0 19,340.2 20,8302012 16,146 3,543 1,839 9,552 11,976 14,124 7,404 16,684 4,844 15,957 5,571 0 20,002.2 21,5282013 16,842 3,438 2,011 9,860 12,431 14,158 8,133 17,377 4,914 16,799 5,492 0 20,831.4 22,2912014 17,538 3,285 2,273 10,231 12,865 14,111 8,985 18,101 4,995 17,791 5,305 0 21,664.0 23,0962015 18,273 3,194 2,371 10,466 13,372 14,233 9,605 18,785 5,053 18,698 5,140 0 22,465.7 23,8382016 18,573 3,167 2,510 10,636 13,614 14,358 9,892 19,213 5,037 19,580 4,670 0 23,236.0 24,2502017 18,197 3,011 2,572 10,500 13,280 13,888 9,892 18,737 5,043 19,347 4,433 0 22,950.8 23,780%Change 2007 to 2012 16.7% 52.0% 58.7% 19.6% 28.3% 18.2% 37.7% 26.0% 18.6% 25.9% 20.0% N/A 26.6% 24.3%%Change 2012 to 2017 12.7% -15.0% 39.9% 9.9% 10.9% -1.7% 33.6% 12.3% 4.1% 21.2% -20.4% N/A 14.7% 10.5%%Change 2007 to 2017 31.5% 29.2% 121.9% 31.5% 42.2% 16.3% 83.9% 41.6% 23.4% 52.6% -4.5% N/A 45.3% 37.3%
Percent of TotalNon- Under- 25 and Total
Fall Session White Black Other Men Women Resident Resident graduate Graduate Under 25 Over FTE2007 79.9% 13.5% 6.7% 46.1% 53.9% 69.0% 31.0% 76.4% 23.6% 73.2% 26.8% 91.2%2008 77.3% 14.0% 8.7% 45.5% 54.5% 69.1% 30.9% 76.0% 24.0% 72.2% 27.8% 91.1%2009 77.8% 15.1% 7.0% 45.3% 54.7% 69.8% 30.2% 75.3% 24.7% 71.3% 28.7% 91.9%2010 76.3% 16.0% 7.7% 45.6% 54.4% 69.0% 31.0% 75.5% 24.5% 72.3% 27.7% 93.0%2011 75.2% 16.5% 8.3% 44.7% 55.3% 66.8% 33.2% 76.6% 23.4% 73.4% 26.6% 92.8%2012 75.0% 16.5% 8.5% 44.4% 55.6% 65.6% 34.4% 77.5% 22.5% 74.1% 25.9% 92.9%2013 75.6% 15.4% 9.0% 44.2% 55.8% 63.5% 36.5% 78.0% 22.0% 75.4% 24.6% 93.5%2014 75.9% 14.2% 9.8% 44.3% 55.7% 61.1% 38.9% 78.4% 21.6% 77.0% 23.0% 93.8%2015 76.7% 13.4% 9.9% 43.9% 56.1% 59.7% 40.3% 78.8% 21.2% 78.4% 21.6% 94.2%2016 76.6% 13.1% 10.4% 43.9% 56.1% 59.2% 40.8% 79.2% 20.8% 80.7% 19.3% 95.8%2017 76.5% 12.7% 10.8% 44.2% 55.8% 58.4% 41.6% 78.8% 21.2% 81.4% 18.6% 96.5%
Notes: Percents may not add to 100% due to rounding. Enrollment figures are unduplicated. For Fall 2005 through Fall 2016, students enrolled in health professional programs are all considered full-time.

Fall Enrollment Book 40
17,323 17,601 18,34419,546
20,830 21,528 22,291 23,096 23,838 24,250 23,780
0
5,000
10,000
15,000
20,000
25,000
2007 2008 2009 2010 2011 2012 2013 2014 2015 2016 2017
Total Headcount Enrollment for the Fall Semester
15,795.1 16,033.9 16,863.118,185.8
19,340.2 20,002.2 20,831.4 21,664.0 22,465.7 23,236.0 22,950.8
0.0
5,000.0
10,000.0
15,000.0
20,000.0
25,000.0
2007 2008 2009 2010 2011 2012 2013 2014 2015 2016 2017
Total FTE Enrollment for the Fall Semester
UnivErsity oF mississippi total FtE and total HEadcoUnt EnrollmEnt

Fall Enrollment Book 41
UnivErsity oF soUtHErn mississippi EnrollmEnt By EtHnicity, GEndEr, rEsidEncy, lEvEl, aGE and FtE
Non- Under- 25 and Age Total TotalFall Session White Black Other Men Women Resident Resident graduate Graduate Under 25 Over Unknown FTE Headcount2007 9,741 3,852 999 5,685 8,907 12,348 2,244 12,122 2,655 9,833 4,759 0 12,630.1 14,5922008 9,614 3,979 1,200 5,798 8,995 12,545 2,248 11,924 2,668 9,907 4,886 0 12,741.3 14,7932009 9,652 4,242 1,399 5,822 9,471 13,001 2,292 12,062 2,731 10,049 5,244 0 13,176.8 15,2932010 9,423 4,328 2,027 5,986 9,792 13,525 2,253 12,383 2,910 10,196 5,582 0 13,584.8 15,7782011 10,079 4,708 1,817 6,271 10,333 14,173 2,431 12,826 2,952 10,862 5,742 0 13,970.3 16,6042012 10,139 4,757 1,572 6,256 10,212 13,889 2,579 13,618 2,986 11,103 5,365 0 13,932.0 16,4682013 9,659 4,352 1,238 5,595 9,654 12,496 2,753 13,658 2,810 10,312 4,937 0 13,331.1 15,2492014 9,369 4,065 1,358 5,448 9,344 11,969 2,823 12,475 2,774 9,947 4,845 0 13,013.6 14,7922015 9,157 3,993 1,401 5,341 9,210 11,727 2,824 12,005 2,787 9,882 4,669 0 12,665.8 14,5512016 9,087 3,856 1,609 5,379 9,173 11,514 3,038 11,840 2,711 9,922 4,630 0 12,868.3 14,5522017 9,128 3,818 1,532 5,311 9,167 11,283 3,195 11,815 2,663 10,068 4,410 0 13,076.5 14,478%Change 2007 to 2012 4.1% 23.5% 57.4% 10.0% 14.7% 12.5% 14.9% 12.3% 12.5% 12.9% 12.7% N/A 10.3% 12.9%%Change 2012 to 2017 -10.0% -19.7% -2.5% -15.1% -10.2% -18.8% 23.9% -13.2% -10.8% -9.3% -17.8% N/A -6.1% -12.1%%Change 2007 to 2017 -6.3% -0.9% 53.4% -6.6% 2.9% -8.6% 42.4% -2.5% 0.3% 2.4% -7.3% N/A 3.5% -0.8%
Percent of TotalNon- Under- 25 and Total
Fall Session White Black Other Men Women Resident Resident graduate Graduate Under 25 Over FTE2007 66.8% 26.4% 6.8% 39.0% 61.0% 84.6% 15.4% 83.1% 18.2% 67.4% 32.6% 86.6%2008 65.0% 26.9% 8.1% 39.2% 60.8% 84.8% 15.2% 80.6% 18.0% 67.0% 33.0% 86.1%2009 63.1% 27.7% 9.1% 38.1% 61.9% 85.0% 15.0% 78.9% 17.9% 65.7% 34.3% 86.2%2010 59.7% 27.4% 12.8% 37.9% 62.1% 85.7% 14.3% 78.5% 18.4% 64.6% 35.4% 86.1%2011 60.7% 28.4% 10.9% 37.8% 62.2% 85.4% 14.6% 77.2% 17.8% 65.4% 34.6% 84.1%2012 61.6% 28.9% 9.5% 38.0% 62.0% 84.3% 15.7% 82.7% 18.1% 67.4% 32.6% 84.6%2013 63.3% 28.5% 8.1% 36.7% 63.3% 81.9% 18.1% 89.6% 18.4% 67.6% 32.4% 87.4%2014 63.3% 27.5% 9.2% 36.8% 63.2% 80.9% 19.1% 84.3% 18.8% 67.2% 32.8% 88.0%2015 62.9% 27.4% 9.6% 36.7% 63.3% 80.6% 19.4% 82.5% 19.2% 67.9% 32.1% 87.0%2016 62.4% 26.5% 11.1% 37.0% 63.0% 79.1% 20.9% 81.4% 18.6% 68.2% 31.8% 88.4%2017 63.0% 26.4% 10.6% 36.7% 63.3% 77.9% 22.1% 81.6% 18.4% 69.5% 30.5% 90.3%
Notes: Percents may not add to 100% due to rounding. Enrollment figures are unduplicated.

Fall Enrollment Book 42
12,630.1 12,741.3 13,176.8 13,584.8 13,970.3 13,932.0 13,331.1 13,013.6 12,665.8 12,868.3 13,076.5
0.02,000.04,000.06,000.08,000.0
10,000.012,000.014,000.016,000.018,000.020,000.0
2007 2008 2009 2010 2011 2012 2013 2014 2015 2016 2017
Total FTE Enrollment for the Fall Semester
14,592 14,793 15,293 15,778 16,604 16,46815,249 14,792 14,551 14,552 14,478
02,0004,0006,0008,000
10,00012,00014,00016,00018,00020,000
2007 2008 2009 2010 2011 2012 2013 2014 2015 2016 2017
Total Headcount Enrollment for the Fall Semester
UnivErsity oF soUtHErn mississippi total FtE and total HEadcoUnt EnrollmEnt

sElEctEd inFormation on divErsity

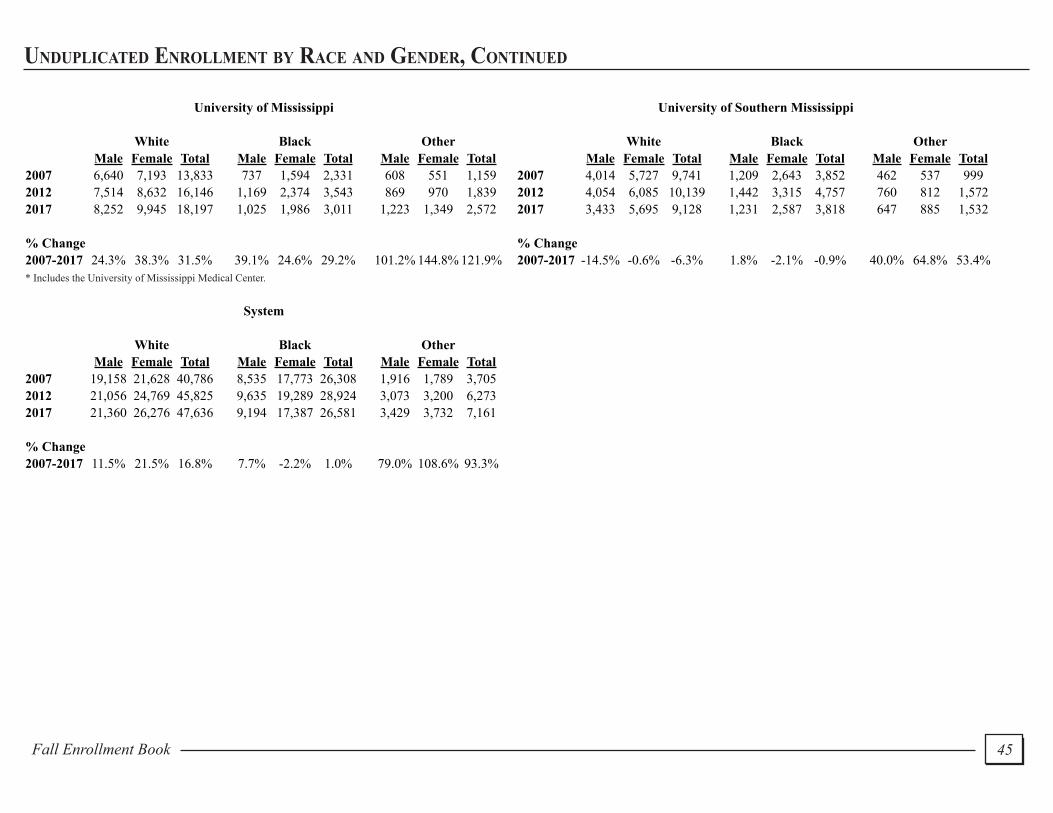
Fall Enrollment Book 44
UndUplicatEd EnrollmEnt By racE and GEndEr
Alcorn State University Delta State University
White Black Other White Black OtherMale Female Total Male Female Total Male Female Total Male Female Total Male Female Total Male Female Total
2007 88 224 312 1,084 2,231 3,228 26 15 41 2007 984 1,328 2,312 421 1,288 1,709 32 38 702012 62 131 193 1,200 2,494 3,378 40 23 63 2012 1,116 1,754 2,870 443 1,123 1,566 115 212 3272017 48 88 136 1,192 2,285 3,229 60 43 103 2017 924 1,376 2,300 430 810 1,240 117 132 249
% Change % Change2007-2017 -45.5% -60.7% -56.4% 10.0% 2.4% 0.0% 130.8% 186.7% 151.2% 2007-2017 -6.1% 3.6% -0.5% 2.1% -37.1% -27.4% 265.6% 247.4% 255.7%
Jackson State University Mississippi State University
White Black Other White Black OtherMale Female Total Male Female Total Male Female Total Male Female Total Male Female Total Male Female Total
2007 217 251 468 2,862 5,265 8,127 39 64 103 2007 6,895 5,596 12,491 1,238 2,113 3,351 701 496 1,1972012 272 334 606 2,744 5,226 7,970 104 139 243 2012 7,694 6,536 14,230 1,701 2,467 4,168 1,097 870 1,9672017 244 300 544 2,574 5,171 7,745 92 177 269 2017 8,067 7,546 15,613 1,786 2,368 4,154 1,178 938 2,116
% Change % Change2007-2017 12.4% 19.5% 16.2% -10.1% -1.8% -4.7% 135.9% 176.6% 161.2% 2007-2017 17.0% 34.8% 25.0% 44.3% 12.1% 24.0% 68.0% 89.1% 76.8%
Mississippi University for Women Mississippi Valley State University
White Black Other White Black OtherMale Female Total Male Female Total Male Female Total Male Female Total Male Female Total Male Female Total
2007 265 1,236 1,501 79 711 790 25 63 88 2007 55 73 128 905 1,928 2,833 23 25 482012 311 1,246 1,557 112 881 993 24 76 100 2012 33 51 84 824 1,409 2,233 64 98 1622017 368 1,300 1,668 131 833 964 49 108 157 2017 24 26 50 825 1,347 2,172 63 100 163
% Change % Change2007-2017 38.9% 5.2% 11.1% 65.8% 17.2% 22.0% 96.0% 71.4% 78.4% 2007-2017 -56.4% -64.4% -60.9% -8.8% -30.1% -23.3% 173.9% 300.0% 239.6%
Fall Enrollment Book 45
UndUplicatEd EnrollmEnt By racE and GEndEr, continUEd
University of Mississippi University of Southern Mississippi
White Black Other White Black OtherMale Female Total Male Female Total Male Female Total Male Female Total Male Female Total Male Female Total
2007 6,640 7,193 13,833 737 1,594 2,331 608 551 1,159 2007 4,014 5,727 9,741 1,209 2,643 3,852 462 537 9992012 7,514 8,632 16,146 1,169 2,374 3,543 869 970 1,839 2012 4,054 6,085 10,139 1,442 3,315 4,757 760 812 1,5722017 8,252 9,945 18,197 1,025 1,986 3,011 1,223 1,349 2,572 2017 3,433 5,695 9,128 1,231 2,587 3,818 647 885 1,532
% Change % Change2007-2017 24.3% 38.3% 31.5% 39.1% 24.6% 29.2% 101.2% 144.8% 121.9% 2007-2017 -14.5% -0.6% -6.3% 1.8% -2.1% -0.9% 40.0% 64.8% 53.4%* Includes the University of Mississippi Medical Center.
System
White Black OtherMale Female Total Male Female Total Male Female Total
2007 19,158 21,628 40,786 8,535 17,773 26,308 1,916 1,789 3,7052012 21,056 24,769 45,825 9,635 19,289 28,924 3,073 3,200 6,2732017 21,360 26,276 47,636 9,194 17,387 26,581 3,429 3,732 7,161
% Change2007-2017 11.5% 21.5% 16.8% 7.7% -2.2% 1.0% 79.0% 108.6% 93.3%