Embed Size (px)
Citation preview

April 2007
EARNINGS REPORT 1st Quarter 2007
S.A.C.I. FALABELLA

Falabella S.A.C.I. Results – 1st Quarter of 2007_______
www.falabella.com 2
Results – First Quarter 2007 Table of Contents I. EXECUTIVE SUMMARY................................................................................................3
II. CONSOLIDATED INCOME STATEMENT AS OF MARCH 31, 2007 .....................4
III. CONSOLIDATED EARNINGS ANALYSIS ..................................................................5
IV. RETAIL INDICATORS....................................................................................................8
V. OPERATING INCOME OF BUSINESS UNITS..........................................................11
VI. CREDIT INDICATORS..................................................................................................14
VII. FINANCIAL STRUCTURE............................................................................................17
VIII. STORES AND SELLING SPACE..................................................................................18
IX. FINANCIAL STATEMENTS OF S.A.C.I. FALABELLA - FECU ............................23
Notes: 1. All figures in dollars are calculated using pesos in the Uniform Codified Statistical
Record (FECU) as of March 31, 2007 and the observed dollar exchange rate for April 2, 2007 (CH$539.21 per US$1).
2. Symbols: 1Q (first quarter), 2Q (second quarter), 3Q (third quarter), and 4Q (fourth quarter).
3. Other symbols for periods in the year: 1S (first semester) and 9M (first nine months of the year).
4. Currency symbols: CH$: Chilean pesos; US$: U.S. dollars; MM: millions.
Falabella S.A.C.I. Results – 1st Quarter of 2007_______
www.falabella.com 3
I. Executive Summary THE CUMULATIVE CONSOLIDATED PROFIT OF FALABELLA ROSE 20.2% AS OF MARCH 2007, TO MMCH$51,323 (MMUS$95.2). THE PROFIT PER SHARE THUS REACHED CH$21.5 IN 1Q. • Consolidated revenues totaled MMCH$638,281 in 1Q 2007 (MMUS$1,183.7, 19.8% higher
than the previous year), driven by the opening of 8 stores in the first quarter of 2007 (4 in Chile, 2 in Peru and 2 in Colombia) and 22 stores during 2006.
• Operating income grew 36.3% as of March 2007, to MMCH$67,226 (MMUS$124.7). Of
significant impact in this growth was the consolidation of Mall Plaza1 starting in 1Q 2007. If Mall Plaza is excluded from 1Q 2007, the growth in operating income was 17.3%.
• The 1Q 2007 EBITDA rose 34.4%, to MMCH$81,811 (MMUS$151.7). The Adjusted
EBITDA2 was MMCH$90,519 as of March 31st (MMUS$167.9), which represents 14.2% of consolidated sales.
• There was a cumulative non-operating loss of MMCH$2,120 (MMUS$3.9) as of March 31,
2007, which compares to a profit of MMCH$639 (MMUS$1.2) in 1Q 2006. The cause was principally an increase in financial expenses and a reduction in the Profit on Investments in Related Companies, both concepts affected by the consolidation of Mall Plaza in 1Q 2007 (see footnote N°1).
• Finally, the Profit before income tax and extraordinary items rose 30.3% during 1Q 2007.
The difference versus growth in Net Income is mainly due to an increase in the income tax provision.
1 Plaza Oeste S.A., Puente Alto S.A., Plaza La Serena S.A. and Plaza del Trebol S.A. began to be consolidated as of 1Q 2007, which include the Plaza Oeste, Plaza Norte, Plaza Antofagasta, Plaza Tobalaba, Plaza La Serena, Plaza del Trebol and Plaza Los Angeles malls. Mall Plaza Vespucio is excluded. 2 Adjusted EBITDA = EBITDA + profit/loss on investment in related companies.

Falabella S.A.C.I. Results – 1st Quarter of 2007_______
www.falabella.com 4
II. Consolidated Income Statement as of March 31, 20073
Consolidated Earnings January - March 2007 (MMCH$) 1Q'07 % Ingresos 1Q'06 % Ingresos Var. 07/06
Revenues 638,281 532,734 19.8%COGS (less) (454,049) -71.1% (382,330) -71.8% 18.8%GROSS MARGIN 184,232 28.9% 150,404 28.2% 22.5%SG&A (less) (117,007) -18.3% (101,077) -19.0% 15.8%OPERATING INCOME 67,226 10.5% 49,328 9.3% 36.3%EBITDA 81,811 12.8% 60,854 11.4% 34.4%Interest Income 1,309 587 122.8%Profit on investment in related companies 8,717 10,503 -17.0%Other non-operating income 5,911 1,083 445.7%Lost on investment in related companies (less) (9) (18) -51.4%Amortization of goodwill (3,664) (3,339) 9.7%Interest expenses (less) (10,609) (7,236) 46.6%Other non-operating expenses (less) (2,994) (1,780) 68.2%Price-level restatement (584) 1,308 -144.7%Exchange differentials (197) (469) -58.0%NON-OPERATING PROFIT (LOSS) (2,120) -0.3% 639 0.1% -431.6%
PROFIT BEFORE INCOME TAX & EXTRAORD. ITMES 65,106 10.2% 49,967 9.4% 30.3%INCOME TAX (10,716) (6,837) 56.7%EXTRAORDINARY ITEMS 0 0MINORITY INTEREST (3,068) (442) 593.4%NET PROFIT (LOSS) 51,323 42,687 20.2%Amortization of negative goodwill 1 1 -18.9%PROFIT (LOSS) IN THE FISCAL YEAR 51,323 8.0% 42,688 8.0% 20.2%
Adjusted EBITDA 3 90,519 14.2% 71,339 13.4% 26.9%
3 Adjusted EBITDA = EBITDA + profit/loss on investment in related companies

Falabella S.A.C.I. Results – 1st Quarter of 2007_______
www.falabella.com 5
III. Consolidated Earnings Analysis Operating Income The consolidated operating income rose 36.3% in 1Q 2007, reaching 10.5% of revenues, or 127 basis points above the previous year. Of this 36.3% growth, 19% came from the consolidation of Mall Plaza (see footnote 1) and 17.3% from the good performance in virtually all of the group's subsidiaries, particularly Peru, Sodimac Chile, Sociedad de Rentas, Financial Retail in Chile and, to a lesser extent, Falabella Chile. Sales Revenue Cumulative revenues as of March 31, 2007 totaled MMCH$638,281 (MMUS$1,183.7), meaning a growth of 19.8% above the previous year. This growth was due in part to the consolidation of Mall Plaza and principally to the good performance in all the business units, particularly Supermercados San Francisco (+37.7%), Peru (+36.7%), Argentina (+19.0%), and Falabella Colombia. The revenues of Falabella Retail Chile rose 7.9% in 1Q and those of Sodimac Chile 12.9%. Gross Margin The cumulative gross margin for the year rose 63 basis points on revenues, as compared to the previous year, totaling 28.9% on sales or MMCH$184,232 (MMUS$341.7). This increase of 63 basis points came from an improvement in gross margins in practically all business units, and especially from the consolidation of Mall Plaza, which has a higher gross margin than the rest of Falabella, seen as a percentage of revenues. Selling, General and Administrative Expenses (SGA) SGA dropped 64 basis points as a percentage of sales in 1Q 2007, to 18.3% on revenues, or MMCH$ 117,007 (MMUS$ 217.0). This 64 basis point improvement was mainly the result of a mix effect by consolidating Mall Plaza, which has less SGA than the rest of Falabella, taken as a percentage of sales. Moreover, except for Financial Retail and Sociedad de Rentas, the remaining business units increased their SGA as a percentage of revenues, basically because they are in the process of opening a significant number of stores. Non-Operating Income Analysis Non-operating income fell significantly in 1Q 2007, resulting in a loss of MMCH$2,120 (MMUS$3.9) as compared to a profit of MMCH$639 (MMUS$1.2) in the same period in 2006. This decrease of MMCH$2,759 came mainly from the following (in order of magnitude):
• Financial expenses: an increase of MMCH$3,373, 46.6% higher than the previous year. 60% of this increase is due to the consolidation of Mall Plaza. The remaining 40% is explained by a higher average debt in 1Q 2007 as compared to the same period in 2006, mainly due to the placement of two bonds in Chile for a total of UF 8,500,000 (approximately MMUS$290).
Falabella S.A.C.I. Results – 1st Quarter of 2007_______
www.falabella.com 6
• Profit/loss on investments in related companies: there was a net reduction of MMCH$1,777 in profits recognized by Falabella, or -16.9% in comparison to the previous year, principally in the following related companies:
o Mall Plazas that consolidate:4 the recognized profit is no longer recorded in this
line and was therefore reduced in full (reduction of MMCH$2,407). o Mall Plaza Vespucio: the recognized profit rose by MMCH$178, a 16.2% higher
than the previous year. o Banco Falabella: grew 7.4% to MMCH$5,718, which means an increase of
MMCH$396. o Farmacias Ahumada: grew 49.5% to a recognized profit of MMCH$419, which is
equal to an increase of MMCH$139. o Sodimac Colombia: the recognized profit fell MMCH$77, or -7.0%, to
MMCH$1,032.
• Price-Level Restatement plus Exchange Differential: a drop of MMCH$1,620, resulting in a loss of MMCH$781.
• Other Non-Operating Expenses: an increase of MMCH$1,214 in disbursements, or +68.2%, mainly due to an extraordinary provision in other investments.
The above was partially offset by the changes in:
• Other Non-Operating Income: an increase of MMCH$4,828, 445.7% higher than the previous year, mainly due to an extraordinary income related to the Falabella store in Mall La Dehesa.
• Interest Income: an increase of MMCH$721, or a growth of 122.8%. Main Events in 1Q 2007 • In Chile, 1 Falabella store was opened in downtown Santiago, 1 Homecenter Sodimac in
Iquique, and 2 Tottus stores in Santiago. On the date of this report (April), a Homecenter Sodimac was inaugurated in the Mall Plaza Antofagasta.
• In Peru, 1 Falabella store was opened in Cajamarca and 1 Homecenter Sodimac in Lima. • In Colombia, 2 Homecenter Sodimac stores were opened: one in Bogota and another in
Cali. On the date of this report (April), a Falabella store had been inaugurated in the Suba Shopping Center in Bogota. This latter corresponded to the second Falabella store opened in Colombia.
• Falabella TV was launched in Peru. • On January 8, 2007, the shares that Cencosud held in Mall Plaza were purchased.
Falabella thus came to hold a 64.5% interest in Plaza Oeste S.A., Puente Alto S.A., Plaza La Serena S.A. and Plaza del Trebol S.A. and as of 1Q 2007, their financial statements are
4 Refers to Plaza Oeste S.A., Puente Alto S.A., Plaza La Serena S.A. and Plaza del Trebol S.A. Only Plaza Vespucio S.A. is excluded.

Falabella S.A.C.I. Results – 1st Quarter of 2007_______
www.falabella.com 7
being consolidated. These companies include Malls Plaza Oeste, Plaza Norte, Plaza Antofagasta, Plaza Tobalaba, Plaza La Serena, Plaza del Trebol and Plaza Los Angeles. Mall Plaza Vespucio is not included, which continues to be an Investment in Related Companies.
• On March 28, 2007, through a material event notified to the Superintendency of Securities and Insurance (SVS), Falabella reported that it would propose a capital increase of 250 million shares, equal to approximately US$1,070 million (using the per-share price at the close of March 29, 2007). On April 24, 2007, a Special Shareholders Meeting was held that approved that capital increase. The principal objective of authorizing the capital increase was to give Falabella’s management flexibility of resources to expand and/or accelerate the investment plan and have alternatives available for potential growth opportunities in new businesses and markets.
• Also on March 28, 2007, notified as a material event to the SVS, Falabella reported that it would propose a capital increase of 20,236,133 shares, equal to approximately US$87 million (using the per-share price at the close of March 29, 2007). On April 24, 2007, a Special Shareholders Meeting was held that approved that capital increase. The objective of this capital increase is to continue with the stock option compensation plan for Falabella executives, begun in 2005.

Falabella S.A.C.I. Results – 1st Quarter of 2007_______
www.falabella.com 8
IV. Retail Indicators
1. Revenues from Retail Businesses
Retail Revenue (MUS$)5 (Adjusted Chilean pesos converted to USD at the observed e/r for April 2, 2007)
1Q 2007 1Q 2006 Var. 07/06Department Stores - Chile 290,308 269,176 7.9%Home Improvement - Chile 416,657 368,890 12.9%Supermarkets - Chile 98,684 71,670 37.7%Retail - Peru (Saga, Sodimac & Tottus) 140,173 107,195 30.8%Department Stores - Argentina 46,157 39,477 16.9%Retail - Colombia (Falabella & Sodimac) 110,859 73,871 50.1%
Same Store Sales (SSS) Growth6 (all growth is real and was calculated in the local currency of each country)
1Q 2006 1S 2006 9M 2006 2006 1Q 2007Department Stores - Chile 3.9% 2.0% -1.1% 2.2% 7.6%Home Improvement - Chile 9.7% 10.4% 10.4% 8.9% 7.9%Supermarkets - Chile 1.0% 1.6% 0.6% 1.7% 2.2%Retail - Peru (Saga, Sodimac y Tottus) 5.2% 2.5% 1.1% 2.2% 4.9%Department Stores - Argentina -2.5% 6.6% 3.3% 4.5% 17.8%
Chile Department Stores Revenues rose 7.9% during 1Q 2007, driven mainly by the same store sales growth (7.6%) and a 6.3% increase in square meters of selling space in the last 12 months. Chile Home Improvement The growth in revenues in 1Q 2007 (12.9%) was due mainly to the 7.9% same store sales growth, plus the increase of 7.3% in square meters of selling space thanks to the opening of 7 stores and the enlargement of another. Chile Supermarkets Revenues rose 37.7% during 1Q 2007. This rise stemmed fundamentally from the opening of 6 stores in the last 12 months that resulted in an increase of 70% in selling space. Peru The rise in the revenues from the retail business in Peru during 1Q 2007 (encompassing SagaFalabella, Sodimac and Tottus) was 30.8%. The increase was driven mainly by the opening of 5 stores, which resulted in a 34% climb in selling space. Argentina Revenues grew 16.9% in 1Q 2007. The 17.8% same store sales growth was fundamental in this sales growth.
5 Excludes revenue from the credit business. 6 All new stores and those that are enlarged by more than 10% in terms of square meters are excluded in the calculation of same store sales growth.

Falabella S.A.C.I. Results – 1st Quarter of 2007_______
www.falabella.com 9
Colombia The revenues of Sodimac and Falabella Colombia rose 50.1% in the aggregate. This growth came from the opening of 3 Sodimac stores, resulting in an increase of 36% in selling space in the last twelve months, and from the opening of the first Falabella department store. 2. Number of Stores and Floor Space7
March 2007 March 2006Sales Area Area (m2) Stores Area (m2) StoresDepartment Stores - Chile 187,977 35 176,834 34Home Improvement - Chile 421,995 56 393,262 55Supermarkets - Chile 68,069 18 40,087 12Department Stores - Peru 67,278 12 57,027 10Hypermarkets - Peru 30,335 4 23,104 3Home Improvement - Peru 38,757 4 21,704 2Department Stores - Argentina 39,817 7 39,817 7Department Stores - Colombia 10,268 1 0 0Home Improvement - Colombia 126,207 12 93,129 9
Total 989,589 149 844,965 132 Chile Department Stores 3 new stores were opened in Chile in the 12 months since March 31, 2006 and approximately 11,100 square meters of selling space were added. This came from the opening of the stores in Mall Plaza Antofagasta (9,164 m2, Oct-2006), La Calera (4,994 m2, Nov-2006) as well as Ahumada 346 (1,864 m2, Jan-2007, in replacement of the store at Ahumada 218 that had 754 m2). In addition, the Plaza Oeste store was enlarged in December 2006 to add 4,215 m2 of selling space while the store in downtown Antofagasta was closed (8,344 m2, December 31, 2006). Chile Home Improvement 7 Home Improvement stores were opened in the 12 months since March 31, 2006 while the net selling space rose by approximately 28,700 m2. Stores were opened in Plaza Oeste (14,400 m2, May-2006, in replacement of the old store of 10,132 m2), La Calera (7,905 m2, Jul-2006), Puerto Montt (9,465 m2, Aug-2006, in replacement of the old store of 7,839 m2), Constructor Fontova (7,351 m2, Sep-2006, in replacement of the old store of 5,691 m2), San Felipe (9,453 m2, Nov-2006, in replacement of the old store of 3,818 m2), Arica (6,267 m2, Dec-2006, in replacement of the old store of 5,501 m2), and Iquique (9,955 m2, Feb-2007, in replacement of the old store of 4,722 m2). The La Florida Homecenter was also enlarged (+1,640 m2, Sep-2006). Chile Supermarkets 6 new San Francisco supermarkets were opened in the 12 months since March 31, 2006 and the selling space rose by approximately 27,600 m2: Tottus La Calera (3,511 m2, Jul-2006), Tottus Fontova (4,591 m2, Sep-2006), Tottus Mall Plaza Antofagasta (5,180 m2, Sep-2006), Tottus Mall Plaza Oeste (5,149 m2, Dec-2006), Tottus Puente Alto II (4,580 m2, Jan-07) and Tottus La Florida (4,971 m2, Mar-07). 7 The six Ahumada stores are counted separately among the Chile Department Stores. Stores are described more thoroughly in the appendices.

Falabella S.A.C.I. Results – 1st Quarter of 2007_______
www.falabella.com 10
Peru 5 new stores were opened in Peru in the last 12 months while selling space rose by approximately 34,500 m2. The stores opened were: Tottus Atocongo (7,231 m2, 2Q-2006), Homecenter Sodimac Atocongo (8,440 m2, 2Q-2006), Homecenter Sodimac Javier Prado (8,613 m2, 1Q-2007), Falabella Megaplaza (9,096 m2, 4Q-2006) and Falabella Cajamarca (1,155 m2, 1Q-2007). Colombia Finally, in Colombia, 4 new stores were opened in the last 12 months and selling space rose by approximately 43,300 m2. The new stores were: Homecenter Medellin San Juan (13,406 m2, 3Q-2006), HC Cali Norte (13,500 m2, 1Q-2007), Homecenter Suba (6,172 m2, 1Q-2007) and the first Falabella department store in Colombia, in Mall Santa Fe (10,268 m2, Nov-2006). 3. Inventories8
Days in Inventory
1Q 2006 1S 2006 9M 2006 2006 1Q 2007Department Stores - Chile 94 86 88 81 86Home Improvement - Chile 64 70 77 78 65Supermarkets - Chile 23 23 26 34 35Department Stores - Peru 112 104 100 93 107Home Improvement - Peru 102 113 125 144 151Hypermarkets - Peru 38 38 38 40 35Department Stores - Argentina 101 95 90 82 109
There was an increase in inventory days in department stores in general related to seasonality. This should tend to drop in the second quarter. There was an increase in days in inventory in Sodimac Peru because of the opening of the Javier Prado store at the end of 1Q 2007.
8 Days in Inventory = Inventories at the end of the period divided by the cumulative sales cost, using in 30-day months.

Falabella S.A.C.I. Results – 1st Quarter of 2007_______
www.falabella.com 11
V. Operating Income of Business Units
1. Chile Department Stores – Retail Only (Individual FECU for SACI Falabella)
Department store operating income rose 0.3% in 1Q 2007, to MMUS$4.1. Also notable is the 12.4% increase in the EBITDA, that reached MMUS$10.1. This was the result of an increase of 7.9% in revenues, accompanied by a gross margin of 27.1%, or 50 basis points higher than 1Q 2006. The rise of 30 basis points in SGA w/o depreciation is due mainly to an increase in corporate expenses (those of the holding company are recorded in the Individual Fecu of Falabella), leases, advertising and other expenses.
Chile Department Stores (MMUS$ and percentage of sales) 1Q 2007 1Q 2006 Var. (pts.)
Revenues 290.3 269.2 7.9%Costs -72.9% -73.3% -0.5 Gross Margin 27.1% 26.7% 0.5SGA w/o depreciation -23.7% -23.3% 0.3EBITDA 3.5% 3.3% 0.1Depreciation + Amortization -2.0% -1.8% 0.2Operating Profit (Loss) 1.4% 1.5% -0.1
2. Chile Home Improvement Chile –Retail Only Sodimac Chile’s operating income was MMUS$ 26.8 as of March 31, 2007, growing 18.7% compared to 1Q 2006. The rise in operating income exceeded revenues, mainly because of the increase of 140 basis points in the gross margin. This was due in particular to the optimization in the mix of imported product and a greater efficiency in inventory shrinkage. Moreover, SGA w/o depreciation rose 100 basis points because of the opening of 7 stores in the last 12 months as well as an increase in pre-opening expenses.
Sodimac Chile (MMUS$ and percentage of sales) 1Q 2007 1Q 2006 Var. (pts.)
Revenues 416.7 368.9 12.9%Costs -73.6% -75.0% -1.4 Gross Margin 26.4% 25.0% 1.4SGA w/o depreciation -19.0% -18.0% 1.0EBITDA 7.3% 7.0% 0.3Depreciation + Amortization -0.9% -0.9% 0.0Operating Profit (Loss) 6.4% 6.1% 0.3

Falabella S.A.C.I. Results – 1st Quarter of 2007_______
www.falabella.com 12
3. Chile Supermarkets The operating income of San Francisco Supermarkets fell 75.2% in 1Q 2007 to MMUS$0.8. This drop was mainly the result of an increase of 320 basis points in SGA expenses because of the start-up of 6 new stores in the last 12 months (i.e., an increase of 50% in the number of stores) that are currently in the process of SGA w/o depreciation maturing.
Chile Supermarkets (MMUS$ and percentage of sales) 1Q 2007 1Q 2006 Var. (pts.)
Revenues 98.7 71.7 37.7%Costs -79.4% -79.7% -0.3 Gross Margin 20.6% 20.3% 0.3SGA w/o depreciation -17.5% -14.3% 3.2EBITDA 3.1% 6.0% -2.9 Depreciation + Amortization -2.3% -1.7% 0.7Operating Profit (Loss) 0.8% 4.3% -3.5
4. International Operations - Retail and Credit
During 1Q 2007, operating income of the international businesses that are consolidated (Argentina, Peru and Colombia)9 totaled MMUS$13.1, which meant a growth of 36.5% compared to the previous year. International businesses that are consolidated thus accounted for 10.5% of the consolidated operating income of Falabella (12.4% when Colombia is excluded). Revenues amounted to MMUS$245.6 and EBITDA to MMUS$19.0, which represent 20.7% and 12.5% relative to the consolidated total respectively. Peru Operating income from Peru was MMUS$16.0 in 1Q 2007, a growth of 32.9%. This growth was based on the opening of 5 new stores in the last 12 months, which drove revenues up 36.7%. The 30 basis point drop in operating income was due mainly to an increase in provisions and write-offs in the credit business.
Peru (MMUS$ and percentage of income) 1Q 2007 1Q 2006 Var. (pts.)
Revenues 184.1 134.7 36.7%Costs -65.3% -64.8% 0.6Gross Margin 34.7% 35.2% -0.6 SGA w/o depreciation -23.4% -23.1% 0.3EBITDA 11.3% 12.1% -0.9 Depreciation + Amortization -2.6% -3.2% -0.6 Operating Profit (Loss) 8.7% 9.0% -0.3
9 Excluding Sodimac Colombia.
Falabella S.A.C.I. Results – 1st Quarter of 2007_______
www.falabella.com 13
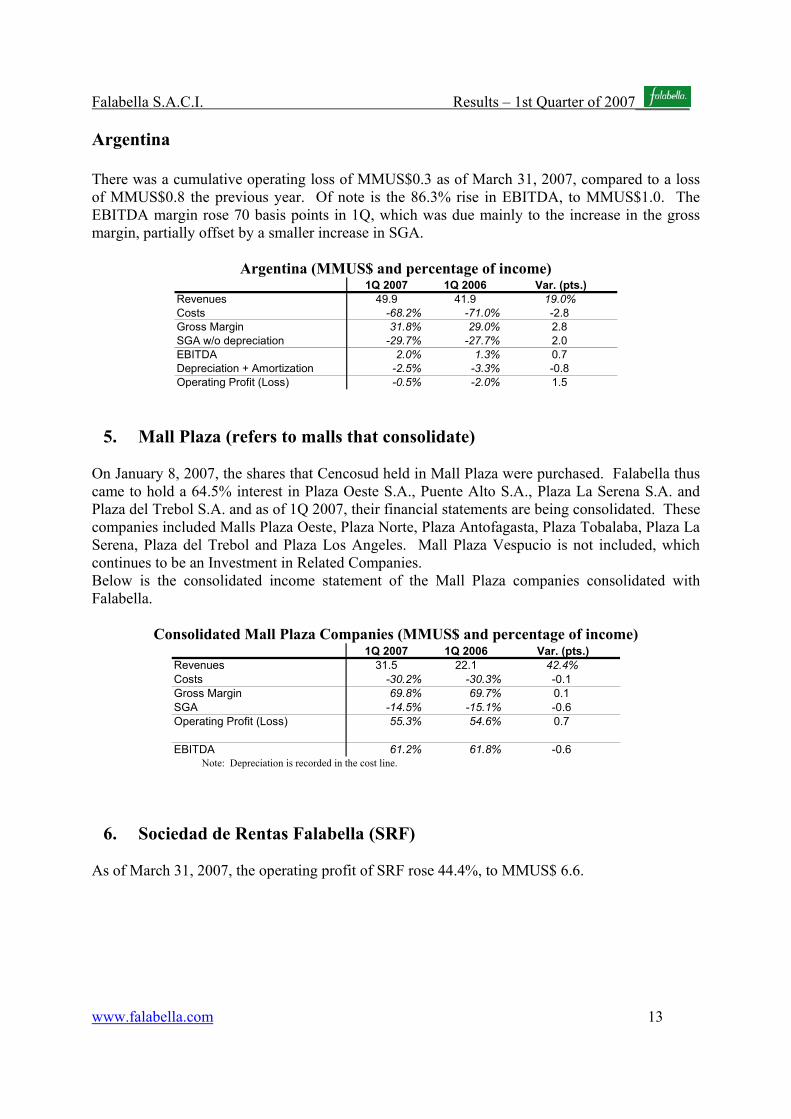
Argentina There was a cumulative operating loss of MMUS$0.3 as of March 31, 2007, compared to a loss of MMUS$0.8 the previous year. Of note is the 86.3% rise in EBITDA, to MMUS$1.0. The EBITDA margin rose 70 basis points in 1Q, which was due mainly to the increase in the gross margin, partially offset by a smaller increase in SGA.
Argentina (MMUS$ and percentage of income) 1Q 2007 1Q 2006 Var. (pts.)
Revenues 49.9 41.9 19.0%Costs -68.2% -71.0% -2.8 Gross Margin 31.8% 29.0% 2.8SGA w/o depreciation -29.7% -27.7% 2.0EBITDA 2.0% 1.3% 0.7Depreciation + Amortization -2.5% -3.3% -0.8 Operating Profit (Loss) -0.5% -2.0% 1.5
5. Mall Plaza (refers to malls that consolidate) On January 8, 2007, the shares that Cencosud held in Mall Plaza were purchased. Falabella thus came to hold a 64.5% interest in Plaza Oeste S.A., Puente Alto S.A., Plaza La Serena S.A. and Plaza del Trebol S.A. and as of 1Q 2007, their financial statements are being consolidated. These companies included Malls Plaza Oeste, Plaza Norte, Plaza Antofagasta, Plaza Tobalaba, Plaza La Serena, Plaza del Trebol and Plaza Los Angeles. Mall Plaza Vespucio is not included, which continues to be an Investment in Related Companies. Below is the consolidated income statement of the Mall Plaza companies consolidated with Falabella.
Consolidated Mall Plaza Companies (MMUS$ and percentage of income) 1Q 2007 1Q 2006 Var. (pts.)
Revenues 31.5 22.1 42.4%Costs -30.2% -30.3% -0.1 Gross Margin 69.8% 69.7% 0.1SGA -14.5% -15.1% -0.6 Operating Profit (Loss) 55.3% 54.6% 0.7
EBITDA 61.2% 61.8% -0.6 Note: Depreciation is recorded in the cost line.
6. Sociedad de Rentas Falabella (SRF) As of March 31, 2007, the operating profit of SRF rose 44.4%, to MMUS$ 6.6.

Falabella S.A.C.I. Results – 1st Quarter of 2007_______
www.falabella.com 14
VI. Credit Indicators
1. CMR Card Sales
Cumulative Percentage of Sales using CMR10 1Q 2006 1S 2006 9M 2006 2006 1Q 2007
Department Stores - Chile 63.4% 65.1% 65.5% 65.3% 63.0%Home Improvement - Chile 31.5% 30.9% 31.2% 31.0% 29.8%Supermarkets - Chile 10.2% 11.1% 11.8% 12.8% 14.7%Department Stores - Peru 66.5% 67.3% 67.9% 68.1% 67.1%Hypermarkets - Peru 53.3% 52.0% 52.6% 52.7% 54.0%Home Improvement - Peru 39.8% 40.1% 40.9% 41.4% 41.3%Department Stores - Argentina 37.3% 37.7% 38.6% 38.2% 40.9%
The calculation for Sodimac Chile includes retail sales and wholesales. If we look at just retail sales, the cumulative penetration is 34.9%. The CMR card began operations in Colombia in October 2005. As of March 31, 2007, there were 236,354 active CMR cards in Colombia. The percentage of card sales in the Sodimac stores totaled 9.8% and it is already 30.3% in the first Falabella store inaugurated in November 2006.
2. CMR Chile
a. Total Gross Loans (Nominal MMCH$)1Q 2Q 3Q 4Q
2005 439,790 477,509 498,856 550,2092006 551,211 553,908 549,624 608,2362007 627,290
b. Total Loan Provisions (Nominal MMCH$)1Q 2Q 3Q 4Q
2005 -15,445 -16,877 -15,397 -17,9752006 -21,266 -22,943 -22,081 -23,1042007 -23,885
c. Provisions/Loans1Q 2Q 3Q 4Q
2005 3.51% 3.53% 3.09% 3.27%2006 3.86% 4.14% 4.02% 3.80%2007 3.81%
d. Cummulative Net Write-offs (Nominal MMCH$)1Q 2Q 3Q 4Q
2005 5,188 7,864 12,725 16,5462006 4,616 9,457 16,485 22,5142007 7,034
Note: Write-offs are net of recoveries
10 The percentage of sales using CMR refers to the cumulative sales using the card as compared to total cumulative sales by each chain.

Falabella S.A.C.I. Results – 1st Quarter of 2007_______
www.falabella.com 15
3. Banco Falabella Chile
a. Total Gross Loans (Nominal MMCH$)1Q 2Q 3Q 4Q
2005 279,663 294,864 324,756 351,4722006 381,344 403,665 430,883 444,1592007 465,000
b. Total Loan Provisions (Nominal MMCH$)1Q 2Q 3Q 4Q
2005 -9,680 -9,664 -9,946 -11,0812006 -11,742 -12,495 -13,307 -14,0502007 -14,842
c. Provisions/Loans1Q 2Q 3Q 4Q
2005 3.46% 3.28% 3.06% 3.15%2006 3.08% 3.10% 3.09% 3.16%2007 3.19%
d. Cummulative Net Write-offs (Nominal MMCH$)1Q 2Q 3Q 4Q
2005 1,482 3,256 5,295 7,5122006 2,434 4,682 7,437 11,0362007 3,585
Note: Write-offs are net of recoveries
4. CMR Peru
Note: CMR Peru uses the provisions schedule indicated by the Peruvian Superintendency of Banking and Insurance, which is characterized by more exigent provision standards than in Chile and portfolio write-offs that start at 120 days. Based on Chilean standards, the total Loan Provisions in Peru would be approximately 2.5%.
a. Total Gross Loans (Nominal MMUS$)1Q 2Q 3Q 4Q
2005 175,674 194,320 224,967 240,6072006 253,955 259,930 267,741 304,2192007 294,472
b. Total Loan Provisions (Nominal MMUS$)1Q 2Q 3Q 4Q
2005 -8,599 -8,448 -9,394 -9,7522006 -11,158 -14,505 -15,826 -17,2822007 -18,151
c. Provisions/Loans Peru1Q 2Q 3Q 4Q
2005 4.89% 4.35% 4.18% 4.05%2006 4.39% 5.58% 5.91% 5.68%2007 6.16%
d. Cummulative Net Write-offs (Nominal MMUS$)1Q 2Q 3Q 4Q
2005 1,059 2,184 2,944 3,7932006 1,141 2,607 4,187 5,7462007 1,841
Note: Write-offs are net of recoveries

Falabella S.A.C.I. Results – 1st Quarter of 2007_______
www.falabella.com 16
5. CMR Argentina
Note: As of 4Q 2004, additional voluntary charges are being debited against income of CMR Argentina in order to maintain a total provision on loans of at least 3.0%. If we exclude the voluntary charges from the calculation, loan provisions would total only 1.75%.
a. Total Gross Loans (Nominal MMUS$)1Q 2Q 3Q 4Q
2005 30,683 34,887 35,740 37,7292006 37,997 42,920 43,946 53,9832007 51,760
b. Total Loan Provisions (Nominal MMUS$)1Q 2Q 3Q 4Q
2005 -767 -977 -1,072 -1,1322006 -1,148 -1,309 -1,322 -1,6212007 -1,597
c. Provisions/Loans Argentina1Q 2Q 3Q 4Q
2005 2.50% 2.80% 3.00% 3.00%2006 3.02% 3.05% 3.01% 3.00%2006 3.09%
d. Cummulative Net Write-offs (Nominal MMUS$)1Q 2Q 3Q 4Q
2005 -65 -167 -260 -3192006 -32 -116 -193 -2902007 -49
Note: Write-offs are net of recoveries
6. CMR Colombia
Note: CMR Colombia began operation in October 2005.
a. Total Gross Loans (Nominal MMUS$)1Q 2Q 3Q 4Q
2005 3,4342006 12,347 18,420 27,111 37,6512007 43,386
b. Total Loan Provisions (Nominal MMUS$)1Q 2Q 3Q 4Q
2005 -292006 -164 -465 -972 -1,2322007 -1,402
c. Provisions/Loans Colombia1Q 2Q 3Q 4Q
2005 0.84%2006 1.33% 2.52% 3.59% 3.27%2007 3.23%
d. Cummulative Net Write-offs (Nominal MMUS$)1Q 2Q 3Q 4Q
2005 02006 0 0 94 6032007 506
Note: Write-offs are net of recoveries

Falabella S.A.C.I. Results – 1st Quarter of 2007_______
www.falabella.com 17
VII. Financial Structure 1. Financial Debt-to-Equity Ratio as of March 31, 2007
Note: Total Financial Debt as of March 31, 2007 = MMUS$1,160,528 (MMUS$ 2,152.3). It includes the credit business debt. As of 1Q 2007, it also included the financial debt of the Malls Plaza that are consolidated with Falabella. 2. Financial Debt Structure as of March 31, 2007
3. Liabilities/Equity Ratio as of March 31, 2007
Note: Liabilities totaled MMCH$1,616,479 as of March 31, 2007 and they included the credit business debt. As of 1Q 2007, it also included the liabilities of the Malls Plaza that are consolidated with Falabella. 4. Liability Structure as of March 31, 2007
Financial Debt / Equity
0.64 0.85
1Q 2006 1Q 2007
Financial Debt Structure
47% 44%
53% 56%
1Q 2006 1Q 2007
Short-Term Debt Long-Term Debt
Total Liabilities/Equity
0.951.18
1Q 2006 1Q 2007
Liability Structure
64% 58%
36% 42%
1Q 2006 1Q 2007
S/T Liabilities L/T Liabilities

Falabella S.A.C.I. Results – 1st Quarter of 2007_______
www.falabella.com 18
VIII. Stores and Selling Space 1. Chile Department Stores (m2 of sales space)
N° StoreSelling Space Opening
1-6 Paseo Ahumada 7,929 Oct-18897 Barros Arana 6,010 may-628 Parque Arauco 12,030 oct-839 Temuco 5,827 may-86
10 Viña del Mar 5,091 sep-8711 Plaza Vespucio 9,048 ago-9012 Lyon 7,856 feb-9213 Rancagua 5,647 feb-9214 Calama 5,554 may-9315 Alto Las Condes 9,470 oct-9316 Plaza Oeste 11,109 nov-9417 Plaza del Trébol 6,296 abr-9518 Valdivia 2,817 abr-9519 Osorno 3,425 oct-9520 Chillán 4,796 sep-9621 Talca 5,132 may-9722 Copiapó 3,349 mar-9823 Plaza Tobalaba 7,085 nov-9824 La Serena 4,998 nov-9825 Valparaíso 5,701 feb-9926 Curicó 4,097 sep-0027 Iquique 5,129 sep-0028 Puerto Montt 4,550 jul-0129 Quilpué 4,398 sep-0130 Plaza Los Angeles 5,155 mar-0331 Plaza Norte 5,677 nov-0332 Paseo Puente 7,739 oct-0533 La Dehesa 7,904 nov-0534 Antofagasta Mall 9,164 oct-0635 La Calera 4,994 nov-06
TOTAL 187,977
Note: The Antofagasta store measuring 8,344 m2 was closed on December 31, 2006.

Falabella S.A.C.I. Results – 1st Quarter of 2007_______
www.falabella.com 19
2. Tiendas Sodimac Chile (m2 of selling space)
N° StoreSelling Space Opening
1 HC Valdivia 5,186 ene-822 HC Temuco 8,656 ene-823 HC Talca 7,891 ene-824 HC Pto.Montt 9,465 ene-825 HC Los Angeles 4,627 ene-826 HC La Serena 13,118 ene-827 HC Copiapó 5,491 ene-828 HC Calama 6,703 ene-829 HC Arica 6,267 ene-82
10 HC Antofagasta 5,951 ene-8211 Co Viña del Mar 5,241 ene-8212 Co Valparaíso 670 ene-8213 Co Vallenar 3,594 ene-8214 Co Talcahuano 1,799 ene-8215 Co Rancagua 1,752 ene-8216 HC Pta. Arenas 3,293 ene-8217 Co Maipú 4,240 ene-8218 Co Castro 326 ene-8219 HC Concepción 4,629 jun-8720 HC Las Condes 8,778 mar-8821 Co Vic. Mackenna 2,990 ene-9222 Co Antofagasta 6,323 ene-9223 HC Viña del Mar 6,330 oct-9224 Co Cantagallo 5,868 ene-9325 HC La Florida 6,666 jul-9326 HC Ñuñoa (Castillo Velasco) 4,837 sep-9327 HC Rancagua 10,724 nov-9528 HC SS Puente Alto 9,079 oct-9629 Co SS Puente Alto 7,793 oct-9630 HC Quilpue 8,123 nov-9631 Co La Florida 6,934 mar-9732 HC Maipu 13,980 jul-9833 HC La Florida (ex HomeStore) 11,402 ago-9834 HC El Trebol 14,440 nov-9835 HC Cerrillos (ex HomeStore) 14,400 dic-9836 Co Reñaca Alto 7,015 dic-9837 HC Parque Arauco (ex HomeStore) 9,292 oct-9938 So Concepción (ex HomeStore) 8,757 dic-9939 HC La Reina (ex HomeStore) 12,172 abr-0240 HC Ñuble (ex HomeStore) 9,873 jun-0241 HC San Miguel 13,020 jun-0242 HC SS Nueva La Florida 12,233 nov-0243 Co SS Nueva La Florida 6,219 nov-0244 HC SS Temuco 13,336 abr-0345 HC Huechuraba 11,327 nov-0346 Co Villarrica 5,554 feb-0447 HC Osorno 8,524 jul-0548 HC Angol 4,214 sep-0549 HC Chillan 8,781 dic-0550 HC Coyhaique 5,941 ene-0651 HC Curico 7,733 mar-0652 HC Coquimbo 5,774 mar-0653 HC La Calera 7,905 jul-0654 Co Fontova 7,351 sep-0655 HC San Felipe 9,453 nov-0656 HC Iquique 9,955 feb-07
TOTAL 421,995
Falabella S.A.C.I. Results – 1st Quarter of 2007_______
www.falabella.com 20
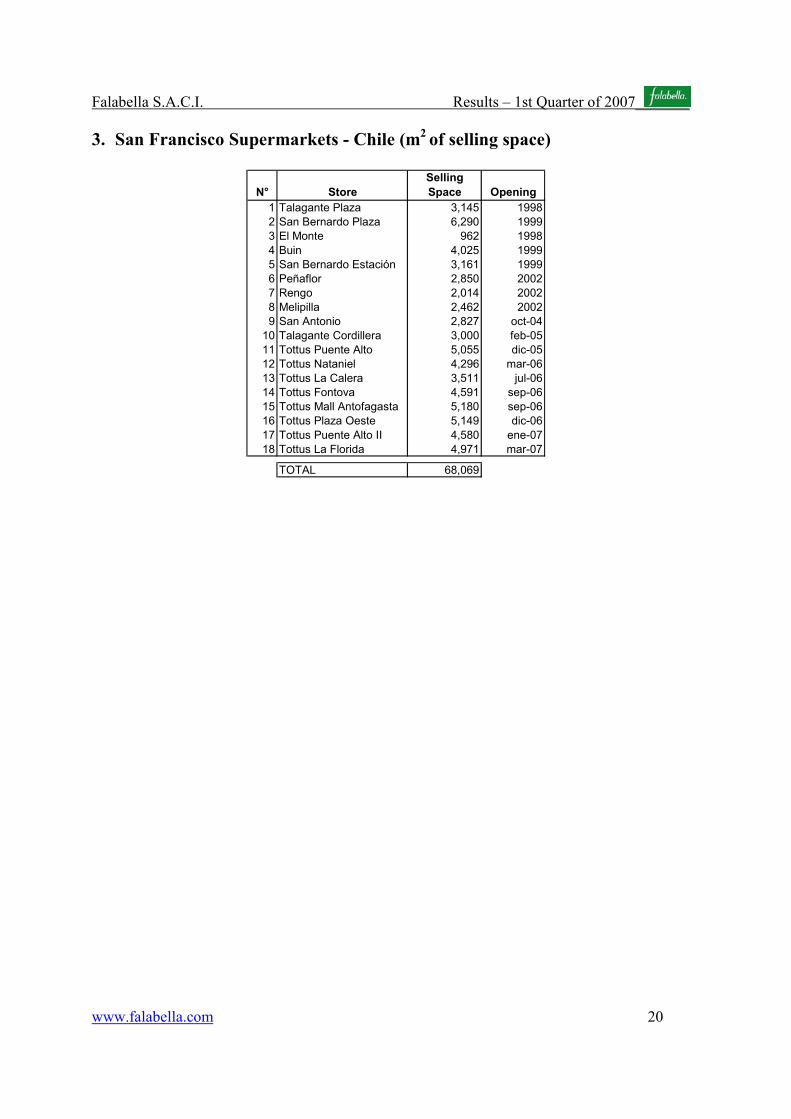
3. San Francisco Supermarkets - Chile (m2 of selling space)
N° StoreSelling Space Opening
1 Talagante Plaza 3,145 19982 San Bernardo Plaza 6,290 19993 El Monte 962 19984 Buin 4,025 19995 San Bernardo Estación 3,161 19996 Peñaflor 2,850 20027 Rengo 2,014 20028 Melipilla 2,462 20029 San Antonio 2,827 oct-04
10 Talagante Cordillera 3,000 feb-0511 Tottus Puente Alto 5,055 dic-0512 Tottus Nataniel 4,296 mar-0613 Tottus La Calera 3,511 jul-0614 Tottus Fontova 4,591 sep-0615 Tottus Mall Antofagasta 5,180 sep-0616 Tottus Plaza Oeste 5,149 dic-0617 Tottus Puente Alto II 4,580 ene-0718 Tottus La Florida 4,971 mar-07
TOTAL 68,069

Falabella S.A.C.I. Results – 1st Quarter of 2007_______
www.falabella.com 21
4. Peru11
Department Stores (m2 of selling space)
N° StoreSelling Space Opening
1 San Isidro 11,848 19952 San Miguel 10,767 19953 Jockey Plaza 10,739 19974 Lima Centro 4,565 19985 Trujillo 569 20016 Chiclayo 356 20017 Piura 2,485 20018 Arequipa 4,915 20029 Miraflores 7,074 oct-05
10 Chiclayo Mall 3,709 oct-0511 Megaplaza 9,096 oct-0612 Cajamarca 1,155 mar-07
TOTAL 67,278
Home Improvement (m2 of selling space)
N° StoreSelling Space Opening
1 Sodimac San Miguel 11,715 20042 Sodimac Megaplaza 9,989 May-053 Sodimac Atocongo 8,440 Abr-064 Sodimac Javier Prado 8,613 Mar-07
TOTAL 38,757
Supermarkets (m2 of selling space)
N° StoreSelling Space Opening
1 Tottus Megaplaza 8,391 20022 Tottus San Isidro 5,616 20033 Tottus San Miguel 9,097 20044 Tottus Atocongo 7,231 Abr-06
TOTAL 30,335
11 The downtown Lima store includes the La Merced Lima Store (Electro only).
Falabella S.A.C.I. Results – 1st Quarter of 2007_______
www.falabella.com 22
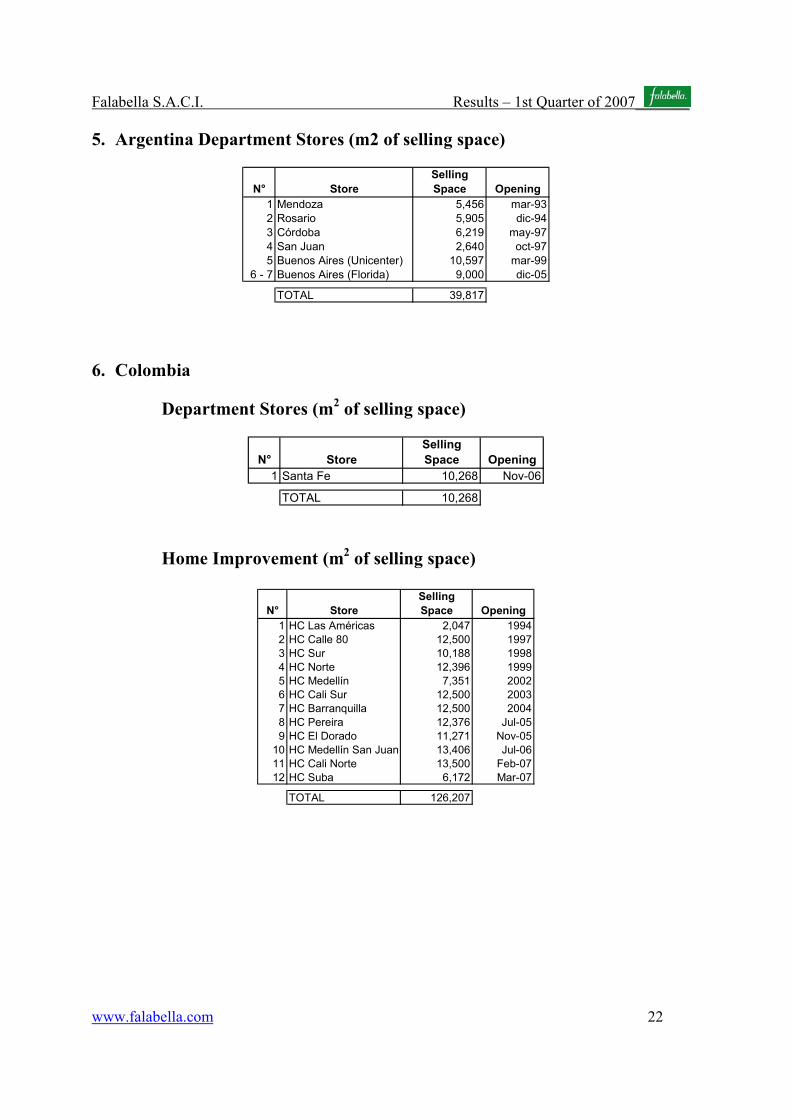
5. Argentina Department Stores (m2 of selling space)
N° StoreSelling Space Opening
1 Mendoza 5,456 mar-932 Rosario 5,905 dic-943 Córdoba 6,219 may-974 San Juan 2,640 oct-975 Buenos Aires (Unicenter) 10,597 mar-99
6 - 7 Buenos Aires (Florida) 9,000 dic-05
TOTAL 39,817 6. Colombia
Department Stores (m2 of selling space)
N° StoreSelling Space Opening
1 Santa Fe 10,268 Nov-06
TOTAL 10,268 Home Improvement (m2 of selling space)
N° Store
Selling Space Opening
1 HC Las Américas 2,047 19942 HC Calle 80 12,500 19973 HC Sur 10,188 19984 HC Norte 12,396 19995 HC Medellín 7,351 20026 HC Cali Sur 12,500 20037 HC Barranquilla 12,500 20048 HC Pereira 12,376 Jul-059 HC El Dorado 11,271 Nov-05
10 HC Medellín San Juan 13,406 Jul-0611 HC Cali Norte 13,500 Feb-0712 HC Suba 6,172 Mar-07
TOTAL 126,207

Falabella S.A.C.I. Results – 1st Quarter of 2007_______
www.falabella.com 23
IX. Financial Statements of S.A.C.I. Falabella - FECU

S.A.C.I. FALABELLACONSOLIDATED BALANCE SHEETS
Expressed in Millions of Historical Chilean Pesos as of March 31 2007 and 2006
2007 2006ASSETS
Current Assets 1.310.089 1.111.879Cash 47.089 26.961Time deposits 1.020 4.655Marketeable securities 18.627 31.265Trade receivables 759.647 645.965Notes receivables 29.163 19.346Other receivables 33.261 26.811Notes and accounts receivable from related parties 2.249 2.131Inventories 342.750 296.308Recoverable taxes 38.152 23.365Prepaid expenses 17.122 8.222Deferred income taxes 10.039 10.677Other current assets 10.972 16.173Leasing agreements 0 0Leasing assets 0 0
Property, Plant and Equipment 1.024.821 584.252Land 243.722 154.275Buildings and infrastructure 498.495 250.159Machinery and equipment 143.278 119.492Other property, plant and equipment 464.589 322.365Technical reappraisal of property, plant and equipment 1.740 1.739Accumulated depreciation (327.003) (263.778)Other Assets 649.376 618.189Investments in related companies 125.412 146.435Investments in other societies 2.705 3.398Goodwill 244.767 220.245Negative goodwill (7) (10)Long Term receivables 118.611 90.492Notes and accounts receivable from relates parties 1.488 2.129Deferred income taxes 0 2.674Intangibles assets 153.234 150.579Amortization (15.084) (10.666)Other long-term assets 18.251 12.913Long-term leasing 0 0Total Assets 2.984.286 2.314.319

S.A.C.I. FALABELLACONSOLIDATED BALANCE SHEETS
Expressed in Millions of Historical Chilean Pesos as of March 31 2007 and 2006
2007 2006LIABILITIES
Current Liabilities 939.639 719.642Short-term bank borrowings 404.989 298.725Current portion of long-term bank borrowings 47.421 26.353Obligations with the public (promissory notes) 30.969 27.456Current portion of bonds payable 23.936 7.949Current portion of long-term borrowings 0 0Dividends to be paid 215 170Trade account payables 303.200 257.727Documents payable 49.531 34.537Sundry creditors 16.610 10.862Notes and accounts payable to related companies 11.904 12.669Accruals 27.907 24.109Withholdings 14.381 12.072Income tax 2.793 2.874Unearned income 5.738 4.139Deferred taxes 0 0Other short-tem liabilities 44 0
Total long-term liabilities 676.840 408.822Long-term bank borrowings 234.993 149.855Bonds payable 418.219 251.467Documents payable - long-term 3.256 3.438Sundry creditors 258 0Notes and accounts payable to related companies 0 2.364Accruals 1.704 1.486Deferred taxes 10.909 0Other long-term liabilities 7.500 211Minority interest 65.180 17.615
Shareholder's Equity 1.302.627 1.168.241Paid-in capital 453.151 455.814Capital revaluation reserve 906 (1.367)Additional paid-in capital 1.800 1.801Other reserves (11.736) (12.796)Retained earnings 858.507 724.790Reserve for future dividends 0 0Accumulated profits 835.789 706.587Accumulated loss 0 0Net income (loss) 51.323 42.688Interim dividends (28.616) (24.466)Deficit from development period 10 (20)
Total Liabilities 2.984.286 2.314.319

S.A.C.I. FALABELLACONSOLIDATED INCOME STATEMENT
Expressed in Millions of Historical Chilean Pesos as of March 31 2007 and 2006
2007 2006
Operating Income 67.226 49.328Gross Margin 184.232 150.404Revenues 638.281 532.734Cost of sales (454.049) (382.330)Selling , general and administrative expenses (117.007) (101.077)
Non-operating Income (2.120) 639Financial income 1.309 587Profit on investments in related companies 8.717 10.503Other non-operating income 5.911 1.083Loss on investment in related companies (9) (18)Amortization of goodwill (3.664) (3.339)Financial expenses (10.609) (7.236)Other non-operating expenses (2.994) (1.780)
Price-level restatement (584) 1.308Exchange differentials (197) (469)Profit Before Income Tax & Extraordinary Items 65.106 49.967Income Tax (10.716) (6.837)Extraordinary Items 0 0Profit (loss) before minority interest 54.390 43.130Minority interest (3.068) (442)Net profit (loss) 51.323 42.687Amortization of negative goodwill 1 1Profit (loss) in the fiscal year 51.323 42.688

S.A.C.I. FALABELLACONSOLIDATED STATEMENT OF CASH FLOWS
Expressed in Millions of Historical Chilean Pesos as of March 31 2007 and 2006
2007 2006
Cash Flows From Operating Activities 53.065 36.102Collection of trade receivables 788.028 640.058Financial income received 1.854 0Dividends received 492 923Other income received 5.369 612Payments to suppliers and personnel (698.375) (566.601)Interest paid (14.582) (7.723)Income tax payments (9.485) (9.869)Other expenses (1.184) (841)VAT and other taxes paid (19.051) (20.456)
Cash Flows From Financing Activities 48.023 (6.846)Proceeds from issuance of common stock 2.076 0Borrowings from banks 242.138 160.961Proceeds from issuance of bonds 361.925 402.552Borrowings from related companies 0 0Other borrowings from related companies 2.721 0Other sources of financing 7.625 0Payment of dividends (0) 0Distribution of capita (4) (3)Payment of loans (215.292) (164.394)Payment of public liabilities incurred (353.166) (405.962)Payment of related companies loans 0 0Payment of other related companies loans 0 0Payment of common stock issuance costs 0 0Payment of bond issuance costs 0 0Other payments 0 0
Cash Flows From Investing Activities (98.388) (21.081)Proceeds from sales of property, plant and equipment 5 162Proceeds from sales of long-term investments 0 0Proceeds from sales of other investments 0 0Collection of loans to related companies 0 1.518Collections of other loans to related companies 0 0Other investment income 86 425Additions to property, plant and equipment (47.769) (19.880)Payment of interest capitalized 0 0Purchase of permanent investments (50.329) 0Investments in financial instruments 0 (445)Loans to related companies 0 0Other payments to related companies 0 0Other payments of investments (381) (2.861)
Net Cash Flow 2.701 8.175
Price-level Restatements of Cash and Cash Equivalents (568) (365)Net Increase (Decrease) in Cash and Cash Equivalents 2.132 7.810Cash and Cash Equivalents at Beginning of Period 64.603 58.151Cash and Cash Equivalents at End of Period 66.736 65.961

S.A.C.I. FALABELLACONSOLIDATED RECONCILIATION BETWEEN NET INCOME AND CASH FLOWS
Expressed in Millions of Historical Chilean Pesos as of March 31 2007 and 2006
2007 2006
Net Income 51.323 42.688
Income on sale of assets 1 192Gain on sales of property, plant and equipment 1 192Gain on sales of investments 0 0Loss on sales of investments 0 0Gain (loss) on sales of other assets 0 0
Other Debits (Credits) to income that do not represent cash flows 30.256 16.877Depreciation 14.297 11.378Amortization of Intangibles 1.073 1.043Write-offs and provisions 18.709 15.101Equity in gains of unconsolidated affiliates (8.717) (10.503)Equity in losses of unconsolidated affiliates 9 18Amortization of goodwill 3.664 3.339Amortization of negative goodwill (1) (1)Price-level restatement 584 (1.308)Exchange differentials 197 469Other credits to income that do not represent cash flows (9.119) (8.290)Other debits to income that do not represent cash flows 9.561 5.631
Changes in operating assets 15.795 15.205Receivables 54.917 39.423Inventories (32.618) (16.701)Other current assets (6.504) (7.516)
Changes in operating liabilities (47.378) (39.302)Trade accounts payable and notes payables relating to operating activities (40.559) (43.777)Taxes to be paid 4.561 2.570Net income tax (1.348) 948Other trade accounts payable relating to operating activities (3.896) 8.030VAT and other taxes (6.137) (7.073)
Income attributable to minority interest 3.068 442Net cash provided by operating activities 53.065 36.102

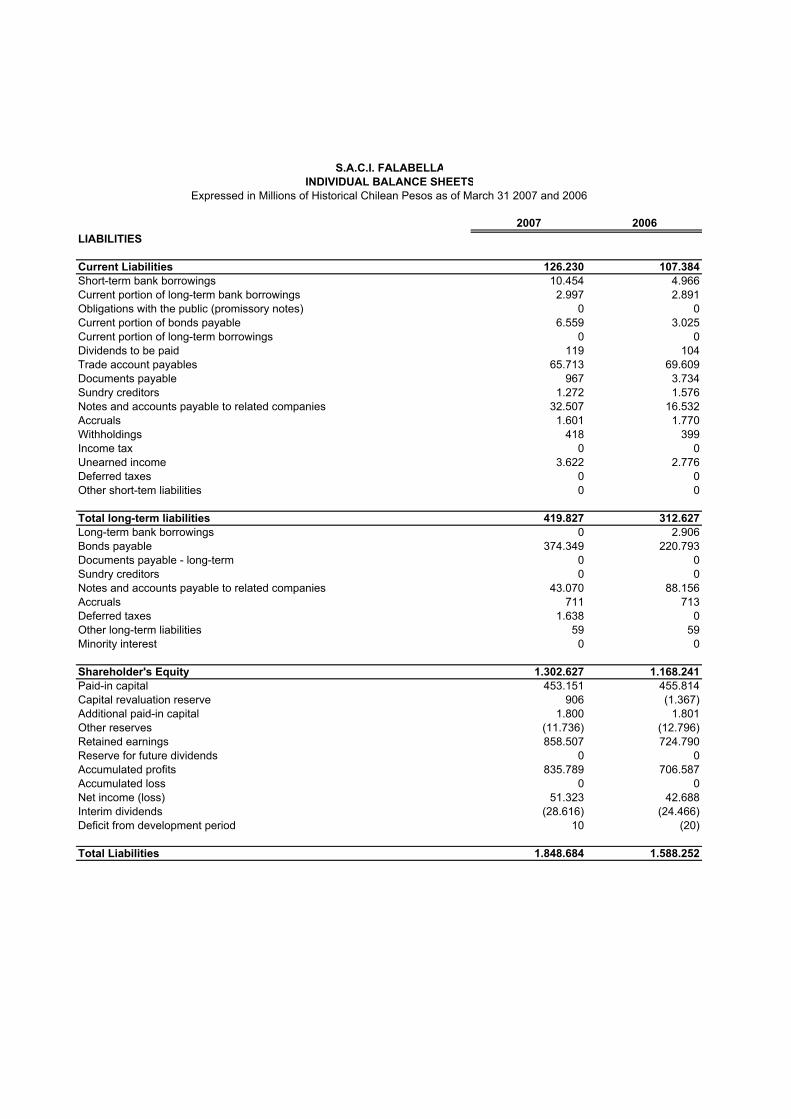
S.A.C.I. FALABELLAINDIVIDUAL BALANCE SHEETS
Expressed in Millions of Historical Chilean Pesos as of March 31 2007 and 2006
2007 2006ASSETS
Current Assets 347.373 223.551Cash 13.306 7.795Time deposits 0 2.693Marketeable securities 0 1.232Trade receivables 4.450 3.137Notes receivables 6.068 5.785Other receivables 4.202 2.169Notes and accounts receivable from related parties 197.067 78.103Inventories 110.116 112.912Recoverable taxes 1.277 2.957Prepaid expenses 4.997 1.097Deferred income taxes 1.411 1.634Other current assets 4.479 4.036Leasing agreements 0 0Leasing assets 0 0
Property, Plant and Equipment 74.619 46.751Land 0 0Buildings and infrastructure 0 0Machinery and equipment 14.277 12.503Other property, plant and equipment 134.498 98.055Technical reappraisal of property, plant and equipment 0 0Accumulated depreciation (74.157) (63.807)Other Assets 1.426.692 1.317.950Investments in related companies 1.399.342 1.287.941Investments in other societies 0 0Goodwill 9.510 10.420Negative goodwill 0 0Long Term receivables 46 96Notes and accounts receivable from relates parties 2.750 2.756Deferred income taxes 0 1.269Intangibles assets 233 200Amortization (79) (59)Other long-term assets 14.891 15.327Long-term leasing 0 0Total Assets 1.848.684 1.588.252
S.A.C.I. FALABELLAINDIVIDUAL BALANCE SHEETS
Expressed in Millions of Historical Chilean Pesos as of March 31 2007 and 2006
2007 2006LIABILITIES
Current Liabilities 126.230 107.384Short-term bank borrowings 10.454 4.966Current portion of long-term bank borrowings 2.997 2.891Obligations with the public (promissory notes) 0 0Current portion of bonds payable 6.559 3.025Current portion of long-term borrowings 0 0Dividends to be paid 119 104Trade account payables 65.713 69.609Documents payable 967 3.734Sundry creditors 1.272 1.576Notes and accounts payable to related companies 32.507 16.532Accruals 1.601 1.770Withholdings 418 399Income tax 0 0Unearned income 3.622 2.776Deferred taxes 0 0Other short-tem liabilities 0 0
Total long-term liabilities 419.827 312.627Long-term bank borrowings 0 2.906Bonds payable 374.349 220.793Documents payable - long-term 0 0Sundry creditors 0 0Notes and accounts payable to related companies 43.070 88.156Accruals 711 713Deferred taxes 1.638 0Other long-term liabilities 59 59Minority interest 0 0
Shareholder's Equity 1.302.627 1.168.241Paid-in capital 453.151 455.814Capital revaluation reserve 906 (1.367)Additional paid-in capital 1.800 1.801Other reserves (11.736) (12.796)Retained earnings 858.507 724.790Reserve for future dividends 0 0Accumulated profits 835.789 706.587Accumulated loss 0 0Net income (loss) 51.323 42.688Interim dividends (28.616) (24.466)Deficit from development period 10 (20)
Total Liabilities 1.848.684 1.588.252

S.A.C.I. FALABELLAINDIVIDUAL INCOME STATEMENT
Expressed in Millions of Historical Chilean Pesos as of March 31 2007 and 2006
2007 2006
Operating Income 2.221 2.214Gross Margin 42.458 38.688Revenues 156.537 145.142Cost of sales (114.079) (106.454)Selling , general and administrative expenses (40.237) (36.473)
Non-operating Income 49.321 40.475Financial income 502 76Profit on investments in related companies 50.324 43.918Other non-operating income 4.636 464Loss on investment in related companies (104) (74)Amortization of goodwill (196) (221)Financial expenses (5.357) (4.014)Other non-operating expenses (369) (379)
Price-level restatement (279) 298Exchange differentials 164 407Profit Before Income Tax & Extraordinary Items 51.541 42.689Income Tax (218) (1)Extraordinary Items 0 0Profit (loss) before minority interest 51.323 42.688Minority interest 0 0Net profit (loss) 51.323 42.688Amortization of negative goodwill 0 0Profit (loss) in the fiscal year 51.323 42.688

S.A.C.I. FALABELLAINDIVIDUAL STATEMENT OF CASH FLOWS
Expressed in Millions of Historical Chilean Pesos as of March 31 2007 and 2006
2007 2006
Cash Flows From Operating Activities 22.667 21.703Collection of trade receivables 214.439 199.123Financial income received 502 76Dividends received 3.688 3.179Other income received 4.631 467Payments to suppliers and personnel (197.636) (177.449)Interest paid (182) (183)Income tax payments (231) (206)Other expenses (369) (379)VAT and other taxes paid (2.175) (2.924)
Cash Flows From Financing Activities (24.894) (18.789)Proceeds from issuance of common stock 0 0Borrowings from banks 5.910 0Proceeds from issuance of bonds 0 0Borrowings from related companies 0 0Other borrowings from related companies 0 0Other sources of financing 0 0Payment of dividends 0 0Distribution of capita 0 0Payment of loans 0 (5.121)Payment of public liabilities incurred 0 0Payment of related companies loans 0 0Payment of other related companies loans (30.804) (13.668)Payment of common stock issuance costs 0 0Payment of bond issuance costs 0 0Other payments 0 0
Cash Flows From Investing Activities (2.666) (3.801)Proceeds from sales of property, plant and equipment 0 0Proceeds from sales of long-term investments 0 0Proceeds from sales of other investments 0 0Collection of loans to related companies 0 0Collections of other loans to related companies 0 0Other investment income 0 0Additions to property, plant and equipment (2.666) (3.801)Payment of interest capitalized 0 0Purchase of permanent investments 0 0Investments in financial instruments 0 0Loans to related companies 0 0Other payments to related companies 0 0Other payments of investments 0 0
Net Cash Flow (4.893) (888)
Price-level Restatements of Cash and Cash Equivalents (462) 26Net Increase (Decrease) in Cash and Cash Equivalents (5.355) (862)Cash and Cash Equivalents at Beginning of Period 18.661 12.582Cash and Cash Equivalents at End of Period 13.306 11.721

S.A.C.I. FALABELLAINDIVIDUAL RECONCILIATION BETWEEN NET INCOME AND CASH FLOWSExpressed in Millions of Historical Chilean Pesos as of March 31 2007 and 2006
2007 2006
Net Income 51.323 42.688
Income on sale of assets 0 0Gain on sales of property, plant and equipment 0 0Gain on sales of investments 0 0Loss on sales of investments 0 0Gain (loss) on sales of other assets 0 0
Other Debits (Credits) to income that do not represent cash flows (42.309) (38.535)Depreciation 3.203 2.610Amortization of Intangibles 4 5Write-offs and provisions 240 750Equity in gains of unconsolidated affiliates (50.324) (43.918)Equity in losses of unconsolidated affiliates 104 74Amortization of goodwill 196 221Amortization of negative goodwill 0 0Price-level restatement 279 (298)Exchange differentials (164) (407)Other credits to income that do not represent cash flows (1.022) (1.404)Other debits to income that do not represent cash flows 5.176 3.832
Changes in operating assets 17.848 20.848Receivables 26.915 25.766Inventories (12.756) (8.096)Other current assets 3.688 3.179
Changes in operating liabilities (4.195) (3.298)Trade accounts payable and notes payables relating to operating activities (7.535) (3.794)Taxes to be paid 4.913 3.339Net income tax (18) (211)Other trade accounts payable relating to operating activities 369 379VAT and other taxes (1.924) (3.012)
Income attributable to minority interest 0 0Net cash provided by operating activities 22.667 21.703

Falabella S.A.C.I. Results – 1st Quarter of 2007_______
www.falabella.com
S.A.C.I. Falabella Address: Rosas 1665 Santiago, Chile Contacts: Juan Guillermo Espinosa F. / Roberto Salas S. Corporate Planning and Development Division Phone: (56 2) 380 2007 E-mail: [email protected] / [email protected] Website: www.falabella.com Click on “Inversionistas” at the page bottom. The information in this report was prepared on the basis of the Uniform Codified Statistical Record (FECU) reported to the Superintendency of Securities and Insurance (SVS). S.A.C.I. Falabella assumes no liability for damages, injuries or losses that may result from the interpretation of this report or the evolution of markets, in particular the stock exchange.