Embed Size (px)
Citation preview
CENTER FOR LABOR ECONOMICS UNIVERSITY OF CALIFORNIA, BERKELEY WORKING PAPER NO. 56
Fairness and Freight-Handlers: A Test of Fair-Wage Theory in a Trucking Firm*
Eric Verhoogen Department of Economics
University of California, Berkeley
Stephen V. Burks Economics & Management
University of Minnesota, Morris
Jeffrey P. Carpenter Department of Economics
Middlebury College
September 2002
ABSTRACT We draw on evidence from an internal attitude survey in a national, unionized trucking firm to investigate the factors that influence employees’ wage-fairness perceptions and the effect of such perceptions on employee performance. We find a robust association between the rate of unemployment in the local labor market and wage-fairness perceptions of employees in the firm, which we argue reflects a causal relationship. The gap between an individual employee’s current wage and her predicted wage in the outside labor market has a similar, but less robust, effect. We also find modest support for the proposition that increases in wage-fairness perceptions generate improvements in employee performance, as measured by the rate of disciplinary dismissals. * We would like to thank: the firm we study for sharing data with us; Michael Belzer of the University of Michigan Trucking Industry Program (UMTIP) and an UMTIP project funded by the Sloan Economic Foundation for facilitating data access; Michael Conyngham, Director of Research, International Brotherhood of Teamsters, for help in gathering contract wage data; Ken Chay, John DiNardo, Herb Gintis, David Lee, David Levine, Peter Matthews, Matthew Rabin, Stan Sedo, Pete Swan, seminar participants at UC Berkeley and the Santa Fe Institute, and especially George Akerlof and David Card for helpful comments; and the McArthur Research Network on Norms and Preferences for funding. Carpenter would like to thank the National Science Foundation (SES-CAREER 0092953) and Verhoogen the McArthur Foundation Research Network on the Costs of Inequality for additional funding. We are of course responsible for any mistakes. Address correspondence to Eric Verhoogen, email [email protected].
2
I. INTRODUCTION
The fair-wage theory of efficiency wages, as formalized by Akerlof [1982] and Akerlof
and Yellen [1990], is based on a simple causal proposition: the fairer an employee considers her
wage, the harder she will work. The theory has captured the attention of an increasing number
of economists, in part because it provides a parsimonious explanation for such long-standing
empirical regularities as the existence of involuntary unemployment and the consistency of
inter-industry wage differentials across occupational categories [Dickens and Katz, 1987; Katz
and Summers, 1989; Krueger and Summers, 1986, 1987]. The theory accords with evidence
from surveys of managers, who typically report that they believe fairness perceptions influence
their employees’ behavior and take those perceptions into account in their wage and
employment decisions [Agell and Lundborg, 1995; Bewley, 1999; Blinder and Choi, 1990;
Campbell and Kamlani, 1997; Foulkes, 1981; Kaufman 1984; Levine, 1993b]. A growing body
of experimental literature also supports the theory: in laboratory games with monetary stakes
[Fehr et al, 1993, 1997, 1998; Charness and Rabin, 2000], subjects consistently act in such a way
as to reward behavior they perceive as fair and punish behavior they perceive as unfair, even at
a cost to themselves.
The existing empirical literature on fairness, however, has left two important issues
unresolved. First, we still know relatively little about the exogenous determinants of workers’
fairness judgments in real workplaces. The experimental literature in economics, together with
older literatures in psychology and sociology, has established that people tend to form fairness
judgments in reference to an alternative transaction or aspect of behavior that has come to be
seen as fair, often referred to as a reference point (see Kahneman, Knetsch, and Thaler [1986] and
the review in Akerlof and Yellen [1990].) It also reveals, however, that the process by which an
3
alternative transaction comes to be seen as fair can be sensitive to apparently incidental details
of the framing of an experiment or hypothetical situation. As a consequence, the experimental
results are not a reliable indicator of whether employees in real workplaces form fairness
perceptions in reference to the salaries of other employees in the same workplace, the profits of
the firm, conditions in the outside labor market, or some other point of comparison.1
Second, existing studies have not been able to identify the causal effect of wage-fairness
perceptions on employee performance in real workplaces. Experiments are able to assign
subjects randomly to treatment groups, and have thereby been able to identify causal effects
under carefully controlled conditions. The settings of such experiments are necessarily quite
stylized and artificial, however, and subjects’ behavior in them may not reflect how they would
behave in actual work environments. A number of studies in real-life contexts have found
positive correlations between relative wages, perceptions of wage fairness, and/or some
measure of employee performance.2 Because of data limitations, however, these studies have
not been able to distinguish between the causal effect posited by the fair-wage theory, the effect
of selection of highly productive workers with management-friendly attitudes into high-wage
workplaces, and the effects of unobserved heterogeneity across firms or across plants within
the same firm.3
1 The surveys of managers provide some clues to the process by which employees form fairness
judgments, but it is not clear that managers’ opinions of that process are accurate. Our results on unemployment in this paper, for instance, are inconsistent with the findings in Levine [1993b].
2 Levine [1992a], Lincoln and Kalleberg [1990, 1996], and Cappelli and Sherer [1988] find that workers express more satisfaction with their wage when their wage is above the going market rate. (See also Akerlof, Andrew Rose, and Yellen [1988].) Cappelli and Chauvin [1991], Spitz [1993] Levine [1992b], Wadhwani and Wall [1991], and Huang et al [1998] investigate the reduced-form relationship between outside labor market conditions and productivity. Norsworthy and Zabala [1985a, 1985b, 1990] examine the relationship between employee attitudes and productivity (see also Straka [1993] for a critique of their econometric method.)
3 Examples of such unobserved heterogeneity are differences in the ability of managers to motivate employees on a personal level, which might generate a correlation between employee attitudes and performance; and regional differences in the history of labor-management relations and work culture between the relatively high-wage industrial Northeast and Midwest and the relatively low-wage rural South, which might generate a correlation between relative wages and employee attitudes.
4
In this paper, we draw on evidence from an internal company attitude survey to address
these two issues – what makes a wage fair, and what is the causal effect of wage-fairness
perceptions on employee performance – in one particular set of workplaces: the freight-
handling terminals of a large, unionized U.S. trucking firm. We have attitude data for 29
geographically dispersed terminals for each year over the period 1996-2000.4 The institutional
characteristics of the firm limit variation in internal wage structure, preventing us from
identifying the internal determinants of fairness perceptions, but they are ideally suited to a
study of the external determinants of those perceptions. Wages at each terminal are determined
in collective bargaining at a national and regional level, and local managers have no discretion
to vary wage rates in response to local labor market conditions. Economic shocks in the local
area surrounding each terminal thus generate exogenous variation in the attractiveness of the
wage paid by the firm relative to employees’ options in the outside labor market.5 We relate this
variation to variation in fairness perceptions within each terminal. We then relate the
exogenous component of variation in fairness perceptions to variation in a measure of
employee performance.
Our strongest result is that there exists a robust association between the rate of
unemployment in the local labor market and the wage-fairness perceptions of employees. After
addressing plausible counter-arguments, we argue that this relationship can be given a causal
interpretation: an increase in the local unemployment rate leads employees to consider that they
are being paid more fairly, and a decrease has the opposite effect. The local unemployment
rate, in other words, appears to be an important reference point – or at least a component of a
4 The firm operates more terminals than we have data for. We do not report the exact number of terminals in order to preserve the confidentiality of the firm.
5 Because the variation in the relative attractiveness of the wage is not a consequence of intentional behavior by managers, our research design does not shed light on the importance of intentions in the formation of fairness judgments, as emphasized for instance in Rabin [1993]. Rather, we test the original formulation of Akerlof [1982], in which the effect of relative wage premia on fairness perceptions does not depend on how those premia are brought about.
5
composite reference point – for workers’ fairness judgments. The gap between an individual
employee’s current wage and his predicted wage in the outside labor market has a similar, but
less robust, effect.
In our second stage, we use indicators of local labor market conditions as instruments
for wage-fairness perceptions to estimate the causal effect of such perceptions on employee
performance. As an indicator of employee performance, we use the rate of disciplinary
dismissals, which we assume varies inversely with the amount of effort or dedication to the job
supplied by workers. We cannot definitively rule out the possibility that local labor market
conditions affect the dismissal rate through an alternative mechanism, namely the effect on
employees’ fear of losing their job. But under the assumption that local labor market conditions
affect the dismissal rate through their effect on wage-fairness perceptions rather than through
their effect on such fears of job loss, we find that an increase in the wage-fairness perceptions
of employees leads them to improve their performance. Our findings are not statistically
significant in our strictest specification, but they provide modest support – stronger evidence
than has yet appeared in the literature – for the key causal claim of the fair-wage theory.
Our paper is most closely related to the papers by Cappelli and Chauvin [1991] and
Spitz [1993], who also examine the relationship between local labor market conditions and
employee performance in different establishments of a single multi-establishment firm. Our
paper has three main advantages over these previous studies: we have information on employee
attitudes, and can examine directly the channel through which the fair-wage theory postulates
that local conditions affect productivity; we can follow individual establishments over time,
which allows us to control for unobserved heterogeneity among establishments; and we have
more extensive information on the characteristics of individual workers at each workplace, and
are better able to address the concern that our results are due to selection effects.
6
II. THE FIRM
The firm we study is a large, national carrier in the less-than-truckload segment of the
U.S. for-hire freight-hauling industry. The term less-than-truckload, as opposed to truckload,
refers to companies that mainly move freight smaller than the capacity of a standard tractor-
trailer.6 Unlike truckload companies, which require no special coordinating mechanism to ship
freight between two points, all successful less-than-truckload companies maintain a network of
distribution terminals to collect freight from surrounding catchment areas and consolidate it
into tractor-trailer-size loads for shipment to other terminals. Many of the larger firms in the
industry organize such local terminals into hub-and-spoke networks, with a second level of
consolidation taking place at hubs. Prior to the deregulation of the trucking industry in 1980,
most firms provided both truckload and less-than-truckload services. Following deregulation,
the industry divided sharply, with most firms specializing in one or the other segment.7 The
less-than-truckload segment, with higher barriers to entry in the form of costs of establishing
and maintaining a distribution network, has remained more oligopolistic than the truckload
segment, although industry analysts agree that price mark-ups over costs are low [Nebesky et a l,
1995] and in recent years smaller regional carriers have made inroads into the national market.
The labor market in the industry has segmented in parallel with the product market, with wages
6 The capacity of an entire tractor-trailer is about 45,000-50,000 lbs. A typical shipment in this segment is
1,000 lbs. 7 Industry analysts generally consider parcel carriers, such as the U.S. Postal Service and United Parcel
Service (UPS), to be a third segment of freight trucking, distinguished by even smaller shipment sizes than firms in the less-than-truckload segment.
7
and union coverage declining sharply in the truckload segment, but only slowly in the less-than-
truckload segment [Burks, 2002; Belzer, 1994, 1995, 2000].8
The hubs in the hub-and-spoke terminal networks are referred to in the industry as
breakbulk terminals. The breakbulk terminals in the firm we study are evenly dispersed across
the continental United States. In June, July or August of each year from 1996 to 2000, the firm
paid an outside consultant to conduct an anonymous survey of attitudes of its employees. We
have individual-level responses to the survey for 29 breakbulks.9 In this paper we focus on the
attitudes of dockworkers, the employees who load and unload freight. These workers are not
drivers; they are stationed permanently on a loading dock in a particular terminal. The work
they do is semi-skilled, requiring agile use of a forklift and some ingenuity to move and stack
freight of varying size, weight, shape and fragility compactly and with a minimum of damage.
We have data only on regular, full-time employees, not on contingent (“casual”) employees.
The attitude survey consisted of a series of statements – 20 in 1996-1998, 40 in 1999-2000 – to
which respondents were asked to agree or disagree. The statements addressed various aspects
of social relations within each terminal, including communication between employees and
managers, the quality of working conditions, and work rules and procedures. We focus on the
statement regarding wage fairness: “I feel I am paid fairly for the kind of work I do.”
Respondents filled in a bubble for one of three possible responses, “agree” “disagree” or “?”.
In 1996, 1997, and 1998, respondents were also asked to report their age, education, race, sex,
and tenure in the firm. In 1999 and 2000, partly in response to employee complaints, the
8 Burks [2002] presents a theoretical explanation for this parallel segmentation of the trucking-industry
labor and product markets, based on a combination of information asymmetries and fairness motivations in the employment relationship.
9 One terminal (#12) does not have attitude data in 1999.
8
demographic questions were dropped, but the tenure question remained.10 The average
response rate to the attitude survey was 71.5 percent and varied little across breakbulks.
Summary statistics on the demographic composition of the workforce, based on the
data available only in 1996-1998, appear in the first panel of Table I. The dockworkers in the
firm are almost entirely male and approximately three-quarters white, with a higher-than-
proportionate number of non-whites concentrated in a few terminals in the south. The modal
worker is 31-40 years of age, with only a high school diploma, although over 40 percent are
older than 40, and over 40 percent have some college experience or a college degree. Summary
statistics on tenure in the firm and responses to the fairness question, available in a ll five years,
are presented in the second panel of Table I. At least 35 percent of workers in the firm have
more than 10 years of tenure,11 and nearly 70 percent consider themselves to be paid fairly.12
Workers in the firm are unionized, and represented by the International Brotherhood
of Teamsters. Two characteristics of the collective bargaining process are especially relevant.
The first is that the pattern of changes in wages and working conditions are determined at a
national and regional level by negotiations between the Teamsters union and a consortium of
national trucking firms. The national negotiations, codified in the National Master Freight
Agreement, set the pattern of wage increases over the life of the contract. Relatively small
adjustments can then be made at a regional level in supplements to the national agreement,
again as the result of negotiations between the union and the consortium of firms. The second
10 The possible responses for age were: (1) 16-24, (2) 25-30, (3) 31-40, (4) 41-50 and (5) over 50; for
education: (1) Some high school, (2) High school degree, (3) Some college, and (4) College degree; for race: (1) White, (2) Black, (3) Hispanic, (4) Asian/Pacific Islander, and (5) Native American; for tenure: (1) <1 year, (2) 1-5 years, (3) 6-10 years, (4) >10 years. For the race variable, there were few Hispanic, Asian/Pacific Islander or Native American respondents; we included all four categories (2)-(5) in a single non-white category.
11 The fraction may be higher, since this figure does not include missing responses. 12 One unfortunate characteristic of the attitude data is that missing values were given the same code as
“?” responses, and are indistinguishable from those responses. In unreported results, we estimate the models treating the “?” as missing, as “agree” responses, and as “disagree” responses. The results are not significantly different from those we report here.
9
noteworthy characteristic of the collective bargaining process is that in the days of James Hoffa
Sr. in the 1960s, the Teamsters union successfully bargained for a nationally uniform wage for
each category of employees, to prevent management from shifting work geographically to
reduce wages [Levinson, 1981]. This wage structure persists, and still specifies nearly identical
wages for workers doing similar jobs across the country, despite large variations in regional
labor market conditions.
As a consequence of this institutional priority of the union, wages in the firm we study
vary little across breakbulk terminals. Table III presents the base pay rates over the survey
period for the 29 terminals. (To preserve the confidentiality of the firm, the locations of the
terminal have been suppressed and replaced by a randomly assigned terminal number that
remains constant throughout this paper.) Base wages never vary by more than plus or minus
$.20 per hour; if we exclude one terminal in the industrial Midwest wages never vary by more
than plus or minus $.11 per hour across terminals within each year. The standard deviation
with a given year is never more than $.08. Wage increases each year were roughly constant
across terminals. New (non-casual) hires receive 75 percent of the base wage initially, 80
percent after 1 year, 90 percent after 18 months, and 100 percent after 2 years, at which point
they receive the base wage for the remainder of their tenure in the firm.
The crucial aspect of this wage-setting process for our study is that local managers have
no discretion to adjust base wage rates at the terminal level. Variation in outside labor market
conditions thus generates exogenous variation in the attractiveness of the wage paid by the firm
relative to local labor market conditions. In addition, the fact that all terminals are part of the
same firm and report to the same corporate managers guarantees a certain degree of
homogeneity across terminals in workplace practices. There may still be differences in
management styles and in the history of labor-management relations across terminals, however,
10
and local managers do have discretion over how many overtime hours are offered to regular,
full-time employees. We return to these possibilities below.
The firm provided us with data on the number of new hires and permanent separations
as well as the total number of employees in each terminal in each year. For each separation, we
also know the tenure of the employee at time of separation and the type of separation:
dismissal, resignation in lieu of dismissal, quit, retirement or death. We take the rate of
disciplinary dismissals – the number of dismissals and resignations in lieu of dismissal in a given
calendar year as a fraction of total employment at the time of the attitude survey – as our
measure of employee performance. This measure does not capture layoffs due to fluctuations
of the freight flow (and hence of labor requirements) in each terminal. Under the union
contract, permanent (i.e. not “casual”) workers in the firm who are laid off retain indefinitely
the right to be recalled; the firm does not count such layoffs as dismissals. The dismissal rate is
a measure of serious behavioral infractions. The union grievance procedure makes it costly for
the firm to fire employees without strong contractual grounds, and although it would be
possible for the firm to build a case against an employee who had low productivity, typically
dismissals are the result of a clear pattern of violations of contractually sanctioned disciplinary
rules, such as those against stealing, coming to work drunk, excessive tardiness, or unexcused
absences.13 While the dismissal rate does not correspond exactly to the effort variable in many
efficiency-wage models, namely the fraction of time spent working, it does provide a measure
of employees’ dedication to the job, or effort broadly construed. 14
13 Failure to meet production standards is not valid grounds for dismissal under the National Master
Freight Agreement, but related behavior, such as “stealing time” by taking excessive or unauthorized breaks, may be so construed.
14 The paper by Cappelli and Chauvin [1991], perhaps the most convincing in the literature on labor market conditions and productivity, also uses the rate of disciplinary dismissals as the primary measure of employee performance.
11
The firm also provided us with the measure it uses internally to track the workload in
each terminal. The firm’s industrial engineers have calculated how long each task involved in
loading or unloading a truck (e.g. “push empty cart into trailer,” “carefully read freight label,”
“walk laden to cart unobstructed”) should take to complete. On the basis of these
measurements, they calculate the length of time the bundle of tasks that each freight load
represents should take to complete. We refer to this measure as “expected work-time.”
Summary statistics on our terminal-level variables (as well as unemployment and the wage gap
terms, which we explain below) appear in Table II.
III. LOCAL LABOR MARKETS
We focus on two indicators of local labor market conditions: (1) the local
unemployment rate; and (2) the gap between employees’ wages in the firm and the predicted
wages that they would receive in the outside labor market based on their demographic
characteristics. Of the 29 breakbulk terminals, 26 are located within Metropolitan Statistical
Areas (MSAs), as defined by the Bureau of Labor Statistics (BLS), and one is located within 5
miles of an MSA. In these cases, we consider the local labor market to be the corresponding
MSA. Two terminals, both in the southern U.S., are located well outside of the nearest MSA. In
these cases, we take all non-MSA areas of the state in which each terminal is located as the local
labor market.15
15 In the case of unemployment, it would be possible to define local labor markets more narrowly, but
the BLS warns that its estimates of unemployment below the MSA-level may be subject to large and unquantifiable errors.
12
A. Local unemployment rates
Our source for unemployment data is the database of the Local Area Unemployment
Statistics program, a joint effort of the BLS and state employment agencies.16 Unemployment
estimates are based on state unemployment insurance records, as well as estimates of new
entries into the workforce based on demographic and seasonal patterns. Estimates of
employment and unemployment at the state level, used in the case of the two terminals in rural
areas, are based on the Current Population Survey (CPS). We take the average yearly
unemployment rate in the local labor market as our unemployment measure. 17
B. Wage gaps
We base our estimates of the wage an employee would receive in the outside local labor
market on predicted values from wage regressions on pooled 12-month samples of Merged
Outgoing Rotation Groups (MORGs) of the CPS, regressed separately for each local labor
market in each year. We limit our CPS sample to men – as noted above, the dockworkers in the
firm we study are 99 percent male – and further limit to ages 16-64.18 We recode information
on age, education, race and sex in the CPS according to the categories of the firm attitude
survey, and calculate predicted wages in the local labor market with the following simple
regression:
(1) kjtjtkjtjtkjtjtkjtjtkjt DDDw εππππ +′+′+′+= ,3,3,2,2,1,1,0
16 The primary basis for employment estimates at the MSA-level are the joint federal-state Current
Employment Statistics (CES) surveys, which gather information from worksites. The statistics are then converted to a place-of-residence basis using information from the Current Population Surveys (CPS) and the decennial censuses on commuting patterns.
17 We experimented with an alternative specification of the unemployment rate, namely the average unemployment rate in June-August, the months in which the attitude surveys were carried out. Results were similar to those we report.
18 We dropped individuals reporting hourly earnings less than $3/hr.
13
where k indexes individuals within a local-labor-market-year in the CPS, j indexes local labor
markets, t indexes years, wkjt represents the log of individual k’s hourly wage, and D1,kjt , D2,kjt ,
and D3,kjt are vectors of dummy variables for age, education and race, defined according to the
demographic categories in the firm’s attitude survey. We are not able to estimate a more general
model with a full set of interaction terms – the equivalent of taking averages for each age-
education-race cell – because of insufficient numbers of observations for each MSA-year in the
CPS. We experimented with alternative specifications, including a dummy for blue-collar
occupations and limiting the sample to full-time workers, but these changes did not affect our
results.
We construct the predicted wage for an employee in the firm we study in two different
ways. In the first method, we calculate the proportion of employees in the firm in each age-
education-race group in 1996 and use these proportions as weights in a weighted average of the
predicted wages for each age-education-race group in the CPS. This is our preferred measure,
because it allows us to construct an expected outside wage for all five years for which we have
attitude data. In the second method, we use the demographic information from the attitude
survey in the years 1996-1998 and equate each employee’s expected outside wage to the
predicted wage for a worker with identical age, education and race characteristics in the CPS
regression. This method has the advantage that we take the human capital and other individual
characteristics of workers into account in calculating their predicted outside wage, but the
shortcoming that we can calculate the expected outside wage for only three years.
Taking the estimated coefficients from the CPS wage regressions, we calculate the two
expected outside log-wage terms, call them w1e and w2
e , as follows:
14
(2a) ∑
′+′+′+=
gjtgjtjtgjtjtgjtjtgj
ejt DDDw ,3,3,2,2,1,1,01996,,1 ˆˆˆˆ ππππλ
(2b) jtijtjtijtjtijtjte
ijt DDDw ,3,3,2,2,1,1,0,2 ˆˆˆˆ ππππ ′+′+′+=
where g indexes all possible age-education-race combinations, j indexes terminals, t indexes
years, λgj,1996 is the proportion of dockworkers in terminal j in year 1996 corresponding to age-
education-race combination g, and i indexes employees within a terminal-year.19
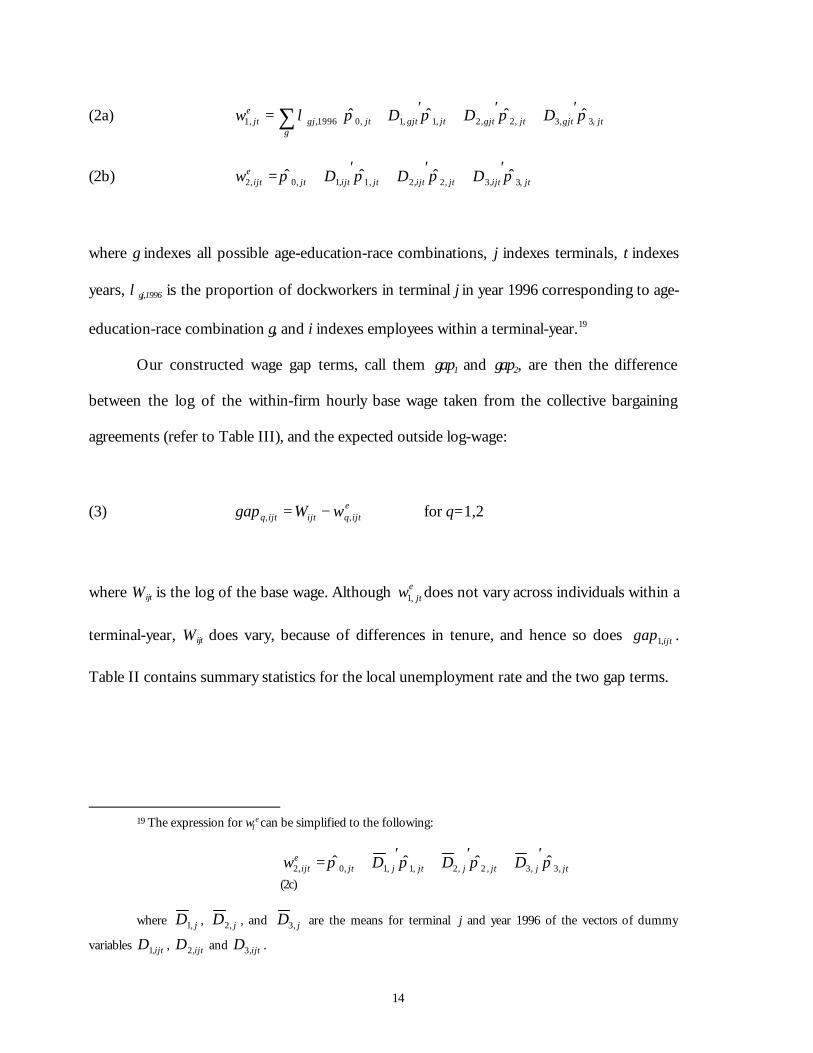
Our constructed wage gap terms, call them gap1 and gap2, are then the difference
between the log of the within-firm hourly base wage taken from the collective bargaining
agreements (refer to Table III), and the expected outside log-wage:
(3) eijtqijtijtq wWgap ,, −= for q=1,2
where Wijt is the log of the base wage. Although ejtw ,1 does not vary across individuals within a
terminal-year, Wijt does vary, because of differences in tenure, and hence so does ijtgap ,1 .
Table II contains summary statistics for the local unemployment rate and the two gap terms.
19 The expression for w1e can be simplified to the following:
jtjjtjjtjjte
ijt DDDw ,3,3,2,2,1,1,0,2 ˆˆˆˆ ππππ ′+′+′+=
(2c)
where jD ,1 , jD ,2 , and jD ,3 are the means for terminal j and year 1996 of the vectors of dummy
variables ijtD ,1 , ijtD ,2 and ijtD ,3 .
15
IV. THE EXTERNAL DETERMINANTS OF FAIRNESS PERCEPTIONS
A. Econometric Model
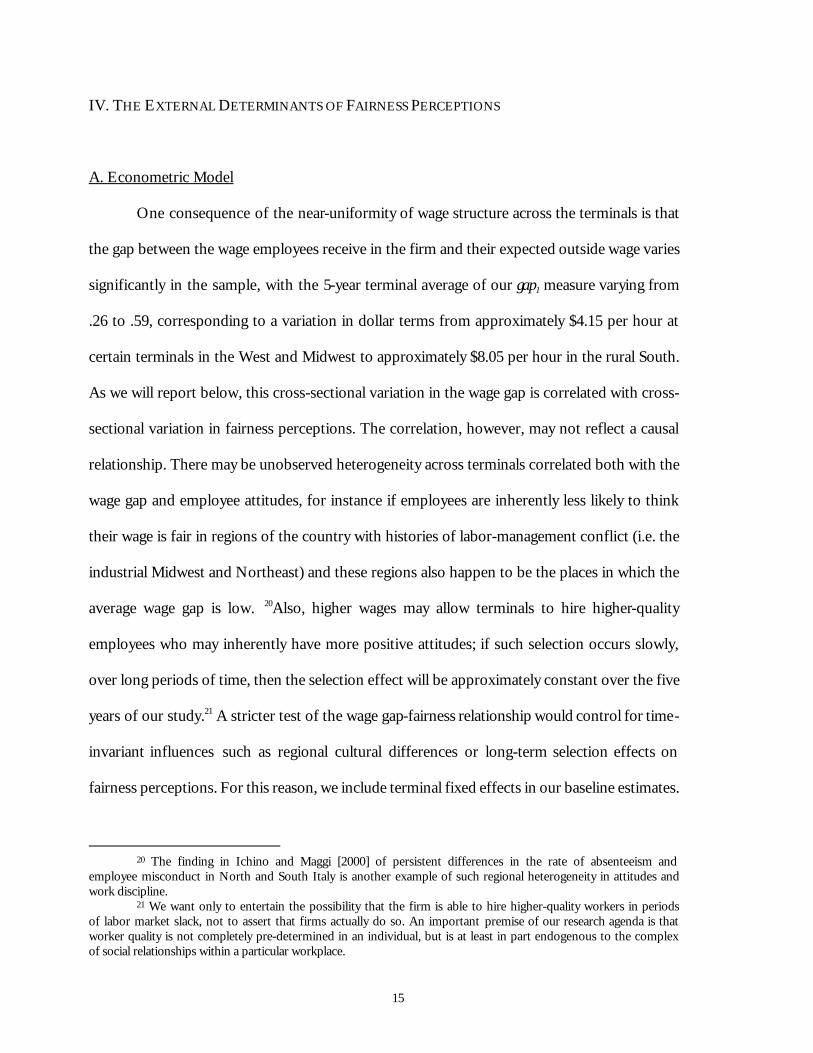
One consequence of the near-uniformity of wage structure across the terminals is that
the gap between the wage employees receive in the firm and their expected outside wage varies
significantly in the sample, with the 5-year terminal average of our gap1 measure varying from
.26 to .59, corresponding to a variation in dollar terms from approximately $4.15 per hour at
certain terminals in the West and Midwest to approximately $8.05 per hour in the rural South.
As we will report below, this cross-sectional variation in the wage gap is correlated with cross-
sectional variation in fairness perceptions. The correlation, however, may not reflect a causal
relationship. There may be unobserved heterogeneity across terminals correlated both with the
wage gap and employee attitudes, for instance if employees are inherently less likely to think
their wage is fair in regions of the country with histories of labor-management conflict (i.e. the
industrial Midwest and Northeast) and these regions also happen to be the places in which the
average wage gap is low. 20Also, higher wages may allow terminals to hire higher-quality
employees who may inherently have more positive attitudes; if such selection occurs slowly,
over long periods of time, then the selection effect will be approximately constant over the five
years of our study.21 A stricter test of the wage gap-fairness relationship would control for time-
invariant influences such as regional cultural differences or long-term selection effects on
fairness perceptions. For this reason, we include terminal fixed effects in our baseline estimates.
20 The finding in Ichino and Maggi [2000] of persistent differences in the rate of absenteeism and
employee misconduct in North and South Italy is another example of such regional heterogeneity in attitudes and work discipline.
21 We want only to entertain the possibility that the firm is able to hire higher-quality workers in periods of labor market slack, not to assert that firms actually do so. An important premise of our research agenda is that worker quality is not completely pre-determined in an individual, but is at least in part endogenous to the complex of social relationships within a particular workplace.
16
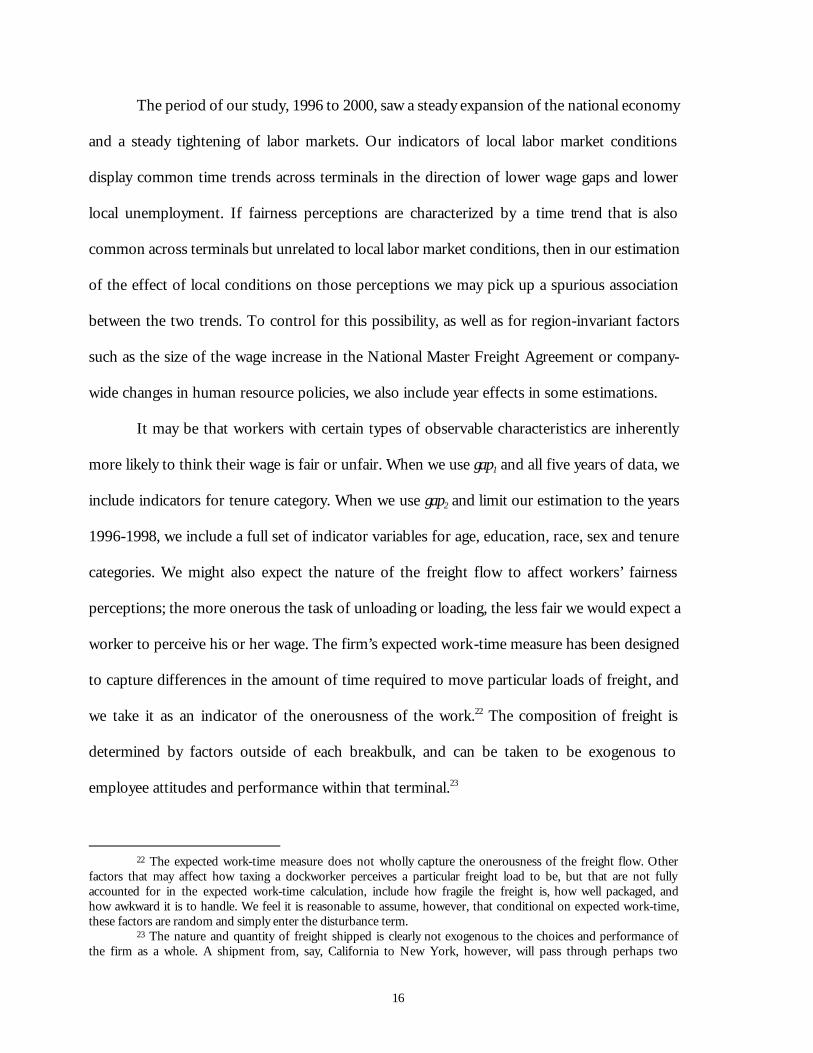
The period of our study, 1996 to 2000, saw a steady expansion of the national economy
and a steady tightening of labor markets. Our indicators of local labor market conditions
display common time trends across terminals in the direction of lower wage gaps and lower
local unemployment. If fairness perceptions are characterized by a time trend that is also
common across terminals but unrelated to local labor market conditions, then in our estimation
of the effect of local conditions on those perceptions we may pick up a spurious association
between the two trends. To control for this possibility, as well as for region-invariant factors
such as the size of the wage increase in the National Master Freight Agreement or company-
wide changes in human resource policies, we also include year effects in some estimations.
It may be that workers with certain types of observable characteristics are inherently
more likely to think their wage is fair or unfair. When we use gap1 and all five years of data, we
include indicators for tenure category. When we use gap2 and limit our estimation to the years
1996-1998, we include a full set of indicator variables for age, education, race, sex and tenure
categories. We might also expect the nature of the freight flow to affect workers’ fairness
perceptions; the more onerous the task of unloading or loading, the less fair we would expect a
worker to perceive his or her wage. The firm’s expected work-time measure has been designed
to capture differences in the amount of time required to move particular loads of freight, and
we take it as an indicator of the onerousness of the work.22 The composition of freight is
determined by factors outside of each breakbulk, and can be taken to be exogenous to
employee attitudes and performance within that terminal.23
22 The expected work-time measure does not wholly capture the onerousness of the freight flow. Other
factors that may affect how taxing a dockworker perceives a particular freight load to be, but that are not fully accounted for in the expected work-time calculation, include how fragile the freight is, how well packaged, and how awkward it is to handle. We feel it is reasonable to assume, however, that conditional on expected work-time, these factors are random and simply enter the disturbance term.
23 The nature and quantity of freight shipped is clearly not exogenous to the choices and performance of the firm as a whole. A shipment from, say, California to New York, however, will pass through perhaps two
17
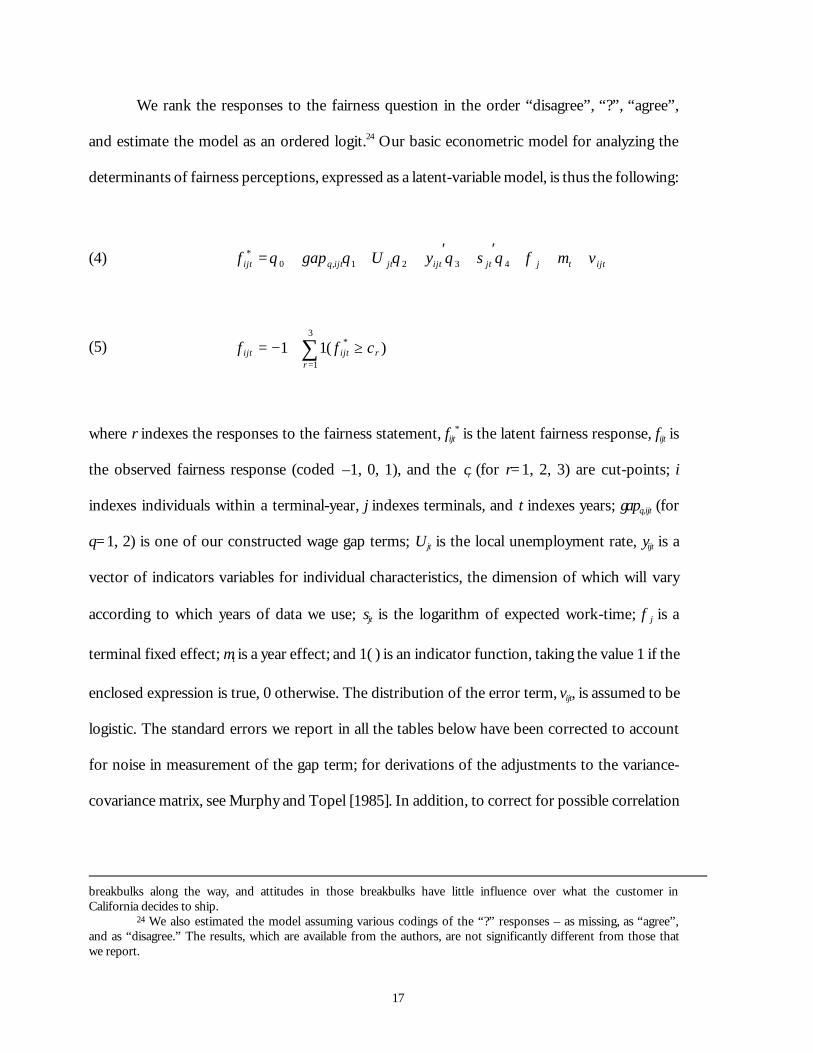
We rank the responses to the fairness question in the order “disagree”, “?”, “agree”,
and estimate the model as an ordered logit.24 Our basic econometric model for analyzing the
determinants of fairness perceptions, expressed as a latent-variable model, is thus the following:
(4) ijttjjtijtjtijtqijt vsyUgapf +++′+′+++= µφθθθθθ 4321,0*
(5) ∑=
≥+−=3
1
* )(11r
rijtijt cff
where r indexes the responses to the fairness statement, fijt* is the latent fairness response, fijt is
the observed fairness response (coded –1, 0, 1), and the cr (for r=1, 2, 3) are cut-points; i
indexes individuals within a terminal-year, j indexes terminals, and t indexes years; gapq,ijt (for
q=1, 2) is one of our constructed wage gap terms; Ujt is the local unemployment rate, yijt is a
vector of indicators variables for individual characteristics, the dimension of which will vary
according to which years of data we use; sjt is the logarithm of expected work-time; φ j is a
terminal fixed effect; µt is a year effect; and 1( ) is an indicator function, taking the value 1 if the
enclosed expression is true, 0 otherwise. The distribution of the error term, vijt, is assumed to be
logistic. The standard errors we report in all the tables below have been corrected to account
for noise in measurement of the gap term; for derivations of the adjustments to the variance-
covariance matrix, see Murphy and Topel [1985]. In addition, to correct for possible correlation
breakbulks along the way, and attitudes in those breakbulks have little influence over what the customer in California decides to ship.
24 We also estimated the model assuming various codings of the “?” responses – as missing, as “agree”, and as “disagree.” The results, which are available from the authors, are not significantly different from those that we report.
18
of the errors within terminal-year due to the fact that our unemployment variable does not vary
at the individual level [see Moulton, 1986], we cluster errors by terminal-year.
B. Results
Figure 1 presents a graphical depiction of our main results on the determinants of
fairness perceptions. Figures 1a and 1c present scatterplots of the average fairness perception
for each terminal over the period 1996-2000 against the average wage gap (using gap1) and the
average local unemployment rate respectively. 25 Figures 1b and 1d present the terminal
averages of the same variables for each year deviated from the 5-year terminal averages; these
graphs are analogous to the estimations that include terminal fixed effects. In all four graphs,
the regression lines are weighted by the number of respondents in each terminal. (The sizes of
the circles in figures 1b and 1d are proportional to the number of respondents.) The graphs
reveal a weak but statistically significant correlation between fairness perceptions and the wage
gap in cross-section; the correlation remains once time-invariant terminal-specific factors are
removed. The most remarkable pattern in the data is evident in figures 1c and 1d:
unemployment bears essentially no relation to fairness perceptions in cross-section, but a
strong and readily apparent relation once terminal fixed effects are removed. Year-to-year
variation in the local unemployment rate is a strong predictor of year-to-year variation in wage-
fairness perceptions.
Table IV presents our baseline estimates of the effect of local labor market conditions
on wage-fairness perceptions. As suggested by figure 1, when terminal fixed effects are not
included in the estimation, there is a significant relationship between the wage gap and fairness
25 In calculating the average fairness perception, as well as in the linear first-stage regressions in section V
below, “agree” responses to the fairness question were assigned the value 1, “disagree” the value -1, and “?” the value zero.
19
perceptions but not between unemployment and fairness perceptions. Once we include
terminal fixed effects in column (4), however, the positive relationship between unemployment
and fairness perceptions shows up strongly, suggesting that changes in local unemployment
rates are more salient for fairness judgments than average levels. The t-statistic for the
coefficient on unemployment is greater than 7. The coefficient on the gap term remains
significant at the 95 percent level. 26
As discussed above, the strictest test of our hypotheses requires that we include year
effects as well as terminal fixed effects, to control for possibly spurious correlation between
unrelated time trends in local labor market conditions and fairness perceptions. Once we
include year effects in column (5), the magnitude of the unemployment coefficient drops by
more than 50 percent, but remains strongly significant. We conclude that the local
unemployment rate is a quite robust predictor of wage-fairness perceptions.27
The gap term is not as robust as the unemployment term; with the inclusion of terminal
effects, the coefficient on the gap term is no longer distinguishable from zero. There are at least
two possible explanations why the wage gap term is less robust a predictor of fairness
perceptions than the unemployment rate, one statistical and one economic. The statistical
reason is that the wage gap terms are constructed from estimates of wage coefficients from a
CPS wage regression, which are measured with noise. This noise biases the coefficient estimate
downward and may be obscuring an underlying economic relationship between the true wage
gap and fairness judgments. The economic reason is that the unemployment may simply be
more salient as a reference point for fairness judgments than the predicted outside wage.
26 Many authors have observed that over time people tend to regard the status quo, whatever it may be,
as fair (see Wadhwani and Wall [1991] for a review of this literature.) This accommodation-to-the-status-quo effect would tend to reduce the effect of changes in local labor market conditions on self-reported fairness perceptions, and work against finding significant coefficients on the unemployment and wage gap terms.
27 We return to columns (6) and (7) of Table IV in section IV.C below.
20
Unemployment is more visible than outside wages; newspapers run stories about it, and people
out of work can be seen on the streetcorner. By contrast, it is unlikely that a worker would
know what he or she would earn on the outside labor market unless he or she had recently
looked for a job. It is important to keep in mind as well that not being able to reject the null
hypothesis that the coefficient on the wage gap term is zero when year effects are included is
not the same as rejecting a null hypothesis that the coefficient is positive; one should infer from
our study only that the data are not conclusive in our strictest specification, not that expected
outside wages do not affect fairness perceptions.
It is also important to note that our strictest specification may be too strict: the year
effects in column (5) may be absorbing variation in wage-fairness perceptions that should
rightfully be attributed to local unemployment and the wage gap.28 The rationale for including
year effects is to control for spurious correlation between unrelated time trends in local labor
market conditions and in wage-fairness attitudes. If such spurious correlation were important,
we might expect to see a spurious correlation between local labor market conditions and other
attitudes that are closely related to wage-fairness perceptions but arguably not affected by local
labor market conditions. The firm’s attitude survey included an indicator of such an attitude:
the perception of the fairness of management in general. The survey in 1996-1998 elicited
responses to the statement, “I have confidence in the fairness of management.” Unfortunately
for our purposes, in 1999 and 2000 the wording changed slightly to “I have confidence in the
fairness of management above my immediate supervisor” (emphasis added). Table V presents our
basic models estimated with the responses to this management-fairness question as the
dependent variable. The estimates are markedly different from those for the wage-fairness
28 In addition, there is always the danger that including the year effects will exacerbate attenuation bias
due to measurement error in the unemployment and wage gap terms, if the year effects are correlated with the signal but not the noise in these local labor market variables. Such an effect is consistent with the reduction in the size of the coefficients on the unemployment and wage gap terms that we observe in column (5) of Table IV.
21
question. In column (1), which does not include year effects, the coefficient on the gap term is
positive as before, but only marginally significant, and the coefficient on unemployment is
negative and insignificant. The estimates in column (2) include year effects, which should
absorb the effect of the change in wording and should be preferred for that reason. The
coefficient on the gap term is still positive but no longer significant. The coefficient on
unemployment is more negative than in column (1) and still insignificant. Local labor market
conditions, in other words, appear to be related to perceptions of wage fairness, not to
perceptions of fairness in general. We take this as indirect evidence that the year-to-year
changes in fairness perceptions that are common across terminals are in fact attributable to the
common trend in local labor market conditions. For this reason, we remain reasonably
confident in our estimates in column (4), and consider them to be our baseline estimates.
Table VI presents the marginal effects corresponding to the coefficient estimates in
columns (4) and (5) in Table IV, which give a sense of the economic significance of our results.
The effects in columns (1)-(3), corresponding to the model including terminal fixed effects but
not year effects, indicate that an increase of 1.1 percent (one standard deviation) in the local
unemployment rate is associated with a 10.2 percent increase in the probability that the average
employee in the firm will consider his wage fair, and a 8.6 percent decrease in the probability
that he will consider it unfair.29 A one-standard-deviation increase in the wage gap term will
raise the probability of a fair response by approximately 2.7 percent, and decrease the
likelihood of an unfair response by 2.3 percent. The corresponding numbers for the model
including both terminal and year effects are 2.9 percent and 2.1 percent for unemployment, and
.2 percent and .2 percent for the wage gap.
29 As is typical in ordered logit models, we have no unambiguous prediction for the effect on the
probability of the intermediate choice, the “?” response.
22
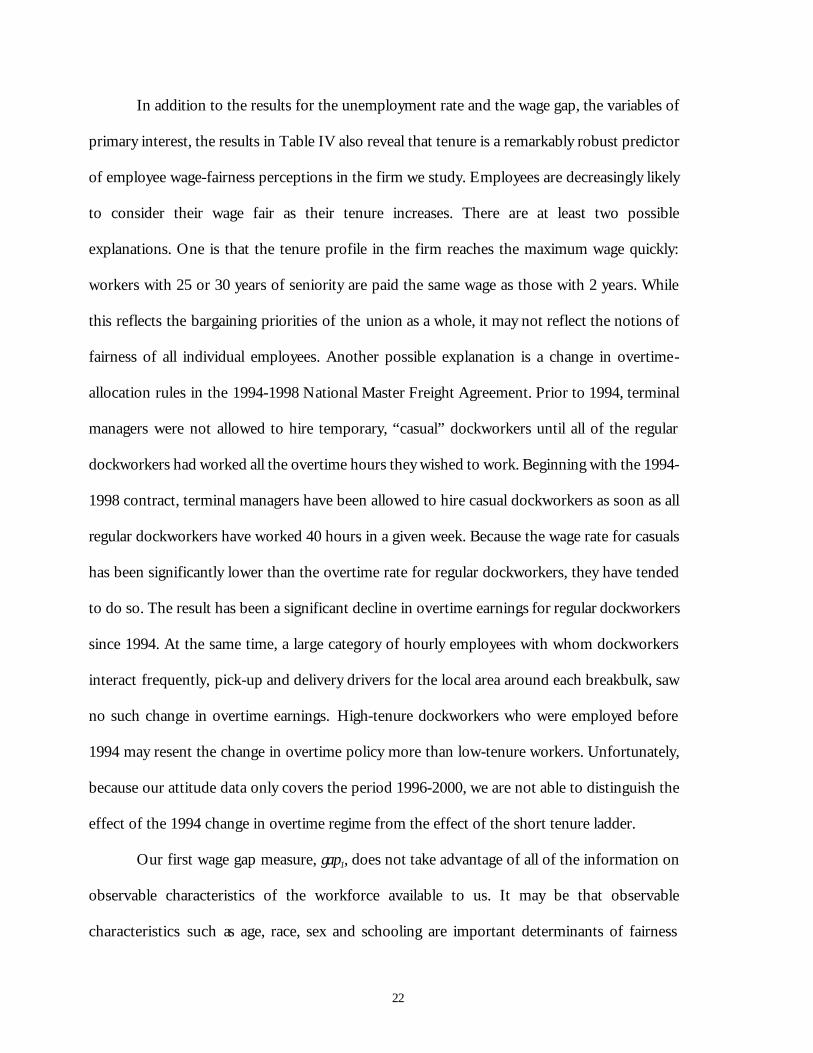
In addition to the results for the unemployment rate and the wage gap, the variables of
primary interest, the results in Table IV also reveal that tenure is a remarkably robust predictor
of employee wage-fairness perceptions in the firm we study. Employees are decreasingly likely
to consider their wage fair as their tenure increases. There are at least two possible
explanations. One is that the tenure profile in the firm reaches the maximum wage quickly:
workers with 25 or 30 years of seniority are paid the same wage as those with 2 years. While
this reflects the bargaining priorities of the union as a whole, it may not reflect the notions of
fairness of all individual employees. Another possible explanation is a change in overtime-
allocation rules in the 1994-1998 National Master Freight Agreement. Prior to 1994, terminal
managers were not allowed to hire temporary, “casual” dockworkers until all of the regular
dockworkers had worked all the overtime hours they wished to work. Beginning with the 1994-
1998 contract, terminal managers have been allowed to hire casual dockworkers as soon as all
regular dockworkers have worked 40 hours in a given week. Because the wage rate for casuals
has been significantly lower than the overtime rate for regular dockworkers, they have tended
to do so. The result has been a significant decline in overtime earnings for regular dockworkers
since 1994. At the same time, a large category of hourly employees with whom dockworkers
interact frequently, pick-up and delivery drivers for the local area around each breakbulk, saw
no such change in overtime earnings. High-tenure dockworkers who were employed before
1994 may resent the change in overtime policy more than low-tenure workers. Unfortunately,
because our attitude data only covers the period 1996-2000, we are not able to distinguish the
effect of the 1994 change in overtime regime from the effect of the short tenure ladder.
Our first wage gap measure, gap1, does not take advantage of all of the information on
observable characteristics of the workforce available to us. It may be that observable
characteristics such as age, race, sex and schooling are important determinants of fairness
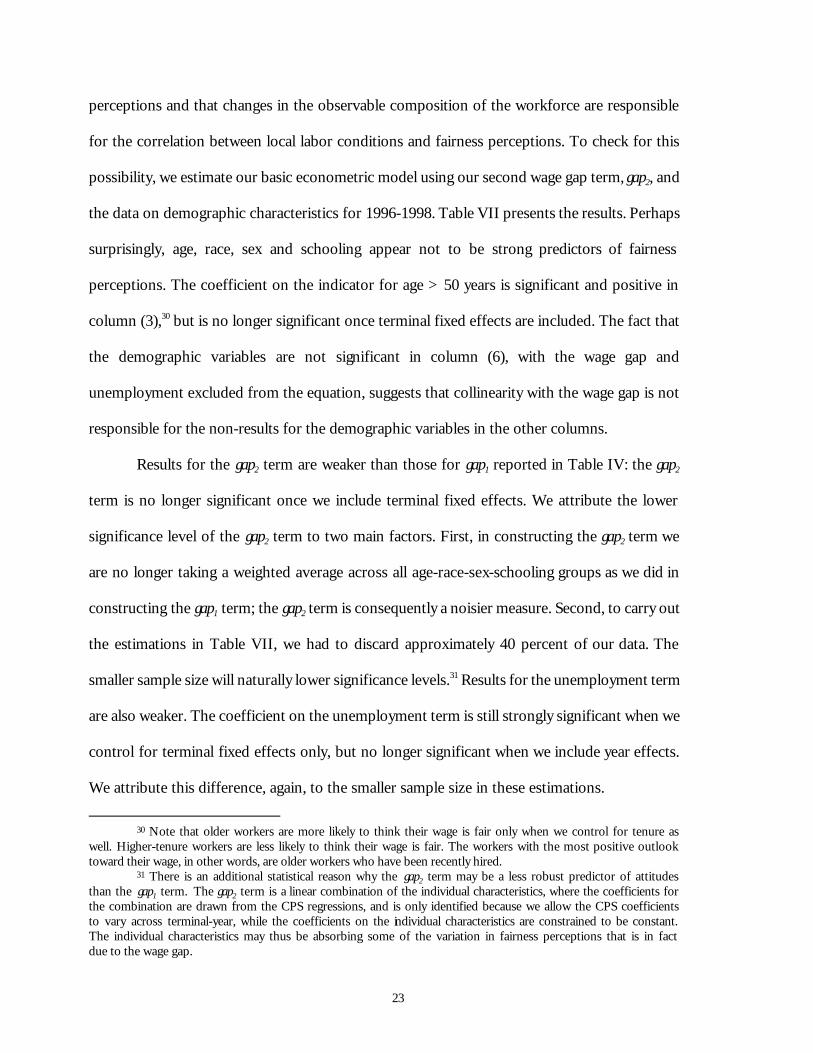
23
perceptions and that changes in the observable composition of the workforce are responsible
for the correlation between local labor conditions and fairness perceptions. To check for this
possibility, we estimate our basic econometric model using our second wage gap term, gap2, and
the data on demographic characteristics for 1996-1998. Table VII presents the results. Perhaps
surprisingly, age, race, sex and schooling appear not to be strong predictors of fairness
perceptions. The coefficient on the indicator for age > 50 years is significant and positive in
column (3),30 but is no longer significant once terminal fixed effects are included. The fact that
the demographic variables are not significant in column (6), with the wage gap and
unemployment excluded from the equation, suggests that collinearity with the wage gap is not
responsible for the non-results for the demographic variables in the other columns.
Results for the gap2 term are weaker than those for gap1 reported in Table IV: the gap2
term is no longer significant once we include terminal fixed effects. We attribute the lower
significance level of the gap2 term to two main factors. First, in constructing the gap2 term we
are no longer taking a weighted average across all age-race-sex-schooling groups as we did in
constructing the gap1 term; the gap2 term is consequently a noisier measure. Second, to carry out
the estimations in Table VII, we had to discard approximately 40 percent of our data. The
smaller sample size will naturally lower significance levels.31 Results for the unemployment term
are also weaker. The coefficient on the unemployment term is still strongly significant when we
control for terminal fixed effects only, but no longer significant when we include year effects.
We attribute this difference, again, to the smaller sample size in these estimations.
30 Note that older workers are more likely to think their wage is fair only when we control for tenure as
well. Higher-tenure workers are less likely to think their wage is fair. The workers with the most positive outlook toward their wage, in other words, are older workers who have been recently hired.
31 There is an additional statistical reason why the gap2 term may be a less robust predictor of attitudes than the gap1 term. The gap2 term is a linear combination of the individual characteristics, where the coefficients for the combination are drawn from the CPS regressions, and is only identified because we allow the CPS coefficients to vary across terminal-year, while the coefficients on the individual characteristics are constrained to be constant. The individual characteristics may thus be absorbing some of the variation in fairness perceptions that is in fact due to the wage gap.
24
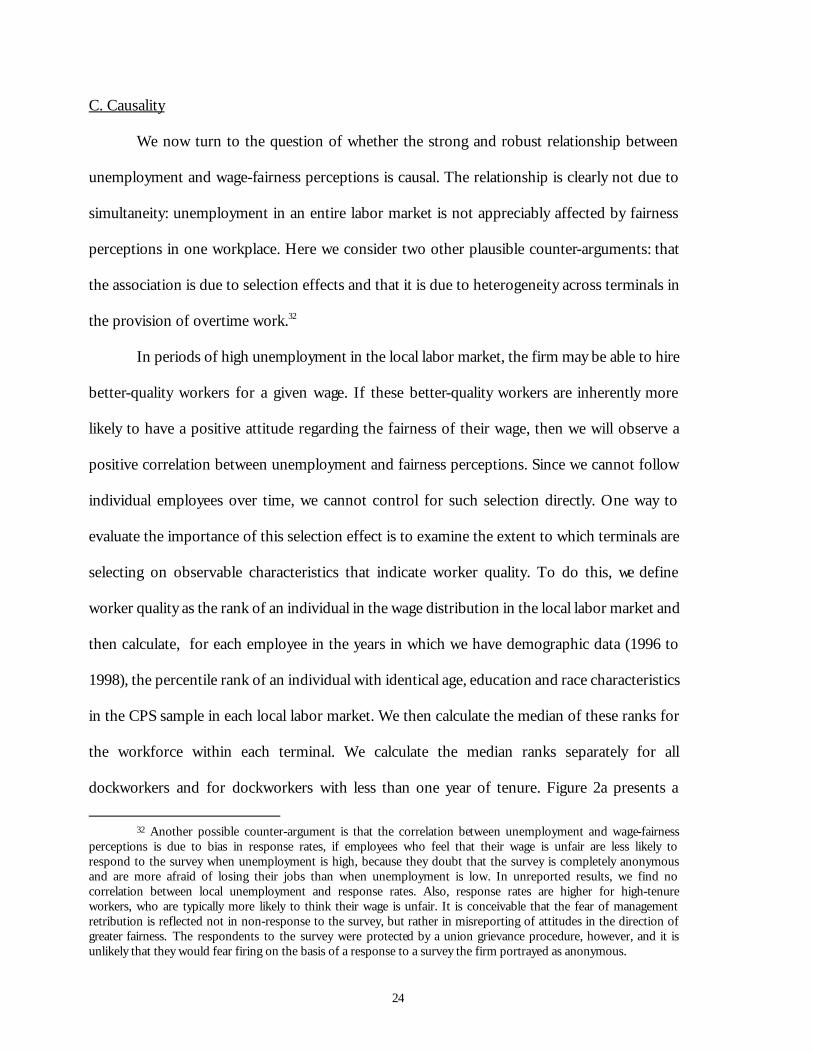
C. Causality
We now turn to the question of whether the strong and robust relationship between
unemployment and wage-fairness perceptions is causal. The relationship is clearly not due to
simultaneity: unemployment in an entire labor market is not appreciably affected by fairness
perceptions in one workplace. Here we consider two other plausible counter-arguments: that
the association is due to selection effects and that it is due to heterogeneity across terminals in
the provision of overtime work.32
In periods of high unemployment in the local labor market, the firm may be able to hire
better-quality workers for a given wage. If these better-quality workers are inherently more
likely to have a positive attitude regarding the fairness of their wage, then we will observe a
positive correlation between unemployment and fairness perceptions. Since we cannot follow
individual employees over time, we cannot control for such selection directly. One way to
evaluate the importance of this selection effect is to examine the extent to which terminals are
selecting on observable characteristics that indicate worker quality. To do this, we define
worker quality as the rank of an individual in the wage distribution in the local labor market and
then calculate, for each employee in the years in which we have demographic data (1996 to
1998), the percentile rank of an individual with identical age, education and race characteristics
in the CPS sample in each local labor market. We then calculate the median of these ranks for
the workforce within each terminal. We calculate the median ranks separately for all
dockworkers and for dockworkers with less than one year of tenure. Figure 2a presents a
32 Another possible counter-argument is that the correlation between unemployment and wage-fairness
perceptions is due to bias in response rates, if employees who feel that their wage is unfair are less likely to respond to the survey when unemployment is high, because they doubt that the survey is completely anonymous and are more afraid of losing their jobs than when unemployment is low. In unreported results, we find no correlation between local unemployment and response rates. Also, response rates are higher for high-tenure workers, who are typically more likely to think their wage is unfair. It is conceivable that the fear of management retribution is reflected not in non-response to the survey, but rather in misreporting of attitudes in the direction of greater fairness. The respondents to the survey were protected by a union grievance procedure, however, and it is unlikely that they would fear firing on the basis of a response to a survey the firm portrayed as anonymous.
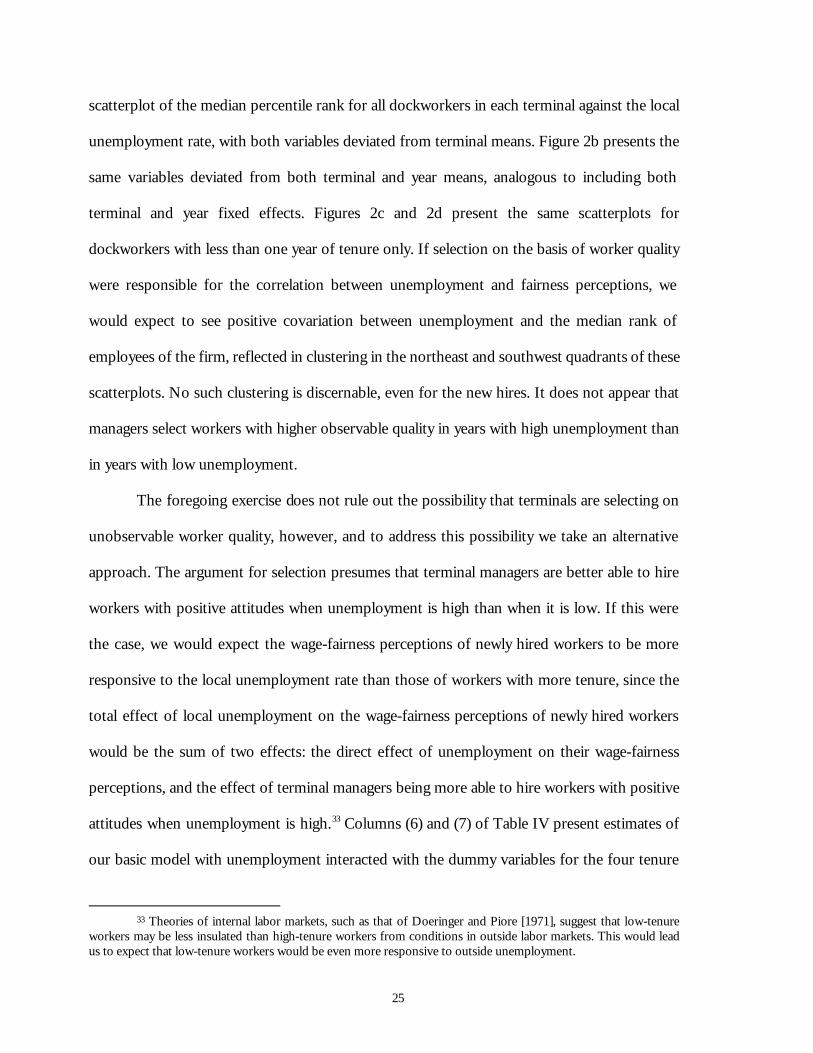
25
scatterplot of the median percentile rank for all dockworkers in each terminal against the local
unemployment rate, with both variables deviated from terminal means. Figure 2b presents the
same variables deviated from both terminal and year means, analogous to including both
terminal and year fixed effects. Figures 2c and 2d present the same scatterplots for
dockworkers with less than one year of tenure only. If selection on the basis of worker quality
were responsible for the correlation between unemployment and fairness perceptions, we
would expect to see positive covariation between unemployment and the median rank of
employees of the firm, reflected in clustering in the northeast and southwest quadrants of these
scatterplots. No such clustering is discernable, even for the new hires. It does not appear that
managers select workers with higher observable quality in years with high unemployment than
in years with low unemployment.
The foregoing exercise does not rule out the possibility that terminals are selecting on
unobservable worker quality, however, and to address this possibility we take an alternative
approach. The argument for selection presumes that terminal managers are better able to hire
workers with positive attitudes when unemployment is high than when it is low. If this were
the case, we would expect the wage-fairness perceptions of newly hired workers to be more
responsive to the local unemployment rate than those of workers with more tenure, since the
total effect of local unemployment on the wage-fairness perceptions of newly hired workers
would be the sum of two effects: the direct effect of unemployment on their wage-fairness
perceptions, and the effect of terminal managers being more able to hire workers with positive
attitudes when unemployment is high.33 Columns (6) and (7) of Table IV present estimates of
our basic model with unemployment interacted with the dummy variables for the four tenure
33 Theories of internal labor markets, such as that of Doeringer and Piore [1971], suggest that low-tenure
workers may be less insulated than high-tenure workers from conditions in outside labor markets. This would lead us to expect that low-tenure workers would be even more responsive to outside unemployment.
26
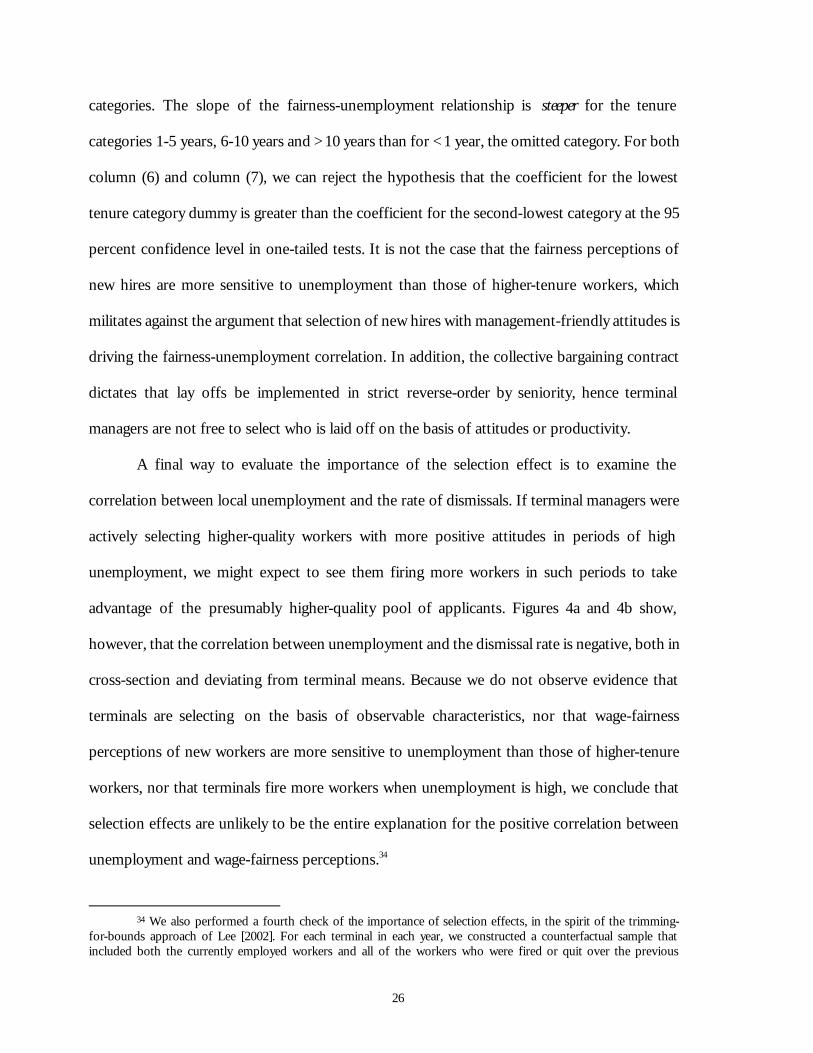
categories. The slope of the fairness-unemployment relationship is steeper for the tenure
categories 1-5 years, 6-10 years and >10 years than for <1 year, the omitted category. For both
column (6) and column (7), we can reject the hypothesis that the coefficient for the lowest
tenure category dummy is greater than the coefficient for the second-lowest category at the 95
percent confidence level in one-tailed tests. It is not the case that the fairness perceptions of
new hires are more sensitive to unemployment than those of higher-tenure workers, which
militates against the argument that selection of new hires with management-friendly attitudes is
driving the fairness-unemployment correlation. In addition, the collective bargaining contract
dictates that lay offs be implemented in strict reverse-order by seniority, hence terminal
managers are not free to select who is laid off on the basis of attitudes or productivity.
A final way to evaluate the importance of the selection effect is to examine the
correlation between local unemployment and the rate of dismissals. If terminal managers were
actively selecting higher-quality workers with more positive attitudes in periods of high
unemployment, we might expect to see them firing more workers in such periods to take
advantage of the presumably higher-quality pool of applicants. Figures 4a and 4b show,
however, that the correlation between unemployment and the dismissal rate is negative, both in
cross-section and deviating from terminal means. Because we do not observe evidence that
terminals are selecting on the basis of observable characteristics, nor that wage-fairness
perceptions of new workers are more sensitive to unemployment than those of higher-tenure
workers, nor that terminals fire more workers when unemployment is high, we conclude that
selection effects are unlikely to be the entire explanation for the positive correlation between
unemployment and wage-fairness perceptions.34
34 We also performed a fourth check of the importance of selection effects, in the spirit of the trimming-
for-bounds approach of Lee [2002]. For each terminal in each year, we constructed a counterfactual sample that included both the currently employed workers and all of the workers who were fired or quit over the previous
27
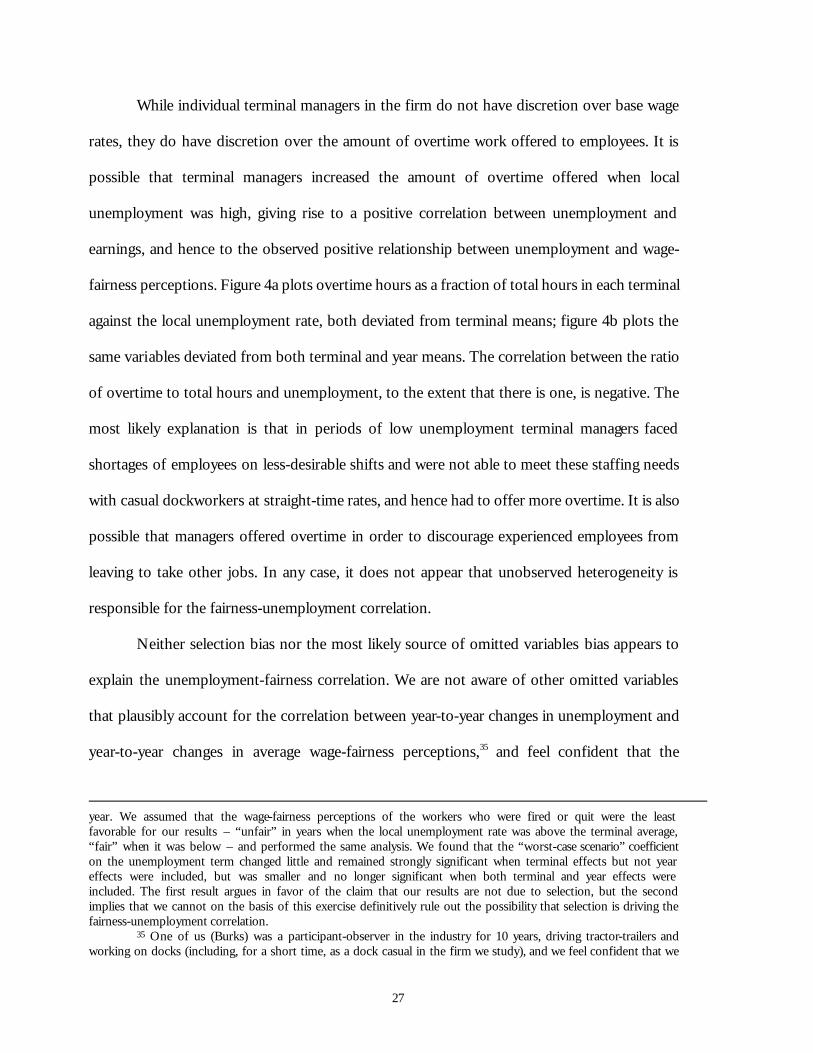
While individual terminal managers in the firm do not have discretion over base wage
rates, they do have discretion over the amount of overtime work offered to employees. It is
possible that terminal managers increased the amount of overtime offered when local
unemployment was high, giving rise to a positive correlation between unemployment and
earnings, and hence to the observed positive relationship between unemployment and wage-
fairness perceptions. Figure 4a plots overtime hours as a fraction of total hours in each terminal
against the local unemployment rate, both deviated from terminal means; figure 4b plots the
same variables deviated from both terminal and year means. The correlation between the ratio
of overtime to total hours and unemployment, to the extent that there is one, is negative. The
most likely explanation is that in periods of low unemployment terminal managers faced
shortages of employees on less-desirable shifts and were not able to meet these staffing needs
with casual dockworkers at straight-time rates, and hence had to offer more overtime. It is also
possible that managers offered overtime in order to discourage experienced employees from
leaving to take other jobs. In any case, it does not appear that unobserved heterogeneity is
responsible for the fairness-unemployment correlation.
Neither selection bias nor the most likely source of omitted variables bias appears to
explain the unemployment-fairness correlation. We are not aware of other omitted variables
that plausibly account for the correlation between year-to-year changes in unemployment and
year-to-year changes in average wage-fairness perceptions,35 and feel confident that the
year. We assumed that the wage-fairness perceptions of the workers who were fired or quit were the least favorable for our results – “unfair” in years when the local unemployment rate was above the terminal average, “fair” when it was below – and performed the same analysis. We found that the “worst-case scenario” coefficient on the unemployment term changed little and remained strongly significant when terminal effects but not year effects were included, but was smaller and no longer significant when both terminal and year effects were included. The first result argues in favor of the claim that our results are not due to selection, but the second implies that we cannot on the basis of this exercise definitively rule out the possibility that selection is driving the fairness-unemployment correlation.
35 One of us (Burks) was a participant-observer in the industry for 10 years, driving tractor-trailers and working on docks (including, for a short time, as a dock casual in the firm we study), and we feel confident that we
28
relationship can be interpreted as a causal effect: an increase in the local unemployment rate
leads employees to consider that they are being paid more fairly, and a decrease has the
opposite effect.
V. THE EFFECT OF WAGE-FAIRNESS PERCEPTIONS ON EMPLOYEE PERFORMANCE
There are a number of reasons why a simple regression of employee performance on
employee attitudes might be misleading: a positive correlation between employee wage-fairness
perceptions and performance might be due to the selection effect discussed above or to an
omitted variable like the ability of individual managers to motivate employees, for instance,
rather than to the causal effect hypothesized by fair-wage theory. A key advantage of having
identified exogenous determinants of wage-fairness perceptions is that we can now use them as
instruments to identify the causal effect of wage-fairness perceptions on employee
performance. We do so here in a modified two-stage least squares model, using the rate of
disciplinary dismissals as our indicator of employee performance.36 To facilitate the
interpretation of our results, we adopt a linear model, rather than an ordered logit or binary
are not overlooking any obvious omitted variables that might be correlated with both unemployment and fairness judgments.
36 The firm also provided us with the measure of productivity it uses internally, namely the ratio of expected work-time (described above) to the actual work-time taken to unload the freight. We experimented with using actual work-time, controlling for expected work-time, as our indicator of employee performance, but our results were inconclusive. It is possible that the actual work-time depends on a variety of factors outside of dockworkers’ control – the availability of forklifts, the timing of arrivals of trucks (which may determine whether they can be unloaded at the most convenient dock) etc. – and hence does not respond as directly to employee effort as the rate of disciplinary dismissals.
We also explored the relationship between local labor market conditions, wage-fairness perceptions and the quit rate in each terminal. The results are broadly similar to those using the dismissal rate (and in other studies such as Campbell[1993]): higher unemployment and a higher wage gap (and hence more positive wage-fairness perceptions) are associated with a lower quit rate. These results are consistent with the idea that slack in the local labor market leads to improved morale which, in turn, makes employees more willing to stay in the job. It may also be the case, however, that the lower quit rate is due simply to the fact that employees have less attractive options outside the firm, and for that reason we do not emphasize these results.
29
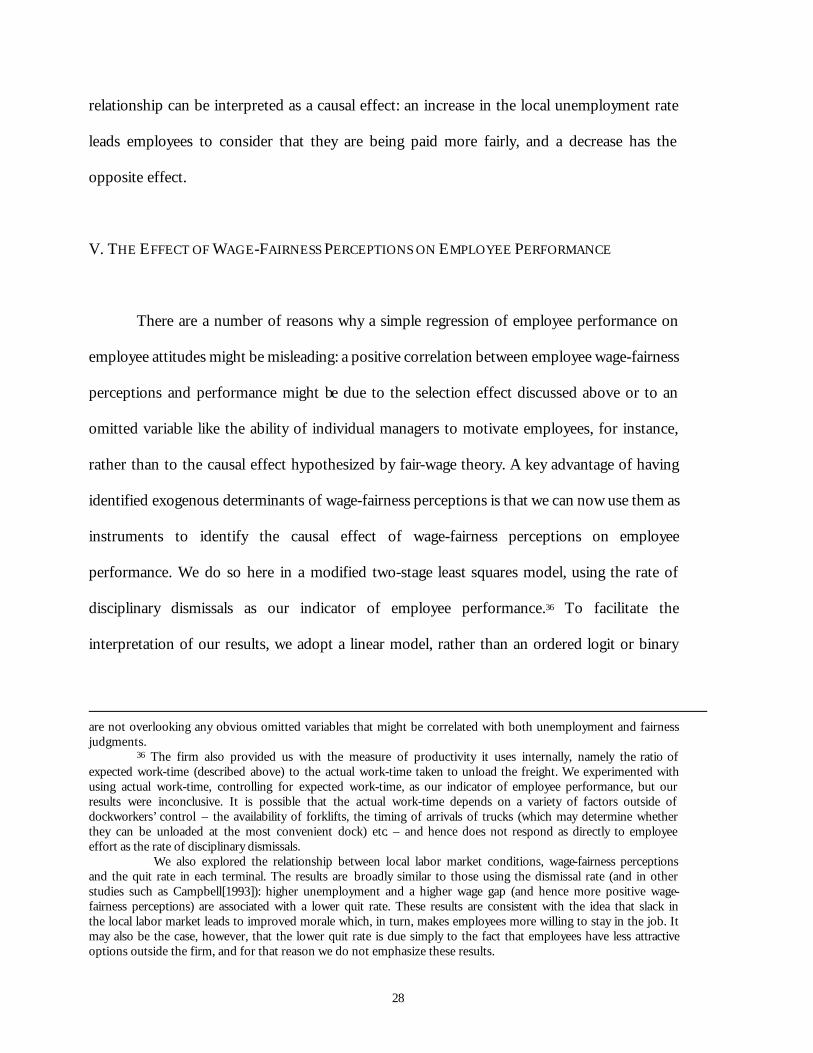
logit, for our first-stage regression of fairness perceptions on local labor market conditions.37
Because we have data on disciplinary dismissals only at the terminal-year level, our covariates in
the second stage are the terminal-year averages of the predicted fairness response and the
covariates from the first stage.38
Our first stage model is essentially the same as in equation (4) above, with the fairness
responses coded –1, 0, 1 and the error assumed only to have a conditional mean of zero. Our
second stage model is:
(6) jttjjtjtjtjt usyfR +++′+++= µφγγγγ 3210
where Rjt is the dismissal rate; jtf and jty are terminal-year averages of ijtf̂ , the predicted values
from the first stage, and ijty as defined above; sjt is the logarithm of expected work-time, and fj
and mt are terminal and year effects, as above. The error term ujt is assumed to be mean-zero
conditional on our covariates. In our estimation, we adjust the standard errors in our second-
stage equation to account for the noise in the terminal-year-average fairness term, jtf , arising
both from the noise in the gap term and from the noise in the estimation of the coefficients in
the fairness equation.
Our estimate of the coefficient on the terminal-year average fairness term, jtf , will be a
consistent estimate of the effect of fairness perceptions on the dismissal rate under two
assumptions: first, that our instruments, unemployment and the gap term, are uncorrelated with
37 We also carried out the analysis using a binomial logit (treating “?” as missing) in the first stage, and a linear model in the second stage. Such a model fits in the general framework for two-step estimators of Murphy and Topel [1985]. We obtained essentially the same results as when we used a linear model in the first stage, however, and for that reason we report results for the more familiar linear model here.
38 In this sense, our model is not a standard two-stage least squares model. It does, however, fits in the general two-step framework of Murphy and Topel [1985], and gives consistent estimates.
30
ujt; and second, that local labor market conditions influence the dismissal rate only through
wage-fairness perceptions. The second assumption, the exclusion restriction, is particularly
vulnerable to criticism. The labor-discipline theory of efficiency wages [Bowles, 1985; Shapiro
and Stiglitz, 1984] also predicts that local labor market conditions will affect the dismissal rate,
but acting through a different channel: as a worker’s wage rises relative to his outside options
he will work harder, not because he considers the wage more fair and wants to reciprocate, but
rather because he is more afraid of losing the job if caught shirking. In our data, the fair-wage
theory and the shirking theory are observationally equivalent; they differ only in the subjective
mental state they ascribe to employees. Our results in this section should thus be viewed as
valid conditionally: if local conditions affect the dismissal rate only through fairness
perceptions, then we have identified the causal effect of fairness perceptions on the dismissal
rate.39 Judgment about whether the condition is true must be based on how well the theories
account for other sets of facts.40
Table VIII reports the results for the first-stage, second-stage and reduced form
equations. The results in columns (1) and (3) for the first stage in our linear two-stage model
are similar to those for the ordered logits in columns (1) and (2) of Table IV. In column (2), we
include a new covariate, a dummy variable for 1997. In August 1997, a major strike at United
Parcel Service (UPS), led to a significant, temporary upsurge in the volume of small packages in
39 There is another channel through which local labor market conditions may affect the dismissal rate:
when the local labor market is slack, hiring costs may be lower, and so the overall cost of replacing workers may decline. This would generate a positive correlation between unemployment and the dismissal rate, however, and would work against the fair-wage hypothesis.
40 The fact that inter-industry wage differentials are consistent across occupational categories has been taken as evidence for the fair-wage theory (generally augmented by the supposition that profit rates, as well as local labor market conditions, are a reference point for fairness judgments) against the shirking theory. In order to explain this consistency, the shirking theory requires that differences in monitoring technologies across industries be consistent across occupations, which has struck many researchers as unlikely (see, for instance, Krueger and Summers [1986]).
31
the firm we study.41 The firm hired a number of new employees to adjust to the increase.
Although the dismissal rate does not include layoffs, the firm may have had a greater incentive
to reduce the size of the workforce after the UPS strike ended, and this may have induced the
firm to seek a greater number of dismissals than it would otherwise have sought. We include
the 1997 dummy to control for this possibility. The first-stage results in column (2) are similar
to those in columns (1) and (3).
In the second stage, the coefficients on the average predicted fairness response are
negative and significant at the 95 percent level in column (4) and at the 99 percent level in
column (5). We argued above that one can have confidence in our results even without year
effects. If so, and the exclusion restriction is valid, then these results provide support for the
key causal claim of the fair-wage theory: the fairer employees consider their wage, the more
effort they supply. The estimates suggest that the effect is economically important: if 10 percent
of employees switch from considering their wage unfair to considering it fair, then the dismissal
rate will fall by between 1.04 percent and 1.2 percent per year. The mean dismissal rate in our
sample is 2.2 percent, hence such a decrease would cut the average dismissal rate approximately
in half. Once we include a full set of year effects in column (6), the standard error on the
average predicted fairness term rises, and the coefficient is no longer statistically significant.
Note that the magnitude of the coefficient remains roughly constant, however.
Columns (7)-(9) present reduced-form results of regressions of the dismissal rate on
unemployment and the wage gap. We have already seen the main reduced-form result in figure
4b: as unemployment rises, the dismissal rate falls. The coefficient on the unemployment term
is negative and significant at the 95 percent level in both columns (7) and (8), with and without
41 As mentioned above, UPS, which has a maximum single parcel weight of 150 lbs., is normally
considered to operate in a different market segment than less-than-truckload firms, which have average shipment weights of about 1,000 lbs. It is not difficult for less-than-truckload firms to accommodate small parcels, however, and many did so during the UPS strike.
32
the 1997 dummy. The estimates suggest that a 1.1 percent (one standard deviation) increase in
the unemployment rate will lead to reduction in the dismissal rate of approximately .8 percent,
about one-third of the mean dismissal rate in the sample – again fairly significant in economic
terms. Once we include year effects in column (9), however, the coefficient on unemployment
drops to approximately 40 percent of its magnitude in columns (7) and (8) (a decrease similar to
the drop we see when year effects are included in the first stage), and statistically it is no longer
significant.
Although not robust to the inclusion of a full set of year effects, these results constitute
stronger evidence than has appeared in previous empirical tests of efficiency wage theories. The
best-known studies [Cappelli and Chauvin, 1991; Wadhwani and Wall, 1991; Levine, 1992b],
which have estimated the reduced-form relationship between outside labor market conditions
and some indicator of productivity, have not controlled for plant or firm fixed effects, much
less plant or firm effects and year effects simultaneously. In addition, we have been able to test
directly the mechanism through which local labor market conditions are hypothesized to affect
employee performance in the fair-wage variant of efficiency-wage theory.
VI. CONCLUSION
This paper has presented strong, robust evidence that the unemployment rate is an
important reference point for wage-fairness judgments in the firm we study. It has presented
slightly less robust evidence that the predicted wages employees would receive in the outside
labor market play a similar role. To our knowledge, ours is the first study based on observations
of employees in real workplaces to identify arguably exogenous determinants of employees’
wage-fairness perceptions. While our research design does not permit us to evaluate the relative
33
importance of internal vs. external reference points in the formation of wage-fairness
judgments, our results do suggest that in the future formal models and empirical tests of the
role of fairness perceptions should explicitly take both outside unemployment and outside
wages into account.42 An interesting question that remains unanswered is whether the
unemployment rate affects fairness judgments simply because it enters into an individual’s
calculation of his or her expected payoff in the outside labor market or because the
unemployment rate in itself is a salient reference point.
The paper has also presented modest evidence in favor of the key causal claim of the
fair-wage theory: that the fairer employees’ consider their wage, the harder they will work.
These results are not definitive – in particular, they rely on an exclusion restriction that is open
to question, and they are not robust to the inclusion of a full set of year effects – but they
represent an advance on the current state of empirical knowledge in the field.
42 Akerlof’s original paper [1982] allows for external unemployment and predicted wages to influence
fairness judgments and the provision of effort, and our results suggest that this is appropriate.
REFERENCES Akerlof, George. “Labor Contracts as Partial Gift Exchange.” Quarterly Journal of Economics
XCVII (1982), 543-569. __________. “Gift Exchange and Efficiency Wages: Four Views,” American Economic Review
LXXIV (1984), 79-83. Akerlof, George. and J. Yellen. “The Fair Wage-Effort Hypothesis and Unemployment,”
Quarterly Journal of Economics CV (1990): 255-283. Akerlof, George, Andrew Rose and Janet Yellen. “Job Switching and Job Satisfaction in the U.S.
Labor Market.” Brookings Papers on Economic Activity II (1988), 495-582. Belzer, Michael H. Paying the Toll: Economic Deregulation of the Trucking Industry.
(Washington, DC: Economic Policy Institute, 1994). __________. “Collective Bargaining after Deregulation: Do the Teamsters Still Count?” Industrial
and Labor Relations Review XLVIII (1995), 636-655. __________. Sweatshops on Wheels: Winners and Losers in Trucking Deregulation. (New York
NY: Oxford University Press, 2000). Bewley, Truman. Why Wages Don’t Fall During a Recession. (Cambridge, MA: Harvard
University Press, 1999). Bowles, Samuel. “The Production Process in a Competitive Economy: Walrasian, Neo-Hobbesian
and Marxian Models.” American Economic Review LXXV (1985), 16-36. Burks, Stephen V. “A Social Preferences Approach to Segmentation of the Labor and Product
Markets in the U.S. Trucking Industry.” Unpub. paper, University of Minnesota, Morris, 2002. Cappelli, Peter and Keith Chauvin. “An Interplant Test of the Efficiency Wage Hypothesis.”
Quarterly Journal of Economics CVI (1991), 769-787. Campbell, Carl M. 1993. “Do Firms Pay Efficiency Wages? Evidence with Data at the Firm
Level.” Journal of Labor Economics XI (1993), 442-470. Campbell, Carl M. and Kunal Kamlani. “The Reasons for Wage Rigidity: Evidence from a Survey
of Firms.” Quarterly Journal of Economics CXII (1997), 759-89. Charness, Gary and Matthew Rabin. “Understanding Social Preferences with Simple Tests”
Quarterly Journal of Economics (forthcoming). Dickens, William and Lawrence Katz. “Inter-Industry Wage Differences and Industry
Characteristics.” in Unemployment and the Structure of Labor Markets, Kevin Lang and Jonathan Leonard eds. (New York NY: Blackwell, 1987).
Doeringer, Peter and Michael Piore. Internal Labor Markets and Manpower Analysis. (Lexington MA: D.C. Heath, 1971).
Fehr, Ernst, Georg Kirchsteiger and Arno Reidl. “Does Fairness Prevent Market Clearing? An Experimental Investigation.” Quarterly Journal of Economics CVIII (1993), 437-60.
Fehr, Ernst, Simon Gächter, and Georg Kirchsteiger. “Reciprocal Fairness and Non-Compensating Wage Differentials.” Journal of Institutional and Theoretical Economics CLII (1996), 608-40.
__________, __________ and __________. “Reciprocity as a Contract Enforcement Device: Experimental Evidence.” Econometrica LXV (1997), 833-860.
Fehr, Ernst, Erich Kirchler, Andreas Weichbold and Simon Gachter. “When Social Norms Overpower Competition — Social Exchange in Experimental Labor Markets.” Journal of Labor Economics XVI (1998), 324-351.
Foulkes, Fred. Personnel Policies in Large Non-Union Companies. (Englewood Cliffs NJ: Prentice Hall, 1980).
35
Huang, Tzu-Ling, Arne Hallam, Peter Orazem, and Elizabeth Paterno. “Empirical Tests of Efficiency Wage Models.” Economica LXV (1996), 125-43.
Ichino, Andrea and Giovanni Maggi. 2000. “Work Environment and Individual Background: Explaining Regional Shirking Differentials in a Large Italian Firm.” Quarterly Journal of Economics CXV (2000), 1057-1090.
Kahneman, Daniel, Jack L. Knetsch, and Richard H. Thaler. “Entitlements in the Market: Fairness as a Constraint on Profit-seeking.” American Economic Review LXXVI (1986), 728-741.
Katz, Lawrence. “Efficiency Wage Theories: A Partial Evaluation.” In NBER Macroeconomics Annual, Stanley Fischer ed. (Cambridge MA: MIT Press, 1986).
Katz, Lawrence, and Lawrence Summers, “Industry Rents: Evidence and Implications.” Brookings Papers on Economic Activity: Microeconomics (1989), 209-75.
Kaufman, Roger T. 1984. “On Wage Stickiness in Britain's Competitive Sector.” British Journal of Industrial Relations XXII (1984), 101-12.
Krueger, Alan and Lawrence Summers. “Efficiency Wages and the Inter-Industry Wage Structure.” Econometrica LVI (1986), 259-293.
Lee, David S. “Trimming for Bounds on Treatment Effects with Missing Outcomes.” UC Berkeley Center for Labor Economics Working Paper #51 (2002).
Levine, David I. “What Do Wages Buy?” Proceedings of the Industrial Relations Research Association: 45th Annual Proceedings (1992a), 133-141.
__________. “Can Wage Increases Pay for Themselves? Tests with a Production Function.” Economic Journal CII (1992b), 1102-1115.
__________. “Fairness, Markets and Ability to Pay: Evidence from Compensation Executives.” American Economic Review LXXXIII (1993), 1241-1259.
Levinson, Harold M. “Trucking.” In Collective Bargaining: Contemporary American Experience, Gerald Somers ed. (Madison WI: Industrial Relations Research Association, 1981).
Lincoln, James R. and Arne Kalleberg. Culture, Control and Commitment. (Cambridge U.K.: Cambridge University Press, 1990).
___________ and __________. “Commitment, Quits, and Work Organization in Japanese and U.S. Plants.” Industrial and Labor Relations Review L (1996), 39-59.
Moulton, Brent. “Random Group Effects and the Precision of Regression Estimates.” Journal of Econometrics XXXII (1986), 385-397.
Murphy, Kevin M. and Robert H. Topel. “Estimation and Inference in Two-Step Econometric Models.” Journal of Business and Economic Statistics III (1985), 370-379.
Nebesky, William, B. Starr McMullen and Man-Keung Lee. “Testing for Market Power in the U.S. Motor Carrier Industry.” Review of Industrial Organization X (1995), 559-76.
Norsworthy, J.R. and Craig A. Zabala. “Worker Attitudes, Worker Behavior and Productivity in the U.S. Automobile Industry, 1959-1976.” Industrial and Labor Relations Review XXXVIII (1985a), 544-557.
__________. “Effects of Worker Attitudes on Production Costs and the Value of Capital Input” Economic Journal XCV (1985b), 992-1002.
__________. “Worker Attitudes and the Cost of Production: Hypothesis Tests in an Equilibrium Model.” Economic Inquiry XXVIII (1990), 57-78.
Rabin, Matthew. “Incorporating Fairness into Game Theory and Economics.” American Economic Review LXXXIII (1993), 1281-1302.
Shapiro, Carl and Joseph Stiglitz. “Equilibrium Unemployment as a Worker Discipline Device.” American Economic Review LXXIV (1984), 433-44.

36
Spitz, Janet. “Work Force Response to an Efficiency Wage: Productivity, Turnover, and the Grievance Rate.” Proceedings of the Industrial Relations Research Association: 45th Annual Proceedings (1993), 142-150.
Straka, John. “Is Worker Morale Costly to Firms?” Industrial and Labor Relations Review XLIV (1993), 381-394.
Wadhwani, Sushil and Martin Wall. “A Direct Test of the Efficiency Wage Model Using UK Micro-data.” Oxford Economic Papers XLIII (1991), 529-548.
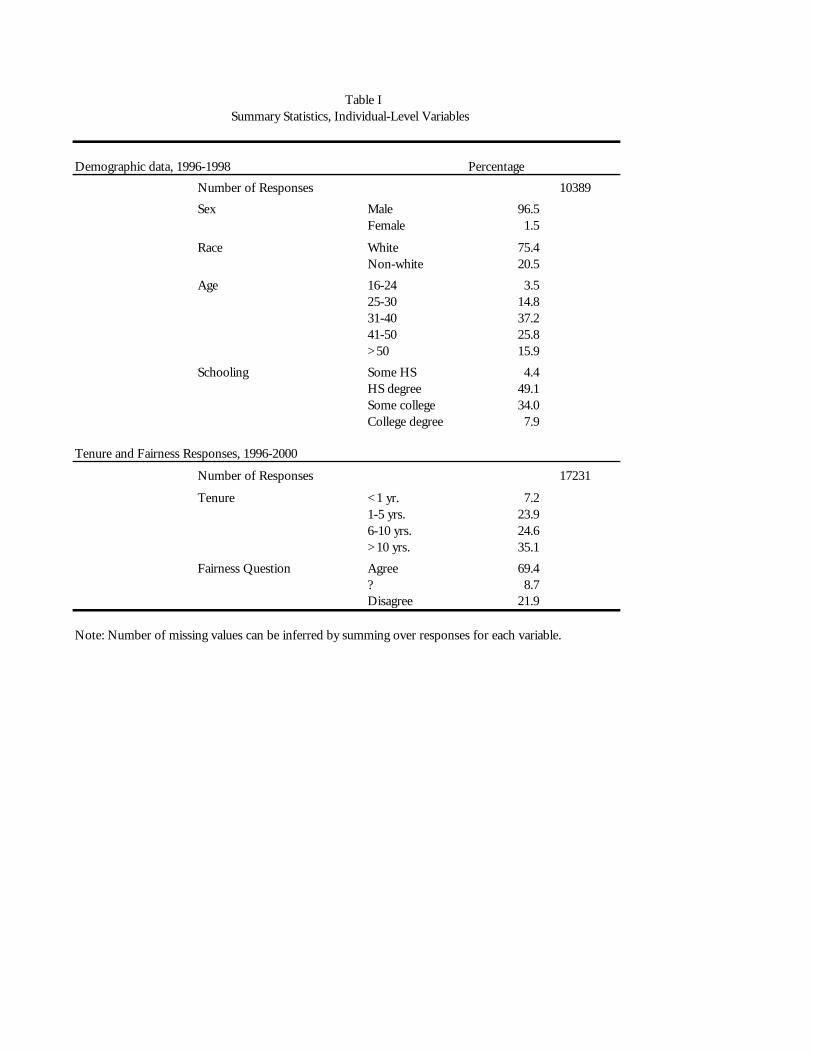
Table I Summary Statistics, Individual-Level Variables
Demographic data, 1996-1998 Percentage
Number of Responses 10389
Sex Male 96.5Female 1.5
Race White 75.4Non-white 20.5
Age 16-24 3.525-30 14.831-40 37.241-50 25.8>50 15.9
Schooling Some HS 4.4HS degree 49.1Some college 34.0College degree 7.9
Tenure and Fairness Responses, 1996-2000
Number of Responses 17231
Tenure <1 yr. 7.21-5 yrs. 23.96-10 yrs. 24.6>10 yrs. 35.1
Fairness Question Agree 69.4? 8.7Disagree 21.9
Note: Number of missing values can be inferred by summing over responses for each variable.
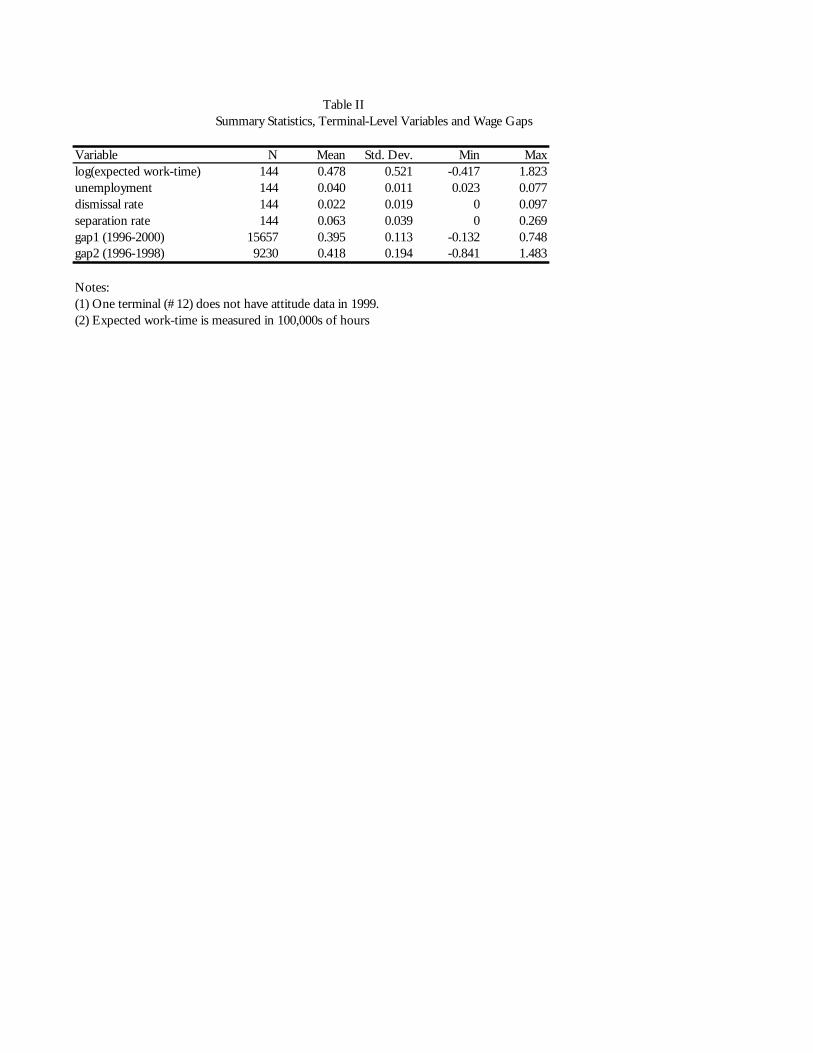
Table IISummary Statistics, Terminal-Level Variables and Wage Gaps
Variable N Mean Std. Dev. Min Maxlog(expected work-time) 144 0.478 0.521 -0.417 1.823unemployment 144 0.040 0.011 0.023 0.077dismissal rate 144 0.022 0.019 0 0.097separation rate 144 0.063 0.039 0 0.269gap1 (1996-2000) 15657 0.395 0.113 -0.132 0.748gap2 (1996-1998) 9230 0.418 0.194 -0.841 1.483
Notes:(1) One terminal (#12) does not have attitude data in 1999.(2) Expected work-time is measured in 100,000s of hours
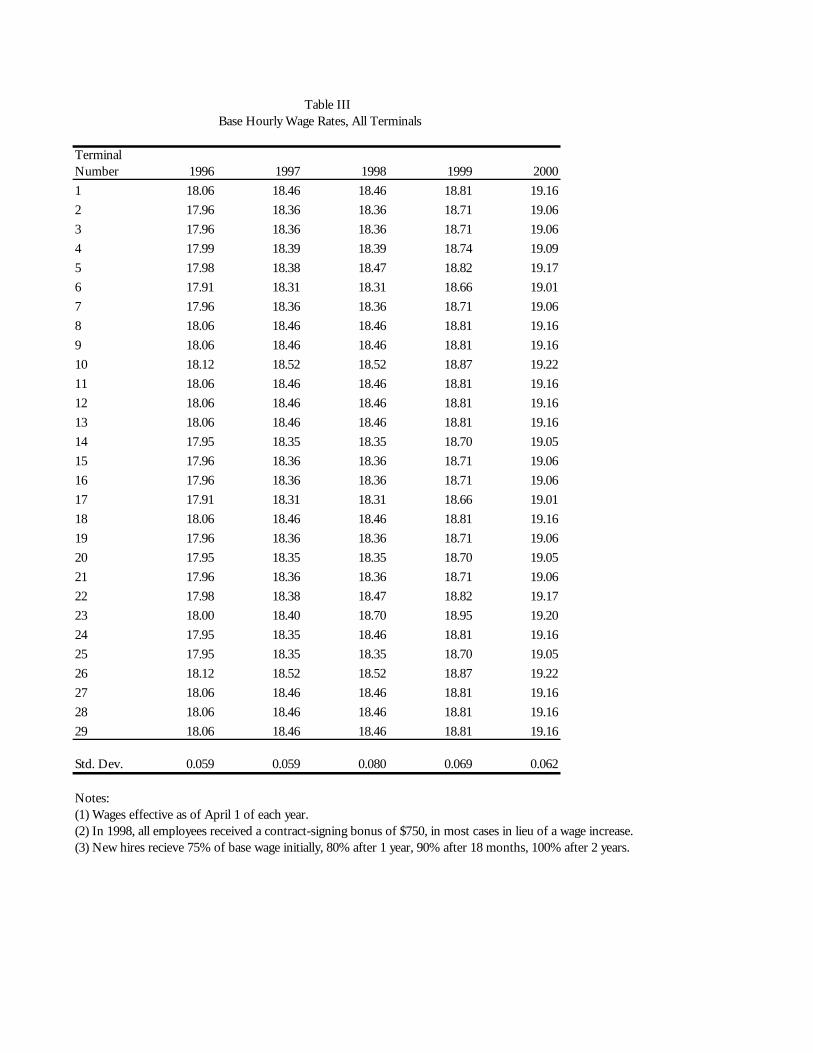
Table IIIBase Hourly Wage Rates, All Terminals
TerminalNumber 1996 1997 1998 1999 20001 18.06 18.46 18.46 18.81 19.162 17.96 18.36 18.36 18.71 19.063 17.96 18.36 18.36 18.71 19.064 17.99 18.39 18.39 18.74 19.095 17.98 18.38 18.47 18.82 19.176 17.91 18.31 18.31 18.66 19.017 17.96 18.36 18.36 18.71 19.068 18.06 18.46 18.46 18.81 19.169 18.06 18.46 18.46 18.81 19.1610 18.12 18.52 18.52 18.87 19.2211 18.06 18.46 18.46 18.81 19.1612 18.06 18.46 18.46 18.81 19.1613 18.06 18.46 18.46 18.81 19.1614 17.95 18.35 18.35 18.70 19.0515 17.96 18.36 18.36 18.71 19.0616 17.96 18.36 18.36 18.71 19.0617 17.91 18.31 18.31 18.66 19.0118 18.06 18.46 18.46 18.81 19.1619 17.96 18.36 18.36 18.71 19.0620 17.95 18.35 18.35 18.70 19.0521 17.96 18.36 18.36 18.71 19.0622 17.98 18.38 18.47 18.82 19.1723 18.00 18.40 18.70 18.95 19.2024 17.95 18.35 18.46 18.81 19.1625 17.95 18.35 18.35 18.70 19.0526 18.12 18.52 18.52 18.87 19.2227 18.06 18.46 18.46 18.81 19.1628 18.06 18.46 18.46 18.81 19.1629 18.06 18.46 18.46 18.81 19.16
Std. Dev. 0.059 0.059 0.080 0.069 0.062
Notes:(1) Wages effective as of April 1 of each year.(2) In 1998, all employees received a contract-signing bonus of $750, in most cases in lieu of a wage increase.(3) New hires recieve 75% of base wage initially, 80% after 1 year, 90% after 18 months, 100% after 2 years.
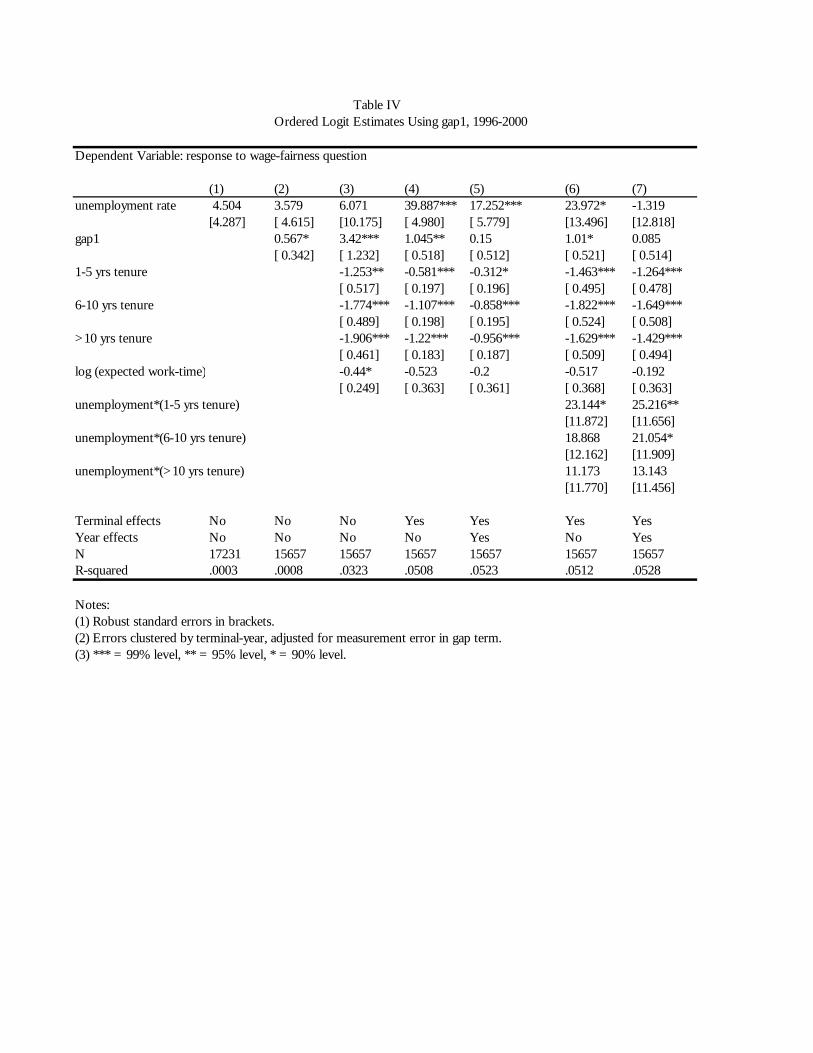
Table IVOrdered Logit Estimates Using gap1, 1996-2000
Dependent Variable: response to wage-fairness question
(1) (2) (3) (4) (5) (6) (7)unemployment rate 4.504 3.579 6.071 39.887*** 17.252*** 23.972* -1.319
[4.287] [ 4.615] [10.175] [ 4.980] [ 5.779] [13.496] [12.818]gap1 0.567* 3.42*** 1.045** 0.15 1.01* 0.085
[ 0.342] [ 1.232] [ 0.518] [ 0.512] [ 0.521] [ 0.514]1-5 yrs tenure -1.253** -0.581*** -0.312* -1.463*** -1.264***
[ 0.517] [ 0.197] [ 0.196] [ 0.495] [ 0.478]6-10 yrs tenure -1.774*** -1.107*** -0.858*** -1.822*** -1.649***
[ 0.489] [ 0.198] [ 0.195] [ 0.524] [ 0.508]>10 yrs tenure -1.906*** -1.22*** -0.956*** -1.629*** -1.429***
[ 0.461] [ 0.183] [ 0.187] [ 0.509] [ 0.494]log (expected work-time) -0.44* -0.523 -0.2 -0.517 -0.192
[ 0.249] [ 0.363] [ 0.361] [ 0.368] [ 0.363]unemployment*(1-5 yrs tenure) 23.144* 25.216**
[11.872] [11.656]unemployment*(6-10 yrs tenure) 18.868 21.054*
[12.162] [11.909]unemployment*(>10 yrs tenure) 11.173 13.143
[11.770] [11.456]
Terminal effects No No No Yes Yes Yes YesYear effects No No No No Yes No YesN 17231 15657 15657 15657 15657 15657 15657R-squared .0003 .0008 .0323 .0508 .0523 .0512 .0528
Notes:(1) Robust standard errors in brackets.(2) Errors clustered by terminal-year, adjusted for measurement error in gap term.(3) *** = 99% level, ** = 95% level, * = 90% level.
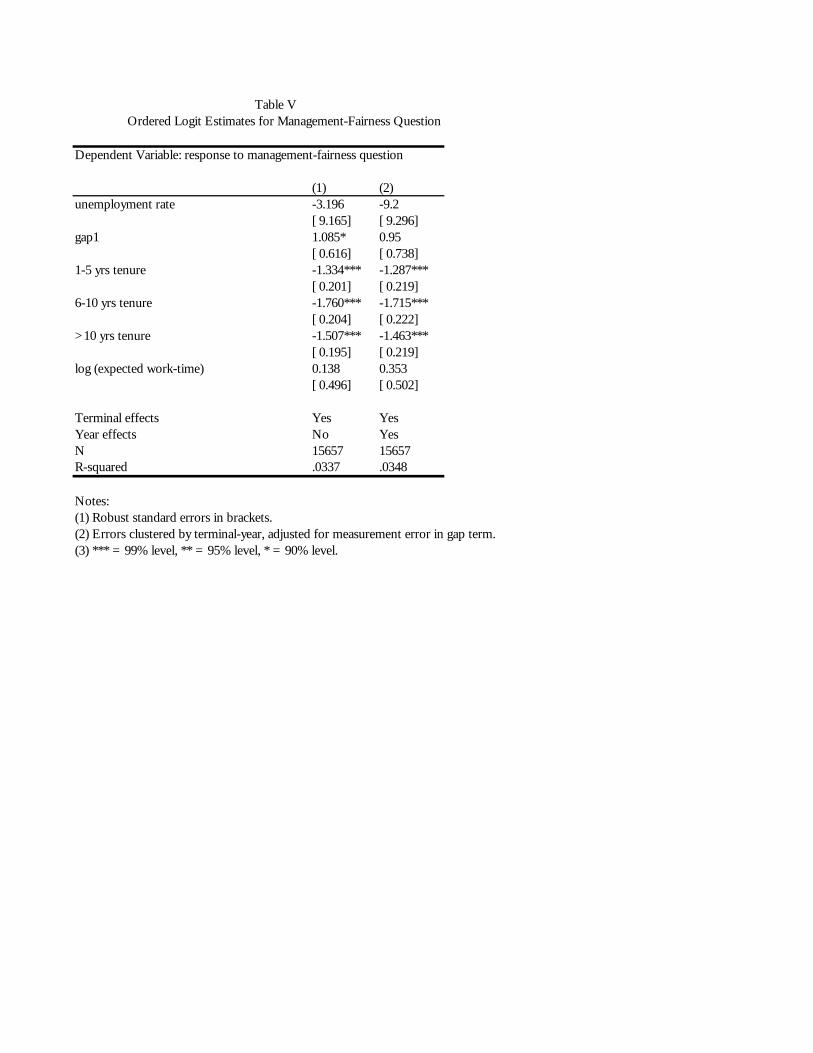
Table VOrdered Logit Estimates for Management-Fairness Question
Dependent Variable: response to management-fairness question
(1) (2)unemployment rate -3.196 -9.2
[ 9.165] [ 9.296]gap1 1.085* 0.95
[ 0.616] [ 0.738]1-5 yrs tenure -1.334*** -1.287***
[ 0.201] [ 0.219]6-10 yrs tenure -1.760*** -1.715***
[ 0.204] [ 0.222]>10 yrs tenure -1.507*** -1.463***
[ 0.195] [ 0.219]log (expected work-time) 0.138 0.353
[ 0.496] [ 0.502]
Terminal effects Yes YesYear effects No YesN 15657 15657R-squared .0337 .0348
Notes:(1) Robust standard errors in brackets.(2) Errors clustered by terminal-year, adjusted for measurement error in gap term.(3) *** = 99% level, ** = 95% level, * = 90% level.
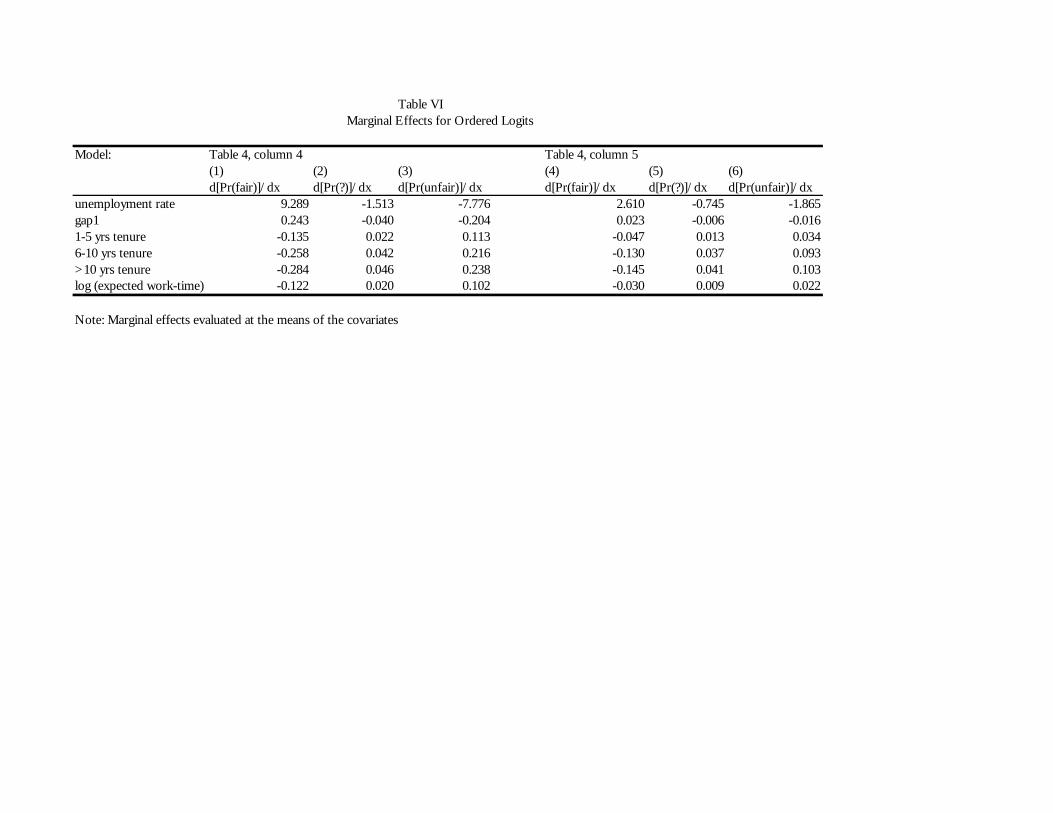
Table VI Marginal Effects for Ordered Logits
Model: Table 4, column 4 Table 4, column 5(1) (2) (3) (4) (5) (6)d[Pr(fair)]/dx d[Pr(?)]/dx d[Pr(unfair)]/dx d[Pr(fair)]/dx d[Pr(?)]/dx d[Pr(unfair)]/dx
unemployment rate 9.289 -1.513 -7.776 2.610 -0.745 -1.865gap1 0.243 -0.040 -0.204 0.023 -0.006 -0.0161-5 yrs tenure -0.135 0.022 0.113 -0.047 0.013 0.0346-10 yrs tenure -0.258 0.042 0.216 -0.130 0.037 0.093>10 yrs tenure -0.284 0.046 0.238 -0.145 0.041 0.103log (expected work-time) -0.122 0.020 0.102 -0.030 0.009 0.022
Note: Marginal effects evaluated at the means of the covariates
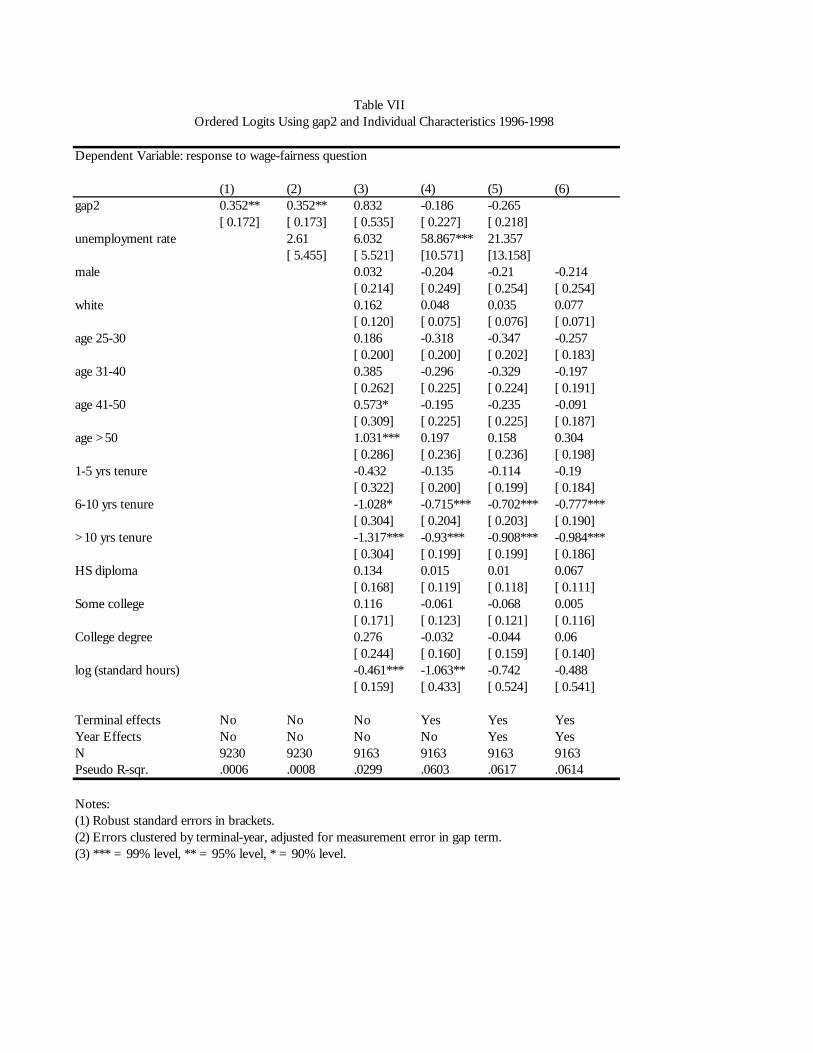
Table VIIOrdered Logits Using gap2 and Individual Characteristics 1996-1998
Dependent Variable: response to wage-fairness question
(1) (2) (3) (4) (5) (6)gap2 0.352** 0.352** 0.832 -0.186 -0.265
[ 0.172] [ 0.173] [ 0.535] [ 0.227] [ 0.218]unemployment rate 2.61 6.032 58.867*** 21.357
[ 5.455] [ 5.521] [10.571] [13.158]male 0.032 -0.204 -0.21 -0.214
[ 0.214] [ 0.249] [ 0.254] [ 0.254]white 0.162 0.048 0.035 0.077
[ 0.120] [ 0.075] [ 0.076] [ 0.071]age 25-30 0.186 -0.318 -0.347 -0.257
[ 0.200] [ 0.200] [ 0.202] [ 0.183]age 31-40 0.385 -0.296 -0.329 -0.197
[ 0.262] [ 0.225] [ 0.224] [ 0.191]age 41-50 0.573* -0.195 -0.235 -0.091
[ 0.309] [ 0.225] [ 0.225] [ 0.187]age >50 1.031*** 0.197 0.158 0.304
[ 0.286] [ 0.236] [ 0.236] [ 0.198]1-5 yrs tenure -0.432 -0.135 -0.114 -0.19
[ 0.322] [ 0.200] [ 0.199] [ 0.184]6-10 yrs tenure -1.028* -0.715*** -0.702*** -0.777***
[ 0.304] [ 0.204] [ 0.203] [ 0.190]>10 yrs tenure -1.317*** -0.93*** -0.908*** -0.984***
[ 0.304] [ 0.199] [ 0.199] [ 0.186]HS diploma 0.134 0.015 0.01 0.067
[ 0.168] [ 0.119] [ 0.118] [ 0.111]Some college 0.116 -0.061 -0.068 0.005
[ 0.171] [ 0.123] [ 0.121] [ 0.116]College degree 0.276 -0.032 -0.044 0.06
[ 0.244] [ 0.160] [ 0.159] [ 0.140]log (standard hours) -0.461*** -1.063** -0.742 -0.488
[ 0.159] [ 0.433] [ 0.524] [ 0.541]
Terminal effects No No No Yes Yes YesYear Effects No No No No Yes YesN 9230 9230 9163 9163 9163 9163Pseudo R-sqr. .0006 .0008 .0299 .0603 .0617 .0614
Notes:(1) Robust standard errors in brackets.(2) Errors clustered by terminal-year, adjusted for measurement error in gap term.(3) *** = 99% level, ** = 95% level, * = 90% level.
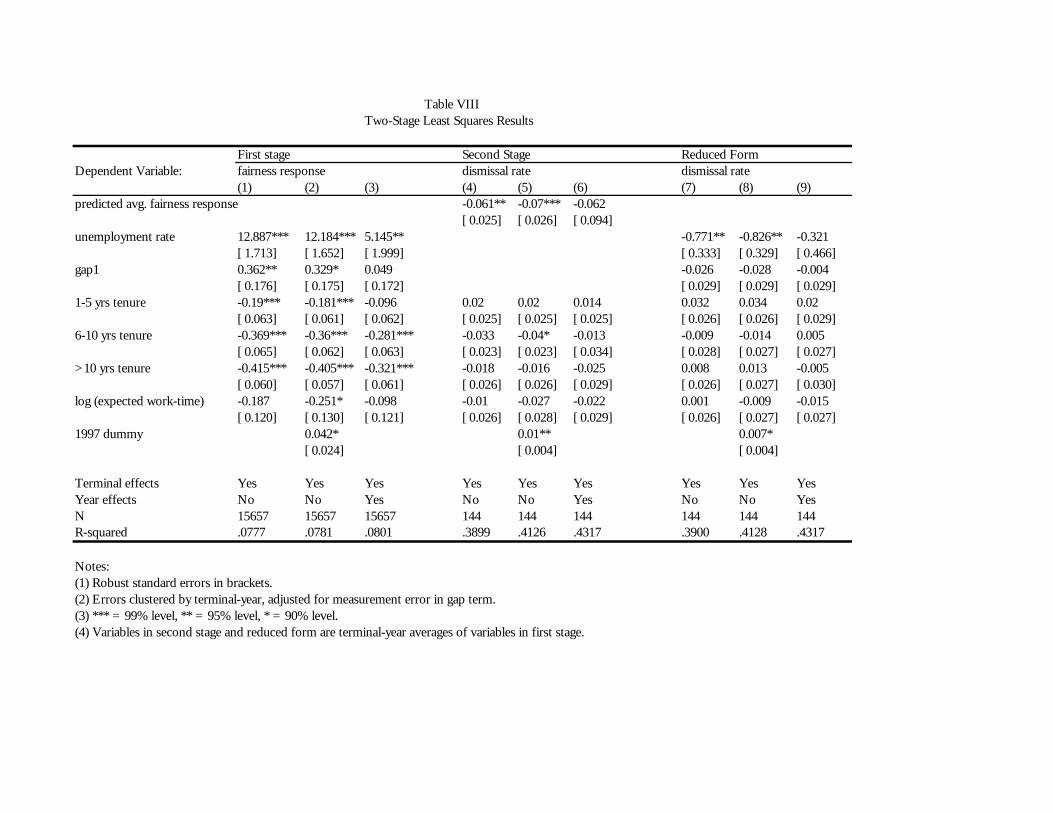
Table VIIITwo-Stage Least Squares Results
First stage Second Stage Reduced FormDependent Variable: fairness response dismissal rate dismissal rate
(1) (2) (3) (4) (5) (6) (7) (8) (9)predicted avg. fairness response -0.061** -0.07*** -0.062
[ 0.025] [ 0.026] [ 0.094]unemployment rate 12.887*** 12.184*** 5.145** -0.771** -0.826** -0.321
[ 1.713] [ 1.652] [ 1.999] [ 0.333] [ 0.329] [ 0.466]gap1 0.362** 0.329* 0.049 -0.026 -0.028 -0.004
[ 0.176] [ 0.175] [ 0.172] [ 0.029] [ 0.029] [ 0.029]1-5 yrs tenure -0.19*** -0.181*** -0.096 0.02 0.02 0.014 0.032 0.034 0.02
[ 0.063] [ 0.061] [ 0.062] [ 0.025] [ 0.025] [ 0.025] [ 0.026] [ 0.026] [ 0.029]6-10 yrs tenure -0.369*** -0.36*** -0.281*** -0.033 -0.04* -0.013 -0.009 -0.014 0.005
[ 0.065] [ 0.062] [ 0.063] [ 0.023] [ 0.023] [ 0.034] [ 0.028] [ 0.027] [ 0.027]>10 yrs tenure -0.415*** -0.405*** -0.321*** -0.018 -0.016 -0.025 0.008 0.013 -0.005
[ 0.060] [ 0.057] [ 0.061] [ 0.026] [ 0.026] [ 0.029] [ 0.026] [ 0.027] [ 0.030]log (expected work-time) -0.187 -0.251* -0.098 -0.01 -0.027 -0.022 0.001 -0.009 -0.015
[ 0.120] [ 0.130] [ 0.121] [ 0.026] [ 0.028] [ 0.029] [ 0.026] [ 0.027] [ 0.027]1997 dummy 0.042* 0.01** 0.007*
[ 0.024] [ 0.004] [ 0.004]
Terminal effects Yes Yes Yes Yes Yes Yes Yes Yes YesYear effects No No Yes No No Yes No No YesN 15657 15657 15657 144 144 144 144 144 144R-squared .0777 .0781 .0801 .3899 .4126 .4317 .3900 .4128 .4317
Notes:(1) Robust standard errors in brackets.(2) Errors clustered by terminal-year, adjusted for measurement error in gap term.(3) *** = 99% level, ** = 95% level, * = 90% level.(4) Variables in second stage and reduced form are terminal-year averages of variables in first stage.
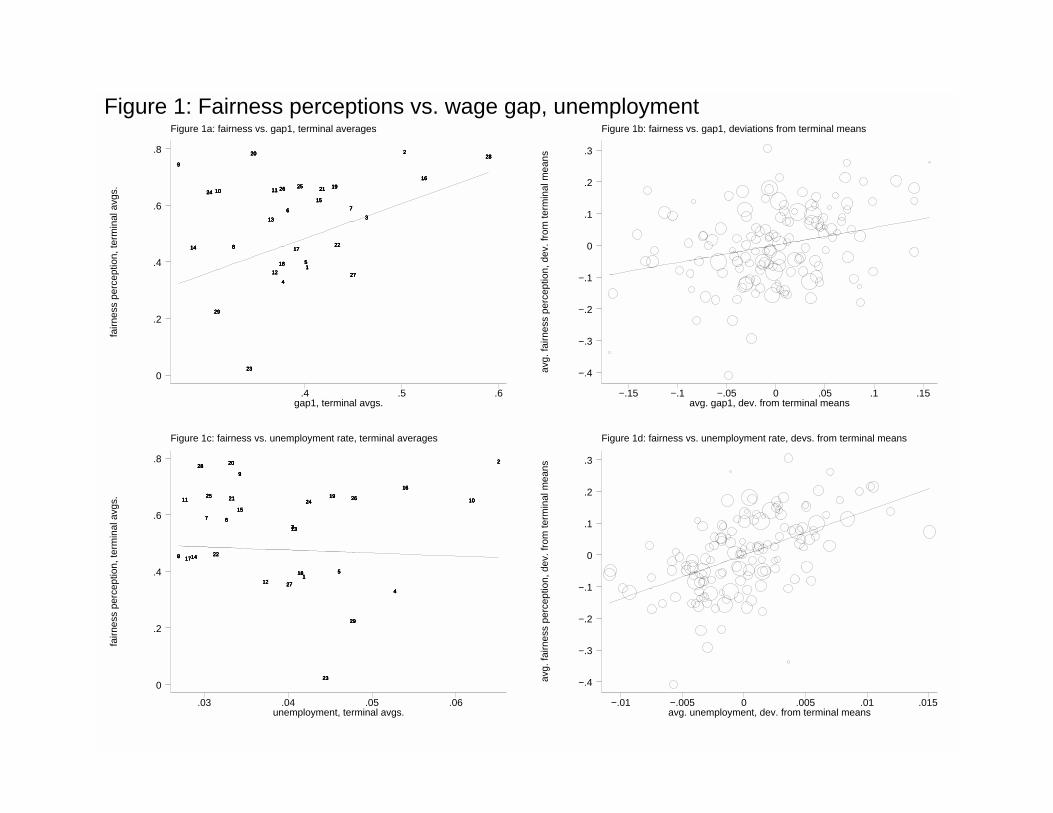
Figure 1: Fairness perceptions vs. wage gap, unemploymentFigure 1a: fairness vs. gap1, terminal averages
fairn
ess
perc
eptio
n, te
rmin
al a
vgs.
gap1, terminal avgs..4 .5 .6
0
.2
.4
.6
.899999
1414141414
2424242424
2929292929
1010101010
88888
2323232323
2020202020
1313131313
1111111111
12121212
1818181818
2626262626
44444
66666
1717171717
2525252525
5555511111
1515151515
2121212121 1919191919
2222222222
77777
2727272727
33333
22222
1616161616
2828282828
Figure 1b: fairness vs. gap1, deviations from terminal means
avg.
fairn
ess
perc
eptio
n, d
ev. f
rom
term
inal
mea
ns
avg. gap1, dev. from terminal means−.15 −.1 −.05 0 .05 .1 .15
−.4
−.3
−.2
−.1
0
.1
.2
.3
Figure 1c: fairness vs. unemployment rate, terminal averages
fairn
ess
perc
eptio
n, te
rmin
al a
vgs.
unemployment, terminal avgs..03 .04 .05 .06
0
.2
.4
.6
.8
88888
1111111111
17171717171414141414
2828282828
77777
2525252525
2222222222
66666
2020202020
2121212121
99999
1515151515
12121212 2727272727
333331313131313
181818181811111
2424242424
2323232323
1919191919
55555
2929292929
2626262626
44444
1616161616
1010101010
22222
Figure 1d: fairness vs. unemployment rate, devs. from terminal means
avg.
fairn
ess
perc
eptio
n, d
ev. f
rom
term
inal
mea
ns
avg. unemployment, dev. from terminal means−.01 −.005 0 .005 .01 .015
−.4
−.3
−.2
−.1
0
.1
.2
.3
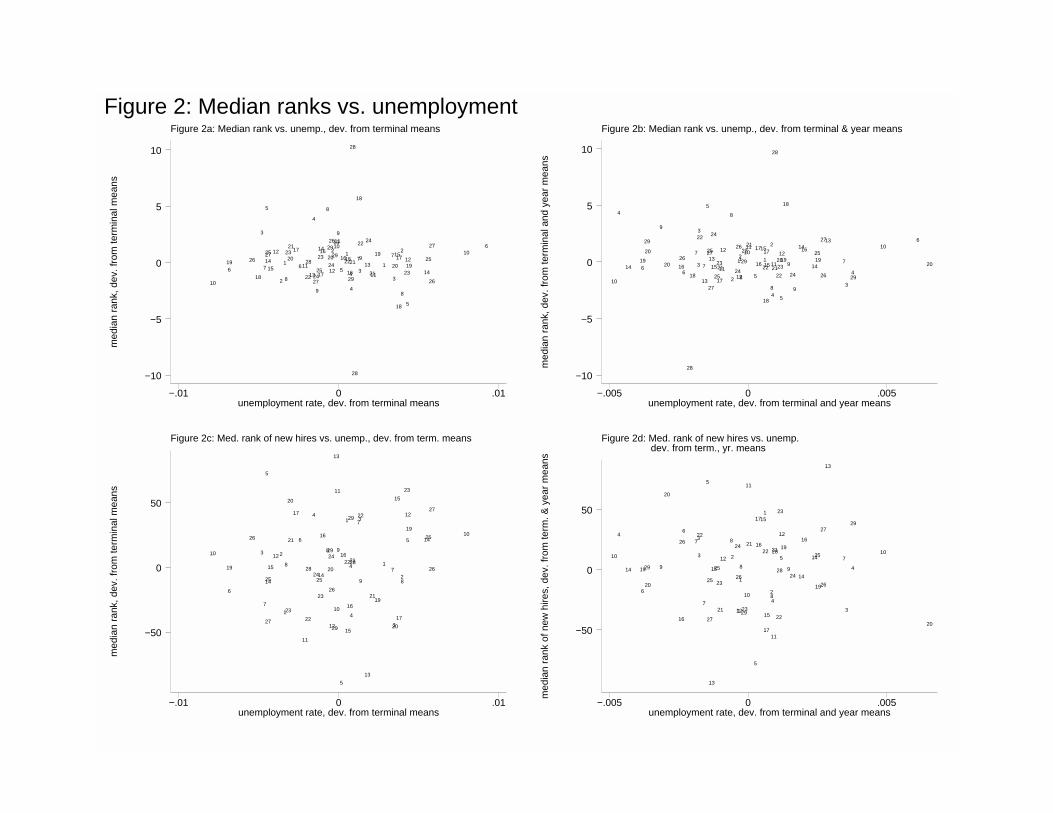
Figure 2: Median ranks vs. unemploymentFigure 2a: Median rank vs. unemp., dev. from terminal means
med
ian
rank
, dev
. fro
m te
rmin
al m
eans
unemployment rate, dev. from terminal means−.01 0 .01
−10
−5
0
5
10
10
619 26
18
3
7
5
142725
15
12
2
1
8
2320
2117
611
22
28
13
4
2724
9
25
23
17
1416
8
29
2024
26
12
229
131011
9
5
1612215
16429
4
21
28
28
7
18
3
22
913
24
2111
19
1
7
3
20
15
18
172
8
23
5
1219
14
25
26
2710
6
Figure 2b: Median rank vs. unemp., dev. from terminal & year means
med
ian
rank
, dev
. fro
m te
rmin
al a
nd y
ear
mea
ns
unemployment rate, dev. from terminal and year means−.005 0 .005
−10
−5
0
5
10
10
4
14 619
29
20
9
20 16
26
6
28
18
7
3
322
7
13
5
2725
27
13
24
15
25
23
17
2111
12
8
2
24
26
1
12
21
8
29
23101121
5
17
16
15
122
18
17
15
2
84
1121
28
22
2823
5
1219
18
9
24
9
1416
14
2519
26
2713
7
3
429
106
20
Figure 2c: Med. rank of new hires vs. unemp., dev. from term. means
med
ian
rank
, dev
. fro
m te
rmin
al m
eans
unemployment rate, dev. from terminal means−.01 0 .01
−50
0
50
10
6
19
26
3
7
5
14
27
25
15
12 2
1
8
23
20
21
17
6
11
22
28
4
2425
23
14
16
829
20
24
26
1229
13
10
11
9
5
16
1
22
15
16
4
29
4
2128
7322
9
13
2119
17
320
15
17
28
23
5
12
19
1425
26
27
10
Figure 2d: Med. rank of new hires vs. unemp. dev. from term., yr. means
med
ian
rank
of n
ew h
ires,
dev
. fro
m te
rm. &
yea
r m
eans
unemployment rate, dev. from terminal and year means−.005 0 .005
−50
0
50
10
4
14
6
1929
20
9
20
16
26
6
73
3
22
7
5
27
25
13
1525
23
21
12
8
2
24
26
112
1
8
2923
10
11
21
5
17
16
151
22
17
15
284
11
2128
22
28
23
5
12
19
924 14
16
1425
1926
27
13
7
3
4
29
10
20
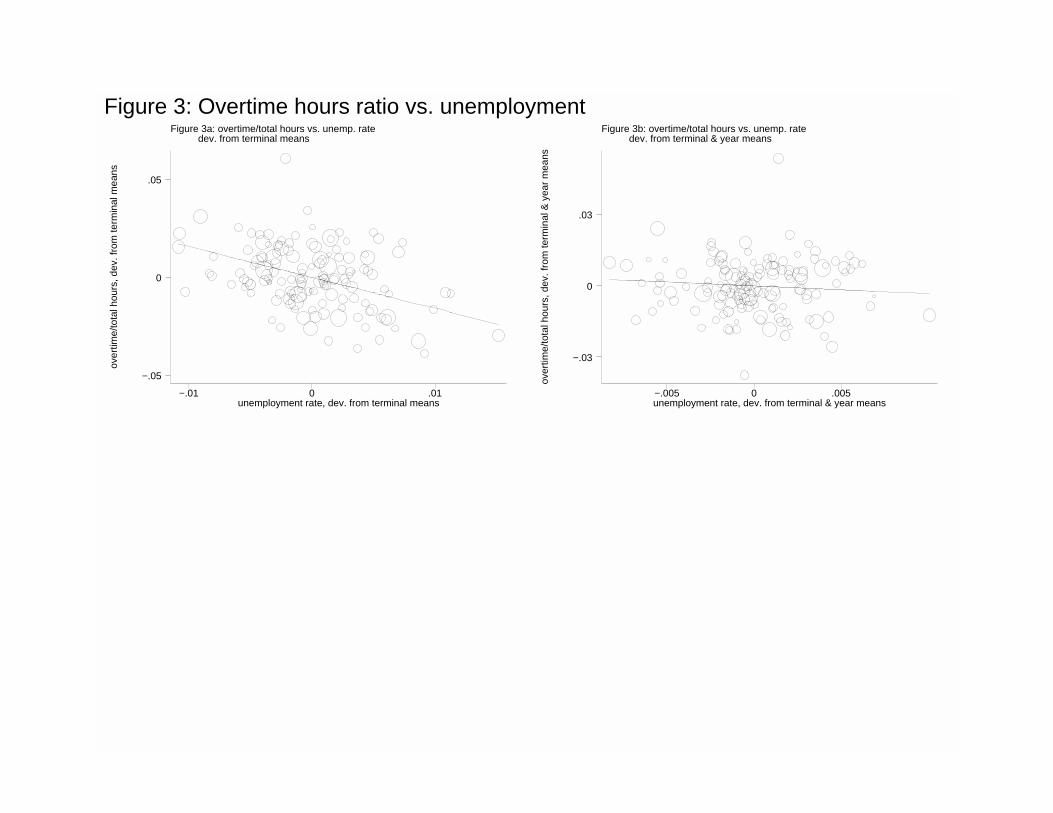
Figure 3: Overtime hours ratio vs. unemploymentFigure 3a: overtime/total hours vs. unemp. rate dev. from terminal means
over
time/
tota
l hou
rs, d
ev. f
rom
term
inal
mea
ns
unemployment rate, dev. from terminal means−.01 0 .01
−.05
0
.05
Figure 3b: overtime/total hours vs. unemp. rate dev. from terminal & year means
over
time/
tota
l hou
rs, d
ev. f
rom
term
inal
& y
ear
mea
ns
unemployment rate, dev. from terminal & year means−.005 0 .005
−.03
0
.03
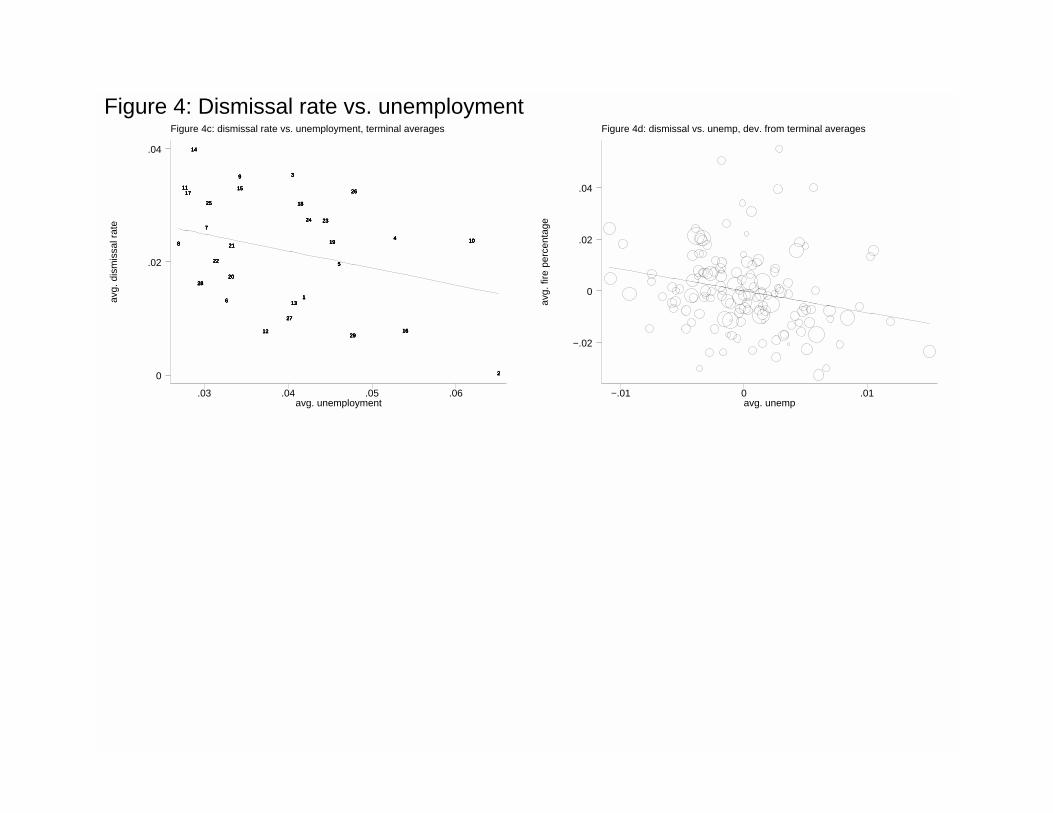
Figure 4: Dismissal rate vs. unemploymentFigure 4c: dismissal rate vs. unemployment, terminal averages
avg.
dis
mis
sal r
ate
avg. unemployment.03 .04 .05 .06
0
.02
.04
88888
11111111111717171717
1414141414
2828282828
77777
2525252525
2222222222
66666
2020202020
2121212121
99999
1515151515
12121212
2727272727
33333
1313131313
1818181818
11111
2424242424 2323232323
1919191919
55555
2929292929
2626262626
44444
1616161616
1010101010
22222
Figure 4d: dismissal vs. unemp, dev. from terminal averages
avg.
fire
per
cent
age
avg. unemp−.01 0 .01
−.02
0
.02
.04