Embed Size (px)
Citation preview

FAIRFAX COUNTY WATER AUTHORITY
Management’s Discussion and Analysis, Basic Financial Statements, Required Supplementary Information and Supplementary Information December 31, 2016 (With Independent Auditor’s Report Thereon)
ASSURANCE, TAX & ADVISORY SERVICES

FAIRFAX COUNTY WATER AUTHORITY
Table of Contents
Independent Auditor’s Report 1
Management’s Discussion and Analysis 4
Basic Financial Statements:
Statement of Net Position 10
Statement of Revenues, Expenses and Change in Net Position 12
Statement of Cash Flows 13
Statement of Fiduciary Net Position 15
Notes to Basic Financial Statements 16
Required Supplementary Information:
Schedule of Changes in Net Pension Liability and Related Ratios 48
Schedule of Employer Contributions – Pension Plan 49
Schedules of Funding Progress and Employer Contributions – Health Benefits 50
Schedules of Funding Progress and Employer Contributions – OPEB 51
Supplementary Information:
Statement of Changes in Assets and Liabilities – Agency Funds 53
Schedule of Bonds Payable 54
1
INDEPENDENT AUDITOR’S REPORT
To the Honorable Board Members Fairfax County Water Authority Fairfax, Virginia Report on the Financial Statements We have audited the accompanying financial statements of the Fairfax County Water Authority (Authority), as of and for the year ended December 31, 2016, and the related notes to the financial statements, which collectively comprise the Authority's basic financial statements as listed in the table of contents. Management’s Responsibility for the Financial Statements Management is responsible for the preparation and fair presentation of these financial statements in accordance with accounting principles generally accepted in the United States of America; this includes the design, implementation, and maintenance of internal control relevant to the preparation and fair presentation of financial statements that are free from material misstatement, whether due to fraud or error. Auditor’s Responsibility Our responsibility is to express an opinion on these financial statements based on our audit. We conducted our audit in accordance with auditing standards generally accepted in the United States of America; the standards applicable to financial audits contained in Government Auditing Standards, issued by the Comptroller General of the United States; and the Specifications for Audits of Authorities, Boards, and Commissions issued by the Auditor of Public Accounts of the Commonwealth of Virginia. Those standards and specifications require we plan and perform the audit to obtain reasonable assurance about whether the financial statements are free from material misstatement. An audit involves performing procedures to obtain audit evidence about the amounts and disclosures in the financial statements. The procedures selected depend on the auditor’s judgment, including the assessment of the risks of material misstatement of the financial statements, whether due to fraud or error. In making those risk assessments, the auditor considers internal control relevant to the Authority’s preparation and fair presentation of the financial statements in order to design audit procedures that are appropriate in the circumstances, but not for the purpose of expressing an opinion on the effectiveness of the Authority’s internal control. Accordingly, we express no such opinion. An audit also includes evaluating the appropriateness of accounting policies used and the reasonableness of significant accounting estimates made by management, as well as evaluating the overall presentation of the financial statements. We believe the audit evidence we have obtained is sufficient and appropriate to provide a basis for our audit opinion.

2
Opinion In our opinion, the financial statements referred to above present fairly, in all material respects, the financial position of the Authority, as of December 31, 2016, and the respective change in financial position and cash flows for the year then ended in accordance with accounting principles generally accepted in the United States of America. Other Matters Required Supplementary Information Accounting principles generally accepted in the United States of America require the Management's Discussion and Analysis and the required supplementary information on pages 4‐9 and 48‐51, respectively, be presented to supplement the financial statements. Such information, although not a part of the financial statements, is required by the Governmental Accounting Standards Board, who considers it to be an essential part of financial reporting for placing the financial statements in an appropriate operational, economic, or historical context. We have applied certain limited procedures to the required supplementary information in accordance with auditing standards generally accepted in the United States of America, which consisted of inquiries of management about the methods of preparing the information and comparing the information for consistency with management’s responses to our inquiries, the financial statements and other knowledge we obtained during our audit of the financial statements. We do not express an opinion or provide any assurance on the information because the limited procedures do not provide us with sufficient evidence to express an opinion or provide any assurance. Other Information Our audit was conducted for the purpose of forming an opinion on the basic financial statements that collectively comprise the Authority’s basic financial statements. The accompanying schedules listed in the table of contents as supplementary information are presented for purposes of additional analysis and are not a required part of the basic financial statements. The Statement of Changes in Assets and Liabilities – Agency Funds and the Schedule of Bonds Payable are the responsibility of management and were derived from and relate directly to the underlying accounting and other records used to prepare the financial statements. Such information has been subjected to the auditing procedures applied in the audit of the financial statements and certain additional procedures, including comparing and reconciling such information directly to the underlying accounting and other records used to prepare the financial statements or to the financial statements themselves, and other additional procedures in accordance with auditing standards generally accepted in the United States of America. In our opinion, the supplementary information noted above is fairly stated, in all material respects, in relation to the financial statements as a whole.

3
Other Reporting Required by Government Auditing Standards In accordance with Government Auditing Standards, we have also issued our report dated April 7, 2017 on our consideration of the Authority's internal control over financial reporting and on our tests of its compliance with certain provisions of laws, regulations, contracts, and grant agreements and other matters. The purpose of that report is to describe the scope of our testing of internal control over financial reporting and compliance and the results of that testing, and not to provide an opinion on internal control over financial reporting or on compliance. That report is an integral part of an audit performed in accordance with Government Auditing Standards in considering the Authority’s internal control over financial reporting and compliance.
PBMares, LLP
Harrisonburg, Virginia April 7, 2017

4
FAIRFAX COUNTY WATER AUTHORITY
Management’s Discussion and Analysis
This section of the Fairfax County Water Authority (Fairfax Water) annual financial report presents management’s analysis of Fairfax Water’s financial performance during the fiscal year ended December 31, 2016. This analysis should be read in conjunction with the basic financial statements that follow this section.
Financial Highlights
Fairfax Water maintained triple‐A bond ratings from Moody’s Investors Service, Standard & Poor’s and Fitch Ratings.
Effective April 1, 2016, Fairfax Water increased the commodity charge by thirteen cents to $2.68. Even with this 5.1% increase, Fairfax Water’s rates are among the lowest in the area. Other fees and connection charges were also revised at that time.
The revenue from wholesale and retail customers for fiscal year 2016 increased by $1.1 million, approximately 0.8% over fiscal year 2015.
The increase in net position during the year of $16.4 million included operating income of $17.4 million, net nonoperating expenses of $3.2 million and capital contributions of $2.2 million.
Operating expenses during 2016 increased by approximately $16.8 million, which is 23.4% above 2015. $9.2 million of the increase is related to a 2015 non‐cash reduction in other postemployment benefits.
Capital assets (water lines, water tanks, treatment plants, pumping stations, multi‐purpose facilities and other facilities), net of disposals and accumulated depreciation and amortization, increased by $19.6 million, approximately 1.2% over 2015.
Overview of the Financial Statements
This annual financial report consists of three parts – management’s discussion and analysis, the basic financial statements, and required supplementary information. The basic financial statements consist of:
Statement of Net Position
Statement of Revenues, Expenses and Change in Net Position
Statement of Cash Flows
Statement of Fiduciary Net Position
Notes to Basic Financial Statements The Statement of Net Position provides a snapshot of Fairfax Water’s assets, deferred outflows of resources, liabilities, and deferred inflows of resources, providing information about the nature and amounts of investments in resources (assets and deferred outflows of resources) and obligations (liabilities and deferred inflows of resources). This statement may be used to evaluate the capital structure, liquidity, and financial flexibility of Fairfax Water. The Statement of Revenues, Expenses and Change in Net Position reflects revenue and expense activity for the fiscal year. This statement allows the user to measure the success of

5
Fairfax Water’s operations and can be used to determine whether Fairfax Water has successfully recovered its costs through user fees and other charges. The Statement of Cash Flows reports the cash provided and used in operating activities as well as other cash sources, such as investment income and cash payments for repayment of bonds and capital additions. Cash provided by operating activities is reconciled to operating income. Fairfax Water uses the direct method for presenting the cash flow statement. The Statement of Fiduciary Net Position (Agency Funds) reflects the amount collected and owed to Fairfax County and the Cities of Falls Church and Fairfax for sales of sewer services. The Notes to Basic Financial Statements and the Required Supplementary Information provide necessary disclosures that are essential to a full understanding of the data provided in the statements. Fairfax Water operates as an enterprise fund, which is one type of proprietary fund. Enterprise funds operate similarly to private businesses in that charges for services to customers are expected to cover expenses. Fairfax Water’s basic financial statements are presented using the accrual basis of accounting and the economic resources measurement focus. Revenue is recognized when water or other services are delivered. Expenses are recognized when goods and services are received. All revenues and expenses are recognized regardless of when cash is received or paid.
Financial Analysis During 2016, Fairfax Water maintained its sound financial position, as demonstrated by Fairfax Water’s continued growth in net position and strong cash and investment portfolio, along with the strategic management of its debt borrowings, as outlined in the financial statements and schedules included in this report. While exercising prudent fiscal discipline, Fairfax Water continues to ensure it is able to provide safe and reliable water to its customers.

6
Net Position
The following table reflects Fairfax Water’s net position at December 31, 2016 and 2015:
Summary of Net Position (in millions)
2016 2015 Increase (Decrease)
% Change
Current and other assets $ 243.4 $ 259.2 $ (15.8) (6.1)
Capital assets, net of accumulated depreciation and amortization
1,722.8
1,703.2
19.6
1.2
Total assets 1,966.2 1,962.4 3.8 0.2
Deferred outflows of resources 60.1 52.4 7.7 14.7
Other liabilities 35.4 33.0 2.4 7.3 Long‐term liabilities 616.3 627.8 (11.5) (1.8)
Total liabilities 651.7 660.8 (9.1) (1.4)
Deferred inflows of resources 4.2 ‐ 4.2 100.0
Net position: Net investment in capital assets
1,259.2 1,221.4
37.8
3.1
Restricted for debt service 41.1 39.7 1.4 3.5 Unrestricted 70.1 92.9 (22.8) (24.5)
Total net position $ 1,370.4 $ 1,354.0 $ 16.4 1.2
During 2016, Fairfax Water’s net position increased 1.2% to $1,370.4 million. Capital assets, net of accumulated depreciation and amortization, increased 1.2% to $1,722.8 million. This increase is attributable to various projects to expand and improve Fairfax Water infrastructure. In addition, during 2016, developers constructed $1.0 million of capital assets and donated them to Fairfax Water. Additional information is presented in the Capital Assets section of this discussion and Notes 4 and 5 of the basic financial statements. Current and other assets decreased 6.1% due primarily to a $16.9 million decrease in cash and cash equivalents. The decrease in cash and cash equivalents is the result of ongoing construction spending. Deferred outflows of resources increased 14.7% to $60.1 million due primarily to an increase in deferred pension plan expenses. A more detailed description of Fairfax Water’s pension plan can be found in Note 8 to the basic financial statements. Total long‐term liabilities decreased 1.8% to $616.3 million, mainly driven by scheduled debt payments, which was offset by an increase in the net pension liability. Other liabilities increased 7.3% to $35.4 million primarily driven by increases in accounts payable and accrued expenses and unearned revenue for availability fees and other connection charges received. A more detailed description of Fairfax Water’s long‐term liabilities can be found in the Bonds Payable section of this discussion and in Notes 6, 7 and 8 of the basic financial statements. Deferred inflows of resources increased 100% to $4.2 million due to deferred earnings on pension plan investments, resulting from the most recent actuarial valuation. A more detailed description of Fairfax Water’s pension plan can be found in Note 8 to the basic financial statements.

7
Changes in Net Position
The following table reflects Fairfax Water’s changes in net position for the years ended December 31, 2016 and 2015:
Summary of Changes in Net Position
(in millions)
2016 2015 Increase (Decrease)
% Change
Operating revenues $ 153.6 $ 153.2 $ 0.4 0.3 Operating expenses (88.5) (71.7) 16.8 23.4 Depreciation and amortization expense (47.7) (44.2) 3.5 7.9 Nonoperating revenues (expenses), net (3.2) (3.0) 0.2 6.7
Increase in net position before contributions 14.2 34.3 (20.1) (58.6)
Capital contributions 2.2 2.6 (0.4) (15.4)
Increase in net position $ 16.4 $ 36.9 $ (20.5) (55.6)
Fairfax Water’s operating revenues increased 0.3% to $153.6 million. Revenue from wholesale customers decreased $5.4 million as a result of decreased capacity charges, which was offset by a 4.1% increase in wholesale water sales. Additionally, retail water sales revenue increased $6.5 million as a result of a 1.6% increase in water sales and the thirteen cent increase in the commodity charge. Operating expenses increased 23.4% to $88.5 million, due primarily to a $14.8 million increase in postemployment benefits, $9.2 million of which is associated with a non‐cash reduction in 2015, and a $3.3 million increase in pension expenses, which was offset by decreased costs for supply facility services. Depreciation and amortization expense increased 7.9% to $47.7 million.
Capital Assets and Debt Administration
Capital Assets
As of December 31, 2016, Fairfax Water had a net investment of $1,722.8 million in a full range of capital assets used in the provision of water service including water lines, water tanks, treatment plants, pumping stations, multi‐purpose facilities and other facilities. This amount represents a net increase of $19.6 million, or 1.2% over December 31, 2015. The following table reflects a breakdown of capital assets by category at December 31, 2016 and 2015:

8
Capital Assets (net of depreciation and amortization, in millions)
2016 2015
Increase (Decrease)
% Change
Land and rights of way $ 25.0 $ 14.6 $ 10.4 71.2 Easements 1.6 1.3 0.3 23.1 Construction in progress 36.0 70.6 (34.6) (49.0)Water supply 116.5 116.2 0.3 0.3 Water treatment 492.2 499.0 (6.8) (1.4)Transmission 273.4 247.0 26.4 10.7 Distribution 445.5 432.3 13.2 3.1 General plant 332.6 322.2 10.4 3.2
Total capital assets $ 1,722.8 $ 1,703.2 $ 19.6 1.2
The increase in capital assets in fiscal year 2016 is attributable to expenditures related to various projects to expand and improve Fairfax Water infrastructure and developer donated assets.
Bonds Payable
At the end of 2016, net bonds outstanding totaled $483.6 million. This 4.1% decrease from the previous year is attributable to the normal retirement of bonds. The primary source of revenue utilized for repayment of debt is water consumption charges. In addition, Fairfax Water obtains funds from other sources to reduce the amount of bonds it needs to sell to construct water projects. These other sources include payments from applicants for new service and payments from other jurisdictions for projects that specifically benefit them. A more detailed description of Fairfax Water’s bonds payable can be found in Note 7 to the basic financial statements. The following table reflects the composition of bonds payable at December 31, 2016 and 2015:
Bonds Payable (in millions)
2016 2015 Increase (Decrease)
% Change
Series 1997 $ 25.5 $ 25.5 $ ‐ ‐ Series 2005 40.2 40.2 ‐ ‐ Series 2007 164.5 170.3 (5.8) (3.4) Series 2010 88.9 88.9 ‐ ‐ Series 2012 77.1 77.4 (0.3) (0.4) Series 2013 67.9 80.6 (12.7) (15.8)
Subtotal 464.1 482.9 (18.8) (3.9)
Plus: Unamortized bond premiums 19.5 21.2 (1.7) (8.0)
Bonds payable, net 483.6 504.1 (20.5) (4.1)
Current portion 22.4 20.5 1.9 9.3
Long‐term portion $ 461.2 $ 483.6 $ (22.4) (4.6)

9
Bond Ratings
During fiscal year 2016, Moody’s Investors Service, Standard & Poor’s, and Fitch Ratings maintained ratings of Aaa, AAA, and AAA, respectively, to Fairfax Water’s outstanding revenue bonds.
Request for Information
This financial report is designed to provide an overview of Fairfax Water’s finances. Questions concerning any of the information provided in this report or requests for additional financial information should be addressed to: Fairfax Water Attention: Director, Finance Division 8570 Executive Park Avenue Fairfax, Virginia 22031‐2218 www.FairfaxWater.org

FAIRFAX COUNTY WATER AUTHORITY
10
Statement of Net Position December 31, 2016
ASSETS AND DEFERRED OUTFLOWS OF RESOURCES
Current assets: Cash and cash equivalents
Unrestricted $ 23,612,747 Restricted 404,250Investments
Unrestricted 17,649,556 Restricted 30,836,127Accrued interest receivable 687,287Customer receivables, net of allowance for doubtful accounts of $216,000 6,623,552Unbilled revenue 12,471,745Notes receivable 56,956Inventory 4,786,150Other current assets 1,068,961
Total current assets 98,197,331
Noncurrent assets:
Investments Unrestricted 126,213,703 Restricted 14,795,680Notes receivable 1,317,680Prepaid health benefits 2,935,625Capital assets, net of accumulated depreciation and amortization 1,722,767,877
Total noncurrent assets 1,868,030,565
Total assets 1,966,227,896
Deferred outflows of resources: Deferred charge on refunding 20,483,781Pension plan 39,574,635
Total deferred outflows of resources 60,058,416
Total assets and deferred outflows of resources $ 2,026,286,312

FAIRFAX COUNTY WATER AUTHORITY
11
Statement of Net Position (continued) December 31, 2016
LIABILITIES, DEFERRED INLOWS OF RESOURCES AND NET POSITION
Current liabilities: Accounts payable and accrued expenses $ 20,089,194 Compensated absences 2,445,867 Bonds payable, current maturities 22,459,971 Accrued interest on bonds payable 5,154,348 Unearned revenue 9,806,549 Construction contract retainage 428,924
Total current liabilities 60,384,853
Noncurrent liabilities:
Compensated absences 2,123,515 Other postemployment benefits 1,859,807 Refundable construction advances 1,722,960 Bonds payable, net of current portion 461,182,823 Net pension liability 124,479,564
Total noncurrent liabilities 591,368,669
Total liabilities 651,753,522
Deferred inflows of resources:
Pension plan 4,173,333
Total deferred inflows of resources 4,173,333
Total liabilities and deferred inflows of resources 655,926,855
Net position:
Net investment in capital assets 1,259,179,940 Restricted for debt service 41,074,616 Unrestricted 70,104,901
Total net position 1,370,359,457
Total liabilities, deferred inflows of resources and net position $ 2,026,286,312
The accompanying notes are an integral part of these basic financial statements.

FAIRFAX COUNTY WATER AUTHORITY
12
Statement of Revenues, Expenses and Change in Net Position For the year ended December 31, 2016
Operating revenues:
Sales to retail customers $ 109,607,168Sales to wholesale customers 33,279,671Sewer service billing charges 6,510,821Other 4,174,772
Total operating revenues 153,572,432
Operating expenses:
Supply facilities 8,420,782Treatment facilities 23,945,224Transmission system 6,253,162Distribution system 19,737,618Administrative and general 30,095,923
Total operating expenses before depreciation and amortization 88,452,709
Operating income before depreciation and amortization 65,119,723Depreciation and amortization (47,657,856)
Operating income 17,461,867
Nonoperating revenues (expenses):
Availability fees and other connection charges 12,151,992Investment income 2,560,973Bond subsidy 1,057,583Lease revenue 728,290Interest expense (19,734,595)
Total nonoperating expenses, net (3,235,757)
Income before capital contributions 14,226,110Capital contributions 2,155,188
Increase in net position 16,381,298Net position, beginning of year 1,353,978,159
Net position, end of year $ 1,370,359,457
The accompanying notes are an integral part of these basic financial statements.

FAIRFAX COUNTY WATER AUTHORITY
13
Statement of Cash Flows For the year ended December 31, 2016
Cash flows from operating activities: Cash received from customers $ 152,590,349 Cash paid to employees (50,279,400) Cash paid to suppliers (32,973,665)
Net cash provided by operating activities 69,337,284
Cash flows from capital and related financing activities: Principal paid on bonds (18,775,000) Interest paid on bonds (19,441,416) Construction of capital assets (66,819,850)
Availability fees and other connection charges 13,286,620 Lease revenue 770,247 Bond subsidy 1,057,583 Capital contributions received from developers 1,146,533
Net cash used in capital and related financing activities (88,775,283)
Cash flows from investing activities: Gross purchases of investments (148,826,509) Gross sales and maturities of investments 148,448,039 Interest received Collection of note receivable
2,850,47553,817
Net cash provided by investing activities 2,525,822
Net decrease in cash and cash equivalents (16,912,177)Cash and cash equivalents, beginning of year 40,929,174
Cash and cash equivalents, end of year $ 24,016,997

FAIRFAX COUNTY WATER AUTHORITY
14
Statement of Cash Flows (continued) For the year ended December 31, 2016
Reconciliation of operating income to net cash provided by operating activities: Operating income $ 17,461,867
Adjustments to reconcile operating income to net cash provided by operating activities:
Depreciation and amortization expense 47,657,856
Other postemployment benefits (338,757)
Prepaid health benefits 3,497,065
Pension expense 1,195,695 Change in operating assets and liabilities: Customer receivables, net 205,164 Unbilled revenue (1,185,517) Inventory (631,187) Other assets (1,730) Accounts payable and accrued expenses 1,614,421 Compensated absences (137,593)
Total adjustments 51,875,417
Net cash provided by operating activities $ 69,337,284
Supplemental schedule of noncash investing, capital and financing activities:
Capital contributions ‐ Estimated fair value of capital assets received from developers and others $ 1,008,655
Capital assets ‐ Capital assets acquired through incurrence of year‐end accounts payable $ 5,825,873
Investments ‐ Change in the fair value of investments $ (521,050)
The accompanying notes are an integral part of these basic financial statements.

FAIRFAX COUNTY WATER AUTHORITY
15
Statement of Fiduciary Net Position December 31, 2016
Agency Funds Assets Cash $ 2,503,244
Total assets $ 2,503,244
Liabilities Accounts payable $ 2,503,244
Total liabilities $ 2,503,244
The accompanying notes are an integral part of these basic financial statements.

FAIRFAX COUNTY WATER AUTHORITY
Notes to Basic Financial Statements
16
December 31, 2016
1. Fairfax Water
The Fairfax County Water Authority (Fairfax Water) is a public body, corporate and politic, exercising public and essential governmental functions in the Commonwealth of Virginia. Fairfax Water was created by the Board of Supervisors of Fairfax County, Virginia, and chartered by the State Corporation Commission in 1957 for the purpose of establishing and operating a comprehensive county‐wide water system. The management is vested in a Board of ten members appointed by the Fairfax County Board of Supervisors.
2. Summary of Significant Accounting Policies
A. Reporting Entity
The accompanying financial statements present Fairfax Water and its blended component unit, the Fairfax County Water Authority Welfare Benefit Trust (the Trust). The purpose of the Trust is to receive and hold assets to provide medical benefits for Fairfax Water employees and retirees. A blended component unit, although a legally separate entity, is in substance part of the primary government’s operations. The Trust meets the criteria to be reported as a blended component unit because Fairfax Water has the ability to impose its will on the Trust, the members of its governing board are substantially the same as Fairfax Water, it provides services solely to Fairfax Water, Fairfax Water has a financial benefit or burden relationship with the Trust, and management (below the level of elected officials) of Fairfax Water have operational responsibility. The Trust is blended with Fairfax Water by consolidating its financial statement data with Fairfax Water’s financial statements and presenting condensed combining information in Note 14 to the Basic Financial Statements. Separate financial statements are not issued for the Trust.
Fairfax Water is not considered a component unit of Fairfax County, Virginia (the County) and all governmental entities operating within the County are excluded from Fairfax Water’s financial statements. Although the Fairfax County Board of Supervisors appoints the members of Fairfax Water’s Board of Directors, the County is not financially accountable for Fairfax Water. In addition, there is no potential for Fairfax Water to provide specific financial benefit to, or impose specific financial burdens on the County, and Fairfax Water is not fiscally dependent on the County.
Fairfax Water also reports agency funds (fiduciary fund type) in its statements for Fairfax County and the Cities of Falls Church and Fairfax (the Cities). The funds account for the collection and remittance of sewer and utility tax payments on the behalf of the County and the Cities. The funds are custodial in nature (assets equal liabilities) and do not involve measurement of results of operations.
B. Basis of Accounting
Basis of accounting refers to when revenues, expenses, assets, deferred outflows of resources, liabilities and deferred inflows of resources are recognized. The accompanying financial statements have been prepared using the economic resources measurement focus and accrual basis of

Notes to Basic Financial Statements
17
accounting. Under the accrual basis of accounting, revenues are generally recognized when earned and expenses are recognized when incurred.
Fairfax Water has elected to apply all applicable Governmental Accounting Standards Board (GASB) pronouncements as GASB is the accepted standard‐setting body for establishing governmental accounting and financial reporting principles. During the current year, Fairfax Water adopted GASB Statement No. 72, Fair Value Measurement and Application, GASB Statement No. 73, Accounting and Financial Reporting for Pensions and Related Assets That Are Not within the Scope of GASB Statement 68, and Amendments to Certain Provisions of GASB Statements 67 and 68, GASB Statement No. 76, The Hierarchy of Generally Accepted Accounting Principles for State and Local Governments, and GASB Statement No. 79, Certain External Investment Pools and Pool Participants.
C. Use of Estimates
The preparation of financial statements in conformity with accounting principles generally accepted in the United States requires management to make estimates and assumptions that affect the reported amounts of assets, deferred outflows of resources, liabilities, and deferred inflows of resources and the disclosure of contingent assets and liabilities as of the date of the financial statements and the reported amounts of revenues and expenses during the reporting period. Actual results could differ from those estimates.
D. Revenue Recognition
Rates, fees, and other charges for services to wholesale and retail customers are established to provide sufficient funds to cover the cost of operations, debt service, and essential repairs and improvements to capital assets. Metered sales are recognized as revenue as customers use water. At year‐end, the amount of revenue generated for which customers have not been billed is recorded as unbilled revenue. Retail customers pay availability, local facility, and service connection charges for each new service connection and meter installation. These charges are recognized as revenue as service connections are made and meters are installed. Wholesale customers pay a charge to reserve capacity of purification and transmission based on a multi‐year contract. Such revenues are recognized at the time Fairfax Water has an enforceable claim to these charges. Sewer service billing charges represent an administrative fee charged to the County and the Cities of Falls Church and Fairfax (the Cities) to cover the cost of billing and collecting sewer service charges by Fairfax Water on behalf of the County and Cities. The administrative fees are recognized as revenue by Fairfax Water as earned.
Fairfax Water’s receivables are recorded net of an allowance for doubtful accounts, where considered necessary. As of December 31, 2016, the only receivables that management determined required an allowance relates to retail customers accounts receivable. Fairfax Water calculates the allowance as a percentage of retail sales, based on past bad debt experience. No allowance is calculated for wholesale customer accounts receivable, as Fairfax Water has not historically experienced any collectability issues with its wholesale customers.

Notes to Basic Financial Statements
18
E. Operating and Nonoperating Revenues and Expenses
Fairfax Water’s Statement of Revenues, Expenses and Change in Net Position distinguishes operating revenues and expenses from nonoperating items. Operating revenues and expenses generally result from providing services and producing and delivering goods in connection with Fairfax Water’s principal ongoing operations. The principal operating revenues of Fairfax Water are from metered sales to customers and other customer related charges. Operating expenses include the cost of water supply, treatment, transmission and distribution; depreciation and amortization of capital assets; and general and administrative costs. All revenues and expenses not meeting this definition are reported as nonoperating revenues and expenses. Customer availability fees and connection charges are reported as nonoperating revenues as such revenues are primarily used to fund capital improvements and expansion.
F. Nonoperating Lease Revenue
Fairfax Water has entered into water tower lease agreements with various cellular phone providers. The leases allow for the placement of cellular antennas on Fairfax Water’s water towers. The contracts are generally for five years, with five‐year renewal options. The total nonoperating revenue received in 2016 for the water tower leases was $644,377.
On October 31, 2016 Fairfax Water entered into an agreement with Vulcan Lands, Inc. (Vulcan) to transfer ownership of a portion of Vulcan’s Graham Quarry, located between Fairfax Water’s Occoquan River supply and the Frederick P. Griffith, Jr. Water Treatment Plant. Vulcan will quarry the land pursuant to a lease agreement until 2035, at which time such land will become available for Fairfax Water’s use as a water supply reservoir with storage capacity of 1.7 billion gallons of water. Subsequent to such land becoming available for Fairfax Water’s use as a water supply reservoir, Vulcan will continue to quarry adjacent property. Ownership of such adjacent property will transfer to Fairfax Water at no additional cost no later than 2085. When completed, such quarry reservoirs are expected to store up to 17 billion gallons of water. The total nonoperating revenue received in 2016 for the lease agreement was $83,913.
G. Cash Equivalents
Cash equivalents consist of short‐term, highly liquid investments with original maturities of three months or less. At December 31, 2016, such investments were primarily comprised of money market funds. Restricted cash equivalents represent funds held by the Trustee for debt service in accordance with applicable bond covenants.
H. Notes Receivable
Fairfax Water entered into an agreement with the Fairfax County Board of Supervisors in July, 2001 to extend Fairfax Water’s transmission and distribution system to serve Lewis Park, Colchester Acres and Vannoy Park Subdivision. Under the agreement, Fairfax County agreed to pay Fairfax Water in semi‐annual payments on October 1 and March 1 of each year commencing October 1, 2002 and ending March 1, 2032. The total project cost and amount financed was $1,896,874. The note receivable at December 31, 2016, totaled $1,374,636.

Notes to Basic Financial Statements
19
I. Investments Investments are stated at fair value, with any related gain or loss reported in investment income on the accompanying Statement of Revenues, Expenses and Change in Net Position. Investment fair values are based on quoted market prices, except for bankers’ acceptances and commercial paper, which are based on accreted value. Investments in mutual funds, which are Securities and Exchange Commission 2a‐7 investment pools, are stated at share price which is substantially the same as fair value. Restricted investments represent investments held by the Trustee for debt service.
J. Inventory Inventories of materials and supplies are accounted for using the consumption method and are carried at average costs. Under this method, inventories are expensed as they are consumed.
K. Capital Assets Capital assets are carried at cost, which, for assets constructed by Fairfax Water, includes associated payroll, fringe benefits, administrative costs, and interest charges capitalized on all projects. Fairfax Water capitalizes all assets that individually cost $2,500 or more, with useful lives greater than one year. Expenses for repairs and upgrading which materially add to the value or life of an asset are capitalized. Contributed assets consist principally of water mains constructed by developers and subsequently donated to Fairfax Water. Such assets are recorded at acquisition cost on the date of the donation. The acquisition cost is based on Fairfax Water’s estimated cost to construct or purchase similar assets. Recurring normal maintenance and repair costs are charged to operations, whereas major repairs, improvements, and replacements are capitalized. In 2016, the capital assets were depreciated or amortized on the straight‐line basis over the following estimated useful lives:
Capital Assets Useful Lives
Pipes 75 – 100 years Treatment Plants 40 – 60 years Buildings 30 – 40 years Equipment/Software 10 – 25 years Vehicles 5 – 10 years
L. Construction in Progress
Construction in progress includes design and construction costs that accumulate until completion of the respective project, at which time the total cost is transferred to depreciable capital assets. When applicable, interest and other carrying costs are capitalized to construction in progress.
M. Deferred Outflows/Inflows of Resources In addition to assets, the Statement of Net Position will sometimes report a separate section for deferred outflows of resources. This separate financial statement element, deferred outflows of

Notes to Basic Financial Statements
20
resources, represents a consumption of net position that applies to future periods and so will not be recognized as an outflow of resources (expense/expenditure) until then. Fairfax Water has four types of items that qualify for reporting in this category related to the pension plan. The first two items are the differences between expected and actual demographic experience and changes of assumptions. These deferred amounts will be recognized over the average expected remaining service life of all active and inactive members of the Plan. As of the measurement date, this period was 5.72 years. The third item is the net difference between projected and actual earnings on pension plan investments and will be amortized over five years. The fourth item relates to contributions made subsequent to the measurement date of the pension plan. This deferred amount will be applied to the net pension liability in the next fiscal year. Fairfax Water also recognizes a deferred outflow for the deferred charge on refunding which results from the difference in the carrying value of refunded debt and its reacquisition price. This amount is deferred and amortized over the shorter of the life of the refunded or refunding debt. In addition to liabilities, the Statement of Net Position will sometimes report a separate section for deferred inflows of resources. This separate financial statement element, deferred inflows of resources, represents an acquisition of net position that applies to future periods and so will not be recognized as an inflow of resources (revenue) until that time. Fairfax Water has one item that qualifies for reporting in this category and relates to differences between expected and actual demographic experience of the pension plan. These differences will be recognized over the average expected remaining service life of all active and inactive members of the Plan. As of the measurement date, this period was 5.72 years.
N. Pensions For purposes of measuring the net pension liability, deferred outflows of resources and deferred inflows of resources related to pensions, and pension expense, information about the fiduciary net position of the Fairfax County Water Authority Retirement Plan (the Plan) and additions to/deductions from the Plan’s fiduciary net position have been determined on the same basis as they are reported by the Plan, which are prepared using the accrual basis of accounting. For this purpose, benefit payments (including refunds of employee contributions) are recognized when due and payable in accordance with the benefit terms. Investments are reported at fair value.
O. Unamortized Debt Discounts (Premiums) Debt discounts (premiums) are amortized over the life of the related bond issuance using the effective interest rate method. The current year amortization is included in interest expense. The debt discount (premium) is netted against the related debt on the accompanying Statement of Net Position. Fairfax Water periodically issues water refunding revenue bonds to advance refund previously issued bonds.
P. Compensated Absences Employees earn vacation and sick pay based on a prescribed formula that allows employees to accumulate a maximum of 40 days in vacation pay and an unlimited amount of sick pay. Fairfax Water’s liability for vacation and vested sick pay earned but not used by its employees is computed

Notes to Basic Financial Statements
21
using pay rates in effect at year‐end. The liability for sick pay vests for employees after three years of service.
Q. Net Position
Net position of Fairfax Water is classified in three components: (1) Net investment in capital assets consists of capital assets net of accumulated depreciation, reduced by the balances of any outstanding borrowings used to finance the purchase or construction of those assets and retainage payable. (2) Restricted for debt service is amounts deposited with the Trustee as required by the 1992 General Trust Indenture discussed in Note 7 and the portion of debt attributable to the amount of unspent bond proceeds less any interest accrued at year end. (3) Unrestricted is remaining net resources that do not meet the definition of investment in capital assets nor restricted.
It is Fairfax Water’s policy to first apply restricted resources when an expense is incurred for purposes for which both restricted and unrestricted resources are available.
R. Refundable Construction Advances
Refundable construction advances represent assets and cash in aid of construction received by Fairfax Water from developers under Fairfax Water’s offsite water main program. These advances are refundable over a ten‐year period based on the number of applicable connections made to the offsite water mains. At the end of ten years, the portion not refunded is considered a capital contribution and is reflected in the table in Note 6 as “refundable construction advances”.
S. New Accounting Pronouncements
GASB Statement No. 74, Financial Reporting for Postemployment Benefit Plans Other Than Pension Plans, requires enhanced note disclosures and schedules of required supplementary information for other postemployment benefits (OPEB) plans administered through trusts that meet specific requirements. This Statement provides information about OPEB liabilities and explains how and why those liabilities changed from year to year. Statement 74 will be effective for Fairfax Water beginning with its year ending December 31, 2017. GASB Statement No. 75, Accounting and Financial Reporting for Postemployment Benefits Other Than Pensions, requires the recognition of the entire OPEB liability and a more comprehensive measure of OPEB expense for state and local governments. Statement 75 will be effective for Fairfax Water beginning with its year ending December 31, 2018. GASB Statement No. 80, Blending Requirements for Certain Component Units‐ an amendment of GASB Statement No. 14, establishes an additional blending requirement for the financial statement presentation of component units. This Statement applies to all state and local governments. Statement 80 will be effective for Fairfax Water beginning with its year ending December 31, 2017. GASB Statement No. 81, Irrevocable Split‐Interest Agreements, provides recognition and measurement guidance for situations in which a government is a beneficiary of an irrevocable split‐interest agreement. Statement 81 will be effective for Fairfax Water beginning with its year ending December 31, 2017.

Notes to Basic Financial Statements
22
GASB Statement No. 82, Pension Issues‐ an amendment of GASB Statements No. 67, No. 68, and No. 73, addresses certain issues that have been raised with respect to Statements No. 67, Financial Reporting for Pension Plans, No. 68, Accounting and Financial Reporting for Pensions, and No. 73, Accounting and Financial Reporting for Pensions and Related Assets That Are Not within the Scope of GASB Statement 68, and Amendments to Certain Provisions of GASB Statements 67 and 68. Specifically, this Statement addresses issues regarding (1) the presentation of payroll‐related measures in required supplementary information, (2) the selection of assumptions and the treatment of deviations from the guidance in an Actuarial Standard of Practice for financial reporting purposes, and (3) the classification of payments made by employers to satisfy employee (plan member) contribution requirements. Statement 82 will be effective for Fairfax Water beginning with its year ending December 31, 2017. GASB Statement No. 83, Certain Asset Retirement Obligations, establishes uniform criteria for governments to recognize and measure certain asset retirement obligations (AROs). Statement 83 will be effective for Fairfax Water beginning with its year ending December 31, 2019. GASB Statement No. 84, Fiduciary Activities, establishes specific criteria for identifying fiduciary activities for accounting and financial reporting purposes and how those activities should be reported. Statement 84 will be effective for Fairfax Water beginning with its year ending December 31, 2019. GASB Statement No. 85, Omnibus 2017, addresses a variety of topics including issues related to blending component units, goodwill, fair value measurement and application, and postemployment benefits (pensions and other postemployment benefits (OPEB)). Statement 85 will be effective for Fairfax Water beginning with its year ending December 31, 2018. Fairfax Water has not yet determined the effect these GASB Statements will have on its financial statements.
3. Cash and Investments
A. Cash and Cash Equivalents ‐ Cash in bank accounts is insured by the Federal Deposit Insurance Corporation and/or collateralized in accordance with the Virginia Security for Public Deposits Act, Section 2.2‐4400 et. Seq. of the Code of Virginia. Under the Act, banks holding public deposits in excess of the amounts insured by the Federal Deposit Insurance Corporation (FDIC) must pledge collateral to the State Treasury Board. Savings and loan institutions are required to collateralize 100% of deposits in excess of FDIC limits. Financial institutions may choose between two collateralization methodologies and depending upon that choice, will pledge collateral that ranges from 50% to 130% of excess deposits. Accordingly, all deposits are considered fully collateralized.
As of December 31, 2016, the carrying value of Fairfax Water’s deposits with banks was $19,544,511, with a bank balance of $22,076,731. In addition, Fairfax Water held a deposit of $2,305,034 with the U.S. Army Corps of Engineers and $2,167,452 of cash equivalents in the PFM Funds and First American Treasury Obligation Fund, which are money market funds, as of December 31, 2016.
B. Investments ‐ Virginia state statutes authorize Fairfax Water to invest in obligations of the United States or agencies thereof; obligations of the Commonwealth of Virginia or political subdivisions

Notes to Basic Financial Statements
23
thereof; qualifying obligations of other states and their political subdivisions; repurchase agreements; commercial paper, rated A‐1 or better by at least two of the rating agencies; bankers’ acceptances rated A‐1 by Standard & Poor’s and P‐1 by Moody’s Investors Service; corporate notes with a maturity no greater than five years and a minimum long‐term debt rating of Aa by Moody’s Investors Service and AA by Standard & Poor’s; negotiable certificates of deposit or bank notes; Virginia Local Government Investment pool; registered money market mutual funds; savings accounts; time deposits; and certificates of deposit.
Interest Rate Risk – Fairfax Water’s policy is to minimize the risk that the market value of securities in its portfolio will fall due to changes in market interest rates. To achieve this minimization of risk, Fairfax Water structures the investment portfolio so that sufficient securities mature to meet cash requirements for ongoing operations, thereby avoiding the need to sell securities on the open market prior to maturity. Further, Fairfax Water may not directly invest in securities maturing in more than five years from the date of purchase. The following table reflects the fair value and the weighted average maturity (WAM) of Fairfax Water’s investments as of December 31, 2016. WAM expresses investment time horizons, the time when investments become due and payable, in years, weighted to reflect the dollar size of the individual investments within an investment type. The portfolio’s WAM is derived by dollar‐weighting the WAM for each investment type. For purposes of the WAM calculation, Fairfax Water assumes that all of its investments will be held to maturity.
Investment Type Fair Value Weighted Average Maturity (Years)
U. S. Government Treasury Notes and Bonds $ 87,967,926 2.206
U. S. Government Agency Notes 66,274,217 3.425
Certificates of Deposit 15,587,728 1.041
Corporate Notes 19,665,195 1.648
Total Portfolio $ 189,495,066 2.478
Credit Risk – Fairfax Water’s policy is to minimize the risk of loss due to the failure of an issuer or other counterparty to an investment to fulfill its obligations. Fairfax Water and its investment advisor pre‐qualify financial institutions and broker‐dealers with which they do business. In addition, Fairfax Water limits its investments to the safest types of securities and diversifies its investment portfolio so that potential losses on individual securities will be minimized. The table below reflects the allocation of credit quality rating of Fairfax Water’s investments by Standard & Poor’s Rating Services as of December 31, 2016.
Investment Type
Credit Quality Rating
AAA AA+ AA AA‐ A‐1+
U.S. Government Treasury Notes and Bonds ‐ 46.4% ‐ ‐ ‐U.S. Government Agency Notes ‐ 35.0% ‐ ‐ ‐Certificates of Deposit ‐ ‐ ‐ 4.9% 3.3%Corporate Notes 1.1% 2.4% 0.9% 6.0% ‐
Total Portfolio 1.1% 83.8% 0.9% 10.9% 3.3%

Notes to Basic Financial Statements
24
Concentration of Credit Risk – To minimize credit risk, Fairfax Water’s investment policy seeks to diversify its portfolio by limiting the percentage of the portfolio that may be invested in any one type of instrument as follows:
Instrument Type Maximum
U.S. Government Obligations 100% Repurchase Agreements 50% Commercial Paper 35% Bankers’ Acceptances 40% Corporate Notes 20% Municipal Obligations 20% Negotiable Certificates of Deposit/Bank Notes 20% State of Virginia Local Government Investment Pool 50% Registered Money Market Mutual Funds 50% Savings Accounts, Time Deposits, Certificates of Deposit 20%
In addition, not more than five percent of total funds available for investment (based on book value on the date of acquisition) can be invested in any single issuing corporation or bank for corporate notes, commercial paper, or bankers’ acceptances. As of December 31, 2016, there are no concentrations of credit risk beyond the stated policy. Custodial Credit Risk – Custodial risk is the risk that in the event of the failure of the counterparty, Fairfax Water will not be able to recover the value of its investments or collateral securities that are in the possession of an outside party. However, Fairfax Water’s investment policy requires that all securities purchased by Fairfax Water be properly and clearly labeled as an asset of Fairfax Water and held in safekeeping by a third party custodial bank or institution in compliance with Section 2.2‐4515 of the Code of Virginia. Therefore, Fairfax Water has no custodial risk.
All investments are held by agents of Fairfax Water in Fairfax Water's name and consist of U.S. Treasury and U.S. agency securities, certificates of deposit, corporate notes, municipal bonds and Resolution Funding Corporation stripped securities (REFCO Strips). Accrued interest at December 31, 2016 of $14,661,071 on the REFCO Strips is classified with the REFCO Strips in unrestricted investments. Maturity dates of the investments determine the Statement of Net Position classification. Fairfax Water categorizes its fair value measurements within the fair value hierarchy established by generally accepted accounting principles. The hierarchy is based on the valuation inputs used to measure the fair value of the asset. Level 1 inputs are quoted prices in active markets for identical assets; Level 2 inputs are quoted prices for similar assets or liabilities, quoted prices in markets that are not active, or other inputs that are observable or can be corroborated by observable data for substantially the full term of the assets and liabilities (REFCO Strips); and Level 3 inputs are significant unobservable inputs.

Notes to Basic Financial Statements
25
The table below details the fair value measurements as of December 31, 2016:
Investment Type Level 1 Inputs Level 2 Inputs
U. S. Government Treasury Notes and Bonds $ 87,967,926 $ ‐
U. S. Government Agency Notes 43,432,315 22,841,902
Certificates of Deposit 15,587,728 ‐
Corporate Notes 19,665,195 ‐
Total Portfolio $ 166,653,164 $ 22,841,902
4. Capital Assets
The changes in Fairfax Water’s capital assets for the year ended December 31, 2016 follow (in thousands):
The amount shown in the Statement of Revenues, Expenses, and Change in Net Position for interest expense is net of $1,437,249 capitalized in 2016.
Beginning Balance Increases
Decreases/Transfers
Ending Balance
Capital assets not being depreciated or amortized:
Land and rights of way $ 14,561 $ 10,433 $ ‐ $ 24,994
Easements 1,285 ‐ 282 1,567
Construction in progress 70,620 15,885 (50,515) 35,990
Total capital assets not being depreciated or amortized 86,466 26,318 (50,233) 62,551
Capital assets being depreciated or amortized:
Water supply 156,664 1,663 1,919 160,246
Water treatment 703,323 1,995 5,276 710,594
Transmission 342,331 818 25,345 368,494
Distribution 572,547 9,124 3,197 584,868
General plant 453,811 27,270 12,229 493,310
Total capital assets being depreciated or amortized 2,228,676 40,870 47,966 2,317,512
Less accumulated depreciation or amortization for:
Water supply 40,414 3,448 ‐ 43,862
Water treatment 204,358 13,992 ‐ 218,350
Transmission 95,289 5,291 (5,533) 95,047
Distribution 140,217 7,948 (8,812) 139,353
General plant 131,626 16,979 12,078 160,683
Total accumulated depreciation or amortization 611,904 47,658 (2,267) 657,295
Capital assets being depreciated or amortized, net 1,616,772 (6,788) 50,233 1,660,217
Total capital assets, net $ 1,703,238 $ 19,530 $ ‐ $ 1,722,768

Notes to Basic Financial Statements
26
5. Capital Contributions
Capital contributions for the year ended December 31, 2016, are as follows:
Donated capital assets $ 1,008,655Contributions from developers 464,373Expired construction advances 682,160
Total $ 2,155,188
Contributed assets consist principally of water mains constructed by developers and subsequently donated to Fairfax Water as well as mains constructed by Fairfax Water and paid for by the developers.
6. Other Long‐Term Liabilities
Other long‐term liabilities activity for the year ended December 31, 2016 was as follows (in thousands):
Beginning Balance Increases Decreases
Ending Balance
Current Portion
Compensated absences $ 4,707 $ 4,569 $ (4,707) $ 4,569 $ 2,446Refundable construction advances 2,175 232 (684) 1,723 ‐ Total other long‐term liabilities $ 6,882 $ 4,801 $ (5,391) $ 6,292 $ 2,446
7. Bonds Payable
Bonds payable activity for the year ended December 31, 2016 was as follows (in thousands):
Beginning Balance Increases Decreases
Ending Balance
Current Maturities
Bonds payable: Series 1997 Bonds $ 25,470 $ ‐ $ ‐ $ 25,470 $ 4,610 Series 2005 Bonds 40,185 ‐ ‐ 40,185 ‐ Series 2007 Bonds 170,330 ‐ (5,755) 164,575 8,825 Series 2010 Bonds 88,860 ‐ ‐ 88,860 ‐ Series 2012 Bonds 77,440 ‐ (340) 77,100 350 Series 2013 Bonds 80,605 ‐ (12,680) 67,925 7,015 482,890 ‐ (18,775) 464,115 20,800
Plus unamortized premiums (net) 21,247 ‐ (1,719) 19,528 1,660 Total bonds payable, net $ 504,137 $ ‐ $ (20,494) $ 483,643 $ 22,460
On August 19, 1997, Fairfax Water issued water refunding revenue bonds dated July 15, 1997 in the aggregate principal amount of $102,210,000 (the Series 1997 Bonds), pursuant to the 1992 General Trust Indenture. The outstanding Series 1997 Bonds bear interest rates at 5.00 percent per annum. On March 30, 2005, Fairfax Water issued water refunding revenue bonds dated March 30, 2005 in the aggregate principal amount of $113,440,000 (the Series 2005 Bonds). Interest on the Series 2005

Notes to Basic Financial Statements
27
Bonds is payable semiannually on each April 1 and October 1. The outstanding Series 2005 Bonds bear interest rates at 5.25 percent per annum. No amount of the refunded bonds is outstanding at December 31, 2016. On February 28, 2007, Fairfax Water issued water revenue and refunding revenue bonds dated February 28, 2007 in the aggregate principal amount of $204,045,000 (the Series 2007 Bonds). Interest on the Series 2007 Bonds is payable semiannually on each April 1 and October 1. The outstanding Series 2007 Bonds bear interest at rates ranging from 3.00 to 5.00 percent per annum. The Series 2007 Bonds with stated maturities on or before April 2017 are not subject to call and redemption prior to maturity. No amount of the refunded bonds is outstanding at December 31, 2016. On November 10, 2010, Fairfax Water issued water revenue and refunding revenue bonds dated November 10, 2010 in the aggregate principal amount of $88,860,000 (the Series 2010 Bonds). Interest on the Series 2010 Bonds is payable semiannually on each April 1 and October 1. The outstanding Series 2010 Bonds bear interest at rates ranging from 3.00 to 5.00 percent per annum. The Series 2010 Bonds with stated maturities on or before April 2022 are not subject to call and redemption prior to maturity. No amount of the refunded bonds is outstanding at December 31, 2016. On January 24, 2012, Fairfax Water issued water refunding revenue bonds dated January 24, 2012 in the aggregate principal amount of $81,225,000 (the Series 2012 Bonds). Interest on the Series 2012 Bonds is payable semiannually on each April 1 and October 1. The outstanding Series 2012 Bonds bear interest at rates ranging from 3.00 to 5.00 percent per annum. The Series 2012 Bonds with stated maturities on or before April 2022 are not subject to call and redemption prior to maturity. No amount of the refunded bonds is outstanding at December 31, 2016.
On February 25, 2013, Fairfax Water issued water refunding revenue bonds dated February 25, 2013 in the aggregate principal amount of $93,870,000 (the Series 2013 Bonds). Interest on the Series 2013 Bonds is payable semiannually on each April 1 and October 1. The outstanding Series 2013 Bonds bear interest at rates ranging from 1.015 to 5.00 percent per annum. The Series 2013 Bonds with stated maturities on or before April 2023 are not subject to call and redemption prior to maturity. Refunded bonds resulting from the issuance of the 2013 Series include amounts outstanding totaling $16,075,000 at December 31, 2016.
At December 31, Fairfax Water is required to have an account balance with the Trustee sufficient to pay principal and interest due on the outstanding bonds issued under the 1992 General Trust Indenture on the following April 1. At December 31, 2016, this amount consisted of cash equivalents of $141,558 and investments in U.S. Government securities of $31,040,024 with a market value of approximately $30,836,127 meeting the requirements of the 1992 General Trust Indenture. In addition, Fairfax Water is required to maintain with the Trustee an amount equal to the maximum amount of interest accruing on all outstanding bonds in the current or any future bond year. At December 31, 2016, this amount consisted of cash equivalents of $262,692 and investments in U.S. Government securities of $14,877,710 with a market value of approximately $14,795,680.
Under the terms of the 1992 General Trust Indenture, before the commencement of each fiscal year, Fairfax Water is required to fix, establish, or maintain or cause to be fixed, established, and maintained such rates, fees, and charges for the provision of water service, and revise or cause to be revised the same prior to the commencement of each fiscal year, as necessary, as will produce net revenues, in the opinion of the Consulting Engineer, at least equal in such fiscal year to the total of 110 percent of

Notes to Basic Financial Statements
28
the principal and interest requirements during that fiscal year. For 2016, Fairfax Water was in compliance with the terms of the 1992 General Trust Indenture.
Future debt payments under all debt agreements as of December 31, 2016 are as follows:
Year Principal Interest Total
2017 $ 20,800,000 $ 20,617,394 $ 41,417,394 2018 21,265,000 19,863,941 41,128,941 2019 22,155,000 18,968,272 41,123,272 2020 23,110,000 18,019,460 41,129,460 2021 24,125,000 17,014,387 41,139,387 2022 – 2026 133,050,000 68,269,901 201,319,901 2027 – 2031 118,955,000 36,583,065 155,538,065 2032 – 2036 53,220,000 19,293,350 72,513,350 2037 – 2040 47,435,000 6,006,800 53,441,800
Total $ 464,115,000 $ 224,636,570 $ 688,751,570
The 1986 Federal Tax Reform Act requires local jurisdictions to report any rebate arbitrage earnings on debt issues to the Federal Government every five years. As of December 31, 2016, Fairfax Water had no arbitrage obligation.
8. Pension Plan
A. Plan Description and Provisions
Fairfax Water sponsors the Fairfax County Water Authority Retirement Plan (the Plan), a single‐employer public employee defined benefit pension plan. The Plan provides retirement benefits for all regular full‐time employees as well as Board members of Fairfax Water who elected to participate prior to July 1, 2002. The Plan document assigns all the responsibilities of maintaining the Plan to the Fairfax Water Board of Directors, including the approval of Plan changes, setting benefit and contribution levels under the Plan, and ensuring the Plan is funded sufficiently to meet its benefit obligations. Fairfax Water has established a Benefits Trust Committee to be responsible for the administration of the Plan. On an ongoing basis, Fairfax Water reviews its established Retirement Plan and makes adjustments accordingly. The Plan administers six different benefit structures for members, five of which are closed to new entrants (Plan A, Plan B, Plan C, Modified Plan D, and Plan E). Newly hired employees currently earn benefits under Plan D. All regular full‐time employees of Fairfax Water are eligible to participate in the Plan immediately upon commencement of employment. The specific provisions and eligibility for each benefit structure are set out below: Plan A The retirement benefit is based on a member’s age, creditable service and average final compensation at retirement using a formula.

Notes to Basic Financial Statements
29
Eligible Members – Employees are in Plan A, if chosen at time of employment, if their membership date is before July 1, 1988. Plan B Opt‐In Option – Effective June 1, 1988 (for a 30‐day period), Plan A members were given the option to join Plan B. Each Plan A member who elected to join Plan B was required to pay into the Plan. The payment requirement equaled the member’s difference between the Plan A and Plan B contributions for the period January 1, 1982 through June 30, 1988, including interest at 10%. Such contributions and interest were credited to the member’s contribution amount. The election was irrevocable. Retirement Contributions – Employees contribute 4.0% of annual creditable compensation up to the Social Security taxable wage base, plus 5.0% of annual creditable compensation in excess of the Social Security taxable wage base to their member contribution account on a bi‐weekly basis. Member contributions are tax‐deferred until they are withdrawn as part of a retirement benefit or as a refund. Fairfax Water makes a separate actuarially determined contribution to the Plan for all covered employees. The Plan invests both member and employer contributions to provide funding for the future benefit payment. Creditable Service – The sum of a participant’s membership service credit, accrued annual leave credit, accrued sick leave service credit, and any additional purchased service. A year of creditable service shall consist of 365 calendar days. Periods less than 365 days shall be prorated to the nearest tenth of a year. A member’s total creditable service is one of the factors used to determine eligibility for retirement and to calculate the retirement benefit. Vesting – Vesting is the minimum length of service a member needs to qualify for a future retirement benefit. Members become vested when they have at least five years of membership service. Vesting means members are eligible to qualify for retirement if they meet the age and service requirements for their plan. Members are always 100% vested in the contributions they make. Calculating the Benefit – The basic benefit is calculated based on a formula using the member’s average final compensation, a retirement multiplier and total creditable service at retirement. An early retirement reduction factor of 0.5% is applied to the basic benefit, and supplemental benefit if applicable, for each month that retirement precedes what would have been the normal retirement date. Average Final Compensation – A member’s average final compensation is the average of the three consecutive years of creditable service which will produce the highest average annual compensation. Service Retirement Multiplier – The retirement multiplier is a factor used in the formula to determine a final retirement benefit. The retirement multiplier is 1.9% of average final compensation up to the Social Security Breakpoint, plus 2.1% of the excess. Supplemental Benefit – In addition to the basic benefit, members who retire prior to the earliest date of eligibility for Social Security benefits shall receive a supplemental benefit of 1.0% of average final compensation up to the Social Security Breakpoint multiplied by years of creditable service.

Notes to Basic Financial Statements
30
Payments cease upon first eligibility for Social Security benefits, whether or not application for Social Security benefits has been made or awarded. Normal Retirement Age – First of the month following attainment of a combination of age and creditable service equal to 80 years, provided the member is not less than 50 years old and has completed at least five years of creditable service, or at age 65 with five years of creditable service, if earlier. Earliest Unreduced Retirement Eligibility – At age 65 with five years of creditable service or at age 50 with at least 30 years of creditable service. Earliest Reduced Retirement Eligibility – First of the month following attainment of a combination of age and creditable service equal to 75 years, with at least five years of creditable service. Cost‐of‐Living Adjustment (COLA) in Retirement – Retirement benefits are increased on May 1 of each year by the change in the Consumer Price Index (CPI) for Washington D.C., Maryland, and Virginia for the preceding twelve months ended December 1. If the period of retirement is less than one year, the increase is 25% of the CPI for each completed quarter. If the increase in the CPI is greater than 4%, the Plan actuary determines the increase that is supportable. Disability Coverage – Participants who become disabled while employed and enter Fairfax Water’s long‐term disability program, continue to accrue service under the Plan as if they were still working. Upon reaching the normal retirement date, disabled participants begin receiving benefits from the Plan. The basic benefit is calculated using average final compensation at the time of disability. Plan B Plan B is the same as Plan A except for the following: Eligible Members – Employees are in Plan B if their membership date is between July 1, 1988 and December 31, 1996, or if they chose Plan B at time of employment between January 1, 1982 and June 30, 1988, or were Plan A members who chose the Plan B Opt‐In Option between June 1, 1988 and June 30, 1988. Retirement Contributions – Employees contribute 5.0% of their annual creditable compensation to their member contribution account on a bi‐weekly basis. Service Retirement Multiplier – The retirement multiplier is 2.1% of average final compensation. Plan C Plan C is the same as Plan A except for the following: Eligible Members – Employees are in Plan C if their membership date is between January 1, 1997 and December 31, 2006.

Notes to Basic Financial Statements
31
Retirement Contributions – Employees contribute 5.0% of their annual creditable compensation to their member contribution account on a bi‐weekly basis. Average Final Compensation – A member’s average final compensation is the average of the five consecutive years of creditable service which will produce the highest average annual compensation. Service Retirement Multiplier – The retirement multiplier is 2.1% of average final compensation to a maximum of twenty five years of creditable service, plus 1.0% of average final compensation for years of creditable service in excess of twenty five up to a maximum of ten years. Normal Retirement Age – First of the month following attainment of a combination of age and creditable service equal to 80 years, provided the member is not less than 55 years old and has completed at least five years of creditable service, or at age 65 with five years of creditable service, if earlier. Earliest Unreduced Retirement Eligibility – At age 65 with five years of creditable service or at age 55 with at least 25 years of creditable service. Plan D Plan D is the same as Plan A except for the following: Eligible Members – Employees are in Plan D if their membership date is on or after January 1, 2007. Retirement Contributions – There is no employee contribution for Plan D. Creditable Service – The sum of a participant’s membership service credit, accrued sick leave service credit, and any additional purchased service. Average Final Compensation – A member’s average final compensation is the average of the five consecutive years of creditable service which will produce the highest average annual compensation. Service Retirement Multiplier – The retirement multiplier is 1.7% of average final compensation to a maximum of twenty five years of creditable service, plus 1.0% of average final compensation for years of creditable service in excess of twenty five up to a maximum of ten years. Supplemental Benefit – There is no supplemental benefit in Plan D. Normal Retirement Age – First of the month following attainment of a combination of age and creditable service equal to 80 years, provided the member is not less than 60 years old and has completed at least five years of creditable service, or at age 65 with five years of creditable service, if earlier. Earliest Unreduced Retirement Eligibility – At age 65 with five years of creditable service or at age 60 with at least 20 years of creditable service.

Notes to Basic Financial Statements
32
Modified Plan D Modified Plan D is the same as Plan D except for the following: Eligible Members – Modified Plan D only applies to vested employees that transferred to Fairfax Water as part of the Asset Purchase Agreement between Fairfax Water and the City of Fairfax dated January 3, 2014 (the transfer date). Effective as of the transfer date, all benefit liabilities for the employees to whom the Asset Purchase Agreement applied and corresponding assets under the City of Fairfax Retirement Plan (the Fairfax City Plan) were transferred to the Plan. Modified Plan D is a closed plan. Creditable Service – The sum of a participant’s membership service credit, accrued sick leave service credit, and any additional purchased service. For purposes of the Modified Plan D retirement benefit, creditable service shall include the member’s prior credited service with the Fairfax City Plan as of the transfer date. Vesting – Members become vested when they have at least five years of creditable service. For purposes of the Modified Plan D, the member’s prior credited service with the Fairfax City Plan shall be counted for purposes of vesting as of the transfer date. Calculating the Benefit – Modified Plan D members are entitled to a basic benefit that is equal to the greater of:
1) 1.7% of the member’s average final compensation multiplied by years of creditable service to a maximum of 25 years, plus 1.0% of average final compensation multiplied by years of creditable service in excess of twenty five years up to a maximum of ten years; or
2) The basic benefit to which the member was entitled under the Fairfax City Plan in effect as of the transfer date.
An early retirement reduction factor of 0.5% is applied to the basic benefit for each month that retirement precedes what would have been the normal retirement date. Average Final Compensation – A member’s average final compensation is the average of the five consecutive years of creditable service which will produce the highest average annual compensation. For purposes of the Modified Plan D retirement benefit, average final compensation shall include the member’s prior annual compensation with the Fairfax City Plan as of the transfer date. Plan E Eligible Members – Plan E only applies to employees that transferred to Fairfax Water as part of the Asset Purchase Agreement between Fairfax Water and the City of Falls Church dated January 3, 2014 (the transfer date). Effective as of the transfer date, all benefit liabilities for the employees to whom the Asset Purchase Agreement applied and corresponding assets under the City of Falls Church Basic Pension Plan (the Falls Church City Plan) were transferred to the Plan. Plan E is a closed plan.

Notes to Basic Financial Statements
33
Retirement Contributions – Employees contribute 5.0% of their annual creditable compensation to their member contribution account on a bi‐weekly basis. Creditable Service – The sum of a participant’s membership service credit and accrued sick leave service credit. For purposes of the Plan E retirement benefit, creditable service shall include the member’s prior credited service with the Falls Church City Plan as of the transfer date. Vesting – Members become vested when they have at least five years of creditable service. For purposes of Plan E, the member’s prior credited service with the Fairfax City Plan shall be counted for purposes of vesting as of the transfer date. Calculating the Benefit – The basic benefit for Plan E members is based on their membership date. If hired before January 1, 2012, 2.0% of the member’s average creditable compensation multiplied by years of creditable service. An early retirement reduction factor of 0.33% is applied to the basic retirement benefit for each month that retirement precedes what would have been the normal retirement date. If hired on or after January 1, 2012, 1.8% of the member’s average creditable compensation multiplied by years of creditable service. An early retirement reduction factor of 0.63% is applied to the basic retirement benefit for each month that retirement precedes what would have been the normal retirement date. Average Final Compensation – If hired before January 1, 2012, the member’s average final compensation is the average of the 36 consecutive months of creditable service which will produce the highest average annual compensation. If hired on or after January 1, 2012, the member’s average final compensation is the average of the 60 consecutive months of creditable service which will produce the highest average annual compensation. Service Retirement Multiplier – If hired before January 1, 2012, the retirement multiplier is 2.0%. If hired on or after January 1, 2012, the retirement multiplier is 1.8%. Supplemental Benefit – In addition to the basic retirement allowance, members who retire prior to their normal retirement date shall receive a supplemental benefit of $200 per month. Payments cease at age 62. Normal Retirement Age – If hired before January 1, 2012, the normal retirement age is 62. If hired on or after January 1, 2012, the normal retirement age is the member’s Social Security Normal Retirement Age. Earliest Unreduced Retirement Eligibility – If hired before January 1, 2012, at age 62 with five years of creditable service. If hired on or after January 1, 2012, at the member’s Social Security Normal Retirement Age with five years of creditable service. Earliest Reduced Retirement Eligibility – If hired before January 1, 2012, the earlier of age 50 and a combined age and creditable service of 80 years or age 52 with ten years of creditable service. If hired on or after January 1, 2012, the earlier of age 50 and a combined age and creditable service of 90 years or age 52 with ten years of creditable service.

Notes to Basic Financial Statements
34
Cost‐of‐Living Adjustment (COLA) in Retirement – Retirement benefits are increased on January 1 of each year by one half of the percentage increase in the Consumer Price Index, U.S. City Average, limited to a maximum of 4.0%. Plan Membership As of the January 1, 2016 actuarial valuation, the following members were covered by the benefit terms of the Plan:
Number
Inactive members or their beneficiaries currently receiving benefits
307
Inactive members entitled to but not yet receiving benefits
28
Active employees 438
Total plan membership 773
Contributions Fairfax Water’s actuarially determined contribution rate for the year ended December 31, 2016 was 44.35% of covered employee compensation, based on an actuarial valuation as of January 1, 2015. Fairfax Water’s current practice is to contribute the greater of the actuarially determined rate or 48% of covered employee compensation. This rate, when combined with employee contributions, was expected to finance the costs of benefits earned by an employee during the year, with an additional amount to finance any unfunded accrued liability. The contributions to the Plan from Fairfax Water for 2016 and 2015 exceeded the actuarially determined requirements and amounted to $17,465,972 and $17,459,685, respectively. Based on the actuarial valuation as of January 1, 2016, the 2015 contributions were prorated between the pension and health benefit portions of the Plan and amounted to $14,362,903 and $3,096,782, respectively. Employee contributions to the Plan for 2016 and 2015 amounted to $1,076,246 and $1,128,898, respectively.
B. Net Pension Liability
Fairfax Water’s net pension liability was measured as of January 1, 2016. The total pension liability used to calculate the net pension liability was determined by an actuarial valuation performed as of January 1, 2015, using updated actuarial assumptions applied to all periods included in the measurement and rolled forward to the measurement date of January 1, 2016.
Actuarial Methods and Assumptions
The total pension liability as of January 1, 2016 was based on the following assumptions:
Actuarial cost method Entry age normal
Inflation 3.00%
Individual salary increases 8.00% for participants under age 45 and 5.00% for participants age 45 and over

Notes to Basic Financial Statements
35
Aggregate payroll increases 4.00%
Cost of living adjustments 3.00% for Plans A, B, C, and D and 1.375% for Plan E Investment rate of return 7.50%, net of pension plan investment expense,
including inflation
Healthy mortality rates were based on the RP‐2000 Healthy Mortality Table for males and females, with adjustments for mortality improvements based on Scale AA. Disabled mortality rates were based on the RPA Post‐1994 Disabled Mortality Table for males and females with no provision for future mortality improvement. The following assumptions were changed since the last valuation dated January 1, 2015:
An annual administrative expense assumption of $154,000 was added to the determination of the recommended contribution rate.
A 1.0% increase in creditable service for assumed sick leave credit was added for Plan E participants.
There were no changes in plan provisions since the last valuation.
Long‐Term Expected Rate of Return
The long‐term expected rate of return on the Plan investments was determined using a building‐block method in which best‐estimate ranges of expected future real rates of return (expected returns, net of pension plan investment expense and inflation) are developed for each major asset class. These ranges are combined to produce the long‐term expected rate of return by weighting the expected future real rates of return by the target asset allocation percentage and by adding expected inflation. Best estimates of arithmetic real rates of return for each major asset class included in the Plan’s target asset allocation as of January 1, 2016 are summarized in the following table:
Long‐Term Asset Class
Target Allocation
Expected Real Rate of Return
Domestic equity 30% ‐ 70% 6.75% International equity 0% ‐ 10% 7.45% Fixed income 20% ‐ 70% 1.75% Real estate 0% ‐ 10% 4.55% Cash 0% ‐ 50% 1.15% Other 0% ‐ 10% N/A

Notes to Basic Financial Statements
36
Discount Rate
The discount rate used to measure the total pension liability was 7.50%. The projection of cash flows used to determine the discount rate assumed plan member contributions will be made at the current contribution rates and that Fairfax Water contributions will be made at rates equal to the actuarially determined contribution rates. Based on those assumptions, the Plan’s fiduciary net position was projected to be available to make all projected future benefit payments of current plan members. Therefore, the long‐term expected rate of return on pension plan investments was applied to all periods of projected benefit payments to determine the total pension liability.
C. Changes in the Net Pension Liability
Total Pension
Liability Plan Fiduciary Net Position
Net Pension Liability
Balance at December 31, 2014 $ 300,234,080 $ 185,654,808 $ 114,579,272 Changes for the year: Service cost 6,138,436 ‐ 6,138,436 Interest 22,410,595 ‐ 22,410,595 Differences between expected and actual experience (5,057,514)
‐
(5,057,514)
Changes of assumptions 54,126 ‐ 54,126 Contributions ‐ employer ‐ 14,362,903 (14,362,903) Contributions ‐ employee ‐ 1,128,898 (1,128,898) Net investment income ‐ (1,694,011) 1,694,011 Benefit payments, including refunds of employee contributions (15,129,156)
(15,129,156)
‐
Administrative expense ‐ (152,439) 152,439
Net changes 8,416,487 (1,483,805) 9,900,292
Balance at December 31, 2015 $ 308,650,567 $ 184,171,003 $ 124,479,564
Sensitivity of the Net Pension Liability to Changes in the Discount Rate
The following presents Fairfax Water’s net pension liability using the discount rate of 7.50%, as well as what the net pension liability would be if it were calculated using a discount rate that is one percentage point lower (6.50%) or one percentage point higher (8.50%) than the current rate:
1% Decrease (6.50%)
Current Discount Rate
(7.50%)
1% Increase (8.50%)
Net pension liability $ 162,185,827 $ 124,479,564 $ 93,067,090

Notes to Basic Financial Statements
37
D. Pension Expense and Deferred Outflows of Resources and Deferred Inflows of Resources Related to Pensions
For the year ended December 31, 2016, Fairfax Water recognized pension expense of $18,661,667. Fairfax Water also reported deferred outflows of resources and deferred inflows of resources from the following sources:
Deferred Outflows
of Resources
Deferred Inflows
of Resources
Differences between expected and actual demographic experience
$ 7,306,452 $
4,173,333
Changes of assumptions 44,663 ‐
Net difference between projected and actual earnings on plan investments
14,757,548
‐
Employer contributions subsequent to the measurement date
17,465,972
‐
Total $ 39,574,635 $ 4,173,333
Deferred outflows of resources of $17,465,972 relates to employer contributions subsequent to the measurement date of the pension plan, and will be recognized as a reduction of the net pension liability in the year ending December 31, 2017. Other amounts reported as deferred outflows and (inflows) of resources related to pensions will be recognized in pension expense as follows:
Year Ending December 31
Amount
2017 $ 5,021,0882018 5,021,0882019 5,021,0892020 3,501,8632021 (629,798)
Total $ 17,935,330
The Plan issues a publicly available financial report that includes the applicable financial statements and supplementary information. That report may be obtained by contacting the Treasurer of the Benefits Trust Committee at 8570 Executive Park Avenue, Fairfax, Virginia 22031.
9. Health Benefits
Employees and their eligible dependents that have previously been covered under the Fairfax County Water Authority Welfare Benefit Trust (the Trust) prior to retirement are eligible for health coverage under the Fairfax County Water Authority Retirement Plan (the Plan). The Plan provides partial

Notes to Basic Financial Statements
38
payment of certain health insurance premium costs of Fairfax Water's retirees, surviving spouses and divorced spouses under a qualified domestic relations order. The health benefit is equal to 3 percent times years of creditable service under the Plan, up to 25 years, times the designated premium. The benefit is subject to a maximum cap of 116 percent of the designated premium as of January 1, 1992, increased by 4 percent for each completed year after that date. Members of Plan D are not eligible for the full health insurance coverage benefit until age 60. Reduced benefits can begin at age 55. The benefit for Members of Plan E hired prior to April 1, 2008 is 50 percent of the designated premium. For Members of Plan E hired on or after April 1, 2008, the benefit is equal to 2 percent times years of creditable service under the Plan, up to 25 years, times the designated premium. Plan Membership
As of the January 1, 2016 actuarial valuation, the following members were covered by the benefit terms of the Plan:
Number
Current retirees, spouses of current retirees, and surviving spouses
408
Current active participants 438
Total plan membership 846
Funding Policy, Annual OPEB Cost and Net OPEB Asset
Board members of Fairfax Water establish employer contribution rates for the respective plan participants. Fairfax Water advance funds the benefits on an actuarially determined basis through the Plan.
The annual cost of other postemployment benefits (OPEB) under GASB Statement No. 45 is called the annual required contribution (ARC). Fairfax Water is required to contribute the ARC of the employer of an amount actuarially determined in accordance with GASB Statement No. 45. The ARC represents a level of funding that, if paid on an on‐going basis, is projected to cover normal cost each year and amortize any unfunded actuarial liabilities (or funding excess) over a period not to exceed 30 years. The following table shows the components of the annual OPEB cost for the year, the amount actually contributed for the year, and the changes in the net OPEB asset for the health benefits.
Health Benefits
Annual required contribution (ARC) $ 3,366,409 Interest on net OPEB asset 250,193 Adjustment to annual required contribution (119,537)
Annual OPEB cost (expense) 3,497,065 Estimated contributions made (3,096,782)
Increase (decrease) in OPEB asset (400,283) Net OPEB asset, beginning of year 3,335,908
Net OPEB asset, end of year $ 2,935,625

Notes to Basic Financial Statements
39
Trend Information Three‐year trend information for the health benefits is as follows:
Year Ended
December 31
Annual OPEB Cost (AOC)
Percentage of AOC
Contributed Net OPEB Asset
2014 $ 2,454,147 110% $ 937,177
2015 3,375,383 171% 3,335,908
2016 3,497,065 89% 2,935,625
Funding Status and Funding Progress
As of January 1, 2016, the most recent actuarial valuation date, the Plan was 61.6 percent funded. The actuarial accrued liability for benefits was $62,787,552 and the actuarial value of assets was $38,679,550 resulting in an unfunded actuarial accrued liability (UAAL) of $24,108,002. The covered payroll was $38,191,309, and the ratio of the UAAL to covered payroll was 63.1 percent. The Schedule of Funding Progress, presented as required supplementary information following the Notes to Basic Financial Statements, presents multi‐year trend information that shows whether the actuarial value of plan assets is increasing or decreasing over time relative to the actuarial accrued liabilities for benefits.
Actuarial Methods and Assumptions
Projections of benefits for financial reporting purposes are based on the substantive plan (the plan as understood by the employer and the plan members) and include the types of benefits provided at the time of each valuation and the historical pattern of sharing of benefits costs between employer and plan members at that point. The actuarial methods and assumptions used include techniques that are designed to reduce the effects of short‐term volatility in actuarial accrued liabilities and the actuarial value of assets, consistent with the long‐term perspective of the calculations.
The following methods and assumptions were used as of January 1, 2016, the valuation upon which the 2016 annual required contribution is based on:
Actuarial cost method Entry age normal
Amortization method Level percentage of payroll over a 30 year period
Inflation 3.00%
Individual salary increases 8.00% for participants under age 45 and 5.00% for participants age 45 and over
Aggregate payroll increases 4.00%
Investment rate of return 7.50%
Discount rate 7.50%

Notes to Basic Financial Statements
40
Pre‐65 and post‐65 trend rates are reviewed separately. The following assumptions and adjustments were changed since the last valuation dated January 1, 2015:
For future retirees electing health coverage, the percentage assumed to cover a spouse was decreased from 80% to 70%.
The assumed per‐capita retiree health costs were updated to reflect more recent experience and premium rates for Medicare‐eligible participants.
A 1.0% increase in creditable service for assumed sick leave credit was added for Plan E participants.
Pre‐Medicare retiree health costs were adjusted to reflect expected savings due to vendor changes implemented January 1, 2016.
There were no changes in plan provisions since the last valuation.
10. Other Postemployment Benefits
Fairfax Water also provides other postemployment benefits (OPEB) for life insurance that is accounted for in a separate program. Membership
As of the January 1, 2016 actuarial valuation, the following members were covered by the benefit terms of the program:
Number
Current retirees 273 Current active participants 438
Total membership 711
Funding Policy, Annual OPEB Cost and Net OPEB Obligation
Board members of Fairfax Water establish employer contribution rates for the respective participants. Fairfax Water has chosen to fund the life insurance on a pay as you go basis.
The annual cost of other postemployment benefits (OPEB) under GASB Statement No. 45 is called the annual required contribution (ARC). Fairfax Water is required to contribute the ARC of the employer of an amount actuarially determined in accordance with GASB Statement No. 45. The ARC represents a level of funding that, if paid on an on‐going basis, is projected to cover normal cost each year and amortize any unfunded actuarial liabilities (or funding excess) over a period not to exceed 30 years.

Notes to Basic Financial Statements
41
The following table shows the components of the annual OPEB cost for the year, the amount actually contributed for the year, and the changes in the net OPEB obligation for the life insurance contribution.
Life Insurance
Annual required contribution (ARC) $ 214,666 Interest on net OPEB obligation 87,943 Adjustment to annual required contribution (76,217)
Annual OPEB cost (expense) 226,392 Actual contributions made (565,149)
Increase (decrease) in net OPEB obligation (338,757) Net OPEB obligation, beginning of year 2,198,564
Net OPEB obligation, end of year $ 1,859,807
Trend Information
Three‐year trend information for the life insurance is as follows:
Year Ended
December 31
Annual OPEB Cost (AOC)
Percentage of AOC
Contributed Net OPEB Obligation
2014 $ 826,376 67% $ 11,414,491
2015 275,591 283% 2,198,564
2016 226,392 250% 1,859,807
Funding Status and Funding Progress As of January 1, 2016, the most recent actuarial valuation date, the program was 0 percent funded. The actuarial accrued liability for benefits was $2,584,933, and the actuarial value of assets was $0, resulting in an unfunded actuarial accrued liability of $2,584,933. The covered payroll was $38,191,309 and the ratio of the AAL to covered payroll was 6.8 percent.
Actuarial valuations of an ongoing program involve estimates of the value of reported amounts and assumptions about the probability of occurrence of events far into the future. Amounts determined regarding the funded status of the program and the annual required contributions of the employer are subject to continual revision as actual results are compared with the past expectations and new estimates are made about the future. The Schedule of Funding Progress, presented as required supplementary information following the Notes to Basic Financial Statements, presents multi‐year trend information that shows whether the actuarial value of program assets is increasing or decreasing over time relative to the actuarial accrued liabilities for benefits.

Notes to Basic Financial Statements
42
Actuarial Methods and Assumptions
The following methods and assumptions were used as of January 1, 2016, the valuation upon which the 2016 annual required contribution is based on:
Actuarial cost method Entry age normal
Amortization method Level percentage of payroll over a 30 year period
Inflation 3.00%
Individual salary increases 8.00% for participants under age 45 and 5.00% for participants age 45 and over
Aggregate payroll increases 4.00%
Investment rate of return 4.00%
Discount rate 4.00%
11. Commitments and Contingencies
In connection with its ongoing capital improvement program, Fairfax Water has entered into various construction contracts. As of December 31, 2016, the uncompleted cost of these and other contracts is approximately $7.1 million.
Fairfax Water has also agreed, in principle, to pay certain portions of the capital and annual operation and maintenance costs relating to various water supply augmentation facilities constructed and proposed to be constructed by other parties for the use and benefit of Fairfax Water and other water supply agencies in the Washington, D.C., metropolitan area. Fairfax Water’s share of the capital costs is presently estimated at $8.1 million which is to be paid with interest over the next 24 years. Fairfax Water’s share of annual operation and maintenance costs associated with these facilities for 2017 is estimated to be $158,000.
On January 3, 2014 Fairfax Water entered into an agreement with the U.S. Army Corps of Engineers (the Army) to purchase water for customers. Fairfax Water also shares the costs of capital improvements to the Washington Aqueduct in accordance with the Approved Capital Improvement Plan. During 2016 Fairfax Water’s costs for water and capital improvements was $2.8 million and $1.1 million, respectively. These costs were recorded as an expense on Fairfax Water’s financial statements. An escrow account has been established for the payments made from which the Army makes draws. The account is interest bearing and all earnings accrue to Fairfax Water. In addition to payments made to the Army, Fairfax Water maintains a balance of approximately three months of the cost of water purchased. The agreement will remain in effect until terminated by either the Army or Fairfax Water, and requires a five year notice. Fairfax Water’s cost for water and capital improvements for 2017 is estimated to be $5.6 million.
In addition, Fairfax Water is contingently liable for claims that arose in the ordinary course of operations and in connection with its capital improvement program. It is the opinion of Fairfax Water and its legal counsel that any losses that may ultimately be incurred as a result of any claims will not be material to the financial statements.

Notes to Basic Financial Statements
43
12. Deferred Compensation Plan
Fairfax Water offers its employees a deferred compensation plan created in accordance with Internal Revenue Code (the Code) Section 457. The deferred compensation plan, available to all employees, permits them to defer a portion of their salaries to future years. All of the assets of the deferred compensation plan are held in a trust for the exclusive benefit of participants and beneficiaries and the assets and liabilities are not reported on the accompanying Statement of Net Position. Participants’ rights under the plan are equal to the fair market value of the deferred account for each participant.
13. Risk Management
Fairfax Water is exposed to various risks of loss related to torts; theft of, damage to and destruction of assets; errors and omissions; injuries to employees; and natural disasters. With the exception of medical coverage for employees, these risks are covered by commercial insurance purchased from independent third parties. Section 6.11 of the 1992 General Trust Indenture states that Fairfax Water “will carry or cause to be carried such insurance with a reputable insurance carrier or carriers, such as is maintained or carried by similar utilities as the Water System.” There have been no significant reductions in insurance coverage from the prior year and settled claims have not exceeded insurance coverage in any of the past three years. Fairfax Water is self‐insured for health benefits coverage for employees up to $200,000 per individual per year and is protected from catastrophic losses through a stop‐loss insurance policy for losses in excess of such levels. The changes in Fairfax Water’s health benefits claims liability in 2016 and 2015 are as follows:
2016
2015
Balance, January 1 $ 766,062 $ 676,557
Claims incurred 8,609,728 7,835,243
Claims paid (8,702,149) (7,745,738)
Balance, December 31 $ 673,641 $ 766,062
This liability, which includes an estimate of incurred but not reported claims, is included in accounts payable and accrued expenses in the accompanying Statement of Net Position.
14. Component Unit
The Fairfax County Water Authority Welfare Benefit Trust (the Trust) is a component unit of Fairfax Water. The assets, liabilities and net position of the Trust amounted to approximately $11,833,882, $673,641, and $11,160,241, respectively, at December 31, 2016. Such amounts have been included in the accompanying financial statements. All transactions between the Trust and Fairfax Water have been eliminated in the preparation of the accompanying financial statements. The Fairfax County

Notes to Basic Financial Statements
44
Water Authority Welfare Benefit Plan provides certain medical, dental, and prescription drug benefits to participating employees, retirees, and their dependents. Amounts deposited into the Trust are based on projected benefit levels determined on an annual basis less projected employee contributions. The purpose of the Trust is to receive and hold assets to provide medical benefits for Fairfax Water employees and retirees. Fairfax Water and the Retirement Plan contributed $7,521,283 to the Trust in 2016. Employees and retirees contributed $2,049,024 in 2016.

Notes to Basic Financial Statements
45
Statement of Net Position
Fairfax Water
Welfare Benefit Trust
Total
Current assets:
Cash and cash equivalents $ 23,364,655 $ 652,342 $ 24,016,997
Investments 43,751,399 4,734,284 48,485,683
Interest receivable 649,160 38,127 687,287
Other assets 25,007,364 ‐ 25,007,364
Noncurrent assets:
Investments 134,600,254 6,409,129 141,009,383
Capital assets, net of accumulated depreciation and amortization 1,722,767,877
‐ 1,722,767,877
Other assets 4,253,305 ‐ 4,253,305
Total assets 1,954,394,014 11,833,882 1,966,227,896
Deferred outflows of resources 60,058,416 ‐ 60,058,416
Total assets and deferred outflows of resources 2,014,452,430 11,833,882 2,026,286,312
Current liabilities 59,711,212 673,641 60,384,853
Noncurrent liabilities 591,368,669 ‐ 591,368,669
Total liabilities 651,079,881 673,641 651,753,522
Deferred inflows of resources 4,173,333 ‐ 4,173,333
Total net position 1,359,199,216 11,160,241 1,370,359,457
Total liabilities, deferred inflows of resources and net position $ 2,014,452,430
$11,833,882
$ 2,026,286,312
Statement of Revenues, Expenses and Change in Net Position
Fairfax Water
Welfare Benefit Trust
Total
Operating revenues $ 153,572,432 $ ‐ $ 153,572,432
Operating expenses (88,944,432) 491,723 (88,452,709)
Depreciation and amortization expense (47,657,856) ‐ (47,657,856)
Nonoperating revenues (expenses), net (3,327,559) 91,802 (3,235,757)
Capital contributions 2,155,188 ‐ 2,155,188
Increase in net position 15,797,773 583,525 16,381,298
Net position, beginning of year 1,343,401,443 10,576,716 1,353,978,159
Net position, end of year $ 1,359,199,216 $11,160,241 $ 1,370,359,457
Statement of Cash Flows
Fairfax Water
Welfare Benefit Trust
Total
Operating activities $ 68,937,982 $ 399,302 $ 69,337,284
Capital and related financing activities (88,775,283) ‐ (88,775,283)
Investing activities 3,336,351 (810,529) 2,525,822
Net decrease in cash and cash equivalents (16,500,950) (411,227) (16,912,177)
Cash and cash equivalents, beginning of year 39,865,605 1,063,569 40,929,174
Cash and cash equivalents, end of year $ 23,364,655 $ 652,342 $ 24,016,997

Notes to Basic Financial Statements
46
15. Related Organizations
Based on an agreement dated January 1, 1989 (original agreement dated July 1, 1978) between the County and Fairfax Water, Fairfax Water bills and collects for the sales of sewer services on behalf of the County’s sewer system. During 2016, Fairfax Water collected approximately $181.8 million on behalf of the County. As of December 31, 2016, approximately $1.9 million was owed to the County. The County has paid a fee of $6.8 million for this service in 2016.
Based on an agreement dated January 3, 2014 between the City of Fairfax and Fairfax Water, Fairfax Water bills and collects for the sales of sewer services on behalf of the City’s sewer system. During 2016, Fairfax Water collected approximately $6.4 million on behalf of the City. As of December 31, 2016, approximately $458,000 was owed to the City. The billing service also includes a utility tax for customers inside the City limits. The City has paid a fee of $260,000 for this service in 2016.
Based on an agreement dated January 3, 2014 between the City of Falls Church and Fairfax Water, Fairfax Water bills and collects for the sales of sewer services on behalf of the City’s sewer system. During 2016, Fairfax Water collected approximately $4.4 million on behalf of the City. As of December 31, 2016, approximately $141,000 was owed to the City. The billing service also includes a utility tax for customers inside the City limits. The City has paid a fee of $94,000 for this service in 2016.
16. Subsequent Events
In January 2017, Fairfax Water purchased two land parcels to be used as future replacement sites for the Central and Chantilly warehouse and maintenance facilities for $11.0 million and $6.5 million, respectively.
On March 1, 2017 Fairfax Water issued $201,590,000 Water Revenue and Refunding Revenue Bonds, Series 2017. The Series 2017 Bonds were sold at a true interest cost of 3.30% and generated a net present value savings of approximately $20.8 million, providing an average annual savings of approximately $1.4 million. The Series 2017 bonds were issued to current refund the Series 2007 Bonds as well as provide funding for Fairfax Water’s capital improvement program.

47
REQUIRED SUPPLEMENTARY INFORMATION

FAIRFAX COUNTY WATER AUTHORITY
48
Schedule of Changes in Net Pension Liability and Related Ratios
Information presented is based on the actuarial information for the plan year ended:
Reporting as of December 31, 2015 2014
Total pension liability
Service cost $ 6,138,436 $ 6,154,281
Interest 22,410,595 20,645,855
Differences between expected and actual experience (5,057,514) 11,343,166
Changes of assumptions 54,126 ‐
Benefit payments, including refunds of employee contributions (15,129,156) (14,066,004)
Net change in total pension liability 8,416,487 24,077,298
Total pension liability – beginning 300,234,080 276,156,782
Total pension liability – ending (a) $ 308,650,567 $ 300,234,080
Plan fiduciary net position
Contributions – employer $ 14,362,903 $ 14,197,131
Contributions – employee 1,128,898 1,192,841
Net investment income (1,694,011) 9,411,421
Benefit payments, including refunds of employee contributions (15,129,156) (14,066,004)
Administrative expense (152,439) (108,171)
Net change in plan fiduciary net position (1,483,805) 10,627,218
Plan fiduciary net position – beginning 185,654,808 175,027,590
Plan fiduciary net position – ending (b) $ 184,171,003 $ 185,654,808
Net pension liability – ending (a) – (b) $ 124,479,564 $ 114,579,272
Plan fiduciary net position as a percentage of the total pension liability 59.67% 61.84%
Covered‐employee payroll $ 36,374,344 $ 35,701,952
Net pension liability as a percentage of covered‐employee payroll 342.22% 320.93%
Notes: This schedule is presented to show information for ten years. However, until a full ten‐year trend is compiled, Fairfax Water will present information for those years which information is available. Covered‐employee payroll figures have been determined by dividing actual employer contributions by the actuarially determined rate or 48%, whichever is greater, given Fairfax Water’s funding practice.

FAIRFAX COUNTY WATER AUTHORITY
49
Schedule of Employer Contributions – Pension Plan (in thousands)
Year Ended
December 31
Actuarially Determined Contribution
Contribution in Relation to the Actuarially Determined Contribution
Contribution Deficiency (Excess)
Covered‐Employee Payroll
Contributions as a Percentage of Covered‐Employee Payroll
2014 $ 12,925 $ 14,197 $ (1,272) $ 35,702 39.77% 2015 12,657 14,363 (1,706) 36,374 39.49%
Notes: This schedule is presented to show information for ten years. However, until a full ten‐year trend is compiled, Fairfax Water will present information for those years which information is available. Covered‐employee payroll figures have been determined by dividing actual employer contributions by the actuarially determined rate or 48%, whichever is greater, given Fairfax Water’s funding practice. Employer contributions are prorated between the pension and health benefits of the Plan based on applicable liability measures for each portion. The total employer contributions to the Plan from Fairfax Water for 2015 and 2014 was 48% of covered‐employee payroll, exceeding the actuarially determined contribution rate, and amounted to $17,459,685 and $17,136,937, respectively.

FAIRFAX COUNTY WATER AUTHORITY
50
Schedule of Funding Progress – Health Benefits (in thousands)
Actuarial Valuation
Date
Actuarial Value of Assets
Actuarial Accrued Liability
Unfunded Actuarial Accrued Liability
Funded Ratio
Annual Covered Payroll
Unfunded Actuarial Accrued
Liability as a Percentage of Covered Payroll
1/1/2014 $ 30,662 $ 51,408 $ 20,746 59.64% $ 35,306 58.76% 1/1/2015 36,466 61,111 24,645 59.67% 36,765 67.03% 1/1/2016 38,680 62,788 24,108 61.60% 38,191 63.12%
Schedule of Employer Contributions – Health Benefits
Year Ended
December 31
Annual Required
Contribution Percentage Contributed
2014 $ 2,449,475 109.84%
2015 3,338,677 172.95%
2016 3,366,409 91.99%

FAIRFAX COUNTY WATER AUTHORITY
51
Schedule of Funding Progress – Other Postemployment Benefits (Implicit Medical Subsidy and Life Insurance)
(in thousands)
Actuarial Valuation
Date
Actuarial Value of Assets
Actuarial Accrued Liability
Unfunded Actuarial Accrued Liability
Funded Ratio
Annual Covered Payroll
Unfunded Actuarial Accrued
Liability as a Percentage of Covered Payroll
1/1/2014 $ ‐ $ 8,311 $ 8,311 0.00% $ 35,306 23.54%
1/1/2015 ‐ 2,732 2,732 0.00% 36,765 7.43%
1/1/2016 ‐ 2,585 2,585 0.00% 38,191 6.77%
Schedule of Employer Contributions – Other Postemployment Benefits (Implicit Medical Subsidy and Life Insurance)
Year Ended
December 31
Annual Required
Contribution Percentage Contributed
2014 $ 759,539 72.60%
2015 214,713 363.42%
2016 214,666 263.27%
Note: There was no implicit medical subsidy included in the 2015 and 2016 annual required contribution. The implicit medical subsidy was $557,030 for the year ended December 31, 2014.

SUPPLEMENTARY INFORMATION

FAIRFAX COUNTY WATER AUTHORITY
53
Statement of Changes in Assets and Liabilities – Agency Funds For the year ended December 31, 2016
FAIRFAX COUNTY SEWER
Balance
January 1, 2016 Additions Reductions Balance
December 31, 2016
Assets
Cash $ 926,404 $ 181,777,674 $ 180,799,808 $ 1,904,270
Liabilities
Accounts payable $ 926,404 $ 181,777,674 $ 180,799,808 $ 1,904,270
CITY OF FAIRFAX SEWER AND UTILITY TAX
Balance
January 1, 2016 Additions Reductions Balance
December 31, 2016
Assets
Cash $ 587,272 $ 6,449,573 $ 6,579,149 $ 457,696
Liabilities
Accounts payable $ 587,272 $ 6,449,573 $ 6,579,149 $ 457,696
CITY OF FALLS CHURCH SEWER AND UTILITY TAX
Balance
January 1, 2016 Additions Reductions Balance
December 31, 2016
Assets
Cash $ 168,250 $ 4,383,732 $ 4,410,704 $ 141,278
Liabilities
Accounts payable $ 168,250 $ 4,383,732 $ 4,410,704 $ 141,278
TOTAL – ALL AGENCY FUNDS
Balance
January 1, 2016 Additions Reductions Balance
December 31, 2016
Assets
Cash $ 1,681,926 $ 192,610,979 $ 191,789,661 $ 2,503,244
Liabilities
Accounts payable $ 1,681,926 $ 192,610,979 $ 191,789,661 $ 2,503,244

FAIRFAX COUNTY WATER AUTHORITY Schedule of Bonds Payable December 31, 2016
54
Description Date of Issue
Maturity Dates
Interest Amount Issued
Outstanding January 1,
2016
Retired During 2016
Outstanding December 31,
2016 Rate Dates
Water Refunding Revenue
Bonds, Series 1997
7/15/1997 4/1/2017 5.000 4/1 – 10/1 $ 4,610,000 $ 4,610,000 $ ‐ $ 4,610,000 7/15/1997 4/1/2018 5.000 4/1 – 10/1 4,840,000 4,840,000 ‐ 4,840,000 7/15/1997 4/1/2019 5.000 4/1 – 10/1 5,080,000 5,080,000 ‐ 5,080,000
7/15/1997 4/1/2020 5.000 4/1 – 10/1 5,335,000 5,335,000 ‐ 5,335,000 7/15/1997 4/1/2021 5.000 4/1 – 10/1 5,605,000 5,605,000 ‐ 5,605,000
25,470,000 ‐ 25,470,000
Water Refunding Revenue 3/30/2005 4/1/2018 5.250 4/1 – 10/1 2,975,000 2,975,000 ‐ 2,975,000 Bonds, Series 2005 3/30/2005 4/1/2019 5.250 4/1 – 10/1 2,835,000 2,835,000 ‐ 2,835,000
3/30/2005 4/1/2020 5.250 4/1 – 10/1 2,910,000 2,910,000 ‐ 2,910,000 3/30/2005 4/1/2021 5.250 4/1 – 10/1 3,475,000 3,475,000 ‐ 3,475,000 3/30/2005 4/1/2022 5.250 4/1 – 10/1 4,000,000 4,000,000 ‐ 4,000,000 3/30/2005 4/1/2023 5.250 4/1 – 10/1 5,865,000 5,865,000 ‐ 5,865,000 3/30/2005 4/1/2024 5.250 4/1 – 10/1 6,175,000 6,175,000 ‐ 6,175,000 3/30/2005 4/1/2025 5.250 4/1 – 10/1 6,500,000 6,500,000 ‐ 6,500,000 3/30/2005 4/1/2026 5.250 4/1 – 10/1 2,655,000 2,655,000 ‐ 2,655,000 3/30/2005 4/1/2027 5.250 4/1 – 10/1 2,795,000 2,795,000 ‐ 2,795,000
40,185,000 ‐ 40,185,000

FAIRFAX COUNTY WATER AUTHORITY Schedule of Bonds Payable (continued) December 31, 2016
55
Description Date of Issue
Maturity Dates
Interest Amount Issued
Outstanding January 1,
2016
Retired During 2016
Outstanding December 31,
2016 Rate Dates
Water Revenue 2/28/2007 4/1/2016 5.00 4/1 – 10/1 5,755,000 5,755,000 5,755,000 ‐ and Refunding Revenue 2/28/2007 4/1/2017 5.00 4/1 – 10/1 8,825,000 8,825,000 ‐ 8,825,000 Bonds, Series 2007 2/28/2007 4/1/2018 5.00 4/1 – 10/1 9,260,000 7,975,000 ‐ 7,975,000
2/28/2007 4/1/2019 5.00 4/1 – 10/1 9,725,000 8,370,000 ‐ 8,370,000 2/28/2007 4/1/2020 5.00 4/1 – 10/1 10,205,000 8,785,000 ‐ 8,785,000 2/28/2007 4/1/2021 5.00 4/1 – 10/1 10,715,000 9,220,000 ‐ 9,220,000 2/28/2007 4/1/2022 4.25 4/1 – 10/1 17,065,000 15,500,000 ‐ 15,500,000 2/28/2007 4/1/2023 4.30 4/1 – 10/1 7,760,000 6,125,000 ‐ 6,125,000 2/28/2007 4/1/2024 4.50 4/1 – 10/1 8,105,000 6,395,000 ‐ 6,395,000 2/28/2007 4/1/2025 4.50 4/1 – 10/1 8,460,000 6,675,000 ‐ 6,675,000 2/28/2007 4/1/2026 4.50 4/1 – 10/1 13,025,000 11,155,000 ‐ 11,155,000 2/28/2007 4/1/2027 4.50 4/1 – 10/1 13,615,000 11,660,000 ‐ 11,660,000 2/28/2007 4/1/2028 3.00 4/1 – 10/1 14,115,000 14,115,000 ‐ 14,115,000 2/28/2007 4/1/2029 4.25 4/1 – 10/1 9,785,000 9,785,000 ‐ 9,785,000 2/28/2007 4/1/2030 4.25 4/1 – 10/1 6,620,000 6,620,000 ‐ 6,620,000
2/28/2007 4/1/2031 4.25 4/1 – 10/1 6,895,000 6,895,000 ‐ 6,895,000 2/28/2007 4/1/2032 4.25 4/1 – 10/1 2,390,000 2,390,000 ‐ 2,390,000 2/28/2007 4/1/2033 4.50 4/1 – 10/1 7,580,000 7,580,000 ‐ 7,580,000
2/28/2007 4/1/2034 4.50 4/1 – 10/1 7,925,000 7,925,000 ‐ 7,925,000 2/28/2007 4/1/2035 4.50 4/1 – 10/1 2,730,000 2,730,000 ‐ 2,730,000 2/28/2007 4/1/2036 4.50 4/1 – 10/1 2,860,000 2,860,000 ‐ 2,860,000 2/28/2007 4/1/2037 4.50 4/1 – 10/1 2,990,000 2,990,000 ‐ 2,990,000
170,330,000 5,755,000 164,575,000

FAIRFAX COUNTY WATER AUTHORITY Schedule of Bonds Payable (continued) December 31, 2016
56
Description Date of Issue
Maturity Dates
Interest Amount Issued
Outstanding January 1,
2016
Retired During 2016
Outstanding December 31,
2016 Rate Dates
Water Revenue and 11/10/2010 4/1/2022 3.000 4/1 – 10/1 150,000 150,000 ‐ 150,000 Refunding Revenue Bonds, 11/10/2010 4/1/2023 3.000 4/1 – 10/1 155,000 155,000 ‐ 155,000
Series 2010 11/10/2010 4/1/2024 3.000 4/1 – 10/1 155,000 155,000 ‐ 155,000 11/10/2010 4/1/2025 3.125 4/1 – 10/1 160,000 160,000 ‐ 160,000 11/10/2010 4/1/2026 3.200 4/1 – 10/1 165,000 165,000 ‐ 165,000 11/10/2010 4/1/2027 3.250 4/1 – 10/1 170,000 170,000 ‐ 170,000 11/10/2010 4/1/2028 4.000 4/1 – 10/1 3,380,000 3,380,000 ‐ 3,380,000 11/10/2010 4/1/2029 4.000 4/1 – 10/1 8,350,000 8,350,000 ‐ 8,350,000 11/10/2010 4/1/2030 4.250 4/1 – 10/1 3,620,000 3,620,000 ‐ 3,620,000 11/10/2010 4/1/2031 4.000 4/1 – 10/1 3,770,000 3,770,000 ‐ 3,770,000 11/10/2010 4/1/2032 4.000 4/1 – 10/1 3,925,000 3,925,000 ‐ 3,925,000 11/10/2010 4/1/2033 5.000 4/1 – 10/1 2,230,000 2,230,000 ‐ 2,230,000 11/10/2010 4/1/2034 5.000 4/1 – 10/1 2,305,000 2,305,000 ‐ 2,305,000 11/10/2010 4/1/2035 5.000 4/1 – 10/1 7,815,000 7,815,000 ‐ 7,815,000 11/10/2010 4/1/2036 5.000 4/1 – 10/1 8,065,000 8,065,000 ‐ 8,065,000 11/10/2010 4/1/2037 5.000 4/1 – 10/1 8,330,000 8,330,000 ‐ 8,330,000 11/10/2010 4/1/2038 5.000 4/1 – 10/1 11,655,000 11,655,000 ‐ 11,655,000 11/10/2010 4/1/2039 5.000 4/1 – 10/1 12,035,000 12,035,000 ‐ 12,035,000 11/10/2010 4/1/2040 5.000 4/1 – 10/1 12,425,000 12,425,000 ‐ 12,425,000
88,860,000 ‐ 88,860,000
Water Refunding Revenue 1/24/2012 4/1/2016 3.000 4/1 – 10/1 340,000 340,000 340,000 ‐ Bonds, Series 2012 1/24/2012 4/1/2017 3.000 4/1 – 10/1 350,000 350,000 ‐ 350,000
1/24/2012 4/1/2018 3.000 4/1 – 10/1 360,000 360,000 ‐ 360,000 1/24/2012 4/1/2019 3.000 4/1 – 10/1 370,000 370,000 ‐ 370,000

FAIRFAX COUNTY WATER AUTHORITY Schedule of Bonds Payable (continued) December 31, 2016
57
Description Date of Issue
Maturity Dates
Interest Amount Issued
Outstanding January 1,
2016
Retired During 2016
Outstanding December 31,
2016 Rate Dates
Water Refunding Revenue 1/24/2012 4/1/2020 3.000 4/1 – 10/1 380,000 380,000 ‐ 380,000 Bonds, Series 2012 1/24/2012 4/1/2021 4.250 4/1 – 10/1 395,000 395,000 ‐ 395,000
(continued) 1/24/2012 4/1/2022 4.250 4/1 – 10/1 410,000 410,000 ‐ 410,000 1/24/2012 4/1/2023 4.250 4/1 – 10/1 2,905,000 2,905,000 ‐ 2,905,000 1/24/2012 4/1/2023 5.000 4/1 – 10/1 6,315,000 6,315,000 ‐ 6,315,000 1/24/2012 4/1/2024 5.000 4/1 – 10/1 9,660,000 9,660,000 ‐ 9,660,000 1/24/2012 4/1/2025 5.000 4/1 – 10/1 10,140,000 10,140,000 ‐ 10,140,000 1/24/2012 4/1/2026 5.000 4/1 – 10/1 10,635,000 10,635,000 ‐ 10,635,000 1/24/2012 4/1/2027 5.000 4/1 – 10/1 11,160,000 11,160,000 ‐ 11,160,000 1/24/2012 4/1/2028 5.000 4/1 – 10/1 11,720,000 11,720,000 ‐ 11,720,000 1/24/2012 4/1/2029 5.000 4/1 – 10/1 12,300,000 12,300,000 ‐ 12,300,000
77,440,000 340,000 77,100,000
Water Refunding Revenue 2/25/2013 4/1/2016 3.000 4/1 – 10/1 5,715,000 5,715,000 5,715,000 ‐ Bonds, Series 2013A 2/25/2013 4/1/2018 3.000 4/1 – 10/1 1,180,000 1,180,000 ‐ 1,180,000
2/25/2013 4/1/2019 4.000 4/1 – 10/1 1,225,000 1,225,000 ‐ 1,225,000 2/25/2013 4/1/2020 4.000 4/1 – 10/1 1,275,000 1,275,000 ‐ 1,275,000 2/25/2013 4/1/2021 4.000 4/1 – 10/1 1,325,000 1,325,000 ‐ 1,325,000 2/25/2013 4/1/2022 5.000 4/1 – 10/1 1,385,000 1,385,000 ‐ 1,385,000 2/25/2013 4/1/2023 4.000 4/1 – 10/1 1,450,000 1,450,000 ‐ 1,450,000 2/25/2013 4/1/2024 5.000 4/1 – 10/1 1,520,000 1,520,000 ‐ 1,520,000 2/25/2013 4/1/2025 5.000 4/1 – 10/1 1,595,000 1,595,000 ‐ 1,595,000 2/25/2013 4/1/2026 5.000 4/1 – 10/1 1,680,000 1,680,000 ‐ 1,680,000 2/25/2013 4/1/2027 5.000 4/1 – 10/1 1,765,000 1,765,000 ‐ 1,765,000 2/25/2013 4/1/2032 4.000 4/1 – 10/1 5,395,000 5,395,000 ‐ 5,395,000
25,510,000 5,715,000 19,795,000
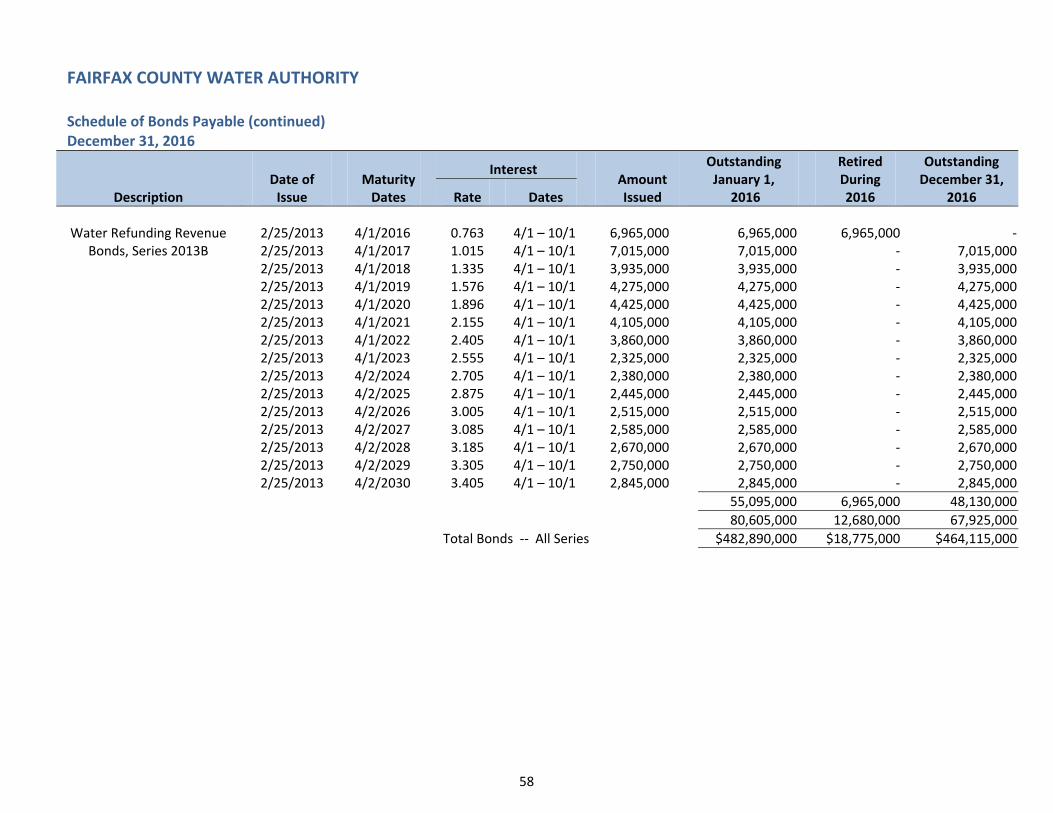
FAIRFAX COUNTY WATER AUTHORITY Schedule of Bonds Payable (continued) December 31, 2016
58
Description Date of Issue
Maturity Dates
Interest Amount Issued
Outstanding January 1,
2016
Retired During 2016
Outstanding December 31,
2016 Rate Dates
Water Refunding Revenue 2/25/2013 4/1/2016 0.763 4/1 – 10/1 6,965,000 6,965,000 6,965,000 ‐ Bonds, Series 2013B 2/25/2013 4/1/2017 1.015 4/1 – 10/1 7,015,000 7,015,000 ‐ 7,015,000
2/25/2013 4/1/2018 1.335 4/1 – 10/1 3,935,000 3,935,000 ‐ 3,935,000 2/25/2013 4/1/2019 1.576 4/1 – 10/1 4,275,000 4,275,000 ‐ 4,275,000 2/25/2013 4/1/2020 1.896 4/1 – 10/1 4,425,000 4,425,000 ‐ 4,425,000 2/25/2013 4/1/2021 2.155 4/1 – 10/1 4,105,000 4,105,000 ‐ 4,105,000 2/25/2013 4/1/2022 2.405 4/1 – 10/1 3,860,000 3,860,000 ‐ 3,860,000 2/25/2013 4/1/2023 2.555 4/1 – 10/1 2,325,000 2,325,000 ‐ 2,325,000 2/25/2013 4/2/2024 2.705 4/1 – 10/1 2,380,000 2,380,000 ‐ 2,380,000 2/25/2013 4/2/2025 2.875 4/1 – 10/1 2,445,000 2,445,000 ‐ 2,445,000 2/25/2013 4/2/2026 3.005 4/1 – 10/1 2,515,000 2,515,000 ‐ 2,515,000 2/25/2013 4/2/2027 3.085 4/1 – 10/1 2,585,000 2,585,000 ‐ 2,585,000 2/25/2013 4/2/2028 3.185 4/1 – 10/1 2,670,000 2,670,000 ‐ 2,670,000 2/25/2013 4/2/2029 3.305 4/1 – 10/1 2,750,000 2,750,000 ‐ 2,750,000 2/25/2013 4/2/2030 3.405 4/1 – 10/1 2,845,000 2,845,000 ‐ 2,845,000
55,095,000 6,965,000 48,130,000
80,605,000 12,680,000 67,925,000
Total Bonds ‐‐ All Series $482,890,000 $18,775,000 $464,115,000