Embed Size (px)
Citation preview

LINES OF BUSINESSMarch 2016
Fairfax County, Virginia
County Lines of Business (LOBs)
Presentation to the Board of Supervisors
EMPLOYEE COMPENSATION
LINES OF BUSINESSMay 2016
Fairfax County, Virginia
County Lines of Business (LOBs)
Presentation to the Board of Supervisors
www.fairfaxcounty.gov/budget/2016-lines-of-business.htm

EMPLOYEE COMPENSATION
County of Fairfax, VA – Lines of Business Presentation
Employee Pay
Retiree Benefits
Other Employee Benefits
Presentation Agenda
2
Employee compensation and retiree benefits are paid from sources across the County, including the General Fund, other funds (i.e. Community Services Board, Sewer Funds), and grants.
Information included in the presentation focuses on the General Fund only.

EMPLOYEE COMPENSATION
County of Fairfax, VA – Lines of Business Presentation
Combined, employee pay and benefits (not including Retiree Health) are 79% of overall General Fund Direct Expenditures
o In FY 2007, employee compensation was 74% of Direct Expenditures
Employee Compensation has grown 3% annually over the past 10 years
Overview
3
General Fund Adopted Budget FY 2007 FY 2017% Annual Increase
Employee Pay $671.70 $808.17 1.9%
Employee Benefits $191.12 $354.85 6.4%
Total Employee Compensation $862.82 $1,163.02 3.0%
Retiree Health $12.27 $16.00 2.7%
Total Employee Compensation & Retiree Health
$875.09 $1,179.02 3.0%
Employee Compensation & Retiree Health(In $millions)
In the General Fund, employee pay is budgeted and paid out of agency budgets, while benefits are budgeted and paid out of a centralized agency (Agency 89)
o This approach allows the County to centrally manage benefit costs, while, at the same time, not penalizing agencies for costs beyond their control (i.e. health plan migration or increases in coverage)

EMPLOYEE COMPENSATION
County of Fairfax, VA – Lines of Business Presentation
LOB # LOB Title
309 Retirement Plan Administration
310 Retirement Plan Investment and Financial Management
311 Retirement Plan Benefit Payments
312 Social Security and Medicare
313 Virginia Retirement System
314 Retiree Health
315 Health Insurance and Wellness
316 Dental Insurance
317 Patient Protection and Affordable Care Act Fees
318 Line of Duty
319 Life Insurance
320 Unemployment Compensation
321 Employee Development Initiatives / Tuition Reimbursement
322 Employee Awards
LOBs Summary Table
4

EMPLOYEE COMPENSATION
County of Fairfax, VA – Lines of Business Presentation
EMPLOYEE PAY
5

EMPLOYEE COMPENSATION
County of Fairfax, VA – Lines of Business Presentation
Overview of Funding
Employee Pay Categories
Types of Pay Plans
County’s Compensation Plan
o Market Rate Adjustment
o Merit/Performance/Longevity Increases
o Promotions
o Plan Characteristics
o Employee Progression through Pay Plans
o Spread of Employees on Pay Scale
o Benchmark Class Studies
Average Base Salaries by Plan
Employee Pay Agenda
6

EMPLOYEE COMPENSATION
County of Fairfax, VA – Lines of Business Presentation
Major pay categories include:
o Regular Salaries
o Limited-Term Support
o Shift Differential
o Extra Compensation
o Position Turnover
Over the past 10 years, Employee Pay has grown, on average, 1.9% annually
Employee Pay Overview
7
General Fund Adopted Budget
FY 2007 FY 2017% Annual Increase
Regular Salaries* $624.79 $800.90 2.5%
Limited-Term $19.61 $19.62 0.0%
Shift Differential $4.72 $4.55 (0.4%)
Extra Compensation $43.64 $46.90 0.7%
Position Turnover ($21.06) ($63.80) 11.7%
Total Employee Pay $671.70 $808.17 1.9%
*Includes Stipends, Awards, Allowances and Leave Payouts
Employee Pay(In $millions)

EMPLOYEE COMPENSATION
County of Fairfax, VA – Lines of Business Presentation
Regular Salaries
Includes salaries for merit employees, as well as various stipends, incentive pays, and allowances. Examples include:o Advanced Life Support Stipend (Fire & Rescue)
o ALS Riding Pay (Fire & Rescue)
o Emergency Services/Mobile Crisis Unit Stipend (CSB)
o Environmental Incentive (Sheriff)
o Flight Medic Pay (Police)
o Language Stipend (Various)
o Uniform allowance (Police, Sheriff)
Limited-Term Support
Includes salaries for non-merit benefits eligible and temporary employees (i.e. Lifeguards, Election Workers, Park Instructors)o Non-Merit Benefits Eligible employees work at least 1,040 but no more than 1,612 hours
o Temporary employees are limited to 900 hours or less
Regular Salaries and Limited-Term
8

EMPLOYEE COMPENSATION
County of Fairfax, VA – Lines of Business Presentation
Shift differential is an additional hourly rate paid based on the shifts worked by the employee
o Evening shift – all schedules that begin at or after 1pm and before 7:59pm
o Night shift – all schedules that begin at or after 8pm and before 7:00am
Most shift differential is paid to uniformed public safety personnel, however other agencies that utilize shift differential include the Community Services Board, Department of Vehicle Services, and Department of Public Works and Environmental Services
As Fire and Rescue employees are on a 24-hour shift, all uniformed FRD employees working a 24-hour shift receive shift differential
While shift differential rates are compared to other jurisdictions on a regular basis for competitiveness, shift differential is not included in overall market pay comparisons
Current shift differential rates are as follows:
Shift Differential
9
Police/Sheriff/Other Fire and Rescue
Evening Shift Night Shift 24 Hour Shift
$0.90/hour $1.30/hour $0.73/hour

EMPLOYEE COMPENSATION
County of Fairfax, VA – Lines of Business Presentation
Includes various types of extra pay, including:
o Callback Pay
o Court Overtime
o On Call Pay
o Scheduled overtime
Overtime is paid in accordance with the Fair Labor Standards Act (FLSA)
Most extra compensation provided to uniformed public safety employees
o 90% of General Fund extra compensation resides in the Public Safety agencies
o Public Safety agencies use a combination of regular hours and overtime to meet minimum staffing requirements
Extra Compensation
10

EMPLOYEE COMPENSATION
County of Fairfax, VA – Lines of Business Presentation
Position turnover is a negative funding amount included in agency budgets that has the overall impact of reducing an agency’s personnel budget
Several years of across-the-board budget reductions included increasing position turnover rates, requiring agencies to keep positions vacant for extended periods.
Currently, position turnover in the General Fund equates to approximately 8% of an agency’s salary budget
o In FY 2007, budgeted position turnover was 3.4%
When budget adjustments are made for pay, such as increases for the Market Rate Adjustment, position turnover is also adjusted
o For example, the FY 2017 MRA had a net General Fund impact of $15.38 million, including:
• Regular Salaries $11.56 million
• Limited-Term Support $0.31 million
• Position Turnover ($0.94) million
• Extra Pay $0.61 million
• Associated Fringe Benefits $3.84 million
Position Turnover
11
EMPLOYEE COMPENSATION
County of Fairfax, VA – Lines of Business Presentation
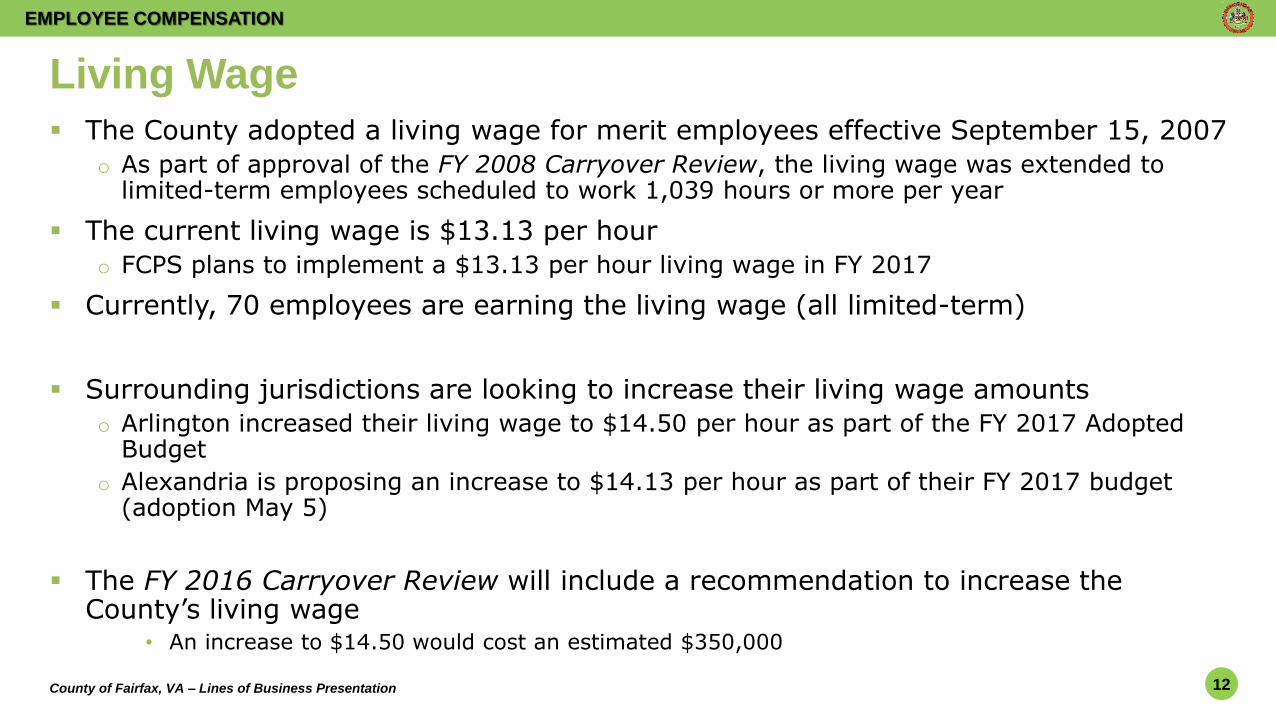
The County adopted a living wage for merit employees effective September 15, 2007
o As part of approval of the FY 2008 Carryover Review, the living wage was extended to limited-term employees scheduled to work 1,039 hours or more per year
The current living wage is $13.13 per hour
o FCPS plans to implement a $13.13 per hour living wage in FY 2017
Currently, 70 employees are earning the living wage (all limited-term)
Surrounding jurisdictions are looking to increase their living wage amounts
o Arlington increased their living wage to $14.50 per hour as part of the FY 2017 Adopted Budget
o Alexandria is proposing an increase to $14.13 per hour as part of their FY 2017 budget (adoption May 5)
The FY 2016 Carryover Review will include a recommendation to increase the County’s living wage
• An increase to $14.50 would cost an estimated $350,000
Living Wage
12

EMPLOYEE COMPENSATION
County of Fairfax, VA – Lines of Business Presentation
Fairfax County has 2 types of compensation structures for merit/performance increases
o Step/Grade plans for Uniformed Public Safety Employees
• Plan C – Uniformed Sheriff
• Plan F – Uniformed Fire and Rescue
• Plan O – Uniformed Police
• Plan P – Public Safety Communications and Animal Control Officers
o Open Range Plans for Non-Uniformed Employees
• Plan L – Lawyers in County Attorney’s Office
• Plan S – General County employees
• Plan E – Executive Service
• Plan X – Exempt service employees
Types of Pay Plans
13

EMPLOYEE COMPENSATION
County of Fairfax, VA – Lines of Business Presentation
Components of County’s Compensation Plan
14
Market Rate Adjustment
Merit/ Performance/
Longevity Increase
Benchmark Class Review
TOTAL ADJUSTMENT
• Keeps overall pay structures competitive with market
• Same MRA applied to all County pay plans
• Based on formula approved by Board and employee groups
• Does not impact employee’s position on pay scale
• Rewards employees based on solid performance and longevity
• Moves employee salaries up their respective pay scales
• Examines individual “benchmark” job classes and determines if in-line with competitor jurisdictions
• For non-uniformed employees, adjustments impact pay grade for impacted job classes
• For uniformed employees, adjustments impact entire pay scale

EMPLOYEE COMPENSATION
County of Fairfax, VA – Lines of Business Presentation
The Market Rate Adjustment (MRA) provides a guide to the amount of pay structure adjustment needed to keep County pay rates competitive with the market.
Provided to all County employees
Since FY 2012, the MRA calculation has consisted of the following components:
Market Rate Adjustment
15
CPI40%
ECI50%
Federal10%
Federal Wage Adjustment for the Washington-Baltimore area. Due to budget timing, adjustment from previous January used.
Consumer Price Index (CPI) for the Washington-Baltimore area monitors changes in the cost of living. September data used.
Employment Cost Index (ECI) measures the rate of change in employee compensation (wages and salaries). Civilian ECI used, which includes private sector, state, and local government employees. Third quarter data used.

EMPLOYEE COMPENSATION
County of Fairfax, VA – Lines of Business Presentation
Calculation for FY 2017 Budget
History of MRA
Market Rate Adjustment History
16
Fiscal
Year
Year Data
Effective
Consumer Price
Index Wash/
Baltimore (CPI)
CPI x .40
Employment
Cost Index
(ECI)
ECI x .50Federal Wage
AdjustmentFed x .10
Market Rate
Adjustment
FY 2017 2015 0.49% 0.194% 2.07% 1.036% 1.00% 0.100% 1.33%
Fiscal
Year
Calculated
MRAFunded MRA
FY 2016 1.68% 1.10%
FY 2015 1.29% 1.29%
FY 2014 1.93% 0.00%
FY 2013 2.18% 2.18%
FY 2012 1.52% 2.00%
FY 2011 0.78% 0.00%
FY 2010 3.49% 0.00%
Note: FY 2012 was the first year that the MRA was applied to the salaries of all County employees (previously, it was only applied to uniformed Public Safety salaries).
In FY 2010 and FY 2011, formula was based on CPI (40%), Local Area Jurisdictions and Federal Adjustments (50%) and the Human Resource Association National
Capital Area Salary Planning Survey (10%).

EMPLOYEE COMPENSATION
County of Fairfax, VA – Lines of Business Presentation
Merit/Performance increases are awarded to all merit employees
These increases are awarded based on the type of pay plan
o Uniformed Public Safety employees are on a Step/Grade pay structure
o Non-Uniformed Employees are on an Open Range pay structure
All merit employees are eligible for longevity increases
o Uniformed Public Safety – 5% at 15 and 20 years
o Non-Uniformed Employees – 4% at 20 and 25 years
o Longevity increases are in place of, not in addition to, normal merit/performance increases
Merit/Performance Increases
17

EMPLOYEE COMPENSATION
County of Fairfax, VA – Lines of Business Presentation
Uniformed Public Safety Employees
o One or two-grade promotion: Salary increase greater than one within-grade increase of prior position, but no less than 6% (typically close to 10%)
o Three of more grade promotion: Step closest to, but not in excess of, a 15% increase
Non-Uniformed Employees
o One or two-grade promotion: Salary increase of 10%
o Three or more grade promotion: Salary increase of 15%
Promotions
18

EMPLOYEE COMPENSATION
County of Fairfax, VA – Lines of Business Presentation
Step/Grade Pay Structure
Pay Plans have 9 steps, with 2 additional longevity steps for 15 and 20 years
The differential between most Pay Steps is 5%
The differential between Pay Grades varies – usually 5% to 10%
Employees are generally hired at Step 1 or Step 2
Market Rate Adjustments increase the entire scale
Merits/Longevities allow employees to move within the pay structure
In any given year, approximately 45% of uniformed employees are eligible for a step/longevity. Therefore, the typical average merit/longevity increase is 2.25% (45% times 5%).
19
Uniformed Public Safety
Plan Characteristics
Pay
GradeStep 1 Step 2 Step 3 Step 4 Step 5 Step 6 Step 7 Step 8 Step 9
Step 10
(15 Years)
Step 11
(20 Years)
O-17 47,871.41 50,263.82 52,777.92 55,417.44 58,188.42 64,007.84 67,359.97 70,728.11 74,263.28 77,976.29 81,875.66
O-18 52,561.18 55,188.43 57,948.59 60,846.03 63,888.45 67,082.29 70,437.33 73,960.43 77,659.71 81,541.62 85,619.25
O-19 55,068.62 57,822.34 60,713.95 63,749.92 66,938.35 70,285.28 73,800.27 77,488.74 81,363.57 85,432.26 89,704.16
10%
5%
5%
5%
5%
5%
5%
5%
5%
5%
5%
5%
5%
5%
5%
5%
10%
5%
5%
5%
5%
5%
5%
5%
5%
5%
5%
5%
5%
5%
5%
5%

EMPLOYEE COMPENSATION
County of Fairfax, VA – Lines of Business Presentation
1.5
0%
1.5
0%
1.5
0%
1.5
0%
1.5
0%
1.5
0%
1.5
0%
1.5
0%
1.5
0%
1.5
0%
1.5
0%
1.5
0%
1.5
0%
1.5
0%
1.5
0%
1.5
0%
1.5
0%
1.5
0%
1.5
0%
1.5
0%
1.5
0%
1.5
0%
1.5
0%
1.5
0%
1.5
0%
5.0
0%
5.0
0%
5.0
0%
5.0
0%
5.0
0%
5.0
0%
5.0
0%
5.0
0%
5.0
0%
5.0
0%
0%
54%
100%
0%
10%
20%
30%
40%
50%
60%
70%
80%
90%
100%
0.0%
0.5%
1.0%
1.5%
2.0%
2.5%
3.0%
3.5%
4.0%
4.5%
5.0%
5.5%
6.0%
6.5%
Hired -Step 1
1 -Step 2
2 -Step 3
3 -Step 4
4 -Step 5
5 -Step 6
6 -Step 7
7 -Step 8
8 -Step 9
9 10 11 12 13 14 15 -Step10
16 17 18 19 20 -Step11
21 22 23 24 25
Positio
n o
n P
ay S
cale
Perc
enta
ge P
ay I
ncre
ase
Years of Service
Employee Progression if Hired at Step 1*
MRA Merit/Longevity Position on Pay Scale
20
Uniformed Public Safety
Employee Progression
Midpoint after 6 Years of Service
Maximum after 20 Years of Service
*Reflects elimination of Hold removed at Step 8 as part of FY 2017 budget
6.50% Total
1.50% Total 1.50% Total
6.50% Total 6.50% Total

EMPLOYEE COMPENSATION
County of Fairfax, VA – Lines of Business Presentation
86 134
201 257 243
205 195
365
475
629
771
0
3
6
9
12
15
18
21
24
27
0
100
200
300
400
500
600
700
800
900
Step 1 Step 2 Step 3 Step 4 Step 5 Step 6 Step 7 Step 8 Step 9 Step 10 Step 11
Avera
ge Y
ears
of S
erv
ice
# o
f Em
plo
yees o
n P
ay S
tep
Position on Pay Scale
Average Years of Service and Position on Pay Scale
# of Employees Average Years of Service
21
Uniformed Public Safety
Spread of Employees on Pay Scale

EMPLOYEE COMPENSATION
County of Fairfax, VA – Lines of Business Presentation
Pass/Fail Pay Plan Structure
Performance increases range from 3% to 1.25% based on position on pay scale
4% Longevity increases at 20 and 25 years (instead of Performance increase)
Employees cannot exceed the maximum for their pay grade
Employees are hired within pay range based on years of experience
Market Rate Adjustments increase the entire scale and do not impact position on pay plan
Performance/Longevity adjustments increase the employee’s position on the pay plan
Average Performance/Longevity increase is 2%
22
Non-Uniformed Employees
Plan Characteristics
Position on Pay Plan
Performance Increase EligibleGreater than or
Equal toLess Than
0% 15% 3.00%
15% 30% 2.50%
30% 45% 2.00%
45% 60% 1.75%
60% 75% 1.50%
75% 100% 1.25% (or until hit maximum)

EMPLOYEE COMPENSATION
County of Fairfax, VA – Lines of Business Presentation
1.5
0%
1.5
0%
1.5
0%
1.5
0%
1.5
0%
1.5
0%
1.5
0%
1.5
0%
1.5
0%
1.5
0%
1.5
0%
1.5
0%
1.5
0%
1.5
0%
1.5
0%
1.5
0%
1.5
0%
1.5
0%
1.5
0%
1.5
0%
1.5
0%
1.5
0%
1.5
0%
1.5
0%
1.5
0%
3.0
0%
3.0
0%
3.0
0%
3.0
0%
2.5
0%
2.5
0%
2.5
0%
2.0
0%
2.0
0%
2.0
0%
2.0
0%
1.7
5%
1.7
5%
1.7
5%
1.7
5%
1.5
0%
1.5
0%
1.5
0%
1.5
0%
4.0
0%
1.2
5%
1.2
5%
1.2
5%
1.2
5%
4.0
0%
0%
50%
100%
0%
10%
20%
30%
40%
50%
60%
70%
80%
90%
100%
0.0%
0.5%
1.0%
1.5%
2.0%
2.5%
3.0%
3.5%
4.0%
4.5%
5.0%
5.5%
6.0%
6.5%
Hired 1 2 3 4 5 6 7 8 9 10 11 12 13 14 15 16 17 18 19 20 21 22 23 24 25
Positio
n o
n P
ay S
cale
Perc
enta
ge P
ay I
ncre
ase
Years of Service
Employee Progression if Hired at Minimum
MRA Performance/Longevity Position on Pay Scale
23
Non-Uniformed Employees
Employee Progression
Midpoint after 12 Years of Service
Maximum after 25 Years of Service
5.50% Total 5.50% Total
4.50% Total
3.50% Total
3.00% Total2.75% Total
4.00% Total
3.25% Total

EMPLOYEE COMPENSATION
County of Fairfax, VA – Lines of Business Presentation
1,063
440
662 666
441 435 369 348
311
398 450
241 258 208 213 225
188 182 186 177
540
0
3
6
9
12
15
18
21
24
27
0
125
250
375
500
625
750
875
1,000
1,125
Avera
ge Y
ears
of S
erv
ice
# o
f Em
plo
yees
Position on Pay Scale
Average Years of Service and Position on Pay Scale
# of Employees Average Years of Service
24
Non-Uniformed Employees
Spread of Employees on Pay Scale

EMPLOYEE COMPENSATION
County of Fairfax, VA – Lines of Business Presentation
Every year, select benchmark classes (representing all County job classes) are compared against pay structures in surrounding jurisdictions
The Board’s long-standing pay philosophy is to be at the midpoint of the market average.
Job classes are generally recommended for re-grades when the Fairfax midpoint is below 95% of the market average midpoint.
Comparator jurisdictions:o City of Alexandria
o Arlington County
o District of Columbia
o Loudoun County
o Montgomery County
o Prince George’s County
o Prince William County
Pay comparisons are focused on base salaries and do not include extra compensation (including guaranteed overtime)
Benchmark class/market reviews are different between uniformed and non-uniformed job classes
Benchmark Class Studies
25

EMPLOYEE COMPENSATION
County of Fairfax, VA – Lines of Business Presentation
Market comparisons for the major public safety groups (Sheriff, Police, and Fire and Rescue) are done annually using 3 designated job classes for each group.
The designated job classes have been agreed upon by the departments and Human Resources
The midpoint of the Fairfax County pay ranges are compared to the market average midpoint. (For Fire and Rescue, hourly midpoint rates are used.)
26
Uniformed Public Safety
Benchmark Class Studies

EMPLOYEE COMPENSATION
County of Fairfax, VA – Lines of Business Presentation
If at least two of the three benchmark classes are below 95% of the market midpoint average, a recommendation is made so that at least two classes are at 95% of market midpoint or better
Although only 3 classes are compared to the market, increases resulting from the market study impact all classes on the pay scaleo For example, in FY 2015, Fire and Rescue hourly midpoint benchmark comparisons were as
follows:• Firefighter 92% of market average
• Fire Technician 84% of market average
• Fire Battalion Chief 96% of market average
o Thus, a 3% across-the-board adjustment was made to all Fire and Rescue classes to bring the Firefighter job class to 95% of the market average and to maintain the integrity of the pay structure for all grades
27
Uniformed Public Safety
Benchmark Class Studies
Sheriff
oDeputy Sheriff I
oDeputy Sheriff II
oDeputy Sheriff Captain
Police
oPolice Officer I
oPolice Officer II
oPolice Lieutenant
Fire and Rescue
oFirefighter
oFire Technician
oFire Battalion Chief

EMPLOYEE COMPENSATION
County of Fairfax, VA – Lines of Business Presentation
Class Title Grade MIN MID MAXHourly
Midpoint
Uniformed
Sheriff
Deputy Sheriff I C17-2
Market Average 46,171 60,617 75,064
Fairfax 48,331 63,529 78,727
Fairfax as % of Market 105%
Deputy Sheriff II C18
Market Average 51,750 68,446 85,141
Fairfax 50,540 66,433 82,326
Fairfax as % of Market 97%
Deputy Sheriff Captain C28
Market Average 78,759 107,126 135,492
Fairfax 74,552 97,994 121,436
Fairfax as % of Market 91%
Uniformed
Police
Police Officer I O17-2
Market Average 48,509 64,078 79,648
Fairfax 50,264 66,070 81,876
Fairfax as % of Market 103%
Police Officer II O18
Market Average 53,151 70,741 88,332
Fairfax 52,561 69,090 85,619
Fairfax as % of Market 98%
Police Lieutenant O26
Market Average 77,047 100,507 123,967
Fairfax 70,778 93,048 115,308
Fairfax as % of Market 93%
Uniformed
Fire and
Rescue
Firefighter F18
Market Average 45,175 62,119 79,063 25.47
Fairfax 53,732 70,654 87,575 24.26
Fairfax as % of Market 114% 95%
Fire Technician F19
Market Average 49,827 69,519 89,211 29.33
Fairfax 56,295 73,998 91,700 25.41
Fairfax as % of Market 106% 87%
Fire Battalion Chief F29
Market Average 77,520 106,363 135,207 46.61
Fairfax 91,588 120,347 149,106 44.73
Fairfax as % of Market 113% 96%
FY 2017 Public Safety Market Study
28

EMPLOYEE COMPENSATION
County of Fairfax, VA – Lines of Business Presentation
Market reviews of benchmark classes are completed annually
Benchmark classes (approximately 100) are tied to all other County job classes (approximately 700)
29
Non-Uniformed Employees
Benchmark Class Studies
Benchmark Class
Engineering Technician II
Benchmark Class
Benchmark Class
Benchmark Class
Engineering Technician I
Linked Job Class
Linked Job Class
Engineering Aide
Linked Job Class
Linked Job Class
Linked Job Class
Linked Job Class
Linked Job Class
Linked Job Class
Linked Job Class
Benchmark Classes compared to Market
Engineering Technician
III

EMPLOYEE COMPENSATION
County of Fairfax, VA – Lines of Business Presentation
Trigger point for recommending regrades is if a benchmark class falls below 95% of the market average midpoint
If an employee’s pay is below the current grade midpoint, the employee receives 3% of new grade midpoint. If pay is currently at or above the current grade midpoint, the employee receives 1.5% of the new grade midpoint.
30
Non-Uniformed Employees
Benchmark Class Studies
Class TitleFairfax as %
of Market
Current Pay
Grade
Grade
Increase
New Pay
Grade
Engineering Technician II (Benchmark Class) 92% S18 1 S19
Engineering Aide S13 1 S14
Engineering Technician I S15 1 S16
Engineering Technician III S21 1 S22
Employee
Example
Current
SalaryS18 Midpoint
S19
MidpointIncrease Eligible $ Increase
Employee A $44,500 $56,716 $59,422 3% of S19 Midpoint $1,783
Employee B $58,000 $56,716 $59,422 1.5% of S19 Midpoint $891

EMPLOYEE COMPENSATION
County of Fairfax, VA – Lines of Business Presentation
Pay
Plan
Pay
GradeClass Title
Fairfax as %
of Market
Midpoint
1 S 15 Administrative Assistant III 110%
2 P 20 Animal Control Officer II 116%
3 S 18 Engineering Technician II 92%
4 S 27 Engineer III 97%
5 S 24 Accountant II 110%
6 S 27 Auditor III 112%
7 S 24 Budget Analyst II 98%
8 S 11 Cook 115%
9 S 24 Speech Pathologist II 96%
10 S 25 Physical Therapist II 96%
11 S 27 BHN Clinical Nurse Specialist 93%
12 S 19 Public Health Laboratory Technologist 96%
13 S 24 Public Health Nurse II 101%
14 S 19 Public Health Nutritionist 98%
15 S 32 Sr. Pharmacist 97%
16 S 23 Environmental Health Specialist II 102%
17 S 24 HR Analyst II 99%
18 S 23 Training Specialist II 97%
19 S 29 Database Administrator II 107%
20 S 27 Internet/Intranet Architect II 100%
21 S 26 Network/Telecom Analyst II 96%
22 S 25 Programmer Analyst II 98%
23 S 20 Combination Inspector 95%
24 S 21 Senior Engineering Inspector 103%
25 S 21 Paralegal 101%
26 L 5 Assistant County Attorney V 109%
27 S 22 Librarian II 100%
FY 2017 General Employees Benchmark Class Survey
31
Pay
Plan
Pay
GradeClass Title
Fairfax as %
of Market
Midpoint
28 S 13 Library Aide 97%
29 S 18 Carpenter II 107%
30 S 20 Electrician II 107%
31 S 17 Heavy Equipment Operator 100%
32 S 16 General Building Maintenance Worker I 111%
33 S 19 HVAC Technician I 104%
34 S 16 Mason 97%
35 S 16 Painter I 108%
36 S 18 Plumber I 103%
37 S 19 Welder II 108%
38 S 21 Parks/Recreation Specialist II 101%
39 S 24 Planner II 95%
40 S 16 Print Shop Operator II 113%
41 S 27 Information Officer III 101%
42 P 20 Public Safety Communicator III 105%
43 S 15 Material Management Specialist II 106%
44 S 24 Contract Specialist II 104%
45 S 23 Substance Abuse Counselor II 99%
46 S 23 Social Services Specialist II 104%
47 S 23 Real Estate Appraiser 98%
48 S 20 Automotive Mechanic II 106%
49 S 20 Instrumentation Technician II 94%
50 S 10 Maintenance Worker 99%
51 S 18 Plant Operator II 94%
52 S 20 Fire Inspector II 97%
53 S 22 Crime Analyst II 104%
54 S 22 Fingerprint Specialist III 107%

EMPLOYEE COMPENSATION
County of Fairfax, VA – Lines of Business Presentation
Pay Plan# of
Employees
Average
Annual
Salary
Average
Years of
Service
Uniformed 3,534 $80,695 12
Plan C - Sheriff 501 $79,685 13
Plan F – Fire and Rescue 1,394 $86,504 13
Plan O - Police 1,359 $79,535 13
Plan P – Public Safety Communicators/
Animal Control Officers280 $59,213 10
Non-Uniformed 8,001 $67,478 11
Plan E - Executive 42 $161,220 17
Plan L – County Attorney 49 $104,685 8
Plan S – General County 7,824 $66,140 11
Plan X – Exempt Service 86 $122,235 7
TOTAL 11,535 $71,527 11
Average Base Salaries by Pay Plan
32
Data as of March 2016. Includes full-time employees. Does not include overtime, stipends, allowances, awards or leave payouts.

EMPLOYEE COMPENSATION
County of Fairfax, VA – Lines of Business Presentation
Compensation Increase History
33
General
County
Uniformed
Fire and
Rescue
Uniformed
Police/
Sheriff/ DPSC
FY 2017 3.33% 3.58% 3.58%
• 1.33% Market Rate Adjustment for all employees
• Performance and longevity increases for non-uniformed with an average of 2.00%
• Merit and longevity increases for uniformed public safety (45% eligible for 5% increase - average of 2.25%)
FY 2016 3.60% 3.35% 3.35%
• 1.10% Market Rate Adjustment for all employees
• Performance and longevity increases for non-uniformed with an average of 2.50% (higher because of large number of
employees receiving 4% longevity 1st year of implementation)
• Merit and longevity increases for uniformed public safety (45% eligible for 5% increase - average of 2.25%)
FY 2015 2.29% 6.54% 3.54%
• 1.29% Market Rate Adjustment for all employees
• Additional 1.00% above MRA provided to non-uniformed employees
• Merits and longevity increases awarded to uniformed public safety personnel (45% eligible for 5% increase - average of
2.25%)
• Fire and Rescue adjustment of 3% based on pay study
FY 2014 0.00% 0.35% 0.35%
• No across-the-board base pay adjustments
• Longevity increases awarded to uniformed public safety personnel (7% eligible for 5% increase - average of 0.35%)
• Gross $850 bonus awarded to all merit employees; Gross $500 bonus awarded to all benefits-eligible (non-merit)
employees
FY 2013 4.68% 5.48% 5.48%
• 2.18% Market Rate Adjustment for all employees
• General County includes 2.5% performance adjustment awarded in January
• Merit and longevity increases awarded to Uniformed Public Safety (because of backlog of longevities, 66% eligible for
5% increase - average of 3.30%)
FY 2012 2.00% 2.00% 2.00% • 2.00% across-the-board adjustment provided to all merit employees (in September 2011)
FY 2011 0.00% 0.00% 0.00%
FY 2010 0.00% 0.00% 0.00%
Average Annual
Increase1.99% 2.66% 2.29%

EMPLOYEE COMPENSATION
County of Fairfax, VA – Lines of Business Presentation
RETIREE BENEFITS
34

EMPLOYEE COMPENSATION
County of Fairfax, VA – Lines of Business Presentation
Major benefits categories include:
o Retirement
• Employees’
• Uniformed
• Police Officers
• Virginia Retirement System
o FICA
o Deferred Compensation
o Retiree Health
Over the past 10 years, the General Fund cost of Retiree Benefits has grown, on average, 6.2% annually
Retiree Benefits Overview
35
General Fund Adopted Budget FY 2007 FY 2017% Annual Increase
FICA $42.40 $49.30 1.5%
Employees’ Retirement $28.02 $83.68 11.6%
Uniformed Retirement $37.27 $62.83 5.4%
Police Retirement $19.28 $44.86 8.8%
Virginia Retirement System $1.46 $0.68 (7.4%)
Retiree Health $12.27 $16.00 2.7%
Total Retiree Benefits $140.70 $257.35 6.2%
Life Insurance costs related to retirees are not included in the above chart.
Retiree Benefits (In $millions)

EMPLOYEE COMPENSATION
County of Fairfax, VA – Lines of Business Presentation
Financial Flow for Retiree Benefits
36
General Fund
Direct Expenditures (Agency 89, Employee Benefits)
Transfers Out
Fund 60040, Health Benefits
Self-Insured Plans
Cigna Plans
Davis Vision
Fully-Insured Plans
Kaiser
Fund 73030, OPEB TrustShare of OPEB Annual Required Contribution
Retirement Employer Contributions
Retiree Health Benefits
Fund 73000, Employees’ RetirementFund 73010, Uniformed RetirementFund 73020, Police Retirement
Retirement Benefits
State of Virginia
Virginia Retirement System Employer Contributions
Retirees
Does not depict Life Insurance or Line of Duty Benefits
Deferred Compensation
FICA (Social Security & Medicare)Federal Government

EMPLOYEE COMPENSATION
County of Fairfax, VA – Lines of Business Presentation
Retirement
37

EMPLOYEE COMPENSATION
County of Fairfax, VA – Lines of Business Presentation 38
History of Plans
County Retirement Plans
Police Officers Retirement
System
Employees’ Retirement
System
Uniformed Retirement
System
Supplemental Retirement
System (SRS) Created
1955
School Bus Drivers,
School Food Service
Workers, and Park Authority
employees brought into
SRS
1967-69
Fire, Sheriff, Park Police, and Game
Wardens moved to URS
1974
Uniformed Retirement System (URS) Created
Supplemental name changed to Employees’
Retirement System (ERS)
2001
1943
Policemen’s Pension & Retirement Board
Established
1940 1950 1960 1970 1980 1990 2000
EMPLOYEE COMPENSATION
County of Fairfax, VA – Lines of Business Presentation
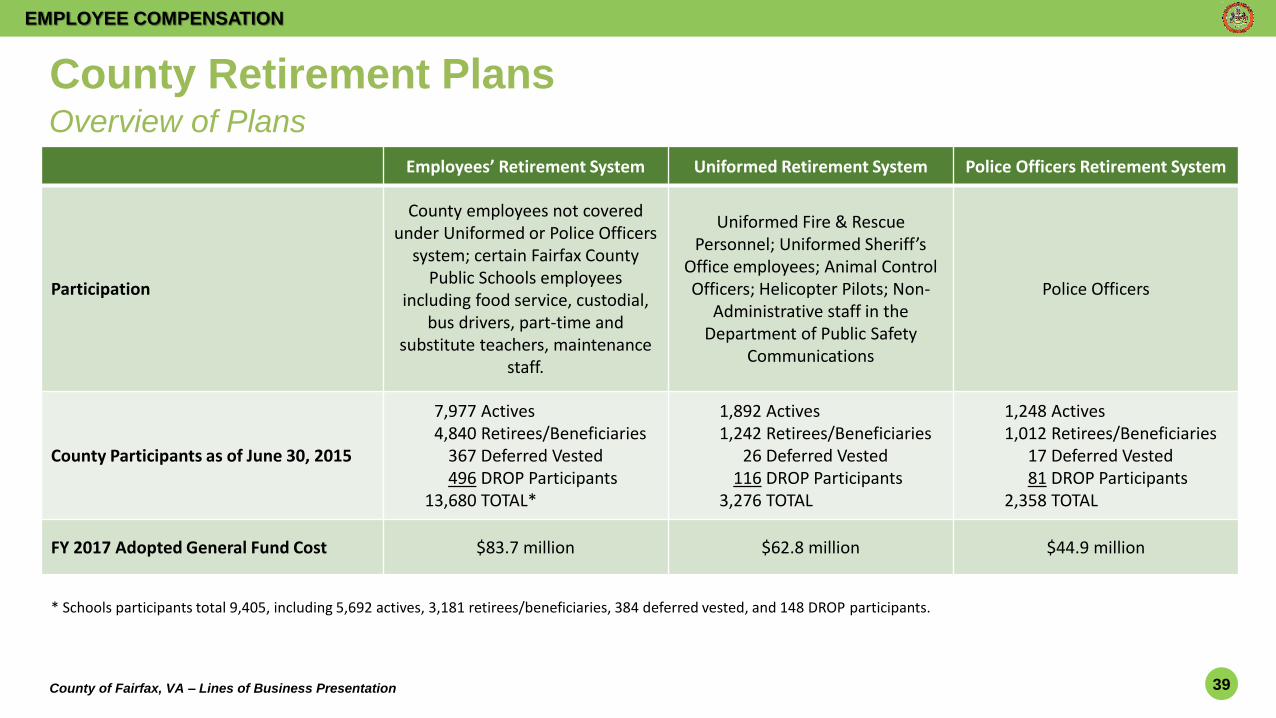
Employees’ Retirement System Uniformed Retirement System Police Officers Retirement System
Participation
County employees not covered under Uniformed or Police Officers
system; certain Fairfax County Public Schools employees
including food service, custodial, bus drivers, part-time and
substitute teachers, maintenance staff.
Uniformed Fire & Rescue Personnel; Uniformed Sheriff’s
Office employees; Animal Control Officers; Helicopter Pilots; Non-
Administrative staff in the Department of Public Safety
Communications
Police Officers
County Participants as of June 30, 2015
7,977 Actives4,840 Retirees/Beneficiaries
367 Deferred Vested496 DROP Participants
13,680 TOTAL*
1,892 Actives1,242 Retirees/Beneficiaries
26 Deferred Vested116 DROP Participants
3,276 TOTAL
1,248 Actives1,012 Retirees/Beneficiaries
17 Deferred Vested81 DROP Participants
2,358 TOTAL
FY 2017 Adopted General Fund Cost $83.7 million $62.8 million $44.9 million
39
Overview of Plans
County Retirement Plans
* Schools participants total 9,405, including 5,692 actives, 3,181 retirees/beneficiaries, 384 deferred vested, and 148 DROP participants.

EMPLOYEE COMPENSATION
County of Fairfax, VA – Lines of Business Presentation
Under Virginia Code §51.1-800, the County’s systems must provide:
“a service retirement allowance to each employee who retires at age sixty-five or older which equals or exceeds two-thirds of the service retirement allowance to which the employee would have been entitled had the allowance been computed under the provisions of the Virginia Retirement System.”
VRS Mandate
40

EMPLOYEE COMPENSATION
County of Fairfax, VA – Lines of Business Presentation
Aon Hewitt completed a study of the County’s retirement benefits, including the pension systems and the County’s retiree health benefits. The study was presented to the Board of Supervisors in February and March 2012.
o http://www.fairfaxcounty.gov/hr/pdf/fairfaxcountyretirementbenefitsbenefitsstudy.pdf
The charts on the following slides show the present value of benefits for several age/service combinations, compared across multiple jurisdictions. As these charts have been extracted from the 2012 retirement study, they are based on the terms of each plan that were in effect on July 1, 2011.
Changes have been made to the terms of each of the County’s retirement plans since July 2011, and changes have also been made to many of the comparator jurisdictions. However, the results of the study are the most recent and most comprehensive benchmarking of the County’s retirement benefits.
Aon Hewitt Retirement Study
41

EMPLOYEE COMPENSATION
County of Fairfax, VA – Lines of Business Presentation 42
Employees’ System
2012 Retirement Study Benchmarking
Age 61 with 21 years of service, $65,000 salary Age 65 with 25 years of service, $65,000 salary

EMPLOYEE COMPENSATION
County of Fairfax, VA – Lines of Business Presentation 43
Uniformed System
2012 Retirement Study Benchmarking
Age 52 with 26 years of service, $90,000 salary

EMPLOYEE COMPENSATION
County of Fairfax, VA – Lines of Business Presentation 44
Police Officers System
2012 Retirement Study Benchmarking
Age 51 with 26 years of service, $90,000 salary
Note: Because Police Officers in many other jurisdictions participate in Social Security (whereby those in Fairfax do not), Social Security contributions/benefits are included in this comparison.

EMPLOYEE COMPENSATION
County of Fairfax, VA – Lines of Business Presentation
Employees’ Uniformed Police Officers
Minimum Retirement Age for Normal Service Retirement
Increased from age 50 to age 55 No change No change
Normal Service Retirement Eligibility
Increased from Rule of 80 (Years plus Service) to Rule of 85 (Years plus Service)
No change No change
Pre-Social Security Supplement and DROP
Removed Pre-Social Security supplement from balances accumulated during the DROP Period
Not applicable
Use of Sick LeavePlaced a cap on the use of sick leave for purposes of determining retirement eligibility and benefits at 2,080 hours
45
Implemented for New Employees hired on or after January 1, 2013
Changes Resulting from the Retirement Study
EMPLOYEE COMPENSATION
County of Fairfax, VA – Lines of Business Presentation
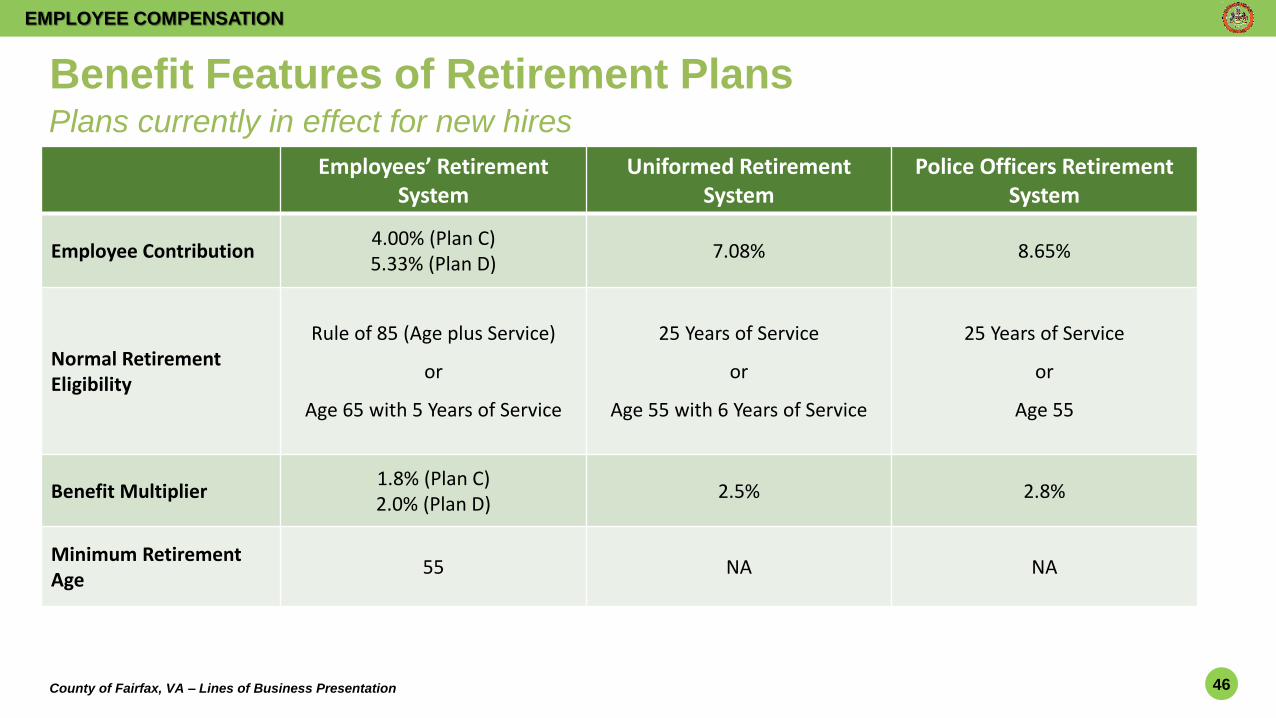
Employees’ RetirementSystem
Uniformed Retirement System
Police Officers Retirement System
Employee Contribution4.00% (Plan C)5.33% (Plan D)
7.08% 8.65%
Normal Retirement Eligibility
Rule of 85 (Age plus Service)
or
Age 65 with 5 Years of Service
25 Years of Service
or
Age 55 with 6 Years of Service
25 Years of Service
or
Age 55
Benefit Multiplier1.8% (Plan C)2.0% (Plan D)
2.5% 2.8%
Minimum Retirement Age
55 NA NA
46
Plans currently in effect for new hires
Benefit Features of Retirement Plans

EMPLOYEE COMPENSATION
County of Fairfax, VA – Lines of Business Presentation 47
Employees’ Retirement System
Retirement Benefit Example
$116,480 $118,227 $120,000
$63,329 $64,279 $65,243 $66,222 $67,215 $68,223 $69,247 $70,285 $71,340 $72,410 $73,496 $74,598
$31,664 $31,664 $31,664 $35,471 $35,826 $36,184 $36,546 $36,911 $37,280 $37,653 $38,030 $38,410
$0
$10,000
$20,000
$30,000
$40,000
$50,000
$60,000
$70,000
$80,000
$90,000
$100,000
$110,000
$120,000
$130,000
$140,000
$150,000
$160,000
2040 - Age61
2041 - Age62
2042 - Age63
2043 - Age64
2044 - Age65
2045 - Age66
2046 - Age67
2047 - Age68
2048 - Age69
2049 - Age70
2050 - Age71
2051 - Age72
2052 - Age73
2053 - Age74
2054 - Age75
An
nu
al S
alar
y/B
enef
it
Projected Retirement Benefit Based on Average New Hire
Salary Base Retirement Benefit Pre-SS Supplement Social Security Final Average Salary
Based on average FY 2016 S-Scale new hire as of March 2016. Does not include pension-eligible stipends or extra pay. Assumes 1.5% Market Rate Adjustments and full funding of pay plan each year. Assumes employee works two years after reaching eligibility for full retirement and retiree health benefits. Estimates Social Security benefit at 30% of Final Average Salary. Assumes 1.5% annual County COLA and 1.00% annual COLA for Social Security.
• New Hire in 2016 at Age 37, Hired at 24% of Scale• Assume S-21 with no promotions• Retiring at age 64 in 2043 with 26 Years of Service
Initial Income Replacement Ratios (as % of Final Average Salary)Base Retirement Benefit – 53%Pre-SS Supplement – 27%TOTAL – 80%

EMPLOYEE COMPENSATION
County of Fairfax, VA – Lines of Business Presentation 48
Uniformed Retirement System
Retirement Benefit Example
$130,611 $132,571 $134,559
$99,007 $100,492 $101,999 $103,529 $105,082 $106,659 $108,259 $109,882 $111,531 $113,204 $114,902 $116,625$11,881 $11,881 $11,881 $11,881 $11,881 $11,881 $11,881 $11,881 $11,881
$39,774 $40,172 $40,573
$0
$10,000
$20,000
$30,000
$40,000
$50,000
$60,000
$70,000
$80,000
$90,000
$100,000
$110,000
$120,000
$130,000
$140,000
$150,000
$160,000
2043 - Age55
2044 - Age56
2045 - Age57
2046 - Age58
2047 - Age59
2048 - Age60
2049 - Age61
2050 - Age62
2051 - Age63
2052 - Age64
2053 - Age65
2054 - Age66
2055 - Age67
2056 - Age68
2057 - Age69
An
nu
al S
alar
y/B
enef
it
Projected Retirement Benefit Based on Average New Hire
Salary Base Retirement Benefit Pre-SS Supplement Social Security Final Average Salary
Based on average FY 2016 F-Scale new hire as of March 2016. Does not include pension-eligible stipends or extra pay. Assumes 1.5% Market Rate Adjustments and full funding of pay plan each year. Assumes employee works two years after reaching eligibility for full retirement and retiree health benefits. Estimates Social Security benefit at 30% of Final Average Salary. Assumes 1.5% annual County COLA and 1.00% annual COLA for Social Security.
• New Hire in 2016 at Age 28, Hired at Step 1• Assume F-18 with no promotions• Retiring at age 58 in 2046 with 29 Years of Service
Initial Income Replacement Ratios (as % of Final Average Salary)Base Retirement Benefit – 75%Pre-SS Supplement – 9%TOTAL – 84%

EMPLOYEE COMPENSATION
County of Fairfax, VA – Lines of Business Presentation 49
Police Officers Retirement System
Retirement Benefit Example
$127,764 $129,681 $131,626
$115,961 $117,700 $119,466 $121,258 $123,077 $124,923 $126,797 $128,699 $130,629 $132,589 $134,577 $136,596
$0
$10,000
$20,000
$30,000
$40,000
$50,000
$60,000
$70,000
$80,000
$90,000
$100,000
$110,000
$120,000
$130,000
$140,000
$150,000
$160,000
2046 - Age55
2047 - Age56
2048 - Age57
2049 - Age58
2050 - Age59
2051 - Age60
2052 - Age61
2053 - Age62
2054 - Age63
2055 - Age64
2056 - Age65
2057 - Age66
2058 - Age67
2059 - Age68
2060 - Age69
An
nu
al S
alar
y/B
enef
it
Projected Retirement Benefit Based on Average New Hire
Salary Base Retirement Benefit Final Average Salary
Based on average FY 2016 O-Scale new hire as of March 2016. Does not include pension-eligible stipends or extra pay. Assumes 1.5% Market Rate Adjustments and full funding of pay plan each year. Assumes employee works two years after reaching eligibility for full retirement and retiree health benefits. Assumes 1.5% annual County COLA.
• New Hire in 2016 at Age 25, Hired at Step 3• Assume O-17 with no promotions• Retiring at age 58 in 2049 with 32 Years of Service
Initial Income Replacement Ratios (as % of Final Average Salary)Base Retirement Benefit – 89%TOTAL – 89%

EMPLOYEE COMPENSATION
County of Fairfax, VA – Lines of Business Presentation
Implemented for Police Officers and Uniformed Systems in October 2003. Added for Employees’ Retirement System in July 2005.
o Initially implemented with sunset provisions; provisions removed in October 2010.
Employees are eligible to enter DROP when eligible for normal service retirement
50
Overview of Program
Deferred Retirement Option Program (DROP)
DROP Participants (June 30, 2015)
Employees’ (County only)
496
Uniformed 116
Police Officers 81
Total 693
DROP period cannot exceed 3 yearso Average DROP stay by plan (since inception):
• Employees: 2.4 years
• Uniformed: 2.8 years
• Police Officers: 2.2 years
During DROP period:o Employees and the County do not make retirement
contributions
o Account balance is credited with 5% interest annually
o Members continue to receive all other active employee benefits
o Members do not earn additional service credits towards retirement

EMPLOYEE COMPENSATION
County of Fairfax, VA – Lines of Business Presentation
When implemented, employer contribution rates increased slightly (less than 1%)
o Salary base against which employer contribution was applied was reduced
The accrued monthly benefit that accumulates in a DROP account is exactly the same as the monthly annuity that would have been paid had the member retired
Investment earnings on DROP balances exceeding 5% remain in the systems
51
Cost
Deferred Retirement Option Program (DROP)

EMPLOYEE COMPENSATION
County of Fairfax, VA – Lines of Business Presentation 52
Funding Status of County Retirement PlansAssets/Liabilities as of June 30, 2015
Market Value of Assets$3,693.36
Unfunded Actuarial Accrued Liability
$1,286.30
Employees’ System
Total Pension Liability = $4,979.66 millionFunded Ratio = 74.2%
Market Value of Assets$1,280.92
Unfunded Actuarial Accrued Liability
$230.00
Police Officers System
Total Pension Liability = $1,510.92 millionFunded Ratio = 84.8%
Market Value of Assets$1,525.62
Unfunded Actuarial Accrued Liability
$358.06
Uniformed System
Total Pension Liability = $1,883.67 millionFunded Ratio = 81.0%
Goal is to reach a 90% funded status for all plans by FY 2025.
EMPLOYEE COMPENSATION
County of Fairfax, VA – Lines of Business Presentation
County has always made required annual contributions at rates determined by County policy
All employees contribute a percentage of their salaries
Actuarial Valuations performed annually
o Experience study performed by actuary every 5 years (next study is underway and will impact FY 2018 employer rates)
County uses conservative actuarial assumptions
o 15-year amortization period for unfunded liability
o 7.5% discount rate
Three Boards of Trustees
Professionally managed investment program
53
Background and Process
Retirement System Funding

EMPLOYEE COMPENSATION
County of Fairfax, VA – Lines of Business Presentation
8.8%
11.8%
10.5%
33.4%
25.4%
23.6%
57.7%
62.9%
65.9%
0% 10% 20% 30% 40% 50% 60% 70% 80% 90% 100%
Uniformed
Police Officers
Employees'
Sources of Funding (20-Year Average)
Employee Contributions Employer Contributions Investment Returns
54
Sources of Funding
Retirement System Funding
Systems are funded through a combination of Employee contributions, Employer contributions, and Investment Returns.

EMPLOYEE COMPENSATION
County of Fairfax, VA – Lines of Business Presentation
$15,153
$33,598$31,003
$3,525
$6,124$6,880
$0
$5,000
$10,000
$15,000
$20,000
$25,000
$30,000
$35,000
$40,000
Employees (S-Scale) Uniformed (F-Scale) Police Officers (O-Scale)
Employee/Employer Contributions based on Average Salaries
Employer Contribution Employee Contribution
55
Retirement Contribution RatesFY 2017 Employee and Employer contributions
Employee Employer
Employees’(Plan C/D)
4.00%/ 5.33%
22.91%
Uniformed(Plan E)
7.08% 38.84%
Police Officers(Plan B)
8.65% 38.98%
Contributions as % of Salary
Employee contribution rates rates are established in Code
Employer contribution rates are determined annually based on an actuarial review

EMPLOYEE COMPENSATION
County of Fairfax, VA – Lines of Business Presentation 56
Retirement Contribution RatesHow are Employer Rates determined?
Actuarial valuations are performed each year to determine rates
Employer Contribution Rates are made up of 4 components:
Employer Portion of
Normal Cost
Administrative Expense
Amortization of Unfunded Liability
Benefit Enhancements
TOTAL EMPLOYER
CONTRIBUTION RATE
• Costs associated with benefits accrued by active employees each year.
• The Normal Cost is most indicative of the overall value of the benefits.
• Small component to account for administrative expenses of the plan.
• A 15-year amortization of the UAAL (Unfunded Actuarial Accrued Liability). Currently, 97% of the UAAL is amortized. By 2020, 100% of the UAAL will be amortized and included in the rate.
• If a plan is 100% funded, this component is eliminated.
• Impact of benefit enhancements approved each year are included in rate (included in Normal Cost in subsequent years).
• If enhancements are applied to current retirees or towards accrued service of actives, any resulting UAAL must be fully funded when the enhancement is approved.
• Until a system reaches 100 percent funded status, employer contributions will not be reduced.
*Included in multi-year funding strategy approved as part of the adoption of the FY 2016 Budget and presented to bond rating agencies.
EMPLOYEE COMPENSATION
County of Fairfax, VA – Lines of Business Presentation 57
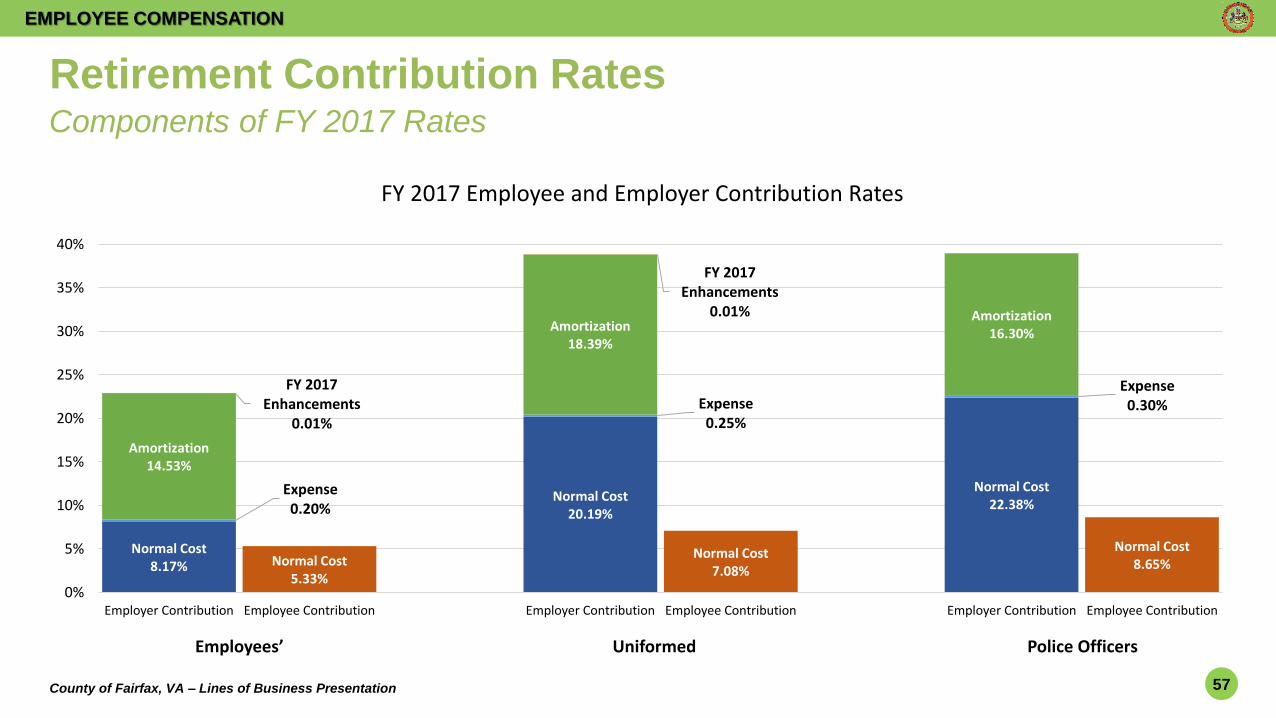
Retirement Contribution RatesComponents of FY 2017 Rates
Normal Cost8.17% Normal Cost
5.33%
Normal Cost20.19%
Normal Cost7.08%
Normal Cost22.38%
Normal Cost8.65%
Expense0.20%
Expense0.25%
Expense0.30%
Amortization14.53%
Amortization18.39%
Amortization16.30%
FY 2017 Enhancements
0.01%
FY 2017 Enhancements
0.01%
0%
5%
10%
15%
20%
25%
30%
35%
40%
Employer Contribution Employee Contribution Employer Contribution Employee Contribution Employer Contribution Employee Contribution
FY 2017 Employee and Employer Contribution Rates
Employees’ Uniformed Police Officers

EMPLOYEE COMPENSATION
County of Fairfax, VA – Lines of Business Presentation 58
Retirement Contribution RatesComponents of Rates when 100% Funded
Normal Cost (ER) 8.17%
Normal Cost (ER) 20.19%Normal Cost (ER) 22.38%
Expense (ER) 0.20%
Expense (ER) 0.25%
Expense (ER) 0.30%
Normal Cost (EE) 5.33%
Normal Cost (EE) 7.08%
Normal Cost (EE) 8.65%
0%
5%
10%
15%
20%
25%
30%
35%
Employees' Uniformed Police Officers
Employee and Employer Portions of Normal Cost and Expenses (Estimated)
39% Employee
61% Employer
26% Employee
74% Employer
28% Employee
72% Employer

EMPLOYEE COMPENSATION
County of Fairfax, VA – Lines of Business Presentation 59
Retirement Contribution Rates15-Year History of Rates
0%
5%
10%
15%
20%
25%
30%
35%
40%
FY 2002 FY 2003 FY 2004 FY 2005 FY 2006 FY 2007 FY 2008 FY 2009 FY 2010 FY 2011 FY 2012 FY 2013 FY 2014 FY 2015 FY 2016 FY 2017
Employer Contribution Rates (FY 2002-2017)
Employees' Uniformed Police Officers
Dotted Lines indicate rates without Benefit Enhancements
Impact of Great Recession
Amortization increased to 91% in FY 2011
Amortization increased to 97% in FY 2017
Amortization increased to 93% in FY 2015
Amortization increased to 95% in FY 2016

EMPLOYEE COMPENSATION
County of Fairfax, VA – Lines of Business Presentation 60
Retirement Contribution RatesWhy have rates increased?
FY 2002 Rate, 6.12%
FY 2002 Rate, 18.93%FY 2002 Rate, 21.79%
Valuations, 12.11%
Valuations, 5.12%Valuations, 2.33%
Amortization, 4.34%
Amortization, 7.04%Amortization, 8.70%
Enhancements, 0.34%
Enhancements, 7.75%Enhancements, 6.16%
0%
5%
10%
15%
20%
25%
30%
35%
40%
Employees' Uniformed Police Officers
Growth in Employer Contribution Rates since FY 2002
FY 2002 Rate Valuations Amortization Enhancements
Employer contribution rates have increased for several reasons:o Valuation Results –
Changes related to demographic changes (i.e. mortality rates, retirement rates) and investment results
o Amortization Adjustments – Increases in the portion of the Unfunded Liability amortized and included in the rates (in line with Bond Rating Agency recommendations)
o Benefit Enhancements –Increases in benefit levels

EMPLOYEE COMPENSATION
County of Fairfax, VA – Lines of Business Presentation
In FY 1996, 233 Health Department employees were converted from state to County employment.
These employees remained members of the Virginia Retirement System (VRS), and the County is required to pay employer contributions to VRS for retirement benefits provided to the converted employees.
The number of County employees who are VRS members has declined to approximately 40 as these employees terminate service with the County.
More than half of the remaining employees are eligible to retire, and many more are expected to become eligible over the next few years.
Virginia Retirement System (VRS)
61
52
47 46 44
40
0
5
10
15
20
25
30
35
40
45
50
55
FY 2013 FY 2014 FY 2015 FY 2016(est)
FY 2017(est)
Active County Employees Covered by VRS

EMPLOYEE COMPENSATION
County of Fairfax, VA – Lines of Business Presentation
FICA and Deferred Compensation
62
EMPLOYEE COMPENSATION
County of Fairfax, VA – Lines of Business Presentation
7.65%
1.45%
7.65%
1.45%
0%
2%
4%
6%
8%
10%
12%
14%
16%
All EmployeesExcept Police
Police Officers
FICA Tax Rates
Employer Employee
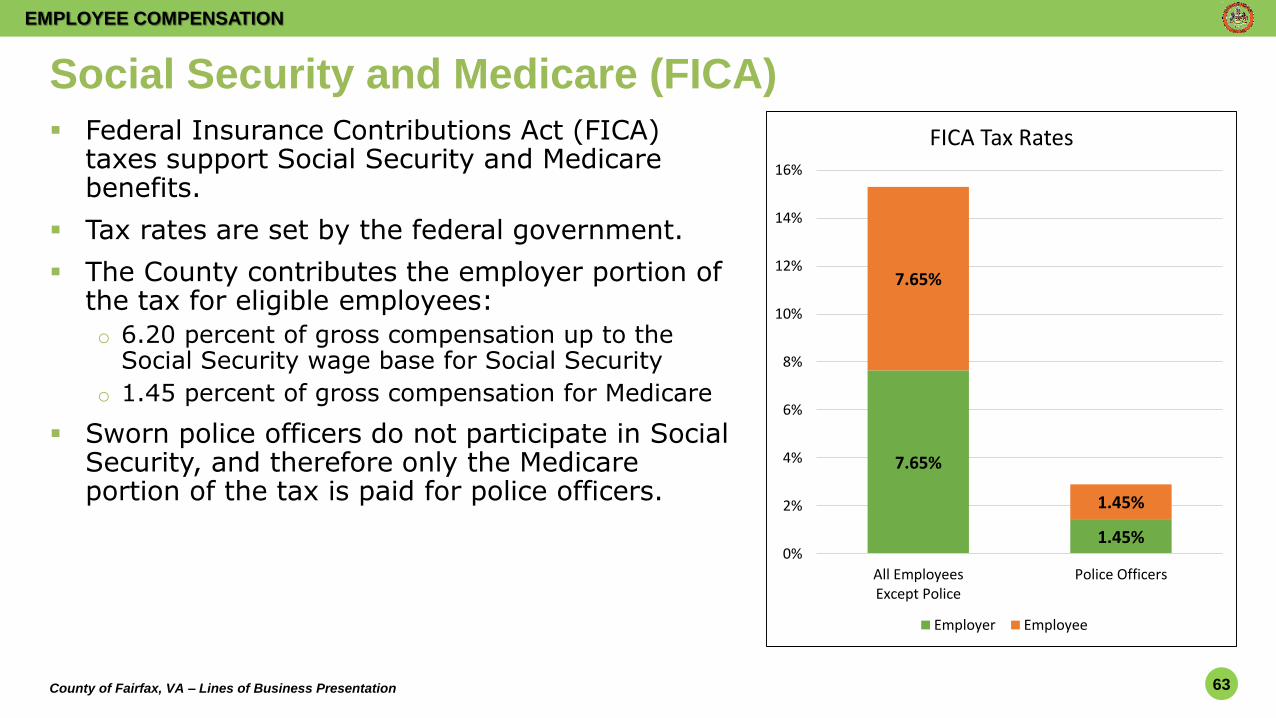
Social Security and Medicare (FICA)
63
Federal Insurance Contributions Act (FICA) taxes support Social Security and Medicare benefits.
Tax rates are set by the federal government.
The County contributes the employer portion of the tax for eligible employees:
o 6.20 percent of gross compensation up to the Social Security wage base for Social Security
o 1.45 percent of gross compensation for Medicare
Sworn police officers do not participate in Social Security, and therefore only the Medicare portion of the tax is paid for police officers.

EMPLOYEE COMPENSATION
County of Fairfax, VA – Lines of Business Presentation
$4
0.4
$4
1.2
$4
2.7
$4
3.3
$4
4.8
$0
$5
$10
$15
$20
$25
$30
$35
$40
$45
$50
FY 2011 FY 2012 FY 2013 FY 2014 FY 2015
Mill
ion
s
Social Security and Medicare (FICA)General Fund Employer Contributions
Looking Ahead: Social Security and Medicare (FICA)
64
While FICA tax rates have remained stable, total expenditures for this benefit category are increasing as a result of compensation adjustments.
Events such as weather emergencies can result in short-term spikes in FICA expenses due to emergency staffing.

EMPLOYEE COMPENSATION
County of Fairfax, VA – Lines of Business Presentation
Employees can save a portion of their wages for retirement on a pre- or post-tax basis.
No employer match is provided.
New employees are auto-enrolled:
o 1% initial contribution
o 1% annual auto-increase, up to 10%
Average contribution rate for participants is 8.5%
Total assets of $904.2 million as of 12/31/2015
Deferred Compensation
65
Contributing59.2%
Not Contributing
40.8%
Participationas of 12/31/2015

EMPLOYEE COMPENSATION
County of Fairfax, VA – Lines of Business Presentation
Retiree Health
66
EMPLOYEE COMPENSATION
County of Fairfax, VA – Lines of Business Presentation
Retirees may remain in the County health, vision and dental plans, but cannot re-enter the plans if they ever elect to terminate coverage.
Retirees must pay the full premium cost of their coverage.
Premium rates are set using the blended experience of actives and retirees, resulting in lower premiums for retirees than if they were set solely based on retiree experience. This is considered to be an “implicit subsidy” to retirees.
Retirees are required to apply for and maintain Medicare Parts A and B when they become eligible, and will then qualify for lower premiums since Medicare becomes the primary payer for claims.
Retiree Health Benefits
67

EMPLOYEE COMPENSATION
County of Fairfax, VA – Lines of Business Presentation
The Retiree Health Benefit Subsidy is provided to help eligible retirees pay for health insurance.
The subsidy is not indexed, and was last adjusted January 1, 2006.
The subsidy structure varies by length of service:
Retiree Health Benefit Subsidy
68
Years of Service at Retirement
Monthly Subsidy
5 to 9 $30
10 to 14 $65
15 to 19 $155
20 to 24 $190
25 or more $220

EMPLOYEE COMPENSATION
County of Fairfax, VA – Lines of Business Presentation
Employees experience a significant increase in the cost of health insurance upon retirement.
As retirees pay the full premium cost, premium increases have a greater impact on their costs.
Retiree Health Costs
69
$3
85
$3
19
$2
37
$2
80
$1
,32
1
$1
,05
4
$7
26 $9
01
$1
,15
6
$2
20
$9
56
$2
20
$7
10
$2
20
$8
40
$2
20
$0
$200
$400
$600
$800
$1,000
$1,200
$1,400
$1,600
Retiree Two-Party Monthly Premiums
Employee Retiree Employer
Co-pay 90% Coinsurance 80% Coinsurance HMO

EMPLOYEE COMPENSATION
County of Fairfax, VA – Lines of Business Presentation 70
Retiree Health
2012 Retirement Study Benchmarking
Age 61 with 21 years of service Age 65 with 25 years of service

EMPLOYEE COMPENSATION
County of Fairfax, VA – Lines of Business Presentation
The County is required under GASB 45 to accrue the costs of other post-employment benefits (OPEBs) during the period of employees’ active employment.
o Includes:
• Health Insurance
• Dental Insurance
• Vision Insurance
• Life Insurance
o This is similar to the accounting treatment for pensions.
The County accounts for its GASB 45 liability in Fund 73030, OPEB Trust.
A valuation is performed by an outside actuary each year to determine the County’s GASB 45 liability.
GASB 45 Liability
71

EMPLOYEE COMPENSATION
County of Fairfax, VA – Lines of Business Presentation
The County’s $317.6 million liability as of July 1, 2015 is the result of three benefits received by retirees:
o The Retiree Health Benefit Subsidy that is paid to retirees to offset health insurance costs;
o The medical implicit subsidy that results from premiums being set based on the blended experience of active employees and retirees; and
o The County contribution of half of the cost of basic life insurance coverage for retirees.
GASB 45 Liability
72
Assets$222.49
70%
Unfunded Liability$95.14
30%
GASB 45 Liability as of July 1, 2015(in $ millions)

EMPLOYEE COMPENSATION
County of Fairfax, VA – Lines of Business Presentation
The actuarial valuation is also used to determine the County’s Annual Required Contribution (ARC).
Fully funding the ARC each year demonstrates that the County is meeting its GASB 45 obligations. Similar to recent developments in pension reporting, future GASB rules will shift focus to the funded ratio.
The ARC is funded each year through the combination of a General Fund transfer and contributions from other funds. In addition, the County is given credit for an “implicit subsidy contribution” toward the ARC as a result of the blending of active and retiree premiums.
GASB 45 Liability
73
General Fund Transfer
Contributions from Other
Funds
Implicit Subsidy
Contribution
Annual Required
Contribution (ARC)

EMPLOYEE COMPENSATION
County of Fairfax, VA – Lines of Business Presentation
The County has made consistent progress toward funding its OPEB liabilities by funding the ARC each year.
The liability was significantly reduced as of the July 1, 2015 valuation as a result of the implementation of an Employer Group Waiver Plan (EGWP).
GASB 45 Liability – Funding Progress
74
14% 11% 12% 17% 20%33%
40% 70%
100% 86%89%
88% 83%80% 67%
60%
30%
$0
$100
$200
$300
$400
$500
$600
2007 2008 2009 2010 2011 2012 2013 2014 2015
Mill
ion
s
Assets and Unfunded Liability as of July 1
Assets Unfunded Liability

EMPLOYEE COMPENSATION
County of Fairfax, VA – Lines of Business Presentation
The County implemented an EGWP for Medicare retiree prescription drug coverage in January 2016.
o The EGWP is a standard Medicare Part D plan with enhanced coverage.
o Implementation of the plan was accomplished with minimal disruption to current retirees.
The EGWP has had a significant impact on the County’s GASB 45 liability.
o EGWP allows the County to maximize prescription drug subsidies from the federal government and pharmaceutical manufactures, which replace the Retiree Drug Subsidy (RDS) that the County previously received.
o GASB accounting rules allow EGWP revenue to directly offset plan costs in the actuarial valuation, whereas the RDS could not be reflected in the liability calculations.
The impact reflected in the July 1, 2015 valuation is based on projected cash flows prior to implementation of the plan. As such, fluctuation in the valuation results is expected over the next several years based on the plan’s actual experience.
As a result of the EGWP implementation, recurring savings of $10 million in the General Fund and $2 million in other County funds have been realized in the FY 2017 budget. In addition, one-time savings of $5 million were realized as part of the FY 2016 Third Quarter Review.
As part of the development of the FY 2018 budget, consideration will be given to using a portion of this savings to increase the Retiree Health Benefit Subsidy.
Employer Group Waiver Plan
75

EMPLOYEE COMPENSATION
County of Fairfax, VA – Lines of Business Presentation
Health care costs have historically outpaced inflation.
The healthcare market continues to evolve.
Future considerations could include:
o Introduction of lower-cost plans for retirees
o Options to better integrate with Medicare
o Public exchanges or individual market exchange if they are stable and viable
Impacts of the Cadillac Tax
Looking Ahead: Retiree Health Benefits
76

EMPLOYEE COMPENSATION
County of Fairfax, VA – Lines of Business Presentation 77
Employees’ System
2012 Retirement Study Benchmarking – Combined
Age 61 with 21 years of service, $65,000 salary Age 65 with 25 years of service, $65,000 salary

EMPLOYEE COMPENSATION
County of Fairfax, VA – Lines of Business Presentation 78
Uniformed System
2012 Retirement Study Benchmarking – Combined
Age 52 with 26 years of service, $90,000 salary

EMPLOYEE COMPENSATION
County of Fairfax, VA – Lines of Business Presentation 79
Police Officers System
2012 Retirement Study Benchmarking – Combined
Age 51 with 26 years of service, $90,000 salary

EMPLOYEE COMPENSATION
County of Fairfax, VA – Lines of Business Presentation
OTHER EMPLOYEE BENEFITS
80

EMPLOYEE COMPENSATION
County of Fairfax, VA – Lines of Business Presentation
Major categories include:
o Health Insurance
o Dental Insurance
o Life Insurance
o Line of Duty
o Employee Development
o Employee Leave
Over the past 10 years, non-retiree related Employee Benefits have grown, on average, 6.1% annually
Other Benefits Overview
81
General Fund Adopted Budget FY 2007 FY 2017% Annual Increase
Health Insurance $59.23 $106.66 6.1%
Dental Insurance $2.40 $4.15 5.6%
Life Insurance $1.91 $1.49 (2.4%)
Line of Duty $0.00 $1.25 --
Flexible Spending Accounts $0.00 $0.13 --
Unemployment Compensation $0.44 $0.18 (8.5%)
Capital Project Reimbursements ($1.29) ($0.98) (2.8%)
Employee Assistance Program* -- $0.25 --
Tuition Reimbursement* -- $0.36 --
Total Other Employee Benefits $62.69 $113.49 6.1%
* Classified as Operating Expenses in FY 2007
Other Employee Benefits (In $millions)
EMPLOYEE COMPENSATION
County of Fairfax, VA – Lines of Business Presentation
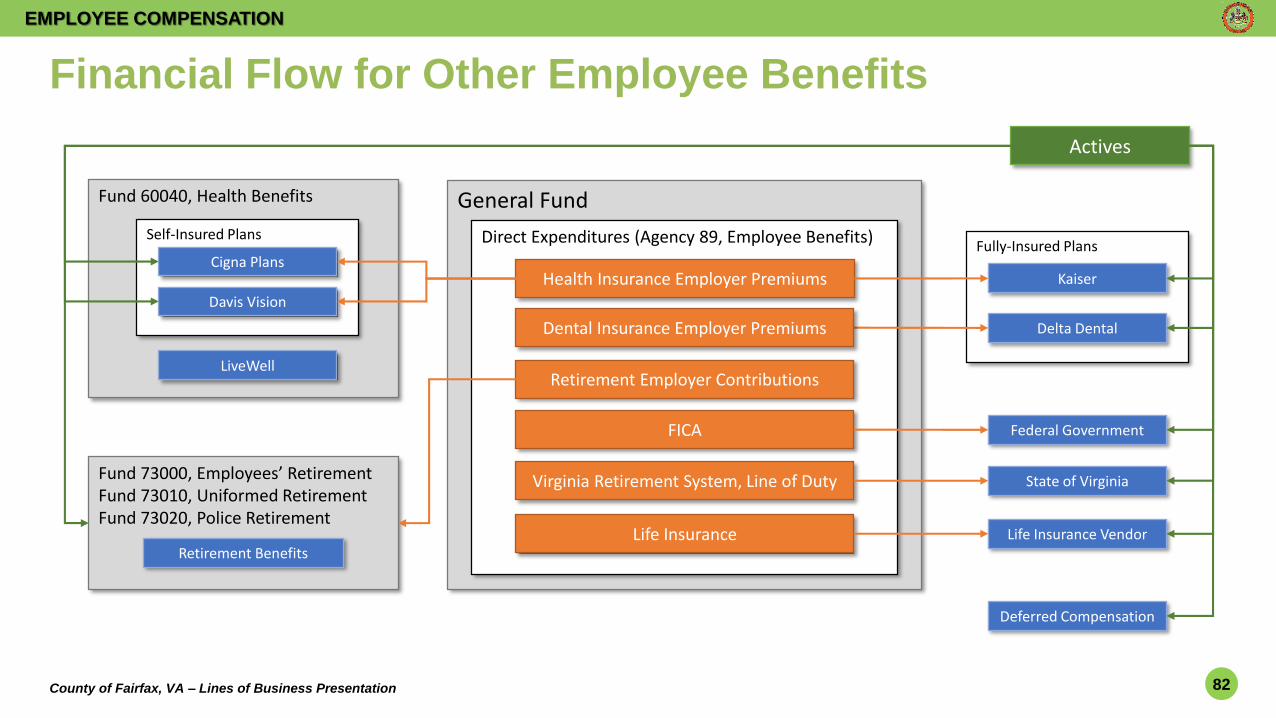
Financial Flow for Other Employee Benefits
82
General Fund
Direct Expenditures (Agency 89, Employee Benefits)
Health Insurance Employer Premiums
Fund 60040, Health Benefits
Self-Insured Plans
Cigna Plans
Davis Vision
LiveWell
Fully-Insured Plans
Kaiser
Delta DentalDental Insurance Employer Premiums
FICA Federal Government
State of Virginia
Life Insurance Vendor
Virginia Retirement System, Line of Duty
Life Insurance
Deferred Compensation
Actives
Retirement Employer Contributions
Fund 73000, Employees’ RetirementFund 73010, Uniformed RetirementFund 73020, Police Retirement
Retirement Benefits

EMPLOYEE COMPENSATION
County of Fairfax, VA – Lines of Business Presentation
Health Insurance
83

EMPLOYEE COMPENSATION
County of Fairfax, VA – Lines of Business Presentation
KaiserHealth Maintenance Organization (HMO)
Open Access Plus Co-Pay Plan
Open Access Plus 90% Co-Insurance
Plan
Open Access Plus 80% Co-Insurance
Plan
MyChoiceConsumer-Directed Health Plan (CDHP)
Primary Care Physician Visit
$10 copay $25 copay90% coinsurance after
deductible80% coinsurance after
deductible90% coinsurance after
deductible
Specialty Care $10 copay $50 copay90% coinsurance after
deductible80% coinsurance after
deductible90% coinsurance after
deductible
Annual Deductible $0 $0$100 Individual
$200 Family$250 Individual
$500 Family$1,300 Individual
$2,600 Family
Annual Out-of-PocketMaximum
$3,500 Individual$9,400 Family
$2,000 Individual$4,000 Family
$1,500 Individual$3,000 Family
$2,000 Individual$4,000 Family
$4,000 Individual$8,000 Family
Employer HSA Contribution
n/a n/a n/a n/a$520 Individual$1,040 Family
Employee Share ofBi-Weekly Premium
$39.81 Individual$129.30 2-Party$192.35 Family
$54.71 Individual$177.81 2-Party$265.32 Family
$44.89 Individual$147.05 2-Party$216.25 Family
$33.60 Individual$109.20 2-Party$162.97 Family
$31.93 Individual$103.79 2-Party$154.88 Family
Participants1,993 Actives288 Retirees
6,372 Actives1,774 Retirees
1,322 Actives869 Retirees
831 Actives881 Retirees
281 Actives0 Retirees
84
Plan Design
Health Insurance
* All benefits shown reflect in-network coverage. Participant out-of-pocket expenses are generally higher for services from out-of-network providers. HMO does not cover services from out-of-network providers.

EMPLOYEE COMPENSATION
County of Fairfax, VA – Lines of Business Presentation
In-Network Office Visit CopaysER CopaysPrimary Care Specialist
Fairfax County Government 10%-20% after ded; $25 10%-20% after ded; $50 10%-20% after ded; $200Anne Arundel County Government $15 Preferred/$25 IN $35 Preferred/$50 IN $75Anne Arundel County Public Schools $10-15 $15 $25-50Baltimore City Government $5-$25 $5-$40 10% after ded; $50Baltimore County Government $15 $25 $50City of Alexandria $15 $25 $150 DC Government $15 $30 $100Fairfax County Public Schools $20 after ded $20-$40 after ded $150 then 10%Howard County Government $20 + 10% coins $20 + 10% coins $100 + 10% coinsLoudoun County Government $20 $35 $150Montgomery County Government $10-$15 $10-$30 $25-$35Montgomery County Public Schools $10-$15 $15-$20 $100Prince George’s County Government $30 $35 $150Prince George's County Public Schools $20 $30 $75
85
Plan Design Benchmarking – PPO/POS
Health Insurance
Source: Aon Hewitt, 2016

EMPLOYEE COMPENSATION
County of Fairfax, VA – Lines of Business Presentation
Rx Drug Copays (Retail)Generic Preferred Non-Preferred
Fairfax County Government $7 20% coins (maximum $50) 30% coins (maximum $100)Anne Arundel County Government $5 $25 $35Anne Arundel County Public Schools $5 $15 $25Baltimore City Government $5-$15 $20-$30 $30-$50Baltimore County Government $12 $30 $45City of Alexandria $15 $30 $50 DC Government $10 $20 $40Fairfax County Public Schools $7 20% coins (maximum $50) 20% coins (maximum $50)Howard County Government $10 $30 $50Loudoun County Government $7 $28 $50Montgomery County Government $4-$10 $4-$20 $8-$35Montgomery County Public Schools $5 $20 $35Prince George’s County Government $10 20% coins ($20 min/$50 max) 30% coins ($40 min/$50 max)Prince George's County Public Schools $5 $20 $35
86
Plan Design Benchmarking – PPO/POS
Health Insurance
Source: Aon Hewitt, 2016

EMPLOYEE COMPENSATION
County of Fairfax, VA – Lines of Business Presentation
Total claims in the self-insured plans have increased in all but one of the past ten years.
o FY 2013 claims growth was flat as a result of brand-name prescription drugs coming off patent.
Claims can be controlled in the long-term by:
o Reducing total health expenditures
• Healthier covered population
• More informed consumers
o Increasing out-of-pocket expenses
• Higher copays, coinsurance, and deductibles
87
Claims Growth
Health Insurance
$5
6.7 $
70
.1
$8
6.4 $9
5.3
$1
05
.0 $1
19
.3 $1
32
.9
$1
32
.8 $1
48
.6
$1
57
.9
$0
$20
$40
$60
$80
$100
$120
$140
$160
$180
FY2006
FY2007
FY2008
FY2009
FY2010
FY2011
FY2012
FY2013
FY2014
FY2015
Mill
ion
s
Total Claimsin Self-Insured Health Plans

EMPLOYEE COMPENSATION
County of Fairfax, VA – Lines of Business Presentation
3.8%
23.6% 23.2%
10.4% 10.1%
13.6%
11.4%
-0.1%
11.9%
6.2%
-5.0%
0.0%
5.0%
10.0%
15.0%
20.0%
25.0%
-$5
$0
$5
$10
$15
$20
$25
FY2006
FY2007
FY2008
FY2009
FY2010
FY2011
FY2012
FY2013
FY2014
FY2015
Mill
ion
s
Change in Total Claims over Prior Year in Self-Insured Health Plans
Claims Growth ($) Claims Growth (%)
88
Claims Growth
Health Insurance
The year-over-year increase in claims has fluctuated greatly.
o Range from (0.01%) to 23.6%
o Single year increases up to $16.3 million
EMPLOYEE COMPENSATION
County of Fairfax, VA – Lines of Business Presentation
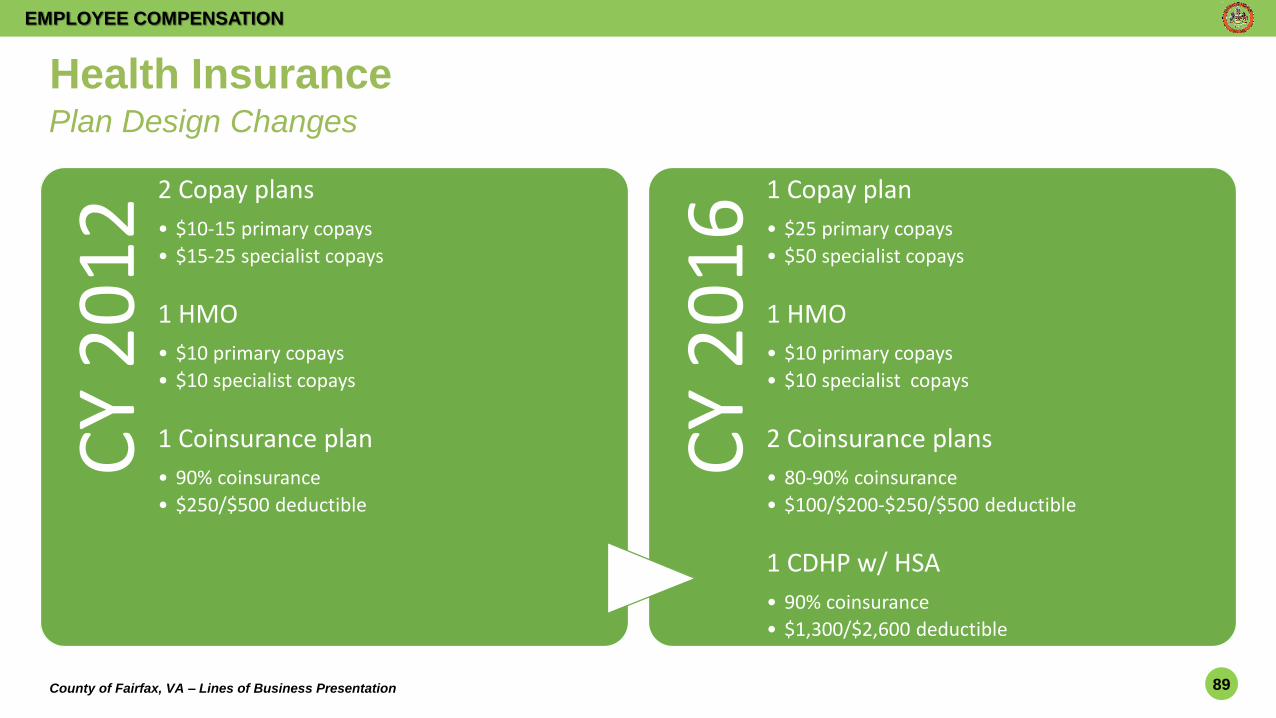
CY
20
12 2 Copay plans
• $10-15 primary copays
• $15-25 specialist copays
1 HMO
• $10 primary copays
• $10 specialist copays
1 Coinsurance plan
• 90% coinsurance
• $250/$500 deductible
CY
20
16 1 Copay plan
• $25 primary copays
• $50 specialist copays
1 HMO
• $10 primary copays
• $10 specialist copays
2 Coinsurance plans
• 80-90% coinsurance
• $100/$200-$250/$500 deductible
1 CDHP w/ HSA
• 90% coinsurance
• $1,300/$2,600 deductible
89
Plan Design Changes
Health Insurance
EMPLOYEE COMPENSATION
County of Fairfax, VA – Lines of Business Presentation
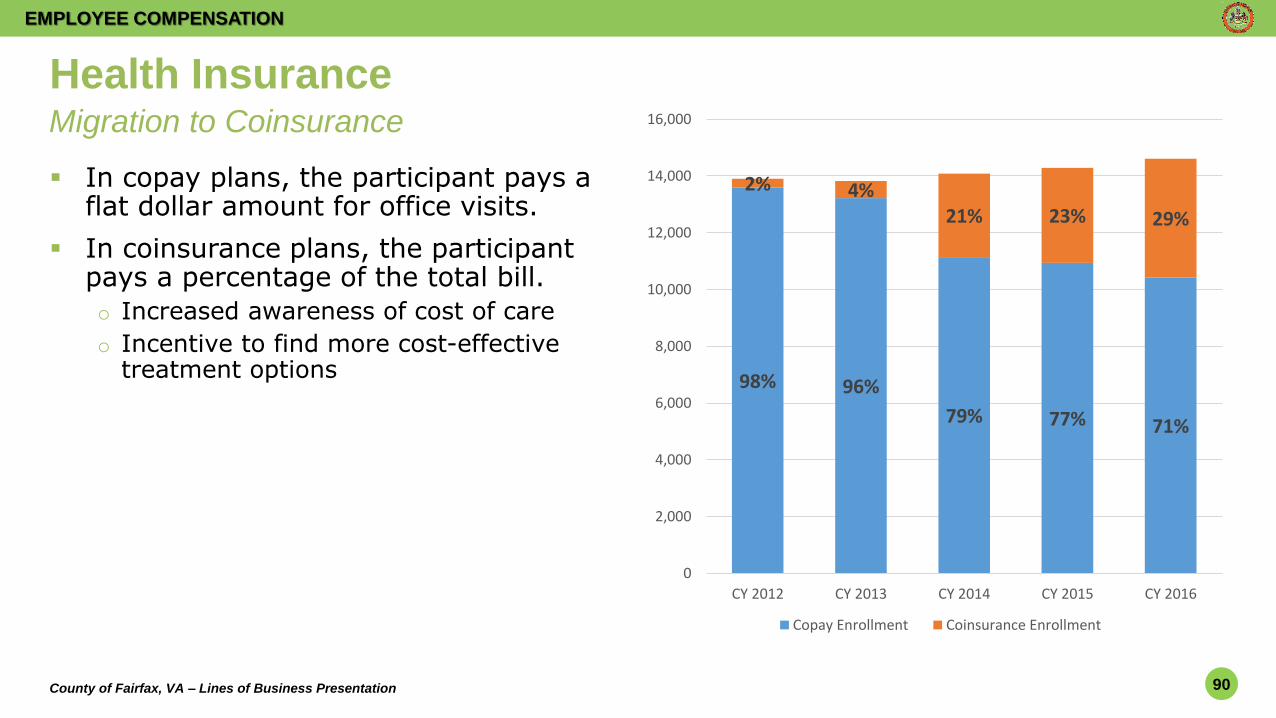
98% 96%
79% 77% 71%
2% 4%21% 23% 29%
0
2,000
4,000
6,000
8,000
10,000
12,000
14,000
16,000
CY 2012 CY 2013 CY 2014 CY 2015 CY 2016
Copay Enrollment Coinsurance Enrollment
90
Migration to Coinsurance
Health Insurance
In copay plans, the participant pays a flat dollar amount for office visits.
In coinsurance plans, the participant pays a percentage of the total bill.
o Increased awareness of cost of care
o Incentive to find more cost-effective treatment options

EMPLOYEE COMPENSATION
County of Fairfax, VA – Lines of Business Presentation
$0
$5,000
$10,000
$15,000
$20,000
$25,000
$30,000
Cig
na
OA
P 8
0%
Co
insu
ran
ce
Ka
iser
HM
O
Cig
na
OA
P 9
0%
Co
insu
ran
ce
Cig
na
OA
P C
op
ay
Ka
iser
DH
MO
UH
C C
ho
ice
EP
O
Ka
iser
HM
O
UH
C C
ho
ice
Plu
s P
OS
Ka
iser
Co
pa
y
Cig
na
OA
P-I
N C
oin
sura
nce
Cig
na
OA
P-I
N C
op
ay
Cig
na
OA
P C
oin
sura
nce
Ca
reFi
rst
Ka
iser
Aet
na
/In
no
vati
on
Hea
lth
Cig
na
Ch
oic
e H
SA
/H
RA
OA
P P
lan
PO
S P
lan
Ka
iser
wit
h P
resc
rip
tio
n C
ove
rage
)
UH
C &
Ca
rem
ark
Sta
nd
ard
Op
tio
n
Ca
reFi
rst
& C
are
ma
rk H
igh
$5
/$
10
Ca
reFi
rst
PO
S H
igh
& C
are
ma
rk
Hig
h $
4/
$8
Cig
na
HM
O +
Pre
scri
pti
on
Ka
iser
+ P
resc
rip
tio
n
Cig
na
PP
O +
Pre
scri
pti
on
An
them
-Hea
lth
keep
ers
PO
S
An
them
-Key
care
PP
O C
ore
An
them
-Key
care
PP
O E
nh
an
ced
Ka
iser
HM
O (C
lose
d)
FAIRFAX Alexandria Arlington FCPS Loudoun Montgomery Prince George's Prince William
Total Premium Costs - Family Coverage (Plan Year 2015)
Average Non-Fairfax Total
91
Comparison of Total Premium Costs to Other Jurisdictions
Health Insurance
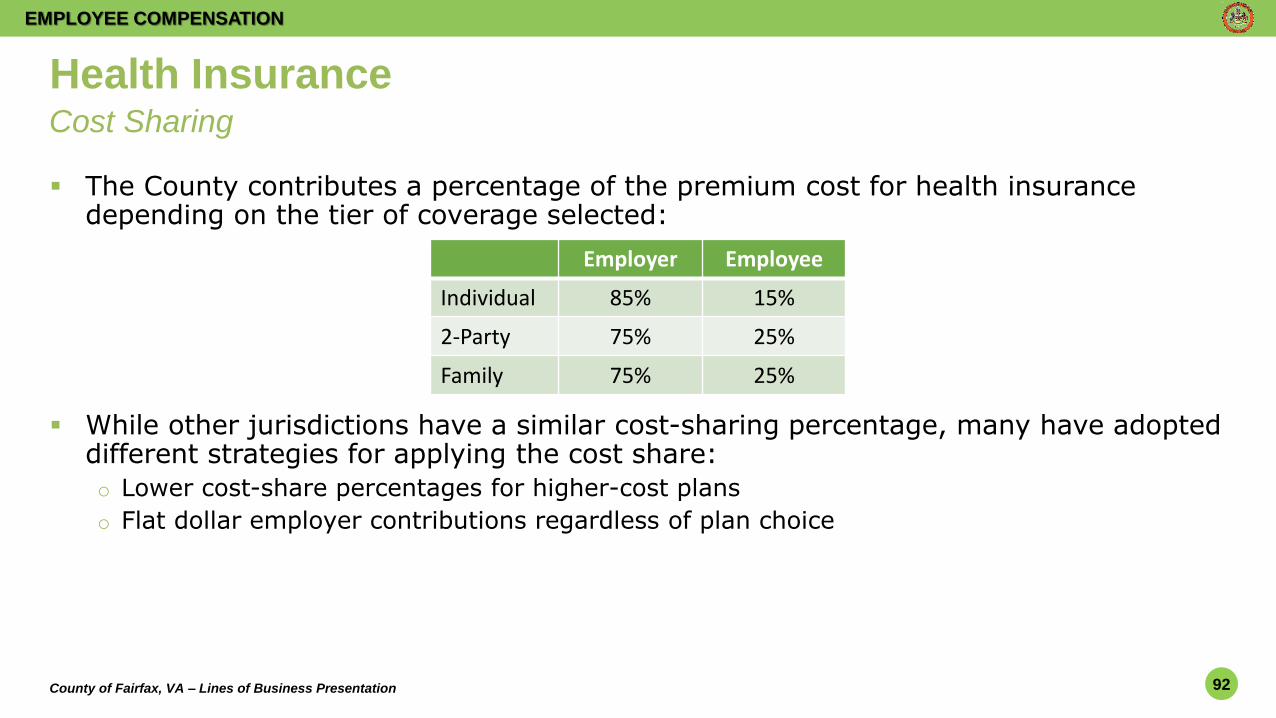
EMPLOYEE COMPENSATION
County of Fairfax, VA – Lines of Business Presentation
The County contributes a percentage of the premium cost for health insurance depending on the tier of coverage selected:
While other jurisdictions have a similar cost-sharing percentage, many have adopted different strategies for applying the cost share:
o Lower cost-share percentages for higher-cost plans
o Flat dollar employer contributions regardless of plan choice
92
Cost Sharing
Health Insurance
Employer Employee
Individual 85% 15%
2-Party 75% 25%
Family 75% 25%

EMPLOYEE COMPENSATION
County of Fairfax, VA – Lines of Business Presentation
30%
40%
50%
60%
70%
80%
90%
Cig
na
OA
P 8
0%
Co
insu
ran
ce
Ka
iser
HM
O
Cig
na
OA
P 9
0%
Co
insu
ran
ce
Cig
na
OA
P C
op
ay
Ka
iser
DH
MO
UH
C C
ho
ice
EP
O
Ka
iser
HM
O
UH
C C
ho
ice
Plu
s P
OS
Ka
iser
Co
pa
y
Cig
na
OA
P-I
N C
oin
sura
nce
Cig
na
OA
P-I
N C
op
ay
Cig
na
OA
P C
oin
sura
nce
Ca
reFi
rst
Ka
iser
Aet
na
/In
no
vati
on
Hea
lth
Cig
na
Ch
oic
e H
SA
/H
RA
OA
P P
lan
PO
S P
lan
Ka
iser
wit
h P
resc
rip
tio
n C
ove
rage
)
UH
C &
Ca
rem
ark
Sta
nd
ard
Op
tio
n
Ca
reFi
rst
& C
are
ma
rk H
igh
$5
/$
10
Ca
reFi
rst
PO
S H
igh
& C
are
ma
rk
Hig
h $
4/
$8
Cig
na
HM
O +
Pre
scri
pti
on
Ka
iser
+ P
resc
rip
tio
n
Cig
na
PP
O +
Pre
scri
pti
on
An
them
-Hea
lth
keep
ers
PO
S
An
them
-Key
care
PP
O C
ore
An
them
-Key
care
PP
O E
nh
an
ced
Ka
iser
HM
O (C
lose
d)
FAIRFAX Alexandria Arlington FCPS Loudoun Montgomery Prince George's Prince William
Employer Paid Share of Premiums - Family Coverage (Plan Year 2015)
Average Non-Fairfax ER Share
93
Comparison of Cost Sharing Percentages to Other Jurisdictions
Health Insurance

EMPLOYEE COMPENSATION
County of Fairfax, VA – Lines of Business Presentation
$0
$5,000
$10,000
$15,000
$20,000
$25,000
Cig
na
OA
P 8
0%
Co
insu
ran
ce
Ka
iser
HM
O
Cig
na
OA
P 9
0%
Co
insu
ran
ce
Cig
na
OA
P C
op
ay
Ka
iser
DH
MO
UH
C C
ho
ice
EP
O
Ka
iser
HM
O
UH
C C
ho
ice
Plu
s P
OS
Ka
iser
Co
pa
y
Cig
na
OA
P-I
N C
oin
sura
nce
Cig
na
OA
P-I
N C
op
ay
Cig
na
OA
P C
oin
sura
nce
Ca
reFi
rst
Ka
iser
Aet
na
/In
no
vati
on
Hea
lth
Cig
na
Ch
oic
e H
SA
/H
RA
OA
P P
lan
PO
S P
lan
Ka
iser
wit
h P
resc
rip
tio
n C
ove
rage
)
UH
C &
Ca
rem
ark
Sta
nd
ard
Op
tio
n
Ca
reFi
rst
& C
are
ma
rk H
igh
$5
/$
10
Ca
reFi
rst
PO
S H
igh
& C
are
ma
rk
Hig
h $
4/
$8
Cig
na
HM
O +
Pre
scri
pti
on
Ka
iser
+ P
resc
rip
tio
n
Cig
na
PP
O +
Pre
scri
pti
on
An
them
-Hea
lth
keep
ers
PO
S
An
them
-Key
care
PP
O C
ore
An
them
-Key
care
PP
O E
nh
an
ced
Ka
iser
HM
O (C
lose
d)
FAIRFAX Alexandria Arlington FCPS Loudoun Montgomery Prince George's Prince William
Total Employer Paid Premiums - Family Coverage (Plan Year 2015)
Average Non-Fairfax Employer
94
Comparison of Employer Premium Costs to Other Jurisdictions
Health Insurance

EMPLOYEE COMPENSATION
County of Fairfax, VA – Lines of Business Presentation
The County self-insures all of its health plans except for the HMO.
o Allows the County to set premiums
o The County is ultimately responsible for plan liabilities
The self-insured plans are managed through Fund 60040, Health Benefits.
Adequate reserves are critical to ensuring that the County is not adversely impacted by unexpectedly high claims:
o Unreserved Ending Balance
o Premium Stabilization Reserve
95
Self-Insurance
Health Insurance

EMPLOYEE COMPENSATION
County of Fairfax, VA – Lines of Business Presentation
The Unreserved Ending Balance has a targeted balance equal to two months, or 16.7 percent, of claims.
A portion of the Unreserved Ending Balance was used in FY 2012, when higher than anticipated claims growth caused the balance to decline to 14.3 percent. The reserve returned to its 16.7 percent target in FY 2013.
96
Unreserved Ending Balance
Health Insurance
16
.7%
16
.7%
16
.7%
14
.3%
16
.7%
16
.7%
16
.7%
$0
$5
$10
$15
$20
$25
$30
FY 2009 FY 2010 FY 2011 FY 2012 FY 2013 FY 2014 FY 2015
Mill
ion
s

EMPLOYEE COMPENSATION
County of Fairfax, VA – Lines of Business Presentation
The Premium Stabilization Reserve was created in FY 2005 to mitigate the impact of unanticipated cost increases.
The reserve allows the County to absorb large swings in claims growth without resorting to dramatic premium increases in a single year. The reserve is funded by excess revenues in years when total revenues from the self-insured plans exceed expenses.
The reserve was tapped in FY 2007 and FY 2009 to allow premiums to be held flat despite rising claims expenses. Additional funds were used from the reserve through FY 2012, when the reserve was depleted as a result of higher than anticipated claims growth.
Lower than anticipated claims in FY 2013 resulted in a replenishment of the reserve.
97
Premium Stabilization Reserve
Health Insurance
13
.0%
9.5
%
4.6
%
11
.7%
11
.1%
12
.2%
$0
$5
$10
$15
$20
$25
FY 2009 FY 2010 FY 2011 FY 2012 FY 2013 FY 2014 FY 2015
Mill
ion
s

EMPLOYEE COMPENSATION
County of Fairfax, VA – Lines of Business Presentation
Premium revenue covers plan expenditures
Increases are not overly burdensome to plan participants
Plan designs are responsive to participant needs
Plan design adjustments change behavior to better control cost
Premiums are set at a level that does not substantially increase the GASB 45 liability
Reserves are maintained at adequate levels
98
Premium Setting and Plan Design Goals
Health Insurance

EMPLOYEE COMPENSATION
County of Fairfax, VA – Lines of Business Presentation
CY 2017 Premium Setting Calendar
99
Jan Feb Mar Apr May June July Aug Sept Oct Nov
Premium estimates developed for Advertised Budget
Dec
20
15
Jan Feb
PublishAdvert. Budget
Mar Apr
Board adopts budget
May June July
Premium and plan design discussions/decisions
Aug Sept Oct
Open enroll-ment
Nov Dec
20
16
Jan
Plan year begins
Feb Mar Apr May June July Aug Sept Oct Nov Dec
20
17
FY 2017
FY 2017
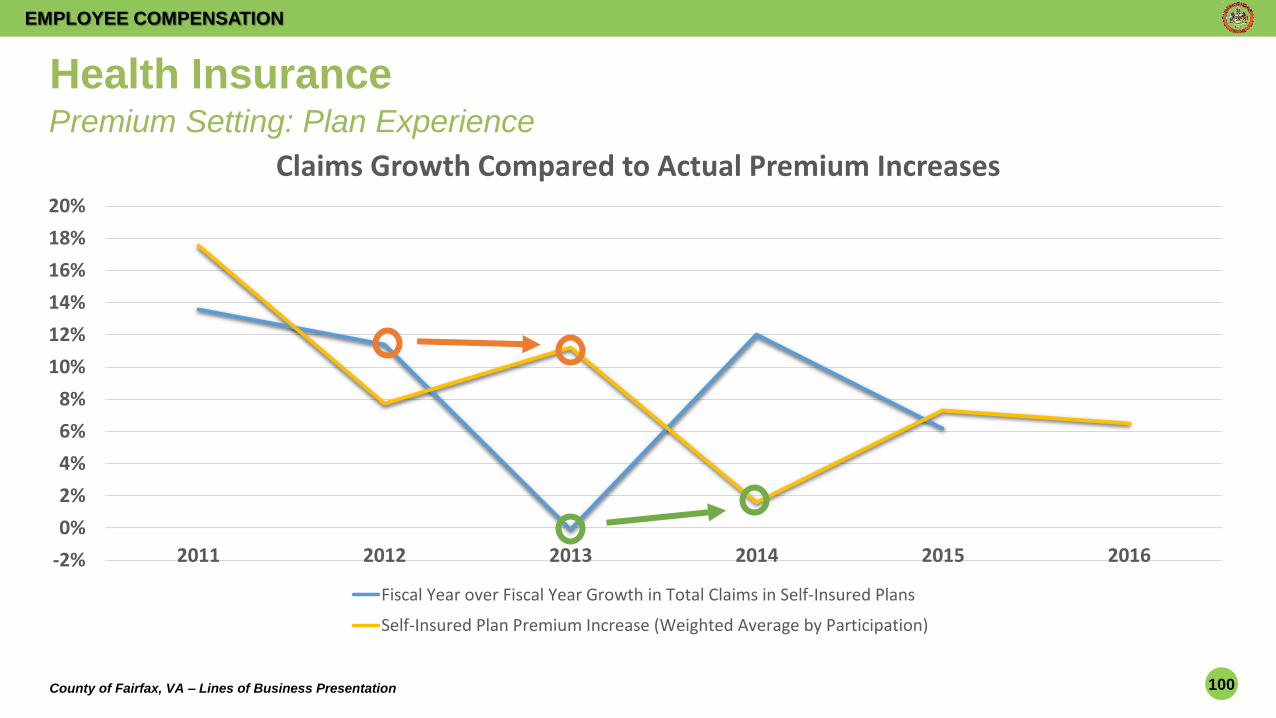
EMPLOYEE COMPENSATION
County of Fairfax, VA – Lines of Business Presentation
-2%
0%
2%
4%
6%
8%
10%
12%
14%
16%
18%
20%
2011 2012 2013 2014 2015 2016
Claims Growth Compared to Actual Premium Increases
Fiscal Year over Fiscal Year Growth in Total Claims in Self-Insured Plans
Self-Insured Plan Premium Increase (Weighted Average by Participation)
100
Premium Setting: Plan Experience
Health Insurance

EMPLOYEE COMPENSATION
County of Fairfax, VA – Lines of Business Presentation
National and regional trends
Plan design recommendations
101
Premium Setting and Plan Design
Health Insurance
Premium and Plan Design Decisions
Plan Experience
Plan Vendor Input
Analysis by Benefit
Consultant
Available Reserves
GASB 45 Impact
Impact on Employees
and Retirees
National and regional trends
Plan design recommendations
Valuation of plan design changes
Review of actuarial value of plans
Overall fund performance
Individual plan performance
Retiree premiums are linked to the GASB 45 liability
Reserves are one-time sources of funding
Compensation Adjustments
Employee Group Feedback

EMPLOYEE COMPENSATION
County of Fairfax, VA – Lines of Business Presentation
Patient-Centered Outcomes Research Institute (PCORI) Fee
o PCORI funds patient-centered comparative clinical effectiveness research.
o The PCORI fee was $2 per covered life in plan year 2013, with increases each year to reflect inflation until the fee ends in plan year 2018.
Transitional Reinsurance Fee
o The Transitional Reinsurance Program reduces the impact of adverse selection on the individual market during the first few years following its implementation
o The fee is imposed for three years, beginning with plan year 2014 and ending in plan year 2016.
o The fee was $63 per member in plan year 2014, $44 in plan year 2015, and $27 in plan year 2016.
Fees are paid from the Health Benefits Fund and were pre-funded with one-time GF transfers in FY 2014 and FY 2015
102
Patient Protection and Affordable Care Act (PPACA) Fees
Health Insurance
$0
$100
$200
$300
$400
$500
$600
$700
$800
$900
$1,000
FY 2014 FY 2015 FY 2016 FY 2017(est)
FY 2018(est)
FY 2019(est)
Tho
usa
nd
s
PPACA Fees
Transitional Reinsurance PCORI

EMPLOYEE COMPENSATION
County of Fairfax, VA – Lines of Business Presentation
40 percent tax on the cost of coverage that exceeds thresholds:
o $10,200 for individual coverage
o $27,500 for two-party and family coverage
Thresholds are indexed to CPI, instead of medical inflation
Excise tax is based on total plan cost, not just the employer portion
103
Excise Tax (“Cadillac Tax”) on High-Cost Health Plans
Health Insurance
Subject to Tax
Pla
n C
ost
Years

EMPLOYEE COMPENSATION
County of Fairfax, VA – Lines of Business Presentation
Uncertainties
o Delayed from 2018 to 2020
o More guidance as 2020 approaches
o Impact of election
Focus on incremental progress toward reducing/delaying impact through plan design changes
104
Excise Tax (“Cadillac Tax”) on High-Cost Health Plans
Health Insurance
Year
Excise Tax(prior to 2016 plan
changes)
Excise Tax(current projection)
2020 $0 $0
2021 $170,800 $0
2022 $1,110,400 $772,900
2023 $5,361,200 $3,813,100
2024 $10,334,100 $8,083,200
2025 $15,834,900 $12,968,900

EMPLOYEE COMPENSATION
County of Fairfax, VA – Lines of Business Presentation
Continue focus on consumerism to control costs and reduce excise tax exposure
o Encourage migration to coinsurance plans
o Increase participation in CDHP
Plan design adjustments to steer behavior
Enhance members’ focus on wellness
Looking Ahead: Health Insurance
105

EMPLOYEE COMPENSATION
County of Fairfax, VA – Lines of Business Presentation
Vision, Dental, Life and Long-Term Disability Insurance
106

EMPLOYEE COMPENSATION
County of Fairfax, VA – Lines of Business Presentation
Enrollment in vision insurance is automatic for employees that enroll in County health insurance.
Premiums are included in the health insurance premium rates.
Plan benefits include:
o $15 copay for annual in-network eye examinations
o Partial coverage of eyeglasses or contact lenses
Vision Insurance
107

EMPLOYEE COMPENSATION
County of Fairfax, VA – Lines of Business Presentation
Dental insurance is offered to County employees and retirees through a two-tiered preferred provider organization (PPO) plan with a nationwide network.
The County contributes 50 percent of the premium for all eligible active employees that elect dental coverage.
There is no employer contribution for retiree coverage.
Dental Insurance
108
PPO PremierOut of
Network
Annual Deductible $50 $50 $50
Annual Benefit Maximum $2,000 $2,000 $2,000
Orthodontic Lifetime Maximum $2,000 $2,000 $2,000
Diagnostic and Preventive Care 100% 100% 80%
Basic Dental Care 90% 80% 80%
Other Dental Care 60% 50% 50%
Orthodontic Benefits 50% 50% 35%

EMPLOYEE COMPENSATION
County of Fairfax, VA – Lines of Business Presentation
Dental Insurance
109
50%75% 70%
70%
75% 75%
75%50% 36%
50%
100%
100%
25%30%
30%
25%25%
25%
100%
100%
50%
64%
$0
$200
$400
$600
$800
$1,000
$1,200
$1,400
$1,600
$1,800
Del
ta D
enta
l
Aet
na
Den
tal
DH
MO
Aet
na
Den
tal
DP
PO
Del
ta D
enta
l
Aet
na
DP
PO
Aet
na
DM
O
Den
tal a
nd
Vis
ion
Un
ited
Co
nd
ord
iaD
enta
l PP
O
Un
ited
Co
nd
ord
iaD
enta
l DH
MO
Aet
na
DM
O
Aet
na
PP
O
Del
ta D
enta
lC
ore
Del
ta D
enta
lEn
han
ced
Fairfax Alexandria Arlington FCPS Loudoun Montgomery Prince George's Prince William
Dental Insurance Annual PremiumsFamily Coverage, Plan Year 2015
Employer Employee
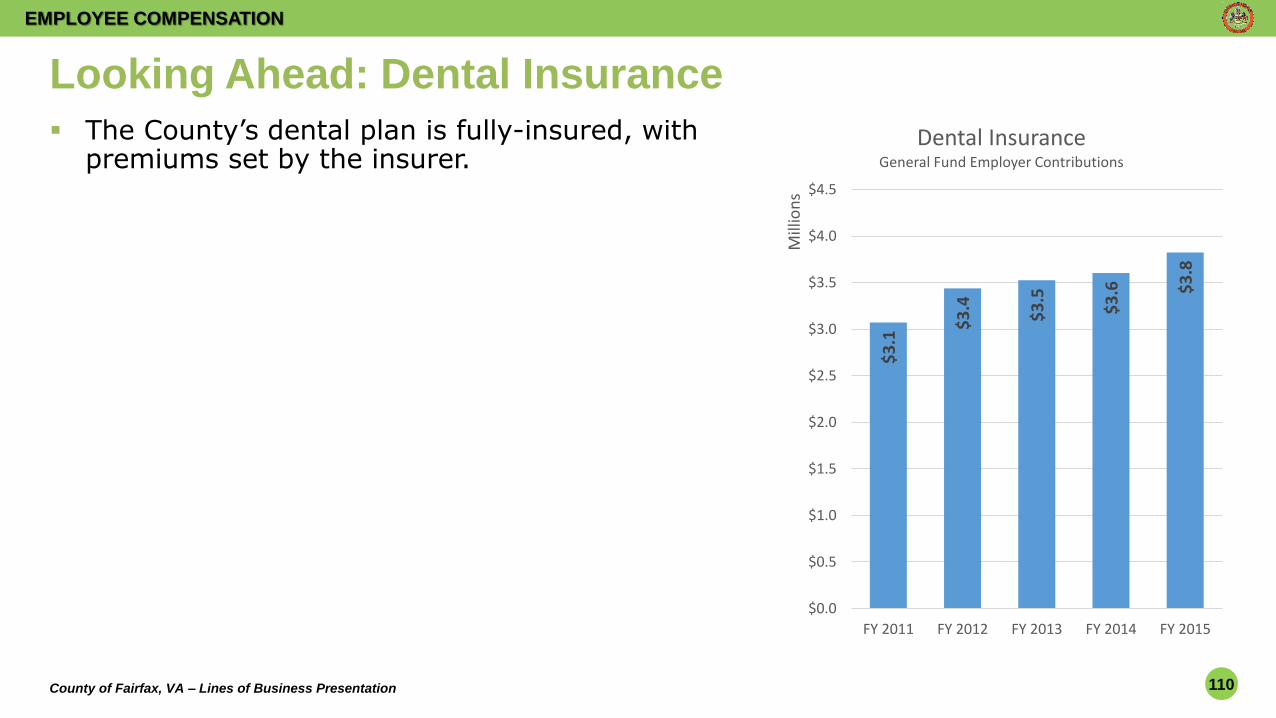
EMPLOYEE COMPENSATION
County of Fairfax, VA – Lines of Business Presentation
The County’s dental plan is fully-insured, with premiums set by the insurer.
Looking Ahead: Dental Insurance
110
$3
.1
$3
.4
$3
.5
$3
.6 $3
.8
$0.0
$0.5
$1.0
$1.5
$2.0
$2.5
$3.0
$3.5
$4.0
$4.5
FY 2011 FY 2012 FY 2013 FY 2014 FY 2015
Mill
ion
s
Dental InsuranceGeneral Fund Employer Contributions

EMPLOYEE COMPENSATION
County of Fairfax, VA – Lines of Business Presentation
Basic group life insurance coverage at a rate of one times salary for all County merit employees is funded solely through an employer contribution.
Employees may elect to purchase optional coverage up to an additional four times salary, as well as spouse and dependent coverage. Employees are responsible for the cost of any optional coverage based on an age-banded premium rating scale.
Retirees can continue coverage with an employer contribution equal to half of the cost of basic coverage.
Life Insurance
111
1x
1x
1x 2
x
2x
2x
2x
0 t
o 4
x
0 t
o 2
x 0 t
o 5
x
0 t
o 4
x
0 t
o 4
x
0 t
o 4
x
0 t
o 4
x
0
1
2
3
4
5
6
7
Fairfax County Alexandria Arlington FCPS Loudoun Prince George's Prince William
Life Insurance BenefitsMultiples of Salary by Funding Source
Basic (Employer Funded) Optional (Employee Funded)

EMPLOYEE COMPENSATION
County of Fairfax, VA – Lines of Business Presentation
Voluntary long-term disability insurance is available to employees with the employee paying the full cost.
Premiums are based on age and salary.
In the event of an accident or extended illness, the plan pays a benefit of up to 60% of monthly basic earnings with a maximum monthly benefit of $5,000.
Long-Term Disability Insurance
112

EMPLOYEE COMPENSATION
County of Fairfax, VA – Lines of Business Presentation
Other Benefits
113

EMPLOYEE COMPENSATION
County of Fairfax, VA – Lines of Business Presentation
The Line of Duty Act provides employees and volunteers in hazardous duty positions and their families with certain benefits in the event of a line of duty death or disability.
o Death benefit
• $100,000 in the event of a death occurring as the direct or proximate result of performance of duty
• $25,000 in the event of a death due to specified work-related illnesses during employment or within five years of retirement
o Continuing employer-funded health and dental insurance coverage
Though the LODA was originally state-funded, the state shifted the cost of these benefits to localities in FY 2011.
Line of Duty Act (LODA)
114

EMPLOYEE COMPENSATION
County of Fairfax, VA – Lines of Business Presentation
The state continues to administer the program and make eligibility determinations.
The number of beneficiaries has increased steadily over the past few years.
LODA expenses increased from $0.78m in FY 2012 to $1.06m in FY 2015.
Line of Duty Act (LODA)
115
-
10
20
30
40
50
60
70
80
FY 2013 FY 2014 FY 2015 FY 2016 (est) FY 2017 (est)
Families Receiving Line of Duty Health Benefits

EMPLOYEE COMPENSATION
County of Fairfax, VA – Lines of Business Presentation
Unemployment compensation taxes are paid to the Virginia Employment Commission based on the actual number of former County employees filing claims.
Virginia’s unemployment insurance program is administered by the Virginia Employment Commission (VEC).
Unemployment Compensation
116
$6
59
$3
81
$3
39
$1
85
$2
48
$0
$100
$200
$300
$400
$500
$600
$700
FY 2011 FY 2012 FY 2013 FY 2014 FY 2015
Tho
usa
nd
s
Unemployment CompensationGeneral Fund Employer Contributions
EMPLOYEE COMPENSATION
County of Fairfax, VA – Lines of Business Presentation
LiveWell
o Flu vaccinations
o Smoking cessation
o Weight Watchers
o Reduced membership fees at County RECenters
o Employee Fitness and Wellness Center
o Events, webinars, and challenges
o MotivateMe Incentive Rewards
The Employee Assistance Program (EAP) is a free, confidential counseling service for merit employees and members of their immediate household, providing problem assessment, short-term counseling, and referral for personal problems.
Wellness
117

EMPLOYEE COMPENSATION
County of Fairfax, VA – Lines of Business Presentation
Flexible Spending Accounts allow employees to use pre-tax earnings for eligible healthcare and dependent care expenses.
o Maximum contribution of $2,550 for Healthcare FSA
o Maximum contribution of $5,000 for Dependent Care FSA
Annual employee contributions to FSAs total approximately $6.4 million.
The County pays the administrative expenses of the program.
Flexible Spending Accounts
118

EMPLOYEE COMPENSATION
County of Fairfax, VA – Lines of Business Presentation
Tuition Assistance Program (TAP) and Language Tuition Assistance Program (LTAP)
o Available to merit employees
o Coursework must be related to current or future position with County
o Must earn a grade of “C” or better or receive a certificate of satisfactory completion
o Maximum reimbursement per fiscal year for full-time merit employees is $1,300
In addition, countywide training funds support programs managed by the Organizational Development and Training (OD&T) Division of the Department of Human Resources.
Major Countywide Awards
o Outstanding Performance Awards
o Team Excellence Awards
o Managerial Excellence Awards
o A. Heath Onthank Award
o Don Smith Award
o Length of Service Awards
Employee Development and Awards
119

EMPLOYEE COMPENSATION
County of Fairfax, VA – Lines of Business Presentation
EMPLOYEE LEAVE
120

EMPLOYEE COMPENSATION
County of Fairfax, VA – Lines of Business Presentation
Annual Leave
o Annual leave in excess of 240 hours (320 hours with 10 or more years of service) is converted to sick leave at the end of each year
o Balance paid out upon separation
Sick Leave
o 4 hours sick leave per pay period, or 13 days per year
o Balance (up to 2,080 hours if hired after 1/1/2013) at retirement counts towards retirement eligibility, final average salary, and benefit calculation
Employee Leave
121
Years of Service Annual Leave Earned per Pay Period
Annual Leave Earned per Year
Up to 3 4 hours 13 days
3 to 15 6 hours 19½ days
15 and over 8 hours 26 days

EMPLOYEE COMPENSATION
County of Fairfax, VA – Lines of Business Presentation
Holiday Leave
o Generally 11½ days per year based on the holiday schedule approved by the Board
Compensatory Leave
o Employees may earn compensatory leave in lieu of pay for overtime worked (eligibility for compensatory leave and overtime pay depends on the type and level of the position)
o Balances up to 240 hours may be carried forward each calendar year
o Balance (up to 240 hours, 336 hours for Fire and Rescue), paid out upon separation
Inclement Weather and Other Emergencies
o Unscheduled Leave
• Employees may use their own leave without prior approval
• Emergency service personnel must report to work
o Emergency Administrative Leave
• Employees may remain home or leave work early without the use of personal leave
• Employees required to work receive extra compensation
Employee Leave
122

EMPLOYEE COMPENSATION
County of Fairfax, VA – Lines of Business Presentation
Bereavement Leave
o 16 hours (Fire & Rescue, 24 hours) bereavement leave per calendar year in the event of a death occurring in the employee’s extended family or household
Parental Leave
o 80 hours of paid leave following the birth, adoption, or foster care placement of a child
Volunteer Activity Leave
o 16 hours of volunteer activity leave per calendar year to participate in volunteer activities and initiatives that support the neighborhoods in which employees live and work
Military Leave
o Employee reservists or members of the National Guard are eligible for 15 days of paid military leave per federal fiscal year (October 1 – September 30) to attend federally funded military duty including training
Employee Leave
123

EMPLOYEE COMPENSATION
County of Fairfax, VA – Lines of Business Presentation
Administrative Leave
Civil Leave
Education Leave
Injury Leave
Leave Without Pay
Family and Medical Leave
o Up to 12 workweeks in any 12 months
o Employees may use a combination of their personal leave (sick, annual, compensatory, parental) or leave without pay
Employee Leave
124

EMPLOYEE COMPENSATION
County of Fairfax, VA – Lines of Business Presentation
Discussion
125