Embed Size (px)
Citation preview

Retirement System A Pension Trust Fund of Fairfax County, Virginia
For the Fiscal Year Ended June 30, 2014
Fairfax County
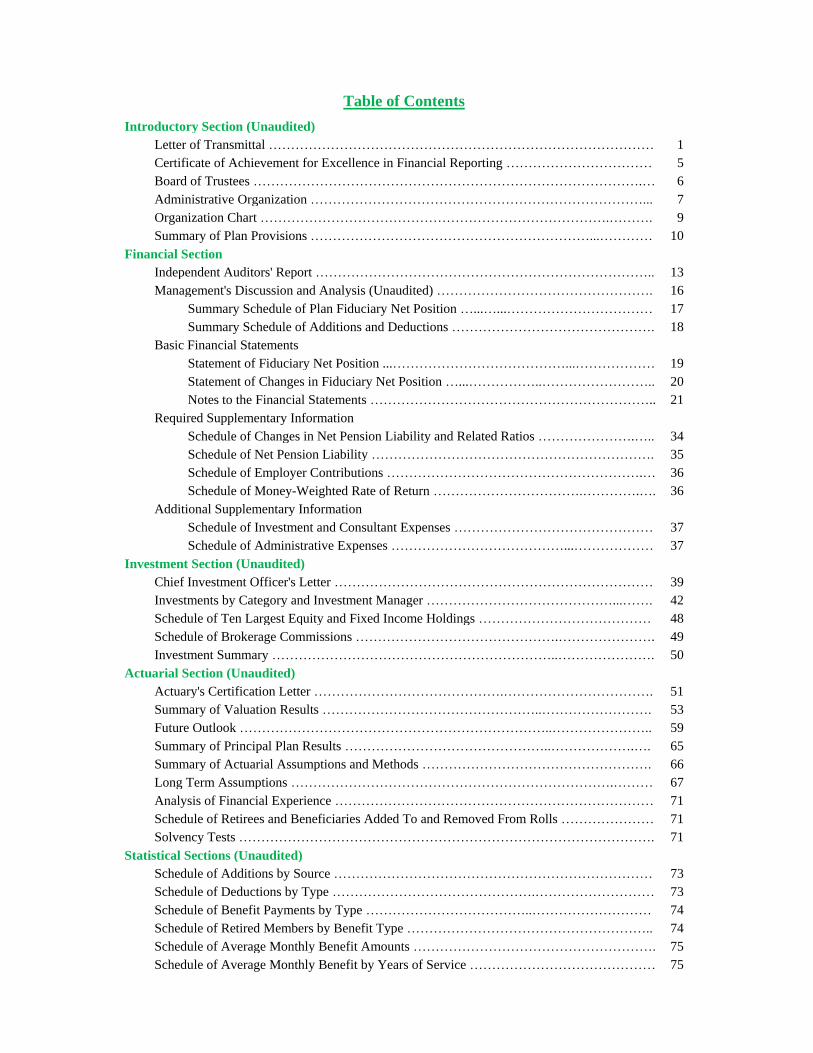
Table of Contents
Introductory Section (Unaudited)
Letter of Transmittal …………………………………………………………………………… 1
Certificate of Achievement for Excellence in Financial Reporting …………………………… 5
Board of Trustees …………………………………………………………………………….… 6
Administrative Organization …………………………………………………………………... 7
Organization Chart …………………………………………………………………….………. 9
Summary of Plan Provisions ………………………………………………………...………… 10
Financial Section
Independent Auditors' Report ………………………………………………………………….. 13
Management's Discussion and Analysis (Unaudited) …………………………………………. 16
Summary Schedule of Plan Fiduciary Net Position …...…...…………………………… 17
Summary Schedule of Additions and Deductions ………………………………………. 18
Basic Financial Statements
Statement of Fiduciary Net Position ...…………………………………...……………… 19
Statement of Changes in Fiduciary Net Position …...……………..…………………….. 20
Notes to the Financial Statements ……………………………………………………….. 21
Required Supplementary Information
Schedule of Changes in Net Pension Liability and Related Ratios ………………….….. 34
Schedule of Net Pension Liability ………………………………………………………. 35
Schedule of Employer Contributions ………………………………………………….… 36
Schedule of Money-Weighted Rate of Return …………………………….………….…. 36
Additional Supplementary Information
Schedule of Investment and Consultant Expenses ……………………………………… 37
Schedule of Administrative Expenses …………………………………...……………… 37
Investment Section (Unaudited)
Chief Investment Officer's Letter ……………………………………………………………… 39
Investments by Category and Investment Manager ……………………………………...……. 42
Schedule of Ten Largest Equity and Fixed Income Holdings ………………………………… 48
Schedule of Brokerage Commissions ……………………………………….…………………. 49
Investment Summary ………………………………………………………..…………………. 50
Actuarial Section (Unaudited)
Actuary's Certification Letter …………………………………….……………………………. 51
Summary of Valuation Results …………………………………………..……………………. 53
Future Outlook ……………………………………………………………..………………….. 59
Summary of Principal Plan Results ………………………………………..……………….…. 65
Summary of Actuarial Assumptions and Methods ……………………………………………. 66
Long Term Assumptions ……………………………………………………………….……… 67
Analysis of Financial Experience ……………………………………………………………… 71
Schedule of Retirees and Beneficiaries Added To and Removed From Rolls ………………… 71
Solvency Tests …………………………………………………………………………………. 71
Statistical Sections (Unaudited)
Schedule of Additions by Source ……………………………………………………………… 73
Schedule of Deductions by Type ……………………………………….……………………… 73
Schedule of Benefit Payments by Type ………………………………..……………………… 74
Schedule of Retired Members by Benefit Type ……………………………………………….. 74
Schedule of Average Monthly Benefit Amounts ………………………………………………. 75
Schedule of Average Monthly Benefit by Years of Service …………………………………… 75


Introductory Section
Fairfax County Employees’ Retirement System - 1 -
C o u n t y o f F a i r f a x , V i r g i n i a
To protect and enrich the quality of life for the people, neighborhoods and diverse communities of Fairfax County
December 5, 2014 Dear Members of the Board of Trustees: I am pleased to submit to you the annual report of the Fairfax County Employees’ Retirement System (System) for the fiscal year ended June 30, 2014. This annual report is provided as an aid to understanding the structure and evaluating the status of the System. The System’s management is responsible for the accuracy of financial information contained herein. The Management’s Discussion and Analysis provides further detail to the financial statements. Background The Fairfax County Supplemental Retirement System was established on July 1, 1955. On February 26, 2001, the name of the System was changed to the Fairfax County Employees’ Retirement System. In previous years, Fairfax County Employees’ Retirement System reported the plan as a cost-sharing multiple employer defined benefit plan. With the implementation of GASB 67 this fiscal year ended June 30, 2014, the System is now considered as a single employer public employee retirement system providing defined benefit pension plan coverage to full-time and certain part-time Fairfax County and Fairfax County Public Schools employees who are not covered by the Fairfax County Police Officers Retirement System, the Fairfax County Uniformed Retirement System, the Educational Employees’ Supplementary Retirement System of Fairfax County (ERFC) or the Virginia Retirement System (VRS). There were 13,862 active members, 705 in the Deferred Retirement Option Program (DROP) and 7,626 retirees participating in the System as of June 30, 2014. For calculations surrounding the Total Pension Liability and its components, Cheiron used rollforward techniques with the June 30, 2013, valuation as a starting point. As such, their results were based on the active, DROP, and retiree counts disclosed as of that date. Provisions The benefit provisions of the System are established by County Ordinance. The System provides normal service retirement and early service retirement benefits for members who attain age or service requirements. Coverage for service-connected disability benefits is immediate upon membership in the System. Ordinary (non-service-related) disability benefits are provided after the attainment of five years of service. Members are vested after five years of service and are eligible for benefits at the early or normal service retirement date. Capital Markets and Economic Conditions
In fiscal year 2014, the System benefited from strong performance in almost all asset classes. Equity markets were up strongly again in 2014 in the U.S. and internationally as well.
Fairfax County Retirement Systems
10680 Main Street * Suite 280 * Fairfax, VA 22030 Phone: 703-279-8200*1-800-333-1633*Fax: 703-273-3185
www.fairfaxcounty.gov/retirement/

Introductory Section
- 2 - Fairfax County Employees’ Retirement System
Bond markets also performed well, particularly in high-yield bonds, leveraged loans, U.S. credit, and emerging market debt. The System achieved a solid portfolio return of 15.2% (14.9%, net of fees), ahead of the long term return target of 7.5%. This return was below the median public fund return of 17.2% and placed in the 81st percentile of the BNY Mellon universe of public funds. Returns compared more favorably over 5 years as investment returns for the five-year period were 16.2% per year, ranking the fund first among all other public funds in the BNY Mellon universe.
Additional details on the markets and the System’s investments are provided in the
Investment Section. Internal and Budgetary Controls The System’s management is responsible for the financial information presented in this report in accordance with U.S. generally accepted accounting principles. Proper internal accounting controls exist to provide reasonable, but not absolute, assurance for both the safekeeping of assets and the fair presentation of the financial statements. The concept of reasonable assurance recognizes that the cost of a control should not exceed the benefits likely to be derived and that the valuation of costs and benefits requires estimates and judgments by management. Investment Policies and Strategies
The Board of Trustees has an adopted Statement of Investment Objectives and Policy. This Statement establishes the investment goals, guidelines, constraints and performance standards that the Board of Trustees uses when exercising its fiduciary duties to manage the investment assets of the System. The Board operates in conformity with the standard of care required in making investments as stated in the Code of Virginia §51.1-803. Please see Footnote C in the financial section of this report for a description of this standard of care and details on the System’s investment policies and strategies.
The Board receives quarterly reporting from staff to ensure compliance with its stated objectives and policy. Staff also monitors the performance of the System and its investment managers and updates the Board on a monthly basis throughout the year. Rate of return information is in the Investment Section prepared internally by staff using data from the System and investment managers. Securities of the System, except for the pooled funds and the County’s pooled cash and temporary investments, are held in safekeeping, on the System’s behalf, by BNY Mellon Asset Servicing as agent. The BNY Mellon Financial Corporation, the parent company, carries Financial Institution bond insurance coverage including a Computer Crime Policy. An additional Excess Securities policy covers all risk of physical loss to securities. Funded Status An actuarial valuation of the System to determine funding requirements is performed annually. The System’s funding policy provides for periodic employer contributions at actuarially determined rates, which are calculated as a percentage of payroll, and are adjusted as necessary to accumulate sufficient assets to meet the costs of benefit payments when due. The valuation of the System performed as of July 1, 2013, indicated that the ratio of assets accumulated by the System to total actuarial accrued liabilities for benefits showed an increase

Introductory Section
Fairfax County Employees’ Retirement System - 3 -
from 71.6% to 72.9%. The actuarial section contains further information on the results of the July 1, 2013, valuation. For purposes of calculating the net pension liability as of June, 30, 2014, in accordance with Governmental Accounting Standards Board’s (GASB) Statement Number 67, the System’s funded status was 78.3%.
Based on the July 1, 2013, actuarial valuation, the employer contribution rate for 2015
following the adopted corridor-based funding policy was 18.32%, a decrease of 0.38% from the 2014 rate of 18.70%. This decrease in the rate is based on fiscal year 2013 actuarial experience. During establishment of the fiscal year 2015 County budget, however, the Board of Supervisors adopted a higher contribution rate of 20.18%. This was done to improve the funded level of the plan, accomplished by raising the target unfunded liability amortization level from 91% to 93%, and to fund an increase in service connected disability benefits (discussed further below). Major Initiatives This year’s annual report has been revamped and updated to comply with the provisions of GASB Statement Number 67, Financial Reporting for Pension Plans, which specifically regards pension fund financial reporting. Its objective is to improve financial reporting by state and local government pension plans by providing decision-useful information, supporting assessments of accountability and interperiod equity, and creating additional transparency. The significant changes required by GASB 67 are explained in more detail in the Financial Section of this report.
Working in concert with the County’s Chief Financial Officer, the System’s actuary (Cheiron), and other County staff, efforts continue to improve the funded status of the Plan. As a result of this work, and as referenced above, the County has increased the employer contribution rate above what was required by the adopted corridor-based funding policy for 2014 and 2015. This was accomplished by increasing the target amortization level for the unfunded liability from 90% in prior years to 91% in 2014. This target was further increased to 93% for the County’s 2015 adopted budget. As part of their FY 2013 Carryover actions, the Board of Supervisors directed that staff reduce the social security offset for disability related retirements from 25% to 15%, effective January 1, 2014. The service-connected disability benefit is two-thirds (66 2/3%) of salary. Prior to this change, the benefit was reduced by 25% of Social Security disability benefits received at any age, or, at age 62, by 25% of the age-based Social Security benefit. Finally, on the investment front, Quantitative Management Associates was added to the Emerging Markets Equity manager lineup replacing the TCW Worldwide Opportunities Fund. The Employees’ System added two fixed income managers, Lazard Emerging Markets Debt Blend Fund and PIMCO BRAVO (Bank Recapitalization and Value Opportunities) Fund II to the lineup, replacing Gramercy Distressed Opportunities Fund and Gramercy Argentina Debt Fund. Additionally, PIMCO All Asset Fund was added to the Absolute Return Manager lineup. Awards The Government Finance Officers Association of the United States and Canada (GFOA) awarded a Certificate of Achievement for Excellence in Financial Reporting to The Fairfax County Employees’ Retirement System for its comprehensive annual financial report for the fiscal year ended June 30, 2013. This was the fourth consecutive year that the System has

Introd
- 4 -
achievgoverfinancapplic currenrequircertifi Other Indep reasonwhethassesscertifi Ackno staff ualso ato ens
financinterewww Respe
JeffreExecu
ductory Secti
ved this prernment must cial report. Tcable legal req
A Certificant annual finrements and icate.
r Informatio
pendent Audit KPMG LL
nable assuranher due to fras the plan’s ication from t
owledgementsThe annua
under the leaacknowledge sure we live u
AccountabAccurate aBest-possi This repor
cial status ofested parties .fairfaxcounty
ectfully subm
ey K. Weiler utive Director
ion
stigious awapublish an e
This report mquirements.
ate of Achievnancial repor
we are subm
on
and ActuariaLP performed nce about wheaud or error.
ability to mthe actuary ar
s al report of thadership of ththe entire Ret
up to our guid
bility to the leand timely Beble Custome
rt is intended f the System
and is avy.gov/retirem
mitted,
r
ard. In ordereasily readabmust satisfy
vement is valit continues tmitting it to
al Certificatioan annual au
ether the finanAdditionally
meet future ore included in
he Employeeshe Board of Ttirement Syst
ding principles
eaders and citenefits for all er Service for
to provide co. It is beingailable to t
ment/.
Fairfax
r to be awable and efficiboth general
id for a perioto meet the the GFOA
ons udit of the financial statemen
y, Cheiron perobligations. n this report.
s’ RetirementTrustees, whotems’ team fos:
tizens of Faircurrent and f
r all members
omplete and g submitted he public v
County Empl
arded a Certiiently organilly accepted
od of one yearCertificate oto determine
ancial statements are free frrformed an anThe indepen
t System wasom I have theor their tireles
rfax County future retireess and retirees
reliable inforto the Board
via the Cou
loyees’ Retire
ificate of Aized compreh
accounting p
ar only. We bof Achieveme its eligibilit
ents of the Syrom material mnnual actuarindent auditor
s prepared bye privilege to ss work throu
s
rmation for dd of Supervisunty’s websi
ement System
chievement, hensive annuprinciples an
believe that oument Program
ty for anothe
ystem to obtaimisstatemential valuation trs’ report an
y the Systemserve. I mu
ughout the yea
determining thsors and otheite located
a al
nd
ur ’s er
in ts, to nd
’s ust ar
he er at

Introductory Section
Fairfax County Employees’ Retirement System - 5 -
Introductory Section
- 6 - Fairfax County Employees’ Retirement System
Ten members serve on the Fairfax County Employees’ Retirement System. Four of the members are citizens appointed by the Fairfax County Board of Supervisors. Three of the members are elected by Fairfax County Government Employees, Fairfax County Public Schools Employees, and Fairfax County Retirees respectively. The Director of Human Resources, the Director of Finance, and the Assistant Superintendent of Human Resources at the Fairfax County Public Schools also serve as Ex Officio members.
Board of Trustees Robert C. Carlson Chairman
Board of Supervisors Appointee Term Expires: August 31, 2017
Phyllis C. Parjardo Christopher J. Pietsch
Assistant Superintendent Treasurer Fairfax County Public Schools Fairfax County Director of Finance
Ex officio Trustee Ex officio Trustee
Randy R. Creller Gordon R. Trapnell, FSA Fairfax County Government Board of Supervisors Appointee
Elected Member Trustee Term Expires: June 30, 2015 Term Expires: June 30, 2017
Susan Woodruff Jon A Miskell, Jr.
Fairfax County Director of Board of Supervisors Appointee Human Resources Term Expires: July 31, 2018 Ex officio Trustee
Thomas M. Stanners Walter Leppin
Board of Supervisors Appointee Fairfax County Public Schools Term Expires: July 31, 2016 Elected Member Trustee
Term Expires: June 30, 2015
John M. Yeatman Vice Chairman
Elected Retiree Trustee Term Expires: December 31, 2014
Introductory Section
Fairfax County Employees’ Retirement System - 7 -
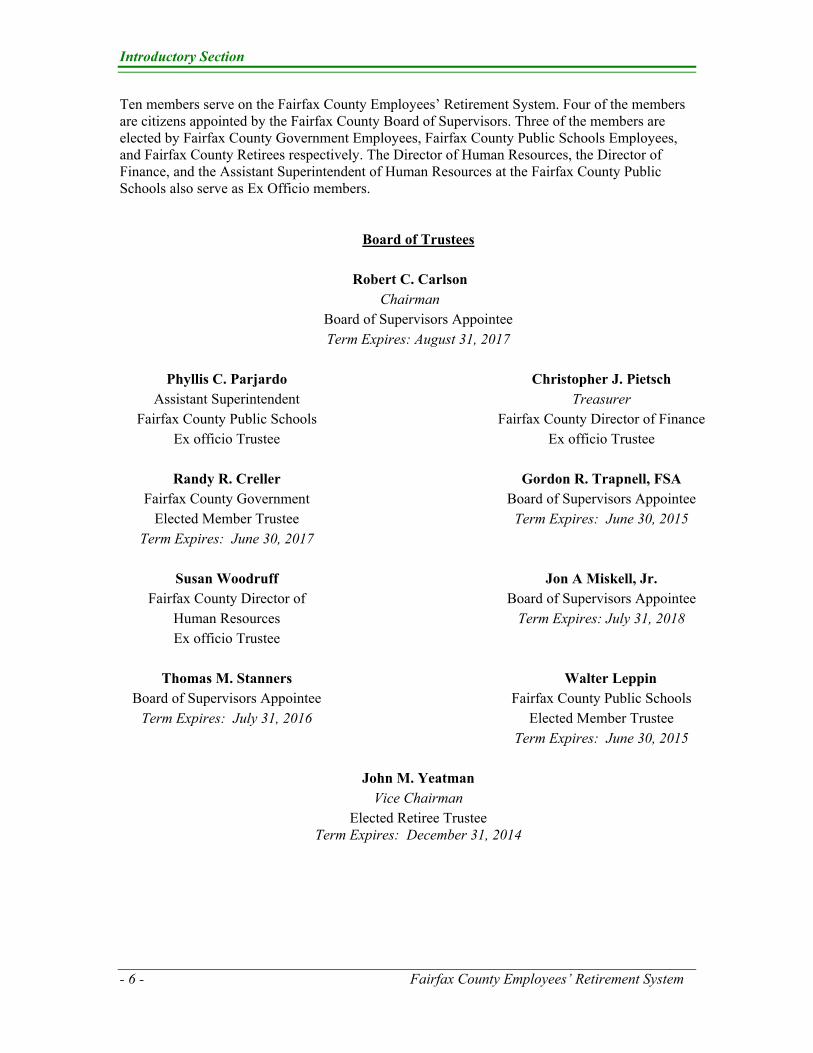
Administrative Organization
Administrative Staff
Jeffrey K. Weiler Executive Director
Gregory A. Samay Andrew J. Spellar Christopher Colandene
Chief Investment Officer Senior Investment Officer Acting Retirement Administrator
Professional Services
Actuary Auditor Cheiron KPMG LLP
Actuaries Certified Public Accountants McLean, VA Washington, DC
Investment Managers
BlackRock, Inc. Bridgewater Associates, LP. San Francisco, CA Westport, CT
Brandywine Global Invest. Management, LLC Czech Asset Management, LP Philadelphia, PA Old Greenwich, CT
The Clifton Group Cohen & Steers Capital Management, Inc. Edina, MN New York, NY
ColumbiaWanger Asset Management, LLC DePrince, Race & Zollo Chicago, IL Winter Park, FL
DoubleLine Capital, L.P. Eagle Trading Systems, Inc.
Los Angeles, CA Princeton, NJ
First Eagle Investment Management Frontpoint Partners, LLC New York, NY Greenwich, CT
Gramercy Advisors, LLC INTECH Investment Management, LLC Greenwich, CT Palm Beach Gardens, FL

Introductory Section
- 8 - Fairfax County Employees’ Retirement System
Investment Managers (continued)
JP Morgan Investment Management, Inc. Lazard Asset Management, LLC New York, NY New York, NY
LSV Asset Management MacKay Shields, LLC Chicago, IL New York, NY
Marathon Asset Management, LLP Post Advisory Group, LLC London, UK Los Angeles, CA
PIMCO Pzena Investment Management, LLC Newport Beach, CA New York, NY
Sands Capital Management, Inc. Shenkman Capital Management, Inc. Arlington, VA Arlington, VA
Stark Investments Standish Mellon Asset Management St. Francis, WI Pittsburgh, PA
WCM Investment Management Quantitative Management Associates
Laguna Beach, CA Newark, NJ
Custodian Bank
BNY Mellon Asset Servicing Pittsburgh, PA
Introductory Section
Fairfax County Employees’ Retirement System - 9 -
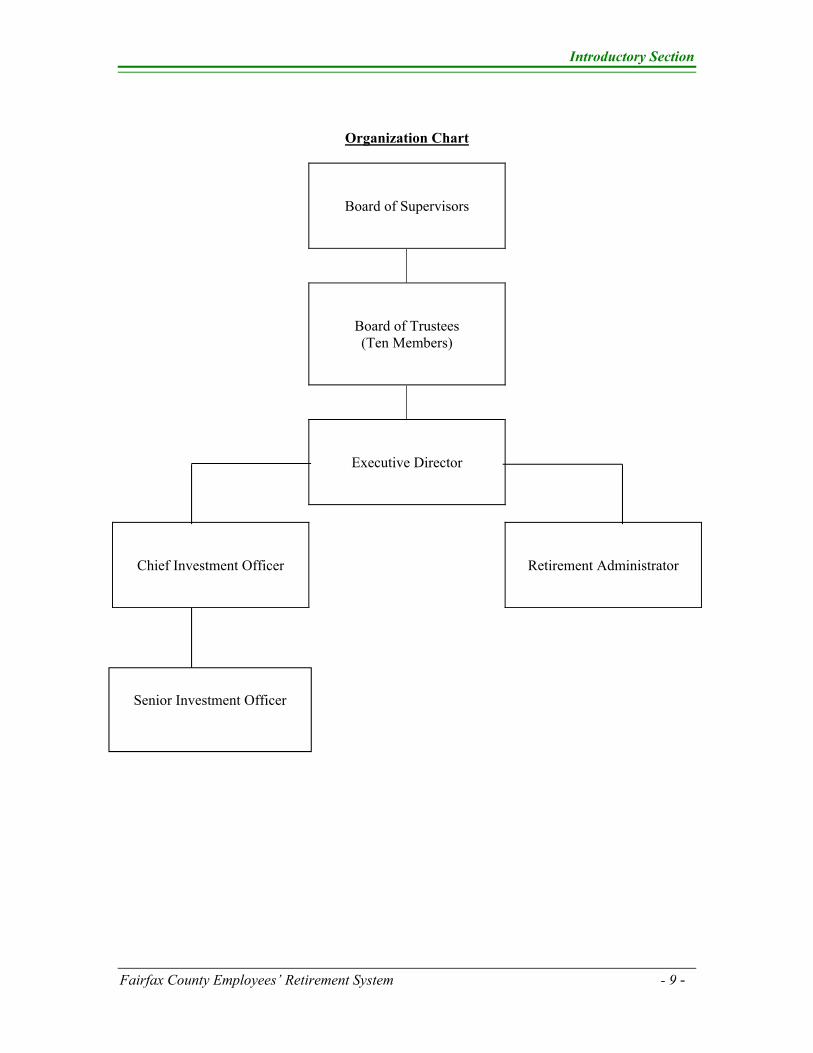
Organization Chart
Board of Supervisors
Board of Trustees (Ten Members)
Executive Director
Chief Investment Officer
Retirement Administrator
Senior Investment Officer

Introductory Section
- 10 - Fairfax County Employees’ Retirement System
Summary of Plan Provisions
Membership in the Fairfax County Employees’ Retirement System includes most County employees working at least 20 hours per week as well as part-time and support staff employees from the Fairfax County Public Schools. The System consists of four Options, A, B, C and D, which have different employee contribution rates and slightly different benefits. Effective on January 1, 2013, all new employees will be enrolled in either Option C or D. The employee has the choice to enroll in either Option within 30 days of employment. This choice is irrevocable. Employees who make no election are automatically enrolled in Option C. The general provisions of the Employees’ Retirement System follow:
Contribution Rates Member:
Option A: The contribution rate for Option A is 4% of base salary up to the maximum Social Security wage base plus 51/3% of base salary over the wage base.
Option B: The contribution rate for Option B is 51/3% of base salary. Option C: The contribution rate for Option C is 4% of base salary up to the maximum
Social Security wage base plus 51/3% of base salary over the wage base. Option D: The contribution rate for Option D is 51/3% of base salary.
Employer: The contribution rate for all four options for Fiscal Year 2014 was19.30%.
Benefit
Options A and C: The benefit is 1.8% of average final compensation (highest consecutive 78 pay periods) up to the Social Security Breakpoint times creditable service plus 2% of average final compensation which exceeds the Social Security Breakpoint times creditable service; and it is then increased by 3%. The Social Security Breakpoint is an average of Social Security wage bases for the last 35 years before a member reaches the age of eligibility for unreduced Social Security benefits.
Options B and D: The benefit is 2% of average final compensation (highest consecutive 78 pay periods) times creditable service; and it is then increased by 3%.
Options A, B, C & D: In addition to the above, at the time of normal service retirement,
a Pre-Social Security Benefit is payable at the rate of 1% of average final compensation up to the Social Security Breakpoint times creditable service; and it is then increased by 3%. This benefit will be payable until the member reaches the age of eligibility for unreduced Social Security benefits.
Types of Benefits - Options A, B, C & D Normal Retirement:
Options A & B: A member is eligible for normal retirement at either age 65 with at least 5 years of creditable service or at least age 50 when the member’s age plus creditable service totals 80 or more.

Introductory Section
Fairfax County Employees’ Retirement System - 11 -
Summary of Plan Provisions (continued)
Options C & D: A member is eligible for normal retirement at either age 65 with at least
5 years of creditable service or at least age 55 when the member’s age plus creditable service totals 85 or more. The maximum retirement service credit allowed for sick leave is 2080 hours.
Benefit Limits: Benefits are limited to the maximum amounts for qualified plans as set forth in Section 415 of the Internal Revenue Code. A separate, nonqualified benefit restoration plan has been established for the payment of any benefit formula amounts in excess of the Section 415 limit. Deferred Retirement Option (DROP): Those eligible for normal retirement may participate in DROP for up to three years. While in DROP, the member continues to work and receive a salary. In lieu of continuing to earn service credit, DROP participants accumulate a lump sum, including interest, payable at retirement. For those in Option C or D, the member does not receive the Pre-Social Security Benefit while in DROP. Early Retirement: For all 4 options, a member is eligible for early retirement at age 50 or older when the member’s age plus creditable service totals 75 or more. Reduction factors are applied to the basic formula for early retirement and no Pre-Social Security Benefit is payable.
Deferred Vested Retirement: Deferred vested retirement is available for vested members (vesting is at 5 years of service) who leave their contributions in the System when they terminate. These members are entitled to their normal retirement benefit, at age 65, based on service with the County or a reduced benefit earlier when they reach age 50 and age plus years of creditable service equal 75. The member also has the option to request a refund of member contributions and interest at any time prior to reaching age 65 or receiving retirement benefits.
Service-Connected Disability Retirement: Service-connected disability retirement is available for members, regardless of their length of service, who become disabled as a result of a job-related illness or injury. Benefits are 66⅔% of average final compensation, less workers’ compensation and 15% of the member’s Social Security benefit.
Ordinary Disability Retirement: Ordinary disability retirement is available for vested members who become disabled due to an injury or illness that is not job-related. Benefits are 2% of average final compensation (highest consecutive three years) times creditable service. The total benefit is then increased by 3%. Death Benefits: If death occurs prior to retirement: If the member is vested and the spouse is the listed beneficiary, the spouse may elect to receive 50% of the normal retirement benefit earned as of the date of the member’s death. If the 50% of normal retirement benefit is not payable, a refund of the member’s contribution plus interest will be paid to the named beneficiary or member’s estate.

Introductory Section
- 12 - Fairfax County Employees’ Retirement System
Summary of Plan Provisions
(continued) If death occurs after retirement: A refund of any of the member’s contributions and interest not already paid in benefits will be payable to the named beneficiary(ies) unless the member has elected the irrevocable Joint and Last Survivor Option which provides a benefit to the member’s spouse for life. At retirement, the member may choose to have his or her spouse receive 50%, 66⅔%, 75% or 100% of the member’s reduced annuity upon the member’s death. The member’s annuity is reduced by a percentage based on the difference in age between the member and his or her spouse. If the spouse pre-deceases the member, the annuity is restored to what it would have been if this option had not been elected. If death occurs because of a job-related illness or injury: A $10,000 lump-sum payment is made to the beneficiary if the member’s death is due to a job-related illness or injury.
Cost of Living Benefit: Annual cost of living adjustments are provided to retirees and beneficiaries equal to the lesser of 4% or the percentage increase in the Consumer Price Index for the Metropolitan Statistical Area that includes Fairfax County. Note: Detailed provisions may be found in the Retirement Handbook for Active Employees: http://www.fairfaxcounty.gov/retirement/pdfs/emphandbook.pdf

Financial Section
Fairfax County Employee’s Retirement System - 13-
KPMG LLP Suite 12000 1801 K Street, NW Washington, DC 20006
Independent Auditor’s Report
The Board of Supervisors
County of Fairfax, Virginia
The Board of Trustees
Fairfax County Employees’ Retirement System:
We have audited the accompanying financial statements of the Fairfax County Employees’
Retirement System (the System), a pension trust fund of the County of Fairfax, Virginia as of and
for the year ended June 30, 2014, and the related notes to the financial statements, which
collectively comprise the System’s basic financial statements as listed in the table of contents.
Management's Responsibility for the Financial Statements
Management is responsible for the preparation and fair presentation of these financial statements
in accordance with U.S. generally accepted accounting principles; this includes the design,
implementation, and maintenance of internal control relevant to the preparation and fair
presentation of financial statements that are free from material misstatement, whether due to fraud
or error.
Auditor's Responsibility
Our responsibility is to express an opinion on these financial statements based on our audit. We
conducted our audit in accordance with auditing standards generally accepted in the United States
of America. Those standards require that we plan and perform the audit to obtain reasonable
assurance about whether the financial statements are free from material misstatement.
An audit involves performing procedures to obtain audit evidence about the amounts and
disclosures in the financial statements. The procedures selected depend on the auditor's judgment,
including the assessment of the risks of material misstatement of the financial statements, whether
due to fraud or error. In making those risk assessments, the auditor considers internal control
relevant to the entity's preparation and fair presentation of the financial statements in order to
design audit procedures that are appropriate in the circumstances, but not for the purpose of
expressing an opinion on the effectiveness of the entity's internal control. Accordingly, we
express no such opinion. An audit also includes evaluating the appropriateness of accounting
policies used and the reasonableness of significant accounting estimates made by management, as
well as evaluating the overall presentation of the financial statements.
KPMG LLP is a Delaware limited liability partnership, the U.S. member firm of KPMG International Cooperative
(“KPMG International”), a Swiss entity.
Financial Section
-14- Fairfax County Employees’ Retirement System
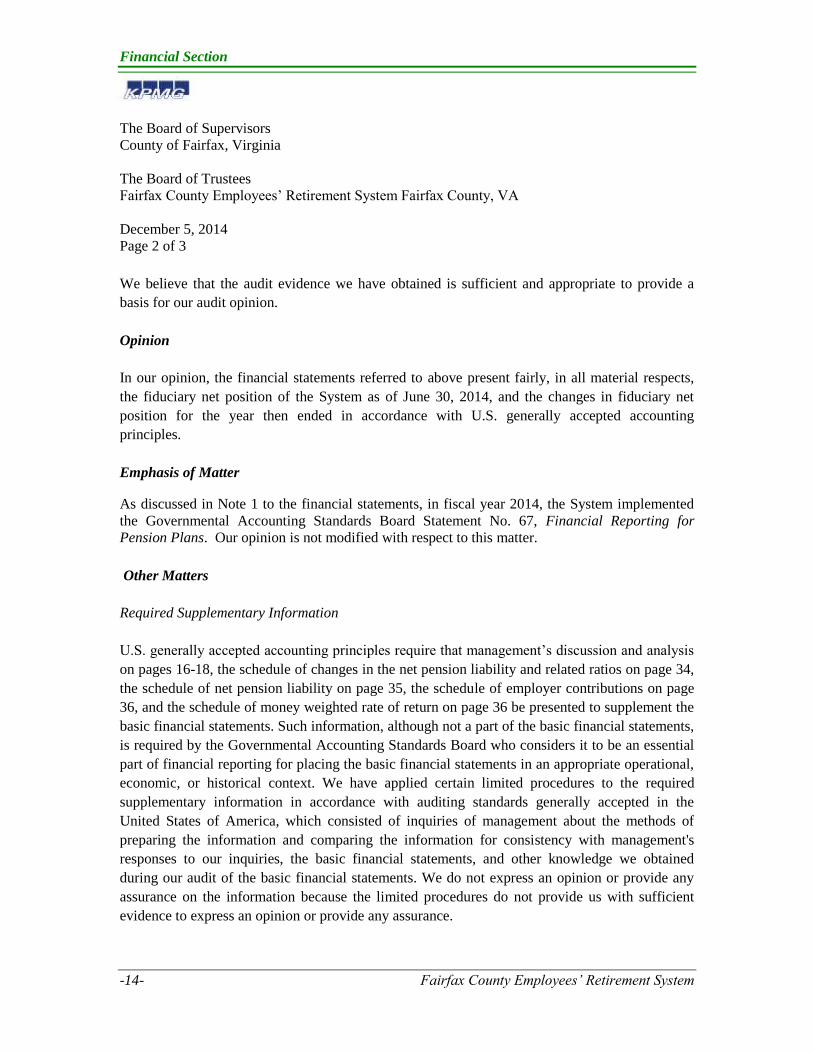
The Board of Supervisors
County of Fairfax, Virginia
The Board of Trustees
Fairfax County Employees’ Retirement System Fairfax County, VA
December 5, 2014
Page 2 of 3
We believe that the audit evidence we have obtained is sufficient and appropriate to provide a
basis for our audit opinion.
Opinion
In our opinion, the financial statements referred to above present fairly, in all material respects,
the fiduciary net position of the System as of June 30, 2014, and the changes in fiduciary net
position for the year then ended in accordance with U.S. generally accepted accounting
principles.
Emphasis of Matter
As discussed in Note 1 to the financial statements, in fiscal year 2014, the System implemented
the Governmental Accounting Standards Board Statement No. 67, Financial Reporting for
Pension Plans. Our opinion is not modified with respect to this matter.
Other Matters
Required Supplementary Information
U.S. generally accepted accounting principles require that management’s discussion and analysis
on pages 16-18, the schedule of changes in the net pension liability and related ratios on page 34,
the schedule of net pension liability on page 35, the schedule of employer contributions on page
36, and the schedule of money weighted rate of return on page 36 be presented to supplement the
basic financial statements. Such information, although not a part of the basic financial statements,
is required by the Governmental Accounting Standards Board who considers it to be an essential
part of financial reporting for placing the basic financial statements in an appropriate operational,
economic, or historical context. We have applied certain limited procedures to the required
supplementary information in accordance with auditing standards generally accepted in the
United States of America, which consisted of inquiries of management about the methods of
preparing the information and comparing the information for consistency with management's
responses to our inquiries, the basic financial statements, and other knowledge we obtained
during our audit of the basic financial statements. We do not express an opinion or provide any
assurance on the information because the limited procedures do not provide us with sufficient
evidence to express an opinion or provide any assurance.

Financial Section
Fairfax County Employee’s Retirement System - 15-
The Board of Supervisors
County of Fairfax, Virginia
The Board of Trustees
Fairfax County Employees’ Retirement System Fairfax County, VA
December 5, 2014
Page 3 of 3
Supplemental and Other Information
Our audit was conducted for the purpose of forming an opinion on the financial statements that
collectively comprise the System’s basic financial statements. The introductory section on pages
1-12, the additional supplementary information on pages 37, the investment section on pages 39-
50, the actuarial section on pages 51-72 and the statistical section on pages 73-75 are presented
for purposes of additional analysis and are not a required part of the basic financial statements.
The additional supplementary information is the responsibility of management and was derived
from and relates directly to the underlying accounting and other records used to prepare the basic
financial statements. Such information has been subjected to the auditing procedures applied in
the audit of the basic financial statements and certain additional procedures, including comparing
and reconciling such information directly to the underlying accounting and other records used to
prepare the basic financial statements or to the basic financial statements themselves, and other
additional procedures in accordance with auditing standards generally accepted in the United
States of America. In our opinion, the additional supplementary information is fairly stated, in all
material respects, in relation to the basic financial statements as a whole.
The introductory section and the investment, actuarial, and statistical sections have not been
subjected to the auditing procedures applied in the audit of the basic financial statements, and
accordingly, we do not express an opinion or provide any assurance on them.
Washington, DC
December 5, 2014
Financial Section
-16- Fairfax County Employees’ Retirement System
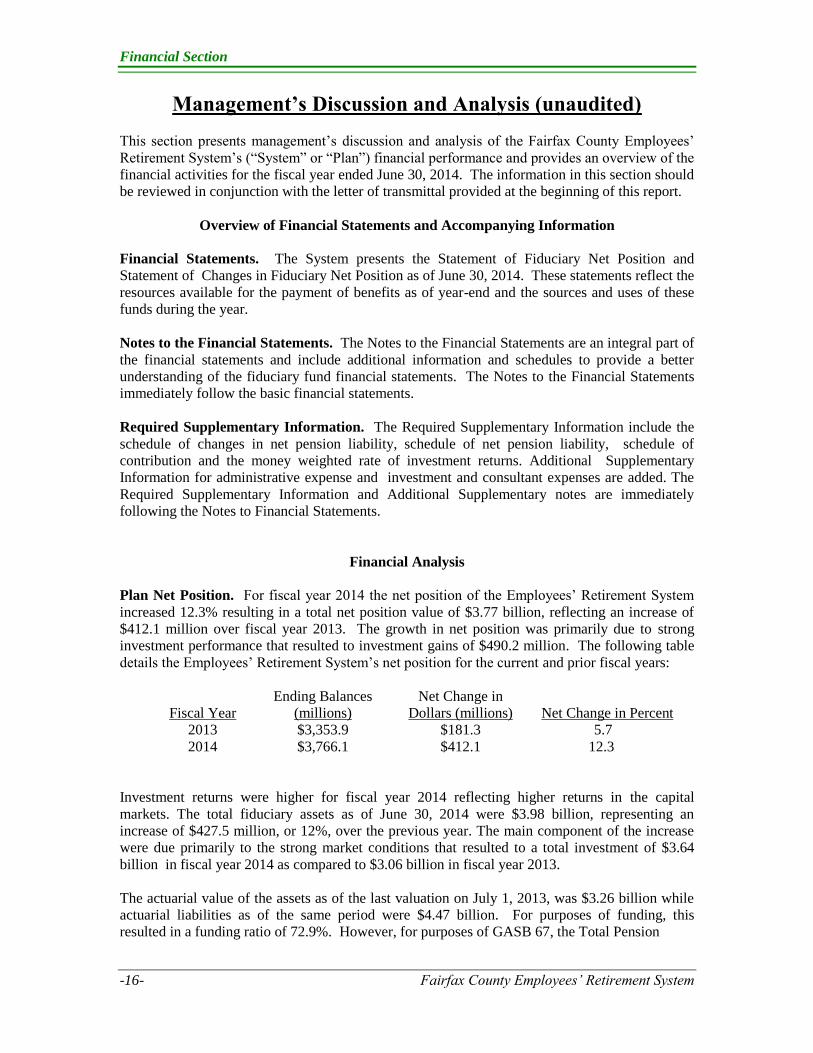
Management’s Discussion and Analysis (unaudited)
This section presents management’s discussion and analysis of the Fairfax County Employees’
Retirement System’s (“System” or “Plan”) financial performance and provides an overview of the
financial activities for the fiscal year ended June 30, 2014. The information in this section should
be reviewed in conjunction with the letter of transmittal provided at the beginning of this report.
Overview of Financial Statements and Accompanying Information
Financial Statements. The System presents the Statement of Fiduciary Net Position and
Statement of Changes in Fiduciary Net Position as of June 30, 2014. These statements reflect the
resources available for the payment of benefits as of year-end and the sources and uses of these
funds during the year.
Notes to the Financial Statements. The Notes to the Financial Statements are an integral part of
the financial statements and include additional information and schedules to provide a better
understanding of the fiduciary fund financial statements. The Notes to the Financial Statements
immediately follow the basic financial statements.
Required Supplementary Information. The Required Supplementary Information include the
schedule of changes in net pension liability, schedule of net pension liability, schedule of
contribution and the money weighted rate of investment returns. Additional Supplementary
Information for administrative expense and investment and consultant expenses are added. The
Required Supplementary Information and Additional Supplementary notes are immediately
following the Notes to Financial Statements.
Financial Analysis
Plan Net Position. For fiscal year 2014 the net position of the Employees’ Retirement System
increased 12.3% resulting in a total net position value of $3.77 billion, reflecting an increase of
$412.1 million over fiscal year 2013. The growth in net position was primarily due to strong
investment performance that resulted to investment gains of $490.2 million. The following table
details the Employees’ Retirement System’s net position for the current and prior fiscal years:
Fiscal Year Ending Balances
(millions) Net Change in
Dollars (millions) Net Change in Percent 2013 $3,353.9 $181.3 5.7 2014 $3,766.1 $412.1 12.3
Investment returns were higher for fiscal year 2014 reflecting higher returns in the capital
markets. The total fiduciary assets as of June 30, 2014 were $3.98 billion, representing an
increase of $427.5 million, or 12%, over the previous year. The main component of the increase
were due primarily to the strong market conditions that resulted to a total investment of $3.64
billion in fiscal year 2014 as compared to $3.06 billion in fiscal year 2013.
The actuarial value of the assets as of the last valuation on July 1, 2013, was $3.26 billion while
actuarial liabilities as of the same period were $4.47 billion. For purposes of funding, this
resulted in a funding ratio of 72.9%. However, for purposes of GASB 67, the Total Pension

Financial Section
Fairfax County Employee’s Retirement System - 17-
Liability as of July 1, 2013, was $4.62 billion compared to the Total Net Position of $3.35 billion,
which results in a funding ratio of 72.6%.
The Plan’s investments are exposed to various risks including interest rate, market and credit
risks. These risks may be influenced by changes in economic conditions and market conditions.
Therefore, it is reasonable to assume that there will be changes in the values of the investments
held in trust which could materially affect the amounts reported in the financial statements.
Detailed information on investment results are in the Investment Section of this report.
Additions and Deductions. The employer contributions for fiscal year 2014 increased by 1.7%
due primarily to an increase in the employer contribution rate from 19.05% to 19.30% of salary.
Total contributions for the fiscal year ended June 30, 2014, amounted to $162.4 million. This
was an increase of $2.4 million when compared with the activity of fiscal year 2013. Employee
contributions increased slightly due to a small increase in covered payroll.
Deductions to the retirement system consist of the payments of benefits to retirees and
beneficiaries, the refund of contributions to former members, and the cost of administering the
retirement system. The total deductions for fiscal year 2014 were $240.4 million, an increase of
$16.4 million, or 7.3%, over fiscal year 2013. Regular pension benefits has increased the number
of retirees and beneficiaries receiving benefit payments to 7,263 from 6,888 in fiscal year 2013.
Benefit payments increased due to a cost-of-living increase of 1.4%, an increase in the number of
retirees and higher benefits for new retirees. Refunds reflected a 12.3% increase due to the higher
employee turnover or separation in the fiscal year.
Summary Schedule of Plan Fiduciary Net Position
Assets 2014 2013 Difference
Total cash and investments $3,815,298,551 $3,442,446,100 $372,852,451
Total fixed assets 3,806 5,075 (1,269)
Total receivables 163,462,101 108,827,163 54,634,938
Total assets 3,978,764,458 3,551,278,338 427,486,120
Total liabilities 212,704,793 197,346,235 15,358,558
Net position restricted for
pension $3,766,059,665 $3,353,932,103 $412,127,562

Financial Section
-18- Fairfax County Employees’ Retirement System
Summary Schedule of Additions and Deductions
Additions 2014 2013 Difference
Contributions
Employer $129,618,309 $127,448,018 $2,170,291
Plan Members 32,758,587 32,551,927 206,660
Total investment income 490,196,386 245,374,617 244,821,769
Total Additions 652,573,282 405,374,562 247,198,720
Deductions
Benefit payments 235,204,611 219,229,038 15,975,573
Refunds of contributions 3,356,282 2,988,397 367,885
Administrative expenses 1,884,827 1,877,620 7,207
Total deductions 240,445,720 224,095,055 16,350,665
Net increase/(decrease) $412,127,562 $181,279,507 $230,848,055
Contacting the System’s Financial Management
This financial report is designed to provide our membership, the Board of Trustees and the
County’s Board of Supervisors with a general overview of the System’s financial condition. If
you have any questions about this report or need additional information, contact the Fairfax
County Retirement Administration Agency, 10680 Main Street, Suite 280, Fairfax, Virginia
22030. This report can also be found on the County’s internet site at
www.fairfaxcounty.gov/retirement/.

Financial Section
Fairfax County Employee’s Retirement System - 19-
Statement of Fiduciary Net Position
As of June 30, 2014
Assets
Cash and short-term investments
Equity in County's pooled cash and temporary
investments $4,550,641
Cash collateral received for securities on loan 39,803,388
Short-term investments 135,148,368
Total cash and short-term investments $179,502,397
Fixed Assets
Equipment, net 3,806
Total fixed assets 3,806
Receivables
Accounts receivable 4,935,820
Accrued interest and dividends 10,981,723
Investment proceeds and other receivables 147,544,558
Total receivables 163,462,101
Investments, at fair value
Common and preferred stock 1,418,920,216
Fixed income
Asset-backed securities 255,465,805
Corporate and other bonds 460,041,691
U.S. Government obligations 101,312,758
Pooled and mutual funds 1,400,055,684
Total investments 3,635,796,154 Total assets 3,978,764,458
Liabilities
Investment purchases and other liabilities 165,763,981
Cash collateral received for securities on loan 39,803,388
Accounts payable and accrued expenses 7,137,424
Total liabilities 212,704,793
Net position restricted for pensions $3,766,059,665
See accompanying notes to financial statements.
Financial Section
-20- Fairfax County Employees’ Retirement System
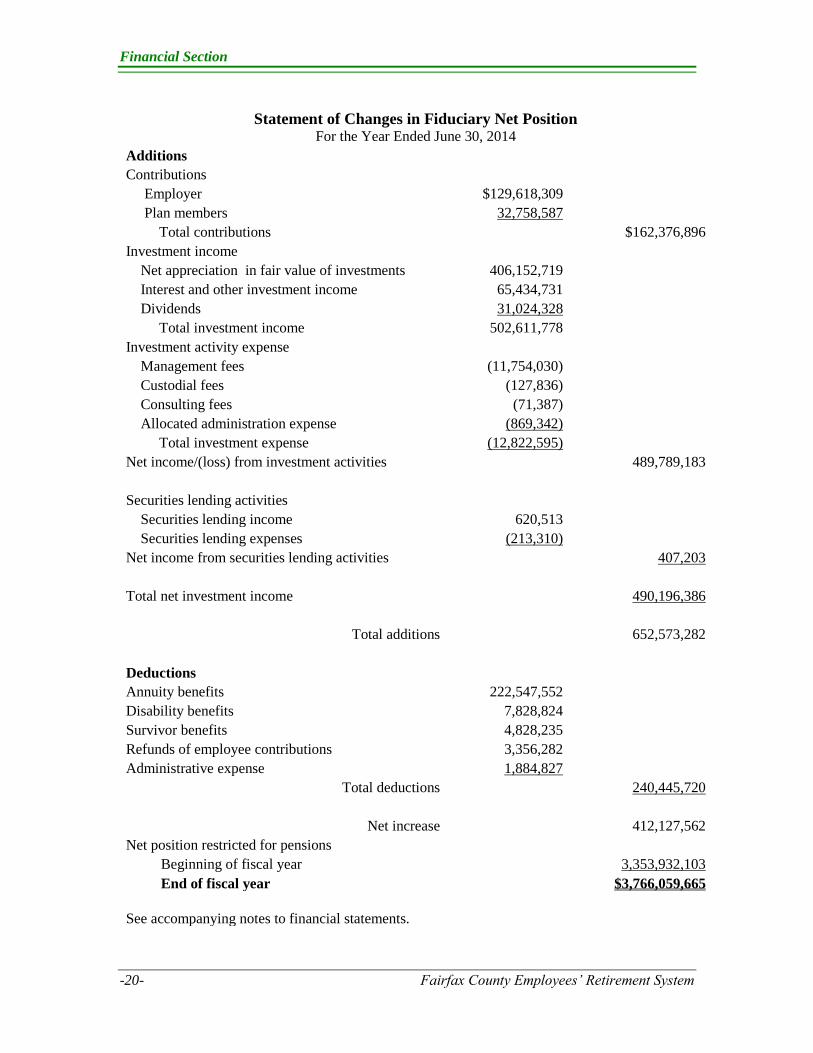
Statement of Changes in Fiduciary Net Position For the Year Ended June 30, 2014
Additions
Contributions
Employer $129,618,309
Plan members 32,758,587
Total contributions $162,376,896
Investment income
Net appreciation in fair value of investments 406,152,719
Interest and other investment income 65,434,731
Dividends 31,024,328
Total investment income 502,611,778
Investment activity expense
Management fees (11,754,030)
Custodial fees (127,836)
Consulting fees (71,387)
Allocated administration expense (869,342)
Total investment expense (12,822,595)
Net income/(loss) from investment activities 489,789,183
Securities lending activities
Securities lending income 620,513
Securities lending expenses (213,310)
Net income from securities lending activities 407,203
Total net investment income 490,196,386
Total additions 652,573,282
Deductions
Annuity benefits 222,547,552
Disability benefits 7,828,824
Survivor benefits 4,828,235
Refunds of employee contributions 3,356,282
Administrative expense 1,884,827
Total deductions 240,445,720
Net increase 412,127,562
Net position restricted for pensions
Beginning of fiscal year 3,353,932,103
End of fiscal year $3,766,059,665 See accompanying notes to financial statements.

Financial Section
Fairfax County Employee’s Retirement System - 21-
Notes to the Financial Statements As of and for the year ended June 30, 2014
The System is considered part of the County’s reporting entity and its financial statements are
included in the County’s basic financial statements as a pension trust fund.
A. Summary of Significant Accounting Policies
Basis of Accounting. The System’s financial statements have been prepared under the accrual
basis of accounting in accordance with accounting principles applicable to governmental units in
the United States of America. Member and employer contributions to the System are recognized
in the period in which the contributions are due. Benefits and refunds are recognized when due in
accordance with the terms of the System. The cost of administering the System is paid by the
System.
Method Used to Value Investments. Short-term investments are reported at cost, which
approximates fair value. All other investments are reported at fair value. Securities traded on a
national or international exchange are valued at the last reported sales price at current exchange
rates. Asset-backed securities are valued on the basis of future principal and interest payments
and are discounted at prevailing interest rates for similar instruments. Because of the inherent
uncertainty in valuing these securities, the fair value may differ from the values that would have
been used had a ready market for such securities existed. Accordingly, the realized value
received upon the sale of the assets may differ from the fair value. The System records
investment purchases and sales as of the trade date. These transactions are not finalized until the
settlement date, which occurs approximately three business days after the trade date. The
amounts of trade receivables and payables are shown as receivables and payables on the
Statement of Fiduciary Net Position. Cash received as collateral on securities lending
transactions and investments made with such cash are reported as assets along with a related
liability for collateral received. The market values of private investments and direct real estate are
lagged by one quarter due to the timing of receipt of private market valuations and information.
Equity in County’s Pooled Cash and Temporary Investments. The System maintains cash with
the County, which invests cash and allocates interest earned, net of a management fee, on a daily
basis to the System based on the System’s average daily balance of equity in pooled cash. As of
June 30, 2014, the bank balance of the County’s public deposits was either insured by the Federal
Deposit Insurance Corporation or through the State Treasury Board pursuant to the provisions of
the Security for Public Deposit Act. The County’s investments are exposed to various risks such
as interest rate risk, market and credit risks. Such risks, and the resulting investment security
values, may be influenced by changes in economic conditions and market perceptions and
expectations. Accordingly, it is at least reasonably possible that changes in the values of
investment securities will occur in the near term and that such change could materially affect the
amounts reported in the financial statements.
Implementation of New Accounting Pronouncements. In fiscal year 2014, the System
implemented GASB Statement No. 65, Items Previously Reported as Assets and Liabilities,
issued in March 2012. The System adopted the statement during the fiscal year ended June 30,
2014. This statement establishes accounting and financial standards that reclassifies certain items
that were previously reported as assets and liabilities as deferred outflows of resources, deferred
inflows of resources, or current period outflows and inflows. Upon careful review, it has been
established that the System does not have any applicable reporting changes.
Financial Section
-22- Fairfax County Employees’ Retirement System
In fiscal year 2014, the System implemented GASB Statement No. 67, Financial Reporting for
Pension Plan (GASB 67), issued in June 2012. The System adopted GASB 67 during the fiscal
year ended June 30, 2014, which addresses the accounting and financial reporting requirements
for pension plans. The requirements for GASB No. 67 require changes in presentation of the
financial statements, notes to the financial statements, and required supplementary information.
Significant changes include an actuarial calculation of total and net pension liability. It also
includes comprehensive footnote disclosure regarding the pension liability, the sensitivity of the
net pension liability to the discount rate, and increased investment activity disclosures. Paragraph
8 of Statement 67 specifies that a primary government and its component units should be
considered to be one employer for purposes of classifying a defined benefit pension plan. With
the implementation of GASB 67, the System, which is a component of Fairfax County
Government, is now recognized as a single employer defined benefit plan. This is a change from
prior years when the System was reported as a multiple employer defined benefit plan.
B. Plan Description, Board Composition, Deferred Retirement Option Program,
Contributions, and Deductions Plan Description. The System is a single employer defined benefit pension plan which covers
employees of the County and its component units. The Plan covers full-time and certain part-
time County, Public Schools, Economic Development Authority and Fairfax County
Redevelopment and Housing Authority employees who are not covered by other plans of the
County or the Virginia Retirement System. Benefit provisions are established and may be
amended by County ordinance. All benefits vest at five years of service. To be eligible for
normal retirement, an individual must meet the following criteria: (a) attain the age of 65 with
five years of service, (b) for Options A and B, attain the age of 50 with age plus years of service
being greater than or equal to 80, or (c) for Options C and D, attain the age of 55 with age plus
years of service being greater than or equal to 85. Normal retirement is calculated using average
final compensation (i.e., the highest consecutive three years) and years, or partial years, of service
at date of termination. The Plan provides that unused sick leave credit may be used in the
calculation of average final compensation by projecting the final salary during the unused sick
leave period (maximum of 2,080 hours of sick leave service credit for Options C & D). Unused
sick leave is also used to increase years of service for calculating benefits and determining
retirement eligibility.
Annual cost-of-living adjustments are provided to retirees and beneficiaries equal to the lesser of
4 percent or the percentage increase in the Consumer Price Index for the Washington-
Consolidated Metropolitan Statistical Area.
Board of Trustees. Ten members serve on the Fairfax County Employees’ Retirement System.
Four of the members are citizens appointed by the Fairfax County Board of Supervisors. Three of
the members are elected by Fairfax County Government Employees, Fairfax County Public
Schools Employees, and Fairfax County Retirees respectively. The Director of Human Resources,
the Director of Finance, and the Assistant Superintendent of Human Resources at the Fairfax
County Public Schools also serve as Ex Officio members.
Financial Section
Fairfax County Employee’s Retirement System - 23-
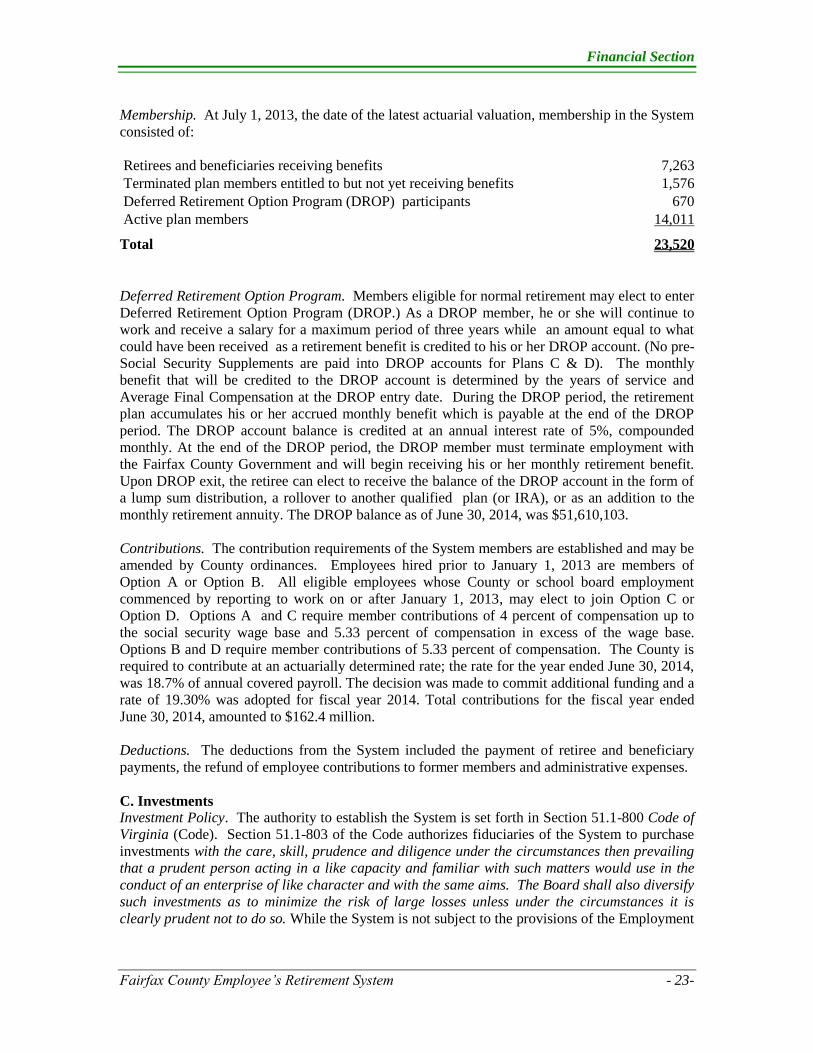
Membership. At July 1, 2013, the date of the latest actuarial valuation, membership in the System
consisted of:
Retirees and beneficiaries receiving benefits 7,263 Terminated plan members entitled to but not yet receiving benefits 1,576 Deferred Retirement Option Program (DROP) participants 670 Active plan members 14,011
Total 23,520
Deferred Retirement Option Program. Members eligible for normal retirement may elect to enter
Deferred Retirement Option Program (DROP.) As a DROP member, he or she will continue to
work and receive a salary for a maximum period of three years while an amount equal to what
could have been received as a retirement benefit is credited to his or her DROP account. (No pre-
Social Security Supplements are paid into DROP accounts for Plans C & D). The monthly
benefit that will be credited to the DROP account is determined by the years of service and
Average Final Compensation at the DROP entry date. During the DROP period, the retirement
plan accumulates his or her accrued monthly benefit which is payable at the end of the DROP
period. The DROP account balance is credited at an annual interest rate of 5%, compounded
monthly. At the end of the DROP period, the DROP member must terminate employment with
the Fairfax County Government and will begin receiving his or her monthly retirement benefit.
Upon DROP exit, the retiree can elect to receive the balance of the DROP account in the form of
a lump sum distribution, a rollover to another qualified plan (or IRA), or as an addition to the
monthly retirement annuity. The DROP balance as of June 30, 2014, was $51,610,103.
Contributions. The contribution requirements of the System members are established and may be
amended by County ordinances. Employees hired prior to January 1, 2013 are members of
Option A or Option B. All eligible employees whose County or school board employment
commenced by reporting to work on or after January 1, 2013, may elect to join Option C or
Option D. Options A and C require member contributions of 4 percent of compensation up to
the social security wage base and 5.33 percent of compensation in excess of the wage base.
Options B and D require member contributions of 5.33 percent of compensation. The County is
required to contribute at an actuarially determined rate; the rate for the year ended June 30, 2014,
was 18.7% of annual covered payroll. The decision was made to commit additional funding and a
rate of 19.30% was adopted for fiscal year 2014. Total contributions for the fiscal year ended
June 30, 2014, amounted to $162.4 million.
Deductions. The deductions from the System included the payment of retiree and beneficiary
payments, the refund of employee contributions to former members and administrative expenses.
C. Investments Investment Policy. The authority to establish the System is set forth in Section 51.1-800 Code of
Virginia (Code). Section 51.1-803 of the Code authorizes fiduciaries of the System to purchase
investments with the care, skill, prudence and diligence under the circumstances then prevailing
that a prudent person acting in a like capacity and familiar with such matters would use in the
conduct of an enterprise of like character and with the same aims. The Board shall also diversify
such investments as to minimize the risk of large losses unless under the circumstances it is
clearly prudent not to do so. While the System is not subject to the provisions of the Employment

Financial Section
-24- Fairfax County Employees’ Retirement System
Retirement Income Security Act (ERISA), the Board wishes to comply with the spirit of ERISA
to the extent that it does not conflict with the Code of Virginia.
The System has adopted the Employees’ Retirement System Investment Policy Statement to
provide a well-managed investment program to meet the long-term needs of the System.
Investment decisions for these assets are made by the Board of Trustees or investment managers
selected by the Board. The overall investment policies do not address specific levels of credit
risk, interest rate risk or foreign currency risk. The Board of Trustees believes that risks can be
managed, but not eliminated, by establishing constraints on the investment portfolio and by
properly monitoring the investment markets, the System’s asset allocation and the investment
managers hired by the System. Each individual investment portfolio is managed by an
investment management firm selected by the Board. Each investment manager has a specific
benchmark and investment guidelines appropriate for the type of mandate they are managing and
that fit within the total risk tolerance of the fund.
The following was the System’s adopted asset allocation policy as of June 30, 2014. Our asset
allocation policy commonly exceeds 100% because we monitor the target exposures to both
direct investments in asset classes plus notional exposure to asset classes through derivative
positions such as Futures held at the portfolio level. We also commonly include notional
exposures for select Investment Managers that have a mandate from the Board to provide the
System with additional asset class exposure using leverage or derivatives.
Asset Class Target Exposure U.S. Equities 20.00% International Equities 10.00% Core Fixed Income 73.00% High Yield 7.50% Absolute Return 20.00% Real Estate 7.50% Commodity 5.00%
Concentrations. The investment policy states that the securities of any one issuer shall not
exceed 10.0% at market value. At June 30, 2014, the System did not have investments (other
than U.S. Government and U.S. Government guaranteed obligations) in any one issuer that
represents 5 percent or more of net position available for benefits. All investments, except for the
pooled and mutual funds, short-term investment fund and a short-term collateral investment pool
are held by an unaffiliated custodian. There is no custodial credit risk since the custodian’s
records establish the System’s interest in the securities.
The System’s fixed income portfolio shall be, on average, comprised of high-quality issues and
limits are imposed on investment manager’s below-investment-grade holdings. Unless otherwise
specified, if any security has a split rating, the higher of the two ratings is used for the purposes of
meeting minimum quality standards.
Rate of Return. For the year ended June 30, 2014, the annual money-weighted rate of return on
pension plan investment, net of pension plan investment expense, was 14.85%. The money-
weighted rate of return expresses investment performance, net of investment expense, adjusted
for the changing amounts actually invested.
Financial Section
Fairfax County Employee’s Retirement System - 25-
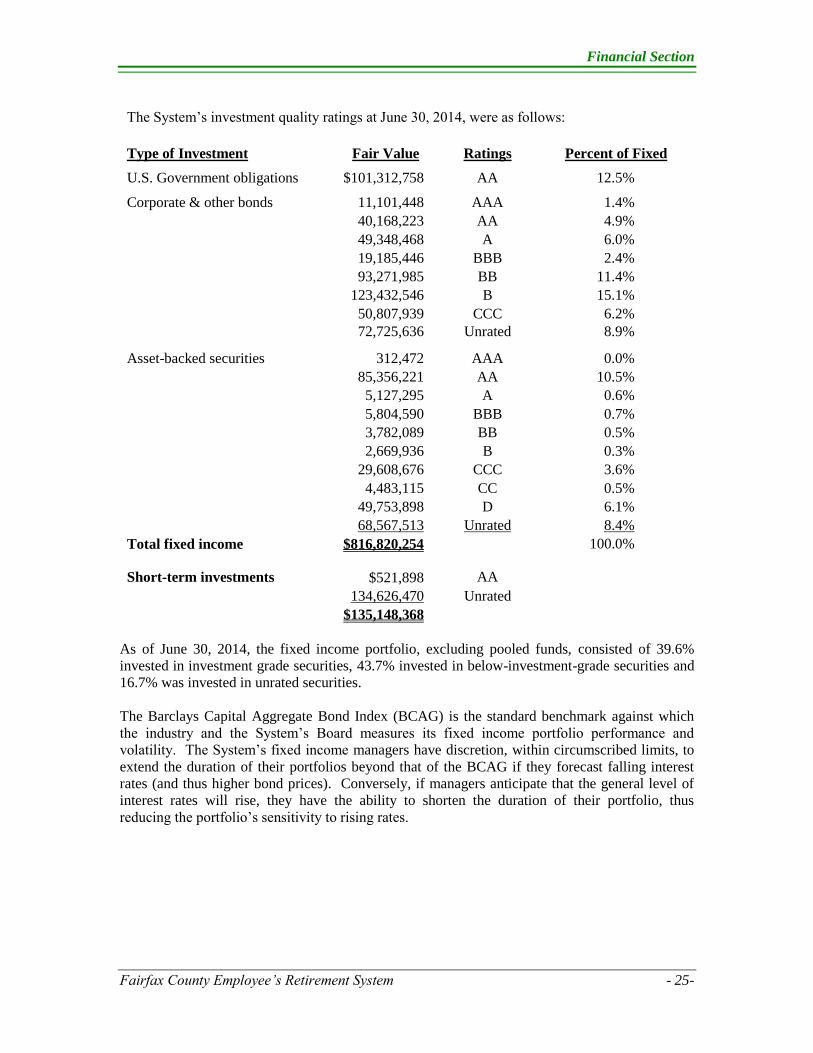
As of June 30, 2014, the fixed income portfolio, excluding pooled funds, consisted of 39.6%
invested in investment grade securities, 43.7% invested in below-investment-grade securities and
16.7% was invested in unrated securities.
The Barclays Capital Aggregate Bond Index (BCAG) is the standard benchmark against which
the industry and the System’s Board measures its fixed income portfolio performance and
volatility. The System’s fixed income managers have discretion, within circumscribed limits, to
extend the duration of their portfolios beyond that of the BCAG if they forecast falling interest
rates (and thus higher bond prices). Conversely, if managers anticipate that the general level of
interest rates will rise, they have the ability to shorten the duration of their portfolio, thus
reducing the portfolio’s sensitivity to rising rates.
The System’s investment quality ratings at June 30, 2014, were as follows:
Type of Investment Fair Value Ratings Percent of Fixed
U.S. Government obligations $101,312,758 AA 12.5%
Corporate & other bonds 11,101,448 AAA 1.4%
40,168,223 AA 4.9%
49,348,468 A 6.0%
19,185,446 BBB 2.4%
93,271,985 BB 11.4%
123,432,546 B 15.1%
50,807,939 CCC 6.2%
72,725,636 Unrated 8.9%
Asset-backed securities 312,472 AAA 0.0%
85,356,221 AA 10.5%
5,127,295 A 0.6%
5,804,590 BBB 0.7%
3,782,089 BB 0.5%
2,669,936 B 0.3%
29,608,676 CCC 3.6%
4,483,115 CC 0.5%
49,753,898 D 6.1%
68,567,513 Unrated 8.4%
Total fixed income $816,820,254 100.0%
Short-term investments $521,898 AA
134,626,470 Unrated
$135,148,368

Financial Section
-26- Fairfax County Employees’ Retirement System
The System’s investments’ sensitivity to interest rates at June 30, 2014, follows:
Option- Adjusted Percentage
Investment Type Fair Value Duration (yrs) of Fixed
U.S. Government obligations $101,312,758 6.6 12.5%
Corporate and other bonds 460,041,691 4.7 56.3%
Asset-backed securities 255,465,805 3.7 31.2%
Total fixed income $816,860,254 4.6 100.0%
Short-term investments $135,148,368 0.1
As of June 30, 2014, duration of the System’s overall fixed income portfolio excluding pooled
funds was 4.6 years compared with the 5.5 year duration of the BCAG.
Foreign currency risk is the risk that changes in exchange rates will adversely affect the fair value
of the investment. The System’s investments at June 30, 2014, held in currencies other than US
dollars were as follows:
International Securities
Short Term
Investments & other Equity
Convertible &
Fixed Income Total
Euro Currency Unit $6,623,571 $53,750,735 $30,172,327 $90,546,633 Japanese Yen 1,204,898 50,019,742 19,754 51,244,394
Pound Sterling 103,762 36,774,189 10,975,387 47,853,338
Australian Dollar 130,193 19,041,880 20,225,179 39,397,252
Mexican New Peso 70 2,771,141 28,476,765 31,247,976
Hong Kong dollar 26,600 22,286,426 22,313,026
Canadian Dollar 310,380 13,899,316 208,384 14,418,080
Swizz Franc 5,029 13,749,815 13,754,844 Danish Krone (8) 12,140,855 12,140,847
Singapore Dollar 180,400 8,500,046 8,680,446
Brazil Real 8,653,314 8,653,314
Swedish Krona 27,584 8,625,724 8,653,308
South Korean Won 8,591,805 8,591,805
S African Comm Rand 30 1,986,778 6,428,258 8,415,066
Polish zloty 49 8,340,376 8,340,425
New Zealand Dollar 26,481 347,067 6,968,152 7,341,700
Hungarian Forint 4 7,176,519 7,176,523
Indonesian Rupiah 4,157,838 4,157,838
Malaysian Ringgit 3,823,981 3,823,981
Other Currencies 90,542 3,747,330 2,605,051 6,442,923
$8,729,585 $247,641,044 $146,823,090 $403,193,719
Financial Section
Fairfax County Employee’s Retirement System - 27-
Derivative Financial Instruments. In accordance with the Board’s investment policies, the
System regularly invests in derivative financial instruments with off-balance-sheet risk in the
normal course of its investing activities to enhance return on investment and manage exposure to
certain risks within the fund. The System also enters into derivative transactions to gain exposure
to currencies and markets where derivatives are the most cost-effective instrument. Derivative
instruments are financial contracts whose values depend on the values of one or more underlying
assets, reference rates or financial indices. During fiscal year 2014, the System invested directly
in various derivatives including asset-backed securities, collateralized mortgage obligations,
exchange-traded futures contracts, forward currency contracts, options, swaps, and floating rate
securities. Some securities, such as structured notes, can have derivative-like characteristics
where the return may be linked to one or more indexes. Asset-backed securities, such as
collateralized mortgage obligations (CMOs), are sensitive to changes in interest rates and pre-
payments. It should also be noted that the System also has exposure to derivatives indirectly
through its ownership interests in certain hedge funds, mutual funds and commingled funds which
may use, hold, or write derivative financial instruments.
Derivative investments may involve, to varying degrees, elements of credit and market risk in
excess of amounts recognized on the financial statements. Market risk results from fluctuations
in interest rates, and currency rates. The credit risk of these investments is associated with the
creditworthiness of the related parties to the contracts. The System could be exposed to risk if the
counterparties to the contracts are unable to meet the terms of the contracts. Holders of futures
contracts look to the exchange for performance under the contract and not to the other party
holding the offsetting futures position. Accordingly, the amount at risk due to nonperformance of
counterparties to futures contracts is minimal. For counterparties involving over the counter
derivatives, the Board seeks to control this risk through counterparty credit evaluations,
counterparty credit limits, and exposure monitoring procedures conducted by investment
managers and staff. To address counterparty risk, the System instructs our investment managers
who use swaps, forwards, and options to only enter into contracts with counterparties rated at
investment grade of BBB or better by at least one nationally recognized rating agency.
At June 30, 2014, the System held the following four types of derivative financial instruments:
futures, currency forwards, options and swaps. Futures, currency forwards, options, and swaps
contracts provide the System with the opportunity to build passive benchmark positions, manage
portfolio duration in relation to various benchmarks, adjust portfolio yield curve exposure,
enhance returns, and gain market exposure to various indices in a more efficient way and at lower
transaction costs. Credit risks depend on whether the contracts are exchange-traded or exercised
over-the-counter. Market risks arise from adverse changes in market prices, interest rates, and
foreign exchange rates.
Investment managers are prohibited from purchasing securities on margin or using leverage
unless specifically permitted within the investment manager’s guidelines. Derivative instruments
covered under the scope of GASB 53 are reported at fair value. The changes in fair value of
derivative instruments that are used for investment purposes are reported within the investment
revenue classification. Gains and losses on derivative securities are determined based upon fair
market values as determined by our custodian and recorded in the Statement of Changes in
Fiduciary Net Position.
Financial Section
-28- Fairfax County Employees’ Retirement System
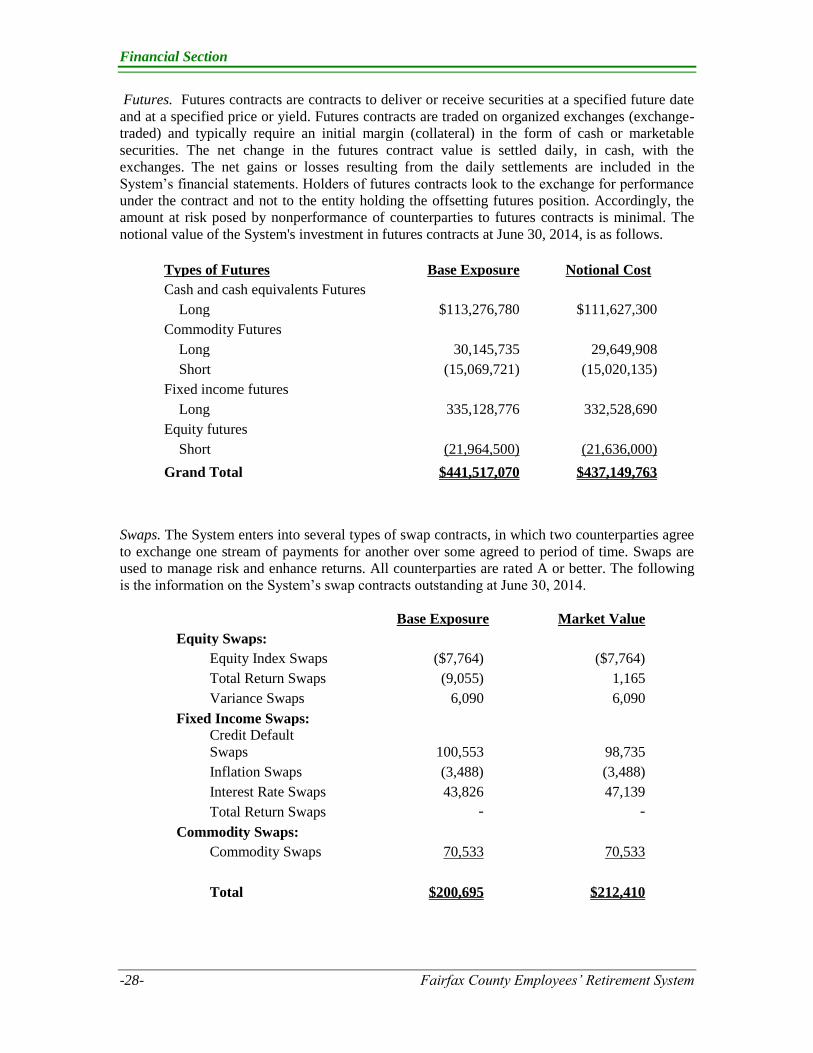
Futures. Futures contracts are contracts to deliver or receive securities at a specified future date
and at a specified price or yield. Futures contracts are traded on organized exchanges (exchange-
traded) and typically require an initial margin (collateral) in the form of cash or marketable
securities. The net change in the futures contract value is settled daily, in cash, with the
exchanges. The net gains or losses resulting from the daily settlements are included in the
System’s financial statements. Holders of futures contracts look to the exchange for performance
under the contract and not to the entity holding the offsetting futures position. Accordingly, the
amount at risk posed by nonperformance of counterparties to futures contracts is minimal. The
notional value of the System's investment in futures contracts at June 30, 2014, is as follows.
Types of Futures Base Exposure Notional Cost
Cash and cash equivalents Futures
Long $113,276,780 $111,627,300
Commodity Futures
Long 30,145,735 29,649,908
Short (15,069,721) (15,020,135)
Fixed income futures
Long 335,128,776 332,528,690
Equity futures
Short (21,964,500) (21,636,000)
Grand Total $441,517,070 $437,149,763
Swaps. The System enters into several types of swap contracts, in which two counterparties agree
to exchange one stream of payments for another over some agreed to period of time. Swaps are
used to manage risk and enhance returns. All counterparties are rated A or better. The following
is the information on the System’s swap contracts outstanding at June 30, 2014.
Base Exposure Market Value
Equity Swaps:
Equity Index Swaps ($7,764) ($7,764)
Total Return Swaps (9,055) 1,165
Variance Swaps 6,090 6,090
Fixed Income Swaps:
Credit Default
Swaps 100,553 98,735
Inflation Swaps (3,488) (3,488)
Interest Rate Swaps 43,826 47,139
Total Return Swaps - -
Commodity Swaps:
Commodity Swaps 70,533 70,533
Total $200,695 $212,410
Financial Section
Fairfax County Employee’s Retirement System - 29-
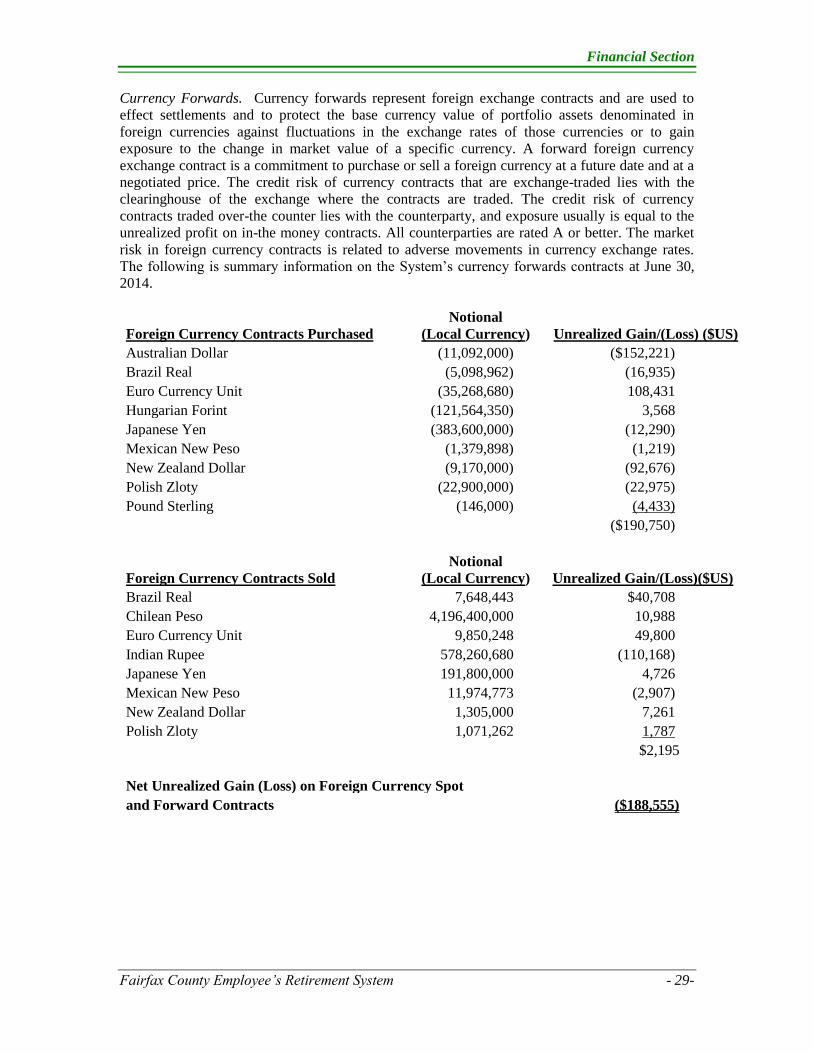
Currency Forwards. Currency forwards represent foreign exchange contracts and are used to
effect settlements and to protect the base currency value of portfolio assets denominated in
foreign currencies against fluctuations in the exchange rates of those currencies or to gain
exposure to the change in market value of a specific currency. A forward foreign currency
exchange contract is a commitment to purchase or sell a foreign currency at a future date and at a
negotiated price. The credit risk of currency contracts that are exchange-traded lies with the
clearinghouse of the exchange where the contracts are traded. The credit risk of currency
contracts traded over-the counter lies with the counterparty, and exposure usually is equal to the
unrealized profit on in-the money contracts. All counterparties are rated A or better. The market
risk in foreign currency contracts is related to adverse movements in currency exchange rates.
The following is summary information on the System’s currency forwards contracts at June 30,
2014.
Foreign Currency Contracts Purchased Notional
(Local Currency) Unrealized Gain/(Loss) ($US)
Australian Dollar (11,092,000) ($152,221)
Brazil Real (5,098,962) (16,935)
Euro Currency Unit (35,268,680) 108,431
Hungarian Forint (121,564,350) 3,568
Japanese Yen (383,600,000) (12,290)
Mexican New Peso (1,379,898) (1,219)
New Zealand Dollar (9,170,000) (92,676)
Polish Zloty (22,900,000) (22,975)
Pound Sterling (146,000) (4,433)
($190,750)
Foreign Currency Contracts Sold Notional
(Local Currency) Unrealized Gain/(Loss)($US)
Brazil Real 7,648,443 $40,708
Chilean Peso 4,196,400,000 10,988
Euro Currency Unit 9,850,248 49,800
Indian Rupee 578,260,680 (110,168)
Japanese Yen 191,800,000 4,726
Mexican New Peso 11,974,773 (2,907)
New Zealand Dollar 1,305,000 7,261
Polish Zloty 1,071,262 1,787
$2,195
Net Unrealized Gain (Loss) on Foreign Currency Spot
and Forward Contracts ($188,555)

Financial Section
-30- Fairfax County Employees’ Retirement System
Options. Option contracts may be exchanged traded or negotiated directly in over the counter
transactions between two counterparties. Options holders have the right, but not the obligation, to
purchase (call) or sell (put) a financial instrument at a future price and time. The System can both
purchase and write options. Exchange traded options rely on the exchange for performance and
the risk to non-performance of counterparties is minimal. All counterparties for over the counter
options are rated A or better. The following table provides information on the System’s option
contracts at June 30, 2014.
Option Types Position Call/Put Cost
Market
Value
Unrealized Investment
Gain/(Loss)
Commodity Purchased Call $132,300 $2,940 ($129,360)
Written Call (142,454) (10,058) 132,396
Written Put (20,119) (261) 19,858
Total Commodity
(30,273) (7,379) 22,894
Equity Written Call (11,440) (393) 11,047
Written Put (5,210) (191) 5,019
Total Equity
(16,650) (584) 16,066
Fixed Income Purchased Put 16,707 1,940 (14,767)
Written Put (28,311) (25,896) 2,415
Total Fixed Income
(11,604) (23,956) (12,352)
Grand Total
($58,527) ($31,919) $26,608
Securities Lending. Board of Trustee policies permit the System to lend its securities to broker-
dealers and other entities (borrowers) for collateral that will be returned for the same securities in
the future. The System’s custodian is the agent in lending the plan’s domestic securities for
collateral of 102% and international securities of 105% of fair value. The custodian receives cash
or securities as collateral from the borrower. All securities loans can be terminated on demand by
either the System or the borrower. Securities received as collateral are not reported as assets and
liabilities on balance sheet since the Retirement Administration Agency does not have the ability
to pledge or sell the collateral securities absent borrower default.
The following represents the balances relating to the securities lending transactions at June 30,
2014.
Underlying Cash Collateral Securities Collateral
Securities Lent Securities Investment Value Investment Value
Lent for cash collateral
US Government securities $1,214,863 $1,243,163
Corporate and other bonds 7,081,477 7,243,629
Common and preferred stock 30,324,757 31,316,596
Lent for securities collateral
US Government securities 21,534,954 $23,429,076
Corporate and other bonds 14,058,812 14,393,641
Common and preferred stock 230,457,894 - 255,685,972
Total $304,672,757 $39,803,388 $293,508,689
Financial Section
Fairfax County Employee’s Retirement System - 31-
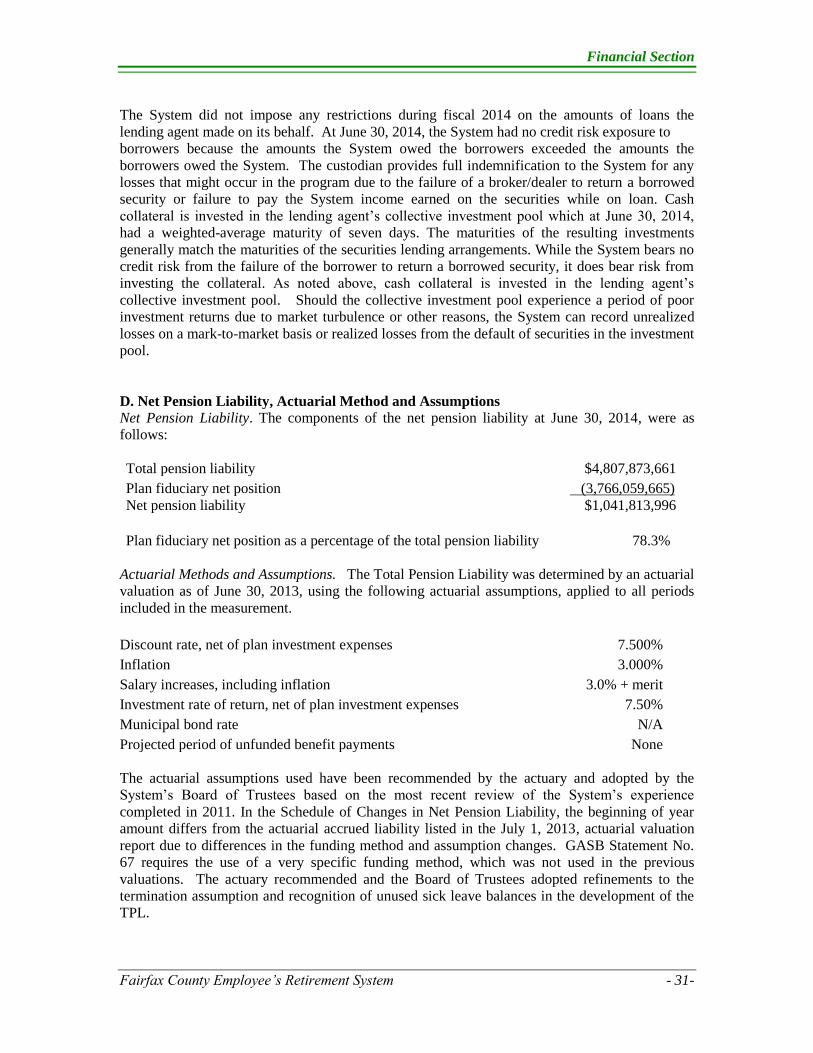
The System did not impose any restrictions during fiscal 2014 on the amounts of loans the
lending agent made on its behalf. At June 30, 2014, the System had no credit risk exposure to
borrowers because the amounts the System owed the borrowers exceeded the amounts the
borrowers owed the System. The custodian provides full indemnification to the System for any
losses that might occur in the program due to the failure of a broker/dealer to return a borrowed
security or failure to pay the System income earned on the securities while on loan. Cash
collateral is invested in the lending agent’s collective investment pool which at June 30, 2014,
had a weighted-average maturity of seven days. The maturities of the resulting investments
generally match the maturities of the securities lending arrangements. While the System bears no
credit risk from the failure of the borrower to return a borrowed security, it does bear risk from
investing the collateral. As noted above, cash collateral is invested in the lending agent’s
collective investment pool. Should the collective investment pool experience a period of poor
investment returns due to market turbulence or other reasons, the System can record unrealized
losses on a mark-to-market basis or realized losses from the default of securities in the investment
pool.
D. Net Pension Liability, Actuarial Method and Assumptions
Net Pension Liability. The components of the net pension liability at June 30, 2014, were as
follows:
Total pension liability $4,807,873,661
Plan fiduciary net position (3,766,059,665) Net pension liability $1,041,813,996 Plan fiduciary net position as a percentage of the total pension liability 78.3%
Actuarial Methods and Assumptions. The Total Pension Liability was determined by an actuarial
valuation as of June 30, 2013, using the following actuarial assumptions, applied to all periods
included in the measurement.
Discount rate, net of plan investment expenses 7.500%
Inflation 3.000%
Salary increases, including inflation 3.0% + merit
Investment rate of return, net of plan investment expenses 7.50%
Municipal bond rate N/A
Projected period of unfunded benefit payments None
The actuarial assumptions used have been recommended by the actuary and adopted by the
System’s Board of Trustees based on the most recent review of the System’s experience
completed in 2011. In the Schedule of Changes in Net Pension Liability, the beginning of year
amount differs from the actuarial accrued liability listed in the July 1, 2013, actuarial valuation
report due to differences in the funding method and assumption changes. GASB Statement No.
67 requires the use of a very specific funding method, which was not used in the previous
valuations. The actuary recommended and the Board of Trustees adopted refinements to the
termination assumption and recognition of unused sick leave balances in the development of the
TPL.
Financial Section
-32- Fairfax County Employees’ Retirement System
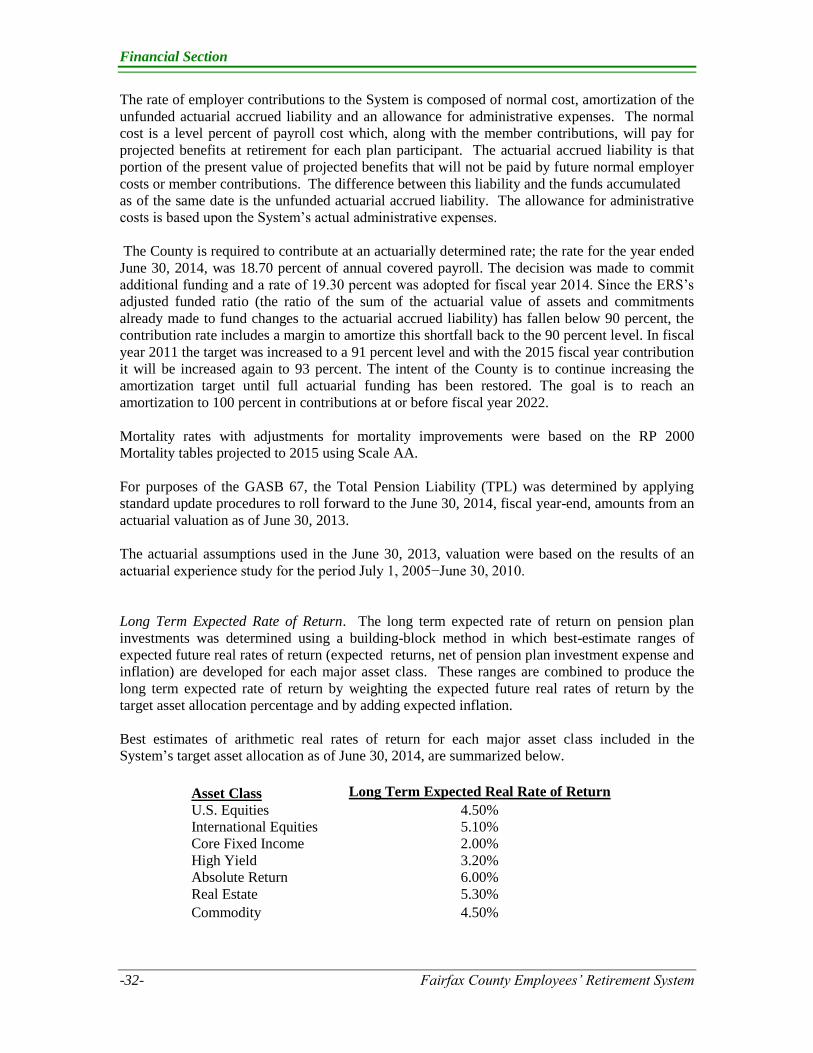
The rate of employer contributions to the System is composed of normal cost, amortization of the
unfunded actuarial accrued liability and an allowance for administrative expenses. The normal
cost is a level percent of payroll cost which, along with the member contributions, will pay for
projected benefits at retirement for each plan participant. The actuarial accrued liability is that
portion of the present value of projected benefits that will not be paid by future normal employer
costs or member contributions. The difference between this liability and the funds accumulated
as of the same date is the unfunded actuarial accrued liability. The allowance for administrative
costs is based upon the System’s actual administrative expenses.
The County is required to contribute at an actuarially determined rate; the rate for the year ended
June 30, 2014, was 18.70 percent of annual covered payroll. The decision was made to commit
additional funding and a rate of 19.30 percent was adopted for fiscal year 2014. Since the ERS’s
adjusted funded ratio (the ratio of the sum of the actuarial value of assets and commitments
already made to fund changes to the actuarial accrued liability) has fallen below 90 percent, the
contribution rate includes a margin to amortize this shortfall back to the 90 percent level. In fiscal
year 2011 the target was increased to a 91 percent level and with the 2015 fiscal year contribution
it will be increased again to 93 percent. The intent of the County is to continue increasing the
amortization target until full actuarial funding has been restored. The goal is to reach an
amortization to 100 percent in contributions at or before fiscal year 2022.
Mortality rates with adjustments for mortality improvements were based on the RP 2000
Mortality tables projected to 2015 using Scale AA.
For purposes of the GASB 67, the Total Pension Liability (TPL) was determined by applying
standard update procedures to roll forward to the June 30, 2014, fiscal year-end, amounts from an
actuarial valuation as of June 30, 2013.
The actuarial assumptions used in the June 30, 2013, valuation were based on the results of an
actuarial experience study for the period July 1, 2005−June 30, 2010.
Long Term Expected Rate of Return. The long term expected rate of return on pension plan
investments was determined using a building-block method in which best-estimate ranges of
expected future real rates of return (expected returns, net of pension plan investment expense and
inflation) are developed for each major asset class. These ranges are combined to produce the
long term expected rate of return by weighting the expected future real rates of return by the
target asset allocation percentage and by adding expected inflation.
Best estimates of arithmetic real rates of return for each major asset class included in the
System’s target asset allocation as of June 30, 2014, are summarized below.
Asset Class Long Term Expected Real Rate of Return
U.S. Equities 4.50% International Equities 5.10% Core Fixed Income 2.00% High Yield 3.20% Absolute Return 6.00% Real Estate 5.30%
Commodity 4.50%

Financial Section
Fairfax County Employee’s Retirement System - 33-
Discount Rate. The discount rate used to measure the total pension liability was 7.5 percent.
The projection of cash flows used to determine the discount rate assumed that plan member
contributions will be made at the current contribution rate and that County contributions will be
made at rates equal to the difference between actuarially determined contribution rates and the
member rate. Based on those assumptions, the pension plan’s fiduciary net position was projected
to be available to make all projected future benefit payments of current plan members. Therefore,
the long-term expected rate of return on pension plan investments was applied to all periods of
projected benefit payments to determine the total pension liability.
In making this determination, we assumed the outflows would equal the anticipated benefit
payments from the 2013 actuarial valuation. The administrative expenses attributable to current
actives were assumed to equal 0.20% of payroll. The inflows to the plan were assumed to
continue at the average aggregate rate for the 2013 active population of 4.71% of payroll and
County contributions were projected at 20.15% for fiscal years 2015 through 2036. After that
time the County contribution was assumed to drop to the normal cost plus expenses (8.50%) since
the unfunded actuarial liability is expected to be paid off by that time.
We also used the actual Fiduciary Net Position at June 30, 2014, in the projections.
Sensitivity of the Net Pension Liability to Changes in the Discount Rate. The following presents
the net pension liability of the County, calculated using the discount rate of 7.5 percent, as well
as what the County’s net pension liability would be if it were calculated using a discount rate
that is 1-percentage-pont lower (6.5 percent) or 1-percentage-higher (8.5 percent) than the current
rate.
Sensitivity of Net Pension Liability to Changes in Discount Rate
1% Decrease Discount Rate 1% Increase
6.50% 7.50% 8.50%
Total Pension Liability $5,480,533,135 $4,807,873,661 $4,259,269,552
Plan Fiduciary Net Position 3,766,059,665 3,766,059,665 3,766,059,665
Net Pension Liability $1,714,473,470 $1,041,813,996 $493,209,887
Plan Fiduciary Net Position as a
Percentage of the Total Pension Liability 68.7% 78.3% 88.4%
E. Income Taxes The Internal Revenue Service issued the System a determination letter which stated that the
System and its underlying trust qualify under the applicable provisions of the Internal Revenue
Code and therefore are exempt from federal income taxes.

Financial Section
-34- Fairfax County Employees’ Retirement System
Required Supplementary Information (unaudited)
Schedule of Changes in the Net Pension Liability and Related Ratios
For the fiscal year ending June 30, 2014
Total Pension Liability
Service cost $84,074,831
Interest 340,919,519
Changes in benefit terms 0
Differences between expected an actual experience 0
Changes in assumptions 0 Benefit payments, including refunds of member
contributions (238,560,893)
Net change in Total Pension Liability 186,433,457
Total Pension Liability - beginning 4,621,440,204
Total Pension Liability - ending (a) $4,807,873,661
Plan Fiduciary Net Position
Contributions - employer $129,618,309
Contributions - member 32,758,587
Net investment income 490,196,386 Benefit payments, including refunds of member
contributions (238,560,893)
Administrative expenses (1,884,827)
Net change in Plan Fiduciary Net Position 412,127,562
Plan Fiduciary Net Position - beginning 3,353,932,103
Plan Fiduciary Net Position - ending (b) $ 3,766,059,665
Net Pension Liability (Asset) - ending (a)-(b) $ 1,041,813,996 Plan Fiduciary Net Position as a Percentage of the
Total Pension Liability 78.3%
Covered Employee Payroll $671,597,456 Net Pension Liability as a Percentage of covered
Employee Payroll 155.12 %
The total pension liability contained in this schedule was provided by Cheiron, the System’s
Actuary. The net pension liability is measured as the total pension liability less the amount of the
fiduciary net position of the Employees’ Retirement System.
This schedule is intended to show information for 10 years. Additional years will be displayed as they become
available.
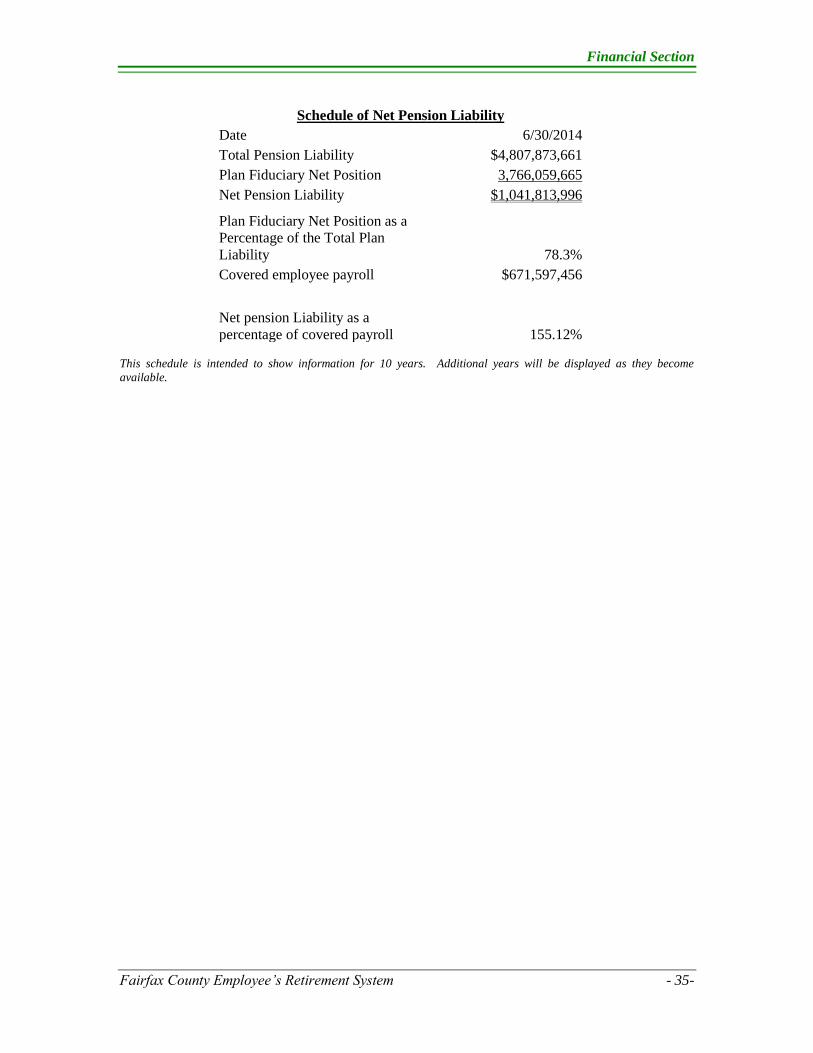
Financial Section
Fairfax County Employee’s Retirement System - 35-
Schedule of Net Pension Liability
Date 6/30/2014
Total Pension Liability $4,807,873,661
Plan Fiduciary Net Position 3,766,059,665
Net Pension Liability $1,041,813,996
Plan Fiduciary Net Position as a
Percentage of the Total Plan
Liability 78.3%
Covered employee payroll $671,597,456
Net pension Liability as a
percentage of covered payroll 155.12%
This schedule is intended to show information for 10 years. Additional years will be displayed as they become
available.
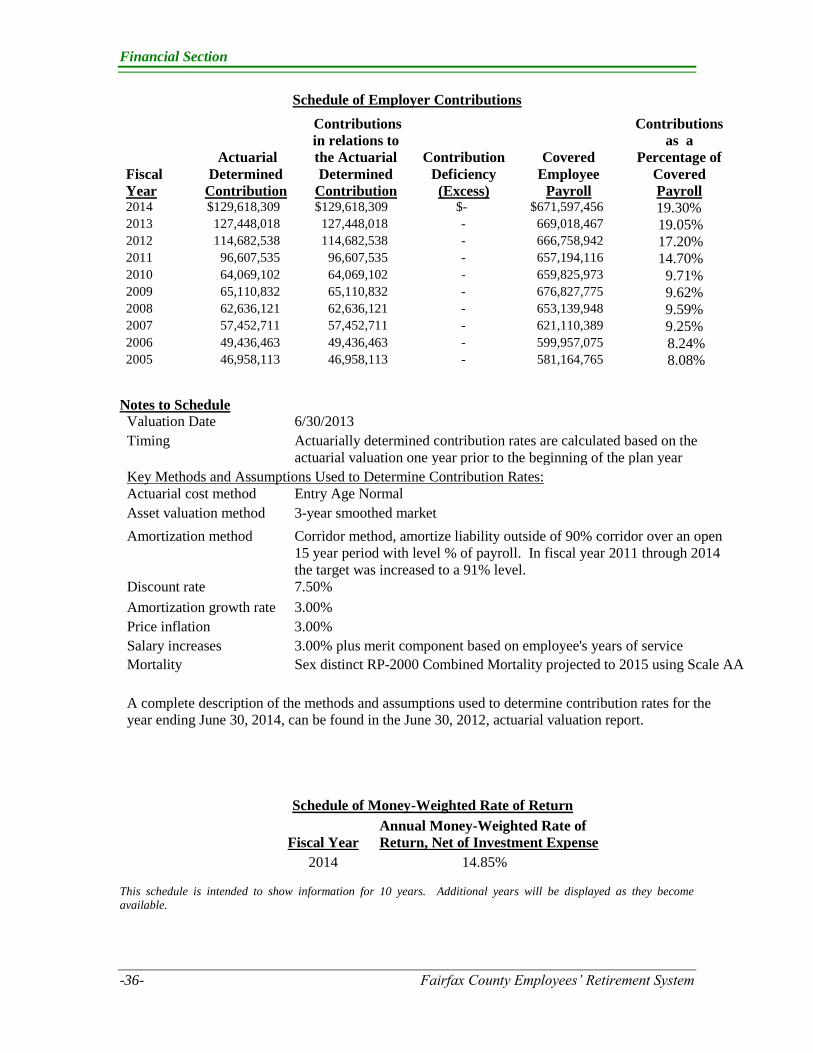
Financial Section
-36- Fairfax County Employees’ Retirement System
Schedule of Employer Contributions
Fiscal
Year
Actuarial
Determined
Contribution
Contributions
in relations to
the Actuarial
Determined
Contribution
Contribution
Deficiency
(Excess)
Covered
Employee
Payroll
Contributions
as a
Percentage of
Covered
Payroll 2014 $129,618,309 $129,618,309 $- $671,597,456 19.30% 2013 127,448,018 127,448,018 - 669,018,467 19.05% 2012 114,682,538 114,682,538 - 666,758,942 17.20% 2011 96,607,535 96,607,535 - 657,194,116 14.70% 2010 64,069,102 64,069,102 - 659,825,973 9.71% 2009 65,110,832 65,110,832 - 676,827,775 9.62% 2008 62,636,121 62,636,121 - 653,139,948 9.59% 2007 57,452,711 57,452,711 - 621,110,389 9.25% 2006 49,436,463 49,436,463 - 599,957,075 8.24% 2005 46,958,113 46,958,113 - 581,164,765 8.08%
Notes to Schedule
Valuation Date 6/30/2013
Timing Actuarially determined contribution rates are calculated based on the
actuarial valuation one year prior to the beginning of the plan year
Key Methods and Assumptions Used to Determine Contribution Rates:
Actuarial cost method Entry Age Normal
Asset valuation method 3-year smoothed market
Amortization method Corridor method, amortize liability outside of 90% corridor over an open
15 year period with level % of payroll. In fiscal year 2011 through 2014
the target was increased to a 91% level.
Discount rate 7.50%
Amortization growth rate 3.00%
Price inflation 3.00%
Salary increases 3.00% plus merit component based on employee's years of service
Mortality Sex distinct RP-2000 Combined Mortality projected to 2015 using Scale AA
A complete description of the methods and assumptions used to determine contribution rates for the
year ending June 30, 2014, can be found in the June 30, 2012, actuarial valuation report.
Schedule of Money-Weighted Rate of Return
Fiscal Year Annual Money-Weighted Rate of
Return, Net of Investment Expense
2014 14.85%
This schedule is intended to show information for 10 years. Additional years will be displayed as they become
available.
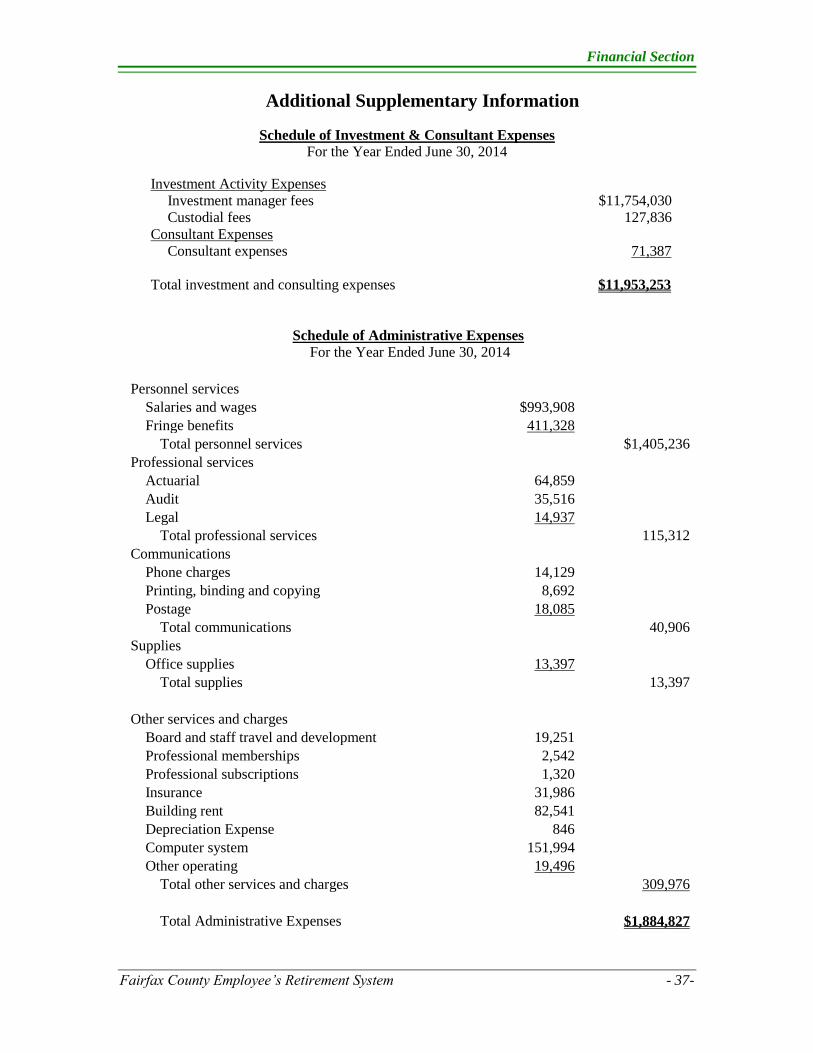
Financial Section
Fairfax County Employee’s Retirement System - 37-
Additional Supplementary Information
Schedule of Investment & Consultant Expenses
For the Year Ended June 30, 2014
Investment Activity Expenses
Investment manager fees $11,754,030
Custodial fees 127,836
Consultant Expenses
Consultant expenses 71,387
Total investment and consulting expenses $11,953,253
Schedule of Administrative Expenses For the Year Ended June 30, 2014
Personnel services
Salaries and wages $993,908
Fringe benefits 411,328
Total personnel services $1,405,236
Professional services
Actuarial 64,859
Audit 35,516
Legal 14,937
Total professional services 115,312
Communications
Phone charges 14,129
Printing, binding and copying 8,692
Postage 18,085
Total communications 40,906
Supplies
Office supplies 13,397
Total supplies 13,397
Other services and charges
Board and staff travel and development 19,251
Professional memberships 2,542
Professional subscriptions 1,320
Insurance 31,986
Building rent 82,541
Depreciation Expense 846
Computer system 151,994
Other operating 19,496
Total other services and charges 309,976
Total Administrative Expenses $1,884,827

-38- Fairfax County Employees’ Retirement System
This Page Left Intentionally Blank

Investment Section
Fairfax County Employees’ Retirement System - 39 -
C o u n t y o f F a i r f a x , V i r g i n i a
To protect and enrich the quality of life for the people, neighborhoods and diverse communities of Fairfax County
December 5, 2014
Dear Members of the Board of Trustees:
Fiscal year 2014 followed a strong 2013 and the System benefited from strong performance
across almost all asset classes. Global equities and fixed income assets ended in the black and
their gains came amidst startlingly low volatility. Investors embraced risk-on trades as the Federal
Reserve focused on creating jobs and kept in place an accommodative monetary policy. Investors
showed resilience to headline risks related to the government shutdown, uncertainty as to
Bernanke’s successor, a severe downward revision to U.S. GDP, a reduction in the Fed
quantitative easing program, and geopolitical tensions arising from Russia and the Middle East.
As the 2013 calendar year came to a close, the U.S. economy appeared to be picking up steam
with rising growth and falling unemployment even as the Fed began to modestly taper its
monetary stimulus. Investor sentiment turned positive in September 2013 when Janet Yellen
emerged as the favored candidate to serve as the chair of the Federal Reserve. The U.S. consumer
was a key driver to the strengthening economy with consumption, income and retail sales all
achieving all time highs in the last fiscal quarter of 2014. U.S. Federal public debt continues to
grow and now exceeds 100% of GDP, however higher debt levels, here and across the Globe,
prove to be manageable in what many fear is an artificially low interest rate environment. In the
final quarter of the fiscal year, all major asset classes moved higher - overlooking a severe
revision downward for the first quarter U.S. GDP growth to -1.0%, attributed to poor weather.
Macro policy and politics affected global markets with fears of a slowdown in China’s growth,
European debt woes, and slowing growth in emerging markets. Most of the world’s leading
central banks maintained their supportive monetary policies. Following a strong fiscal 2013,
growth assets in developed markets continued their upward trajectory, while emerging market
stocks and bonds rallied in the last fiscal quarter to offset the weak performance in the prior
quarter. Markets mostly shrugged off the geopolitical tensions arising from Russia taking control
of Crimea, and the sustained economic slowdown in emerging economies. Emerging market
assets continued their recovery with large inflows pouring into equity and debt during the last
quarter as investors dismissed balance of payment concerns.
Domestic Equity Markets
U.S. equity markets were up strongly in 2014 fiscal year, producing positive returns across the
board and outpacing a strong 2013. Throughout the year, investors shrugged off the “fiscal cliff”,
the change in leadership at the Federal Reserve, the “taper tantrum”, the government shutdown,
and geopolitical tensions in the Middle East. Large cap stocks outperformed small cap stocks by
Fairfax County Retirement Systems
10680 Main Street * Suite 280 * Fairfax, VA 22030
Phone: 703-279-8200*1-800-333-1633*Fax: 703-273-3185
www.fairfaxcounty.gov/retirement/
Investment Section
- 40 - Fairfax County Employees’ Retirement System
+1.0% as the S&P 500 returned +24.6% for the fiscal year and finished the year by posting its 6th
consecutive quarter of gains and the Russell 2000 returned +23.6% for the fiscal year. Large cap
growth outperformed large cap value with the Russell 1000 Growth up 26.9% compared to
+23.1% for the Russell 1000 Value. The same trend held true in smaller cap names as the Russell
2000 Growth returned +24.7 as compared with the Russell 2000 Value Index return of +22.5%.
Domestic Fixed Income Markets
Bond markets rallied for the fiscal year, with the star performers being high-yield bonds,
leveraged loans, and U.S. credit. Credit spreads tightened significantly while the 10-Year U.S.
Treasury bond yielding 2.5% finished the fiscal year essentially flat with the beginning of the
year. For the fiscal year the Barclays Aggregate Bond Index returned +2.0% while high yield
bonds posted strong gains returning +11.7%. Demand for floating-rate assets climbed through
the year. With concern around rising interest rates, bank loans ended the year with gains of
+5.6%, according to the S&P LSTA Loan Index. Despite record new supply, investment grade
credit posted strong performance, with Barclays U.S. Credit gaining +7.4% for the one-year
period ended June 30, 2014.
International Markets
International equity markets were boosted by improving economic data and lower debt yields in
Europe, especially in some of the more troubled regions such as Greece, Italy, and Spain.
International developed market equities as measured by the MSCI EAFE Index (a broad index of
the international developed market equities) returned +24.1% for the year with the strongest
contribution coming from Europe and the UK. Emerging market investments were bolstered by
improving confidence in Latin America, positive election results in India, and better economic
conditions in China. Emerging markets equities, as measured by the MSCI Emerging Markets
Index, returned +14.7% for the year with the strongest results coming from Asia.
International fixed income markets were generally positive with the Barclay’s Global Aggregate
Bond Index up +7.4%. Emerging market debt was also a clear winner in the first half of 2014
following a challenging 2013. In addition to the accommodative action by the ECB, declining
Treasury yields and economic stability in several emerging market countries provided a tailwind
for the asset class. According to the JPM GBI-EM Global Diversified Index, emerging market
debt had a stellar year, returning +11.6%.
Employees’ System
The Employees’ Retirement System operates a sound and diversified investment program with
disciplined asset re-balancing to achieve strategic long-term goals. This disciplined investment
process has been effective in achieving a long-term record of consistent asset growth. The System
follows a risk balanced approach to diversify market risk exposures and returns. Using futures
and other derivative instruments, the System increases the allocation to low risk and return assets
classes and reduces the relative allocation to high risk, higher return asset classes. By using
futures, the System’s economic exposure to all asset classes commonly exceeds the 100%
weighting of the capital value of the portfolio’s assets.
For fiscal year 2014, investments provided a return of 15.2%, gross of fees (14.9%, net of fees).
The System’s annualized rates of return, gross of fees, were 10.7% (10.3%, net of fees) over the
last three years and 16.2%, (15.7%, net of fees), over the last five years. These System returns

Investment Section
Fairfax County Employees’ Retirement System - 41 -
ranked in the 81st percentile of The Bank of New York Mellon universe of public plans for 2014,
in the 24th percentile for the latest 3-year period, and in the 1st percentile of public plans for the
last 5 years.
During the past twelve months, Quantitative Management Associates was added to the Emerging
Markets Equity manager lineup replacing the TCW Worldwide Opportunities Fund. The
Employees’ System added two fixed income managers, Lazard Emerging Markets Debt Blend
Fund and PIMCO BRAVO (Bank Recapitalization and Value Opportunities) Fund II to the
lineup, and Gramercy Distressed Opportunities Fund and Gramercy Argentina Debt Fund were
removed. PIMCO All Asset Fund was added to the Absolute Return Manager lineup.
Sincerely,
Gregory A. Samay
Chief Investment Officer

Investment Section
- 42 - Fairfax County Employees’ Retirement System
Investments by Category and Investment Manager** June 30, 2014
Asset Class % of Total
Manager Investment Style Total Fair Market Values Portfolio
Domestic Equities
Columbia Wanger Asset Management Small/Mid Cap Core $234,020,451 6.2%
DePrince, Race & Zollo Large Cap Value 158,594,926 4.2%
Enhanced Inv. Technologies (INTECH) Large Cap Growth 162,194,714 4.3%
Pzena Investment Management Large Cap Value 148,262,037 3.9%
Sands Capital Management Large Cap Growth 82,226,757 2.2%
International Equities
BlackRock Emerging Markets Emerging Markets Index 52,820,607 1.4%
First Eagle Investment Management* Developed Markets 57,585,175 1.5%
LSV Asset Management Developed Markets Value 100,423,683 2.7%
Marathon Asset Management* Developed Markets 54,064,917 1.4%
Quantitative Management Associates* Emerging Markets 61,416,231 1.6%
WCM Investment Management Developed Markets 91,245,053 2.4%
Fixed Income
Brandywine Asset Management Global Bonds 189,239,781 5.0%
Bridgewater Associates Enhanced Multi-Asset Real Return 476,413,630 12.6%
Bridgewater Associates* TIPS Index 232,566,790 6.2%
Czech Asset Management* Direct Lending 29,685,126 0.8%
DoubleLine Capital Mortgage-Backed Securities 230,509,798 6.1%
DoubleLine Capital Special Mortage Credit 43,055,694 1.1%
JPMorgan Global Maritime Fund* Distressed Opportunity 8,958,776 0.2%
JPMorgan* Fixed Income Opportunity Fund 10,173,394 0.3%
Lazard Asset Management* Emerging Markets Debt 36,703,023 1.0%
MacKay Shields High Yield Bonds 97,646,714 2.6%
Pacific Investment Management Co. (PIMCO)* Bank Recapitalization/Value 13,484,033 0.4%
Pacific Investment Management Co. (PIMCO)* Distressed Senior Credit 64,482,210 1.7%
Post Advisory High Yield Bonds 102,173,461 2.7%
Shenkman Capital Management High Yield Bonds 92,499,218 2.5%
Real Estate and Commodity
Cohen & Steers Capital Management Int'l Real Estate Securities 91,277,336 2.4%
Cohen & Steers Capital Management U.S. Real Estate Inv. Trusts 232,173,432 6.2%
Pacific Investment Management Co. (PIMCO) Collateralized Commodity Futures 93,951,067 2.5%
Absolute Return
BGI Global Ascent Fund* Global Macro Absolute Return Fund 50,443,414 1.3%
BGI GlobalAlpha Fund* Multi-Strategy Absolute Return Fund 83,036,226 2.2%
Deephaven Capital Management* Multi-Strategy Absolute Return Fund 61,134 0.0%
Eagle Trading Systems* Global Macro Absolute Return Fund 58,555,344 1.6%
FrontPoint Partners* Multi-Strategy Absolute Return Fund 343,411 0.0%
Pacific Investment Management Co. (PIMCO)* Global Credit Opportunity Fund 92,953,339 2.5%
Pacific Investment Management Co. (PIMCO)* Global Macro Absolute Return Fund 84,391,427 2.2%
Pacific Investment Management Co. (PIMCO)* Multi-Strategy Absolute Return Fund 74,200,446 2.0%
Short-term
BNY Mellon Cash Investment Strategies Plan Level Cash Accounts 55,037,650 1.5%
Cash Held at County Treasurer Operating Cash Account 4,562,036 0.1%
The Clifton Group Policy Implementation Overlay 16,825,002 0.5%
Total Investments $3,768,257,463 100.0%
* Pooled fund **See Pages 7-8 for complete listing of investment professionals.
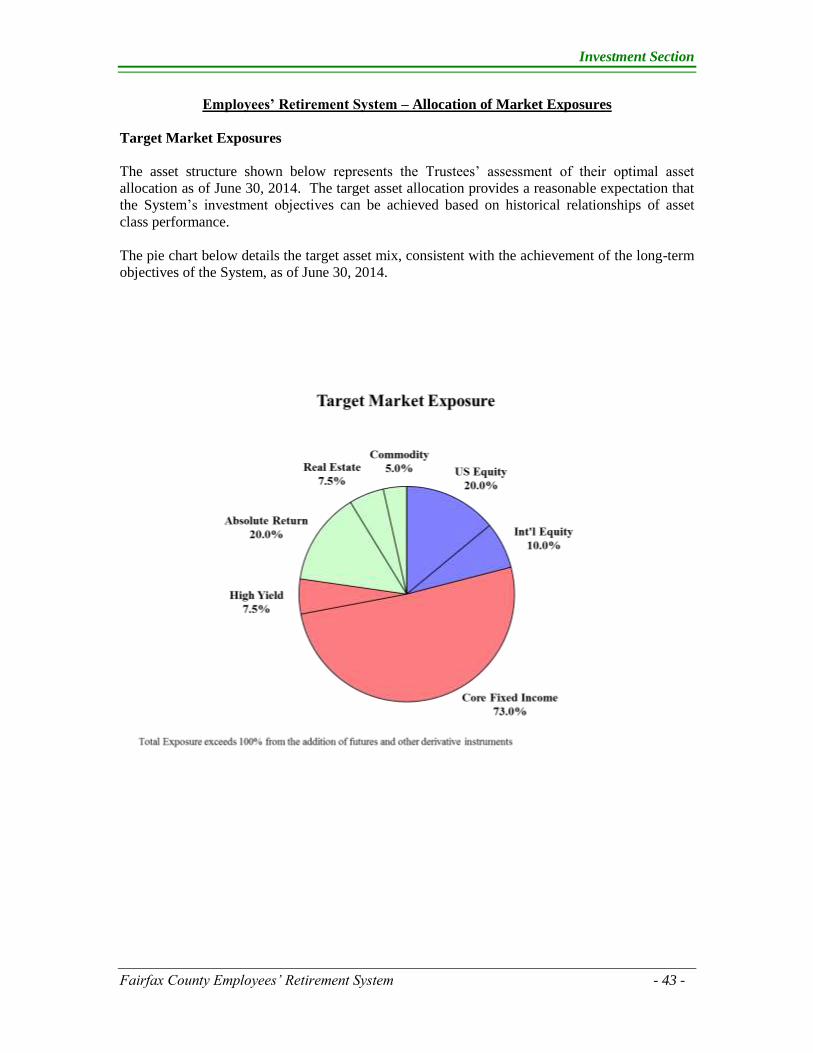
Investment Section
Fairfax County Employees’ Retirement System - 43 -
Employees’ Retirement System – Allocation of Market Exposures
Target Market Exposures
The asset structure shown below represents the Trustees’ assessment of their optimal asset
allocation as of June 30, 2014. The target asset allocation provides a reasonable expectation that
the System’s investment objectives can be achieved based on historical relationships of asset
class performance.
The pie chart below details the target asset mix, consistent with the achievement of the long-term
objectives of the System, as of June 30, 2014.
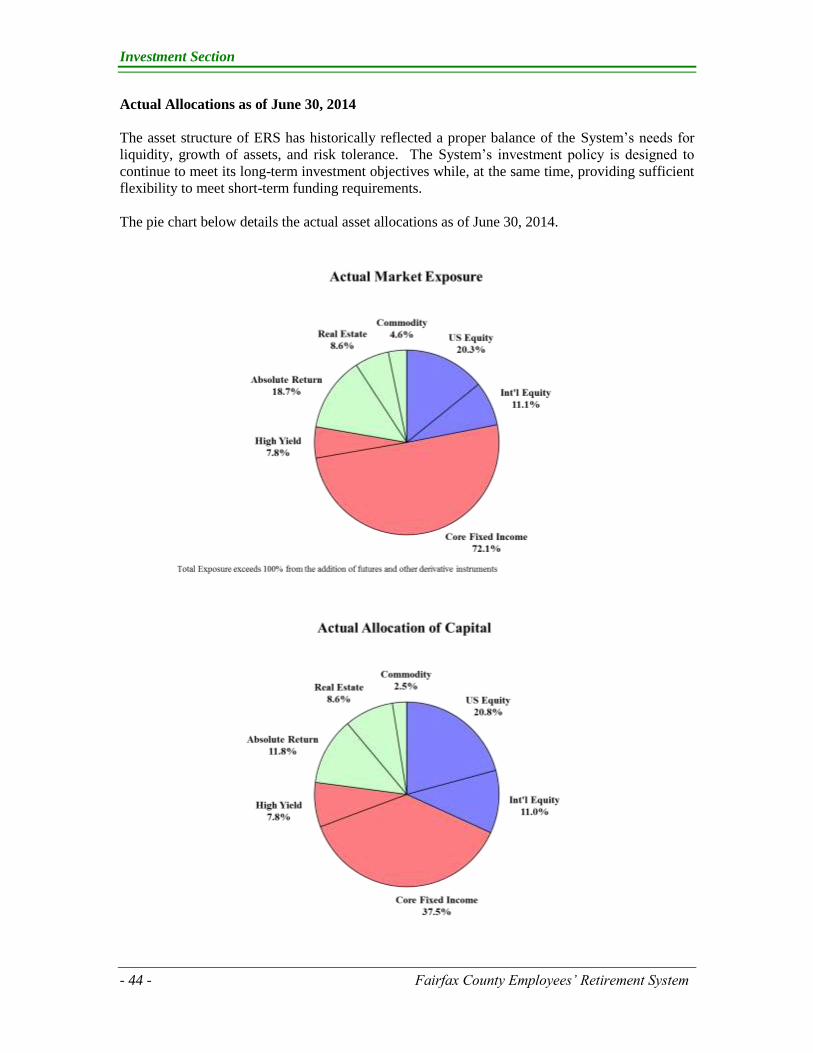
Investment Section
- 44 - Fairfax County Employees’ Retirement System
Actual Allocations as of June 30, 2014
The asset structure of ERS has historically reflected a proper balance of the System’s needs for
liquidity, growth of assets, and risk tolerance. The System’s investment policy is designed to
continue to meet its long-term investment objectives while, at the same time, providing sufficient
flexibility to meet short-term funding requirements.
The pie chart below details the actual asset allocations as of June 30, 2014.
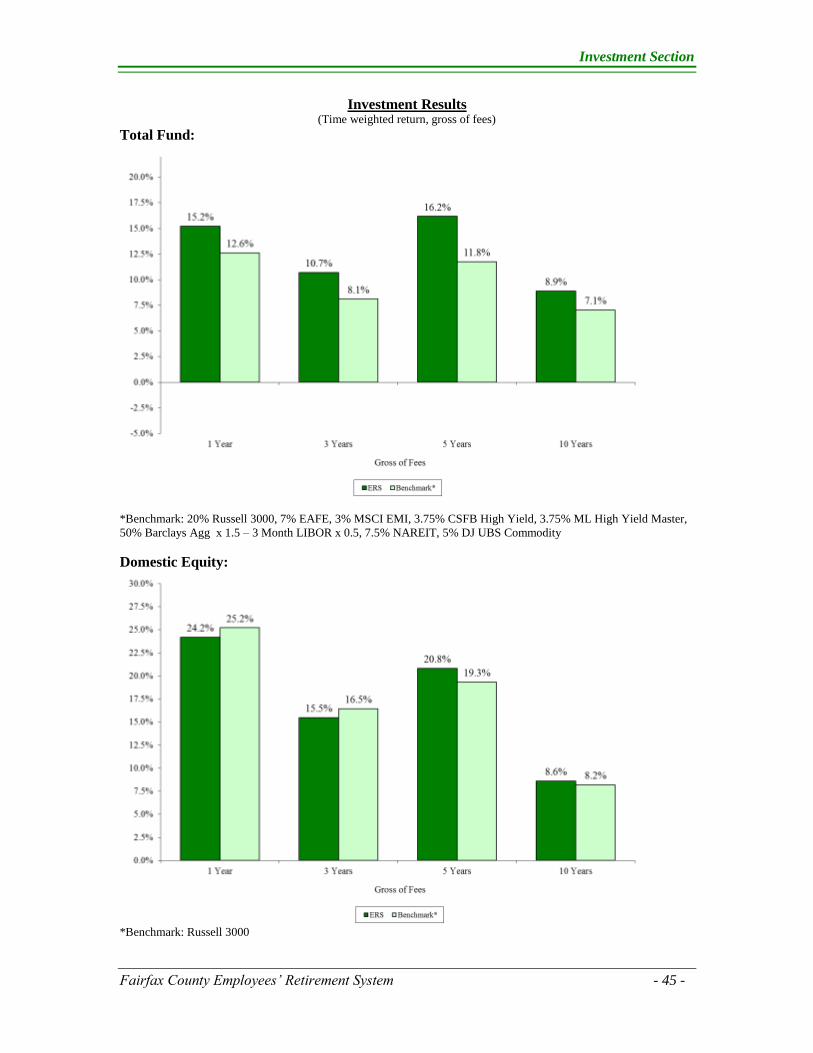
Investment Section
Fairfax County Employees’ Retirement System - 45 -
Investment Results (Time weighted return, gross of fees)
Total Fund:
*Benchmark: 20% Russell 3000, 7% EAFE, 3% MSCI EMI, 3.75% CSFB High Yield, 3.75% ML High Yield Master,
50% Barclays Agg x 1.5 – 3 Month LIBOR x 0.5, 7.5% NAREIT, 5% DJ UBS Commodity
Domestic Equity:
*Benchmark: Russell 3000

Investment Section
- 46 - Fairfax County Employees’ Retirement System
Investment Results (Time weighted return, gross of fees)
International Equity:
*Benchmark: 67% MSCI EAFE, 33% MSCI EM
Fixed Income:
*Benchmark: 81.25% Barclays Agg x 1.5 – 3 Month LIBOR x 0.5, 9.375% CSFB High Yield, 9.375% ML High Yield
Master

Investment Section
Fairfax County Employees’ Retirement System - 47 -
Investment Results (Time weighted return, gross of fees)
Real Estate:
*Benchmark: NAREIT Equity Share Price Index
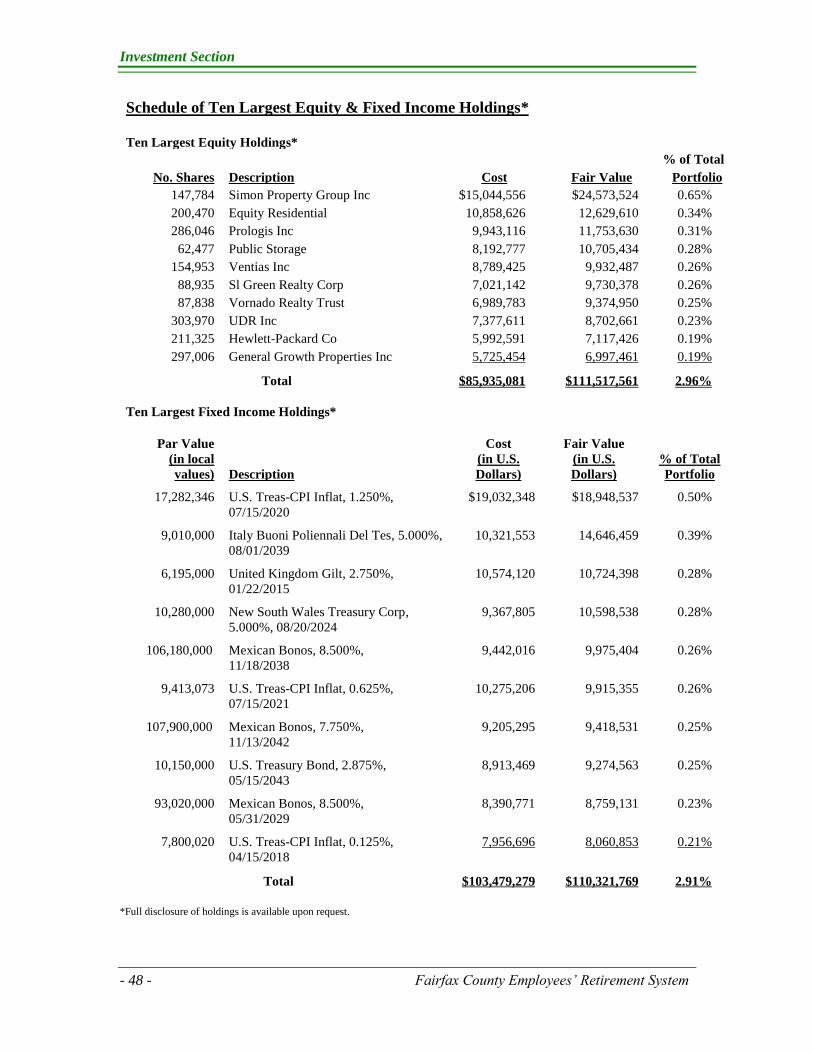
Investment Section
- 48 - Fairfax County Employees’ Retirement System
Schedule of Ten Largest Equity & Fixed Income Holdings*
Ten Largest Equity Holdings*
% of Total
No. Shares Description Cost Fair Value Portfolio
147,784 Simon Property Group Inc $15,044,556 $24,573,524 0.65%
200,470 Equity Residential 10,858,626 12,629,610 0.34%
286,046 Prologis Inc 9,943,116 11,753,630 0.31%
62,477 Public Storage 8,192,777 10,705,434 0.28%
154,953 Ventias Inc 8,789,425 9,932,487 0.26%
88,935 Sl Green Realty Corp 7,021,142 9,730,378 0.26%
87,838 Vornado Realty Trust 6,989,783 9,374,950 0.25%
303,970 UDR Inc 7,377,611 8,702,661 0.23%
211,325 Hewlett-Packard Co 5,992,591 7,117,426 0.19%
297,006 General Growth Properties Inc 5,725,454 6,997,461 0.19%
Total $85,935,081 $111,517,561 2.96%
Ten Largest Fixed Income Holdings*
Par Value Cost Fair Value
(in local
values) Description
(in U.S.
Dollars)
(in U.S.
Dollars)
% of Total
Portfolio
17,282,346
U.S. Treas-CPI Inflat, 1.250%,
07/15/2020
$19,032,348
$18,948,537
0.50%
9,010,000
Italy Buoni Poliennali Del Tes, 5.000%,
08/01/2039
10,321,553
14,646,459
0.39%
6,195,000
United Kingdom Gilt, 2.750%,
01/22/2015
10,574,120
10,724,398
0.28%
10,280,000
New South Wales Treasury Corp,
5.000%, 08/20/2024
9,367,805
10,598,538
0.28%
106,180,000
Mexican Bonos, 8.500%,
11/18/2038
9,442,016
9,975,404
0.26%
9,413,073
U.S. Treas-CPI Inflat, 0.625%,
07/15/2021
10,275,206
9,915,355
0.26%
107,900,000
Mexican Bonos, 7.750%,
11/13/2042
9,205,295
9,418,531
0.25%
10,150,000
U.S. Treasury Bond, 2.875%,
05/15/2043
8,913,469
9,274,563
0.25%
93,020,000
Mexican Bonos, 8.500%,
05/31/2029
8,390,771
8,759,131
0.23%
7,800,020
U.S. Treas-CPI Inflat, 0.125%,
04/15/2018
7,956,696
8,060,853
0.21%
Total $103,479,279 $110,321,769 2.91%
*Full disclosure of holdings is available upon request.
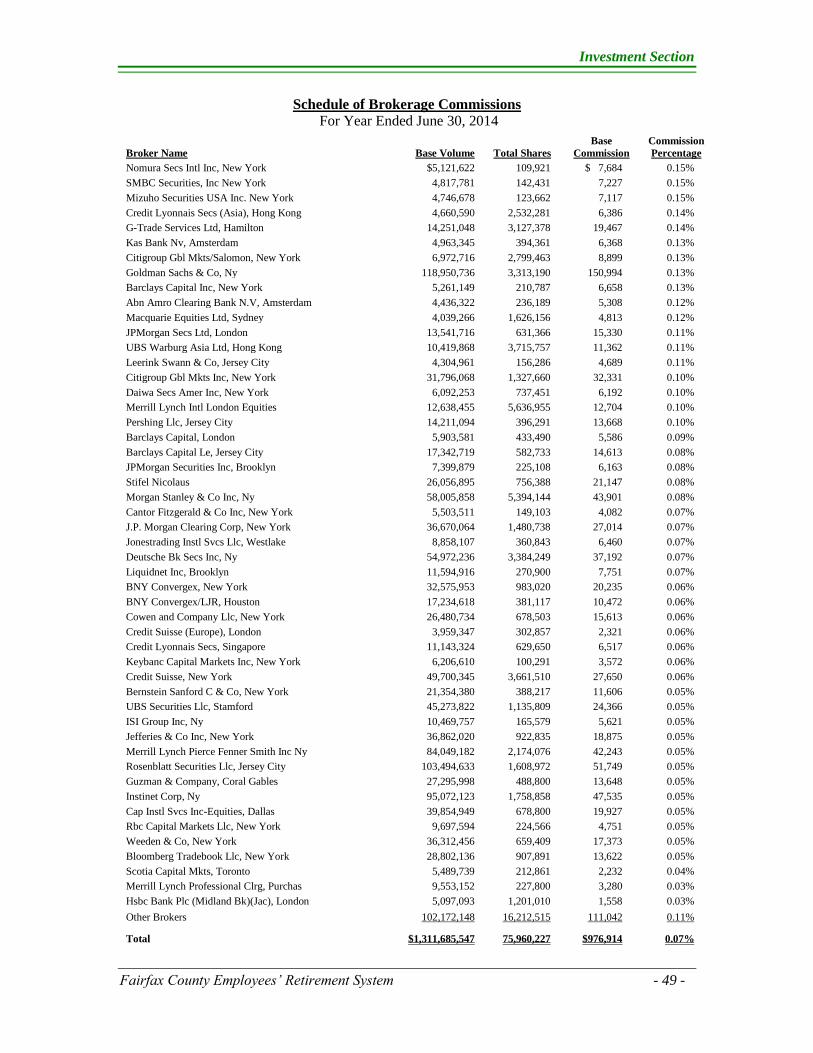
Investment Section
Fairfax County Employees’ Retirement System - 49 -
Schedule of Brokerage Commissions
For Year Ended June 30, 2014
Broker Name Base Volume Total Shares
Base
Commission
Commission
Percentage
Nomura Secs Intl Inc, New York $5,121,622 109,921 $ 7,684 0.15%
SMBC Securities, Inc New York 4,817,781 142,431 7,227 0.15%
Mizuho Securities USA Inc. New York 4,746,678 123,662 7,117 0.15%
Credit Lyonnais Secs (Asia), Hong Kong 4,660,590 2,532,281 6,386 0.14%
G-Trade Services Ltd, Hamilton 14,251,048 3,127,378 19,467 0.14%
Kas Bank Nv, Amsterdam 4,963,345 394,361 6,368 0.13%
Citigroup Gbl Mkts/Salomon, New York 6,972,716 2,799,463 8,899 0.13%
Goldman Sachs & Co, Ny 118,950,736 3,313,190 150,994 0.13%
Barclays Capital Inc, New York 5,261,149 210,787 6,658 0.13%
Abn Amro Clearing Bank N.V, Amsterdam 4,436,322 236,189 5,308 0.12%
Macquarie Equities Ltd, Sydney 4,039,266 1,626,156 4,813 0.12%
JPMorgan Secs Ltd, London 13,541,716 631,366 15,330 0.11%
UBS Warburg Asia Ltd, Hong Kong 10,419,868 3,715,757 11,362 0.11%
Leerink Swann & Co, Jersey City 4,304,961 156,286 4,689 0.11%
Citigroup Gbl Mkts Inc, New York 31,796,068 1,327,660 32,331 0.10%
Daiwa Secs Amer Inc, New York 6,092,253 737,451 6,192 0.10%
Merrill Lynch Intl London Equities 12,638,455 5,636,955 12,704 0.10%
Pershing Llc, Jersey City 14,211,094 396,291 13,668 0.10%
Barclays Capital, London 5,903,581 433,490 5,586 0.09%
Barclays Capital Le, Jersey City 17,342,719 582,733 14,613 0.08%
JPMorgan Securities Inc, Brooklyn 7,399,879 225,108 6,163 0.08%
Stifel Nicolaus 26,056,895 756,388 21,147 0.08%
Morgan Stanley & Co Inc, Ny 58,005,858 5,394,144 43,901 0.08%
Cantor Fitzgerald & Co Inc, New York 5,503,511 149,103 4,082 0.07%
J.P. Morgan Clearing Corp, New York 36,670,064 1,480,738 27,014 0.07%
Jonestrading Instl Svcs Llc, Westlake 8,858,107 360,843 6,460 0.07%
Deutsche Bk Secs Inc, Ny 54,972,236 3,384,249 37,192 0.07%
Liquidnet Inc, Brooklyn 11,594,916 270,900 7,751 0.07%
BNY Convergex, New York 32,575,953 983,020 20,235 0.06%
BNY Convergex/LJR, Houston 17,234,618 381,117 10,472 0.06%
Cowen and Company Llc, New York 26,480,734 678,503 15,613 0.06%
Credit Suisse (Europe), London 3,959,347 302,857 2,321 0.06%
Credit Lyonnais Secs, Singapore 11,143,324 629,650 6,517 0.06%
Keybanc Capital Markets Inc, New York 6,206,610 100,291 3,572 0.06%
Credit Suisse, New York 49,700,345 3,661,510 27,650 0.06%
Bernstein Sanford C & Co, New York 21,354,380 388,217 11,606 0.05%
UBS Securities Llc, Stamford 45,273,822 1,135,809 24,366 0.05%
ISI Group Inc, Ny 10,469,757 165,579 5,621 0.05%
Jefferies & Co Inc, New York 36,862,020 922,835 18,875 0.05%
Merrill Lynch Pierce Fenner Smith Inc Ny 84,049,182 2,174,076 42,243 0.05%
Rosenblatt Securities Llc, Jersey City 103,494,633 1,608,972 51,749 0.05%
Guzman & Company, Coral Gables 27,295,998 488,800 13,648 0.05%
Instinet Corp, Ny 95,072,123 1,758,858 47,535 0.05%
Cap Instl Svcs Inc-Equities, Dallas 39,854,949 678,800 19,927 0.05%
Rbc Capital Markets Llc, New York 9,697,594 224,566 4,751 0.05%
Weeden & Co, New York 36,312,456 659,409 17,373 0.05%
Bloomberg Tradebook Llc, New York 28,802,136 907,891 13,622 0.05%
Scotia Capital Mkts, Toronto 5,489,739 212,861 2,232 0.04%
Merrill Lynch Professional Clrg, Purchas 9,553,152 227,800 3,280 0.03%
Hsbc Bank Plc (Midland Bk)(Jac), London 5,097,093 1,201,010 1,558 0.03%
Other Brokers 102,172,148 16,212,515 111,042 0.11%
Total $1,311,685,547 75,960,227 $976,914 0.07%
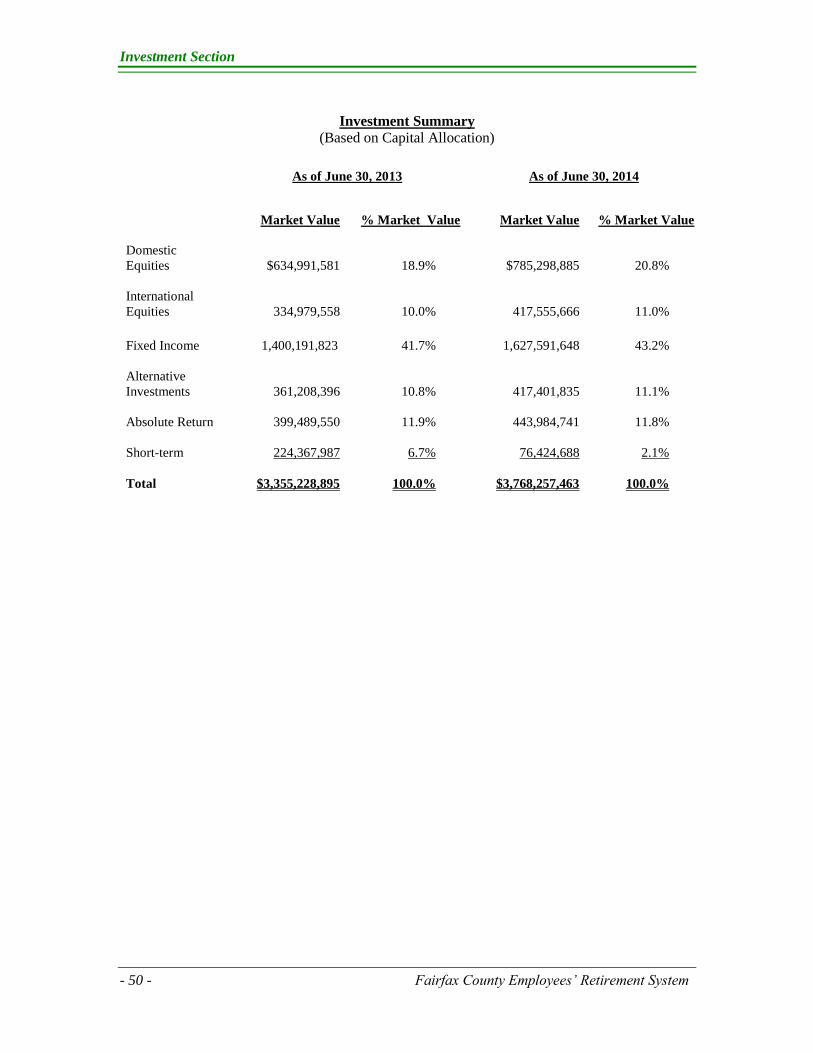
Investment Section
- 50 - Fairfax County Employees’ Retirement System
Investment Summary
(Based on Capital Allocation)
As of June 30, 2013 As of June 30, 2014
Market Value % Market Value Market Value % Market Value
Domestic
Equities
$634,991,581 18.9%
$785,298,885 20.8%
International
Equities 334,979,558 10.0% 417,555,666 11.0%
Fixed Income 1,400,191,823 41.7% 1,627,591,648 43.2%
Alternative
Investments 361,208,396 10.8% 417,401,835 11.1%
Absolute Return 399,489,550 11.9% 443,984,741 11.8%
Short-term 224,367,987 6.7% 76,424,688 2.1%
Total
$3,355,228,895 100.0%
$3,768,257,463 100.0%

Actuarial Section
Fairfax County Employees’ Retirement System - 51 -
March 24, 2014
Fairfax County Employees’
Retirement System
10680 Main Street, Suite 280
Fairfax, Virginia 22030-3812
Dear Members of the Board:
At your request, we have conducted our annual actuarial valuation of the Fairfax County Employees’
Retirement System as of July 1, 2013. The results of the valuation are contained in this report.
Funding Objective
The funding objective of the System is to establish contribution rates which, over time, will remain level
as a percent of payroll and will fully fund the actuarially determined contribution. In order to achieve a
more stable contribution rate the Employer implemented a corridor funding method on July 1, 2002,
(based on the July 1, 2001, valuation results). Under this approach the contribution rate is based on the
normal cost rate and expense rate on July 1, 2001, adjusted for subsequent plan changes, including a 15
year amortization of any UAL impact. The rate includes an additional charge once the actuarial funded
ratio falls below 90%. Originally this additional charge was designed to amortize the amount of
underfunding to the 90% threshold. The actuary and Board have recommended and the Employer has
taken steps to increase this target from 90% until it reaches a target of 100%.
Assumptions
The actuarial assumptions used in performing the July 1, 2013, valuation were recommended by the
actuary and adopted by the Board of Trustees based on our most recent review of the System’s experience
for the five year period ending June 30, 2010. The assumptions reflect our understanding of the likely
future experience of the System and the assumptions as a whole represent our best estimate for the future
experience of the System. The results of this report are dependent upon future experience conforming to
these assumptions. To the extent that future experience deviates from the underlying assumptions, the
results would vary accordingly.
The assumptions and methods used in determining the assets, liabilities, and the annual required
contributions of the employer as defined by the Government Accounting Standards Board (GASB) meet
the parameters set by GASB Statement No. 25, Financial Reporting for Defined Benefit Pension Plans
and Note Disclosures for Defined Contributions Plans.
Reliance on Others
In preparing our report, we relied on information (some oral and some written) supplied by the
Retirement System. This information includes, but is not limited to, plan provisions, employee data, and
financial information. We performed an informal examination of the obvious characteristics of the data
for reasonableness and consistency in accordance with Actuarial Standards of Practice No. 23.
Actuarial Section
- 52 - Fairfax County Employees’ Retirement System
March 24, 2014
Fairfax County Employees’ Retirement System
Page 2
Supporting Schedules
We are responsible for all supporting schedules to be found in the Actuarial Section.
We are responsible for the 2004 through 2013 information shown in historical sections of this report. All
data shown prior to 2004 was prepared by the prior actuary.
Compliance with Code of Virginia §51.1-800
Code of Virginia §51.1-800 requires that the benefits provided to a retiree at age 65 from a local
retirement system equal or exceed two-thirds of the allowance to which the employee would be entitled
under the provisions of the Virginia Retirement System (VRS).
Although there is no formal procedure for making this comparison, we compared the least valuable rate
under the Employees’ System to the most valuable accrual rate under the VRS, making adjustments for
the fact that employee contributions are required in excess of the VRS 5% rate. The employer provided
accrual rates do exceed two-thirds of the employer provided accrual rates under the VRS plan.
We certify that, to the best of our knowledge and understanding, the Fairfax County Employees’
Retirement System satisfies the requirements of the Code of Virginia §51.1-800.
Certification
We are consulting actuaries for Cheiron. We are also Members of the American Academy of Actuaries
and meet their Qualification Standards to render the actuarial opinion contained herein.
We hereby certify that, to the best of our knowledge, this report and its contents, have been prepared in
accordance with generally recognized and accepted actuarial principles and practices which are consistent
with the Code of Professional Conduct and applicable Actuarial Standards of Practice set out by the
Actuarial Standards Board. Furthermore, as credentialed actuaries, we meet the Qualification Standards of
the American Academy of Actuaries to render the opinions contained herein.
Sincerely,
Cheiron
Fiona E. Liston, FSA Christian E. Benjaminson, FSA
Principal Consulting Actuary Principal Consulting Actuary

Actuarial Section
Fairfax County Employees’ Retirement System - 53 -
Summary of Valuation Results
Overview
This report presents the results of the July 1, 2013, actuarial valuation of the Fairfax County
Employees’ Retirement System. The primary purposes of performing the annual actuarial
valuation are to:
Measure and disclose, as of the valuation date, the financial condition of the System;
Indicate trends in the financial progress of the System;
Determine the contribution rate to be paid by the employer for Fiscal Year 2015; and
Provide specific information and documentation required by the Governmental
Accounting Standards Board (GASB).
This section of the report presents a summary of the above information in the form of:
The actuary’s comments;
The prior year’s experience of the System’s assets, liabilities, contributions, and
membership;
A series of graphs which highlight key trends experienced by the System; and
A summary of all principal results from this year’s valuation, compared to last year’s, in
a single table, intended for quick reference purposes.
General Comments
The employer’s annual contribution to this System is determined by using a corridor funding
method. Under this funding approach, the employer contribution rate is based on the normal cost
rate plus expense rate determined as of the implementation date of the corridor method
(July 1, 2001) 5.85% of payroll plus an expense rate, currently 0.20% of payroll. This rate is
adjusted for benefit and assumption changes. The rate includes an additional charge once the
actuarial funded ratio falls below 90%. Originally this additional charge was designed to
amortize the amount of underfunding to the 90% threshold. The actuary and Board have
recommended and the Employer has taken steps to increase this target from 90% until it reaches
a target of 100%.
The employer contribution rate will change when benefits are increased or modified or
assumptions are changed. The new rate will reflect the change in normal cost rate and the change
in actuarial liability amortized over 15 years. Since the inception of the corridor funding method
the normal cost rate has increased by 1.06% and the UAL rate has increased by 1.50%, the
specific changes are summarized in the table on the next page:
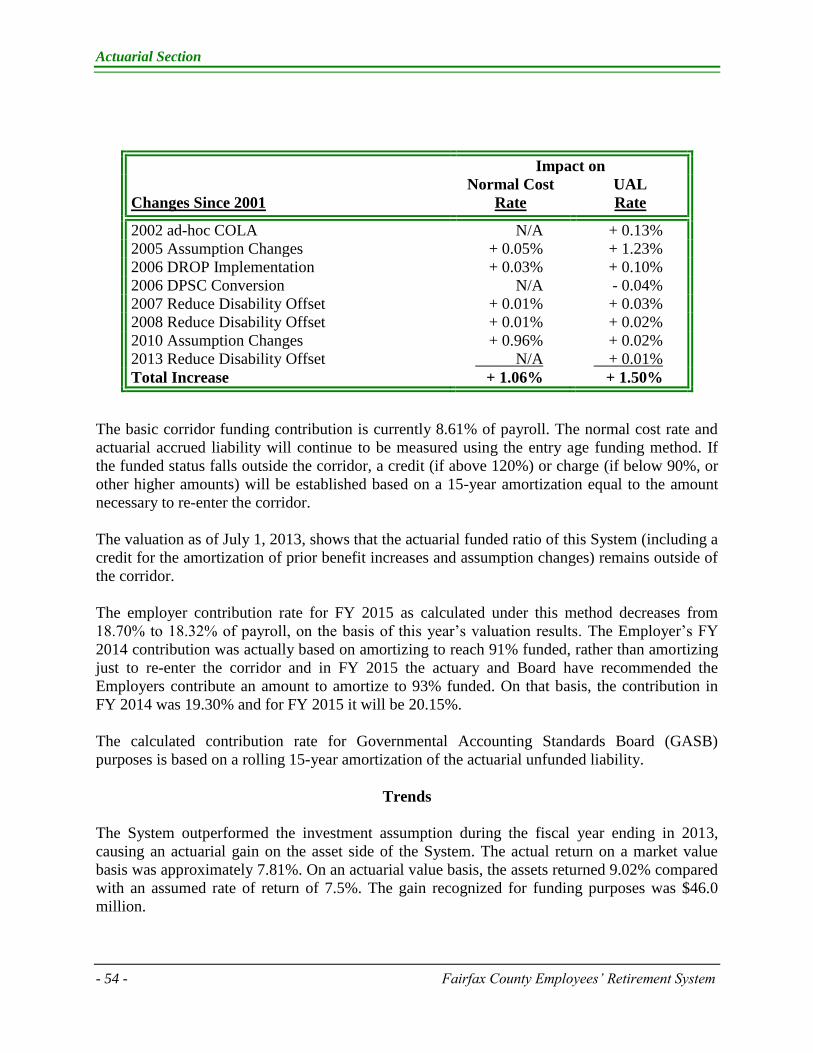
Actuarial Section
- 54 - Fairfax County Employees’ Retirement System
Impact on
Changes Since 2001
Normal Cost
Rate
UAL
Rate
2002 ad-hoc COLA N/A + 0.13%
2005 Assumption Changes + 0.05% + 1.23%
2006 DROP Implementation + 0.03% + 0.10%
2006 DPSC Conversion N/A - 0.04%
2007 Reduce Disability Offset + 0.01% + 0.03%
2008 Reduce Disability Offset + 0.01% + 0.02%
2010 Assumption Changes
2013 Reduce Disability Offset
+ 0.96%
N/A
+ 0.02%
+ 0.01%
Total Increase + 1.06% + 1.50%
The basic corridor funding contribution is currently 8.61% of payroll. The normal cost rate and
actuarial accrued liability will continue to be measured using the entry age funding method. If
the funded status falls outside the corridor, a credit (if above 120%) or charge (if below 90%, or
other higher amounts) will be established based on a 15-year amortization equal to the amount
necessary to re-enter the corridor.
The valuation as of July 1, 2013, shows that the actuarial funded ratio of this System (including a
credit for the amortization of prior benefit increases and assumption changes) remains outside of
the corridor.
The employer contribution rate for FY 2015 as calculated under this method decreases from
18.70% to 18.32% of payroll, on the basis of this year’s valuation results. The Employer’s FY
2014 contribution was actually based on amortizing to reach 91% funded, rather than amortizing
just to re-enter the corridor and in FY 2015 the actuary and Board have recommended the
Employers contribute an amount to amortize to 93% funded. On that basis, the contribution in
FY 2014 was 19.30% and for FY 2015 it will be 20.15%.
The calculated contribution rate for Governmental Accounting Standards Board (GASB)
purposes is based on a rolling 15-year amortization of the actuarial unfunded liability.
Trends
The System outperformed the investment assumption during the fiscal year ending in 2013,
causing an actuarial gain on the asset side of the System. The actual return on a market value
basis was approximately 7.81%. On an actuarial value basis, the assets returned 9.02% compared
with an assumed rate of return of 7.5%. The gain recognized for funding purposes was $46.0
million.
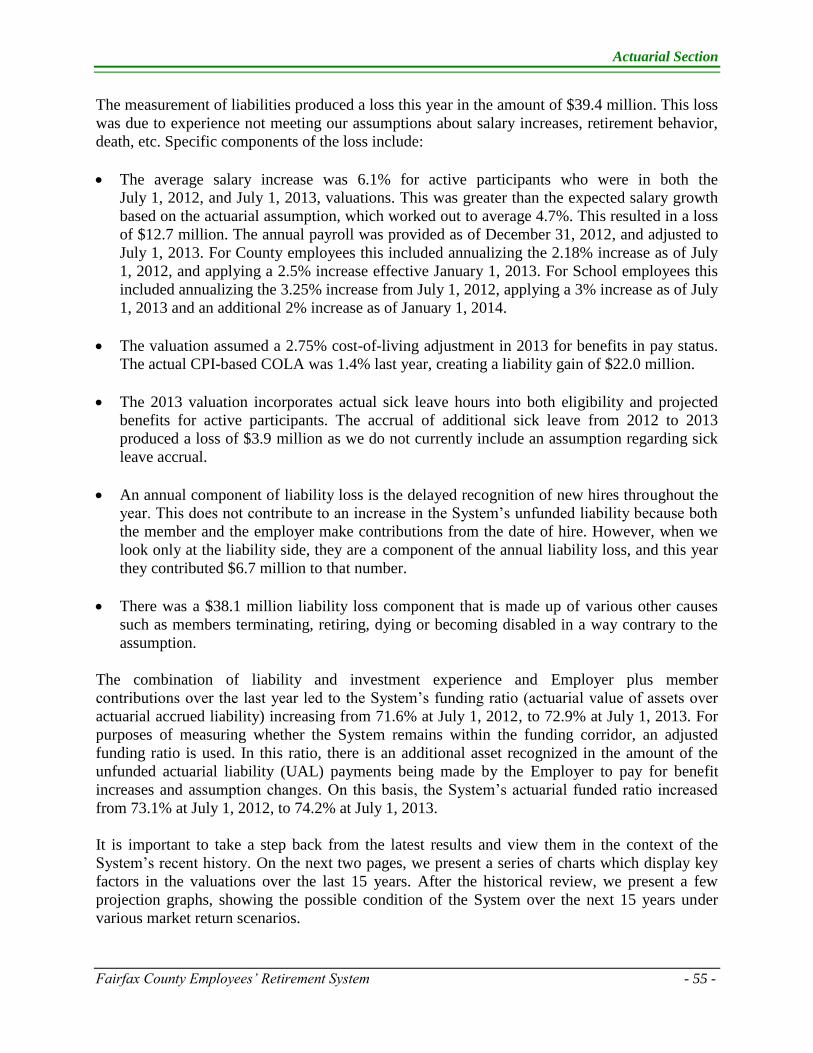
Actuarial Section
Fairfax County Employees’ Retirement System - 55 -
The measurement of liabilities produced a loss this year in the amount of $39.4 million. This loss
was due to experience not meeting our assumptions about salary increases, retirement behavior,
death, etc. Specific components of the loss include:
The average salary increase was 6.1% for active participants who were in both the
July 1, 2012, and July 1, 2013, valuations. This was greater than the expected salary growth
based on the actuarial assumption, which worked out to average 4.7%. This resulted in a loss
of $12.7 million. The annual payroll was provided as of December 31, 2012, and adjusted to
July 1, 2013. For County employees this included annualizing the 2.18% increase as of July
1, 2012, and applying a 2.5% increase effective January 1, 2013. For School employees this
included annualizing the 3.25% increase from July 1, 2012, applying a 3% increase as of July
1, 2013 and an additional 2% increase as of January 1, 2014.
The valuation assumed a 2.75% cost-of-living adjustment in 2013 for benefits in pay status.
The actual CPI-based COLA was 1.4% last year, creating a liability gain of $22.0 million.
The 2013 valuation incorporates actual sick leave hours into both eligibility and projected
benefits for active participants. The accrual of additional sick leave from 2012 to 2013
produced a loss of $3.9 million as we do not currently include an assumption regarding sick
leave accrual.
An annual component of liability loss is the delayed recognition of new hires throughout the
year. This does not contribute to an increase in the System’s unfunded liability because both
the member and the employer make contributions from the date of hire. However, when we
look only at the liability side, they are a component of the annual liability loss, and this year
they contributed $6.7 million to that number.
There was a $38.1 million liability loss component that is made up of various other causes
such as members terminating, retiring, dying or becoming disabled in a way contrary to the
assumption.
The combination of liability and investment experience and Employer plus member
contributions over the last year led to the System’s funding ratio (actuarial value of assets over
actuarial accrued liability) increasing from 71.6% at July 1, 2012, to 72.9% at July 1, 2013. For
purposes of measuring whether the System remains within the funding corridor, an adjusted
funding ratio is used. In this ratio, there is an additional asset recognized in the amount of the
unfunded actuarial liability (UAL) payments being made by the Employer to pay for benefit
increases and assumption changes. On this basis, the System’s actuarial funded ratio increased
from 73.1% at July 1, 2012, to 74.2% at July 1, 2013.
It is important to take a step back from the latest results and view them in the context of the
System’s recent history. On the next two pages, we present a series of charts which display key
factors in the valuations over the last 15 years. After the historical review, we present a few
projection graphs, showing the possible condition of the System over the next 15 years under
various market return scenarios.
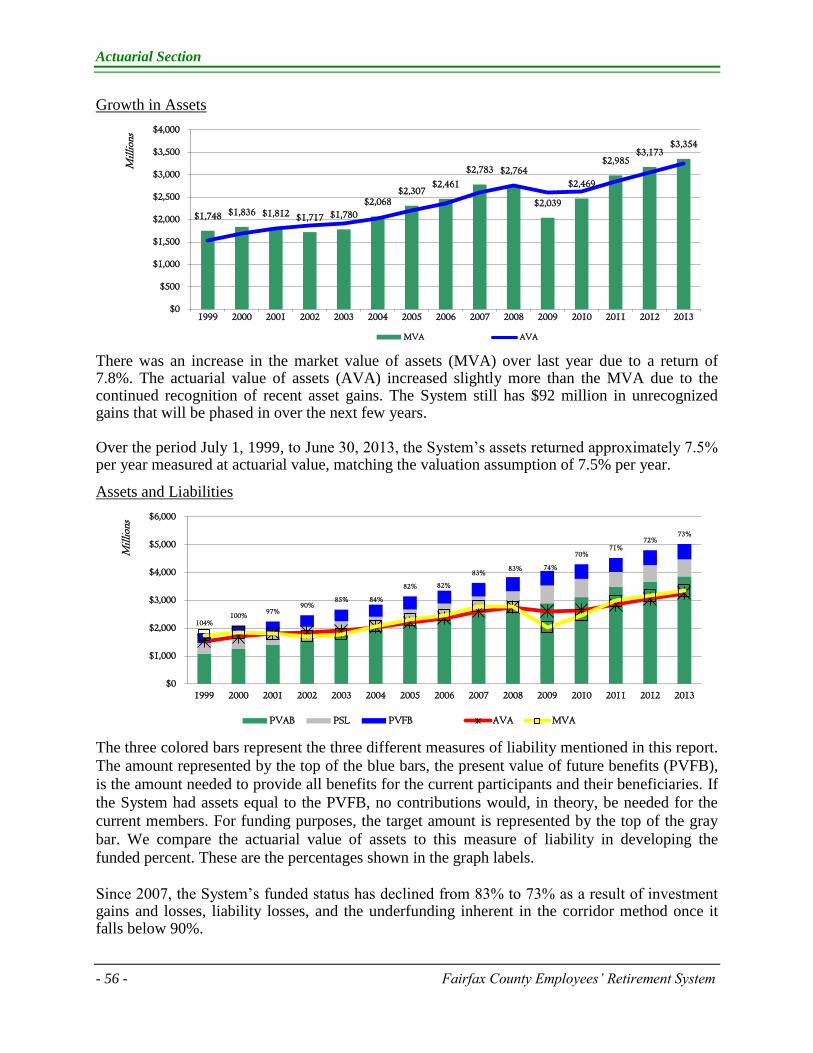
Actuarial Section
- 56 - Fairfax County Employees’ Retirement System
Growth in Assets
There was an increase in the market value of assets (MVA) over last year due to a return of 7.8%. The actuarial value of assets (AVA) increased slightly more than the MVA due to the continued recognition of recent asset gains. The System still has $92 million in unrecognized gains that will be phased in over the next few years. Over the period July 1, 1999, to June 30, 2013, the System’s assets returned approximately 7.5% per year measured at actuarial value, matching the valuation assumption of 7.5% per year. Assets and Liabilities
The three colored bars represent the three different measures of liability mentioned in this report.
The amount represented by the top of the blue bars, the present value of future benefits (PVFB),
is the amount needed to provide all benefits for the current participants and their beneficiaries. If
the System had assets equal to the PVFB, no contributions would, in theory, be needed for the
current members. For funding purposes, the target amount is represented by the top of the gray
bar. We compare the actuarial value of assets to this measure of liability in developing the
funded percent. These are the percentages shown in the graph labels.
Since 2007, the System’s funded status has declined from 83% to 73% as a result of investment gains and losses, liability losses, and the underfunding inherent in the corridor method once it falls below 90%.
$1,748 $1,836 $1,812 $1,717 $1,780
$2,068$2,307
$2,461
$2,783 $2,764
$2,039
$2,469
$2,985$3,173
$3,354
$0
$500
$1,000
$1,500
$2,000
$2,500
$3,000
$3,500
$4,000
1999 2000 2001 2002 2003 2004 2005 2006 2007 2008 2009 2010 2011 2012 2013
Mil
lions
MVA AVA
104%100%
97%90%
85% 84%
82% 82%
83%83% 74%
70%71%
72%73%
$0
$1,000
$2,000
$3,000
$4,000
$5,000
$6,000
1999 2000 2001 2002 2003 2004 2005 2006 2007 2008 2009 2010 2011 2012 2013
Mil
lions
PVAB PSL PVFB AVA MVA

Actuarial Section
Fairfax County Employees’ Retirement System - 57 -
Contribution Rates
The stacked bars in this graph show the contributions made by both the Employer and the
members (left hand scale). The red line shows the Employer contribution rate as a percent of
payroll (right hand scale).
The member contribution rate is set by the County Ordinance. The Employer contribution rate is
set by the actuarial process, as constrained by the corridor method. Note there is a lag in the rate
shown. For example, the 2013 value is the rate prepared by the 2011 valuation and implemented
for the period July 1, 2012, to June 30, 2013. For FY 2015, the graph shows both the basic
corridor contribution rate and the anticipated rate using an “amortize to 93%” approach.
Participant Trends
As with many funds in this country, there has been a steady growth in the number of retired
members as the System has matured. The active-to-inactive ratio has decreased from 3.1 actives
to each inactive in 1999 to 1.5 actives for each inactive today. While this would be an alarming
trend in a pay-as-you-go system, the pool of invested assets has been established in anticipation
of this development.
Starting in 2006, the chart also shows the number of DROP participants. Neither employer nor
member contributions are made on their behalf, which leads to a slightly lower growth in
effective covered payroll for this System.
0%
5%
10%
15%
20%
25%
$0
$20
$40
$60
$80
$100
$120
$140
$160
$180
1999 2000 2001 2002 2003 2004 2005 2006 2007 2008 2009 2010 2011 2012 2013 2014 2015
Mil
lions
Member's Cost County's Cost County Contribution Rate
3.1 3.1 3.03.1 2.9 2.9
2.7 2.5 2.0 2.0 1.9 1.8 1.7 1.6 1.5
$0
$100
$200
$300
$400
$500
$600
$700
0.0
5.0
10.0
15.0
20.0
25.0
1999 2000 2001 2002 2003 2004 2005 2006 2007 2008 2009 2010 2011 2012 2013
Mil
lions
Tho
usan
ds
Actives DROP Def Vested Retirees Payroll
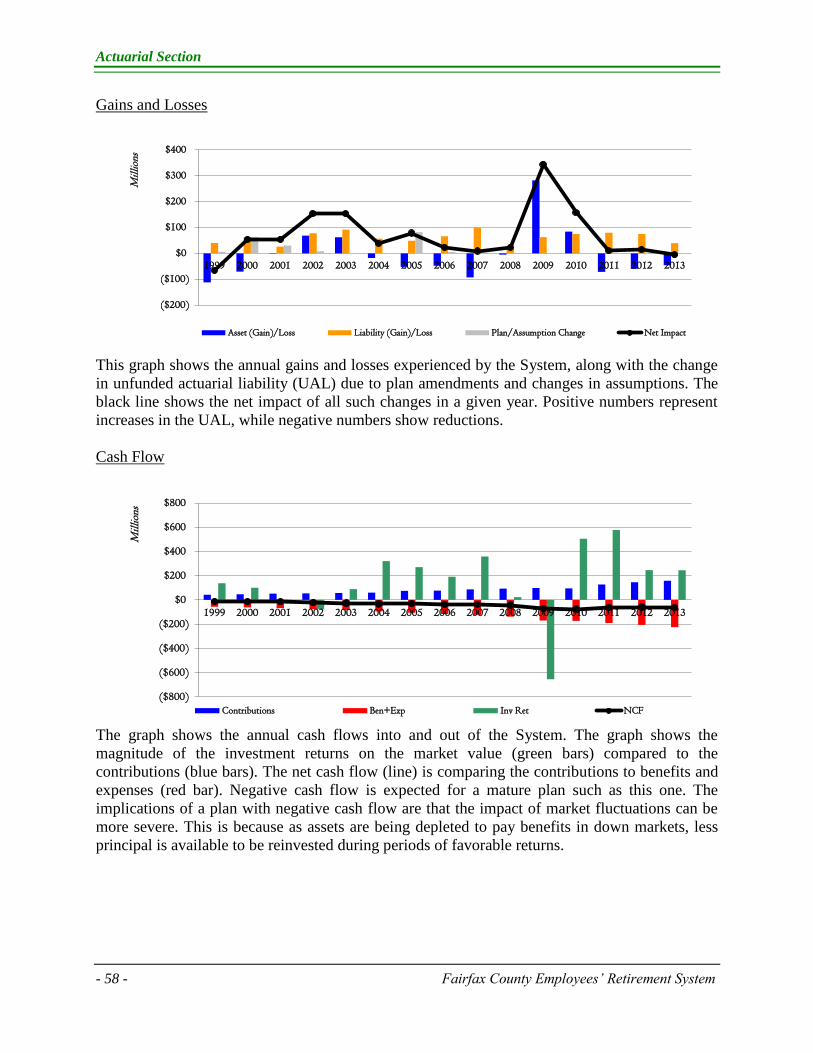
Actuarial Section
- 58 - Fairfax County Employees’ Retirement System
Gains and Losses
This graph shows the annual gains and losses experienced by the System, along with the change
in unfunded actuarial liability (UAL) due to plan amendments and changes in assumptions. The
black line shows the net impact of all such changes in a given year. Positive numbers represent
increases in the UAL, while negative numbers show reductions.
Cash Flow
The graph shows the annual cash flows into and out of the System. The graph shows the
magnitude of the investment returns on the market value (green bars) compared to the
contributions (blue bars). The net cash flow (line) is comparing the contributions to benefits and
expenses (red bar). Negative cash flow is expected for a mature plan such as this one. The
implications of a plan with negative cash flow are that the impact of market fluctuations can be
more severe. This is because as assets are being depleted to pay benefits in down markets, less
principal is available to be reinvested during periods of favorable returns.
($200)
($100)
$0
$100
$200
$300
$400
1999 2000 2001 2002 2003 2004 2005 2006 2007 2008 2009 2010 2011 2012 2013
Mil
lions
Asset (Gain)/Loss Liability (Gain)/Loss Plan/Assumption Change Net Impact
($800)
($600)
($400)
($200)
$0
$200
$400
$600
$800
1999 2000 2001 2002 2003 2004 2005 2006 2007 2008 2009 2010 2011 2012 2013
Mil
lions
Contributions Ben+Exp Inv Ret NCF

Actuarial Section
Fairfax County Employees’ Retirement System - 59 -
Future Outlook
Base-line Projections
The two graphs below show the expected progress of the System over the next 15 years,
assuming the System’s assets earn 7.5% on their market value.
The graph entitled “Plan Funding” shows the projected contribution rates assuming the target
corridor percent is increased each year from 93% to 100%. The Employer contribution rate is
projected to decline over the period, but the System does not re-enter the corridor (if all other
actuarial assumptions are met as well as the 7.5% interest rate). The contribution rate decreases
as the stored investment gains are fully phased-in, as plan change bases become fully amortized
and drop out, and as more of the population is covered by Plans C & D. The blue line shows the
actuarially calculated rate if the corridor were not in place.
0%
5%
10%
15%
20%
25%
2015 2016 2017 2018 2019 2020 2021 2022 2023 2024 2025 2026 2027 2028 2029 2030
Fiscal Year ending June 30,
Plan Funding
Calculated Rate Corridor Rate
73% 74% 76% 77% 78% 79% 80% 81% 82% 83% 83% 84% 85% 85% 86% 86%
$0
$1,000
$2,000
$3,000
$4,000
$5,000
$6,000
$7,000
$8,000
2013 2014 2015 2016 2017 2018 2019 2020 2021 2022 2023 2024 2025 2026 2027 2028
Mil
lion
s
Valuation Date July 1,
Assets and Liabilities
PVAB AAL PVFB MVA AVA
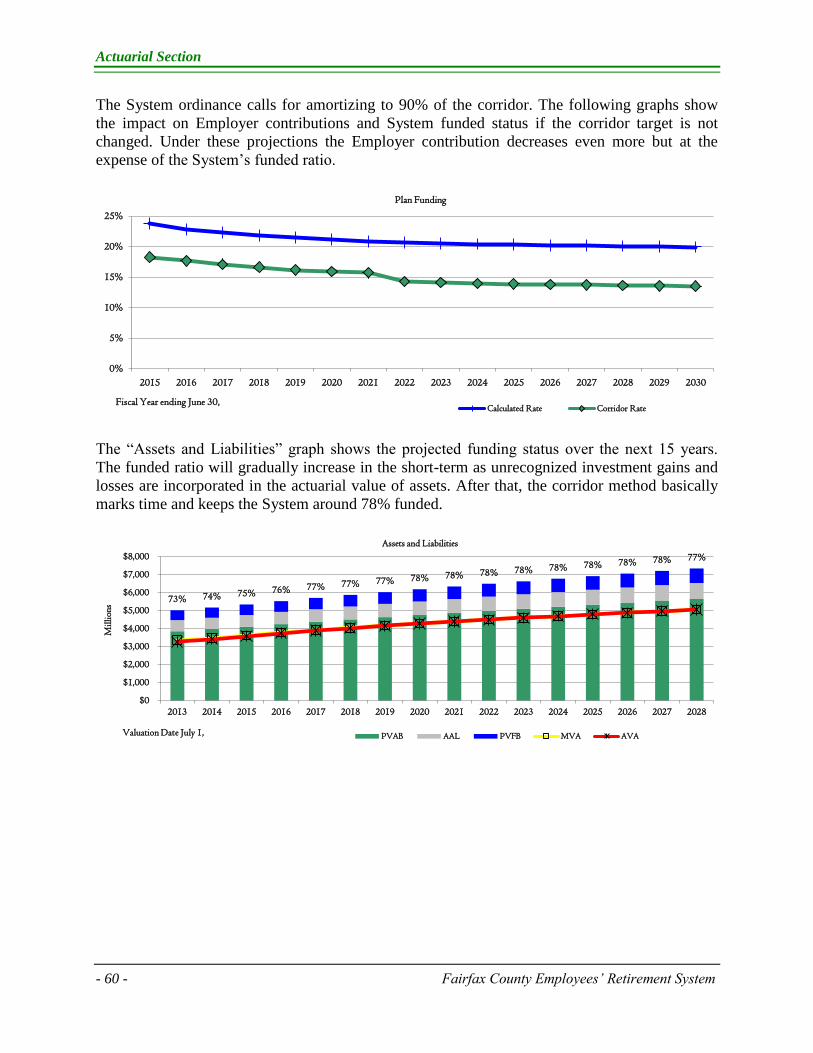
Actuarial Section
- 60 - Fairfax County Employees’ Retirement System
The System ordinance calls for amortizing to 90% of the corridor. The following graphs show
the impact on Employer contributions and System funded status if the corridor target is not
changed. Under these projections the Employer contribution decreases even more but at the
expense of the System’s funded ratio.
The “Assets and Liabilities” graph shows the projected funding status over the next 15 years.
The funded ratio will gradually increase in the short-term as unrecognized investment gains and
losses are incorporated in the actuarial value of assets. After that, the corridor method basically
marks time and keeps the System around 78% funded.
0%
5%
10%
15%
20%
25%
2015 2016 2017 2018 2019 2020 2021 2022 2023 2024 2025 2026 2027 2028 2029 2030
Fiscal Year ending June 30,
Plan Funding
Calculated Rate Corridor Rate
73% 74% 75% 76% 77% 77% 77% 78% 78% 78% 78% 78% 78% 78% 78% 77%
$0
$1,000
$2,000
$3,000
$4,000
$5,000
$6,000
$7,000
$8,000
2013 2014 2015 2016 2017 2018 2019 2020 2021 2022 2023 2024 2025 2026 2027 2028
Mil
lion
s
Valuation Date July 1,
Assets and Liabilities
PVAB AAL PVFB MVA AVA
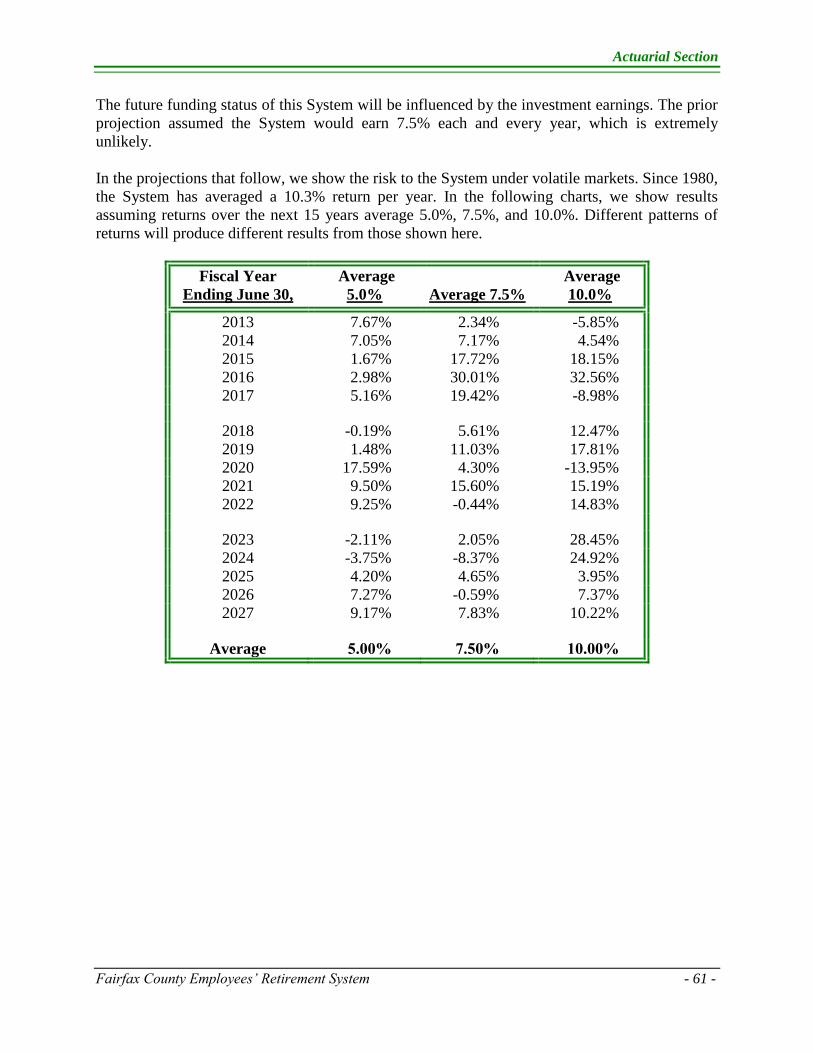
Actuarial Section
Fairfax County Employees’ Retirement System - 61 -
The future funding status of this System will be influenced by the investment earnings. The prior
projection assumed the System would earn 7.5% each and every year, which is extremely
unlikely.
In the projections that follow, we show the risk to the System under volatile markets. Since 1980,
the System has averaged a 10.3% return per year. In the following charts, we show results
assuming returns over the next 15 years average 5.0%, 7.5%, and 10.0%. Different patterns of
returns will produce different results from those shown here.
Fiscal Year
Ending June 30,
Average
5.0%
Average 7.5%
Average
10.0%
2013 7.67% 2.34% -5.85%
2014 7.05% 7.17% 4.54%
2015 1.67% 17.72% 18.15%
2016 2.98% 30.01% 32.56%
2017 5.16% 19.42% -8.98%
2018 -0.19% 5.61% 12.47%
2019 1.48% 11.03% 17.81%
2020 17.59% 4.30% -13.95%
2021 9.50% 15.60% 15.19%
2022 9.25% -0.44% 14.83%
2023 -2.11% 2.05% 28.45%
2024 -3.75% -8.37% 24.92%
2025 4.20% 4.65% 3.95%
2026 7.27% -0.59% 7.37%
2027 9.17% 7.83% 10.22%
Average 5.00% 7.50% 10.00%
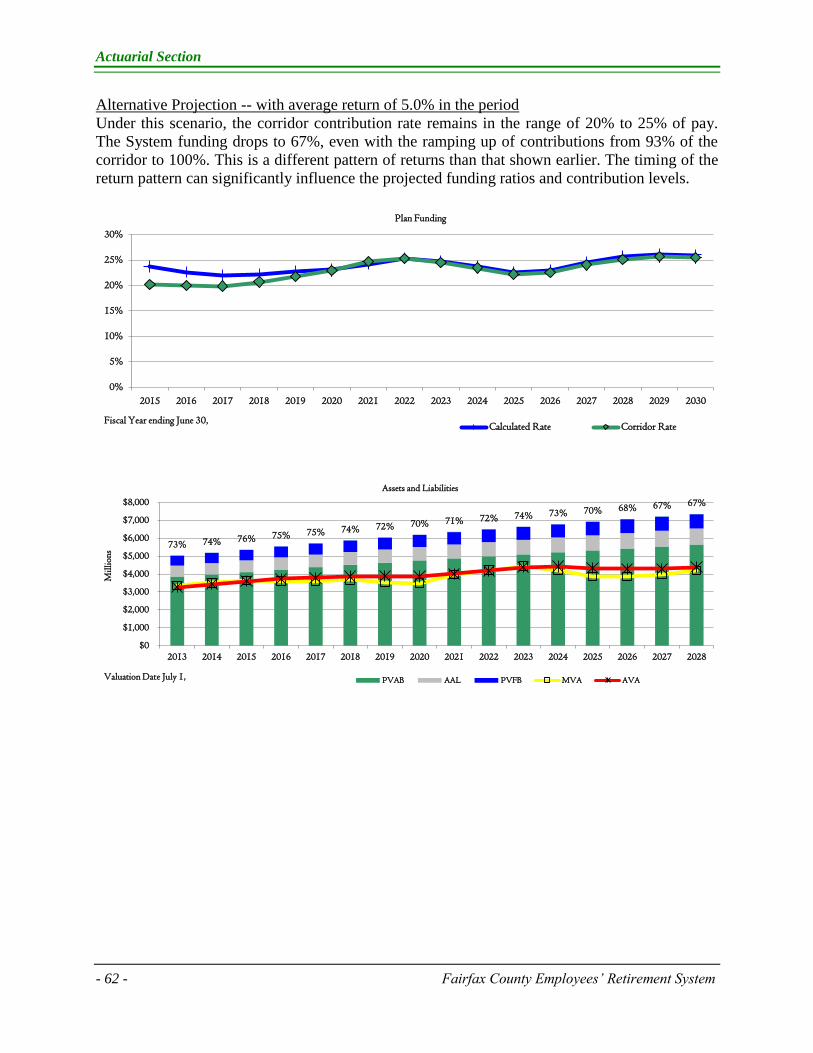
Actuarial Section
- 62 - Fairfax County Employees’ Retirement System
Alternative Projection -- with average return of 5.0% in the period
Under this scenario, the corridor contribution rate remains in the range of 20% to 25% of pay.
The System funding drops to 67%, even with the ramping up of contributions from 93% of the
corridor to 100%. This is a different pattern of returns than that shown earlier. The timing of the
return pattern can significantly influence the projected funding ratios and contribution levels.
0%
5%
10%
15%
20%
25%
30%
2015 2016 2017 2018 2019 2020 2021 2022 2023 2024 2025 2026 2027 2028 2029 2030
Fiscal Year ending June 30,
Plan Funding
Calculated Rate Corridor Rate
73% 74% 76% 75% 75% 74% 72% 70% 71% 72% 74% 73% 70% 68% 67% 67%
$0
$1,000
$2,000
$3,000
$4,000
$5,000
$6,000
$7,000
$8,000
2013 2014 2015 2016 2017 2018 2019 2020 2021 2022 2023 2024 2025 2026 2027 2028
Mil
lion
s
Valuation Date July 1,
Assets and Liabilities
PVAB AAL PVFB MVA AVA
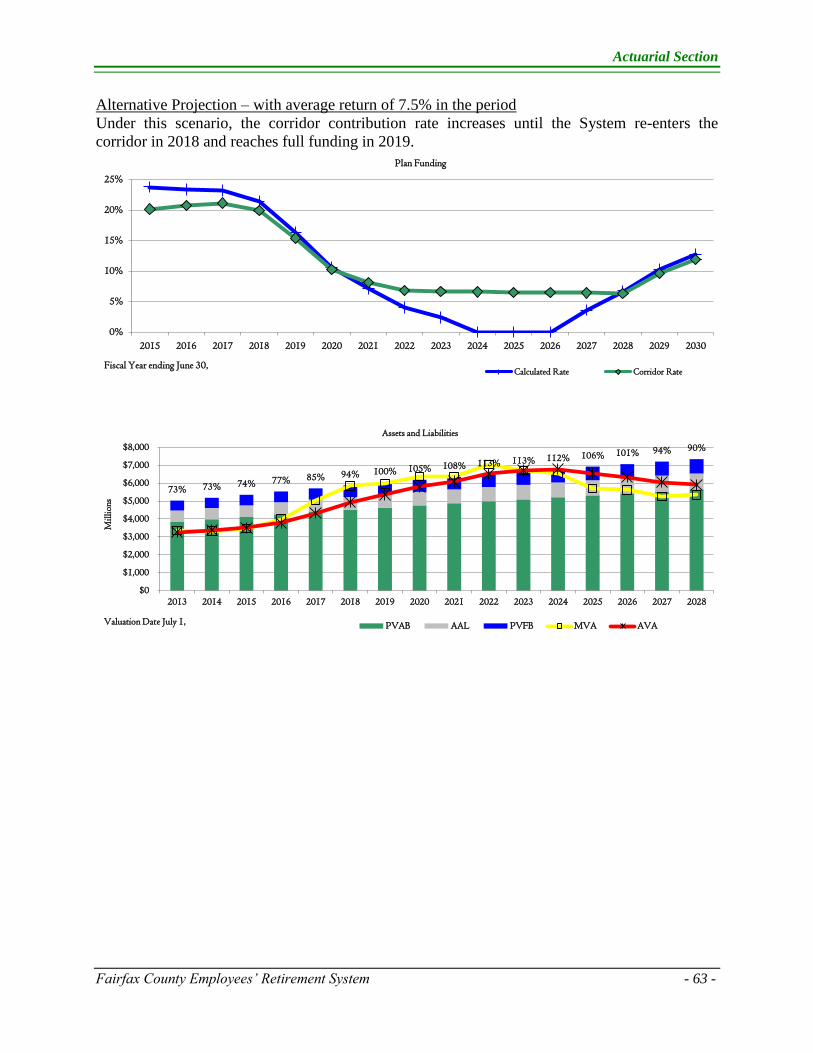
Actuarial Section
Fairfax County Employees’ Retirement System - 63 -
Alternative Projection – with average return of 7.5% in the period
Under this scenario, the corridor contribution rate increases until the System re-enters the
corridor in 2018 and reaches full funding in 2019.
0%
5%
10%
15%
20%
25%
2015 2016 2017 2018 2019 2020 2021 2022 2023 2024 2025 2026 2027 2028 2029 2030
Fiscal Year ending June 30,
Plan Funding
Calculated Rate Corridor Rate
73% 73% 74% 77% 85% 94% 100% 105% 108% 113% 113% 112% 106% 101% 94% 90%
$0
$1,000
$2,000
$3,000
$4,000
$5,000
$6,000
$7,000
$8,000
2013 2014 2015 2016 2017 2018 2019 2020 2021 2022 2023 2024 2025 2026 2027 2028
Mil
lion
s
Valuation Date July 1,
Assets and Liabilities
PVAB AAL PVFB MVA AVA
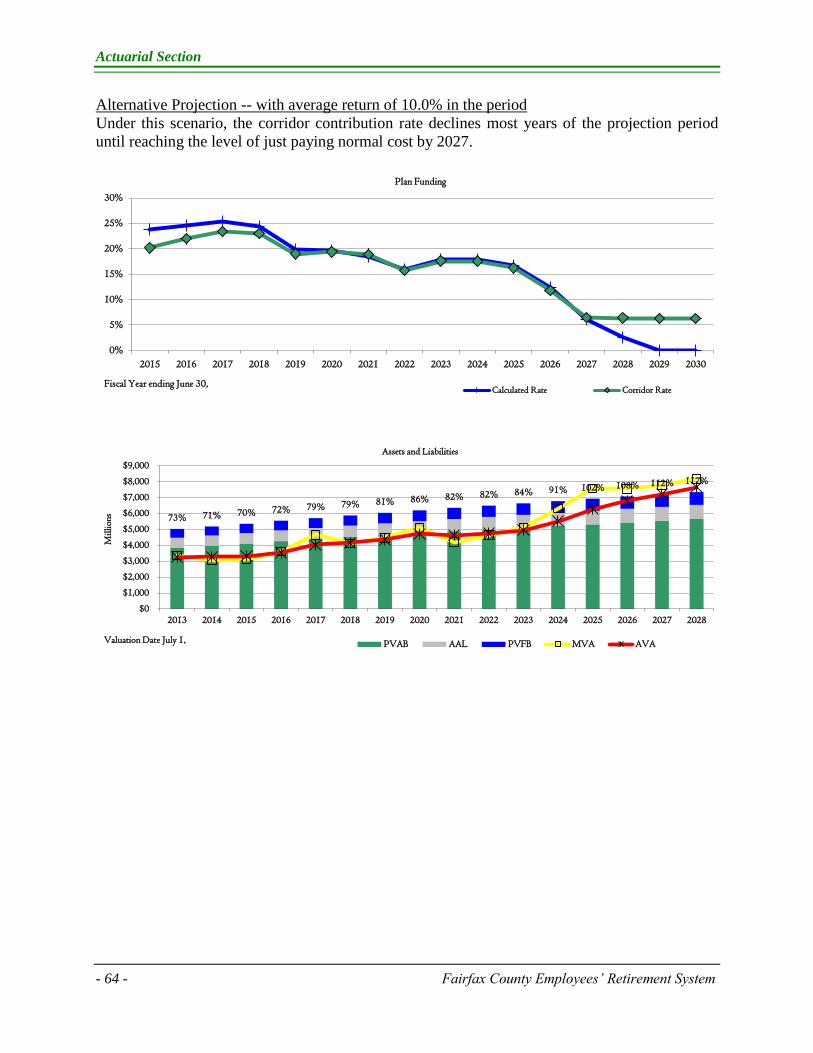
Actuarial Section
- 64 - Fairfax County Employees’ Retirement System
Alternative Projection -- with average return of 10.0% in the period
Under this scenario, the corridor contribution rate declines most years of the projection period
until reaching the level of just paying normal cost by 2027.
0%
5%
10%
15%
20%
25%
30%
2015 2016 2017 2018 2019 2020 2021 2022 2023 2024 2025 2026 2027 2028 2029 2030
Fiscal Year ending June 30,
Plan Funding
Calculated Rate Corridor Rate
73% 71% 70% 72% 79% 79% 81% 86% 82% 82% 84% 91% 102% 108% 112% 117%
$0
$1,000
$2,000
$3,000
$4,000
$5,000
$6,000
$7,000
$8,000
$9,000
2013 2014 2015 2016 2017 2018 2019 2020 2021 2022 2023 2024 2025 2026 2027 2028
Mil
lion
s
Valuation Date July 1,
Assets and Liabilities
PVAB AAL PVFB MVA AVA
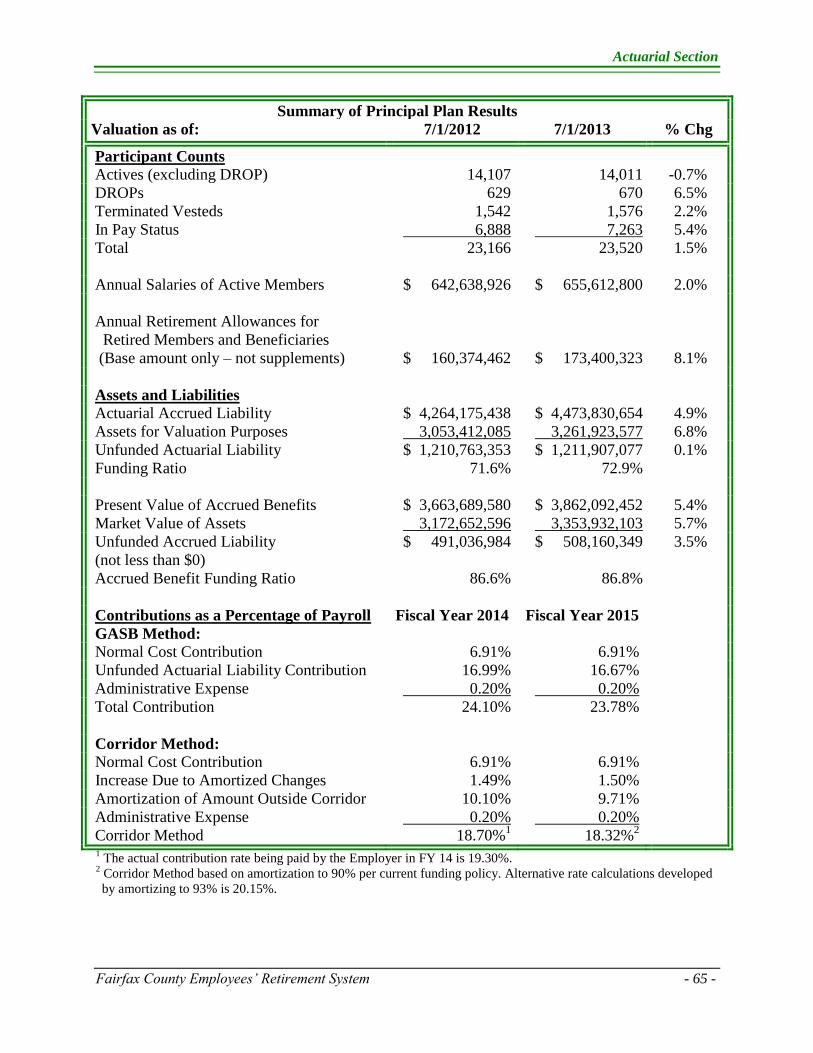
Actuarial Section
Fairfax County Employees’ Retirement System - 65 -
Summary of Principal Plan Results
Valuation as of: 7/1/2012 7/1/2013 % Chg
Participant Counts
Actives (excluding DROP) 14,107 14,011 -0.7%
DROPs 629 670 6.5%
Terminated Vesteds 1,542 1,576 2.2%
In Pay Status 6,888 7,263 5.4%
Total 23,166 23,520 1.5%
Annual Salaries of Active Members $ 642,638,926 $ 655,612,800 2.0%
Annual Retirement Allowances for
Retired Members and Beneficiaries
(Base amount only – not supplements) $ 160,374,462 $ 173,400,323 8.1%
Assets and Liabilities
Actuarial Accrued Liability $ 4,264,175,438 $ 4,473,830,654 4.9%
Assets for Valuation Purposes 3,053,412,085 3,261,923,577 6.8%
Unfunded Actuarial Liability $ 1,210,763,353 $ 1,211,907,077 0.1%
Funding Ratio 71.6% 72.9%
Present Value of Accrued Benefits $ 3,663,689,580 $ 3,862,092,452 5.4%
Market Value of Assets 3,172,652,596 3,353,932,103 5.7%
Unfunded Accrued Liability
(not less than $0)
$ 491,036,984 $ 508,160,349 3.5%
Accrued Benefit Funding Ratio 86.6% 86.8%
Contributions as a Percentage of Payroll Fiscal Year 2014 Fiscal Year 2015
GASB Method:
Normal Cost Contribution 6.91% 6.91%
Unfunded Actuarial Liability Contribution 16.99% 16.67%
Administrative Expense 0.20% 0.20%
Total Contribution 24.10% 23.78%
Corridor Method:
Normal Cost Contribution 6.91% 6.91%
Increase Due to Amortized Changes 1.49% 1.50%
Amortization of Amount Outside Corridor 10.10% 9.71%
Administrative Expense 0.20% 0.20%
Corridor Method 18.70%1
18.32%2
1 The actual contribution rate being paid by the Employer in FY 14 is 19.30%.
2 Corridor Method based on amortization to 90% per current funding policy. Alternative rate calculations developed
by amortizing to 93% is 20.15%.

Actuarial Section
- 66 - Fairfax County Employees’ Retirement System
Summary of Actuarial Assumptions and Methods
Funding Method
The funding method used for GASB disclosure purposes is the “aggregate accrual modification
of the Entry Age Normal Cost method.” Under this method, the employer contribution has three
components: the normal cost, the payment toward the unfunded actuarial liability, and the
expense rate.
The normal cost is a level percent of pay cost which, along with the member contributions, will
pay for projected benefits at retirement for the average plan participant. The level percent
developed is called the normal cost rate, and the product of that rate and payroll is the normal
cost.
The actuarial liability is that portion of the present value of projected benefits that will not be
paid by future employer normal costs or member contributions. The difference between this
liability and funds accumulated as of the same date is referred to as the unfunded actuarial
liability.
The expense rate is added to cover the System’s administrative expenses.
The employer contributions are calculated using the same basic actuarial method (EAN).
However, in order to produce a more level contribution rate, the System has adopted a Corridor
Funding Method.
Under the Corridor Funding Method, the employer’s total contribution rate is equal to the normal
cost rate plus rate changes due to assumption changes or amendments passed since July 1, 2001
plus the expense rate as long as the System’s actuarial funded status remains within a corridor of
90% to 120%. If the funded status falls outside the corridor, a credit (if above 120%) or charge
(if below 90%) will be established based on a 15-year amortization equal to the amount
necessary to re-enter the corridor. Once the funded status is within the corridor, the contribution
rate will return to normal cost rate, plus amortization of post-2001 changes, plus expense rate.
Actuarial Value of Assets
For purposes of determining the Employer contribution to the System, we use an actuarial value
of assets. The asset adjustment method dampens the volatility in asset values that could occur
because of fluctuations in market conditions. Use of an asset smoothing method is consistent
with the long-term nature of the actuarial valuation process.
In determining the actuarial value of assets, we calculate an expected actuarial value based on
cash flow for the year and imputed returns at the actuarial assumption. This expected value is
compared to the market value, and one-third of the difference is added to the preliminary
actuarial value to arrive at the final actuarial value.
Changes Since Last Valuation
There have been no changes since the last valuation to the Funding Method or Actuarial Value of
Assets.

Actuarial Section
Fairfax County Employees’ Retirement System - 67 -
Long Term Assumptions Used to Determine System Costs and Liabilities
Demographic Assumptions
Mortality
Annual Deaths Per 10,000 Members
RP 2000 Mortality Projected to 2015* Age Male Female
20 25 30 35 40
3 3 4 7 10
2 2 2 4 6
45 50 55 60 65
12 16 27 53 103
9 13 24 47 90
70 75 80 85 90
177 306 554 997 1,727
155 249 413 708 1,259
95 100 105
2,596 3,394 3,979
1,888 2,339 2,931
* 5% of deaths are assumed to be service-connected.
Annual Deaths Per 1,000 Disabled Members
RP 2000 Mortality Projected to 2015 with Ages Set
Forward 5 Years
Age Male Female
45
50
55
60
65
16
27
53
103
177
13
24
47
90
155
70
75
80
306
554
997
249
413
708

Actuarial Section
- 68 - Fairfax County Employees’ Retirement System
Termination of Employment (Prior to Normal Retirement Eligibility)
Annual Termination Rates Per 1,000 Members – Male Years of Employment with County
Age 0-2 3-4 5+
20 25 30 35
283 270 210 130
174 150 122 103
80 80 65 50
40 45 50 55
125 125 125 125
89 74 59 50
35 20 20 20
Annual Termination Rates Per 1,000 Members – Female Years of Employment with County
Age 0-2 3-4 5+
20 25 30 35
333 320 260 180
150 150 150 138
150 150 150 100
40 45 50 55
175 168 160 153
125 113 100 100
50 50 50 50
It is assumed that members who terminate before the earlier of age 45 or with age plus service equal to 60 elect to receive a refund of contributions instead of vested benefits.
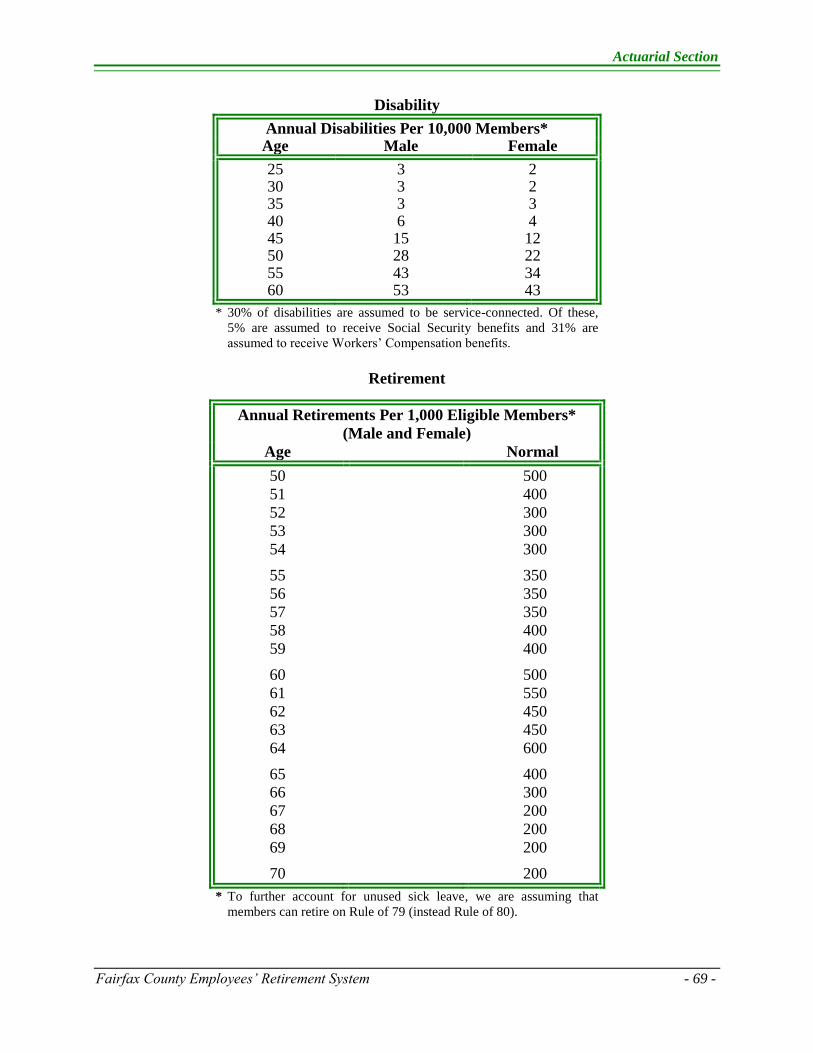
Actuarial Section
Fairfax County Employees’ Retirement System - 69 -
Disability
Annual Disabilities Per 10,000 Members* Age Male Female
25 30 35 40 45 50 55 60
3 3 3 6 15 28 43 53
2 2 3 4 12 22 34 43
* 30% of disabilities are assumed to be service-connected. Of these,
5% are assumed to receive Social Security benefits and 31% are
assumed to receive Workers’ Compensation benefits.
Retirement
Annual Retirements Per 1,000 Eligible Members*
(Male and Female)
Age Normal
50
51
52
53
54
55
56
57
58
59
60
61
62
63
64
65
66
67
68
69
70
500
400
300
300
300
350
350
350
400
400
500
550
450
450
600
400
300
200
200
200
200
* To further account for unused sick leave, we are assuming that
members can retire on Rule of 79 (instead Rule of 80).
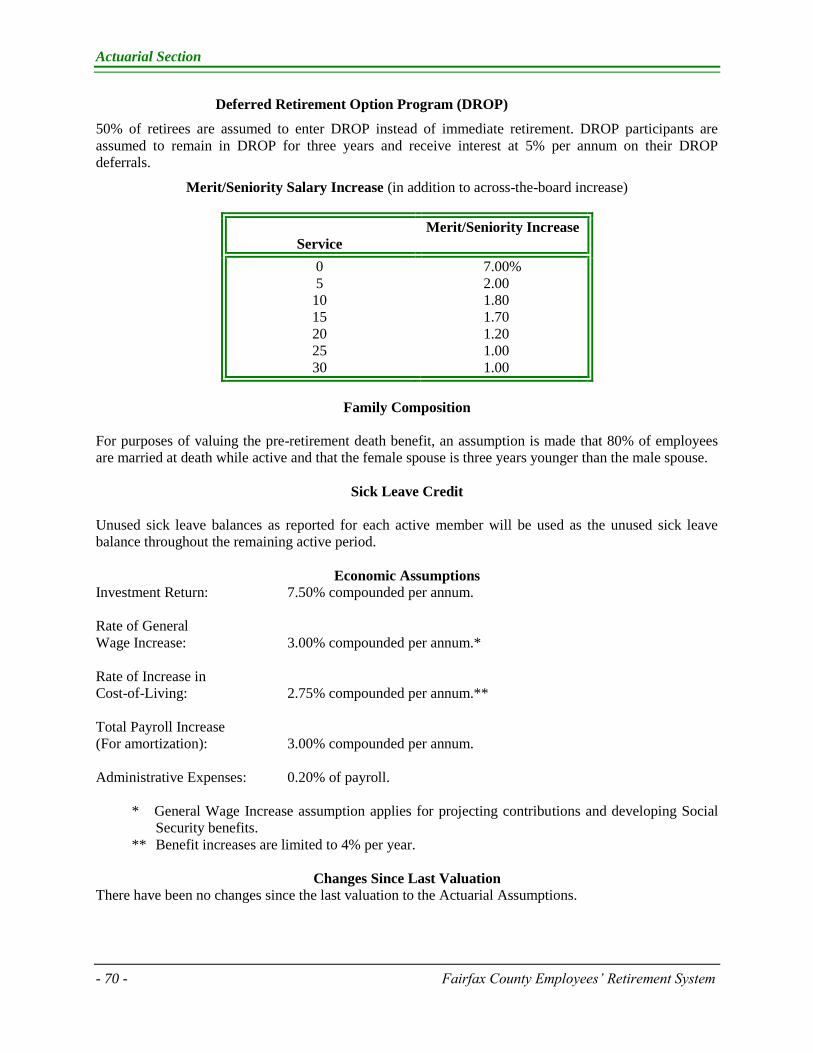
Actuarial Section
- 70 - Fairfax County Employees’ Retirement System
Deferred Retirement Option Program (DROP)
50% of retirees are assumed to enter DROP instead of immediate retirement. DROP participants are
assumed to remain in DROP for three years and receive interest at 5% per annum on their DROP
deferrals.
Merit/Seniority Salary Increase (in addition to across-the-board increase)
Service
Merit/Seniority Increase
0
5
10
15
20
25
30
7.00%
2.00
1.80
1.70
1.20
1.00
1.00
Family Composition
For purposes of valuing the pre-retirement death benefit, an assumption is made that 80% of employees
are married at death while active and that the female spouse is three years younger than the male spouse.
Sick Leave Credit
Unused sick leave balances as reported for each active member will be used as the unused sick leave
balance throughout the remaining active period.
Economic Assumptions
Investment Return: 7.50% compounded per annum.
Rate of General
Wage Increase: 3.00% compounded per annum.*
Rate of Increase in
Cost-of-Living: 2.75% compounded per annum.**
Total Payroll Increase
(For amortization): 3.00% compounded per annum.
Administrative Expenses: 0.20% of payroll.
* General Wage Increase assumption applies for projecting contributions and developing Social
Security benefits.
** Benefit increases are limited to 4% per year.
Changes Since Last Valuation
There have been no changes since the last valuation to the Actuarial Assumptions.

Actuarial Section
Fairfax County Employees’ Retirement System - 71 -
Analysis of Financial Experience
Gain and Loss in Accrued Liability During Years Ended June 30
Resulting from Differences Between Assumed Experience and Actual Experience
Type of Activity 2008 2009 2010 2011 2012 2013
Investment Income $5,501,407 $(282,116,118) $(83,485,934) $71,698,746 $59,620,255 $46,004,262
Combined Liability
Experience (26,428,258) (62,427,360) (74,720,305) (79,444,131) (74,547,089) (39,401,877)
Gain (or Loss)
During Year from
Financial Experience $(20,926,851) $(344,543,478) $(158,206,239) $(7,745,385) $(14,926,834) $6,602,385
Non-Recurring Items (1,446,483) 0 0 (1,602,061) 0 (727,193)
Composite Gain (or
Loss) During Year $(22,373,334) $(344,543,478) $(158,206,239)
$(9,347,446) $(14,926,834)
$5,875,192
Schedule of Retirees and Beneficiaries
Added To and Removed From Rolls
Year Added to Rolls
Removed
On Rolls @ Yr. End
From Rolls
Ended
Annual
Annual
Annual %Increase Average
June 30, No. Allowance No. Allowance No. Allowance Allowance Allowance
2008 388 $13,490,523 158 $2,650,227 5,585 $133,467,368 8.84% $23,897
2009 533 14,697,864 187 3,032,662 5,931 145,132,570 8.74% 24,470
2010 450 14,483,584 163 2,748,741 6,218 156,867,413 8.09% 25,228
2011 518 18,345,093 168 2,885,600 6,568 172,326,906 9.86% 26,237
2012 472 17,441,822 152 2,971,259 6,888 186,797,469 8.40% 27,119
2013 559 17,469,060 184 3,336,404 7,263 200,930,125 7.57% 27,665
Solvency Tests
Aggregate Accrued Liabilities For
Valuation
Date
July 1,
(1)
Active
Member
Contributions
(2)
Retirees, Vested
Terms, Beneficiaries
& DROP
(3)
Active Members
(Employer
Financed Portion)
Reported
Assets *
Portion of Accrued
Liabilities
by Reported Assets
(1)
(2)
(3)
2008 $298,907,993 $1,662,930,379 $1,367,062,619 $2,752,873,842 100% 100% 58%
2009 312,357,412 1,813,482,907 1,410,033,226 2,603,283,631 100% 100% 34%
2010 329,166,585 1,985,373,546 1,456,519,392 2,636,051,959 100% 100% 22%
2011 339,170,151 2,177,027,867 1,502,726,115 2,841,466,151 100% 100% 22%
2012 332,723,684 2,411,862,623 1,519,589,131 3,053,412,085 100% 100% 20%
2013 355,254,873 2,587,007,980 1,531,567,801 3,261,923,577 100% 100% 21%
* Based on the Actuarial Value of Assets

-72 - Fairfax County Employees’ Retirement System
This Page Left Intentionally Blank
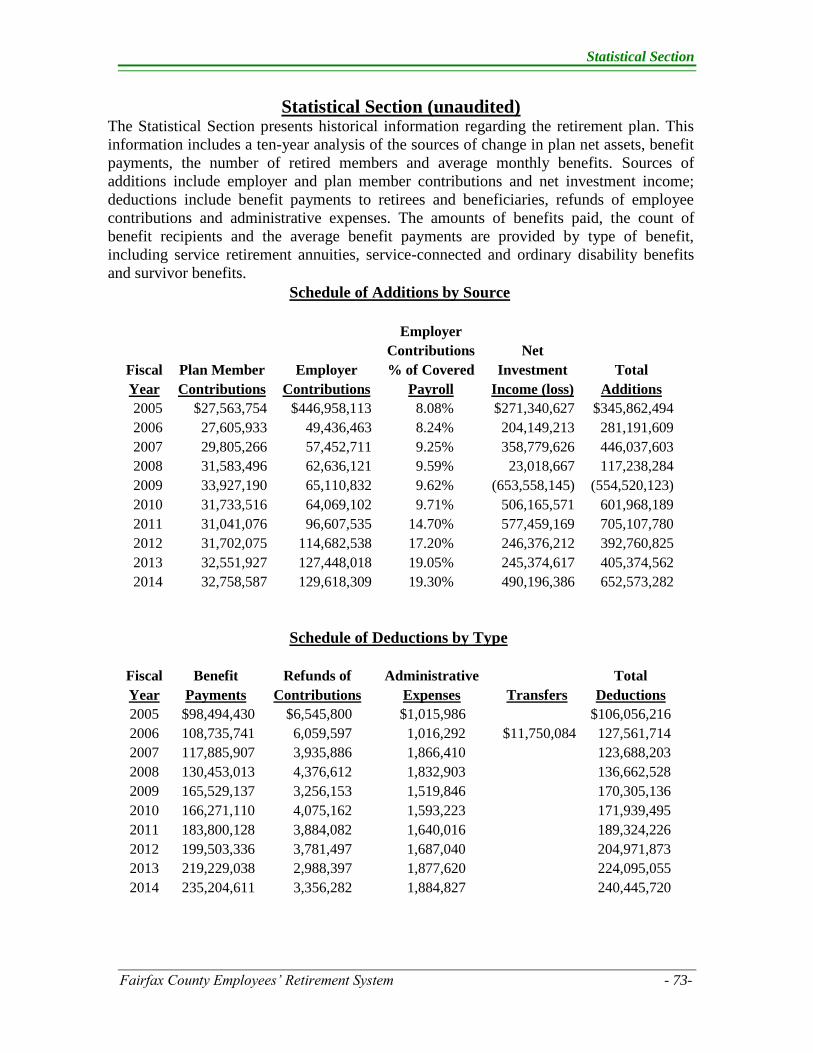
Statistical Section
Fairfax County Employees’ Retirement System - 73-
Statistical Section (unaudited) The Statistical Section presents historical information regarding the retirement plan. This
information includes a ten-year analysis of the sources of change in plan net assets, benefit
payments, the number of retired members and average monthly benefits. Sources of
additions include employer and plan member contributions and net investment income;
deductions include benefit payments to retirees and beneficiaries, refunds of employee
contributions and administrative expenses. The amounts of benefits paid, the count of
benefit recipients and the average benefit payments are provided by type of benefit,
including service retirement annuities, service-connected and ordinary disability benefits
and survivor benefits.
Schedule of Additions by Source
Employer
Contributions Net
Fiscal Plan Member Employer % of Covered Investment Total
Year Contributions Contributions Payroll Income (loss) Additions
2005 $27,563,754 $446,958,113 8.08% $271,340,627 $345,862,494
2006 27,605,933 49,436,463 8.24% 204,149,213 281,191,609
2007 29,805,266 57,452,711 9.25% 358,779,626 446,037,603
2008 31,583,496 62,636,121 9.59% 23,018,667 117,238,284
2009 33,927,190 65,110,832 9.62% (653,558,145) (554,520,123)
2010 31,733,516 64,069,102 9.71% 506,165,571 601,968,189
2011 31,041,076 96,607,535 14.70% 577,459,169 705,107,780
2012 31,702,075 114,682,538 17.20% 246,376,212 392,760,825
2013 32,551,927 127,448,018 19.05% 245,374,617 405,374,562
2014 32,758,587 129,618,309 19.30% 490,196,386 652,573,282
Schedule of Deductions by Type
Fiscal Benefit Refunds of Administrative
Total
Year Payments Contributions Expenses Transfers Deductions
2005 $98,494,430 $6,545,800 $1,015,986
$106,056,216
2006 108,735,741 6,059,597 1,016,292 $11,750,084 127,561,714
2007 117,885,907 3,935,886 1,866,410
123,688,203
2008 130,453,013 4,376,612 1,832,903
136,662,528
2009 165,529,137 3,256,153 1,519,846
170,305,136
2010 166,271,110 4,075,162 1,593,223
171,939,495
2011 183,800,128 3,884,082 1,640,016
189,324,226
2012 199,503,336 3,781,497 1,687,040
204,971,873
2013 219,229,038 2,988,397 1,877,620 224,095,055
2014 235,204,611 3,356,282 1,884,827 240,445,720
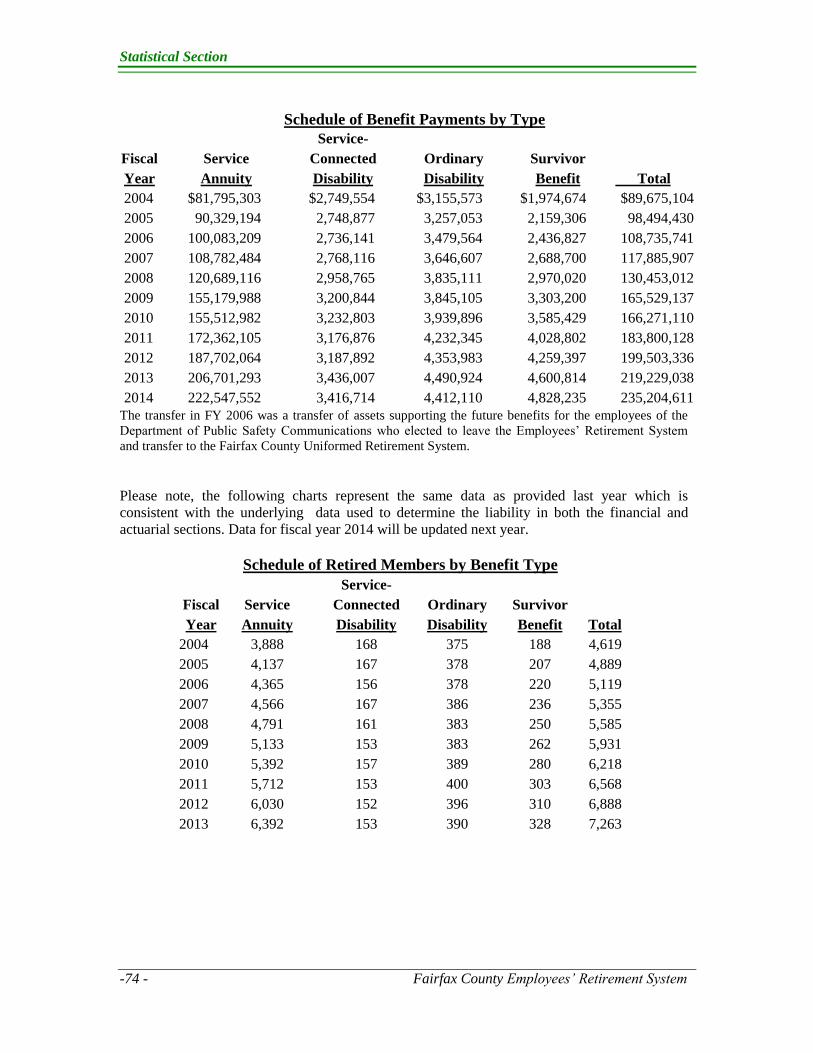
Statistical Section
-74 - Fairfax County Employees’ Retirement System
The transfer in FY 2006 was a transfer of assets supporting the future benefits for the employees of the
Department of Public Safety Communications who elected to leave the Employees’ Retirement System
and transfer to the Fairfax County Uniformed Retirement System.
Please note, the following charts represent the same data as provided last year which is
consistent with the underlying data used to determine the liability in both the financial and
actuarial sections. Data for fiscal year 2014 will be updated next year.
Schedule of Retired Members by Benefit Type
Service-
Fiscal Service
Connected Ordinary Survivor
Year Annuity
Disability Disability Benefit Total
2004
3,888
168 375 188 4,619
2005
4,137
167 378 207 4,889
2006
4,365
156 378 220 5,119
2007
4,566
167 386 236 5,355
2008
4,791
161 383 250 5,585
2009
5,133
153 383 262 5,931
2010
5,392
157 389 280 6,218
2011
5,712
153 400 303 6,568
2012
6,030
152 396 310 6,888
2013
6,392
153 390 328 7,263
Schedule of Benefit Payments by Type
Service-
Fiscal Service Connected Ordinary Survivor
Year Annuity Disability Disability Benefit Total
2004
$81,795,303
$2,749,554
$3,155,573
$1,974,674
$89,675,104
2005 90,329,194 2,748,877 3,257,053 2,159,306 98,494,430
2006
100,083,209
2,736,141
3,479,564
2,436,827
108,735,741
2007
108,782,484
2,768,116
3,646,607
2,688,700
117,885,907
2008
120,689,116
2,958,765
3,835,111
2,970,020
130,453,012
2009
155,179,988
3,200,844
3,845,105
3,303,200
165,529,137
2010
155,512,982
3,232,803
3,939,896
3,585,429
166,271,110
2011
172,362,105
3,176,876
4,232,345
4,028,802
183,800,128
2012
187,702,064
3,187,892
4,353,983
4,259,397
199,503,336
2013
206,701,293
3,436,007
4,490,924
4,600,814
219,229,038
2014 222,547,552 3,416,714 4,412,110 4,828,235 235,204,611

Statistical Section
Fairfax County Employees’ Retirement System - 75-
Schedule of Average Monthly Benefit Amounts
Service-
Fiscal Service Connected Ordinary Survivor
Year Annuity Disability Disability Benefit Average
2004
$1,840
$1,333
$708
$915
$1,692
2005
1,932
1,401
740
939
1,780
2006
1,987
1,460
777
998
1,839
2007
2,061
1,502
816
1,030
1,908
2008
2,144
1,619
845
1,070
1,991
2009
2,187
1,710
841
1,092
2,039
2010
2,250
1,708
872
1,193
2,102
2011
2,339
1,761
896
1,225
2,186
2012
2,409
1,857
935
1,247
2,260
2013
2,450
1,913
941
1,274
2,305
Schedule of Average Monthly Benefits by Years of Service
Years of Credited Service* 2-4 5-9 10-14 15-19 20-24 25-29 30+
Period 7/1/2009 to 6/30/2010
Average Monthly Benefit ** 196
496
928
1,553
2,205
2,945
3,880
Average of Final Monthly
Salaries 3,088
3,451
4,034
4,678
5,409
5,646
6,346
Number of Retirees 24
60
47
66
87
43
34
Period 7/1/2010 to 6/30/2011
Average Monthly Benefit ** 243
564
972
1,823
2,504
2,940
3,633
Average of Final Monthly
Salaries 3,317
3,772
4,278
5,416
5,796
5,855
6,164
Number of Retirees 29
57
59
75
112
67
46
Period 7/1/2011 to 6/30/2012
Average Monthly Benefit ** 259
525
970
1,690
2,565
3,042
3,699
Average of Final Monthly
Salaries 3,712
3,764
4,147
5,145
6,145
6,060
6,252
Number of Retirees 25
52
54
65
89
80
30
Period 7/1/2012 to 6/30/2013
Average Monthly Benefit ** 207
581
990
1,832
2,514
3,123
4,569
Average of Final Monthly
Salaries 2,847
4,114
4,278
5,430
5,860
6,300
7,428
Number of Retirees 34
66
54
69
113
77
37
* The Years of Credited Service is the service used in the determination of benefits, which may be different
than service for eligibility.
** Does not include supplements.

-76- Fairfax County Employees’ Retirement System
This Page Left Intentionally Blank

Fairfax County Retirement Systems 10680 Main Street, Suite 280, Fairfax, VA 22030
A Fairfax County, Va., publication