Embed Size (px)
Citation preview
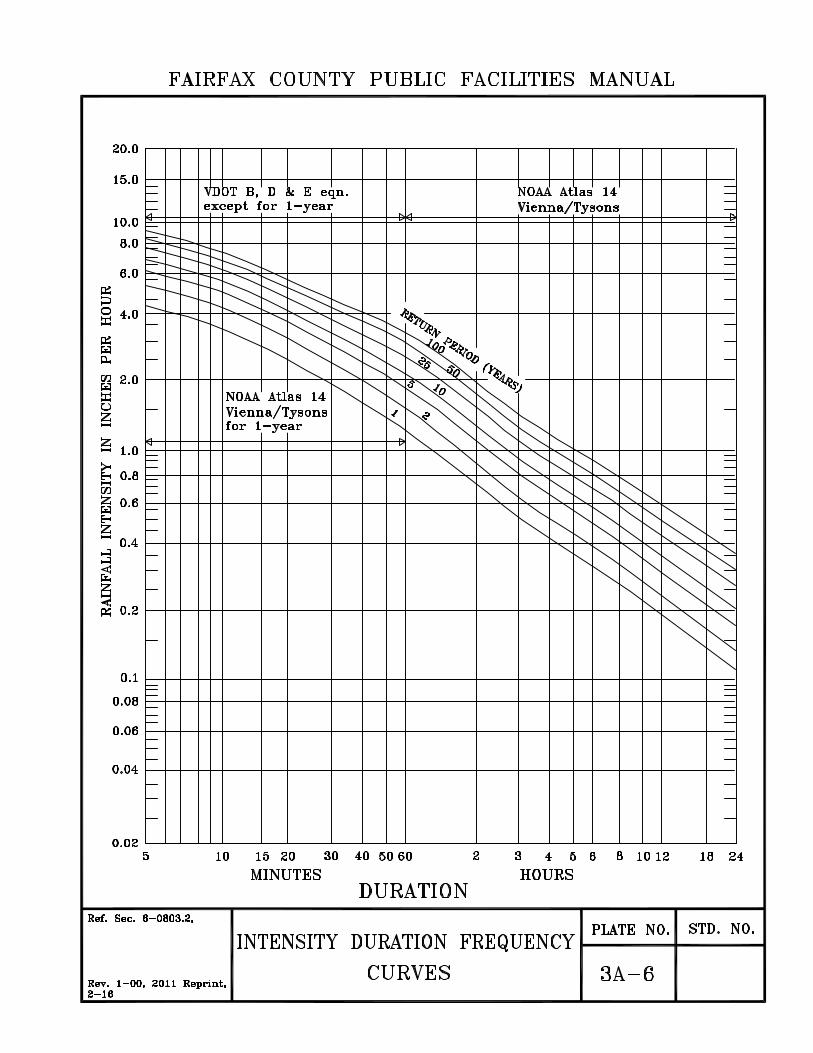
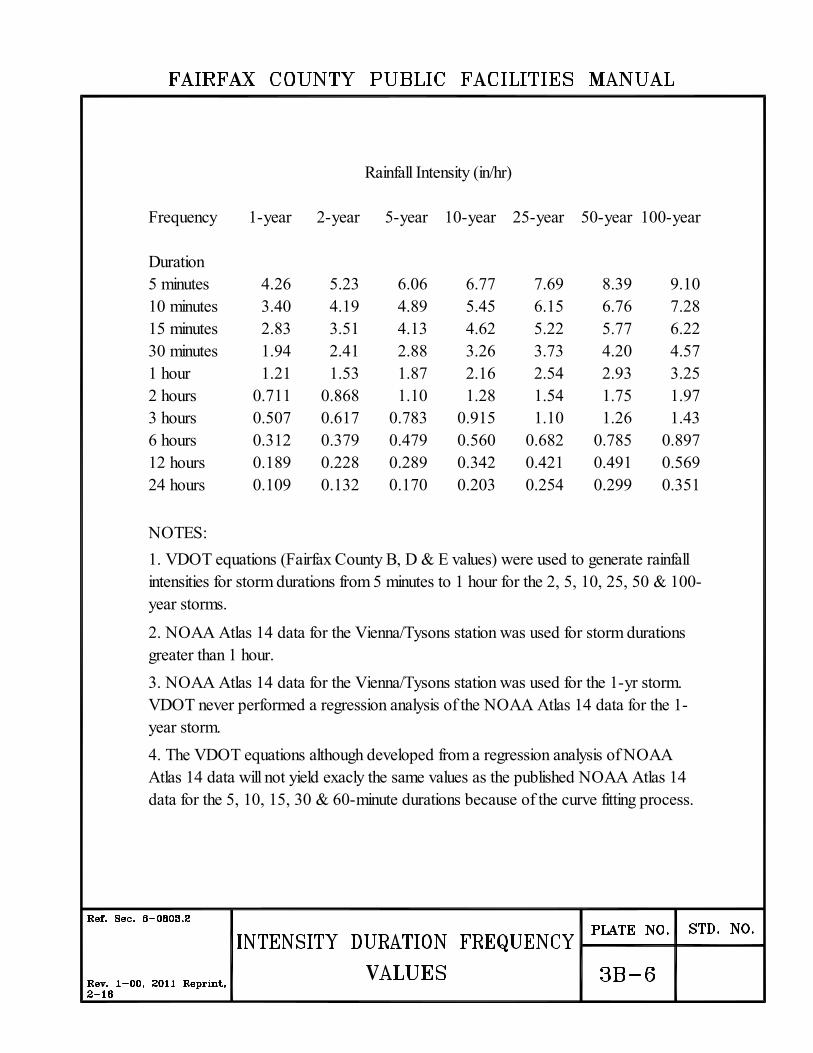
Rainfall Intensity (in/hr)
Frequency 1-year 2-year 5-year 10-year 25-year 50-year 100-year
Duration 5 minutes 4.26 5.23 6.06 6.77 7.69 8.39 9.10 10 minutes 3.40 4.19 4.89 5.45 6.15 6.76 7.28 15 minutes 2.83 3.51 4.13 4.62 5.22 5.77 6.22 30 minutes 1.94 2.41 2.88 3.26 3.73 4.20 4.57 1 hour 1.21 1.53 1.87 2.16 2.54 2.93 3.25 2 hours 0.711 0.868 1.10 1.28 1.54 1.75 1.97 3 hours 0.507 0.617 0.783 0.915 1.10 1.26 1.43 6 hours 0.312 0.379 0.479 0.560 0.682 0.785 0.897 12 hours 0.189 0.228 0.289 0.342 0.421 0.491 0.569 24 hours 0.109 0.132 0.170 0.203 0.254 0.299 0.351
NOTES:
1. VDOT equations (Fairfax County B, D & E values) were used to generate rainfall intensities for storm durations from 5 minutes to 1 hour for the 2, 5, 10, 25, 50 & 100-
year storms.
2. NOAA Atlas 14 data for the Vienna/Tysons station was used for storm durations greater than 1 hour.
3. NOAA Atlas 14 data for the Vienna/Tysons station was used for the 1-yr storm.
VDOT never performed a regression analysis of the NOAA Atlas 14 data for the 1-
year storm.
4. The VDOT equations although developed from a regression analysis of NOAA Atlas 14 data will not yield exacly the same values as the published NOAA Atlas 14
data for the 5, 10, 15, 30 & 60-minute durations because of the curve fitting process.
•
•
•
•
•
•
•
•
•
•
•
•
•
• •
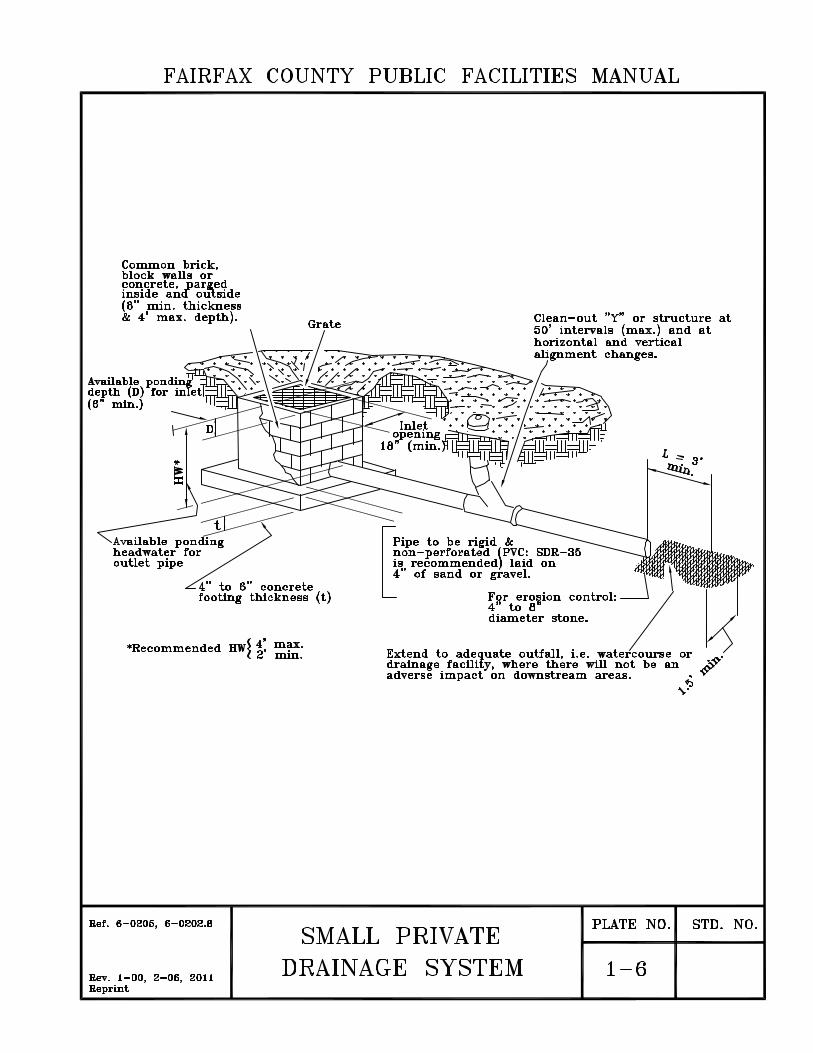
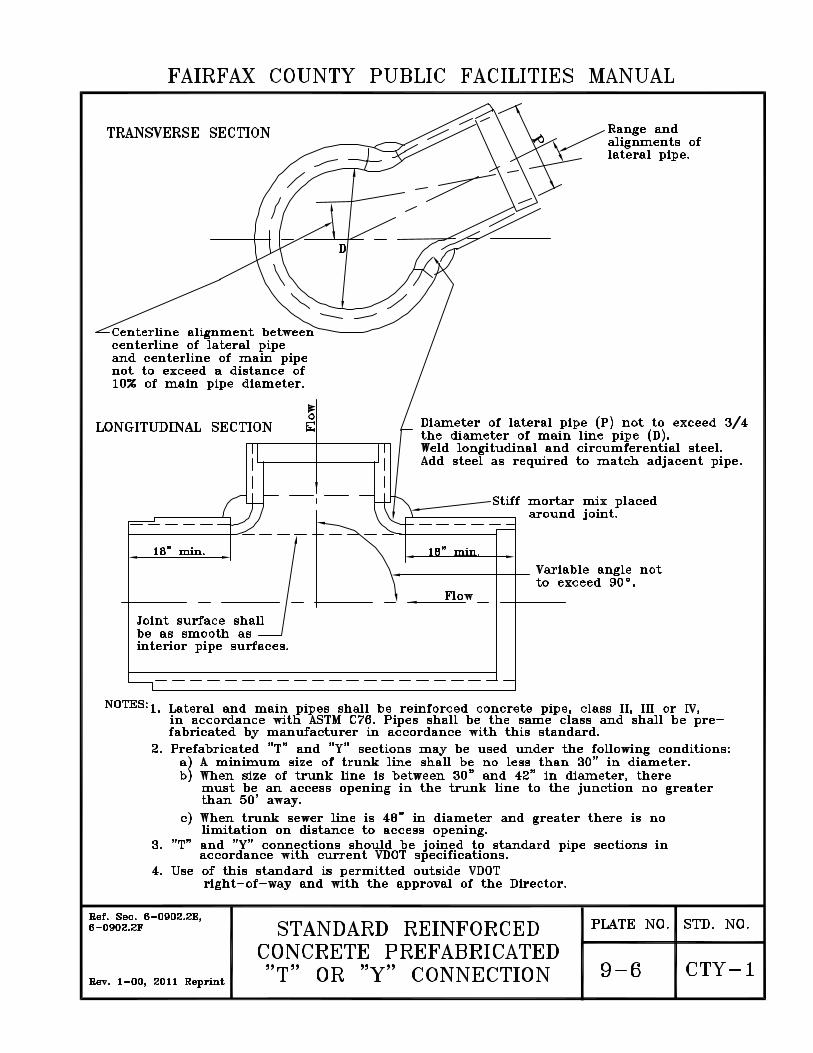
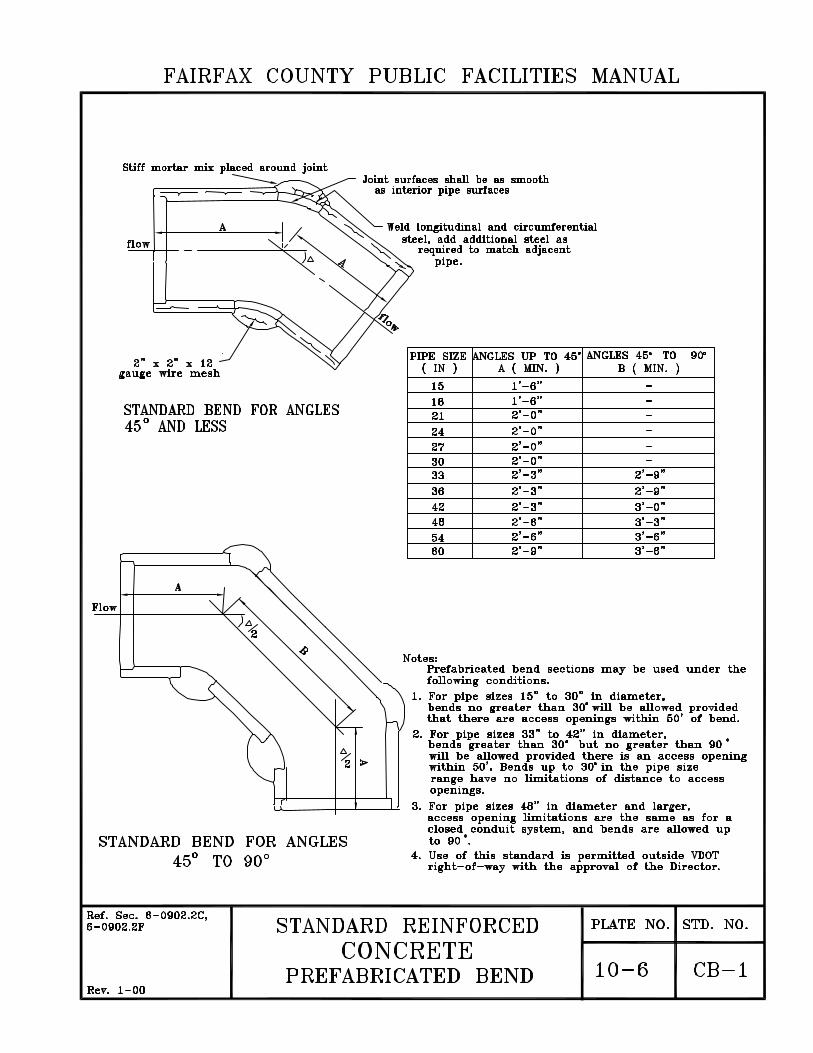
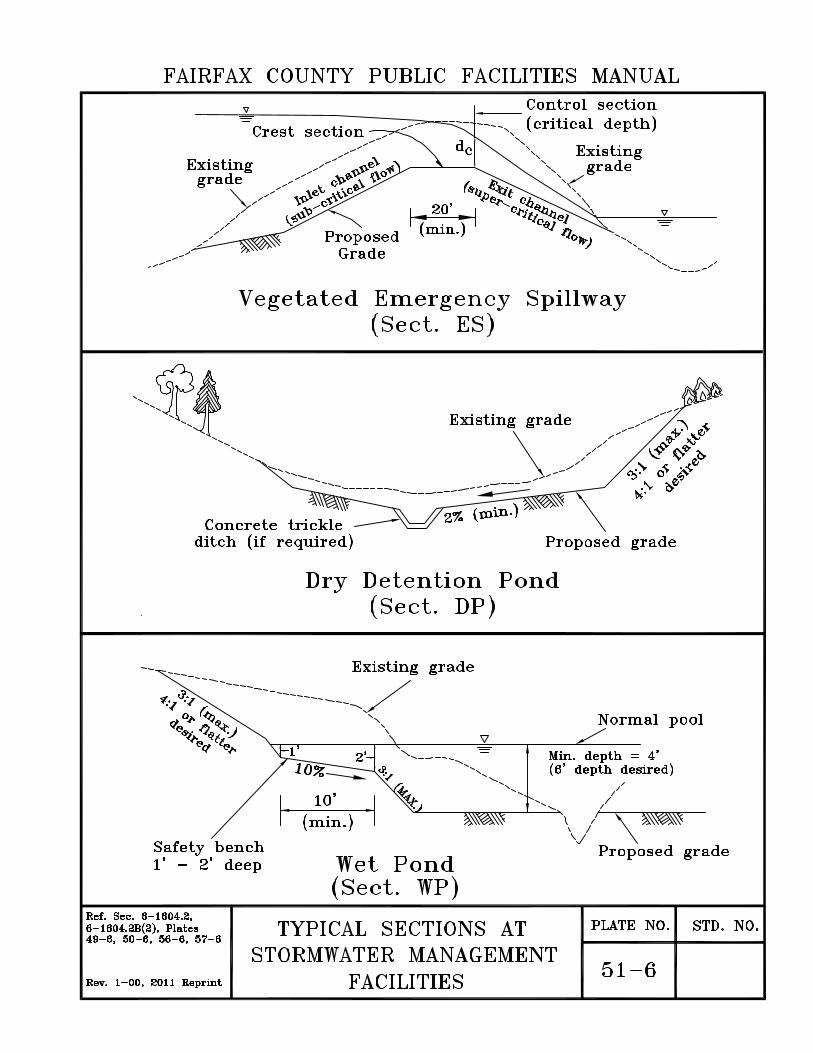
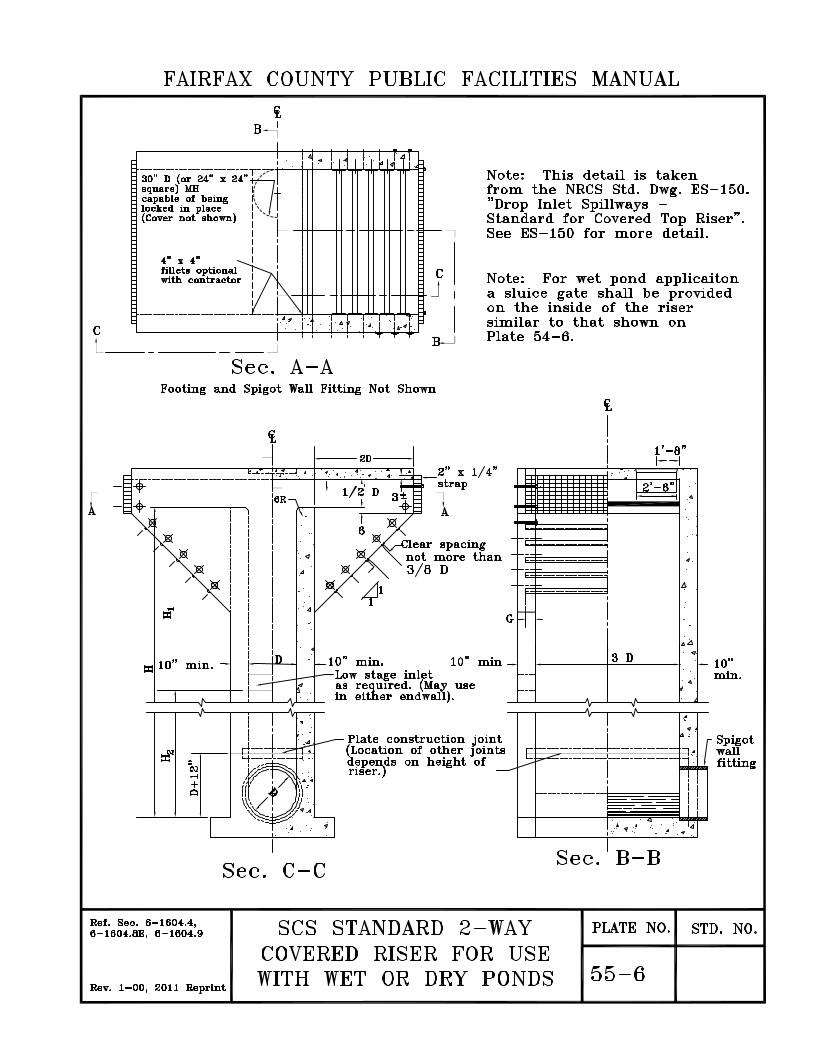
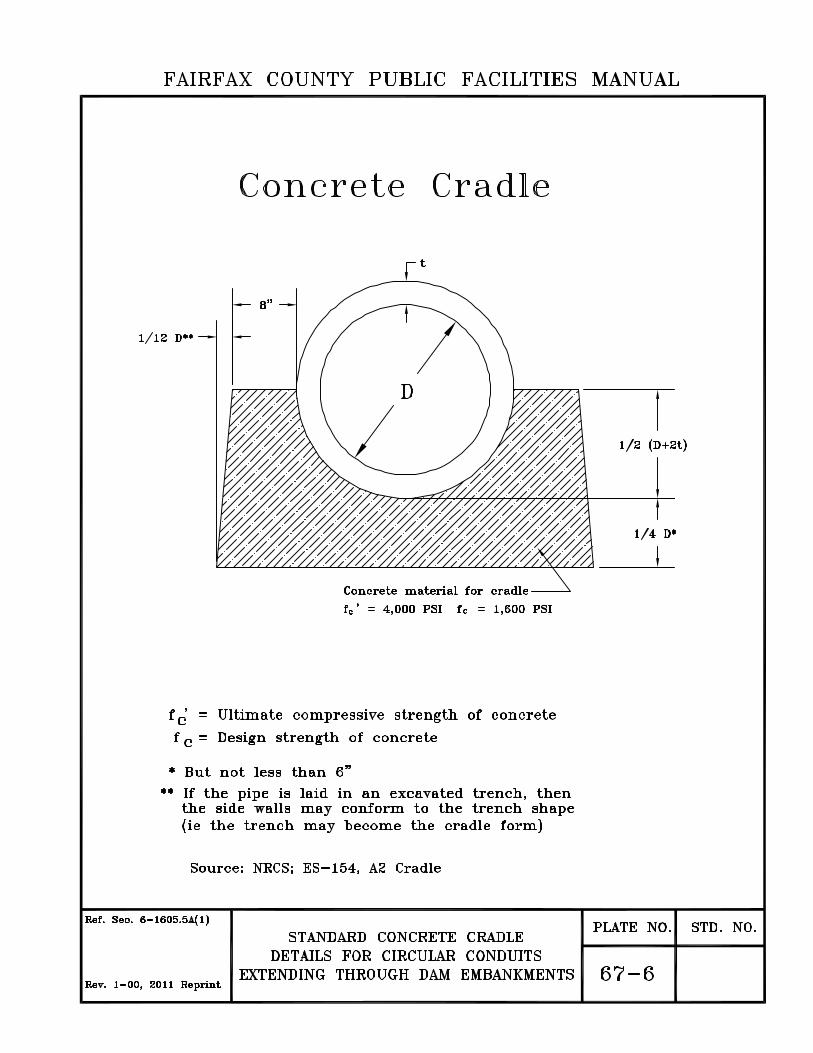
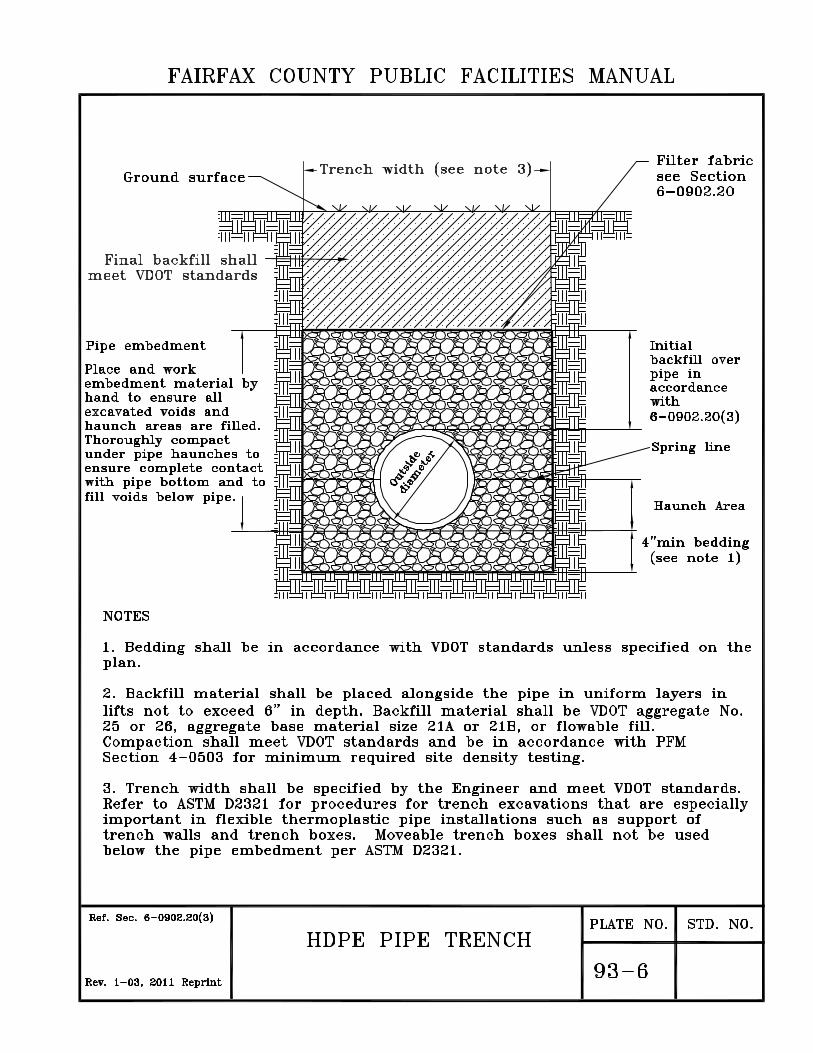
1'-6"
1'-6"
5' (min)


![Journal of Membrane Scienceuhv.cheme.cmu.edu/pubs/2015_6.pdf2S was added to a water–gas shift mixture at 673 K [16]. Recently, Wayand coworkers [20] tested the effect of H 2S on](https://img.pdfslide.us/doc/110x75/60e04c254900e60d794493c9/journal-of-membrane-2s-was-added-to-a-wateragas-shift-mixture-at-673-k-16-recently.jpg)