Embed Size (px)
Citation preview
S t a t e o f C a l i f o r n i a A n a l y s i s o f I m p e d i m e n t s P a g e | 6 - 1
Fair Housing Complaints ____________________________________ Fair housing complaints can be used as an indicator to identify heavily impacted areas and characteristics of households experiencing discrimination in housing. To accomplish this, this report considers fair housing complaint data filed with the Department of Fair Employment and Housing (DFEH) and the U.S. Department of Housing and Urban Development (HUD) between fiscal years 2005/2006 and 2009/2010. Using this data the report identifies and analyzes the following: the absolute number of complaints filed with DFEH and HUD in California. The
majority of complaints are filed on the basis of disability discrimination.
complaint closures and variations in outcome of cases between the two agencies.
complaint rates to evaluate if specific areas have higher rates of complaints, which may indicate areas of concern. 1 It shows that a number of counties had significantly higher rates than the State as a whole.
In conduction this analysis, several data limitations were identified. The following summarizes the most important limitations of the DFEH and HUD datasets. It, however, is not an exhaustive list:
Because the complaint process relies on people self-reporting, the data represents only complaints filed. This does not represent all acts of housing discrimination, as all incidents may not be reported. Therefore, the data is fluid, as reports may be filed belatedly.
Larger, denser areas are likelier to have a higher number of complaints due to larger populations.
Given the short temporal frame considered in the analysis, a longitudinal approach of complaint outcomes is not possible. Complaints may have been filed or closed in years prior than those considered in this analysis.
Due to privacy concerns, the geo-location of complaints used for this analysis is of the respondent rather than the individual filing the claim, which may not be the same location where the discrimination occurred.
1 For this analysis, housing complaint rates are the number of housing complaints in an area by the number of households estimated in the 2005-2009 5-year ACS in that same area.
6
S t a t e
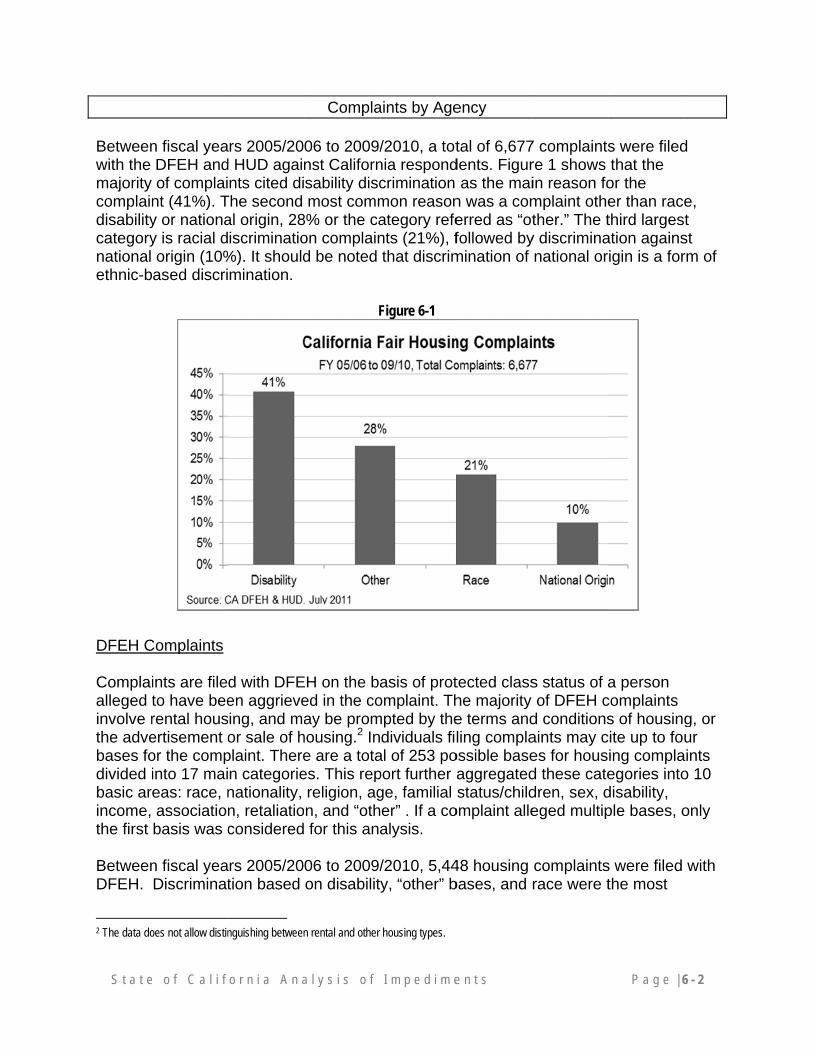
Betweenwith the majority complaindisabilitycategorynational ethnic-b
DFEH C Complaialleged tinvolve rthe advebases fodivided ibasic arincome, the first
BetweenDFEH.
2 The data do
o f C a l i f
n fiscal yeaDFEH andof complai
nt (41%). Ty or nationay is racial dorigin (10%ased discri
Complaints
ints are fileto have beerental housertisement oor the compinto 17 maieas: race, nassociationbasis was c
n fiscal yeaDiscriminat
oes not allow distin
o r n i a A n a
rs 2005/20d HUD againnts cited di
The second al origin, 28iscriminatio
%). It shouldmination.
d with DFEen aggrieveing, and maor sale of h
plaint. Theren categorienationality, n, retaliatioconsidered
rs 2005/20tion based
nguishing between
a l y s i s o f
Compla
06 to 2009/nst Californsability discmost comm
8% or the caon complaind be noted
F
EH on the baed in the coay be prom
housing.2 Ine are a totaes. This repreligion, agn, and “oth for this ana
06 to 2009/on disabilit
n rental and other
I m p e d i m e
aints by Age
/2010, a totnia respondcrimination mon reasonategory refents (21%), fthat discrim
Figure 6-1
asis of protomplaint. Th
mpted by thedividuals fil
al of 253 poport further ge, familial er” . If a coalysis.
/2010, 5,44y, “other” b
housing types.
e n t s
ency
tal of 6,677dents. Figur
as the main was a comerred as “otfollowed bymination of
tected classhe majority e terms andling compla
ossible baseaggregatedstatus/child
omplaint alle
48 housing bases, and
7 complaintsre 1 shows in reason fomplaint othether.” The t
y discriminanational or
s status of aof DFEH c
d conditionsaints may ces for housd these catedren, sex, deged multip
complaintsrace were t
P a g e | 6
s were filedthat the
or the er than racethird largesation againsigin is a for
a person complaints s of housing
cite up to fouing complaegories intodisability, ple bases, o
s were filed the most
6 - 2
d
e, t
st rm of
g, or ur
aints o 10
only
with
S t a t e o f C a l i f o r n i a A n a l y s i s o f I m p e d i m e n t s P a g e | 6 - 3
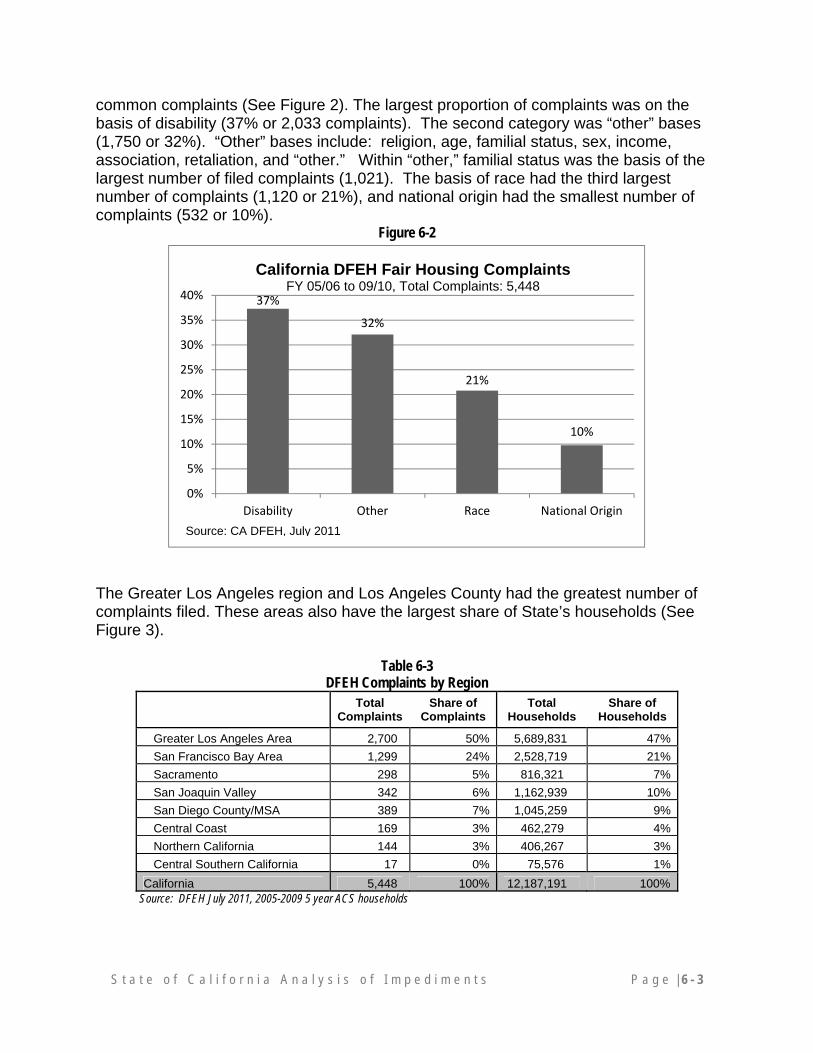
common complaints (See Figure 2). The largest proportion of complaints was on the basis of disability (37% or 2,033 complaints). The second category was “other” bases (1,750 or 32%). “Other” bases include: religion, age, familial status, sex, income, association, retaliation, and “other.” Within “other,” familial status was the basis of the largest number of filed complaints (1,021). The basis of race had the third largest number of complaints (1,120 or 21%), and national origin had the smallest number of complaints (532 or 10%).
Figure 6-2
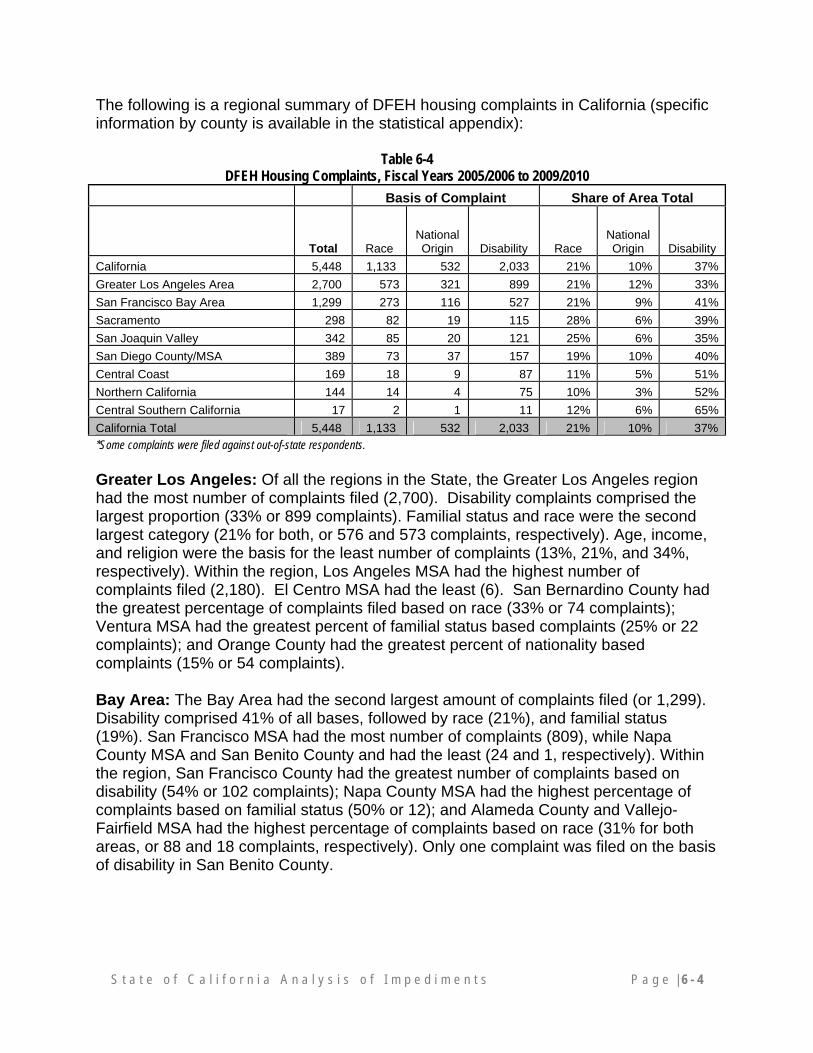
The Greater Los Angeles region and Los Angeles County had the greatest number of complaints filed. These areas also have the largest share of State’s households (See Figure 3).
Table 6-3 DFEH Complaints by Region
Total Complaints
Share of Complaints
Total Households
Share of Households
Greater Los Angeles Area 2,700 50% 5,689,831 47%
San Francisco Bay Area 1,299 24% 2,528,719 21%
Sacramento 298 5% 816,321 7%
San Joaquin Valley 342 6% 1,162,939 10%
San Diego County/MSA 389 7% 1,045,259 9%
Central Coast 169 3% 462,279 4%
Northern California 144 3% 406,267 3%
Central Southern California 17 0% 75,576 1%
California 5,448 100% 12,187,191 100% Source: DFEH July 2011, 2005-2009 5 year ACS households
37%
32%
21%
10%
0%
5%
10%
15%
20%
25%
30%
35%
40%
Disability Other Race National Origin
California DFEH Fair Housing ComplaintsFY 05/06 to 09/10, Total Complaints: 5,448
Source: CA DFEH, July 2011
S t a t e o f C a l i f o r n i a A n a l y s i s o f I m p e d i m e n t s P a g e | 6 - 4
The following is a regional summary of DFEH housing complaints in California (specific information by county is available in the statistical appendix):
Table 6-4 DFEH Housing Complaints, Fiscal Years 2005/2006 to 2009/2010
Basis of Complaint Share of Area Total
Total Race National Origin Disability Race
National Origin Disability
California 5,448 1,133 532 2,033 21% 10% 37%
Greater Los Angeles Area 2,700 573 321 899 21% 12% 33%
San Francisco Bay Area 1,299 273 116 527 21% 9% 41%
Sacramento 298 82 19 115 28% 6% 39%
San Joaquin Valley 342 85 20 121 25% 6% 35%
San Diego County/MSA 389 73 37 157 19% 10% 40%
Central Coast 169 18 9 87 11% 5% 51%
Northern California 144 14 4 75 10% 3% 52%
Central Southern California 17 2 1 11 12% 6% 65%
California Total 5,448 1,133 532 2,033 21% 10% 37%
*Some complaints were filed against out-of-state respondents.
Greater Los Angeles: Of all the regions in the State, the Greater Los Angeles region had the most number of complaints filed (2,700). Disability complaints comprised the largest proportion (33% or 899 complaints). Familial status and race were the second largest category (21% for both, or 576 and 573 complaints, respectively). Age, income, and religion were the basis for the least number of complaints (13%, 21%, and 34%, respectively). Within the region, Los Angeles MSA had the highest number of complaints filed (2,180). El Centro MSA had the least (6). San Bernardino County had the greatest percentage of complaints filed based on race (33% or 74 complaints); Ventura MSA had the greatest percent of familial status based complaints (25% or 22 complaints); and Orange County had the greatest percent of nationality based complaints (15% or 54 complaints). Bay Area: The Bay Area had the second largest amount of complaints filed (or 1,299). Disability comprised 41% of all bases, followed by race (21%), and familial status (19%). San Francisco MSA had the most number of complaints (809), while Napa County MSA and San Benito County and had the least (24 and 1, respectively). Within the region, San Francisco County had the greatest number of complaints based on disability (54% or 102 complaints); Napa County MSA had the highest percentage of complaints based on familial status (50% or 12); and Alameda County and Vallejo-Fairfield MSA had the highest percentage of complaints based on race (31% for both areas, or 88 and 18 complaints, respectively). Only one complaint was filed on the basis of disability in San Benito County.
S t a t e o f C a l i f o r n i a A n a l y s i s o f I m p e d i m e n t s P a g e | 6 - 5
Sacramento: With 298 total complaints for the reporting period, 115 or 39% of complaints within the Sacramento region were based on disability, 28% based on race, and 11% based on familial status. The region also had the highest percentage of racial discrimination complaints relative to other regions, representing 28% of total complaints compared to the State at 21%. For the most common bases, Sutter County and Placer County had the greatest proportion of complaints on the basis of disability (60% or 6 complaints and 49% or 18 complaints). Also, Yuba County had the greatest proportion of complaints on the basis of race (54% or 7 complaints) while El Dorado County had the highest percentage of complaints on the basis of familial status (35% or 6). San Joaquin Valley: The San Joaquin Valley had 342 complaints with 35% of complaints based on disability, 25% based on race, and 15% based on familial status. Interestingly, the San Joaquin Valley had the highest percentage of complaints filed based on sex (10%) in the State. While Fresno County had the greatest number of complaints (82), Kings County had the least number of housing complaints filed (12). Madera County had the highest percentage of complaints due to disability (44% or 7). Merced County had the highest percentage of complaints due to race (36% or 5), and Kern County had the highest percentage of complaints due to familial status (30% or 14). San Diego: This region had about 389 complaints filed. Almost half of the complaints were filed based on disability (40%). Race and familial status were the next highest bases for complaints (or 19% and 16%, respectively). Central Coast: With 169 complaints, the Central Coast had a lower number of complaints than many other regions in the State. A majority of the complaints were on the basis of disability (51%) with familial status as the next highest in percentage (20%) and race with the third highest percentage (11%). All of the sub-areas in the Central Coast had between 40 to 50 complaints, except for San Luis Obispo County, which had the lowest in number (28). Santa Cruz County had the highest proportion of complaints filed on the basis of disability (63% or 30 complaints) while Santa Barbara County had the highest proportion for familial status (29% or 15 complaints) and Monterey County for race (17% or 7). Northern California: Northern California had 144 complaints filed with the majority of complaints filed on the basis of disability (52%), familial status (11%), and race (10%). Within this region, no complaints were filed in Modoc, Plumas, Sierra, and Trinity counties. Humboldt County had the highest number of complaints filed (33). Colusa County had the highest percentage of complaints filed based on disability (100% or 2 complaints), followed by Lake County and Shasta County (86% or 4 and 85% or 22 complaints, respectively). On the other hand, Glenn County had the highest percentage of complaints filed based on race (100% or 1 complaint) with Lassen County following behind (33% or 1 complaint). Tehama County had the highest percentage of complaints filed based on familial status (75% or 3 complaints).
S t a t e o f C a l i f o r n i a A n a l y s i s o f I m p e d i m e n t s P a g e | 6 - 6
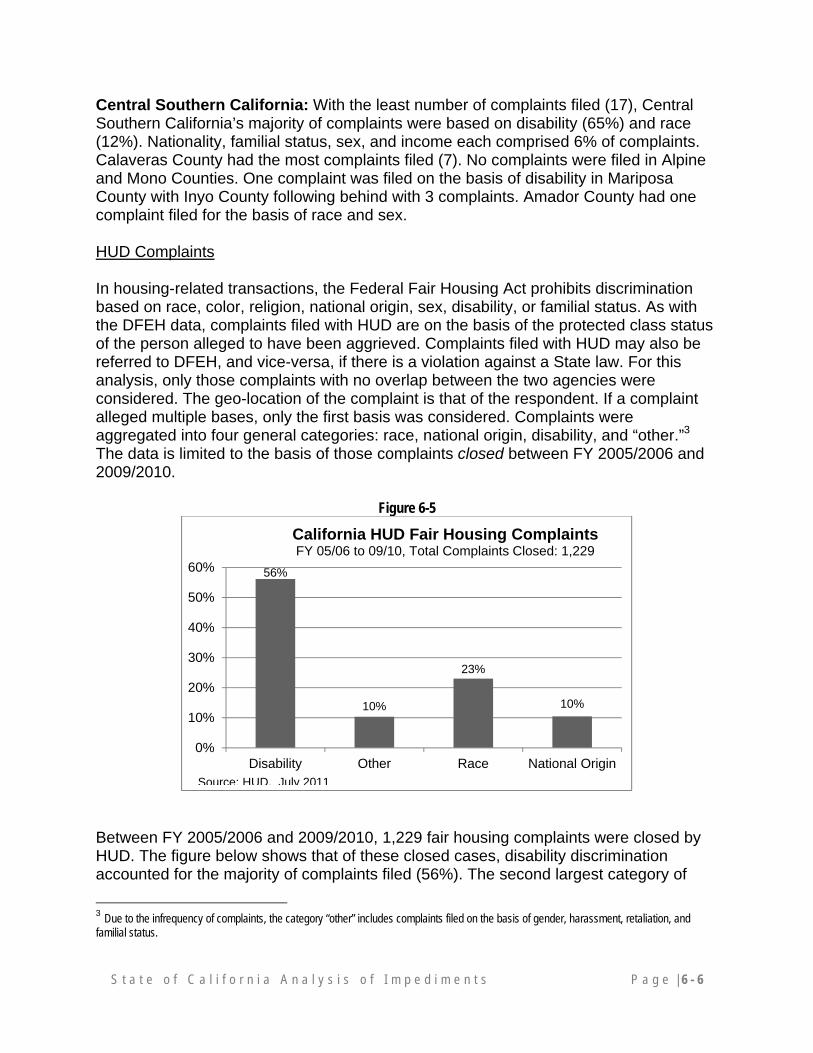
Central Southern California: With the least number of complaints filed (17), Central Southern California’s majority of complaints were based on disability (65%) and race (12%). Nationality, familial status, sex, and income each comprised 6% of complaints. Calaveras County had the most complaints filed (7). No complaints were filed in Alpine and Mono Counties. One complaint was filed on the basis of disability in Mariposa County with Inyo County following behind with 3 complaints. Amador County had one complaint filed for the basis of race and sex. HUD Complaints In housing-related transactions, the Federal Fair Housing Act prohibits discrimination based on race, color, religion, national origin, sex, disability, or familial status. As with the DFEH data, complaints filed with HUD are on the basis of the protected class status of the person alleged to have been aggrieved. Complaints filed with HUD may also be referred to DFEH, and vice-versa, if there is a violation against a State law. For this analysis, only those complaints with no overlap between the two agencies were considered. The geo-location of the complaint is that of the respondent. If a complaint alleged multiple bases, only the first basis was considered. Complaints were aggregated into four general categories: race, national origin, disability, and “other.”3 The data is limited to the basis of those complaints closed between FY 2005/2006 and 2009/2010.
Figure 6-5
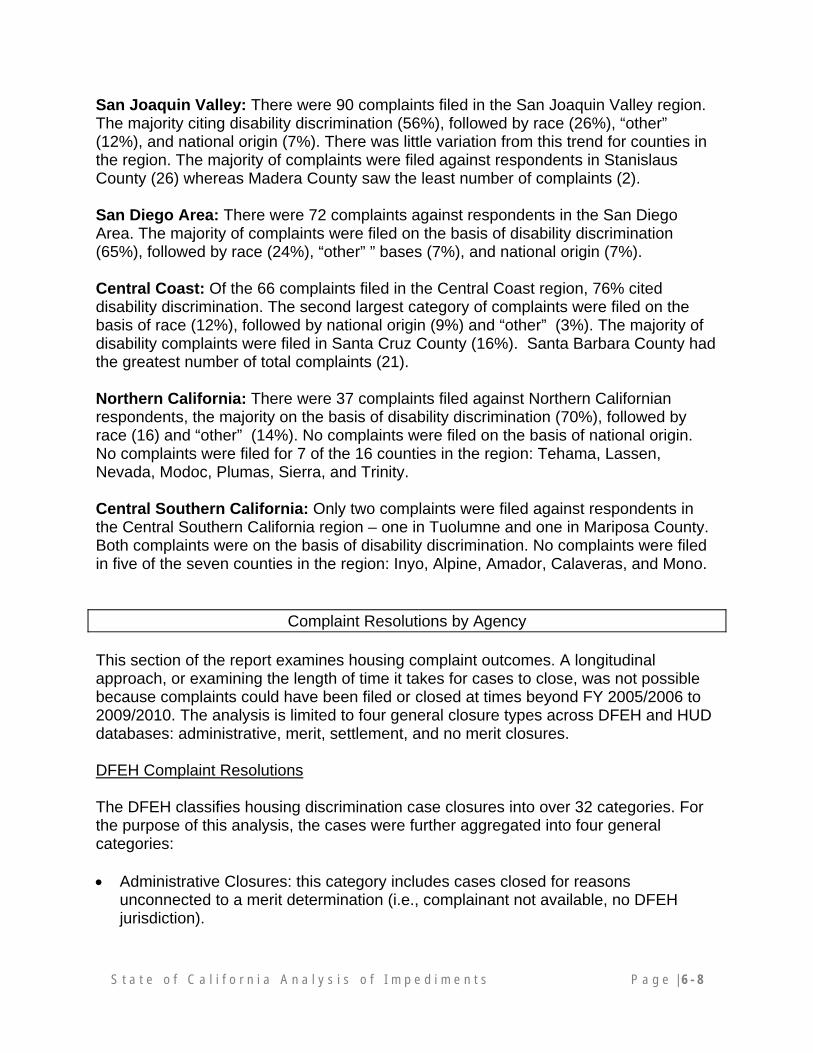
Between FY 2005/2006 and 2009/2010, 1,229 fair housing complaints were closed by HUD. The figure below shows that of these closed cases, disability discrimination accounted for the majority of complaints filed (56%). The second largest category of
3 Due to the infrequency of complaints, the category “other” includes complaints filed on the basis of gender, harassment, retaliation, and familial status.
56%
10%
23%
10%
0%
10%
20%
30%
40%
50%
60%
Disability Other Race National Origin
California HUD Fair Housing ComplaintsFY 05/06 to 09/10, Total Complaints Closed: 1,229
Source: HUD, July 2011
S t a t e o f C a l i f o r n i a A n a l y s i s o f I m p e d i m e n t s P a g e | 6 - 7
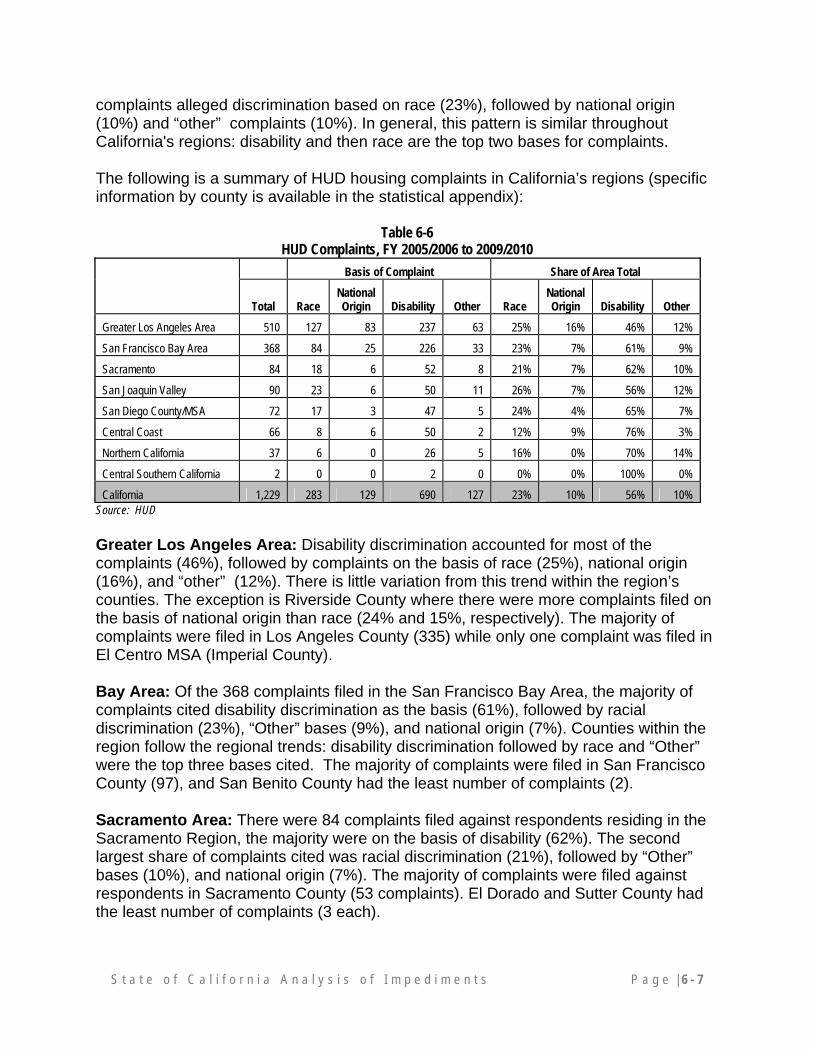
complaints alleged discrimination based on race (23%), followed by national origin (10%) and “other” complaints (10%). In general, this pattern is similar throughout California's regions: disability and then race are the top two bases for complaints. The following is a summary of HUD housing complaints in California’s regions (specific information by county is available in the statistical appendix):
Table 6-6 HUD Complaints, FY 2005/2006 to 2009/2010
Basis of Complaint Share of Area Total
Total Race National Origin Disability Other Race
National Origin Disability Other
Greater Los Angeles Area 510 127 83 237 63 25% 16% 46% 12%
San Francisco Bay Area 368 84 25 226 33 23% 7% 61% 9%
Sacramento 84 18 6 52 8 21% 7% 62% 10%
San Joaquin Valley 90 23 6 50 11 26% 7% 56% 12%
San Diego County/MSA 72 17 3 47 5 24% 4% 65% 7%
Central Coast 66 8 6 50 2 12% 9% 76% 3%
Northern California 37 6 0 26 5 16% 0% 70% 14%
Central Southern California 2 0 0 2 0 0% 0% 100% 0%
California 1,229 283 129 690 127 23% 10% 56% 10% Source: HUD
Greater Los Angeles Area: Disability discrimination accounted for most of the complaints (46%), followed by complaints on the basis of race (25%), national origin (16%), and “other” (12%). There is little variation from this trend within the region’s counties. The exception is Riverside County where there were more complaints filed on the basis of national origin than race (24% and 15%, respectively). The majority of complaints were filed in Los Angeles County (335) while only one complaint was filed in El Centro MSA (Imperial County). Bay Area: Of the 368 complaints filed in the San Francisco Bay Area, the majority of complaints cited disability discrimination as the basis (61%), followed by racial discrimination (23%), “Other” bases (9%), and national origin (7%). Counties within the region follow the regional trends: disability discrimination followed by race and “Other” were the top three bases cited. The majority of complaints were filed in San Francisco County (97), and San Benito County had the least number of complaints (2). Sacramento Area: There were 84 complaints filed against respondents residing in the Sacramento Region, the majority were on the basis of disability (62%). The second largest share of complaints cited was racial discrimination (21%), followed by “Other” bases (10%), and national origin (7%). The majority of complaints were filed against respondents in Sacramento County (53 complaints). El Dorado and Sutter County had the least number of complaints (3 each).
S t a t e o f C a l i f o r n i a A n a l y s i s o f I m p e d i m e n t s P a g e | 6 - 8
San Joaquin Valley: There were 90 complaints filed in the San Joaquin Valley region. The majority citing disability discrimination (56%), followed by race (26%), “other” (12%), and national origin (7%). There was little variation from this trend for counties in the region. The majority of complaints were filed against respondents in Stanislaus County (26) whereas Madera County saw the least number of complaints (2). San Diego Area: There were 72 complaints against respondents in the San Diego Area. The majority of complaints were filed on the basis of disability discrimination (65%), followed by race (24%), “other” ” bases (7%), and national origin (7%). Central Coast: Of the 66 complaints filed in the Central Coast region, 76% cited disability discrimination. The second largest category of complaints were filed on the basis of race (12%), followed by national origin (9%) and “other” (3%). The majority of disability complaints were filed in Santa Cruz County (16%). Santa Barbara County had the greatest number of total complaints (21). Northern California: There were 37 complaints filed against Northern Californian respondents, the majority on the basis of disability discrimination (70%), followed by race (16) and “other” (14%). No complaints were filed on the basis of national origin. No complaints were filed for 7 of the 16 counties in the region: Tehama, Lassen, Nevada, Modoc, Plumas, Sierra, and Trinity. Central Southern California: Only two complaints were filed against respondents in the Central Southern California region – one in Tuolumne and one in Mariposa County. Both complaints were on the basis of disability discrimination. No complaints were filed in five of the seven counties in the region: Inyo, Alpine, Amador, Calaveras, and Mono.
Complaint Resolutions by Agency This section of the report examines housing complaint outcomes. A longitudinal approach, or examining the length of time it takes for cases to close, was not possible because complaints could have been filed or closed at times beyond FY 2005/2006 to 2009/2010. The analysis is limited to four general closure types across DFEH and HUD databases: administrative, merit, settlement, and no merit closures. DFEH Complaint Resolutions The DFEH classifies housing discrimination case closures into over 32 categories. For the purpose of this analysis, the cases were further aggregated into four general categories: Administrative Closures: this category includes cases closed for reasons
unconnected to a merit determination (i.e., complainant not available, no DFEH jurisdiction).
S t a t e o f C a l i f o r n i a A n a l y s i s o f I m p e d i m e n t s P a g e | 6 - 9
Merit Closures: cases closed after a merit determination is been made by DFEH
Enforcement Division. These closures include cases in which an accusation was issued but the case closed before a hearing/trial was held. This category also includes cases in which a final determination was made by the California Fair Employment and Housing Commission (FEHC) or a court.
Settlement Closures: this category includes cases closed because a resolution was
reached prior to a determination on the merits (i.e., mediation). No Merit Closures: cases closed because an investigation found insufficient
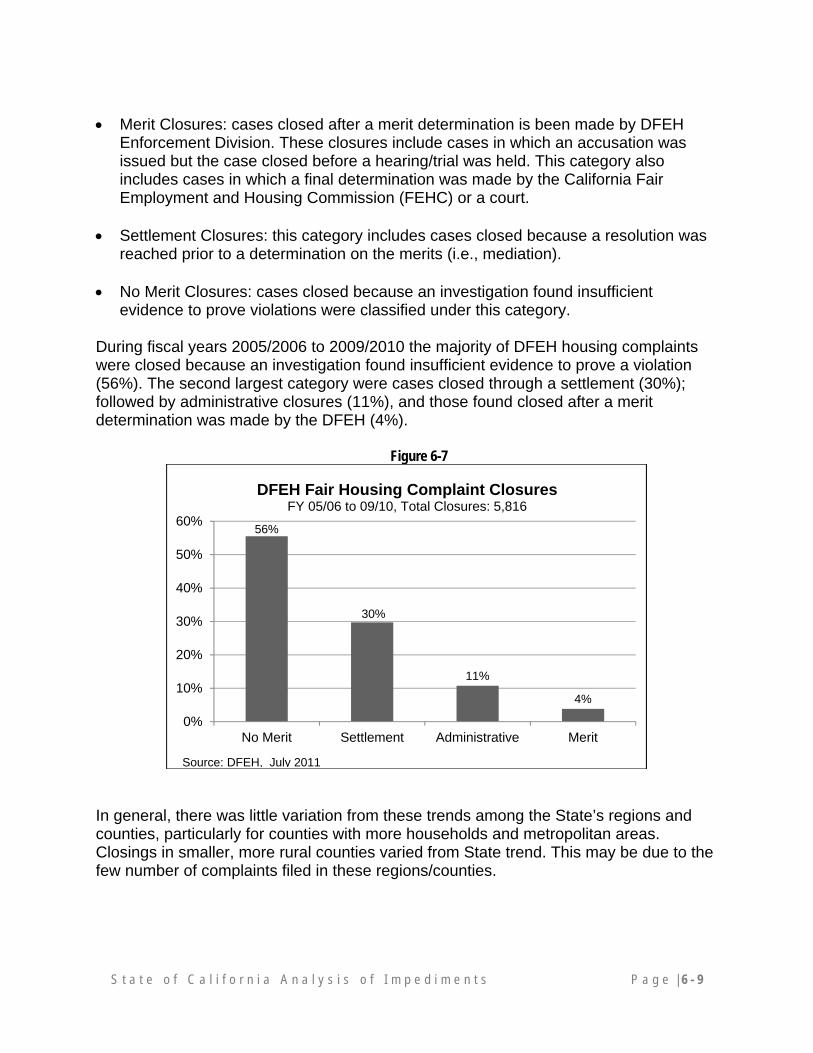
evidence to prove violations were classified under this category. During fiscal years 2005/2006 to 2009/2010 the majority of DFEH housing complaints were closed because an investigation found insufficient evidence to prove a violation (56%). The second largest category were cases closed through a settlement (30%); followed by administrative closures (11%), and those found closed after a merit determination was made by the DFEH (4%).
Figure 6-7
In general, there was little variation from these trends among the State’s regions and counties, particularly for counties with more households and metropolitan areas. Closings in smaller, more rural counties varied from State trend. This may be due to the few number of complaints filed in these regions/counties.
56%
30%
11%
4%
0%
10%
20%
30%
40%
50%
60%
No Merit Settlement Administrative Merit
DFEH Fair Housing Complaint Closures FY 05/06 to 09/10, Total Closures: 5,816
Source: DFEH, July 2011
S t a t e o f C a l i f o r n i a A n a l y s i s o f I m p e d i m e n t s P a g e | 6 - 10
Table 6-8 DFEH Complaint Closures, FY 2005/06 to 2009/10
Complaint Closures Share of Area Total
Total Admin. Merit Settle. No Merit Admin. Merit Settle. No Merit
Greater Los Angeles Area 2,737 286 95 728 1,625 10% 3% 27% 59%
San Francisco Bay Area 1,339 168 71 468 631 13% 5% 35% 47%
Sacramento 295 29 9 83 172 10% 3% 28% 58%
San Joaquin Valley 347 37 10 117 182 11% 3% 34% 52%
San Diego County/MSA 387 32 8 97 250 8% 2% 25% 65%
Central Coast 168 14 2 53 99 8% 1% 32% 59%
Northern California 152 19 3 52 77 13% 2% 34% 51%
Central Southern California 20 4 0 10 6 20% 50% 30%
California 5,619 601 222 1,664 3,124 11% 4% 30% 56%Source: DFEH
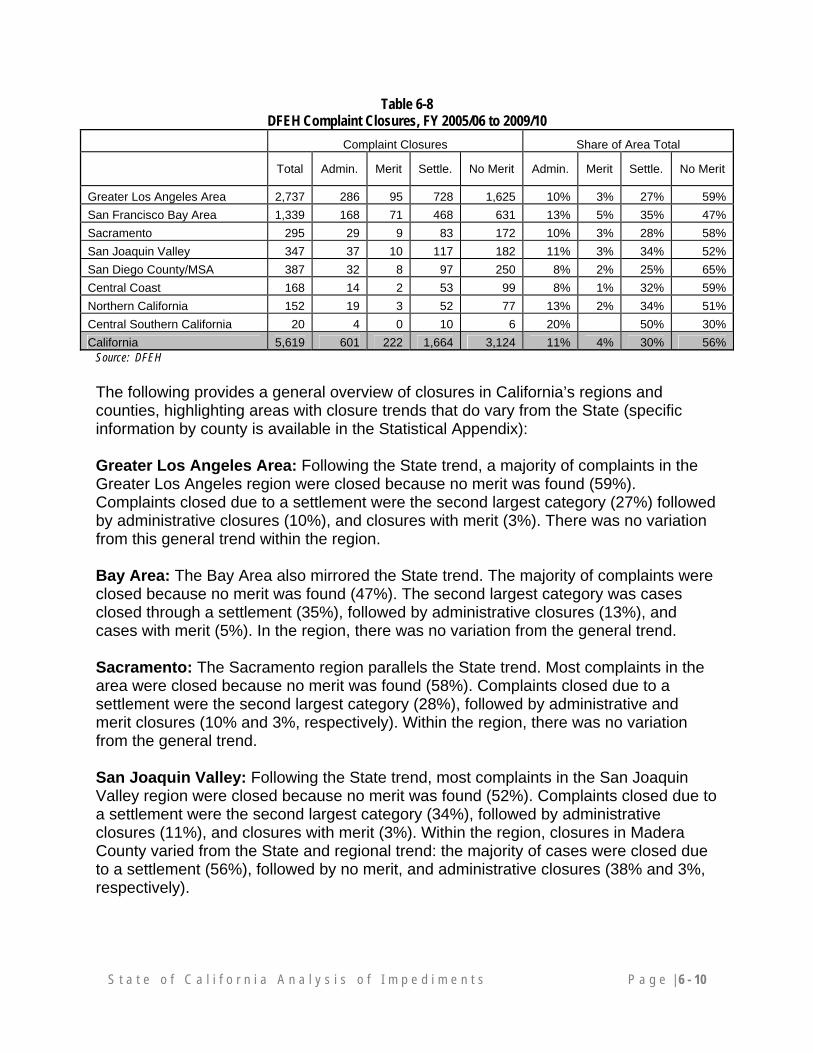
The following provides a general overview of closures in California’s regions and counties, highlighting areas with closure trends that do vary from the State (specific information by county is available in the Statistical Appendix): Greater Los Angeles Area: Following the State trend, a majority of complaints in the Greater Los Angeles region were closed because no merit was found (59%). Complaints closed due to a settlement were the second largest category (27%) followed by administrative closures (10%), and closures with merit (3%). There was no variation from this general trend within the region. Bay Area: The Bay Area also mirrored the State trend. The majority of complaints were closed because no merit was found (47%). The second largest category was cases closed through a settlement (35%), followed by administrative closures (13%), and cases with merit (5%). In the region, there was no variation from the general trend. Sacramento: The Sacramento region parallels the State trend. Most complaints in the area were closed because no merit was found (58%). Complaints closed due to a settlement were the second largest category (28%), followed by administrative and merit closures (10% and 3%, respectively). Within the region, there was no variation from the general trend. San Joaquin Valley: Following the State trend, most complaints in the San Joaquin Valley region were closed because no merit was found (52%). Complaints closed due to a settlement were the second largest category (34%), followed by administrative closures (11%), and closures with merit (3%). Within the region, closures in Madera County varied from the State and regional trend: the majority of cases were closed due to a settlement (56%), followed by no merit, and administrative closures (38% and 3%, respectively).
S t a t e o f C a l i f o r n i a A n a l y s i s o f I m p e d i m e n t s P a g e | 6 - 11
San Diego: Case closures in the San Diego County paralleled the State trend. The majority of closures were found to have no merit (65%), followed by settlements (25%), administrative closures (8%), and cases found to have merit (2%). Central Coast: The majority of closures were found to have no merit (59%), followed by settlements (32%), administrative closures (8%), and cases found to have merit (2%). Within the county there was little variation from this general trend. Monterey County had an equal number of administrative and merit closures (4% or 2 cases each). Northern California: Although only 152 cases were closed in the region, the Northern California region as a whole followed the State trend. Most cases were closed because no merit was found (51%). The second largest category was settlement closures (34%) followed by administrative and merit closures (13% and 2%, respectively). Within the region’s counties, few cases closed because a merit determination was made. No closures were reported for Modoc, Plumas, Sierra or Trinity counties. Central Southern California: Only 20 cases were closed in the Central Southern California region. Unlike the State trend, the majority closures in this region were due to a settlement (50%). The second largest category was no merit closures (30%), followed by administrative closures (20%). No cases were determined to have merit. No closures were reported in Alpine and Mono counties. HUD Complaint Closures The 20 closing categories provided by HUD were aggregated into four general categories to parallel DFEH categories as best as possible. However, the categories between the DFEH and HUD are not fully comparable. The following provide details on the closure categories for HUD housing cases used in this analysis: Administrative closures include the following cases: untimely filed, dismissal for lack
of jurisdiction, unable to locate complainant, complainant failed to cooperate, unable to identify respondent, and complaint withdrawn by complainant without resolution.
Merit-based closures include: election made to go to court, a HUD Administrative
Law Judge (ALJ) consent order entered after issuance of charge, and Department of Justice (DOJ) dismissal.
Settlement closures include conciliation; settlement successful and complaint
withdrawn by complainant after resolution. No merit closure includes those cases coded as no cause determination.
S t a t e o f C a l i f o r n i a A n a l y s i s o f I m p e d i m e n t s P a g e | 6 - 12
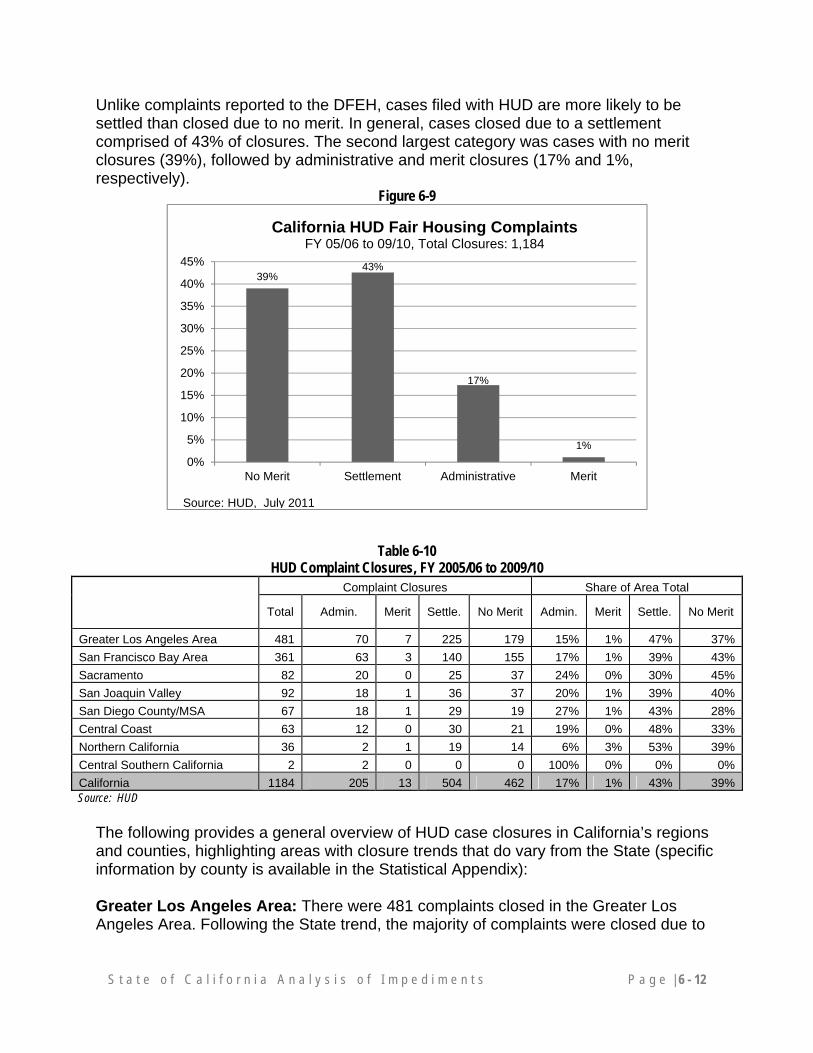
Unlike complaints reported to the DFEH, cases filed with HUD are more likely to be settled than closed due to no merit. In general, cases closed due to a settlement comprised of 43% of closures. The second largest category was cases with no merit closures (39%), followed by administrative and merit closures (17% and 1%, respectively).
Figure 6-9
Table 6-10 HUD Complaint Closures, FY 2005/06 to 2009/10
Complaint Closures Share of Area Total
Total Admin. Merit Settle. No Merit Admin. Merit Settle. No Merit
Greater Los Angeles Area 481 70 7 225 179 15% 1% 47% 37%
San Francisco Bay Area 361 63 3 140 155 17% 1% 39% 43%
Sacramento 82 20 0 25 37 24% 0% 30% 45%
San Joaquin Valley 92 18 1 36 37 20% 1% 39% 40%
San Diego County/MSA 67 18 1 29 19 27% 1% 43% 28%
Central Coast 63 12 0 30 21 19% 0% 48% 33%
Northern California 36 2 1 19 14 6% 3% 53% 39%
Central Southern California 2 2 0 0 0 100% 0% 0% 0%
California 1184 205 13 504 462 17% 1% 43% 39%Source: HUD
The following provides a general overview of HUD case closures in California’s regions and counties, highlighting areas with closure trends that do vary from the State (specific information by county is available in the Statistical Appendix): Greater Los Angeles Area: There were 481 complaints closed in the Greater Los Angeles Area. Following the State trend, the majority of complaints were closed due to
39%43%
17%
1%
0%
5%
10%
15%
20%
25%
30%
35%
40%
45%
No Merit Settlement Administrative Merit
California HUD Fair Housing ComplaintsFY 05/06 to 09/10, Total Closures: 1,184
Source: HUD, July 2011
S t a t e o f C a l i f o r n i a A n a l y s i s o f I m p e d i m e n t s P a g e | 6 - 13
a settlement (47%), followed by those found to have no merit (37%), administrative and merit closures (15% and 1%, respectively). Aside from Ventura County, other counties did not vary from this general trend. In Ventura, the second largest category of closures was administrative (33%). Bay Area: There were 361 complaints closed in the San Francisco Bay Area. The majority of closures in this area were because no merit was found (43%), followed by settled cases (39%), administrative and merit closures (17% and 1%, respectively). Larger areas in the region tend to follow this trend. Smaller counties tend to have more settled closures than no merit closures. For example, of the 52 cases closed in Santa Clara, 46% (24 cases) were settled cases. Sacramento: Of the 82 closures in the Sacramento region, the majority were found to have no merit (45%). The second largest category were settled closures (30%) followed by administrative closures (24%). No cases were closed due to merit. San Joaquin Valley: With 92 closures in the San Joaquin Valley, the region did not follow the State’s trends: the majority of cases were closed because no merit was found (40%). The second largest category was settled cases (39%), followed by administrative and merit closures (20% and 1%, respectively). Only one case in the region was found to have merit. San Diego: The San Diego County area followed the State closure trend. The majority of cases were settled (43%), followed by no merit closures (28%), administrative (27%) and merit closures (1%). Central Coast: Following the State trend, the majority of cases closed in the Central Coast area were settled (48%). The second largest category of closures was cases with no merit (33%), followed by administrative closures (19%). No cases were found to have merit. Within the region, Santa Cruz is the only county to deviate from the regional trend. The majority of cases in Santa Cruz were found to have no merit (53%), followed by settled or administratively closed cases (24%). Northern California: Closures in the Northern California region followed the State trend. There were 36 cases closed, the majority due to a settlement (53%). The second largest category of closures was cases with no merit (39%), followed by administrative closures (6%) and merit closures (3%). No closures were reported for eight of the sixteen counties in the area: Tehama, Lassen, Nevada, Colusa, Modoc, Plumas, Sierra, and Trinity. Central Southern California: Two cases were closed in the Central Southern California region, both were administrative closures. Cases were filed against respondents in Tuolumne and Mariposa counties.
S t a t e o f C a l i f o r n i a A n a l y s i s o f I m p e d i m e n t s P a g e | 6 - 14
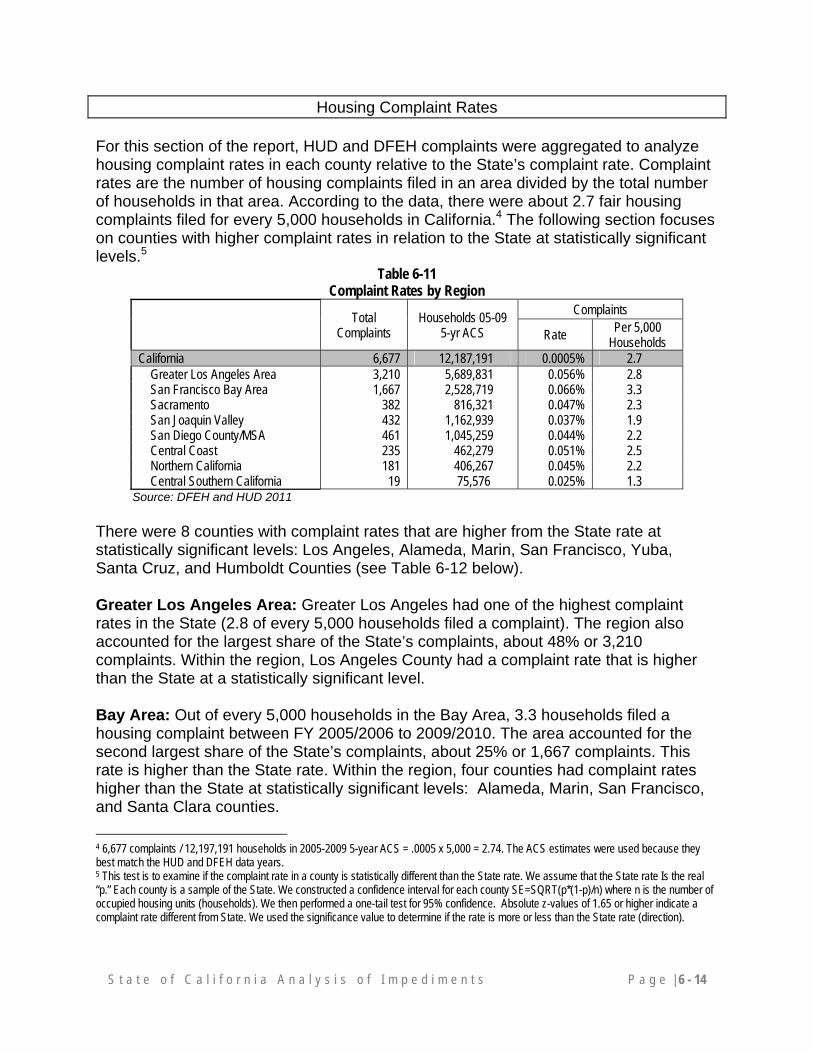
Housing Complaint Rates For this section of the report, HUD and DFEH complaints were aggregated to analyze housing complaint rates in each county relative to the State’s complaint rate. Complaint rates are the number of housing complaints filed in an area divided by the total number of households in that area. According to the data, there were about 2.7 fair housing complaints filed for every 5,000 households in California.4 The following section focuses on counties with higher complaint rates in relation to the State at statistically significant levels.5
Table 6-11 Complaint Rates by Region
Total Complaints
Households 05-09 5-yr ACS
Complaints
Rate Per 5,000
Households California 6,677 12,187,191 0.0005% 2.7 Greater Los Angeles Area 3,210 5,689,831 0.056% 2.8 San Francisco Bay Area 1,667 2,528,719 0.066% 3.3 Sacramento 382 816,321 0.047% 2.3 San Joaquin Valley 432 1,162,939 0.037% 1.9 San Diego County/MSA 461 1,045,259 0.044% 2.2 Central Coast 235 462,279 0.051% 2.5 Northern California 181 406,267 0.045% 2.2 Central Southern California 19 75,576 0.025% 1.3
Source: DFEH and HUD 2011 There were 8 counties with complaint rates that are higher from the State rate at statistically significant levels: Los Angeles, Alameda, Marin, San Francisco, Yuba, Santa Cruz, and Humboldt Counties (see Table 6-12 below). Greater Los Angeles Area: Greater Los Angeles had one of the highest complaint rates in the State (2.8 of every 5,000 households filed a complaint). The region also accounted for the largest share of the State’s complaints, about 48% or 3,210 complaints. Within the region, Los Angeles County had a complaint rate that is higher than the State at a statistically significant level. Bay Area: Out of every 5,000 households in the Bay Area, 3.3 households filed a housing complaint between FY 2005/2006 to 2009/2010. The area accounted for the second largest share of the State’s complaints, about 25% or 1,667 complaints. This rate is higher than the State rate. Within the region, four counties had complaint rates higher than the State at statistically significant levels: Alameda, Marin, San Francisco, and Santa Clara counties.
4 6,677 complaints / 12,197,191 households in 2005-2009 5-year ACS = .0005 x 5,000 = 2.74. The ACS estimates were used because they best match the HUD and DFEH data years. 5 This test is to examine if the complaint rate in a county is statistically different than the State rate. We assume that the State rate Is the real “p.” Each county is a sample of the State. We constructed a confidence interval for each county SE=SQRT(p*(1-p)/n) where n is the number of occupied housing units (households). We then performed a one-tail test for 95% confidence. Absolute z-values of 1.65 or higher indicate a complaint rate different from State. We used the significance value to determine if the rate is more or less than the State rate (direction).
S t a t e o f C a l i f o r n i a A n a l y s i s o f I m p e d i m e n t s P a g e | 6 - 15
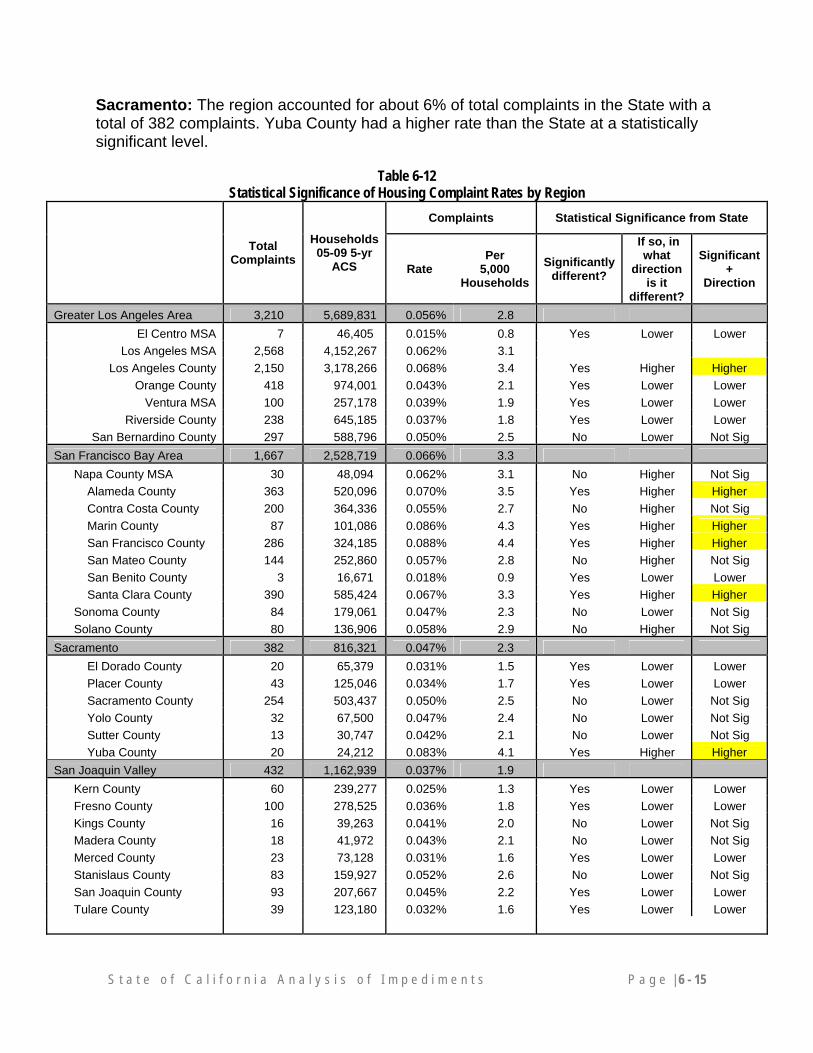
Sacramento: The region accounted for about 6% of total complaints in the State with a total of 382 complaints. Yuba County had a higher rate than the State at a statistically significant level.
Table 6-12 Statistical Significance of Housing Complaint Rates by Region
Total Complaints
Households 05-09 5-yr
ACS
Complaints Statistical Significance from State
Rate Per
5,000 Households
Significantly different?
If so, in what
direction is it
different?
Significant +
Direction
Greater Los Angeles Area 3,210 5,689,831 0.056% 2.8
El Centro MSA 7 46,405 0.015% 0.8 Yes Lower Lower
Los Angeles MSA 2,568 4,152,267 0.062% 3.1
Los Angeles County 2,150 3,178,266 0.068% 3.4 Yes Higher Higher
Orange County 418 974,001 0.043% 2.1 Yes Lower Lower
Ventura MSA 100 257,178 0.039% 1.9 Yes Lower Lower
Riverside County 238 645,185 0.037% 1.8 Yes Lower Lower
San Bernardino County 297 588,796 0.050% 2.5 No Lower Not Sig
San Francisco Bay Area 1,667 2,528,719 0.066% 3.3
Napa County MSA 30 48,094 0.062% 3.1 No Higher Not Sig
Alameda County 363 520,096 0.070% 3.5 Yes Higher Higher
Contra Costa County 200 364,336 0.055% 2.7 No Higher Not Sig
Marin County 87 101,086 0.086% 4.3 Yes Higher Higher
San Francisco County 286 324,185 0.088% 4.4 Yes Higher Higher
San Mateo County 144 252,860 0.057% 2.8 No Higher Not Sig
San Benito County 3 16,671 0.018% 0.9 Yes Lower Lower
Santa Clara County 390 585,424 0.067% 3.3 Yes Higher Higher
Sonoma County 84 179,061 0.047% 2.3 No Lower Not Sig
Solano County 80 136,906 0.058% 2.9 No Higher Not Sig
Sacramento 382 816,321 0.047% 2.3
El Dorado County 20 65,379 0.031% 1.5 Yes Lower Lower
Placer County 43 125,046 0.034% 1.7 Yes Lower Lower
Sacramento County 254 503,437 0.050% 2.5 No Lower Not Sig
Yolo County 32 67,500 0.047% 2.4 No Lower Not Sig
Sutter County 13 30,747 0.042% 2.1 No Lower Not Sig
Yuba County 20 24,212 0.083% 4.1 Yes Higher Higher
San Joaquin Valley 432 1,162,939 0.037% 1.9
Kern County 60 239,277 0.025% 1.3 Yes Lower Lower
Fresno County 100 278,525 0.036% 1.8 Yes Lower Lower
Kings County 16 39,263 0.041% 2.0 No Lower Not Sig
Madera County 18 41,972 0.043% 2.1 No Lower Not Sig
Merced County 23 73,128 0.031% 1.6 Yes Lower Lower
Stanislaus County 83 159,927 0.052% 2.6 No Lower Not Sig
San Joaquin County 93 207,667 0.045% 2.2 Yes Lower Lower
Tulare County 39 123,180 0.032% 1.6 Yes Lower Lower
S t a t e o f C a l i f o r n i a A n a l y s i s o f I m p e d i m e n t s P a g e | 6 - 16
Total Complaints
Households05-09 5-yr
ACS Complaints Statistical Significance from State
Rate
Per 5,000
Households Significantly
different?
If so,in what
direction is it
different?
Significant +
Direction
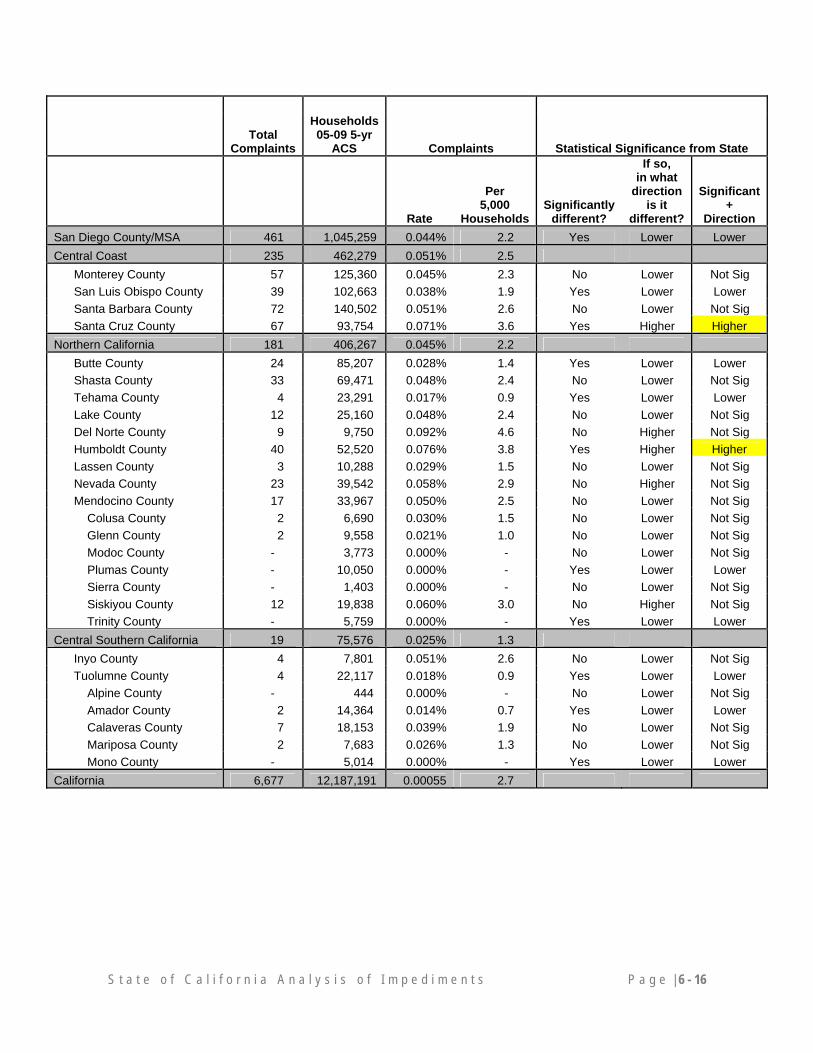
San Diego County/MSA 461 1,045,259 0.044% 2.2 Yes Lower Lower
Central Coast 235 462,279 0.051% 2.5
Monterey County 57 125,360 0.045% 2.3 No Lower Not Sig
San Luis Obispo County 39 102,663 0.038% 1.9 Yes Lower Lower
Santa Barbara County 72 140,502 0.051% 2.6 No Lower Not Sig
Santa Cruz County 67 93,754 0.071% 3.6 Yes Higher Higher
Northern California 181 406,267 0.045% 2.2
Butte County 24 85,207 0.028% 1.4 Yes Lower Lower
Shasta County 33 69,471 0.048% 2.4 No Lower Not Sig
Tehama County 4 23,291 0.017% 0.9 Yes Lower Lower
Lake County 12 25,160 0.048% 2.4 No Lower Not Sig
Del Norte County 9 9,750 0.092% 4.6 No Higher Not Sig
Humboldt County 40 52,520 0.076% 3.8 Yes Higher Higher
Lassen County 3 10,288 0.029% 1.5 No Lower Not Sig
Nevada County 23 39,542 0.058% 2.9 No Higher Not Sig
Mendocino County 17 33,967 0.050% 2.5 No Lower Not Sig
Colusa County 2 6,690 0.030% 1.5 No Lower Not Sig
Glenn County 2 9,558 0.021% 1.0 No Lower Not Sig
Modoc County - 3,773 0.000% - No Lower Not Sig
Plumas County - 10,050 0.000% - Yes Lower Lower
Sierra County - 1,403 0.000% - No Lower Not Sig
Siskiyou County 12 19,838 0.060% 3.0 No Higher Not Sig
Trinity County - 5,759 0.000% - Yes Lower Lower
Central Southern California 19 75,576 0.025% 1.3
Inyo County 4 7,801 0.051% 2.6 No Lower Not Sig
Tuolumne County 4 22,117 0.018% 0.9 Yes Lower Lower
Alpine County - 444 0.000% - No Lower Not Sig
Amador County 2 14,364 0.014% 0.7 Yes Lower Lower
Calaveras County 7 18,153 0.039% 1.9 No Lower Not Sig
Mariposa County 2 7,683 0.026% 1.3 No Lower Not Sig
Mono County - 5,014 0.000% - Yes Lower Lower
California 6,677 12,187,191 0.00055 2.7
S t a t e o f C a l i f o r n i a A n a l y s i s o f I m p e d i m e n t s P a g e | 6 - 17
San Joaquin Valley: In the San Joaquin Valley region, 1.9 complaints were filed per 5,000 households. A total of 432 complaints were filed in the region or about 6% of the State’s total. Within the region, no counties had rates higher than the Statewide rate at statistically significant levels. San Diego: San Diego County/MSA had 2.2 complaints per 5,000 households, a rate slightly lower than Statewide. A total of 461 complaints were filed in the region or 7% of all complaints filed in the State. The rate for the county is lower relative to the State rate at a statistically significant level. Central Coast: The Central Coast region had a complaint rate of 2.5 per 5,000 households, a rate slightly lower than California as a while. A total of 235 complaints were filed in the region, 67 of these were filed in Santa Cruz (about 29%).Of the four counties within the region, only Santa Cruz County had a rate higher than the State at a statistically significant level. Northern California: The Northern California region had a 2.2 per 5,000 household complaint rate, which is low relative to the State rate. Of the total 181 complaints filed in the region, 40 complaints were filed Humboldt (about 22%). Of the 16 counties in the region, only Humboldt County had a rate higher than the State’s rate at a statistically significant level. Central Southern California: The Central Southern California region had a rate of 1.3 fair housing complaints per 5,000 households. With only 19 complaints filed in the region, the area accounted for the smallest share of complaints in the State (3%). Within the region, no county had higher a complaint rate than California at a statistically significant level.
Presence and Role of Fair Housing Education and Enforcement Organizations There are potential problems with looking solely at the number of fair housing complaints filed within a given community as that a number cannot by itself be used to ascertain if there is a fair housing problem in that community. For example, a community with a relatively high number of complaints could be a reflection of an effective public education program that has successfully informed residents about their fair housing rights, and how to exercise them. Or, it could mean that there is a problem with discrimination, especially if the complaints are filed on the same basis (e.g., race, disability, national origin, etc.). Conversely, a community with a relatively low number of complaints (or zero complaints) may mean that there is no problem with discrimination there or it could mean residents don’t know of their fair housing rights, and/or there is no private fair housing agency there to help them exercise those rights.
S t a t e o f C a l i f o r n i a A n a l y s i s o f I m p e d i m e n t s P a g e | 6 - 18
Education is believed to be one of the most important tools in ensuring that fair housing opportunities are provided and therefore, is one of the most important components of fair housing services. Education gives residents the knowledge to understand their rights and responsibilities, to recognize discrimination, and to locate resources if they need to file a complaint or need general assistance. California has a wide network of organizations engaged in fair housing education and enforcement activities. Some of these organizations may not list fair housing enforcement as its sole activity but would have some knowledge of FH rights, and would know how to help refer clients to HUD or DFEH if the issue was beyond their given scope of authority. Many of these organizations are recipients of funding through HUD’s Fair Housing Initiatives Program (FHIP) and Fair Housing Assistance Program (FHAP) to address housing discrimination. A FHIP-eligible entity is often a non-profit, local community based agency providing contractual fair housing services to cities and assisting them in meeting AFFH obligations. Three FHIP initiatives provide competitive grants to eligible organizations: The Fair Housing Organizations Initiative (FHOI) provides funding that builds the
capacity and effectiveness of non-profit fair housing organizations by providing funds to handle fair housing enforcement and education initiatives more effectively.
The Private Enforcement Initiative (PEI) offers a range of assistance to the nationwide network of fair housing groups. This initiative funds non-profit fair housing organizations to carry out testing and enforcement activities to prevent or eliminate discriminatory housing practices.
The Education and Outreach Initiative (EOI) offers a comprehensive range of support for fair housing activities, providing funding to State and local government agencies and non-profit organizations for initiatives that explain to the general public and housing providers what equal opportunity in housing means and what housing providers need to do to comply with the Fair Housing Act.
In addition to FHIP or FHAP funding, many organizations receive CDBG or other types of local funds from the communities they serve to provide specified services to the public. According to HUD, approximately 180 fair housing referral agencies operate within California. These include private fair housing agencies including FHIP recipients as well as agencies that exist primarily to provide tenant-landlord information and counseling, or provide other forms of advocacy such as the Center for Independent Living for persons with disabilities, or an agency providing resources for seniors or families with children.
S t a t e o f C a l i f o r n i a A n a l y s i s o f I m p e d i m e n t s P a g e | 6 - 19
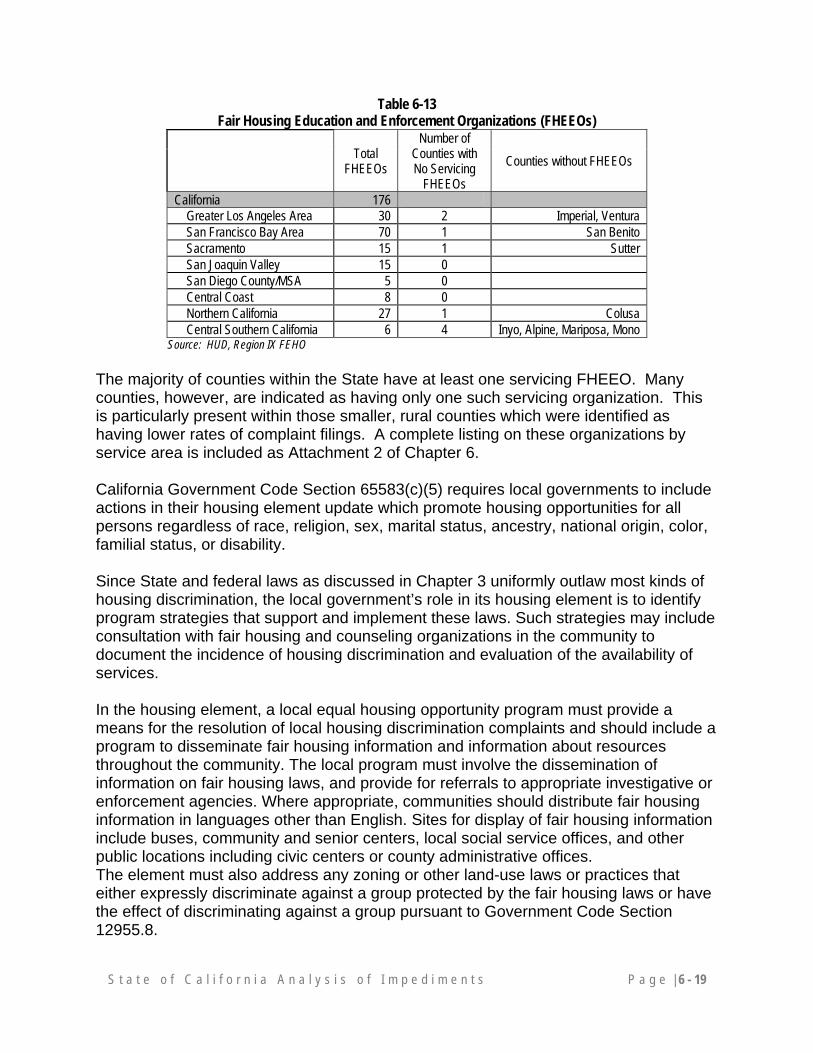
Table 6-13 Fair Housing Education and Enforcement Organizations (FHEEOs)
Total
FHEEOs
Number of Counties with No Servicing
FHEEOs
Counties without FHEEOs
California 176 Greater Los Angeles Area 30 2 Imperial, Ventura San Francisco Bay Area 70 1 San Benito Sacramento 15 1 Sutter San Joaquin Valley 15 0 San Diego County/MSA 5 0 Central Coast 8 0 Northern California 27 1 Colusa Central Southern California 6 4 Inyo, Alpine, Mariposa, Mono
Source: HUD, Region IX FEHO
The majority of counties within the State have at least one servicing FHEEO. Many counties, however, are indicated as having only one such servicing organization. This is particularly present within those smaller, rural counties which were identified as having lower rates of complaint filings. A complete listing on these organizations by service area is included as Attachment 2 of Chapter 6. California Government Code Section 65583(c)(5) requires local governments to include actions in their housing element update which promote housing opportunities for all persons regardless of race, religion, sex, marital status, ancestry, national origin, color, familial status, or disability. Since State and federal laws as discussed in Chapter 3 uniformly outlaw most kinds of housing discrimination, the local government’s role in its housing element is to identify program strategies that support and implement these laws. Such strategies may include consultation with fair housing and counseling organizations in the community to document the incidence of housing discrimination and evaluation of the availability of services. In the housing element, a local equal housing opportunity program must provide a means for the resolution of local housing discrimination complaints and should include a program to disseminate fair housing information and information about resources throughout the community. The local program must involve the dissemination of information on fair housing laws, and provide for referrals to appropriate investigative or enforcement agencies. Where appropriate, communities should distribute fair housing information in languages other than English. Sites for display of fair housing information include buses, community and senior centers, local social service offices, and other public locations including civic centers or county administrative offices. The element must also address any zoning or other land-use laws or practices that either expressly discriminate against a group protected by the fair housing laws or have the effect of discriminating against a group pursuant to Government Code Section 12955.8.
S t a t e o f C a l i f o r n i a A n a l y s i s o f I m p e d i m e n t s P a g e | 6 - 20
If fair housing services are not available or are inadequate within a jurisdiction, the locality could include a program commitment to contract with or create a fair housing council to investigate and resolve discrimination complaints, and advocate specific equal housing opportunity actions before community and business organizations.
Conclusion and Summary Findings The basis for the majority of complaints in California is disability discrimination, followed by discrimination based on race and nationality. It is possible that these trends are the result of the complaint process. For example, to file a complaint, an individual must feel that there is a discriminatory act; they must know that they have a right to file a complaint; they must be willing or able to file a complaint; and they must believe that it would likely payoff to make a complaint. However, there are differences in how disability discrimination and racial discrimination are perceived. Many of the complaints by the disabled may be due to the lack of adequate facilities; housing that has not been adequately adapted to their needs. This is easy to identify and provide evidence of the discrimination. However, racial discrimination is more subtle. It is unknown if there are systematic differences in knowledge between the disabled and racial minorities because many minorities in California are immigrants (Latinos and Asians) and/or speak English as second language. It could be inferred that theses households may not be as knowledgeable about anti-discrimination and fair housing laws or as, perhaps, they are not willing to step forward. One option in the face of racial discrimination is simply finding housing elsewhere, rather than spending the time and energy to file a claim against a landlord. For the disabled, many units are not adequately arranged, so they have fewer housing options and therefore perhaps have a higher incentive to make a claim. In general, trends in larger metropolitan counties and regions vary slightly from the State trend where most cases are closed because no merit was found, followed by administrative closures, settled cases, and cases found to have merit. It is possible that this is a result of better outreach and education in larger metropolitan areas. Lower compliant rates in smaller, more rural areas of the State may be a result of lack of organizations to assist complainants or general lack of knowledge regarding fair housing rights and how to file a complaint. It should be noted, however, that in smaller, more rural areas, while there are fewer cases filed in general, a higher rate of these cases are closed because they were found to have merit. Unlike complaints filed with DFEH, those filed with HUD are more likely to be closed due to a settlement than found without merit. However, as seen with DFEH closures in smaller, more rural areas, very few cases are closed because they were found to have merit. This may be a result of the low number of complaints being filed in these areas or because there is a lack of services to assist complainants as stated above. Additional research needs to be conducted to address these questions.
S t a t e o f C a l i f o r n i a A n a l y s i s o f I m p e d i m e n t s P a g e | 6 - 21
Appendix I Detailed Methodology for Housing Complaint Closures
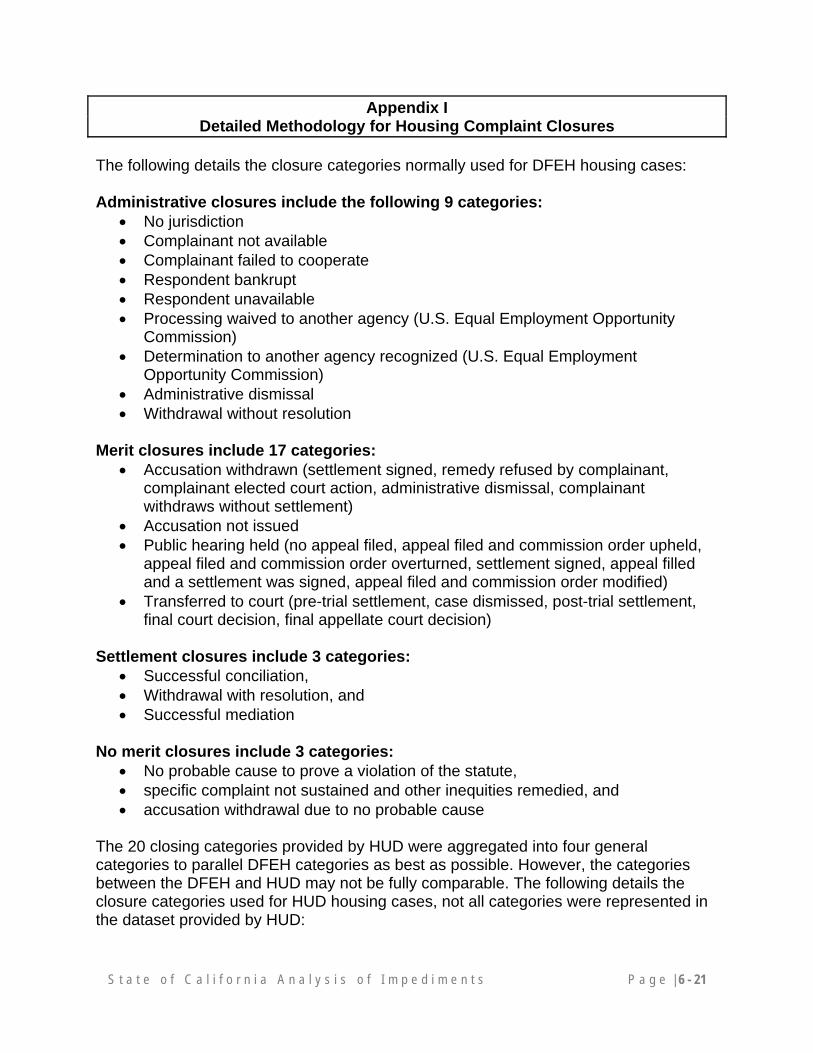
The following details the closure categories normally used for DFEH housing cases: Administrative closures include the following 9 categories:
No jurisdiction Complainant not available Complainant failed to cooperate Respondent bankrupt Respondent unavailable Processing waived to another agency (U.S. Equal Employment Opportunity
Commission) Determination to another agency recognized (U.S. Equal Employment
Opportunity Commission) Administrative dismissal Withdrawal without resolution
Merit closures include 17 categories:
Accusation withdrawn (settlement signed, remedy refused by complainant, complainant elected court action, administrative dismissal, complainant withdraws without settlement)
Accusation not issued Public hearing held (no appeal filed, appeal filed and commission order upheld,
appeal filed and commission order overturned, settlement signed, appeal filled and a settlement was signed, appeal filed and commission order modified)
Transferred to court (pre-trial settlement, case dismissed, post-trial settlement, final court decision, final appellate court decision)
Settlement closures include 3 categories:
Successful conciliation, Withdrawal with resolution, and Successful mediation
No merit closures include 3 categories:
No probable cause to prove a violation of the statute, specific complaint not sustained and other inequities remedied, and accusation withdrawal due to no probable cause
The 20 closing categories provided by HUD were aggregated into four general categories to parallel DFEH categories as best as possible. However, the categories between the DFEH and HUD may not be fully comparable. The following details the closure categories used for HUD housing cases, not all categories were represented in the dataset provided by HUD:
S t a t e o f C a l i f o r n i a A n a l y s i s o f I m p e d i m e n t s P a g e | 6 - 22
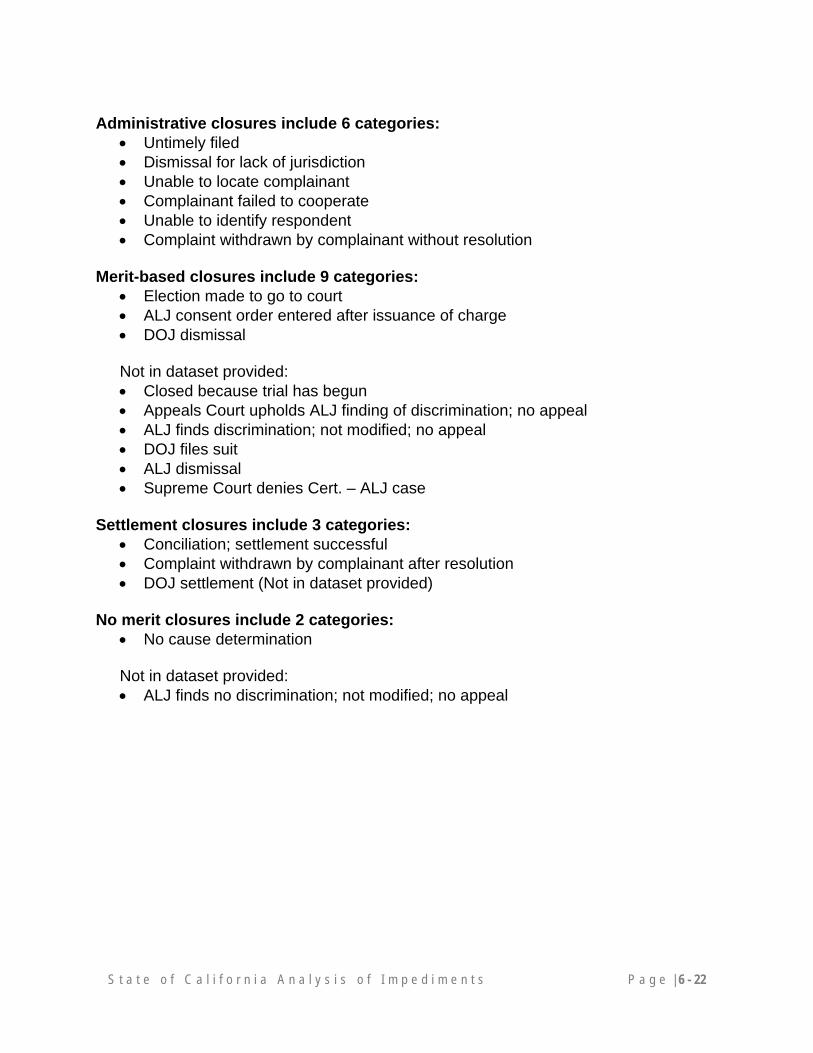
Administrative closures include 6 categories:
Untimely filed Dismissal for lack of jurisdiction Unable to locate complainant Complainant failed to cooperate Unable to identify respondent Complaint withdrawn by complainant without resolution
Merit-based closures include 9 categories:
Election made to go to court ALJ consent order entered after issuance of charge DOJ dismissal
Not in dataset provided: Closed because trial has begun Appeals Court upholds ALJ finding of discrimination; no appeal ALJ finds discrimination; not modified; no appeal DOJ files suit ALJ dismissal Supreme Court denies Cert. – ALJ case
Settlement closures include 3 categories:
Conciliation; settlement successful Complaint withdrawn by complainant after resolution DOJ settlement (Not in dataset provided)
No merit closures include 2 categories:
No cause determination Not in dataset provided: ALJ finds no discrimination; not modified; no appeal
S t a t e o f C a l i f o r n i a A n a l y s i s o f I m p e d i m e n t s P a g e | 6 - 23
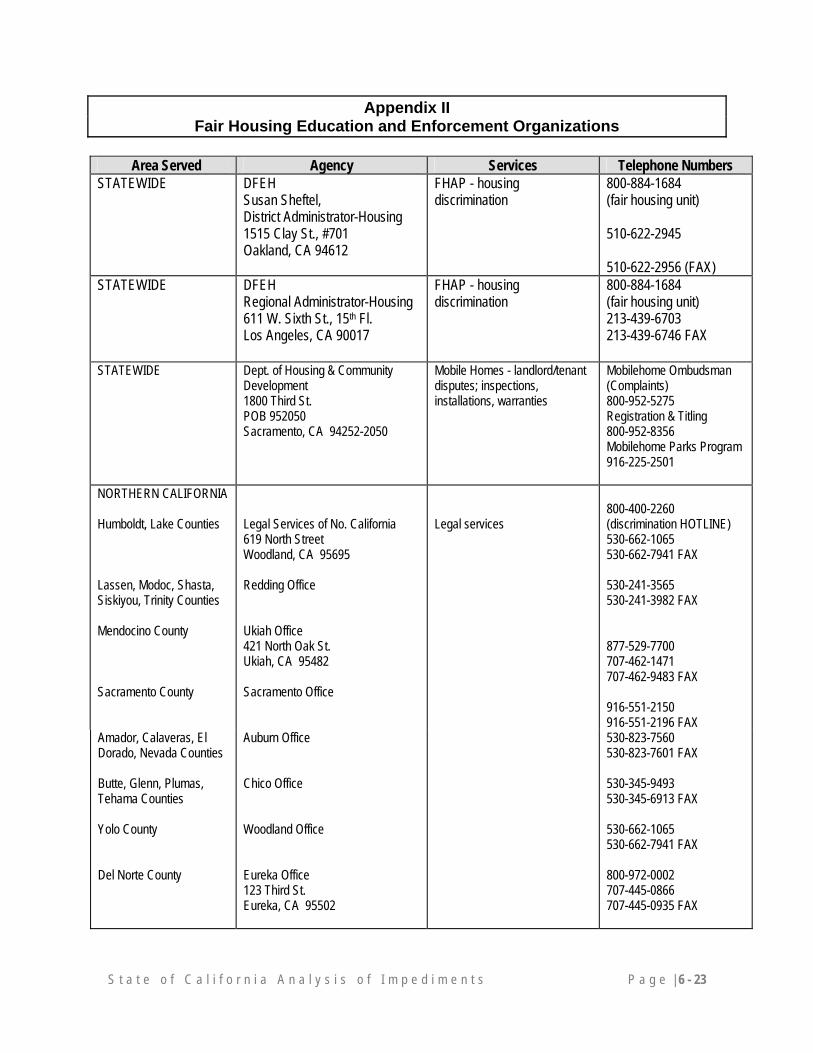
Appendix II Fair Housing Education and Enforcement Organizations
Area Served Agency Services Telephone Numbers
STATEWIDE DFEH Susan Sheftel, District Administrator-Housing 1515 Clay St., #701 Oakland, CA 94612
FHAP - housing discrimination
800-884-1684 (fair housing unit) 510-622-2945 510-622-2956 (FAX)
STATEWIDE DFEH Regional Administrator-Housing 611 W. Sixth St., 15th Fl. Los Angeles, CA 90017
FHAP - housing discrimination
800-884-1684 (fair housing unit) 213-439-6703 213-439-6746 FAX
STATEWIDE Dept. of Housing & Community Development 1800 Third St. POB 952050 Sacramento, CA 94252-2050
Mobile Homes - landlord/tenant disputes; inspections, installations, warranties
Mobilehome Ombudsman (Complaints) 800-952-5275 Registration & Titling 800-952-8356 Mobilehome Parks Program 916-225-2501
NORTHERN CALIFORNIA Humboldt, Lake Counties Lassen, Modoc, Shasta, Siskiyou, Trinity Counties Mendocino County Sacramento County
Legal Services of No. California 619 North Street Woodland, CA 95695 Redding Office Ukiah Office 421 North Oak St. Ukiah, CA 95482 Sacramento Office
Legal services
800-400-2260 (discrimination HOTLINE) 530-662-1065 530-662-7941 FAX 530-241-3565 530-241-3982 FAX 877-529-7700 707-462-1471 707-462-9483 FAX 916-551-2150 916-551-2196 FAX
Amador, Calaveras, El Dorado, Nevada Counties Butte, Glenn, Plumas, Tehama Counties Yolo County Del Norte County
Auburn Office Chico Office Woodland Office Eureka Office 123 Third St. Eureka, CA 95502
530-823-7560 530-823-7601 FAX 530-345-9493 530-345-6913 FAX 530-662-1065 530-662-7941 FAX 800-972-0002 707-445-0866 707-445-0935 FAX
S t a t e o f C a l i f o r n i a A n a l y s i s o f I m p e d i m e n t s P a g e | 6 - 24
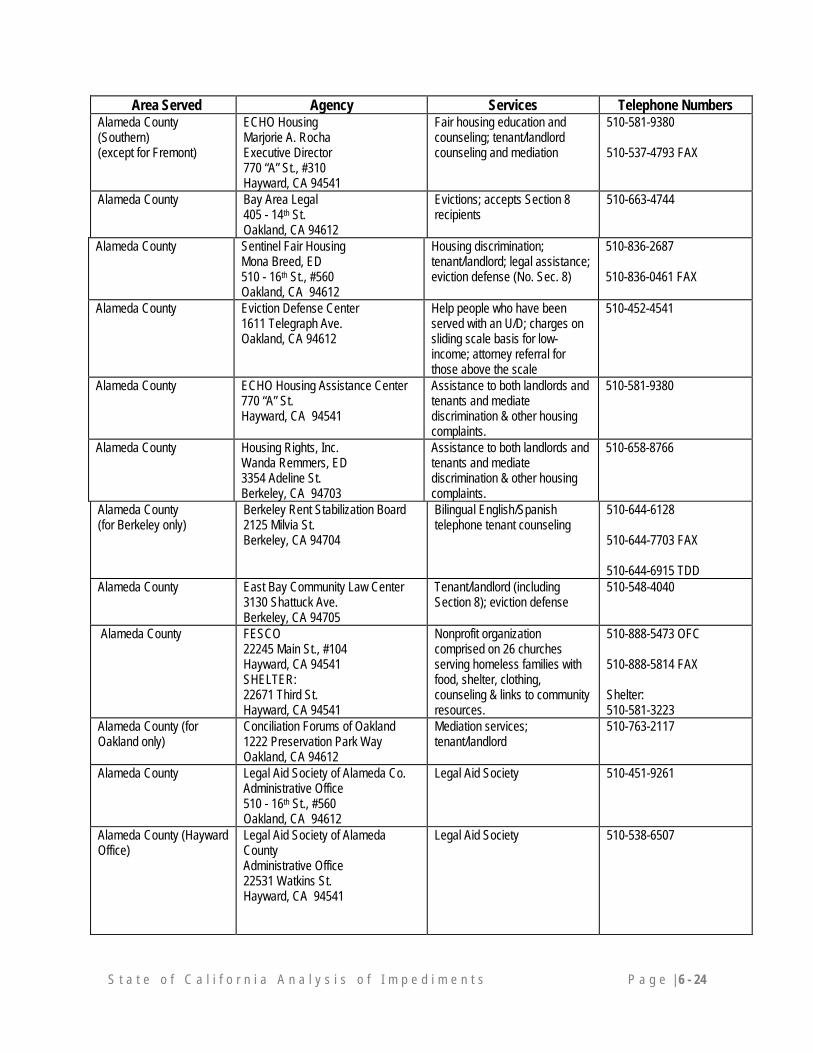
Area Served Agency Services Telephone Numbers Alameda County (Southern) (except for Fremont)
ECHO Housing Marjorie A. Rocha Executive Director 770 “A” St., #310 Hayward, CA 94541
Fair housing education and counseling; tenant/landlord counseling and mediation
510-581-9380 510-537-4793 FAX
Alameda County Bay Area Legal 405 - 14th St. Oakland, CA 94612
Evictions; accepts Section 8 recipients
510-663-4744
Alameda County Sentinel Fair Housing Mona Breed, ED 510 - 16th St., #560 Oakland, CA 94612
Housing discrimination; tenant/landlord; legal assistance; eviction defense (No. Sec. 8)
510-836-2687 510-836-0461 FAX
Alameda County Eviction Defense Center 1611 Telegraph Ave. Oakland, CA 94612
Help people who have been served with an U/D; charges on sliding scale basis for low-income; attorney referral for those above the scale
510-452-4541
Alameda County ECHO Housing Assistance Center 770 “A” St. Hayward, CA 94541
Assistance to both landlords and tenants and mediate discrimination & other housing complaints.
510-581-9380
Alameda County Housing Rights, Inc. Wanda Remmers, ED 3354 Adeline St. Berkeley, CA 94703
Assistance to both landlords and tenants and mediate discrimination & other housing complaints.
510-658-8766
Alameda County (for Berkeley only)
Berkeley Rent Stabilization Board 2125 Milvia St. Berkeley, CA 94704
Bilingual English/Spanish telephone tenant counseling
510-644-6128 510-644-7703 FAX 510-644-6915 TDD
Alameda County East Bay Community Law Center 3130 Shattuck Ave. Berkeley, CA 94705
Tenant/landlord (including Section 8); eviction defense
510-548-4040
Alameda County FESCO 22245 Main St., #104 Hayward, CA 94541 SHELTER: 22671 Third St. Hayward, CA 94541
Nonprofit organization comprised on 26 churches serving homeless families with food, shelter, clothing, counseling & links to community resources.
510-888-5473 OFC 510-888-5814 FAX Shelter: 510-581-3223
Alameda County (for Oakland only)
Conciliation Forums of Oakland 1222 Preservation Park Way Oakland, CA 94612
Mediation services; tenant/landlord
510-763-2117
Alameda County Legal Aid Society of Alameda Co. Administrative Office 510 - 16th St., #560 Oakland, CA 94612
Legal Aid Society 510-451-9261
Alameda County (Hayward Office)
Legal Aid Society of Alameda County Administrative Office 22531 Watkins St. Hayward, CA 94541
Legal Aid Society 510-538-6507
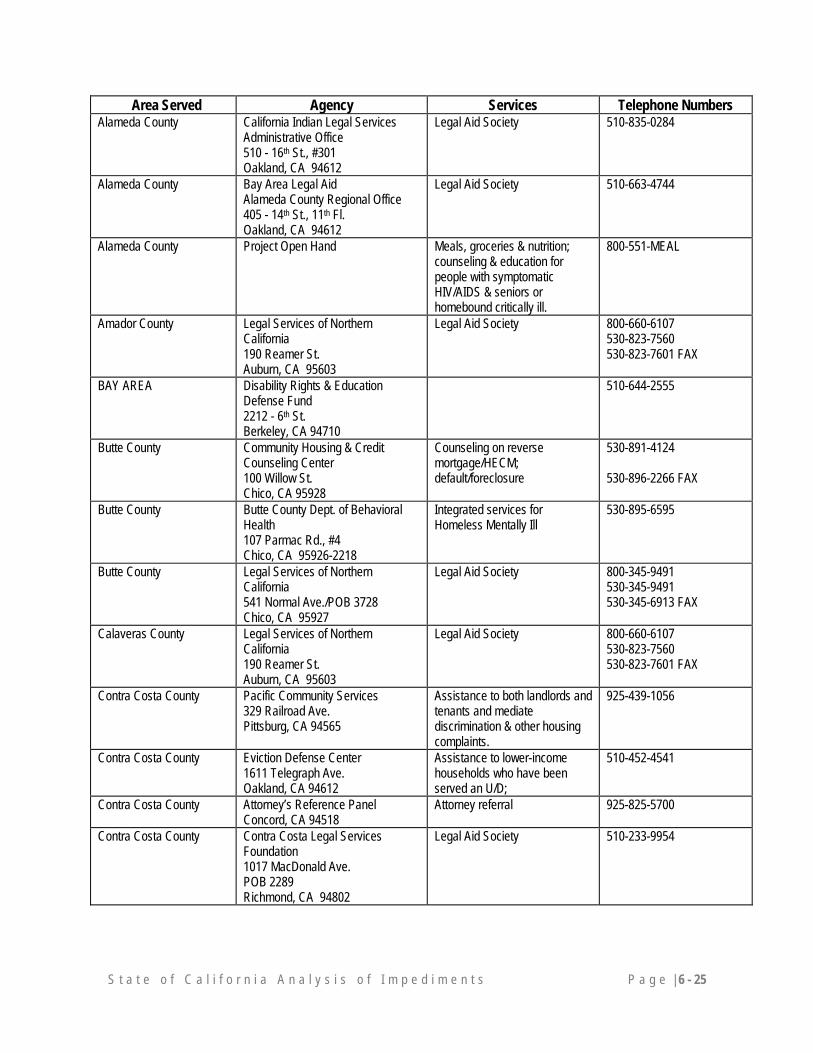
S t a t e o f C a l i f o r n i a A n a l y s i s o f I m p e d i m e n t s P a g e | 6 - 25
Area Served Agency Services Telephone Numbers Alameda County California Indian Legal Services
Administrative Office 510 - 16th St., #301 Oakland, CA 94612
Legal Aid Society 510-835-0284
Alameda County Bay Area Legal Aid Alameda County Regional Office 405 - 14th St., 11th Fl. Oakland, CA 94612
Legal Aid Society 510-663-4744
Alameda County Project Open Hand Meals, groceries & nutrition; counseling & education for people with symptomatic HIV/AIDS & seniors or homebound critically ill.
800-551-MEAL
Amador County Legal Services of Northern California 190 Reamer St. Auburn, CA 95603
Legal Aid Society 800-660-6107 530-823-7560 530-823-7601 FAX
BAY AREA Disability Rights & Education Defense Fund 2212 - 6th St. Berkeley, CA 94710
510-644-2555
Butte County Community Housing & Credit Counseling Center 100 Willow St. Chico, CA 95928
Counseling on reverse mortgage/HECM; default/foreclosure
530-891-4124 530-896-2266 FAX
Butte County Butte County Dept. of Behavioral Health 107 Parmac Rd., #4 Chico, CA 95926-2218
Integrated services for Homeless Mentally Ill
530-895-6595
Butte County Legal Services of Northern California 541 Normal Ave./POB 3728 Chico, CA 95927
Legal Aid Society 800-345-9491 530-345-9491 530-345-6913 FAX
Calaveras County Legal Services of Northern California 190 Reamer St. Auburn, CA 95603
Legal Aid Society 800-660-6107 530-823-7560 530-823-7601 FAX
Contra Costa County Pacific Community Services 329 Railroad Ave. Pittsburg, CA 94565
Assistance to both landlords and tenants and mediate discrimination & other housing complaints.
925-439-1056
Contra Costa County Eviction Defense Center 1611 Telegraph Ave. Oakland, CA 94612
Assistance to lower-income households who have been served an U/D;
510-452-4541
Contra Costa County Attorney’s Reference Panel Concord, CA 94518
Attorney referral 925-825-5700
Contra Costa County Contra Costa Legal Services Foundation 1017 MacDonald Ave. POB 2289 Richmond, CA 94802
Legal Aid Society 510-233-9954
S t a t e o f C a l i f o r n i a A n a l y s i s o f I m p e d i m e n t s P a g e | 6 - 26
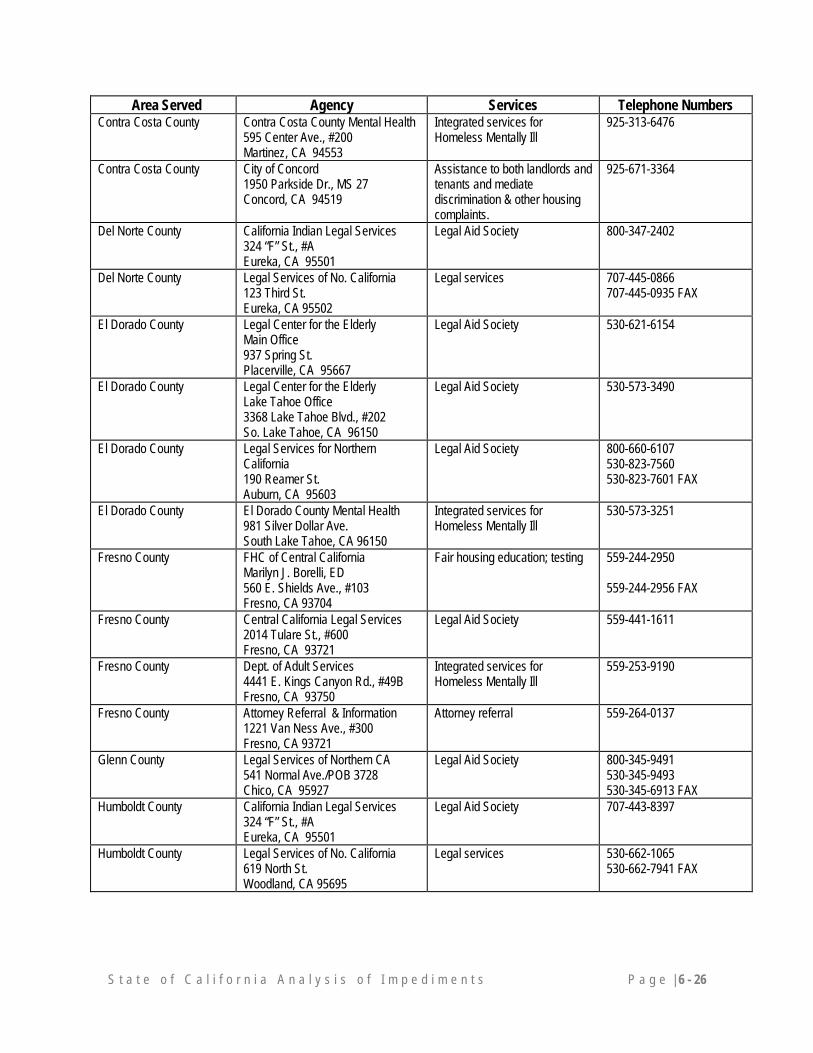
Area Served Agency Services Telephone Numbers Contra Costa County Contra Costa County Mental Health
595 Center Ave., #200 Martinez, CA 94553
Integrated services for Homeless Mentally Ill
925-313-6476
Contra Costa County City of Concord 1950 Parkside Dr., MS 27 Concord, CA 94519
Assistance to both landlords and tenants and mediate discrimination & other housing complaints.
925-671-3364
Del Norte County California Indian Legal Services 324 “F” St., #A Eureka, CA 95501
Legal Aid Society 800-347-2402
Del Norte County Legal Services of No. California 123 Third St. Eureka, CA 95502
Legal services 707-445-0866 707-445-0935 FAX
El Dorado County Legal Center for the Elderly Main Office 937 Spring St. Placerville, CA 95667
Legal Aid Society 530-621-6154
El Dorado County Legal Center for the Elderly Lake Tahoe Office 3368 Lake Tahoe Blvd., #202 So. Lake Tahoe, CA 96150
Legal Aid Society 530-573-3490
El Dorado County Legal Services for Northern California 190 Reamer St. Auburn, CA 95603
Legal Aid Society 800-660-6107 530-823-7560 530-823-7601 FAX
El Dorado County El Dorado County Mental Health 981 Silver Dollar Ave. South Lake Tahoe, CA 96150
Integrated services for Homeless Mentally Ill
530-573-3251
Fresno County FHC of Central California Marilyn J. Borelli, ED 560 E. Shields Ave., #103 Fresno, CA 93704
Fair housing education; testing 559-244-2950 559-244-2956 FAX
Fresno County Central California Legal Services 2014 Tulare St., #600 Fresno, CA 93721
Legal Aid Society 559-441-1611
Fresno County Dept. of Adult Services 4441 E. Kings Canyon Rd., #49B Fresno, CA 93750
Integrated services for Homeless Mentally Ill
559-253-9190
Fresno County Attorney Referral & Information 1221 Van Ness Ave., #300 Fresno, CA 93721
Attorney referral 559-264-0137
Glenn County Legal Services of Northern CA 541 Normal Ave./POB 3728 Chico, CA 95927
Legal Aid Society 800-345-9491 530-345-9493 530-345-6913 FAX
Humboldt County California Indian Legal Services 324 “F” St., #A Eureka, CA 95501
Legal Aid Society 707-443-8397
Humboldt County Legal Services of No. California 619 North St. Woodland, CA 95695
Legal services 530-662-1065 530-662-7941 FAX
S t a t e o f C a l i f o r n i a A n a l y s i s o f I m p e d i m e n t s P a g e | 6 - 27
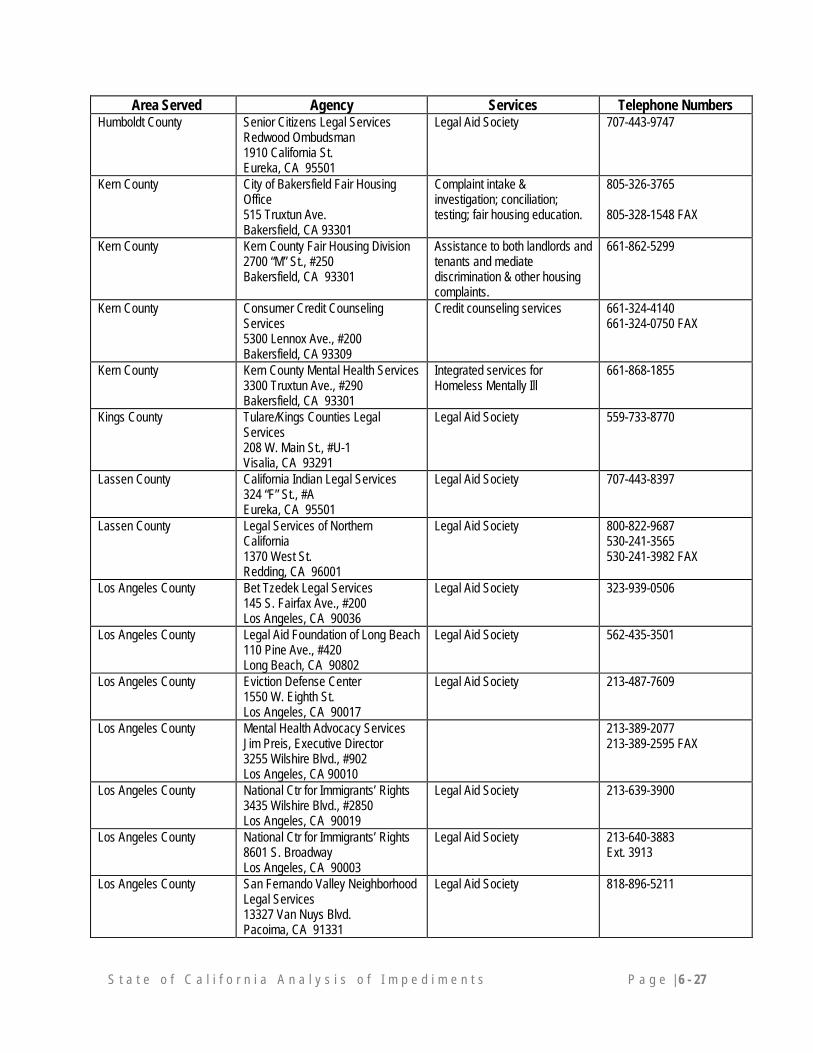
Area Served Agency Services Telephone Numbers Humboldt County Senior Citizens Legal Services
Redwood Ombudsman 1910 California St. Eureka, CA 95501
Legal Aid Society 707-443-9747
Kern County City of Bakersfield Fair Housing Office 515 Truxtun Ave. Bakersfield, CA 93301
Complaint intake & investigation; conciliation; testing; fair housing education.
805-326-3765 805-328-1548 FAX
Kern County Kern County Fair Housing Division 2700 “M” St., #250 Bakersfield, CA 93301
Assistance to both landlords and tenants and mediate discrimination & other housing complaints.
661-862-5299
Kern County Consumer Credit Counseling Services 5300 Lennox Ave., #200 Bakersfield, CA 93309
Credit counseling services 661-324-4140 661-324-0750 FAX
Kern County Kern County Mental Health Services 3300 Truxtun Ave., #290 Bakersfield, CA 93301
Integrated services for Homeless Mentally Ill
661-868-1855
Kings County Tulare/Kings Counties Legal Services 208 W. Main St., #U-1 Visalia, CA 93291
Legal Aid Society 559-733-8770
Lassen County California Indian Legal Services 324 “F” St., #A Eureka, CA 95501
Legal Aid Society 707-443-8397
Lassen County Legal Services of Northern California 1370 West St. Redding, CA 96001
Legal Aid Society 800-822-9687 530-241-3565 530-241-3982 FAX
Los Angeles County Bet Tzedek Legal Services 145 S. Fairfax Ave., #200 Los Angeles, CA 90036
Legal Aid Society 323-939-0506
Los Angeles County Legal Aid Foundation of Long Beach 110 Pine Ave., #420 Long Beach, CA 90802
Legal Aid Society 562-435-3501
Los Angeles County Eviction Defense Center 1550 W. Eighth St. Los Angeles, CA 90017
Legal Aid Society 213-487-7609
Los Angeles County Mental Health Advocacy Services Jim Preis, Executive Director 3255 Wilshire Blvd., #902 Los Angeles, CA 90010
213-389-2077 213-389-2595 FAX
Los Angeles County National Ctr for Immigrants’ Rights 3435 Wilshire Blvd., #2850 Los Angeles, CA 90019
Legal Aid Society 213-639-3900
Los Angeles County National Ctr for Immigrants’ Rights 8601 S. Broadway Los Angeles, CA 90003
Legal Aid Society 213-640-3883 Ext. 3913
Los Angeles County San Fernando Valley Neighborhood Legal Services 13327 Van Nuys Blvd. Pacoima, CA 91331
Legal Aid Society 818-896-5211
S t a t e o f C a l i f o r n i a A n a l y s i s o f I m p e d i m e n t s P a g e | 6 - 28
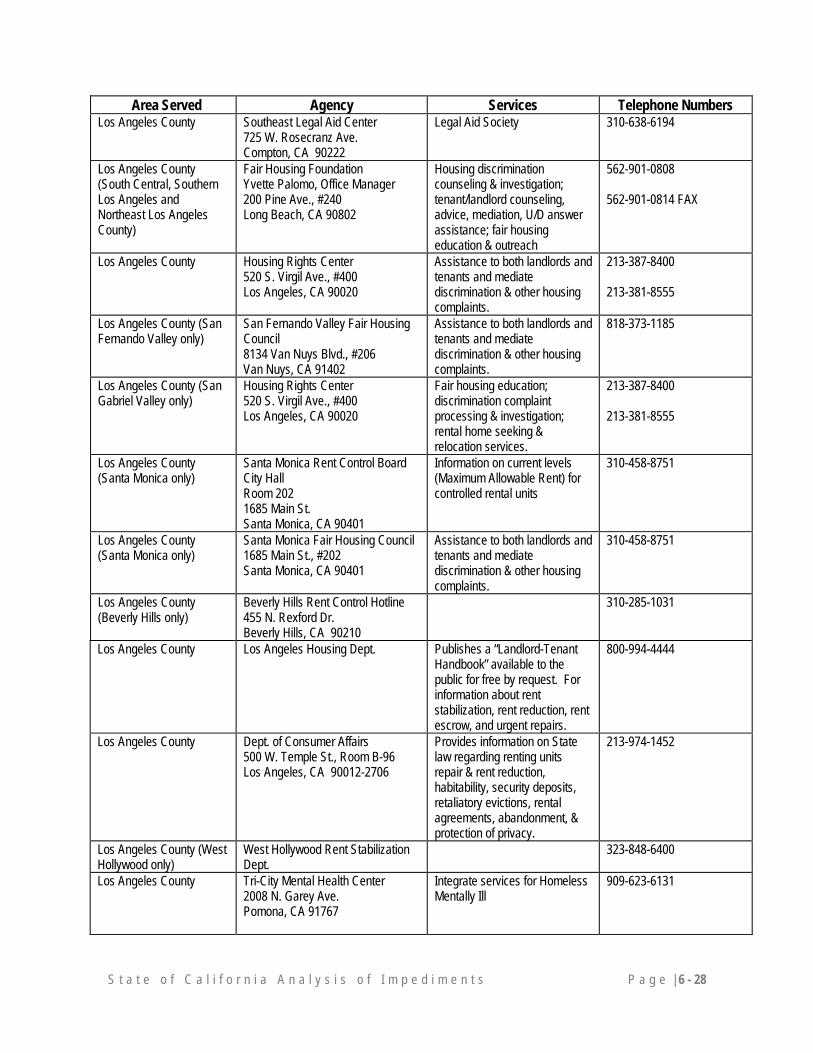
Area Served Agency Services Telephone Numbers Los Angeles County Southeast Legal Aid Center
725 W. Rosecranz Ave. Compton, CA 90222
Legal Aid Society 310-638-6194
Los Angeles County (South Central, Southern Los Angeles and Northeast Los Angeles County)
Fair Housing Foundation Yvette Palomo, Office Manager 200 Pine Ave., #240 Long Beach, CA 90802
Housing discrimination counseling & investigation; tenant/landlord counseling, advice, mediation, U/D answer assistance; fair housing education & outreach
562-901-0808 562-901-0814 FAX
Los Angeles County Housing Rights Center 520 S. Virgil Ave., #400 Los Angeles, CA 90020
Assistance to both landlords and tenants and mediate discrimination & other housing complaints.
213-387-8400 213-381-8555
Los Angeles County (San Fernando Valley only)
San Fernando Valley Fair Housing Council 8134 Van Nuys Blvd., #206 Van Nuys, CA 91402
Assistance to both landlords and tenants and mediate discrimination & other housing complaints.
818-373-1185
Los Angeles County (San Gabriel Valley only)
Housing Rights Center 520 S. Virgil Ave., #400 Los Angeles, CA 90020
Fair housing education; discrimination complaint processing & investigation; rental home seeking & relocation services.
213-387-8400 213-381-8555
Los Angeles County (Santa Monica only)
Santa Monica Rent Control Board City Hall Room 202 1685 Main St. Santa Monica, CA 90401
Information on current levels (Maximum Allowable Rent) for controlled rental units
310-458-8751
Los Angeles County (Santa Monica only)
Santa Monica Fair Housing Council 1685 Main St., #202 Santa Monica, CA 90401
Assistance to both landlords and tenants and mediate discrimination & other housing complaints.
310-458-8751
Los Angeles County (Beverly Hills only)
Beverly Hills Rent Control Hotline 455 N. Rexford Dr. Beverly Hills, CA 90210
310-285-1031
Los Angeles County Los Angeles Housing Dept. Publishes a “Landlord-Tenant Handbook” available to the public for free by request. For information about rent stabilization, rent reduction, rent escrow, and urgent repairs.
800-994-4444
Los Angeles County Dept. of Consumer Affairs 500 W. Temple St., Room B-96 Los Angeles, CA 90012-2706
Provides information on State law regarding renting units repair & rent reduction, habitability, security deposits, retaliatory evictions, rental agreements, abandonment, & protection of privacy.
213-974-1452
Los Angeles County (West Hollywood only)
West Hollywood Rent Stabilization Dept.
323-848-6400
Los Angeles County Tri-City Mental Health Center 2008 N. Garey Ave. Pomona, CA 91767
Integrate services for Homeless Mentally Ill
909-623-6131
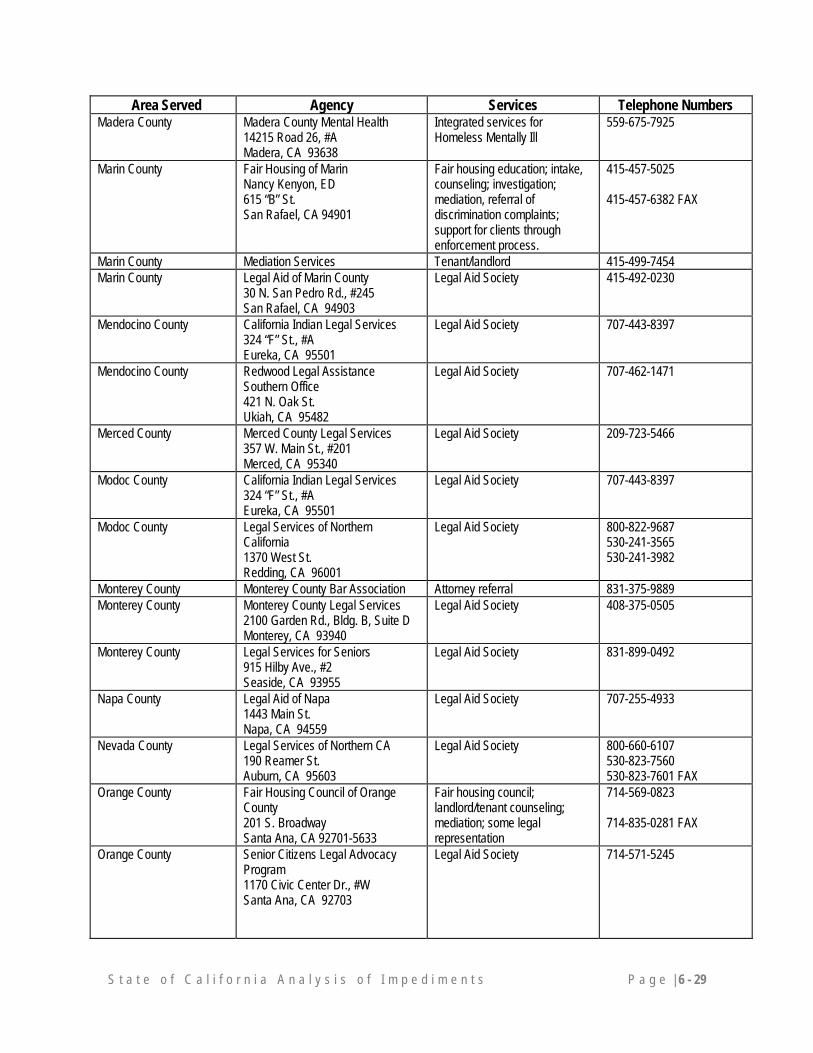
S t a t e o f C a l i f o r n i a A n a l y s i s o f I m p e d i m e n t s P a g e | 6 - 29
Area Served Agency Services Telephone Numbers Madera County Madera County Mental Health
14215 Road 26, #A Madera, CA 93638
Integrated services for Homeless Mentally Ill
559-675-7925
Marin County Fair Housing of Marin Nancy Kenyon, ED 615 “B” St. San Rafael, CA 94901
Fair housing education; intake, counseling; investigation; mediation, referral of discrimination complaints; support for clients through enforcement process.
415-457-5025 415-457-6382 FAX
Marin County Mediation Services Tenant/landlord 415-499-7454 Marin County Legal Aid of Marin County
30 N. San Pedro Rd., #245 San Rafael, CA 94903
Legal Aid Society 415-492-0230
Mendocino County California Indian Legal Services 324 “F” St., #A Eureka, CA 95501
Legal Aid Society 707-443-8397
Mendocino County Redwood Legal Assistance Southern Office 421 N. Oak St. Ukiah, CA 95482
Legal Aid Society 707-462-1471
Merced County Merced County Legal Services 357 W. Main St., #201 Merced, CA 95340
Legal Aid Society 209-723-5466
Modoc County California Indian Legal Services 324 “F” St., #A Eureka, CA 95501
Legal Aid Society 707-443-8397
Modoc County Legal Services of Northern California 1370 West St. Redding, CA 96001
Legal Aid Society 800-822-9687 530-241-3565 530-241-3982
Monterey County Monterey County Bar Association Attorney referral 831-375-9889 Monterey County Monterey County Legal Services
2100 Garden Rd., Bldg. B, Suite D Monterey, CA 93940
Legal Aid Society 408-375-0505
Monterey County Legal Services for Seniors 915 Hilby Ave., #2 Seaside, CA 93955
Legal Aid Society 831-899-0492
Napa County Legal Aid of Napa 1443 Main St. Napa, CA 94559
Legal Aid Society 707-255-4933
Nevada County Legal Services of Northern CA 190 Reamer St. Auburn, CA 95603
Legal Aid Society 800-660-6107 530-823-7560 530-823-7601 FAX
Orange County Fair Housing Council of Orange County 201 S. Broadway Santa Ana, CA 92701-5633
Fair housing council; landlord/tenant counseling; mediation; some legal representation
714-569-0823 714-835-0281 FAX
Orange County Senior Citizens Legal Advocacy Program 1170 Civic Center Dr., #W Santa Ana, CA 92703
Legal Aid Society 714-571-5245
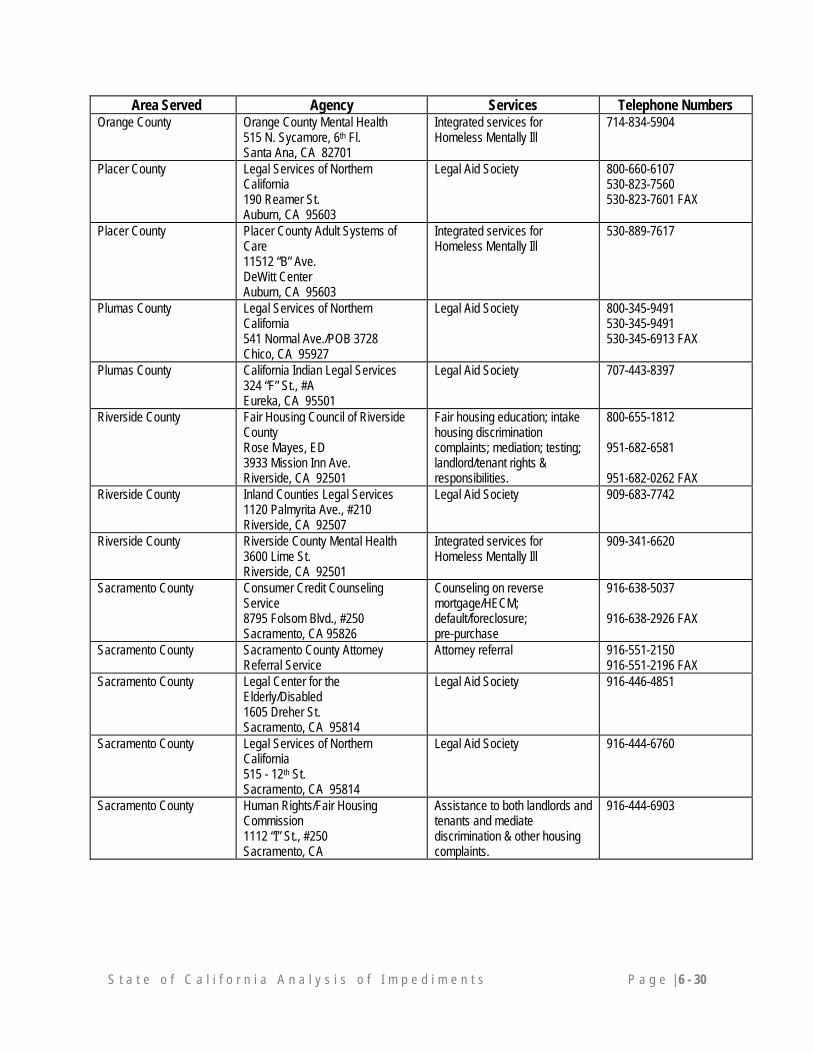
S t a t e o f C a l i f o r n i a A n a l y s i s o f I m p e d i m e n t s P a g e | 6 - 30
Area Served Agency Services Telephone Numbers Orange County Orange County Mental Health
515 N. Sycamore, 6th Fl. Santa Ana, CA 82701
Integrated services for Homeless Mentally Ill
714-834-5904
Placer County Legal Services of Northern California 190 Reamer St. Auburn, CA 95603
Legal Aid Society 800-660-6107 530-823-7560 530-823-7601 FAX
Placer County Placer County Adult Systems of Care 11512 “B” Ave. DeWitt Center Auburn, CA 95603
Integrated services for Homeless Mentally Ill
530-889-7617
Plumas County Legal Services of Northern California 541 Normal Ave./POB 3728 Chico, CA 95927
Legal Aid Society 800-345-9491 530-345-9491 530-345-6913 FAX
Plumas County California Indian Legal Services 324 “F” St., #A Eureka, CA 95501
Legal Aid Society 707-443-8397
Riverside County Fair Housing Council of Riverside County Rose Mayes, ED 3933 Mission Inn Ave. Riverside, CA 92501
Fair housing education; intake housing discrimination complaints; mediation; testing; landlord/tenant rights & responsibilities.
800-655-1812 951-682-6581 951-682-0262 FAX
Riverside County Inland Counties Legal Services 1120 Palmyrita Ave., #210 Riverside, CA 92507
Legal Aid Society 909-683-7742
Riverside County Riverside County Mental Health 3600 Lime St. Riverside, CA 92501
Integrated services for Homeless Mentally Ill
909-341-6620
Sacramento County Consumer Credit Counseling Service 8795 Folsom Blvd., #250 Sacramento, CA 95826
Counseling on reverse mortgage/HECM; default/foreclosure; pre-purchase
916-638-5037 916-638-2926 FAX
Sacramento County Sacramento County Attorney Referral Service
Attorney referral 916-551-2150 916-551-2196 FAX
Sacramento County Legal Center for the Elderly/Disabled 1605 Dreher St. Sacramento, CA 95814
Legal Aid Society 916-446-4851
Sacramento County Legal Services of Northern California 515 - 12th St. Sacramento, CA 95814
Legal Aid Society 916-444-6760
Sacramento County Human Rights/Fair Housing Commission 1112 “I” St., #250 Sacramento, CA
Assistance to both landlords and tenants and mediate discrimination & other housing complaints.
916-444-6903

S t a t e o f C a l i f o r n i a A n a l y s i s o f I m p e d i m e n t s P a g e | 6 - 31
Area Served Agency Services Telephone Numbers Sacramento County The Second Lease
7300 Lincolnshire Dr., #200 Sacramento, CA 95823
Provide assistance to those who are homeless or about to become homeless. Work with people who have less than perfect credit. Find affordable & reliable housing. Show individuals how to repair credit. Assist in becoming homeowners.
916-399-1792
San Bernardino County Inland Fair Housing & Mediation Board Lynne Anderson, ED 1005 Begonia Ave. Ontario, CA 91762
Fair housing education; landlord/tenant mediation; housing counseling; alternative dispute resolution courts; senior services/shared housing; ADA transportation information; conciliation and mediation; mobile home housing mediation
800-321-0911 909-984-2254 909-460-0274 FAX
San Bernardino County San Bernardino County Attorney Referral Service
Attorney referral 909-888-0550
San Bernardino County Inland Counties Legal Services 715 N. Arrowhead Ave., #113 San Bernardino, CA 92401
Legal Aid Society 800-677-4257 909-884-8615
San Bernardino County Inland Counties Legal Services 14196 Amargosa Rd., #K Victorville, CA 92392
Legal Aid Society 888-805-6455 760-241-7072
San Bernardino County Inland Counties Legal Services 10601 Civic Center Dr., #260 Rancho Cucamonga, CA 91730
Legal Aid Society 800-977-4257 909-980-0982
San Diego County San Diego Fair Housing Council Mary Scott Knoll 625 Broadway, #1114 San Diego, CA 92101
Fair housing council 619-699-5888
San Diego County and City San Diego Housing Commission 1625 Newton Ave. San Diego, CA 92113
Assistance to both landlords and tenants and mediate discrimination & other housing complaints.
619-231-9400
San Diego County and City Legal Aid Society of San Diego 110 S. Euclid Ave. San Diego, CA 92114-3796
Legal services to poor residents of San Diego city and county.
619-262-0896
San Diego County California Indian Legal Services 6001 S. Escondido Blvd. Escondido, CA 92025
Legal Aid Society 760-746-8941
San Diego County (San Diego only)
Renter’s Rights Center of San Diego 5252 Balboa Ave., Suite 408 San Diego, CA 92117-6939
Community law office. Attorneys provide low cost legal assistance. Wanted to charge an woman $80 for services – PES 3/21/05
858-571-7100
San Francisco City/County National Center for Youth Law 405 - 14th St., 15th Fl. Oakland, CA 94612-2701
Assistance to both landlords and tenants and mediate discrimination & other housing complaints.
510-835-8098
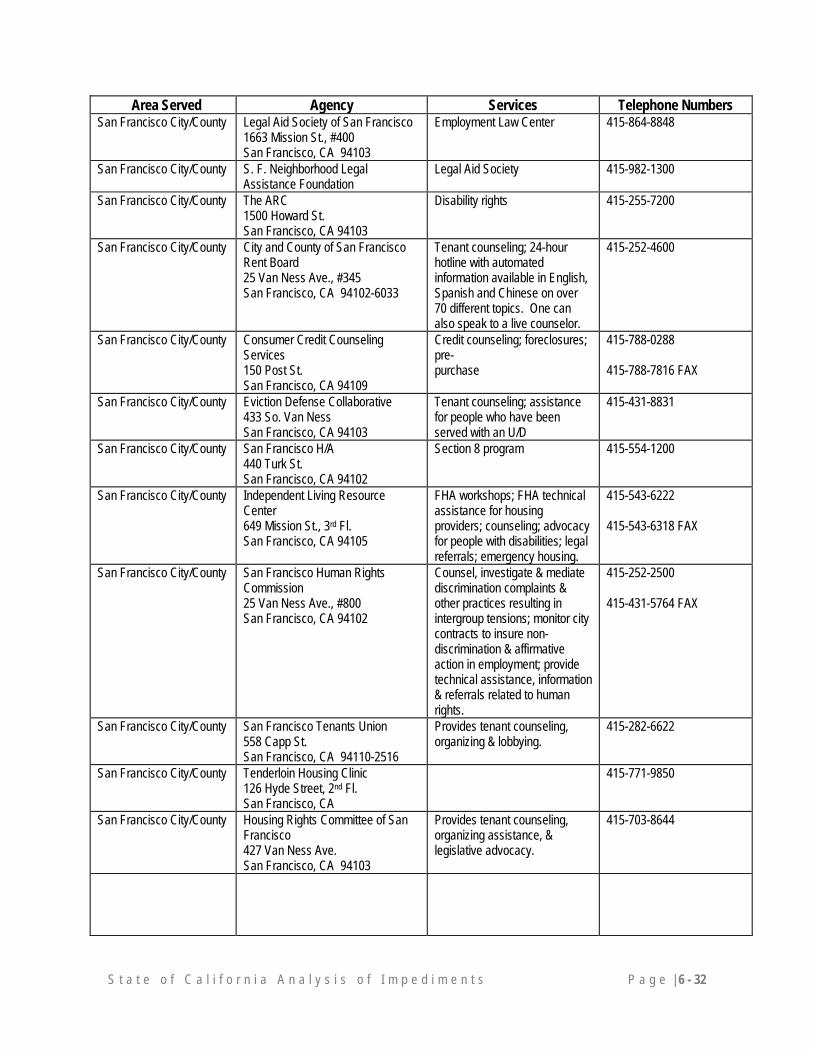
S t a t e o f C a l i f o r n i a A n a l y s i s o f I m p e d i m e n t s P a g e | 6 - 32
Area Served Agency Services Telephone Numbers San Francisco City/County Legal Aid Society of San Francisco
1663 Mission St., #400 San Francisco, CA 94103
Employment Law Center 415-864-8848
San Francisco City/County S. F. Neighborhood Legal Assistance Foundation
Legal Aid Society 415-982-1300
San Francisco City/County The ARC 1500 Howard St. San Francisco, CA 94103
Disability rights 415-255-7200
San Francisco City/County City and County of San Francisco Rent Board 25 Van Ness Ave., #345 San Francisco, CA 94102-6033
Tenant counseling; 24-hour hotline with automated information available in English, Spanish and Chinese on over 70 different topics. One can also speak to a live counselor.
415-252-4600
San Francisco City/County Consumer Credit Counseling Services 150 Post St. San Francisco, CA 94109
Credit counseling; foreclosures; pre- purchase
415-788-0288 415-788-7816 FAX
San Francisco City/County Eviction Defense Collaborative 433 So. Van Ness San Francisco, CA 94103
Tenant counseling; assistance for people who have been served with an U/D
415-431-8831
San Francisco City/County San Francisco H/A 440 Turk St. San Francisco, CA 94102
Section 8 program 415-554-1200
San Francisco City/County Independent Living Resource Center 649 Mission St., 3rd Fl. San Francisco, CA 94105
FHA workshops; FHA technical assistance for housing providers; counseling; advocacy for people with disabilities; legal referrals; emergency housing.
415-543-6222 415-543-6318 FAX
San Francisco City/County San Francisco Human Rights Commission 25 Van Ness Ave., #800 San Francisco, CA 94102
Counsel, investigate & mediate discrimination complaints & other practices resulting in intergroup tensions; monitor city contracts to insure non-discrimination & affirmative action in employment; provide technical assistance, information & referrals related to human rights.
415-252-2500 415-431-5764 FAX
San Francisco City/County San Francisco Tenants Union 558 Capp St. San Francisco, CA 94110-2516
Provides tenant counseling, organizing & lobbying.
415-282-6622
San Francisco City/County Tenderloin Housing Clinic 126 Hyde Street, 2nd Fl. San Francisco, CA
415-771-9850
San Francisco City/County Housing Rights Committee of San Francisco 427 Van Ness Ave. San Francisco, CA 94103
Provides tenant counseling, organizing assistance, & legislative advocacy.
415-703-8644
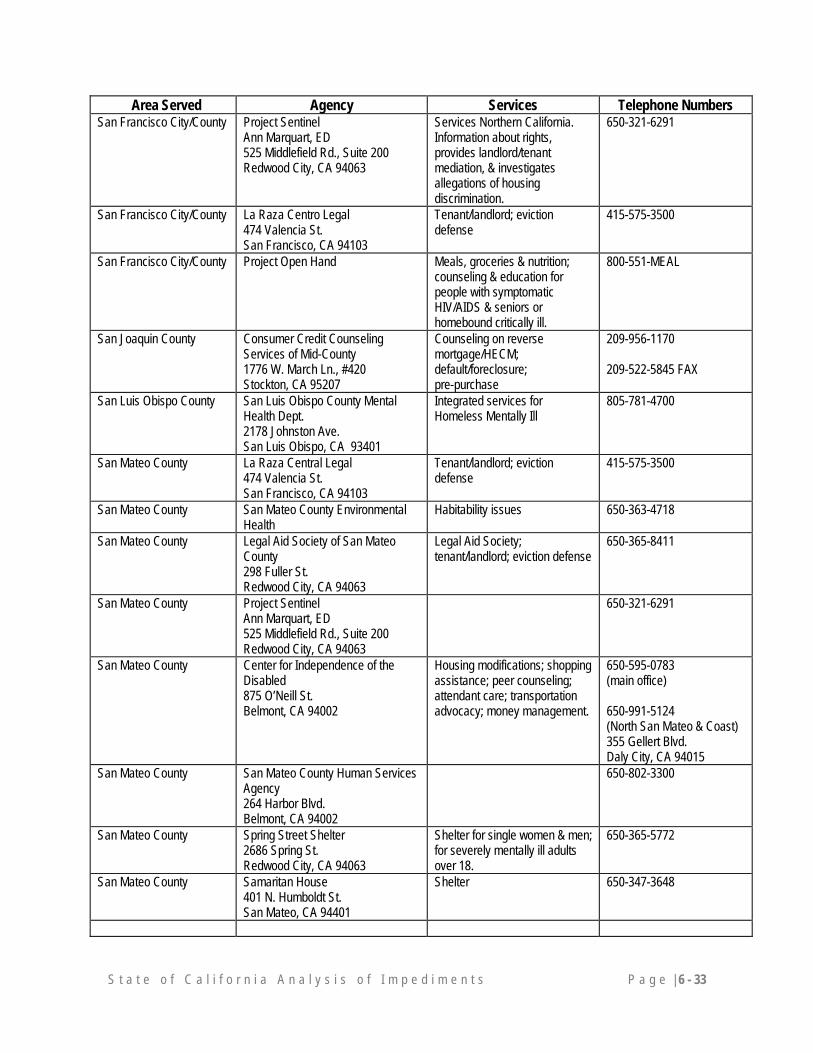
S t a t e o f C a l i f o r n i a A n a l y s i s o f I m p e d i m e n t s P a g e | 6 - 33
Area Served Agency Services Telephone Numbers San Francisco City/County Project Sentinel
Ann Marquart, ED 525 Middlefield Rd., Suite 200 Redwood City, CA 94063
Services Northern California. Information about rights, provides landlord/tenant mediation, & investigates allegations of housing discrimination.
650-321-6291
San Francisco City/County La Raza Centro Legal 474 Valencia St. San Francisco, CA 94103
Tenant/landlord; eviction defense
415-575-3500
San Francisco City/County Project Open Hand Meals, groceries & nutrition; counseling & education for people with symptomatic HIV/AIDS & seniors or homebound critically ill.
800-551-MEAL
San Joaquin County Consumer Credit Counseling Services of Mid-County 1776 W. March Ln., #420 Stockton, CA 95207
Counseling on reverse mortgage/HECM; default/foreclosure; pre-purchase
209-956-1170 209-522-5845 FAX
San Luis Obispo County San Luis Obispo County Mental Health Dept. 2178 Johnston Ave. San Luis Obispo, CA 93401
Integrated services for Homeless Mentally Ill
805-781-4700
San Mateo County La Raza Central Legal 474 Valencia St. San Francisco, CA 94103
Tenant/landlord; eviction defense
415-575-3500
San Mateo County San Mateo County Environmental Health
Habitability issues 650-363-4718
San Mateo County Legal Aid Society of San Mateo County 298 Fuller St. Redwood City, CA 94063
Legal Aid Society; tenant/landlord; eviction defense
650-365-8411
San Mateo County Project Sentinel Ann Marquart, ED 525 Middlefield Rd., Suite 200 Redwood City, CA 94063
650-321-6291
San Mateo County Center for Independence of the Disabled 875 O’Neill St. Belmont, CA 94002
Housing modifications; shopping assistance; peer counseling; attendant care; transportation advocacy; money management.
650-595-0783 (main office) 650-991-5124 (North San Mateo & Coast) 355 Gellert Blvd. Daly City, CA 94015
San Mateo County San Mateo County Human Services Agency 264 Harbor Blvd. Belmont, CA 94002
650-802-3300
San Mateo County Spring Street Shelter 2686 Spring St. Redwood City, CA 94063
Shelter for single women & men; for severely mentally ill adults over 18.
650-365-5772
San Mateo County Samaritan House 401 N. Humboldt St. San Mateo, CA 94401
Shelter 650-347-3648
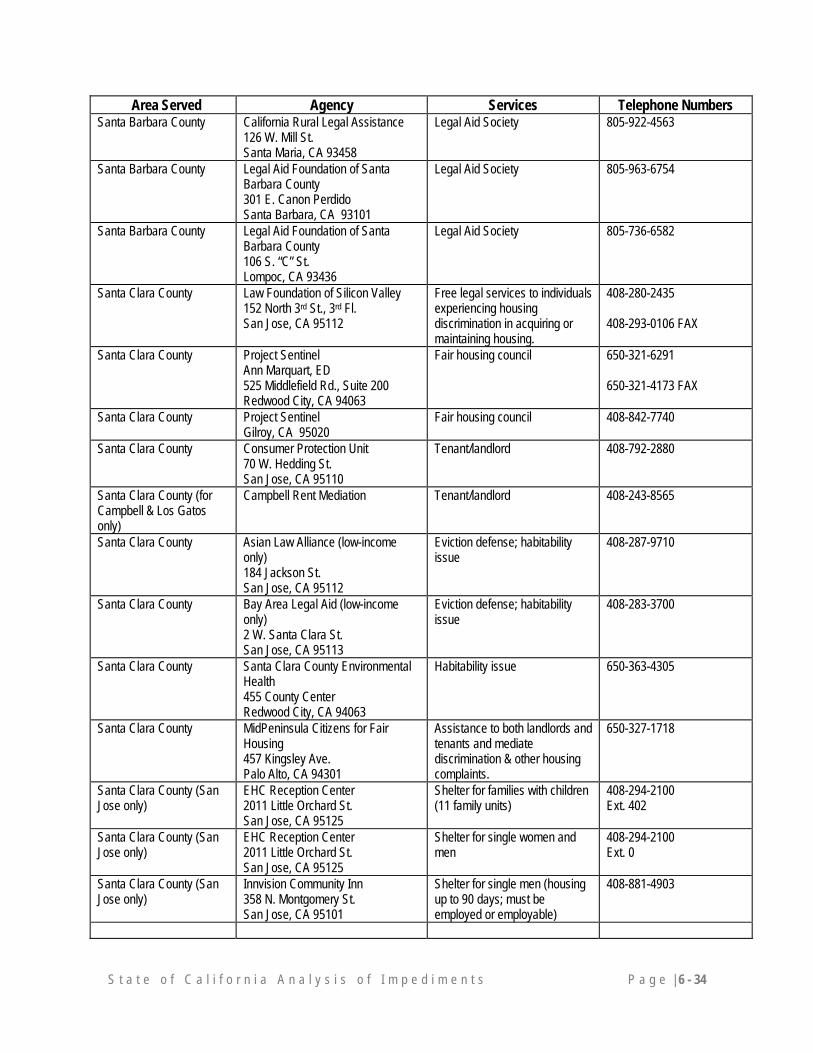
S t a t e o f C a l i f o r n i a A n a l y s i s o f I m p e d i m e n t s P a g e | 6 - 34
Area Served Agency Services Telephone Numbers Santa Barbara County California Rural Legal Assistance
126 W. Mill St. Santa Maria, CA 93458
Legal Aid Society 805-922-4563
Santa Barbara County Legal Aid Foundation of Santa Barbara County 301 E. Canon Perdido Santa Barbara, CA 93101
Legal Aid Society 805-963-6754
Santa Barbara County Legal Aid Foundation of Santa Barbara County 106 S. “C” St. Lompoc, CA 93436
Legal Aid Society 805-736-6582
Santa Clara County Law Foundation of Silicon Valley 152 North 3rd St., 3rd Fl. San Jose, CA 95112
Free legal services to individuals experiencing housing discrimination in acquiring or maintaining housing.
408-280-2435 408-293-0106 FAX
Santa Clara County Project Sentinel Ann Marquart, ED 525 Middlefield Rd., Suite 200 Redwood City, CA 94063
Fair housing council 650-321-6291 650-321-4173 FAX
Santa Clara County Project Sentinel Gilroy, CA 95020
Fair housing council 408-842-7740
Santa Clara County Consumer Protection Unit 70 W. Hedding St. San Jose, CA 95110
Tenant/landlord 408-792-2880
Santa Clara County (for Campbell & Los Gatos only)
Campbell Rent Mediation Tenant/landlord 408-243-8565
Santa Clara County Asian Law Alliance (low-income only) 184 Jackson St. San Jose, CA 95112
Eviction defense; habitability issue
408-287-9710
Santa Clara County Bay Area Legal Aid (low-income only) 2 W. Santa Clara St. San Jose, CA 95113
Eviction defense; habitability issue
408-283-3700
Santa Clara County Santa Clara County Environmental Health 455 County Center Redwood City, CA 94063
Habitability issue 650-363-4305
Santa Clara County MidPeninsula Citizens for Fair Housing 457 Kingsley Ave. Palo Alto, CA 94301
Assistance to both landlords and tenants and mediate discrimination & other housing complaints.
650-327-1718
Santa Clara County (San Jose only)
EHC Reception Center 2011 Little Orchard St. San Jose, CA 95125
Shelter for families with children (11 family units)
408-294-2100 Ext. 402
Santa Clara County (San Jose only)
EHC Reception Center 2011 Little Orchard St. San Jose, CA 95125
Shelter for single women and men
408-294-2100 Ext. 0
Santa Clara County (San Jose only)
Innvision Community Inn 358 N. Montgomery St. San Jose, CA 95101
Shelter for single men (housing up to 90 days; must be employed or employable)
408-881-4903
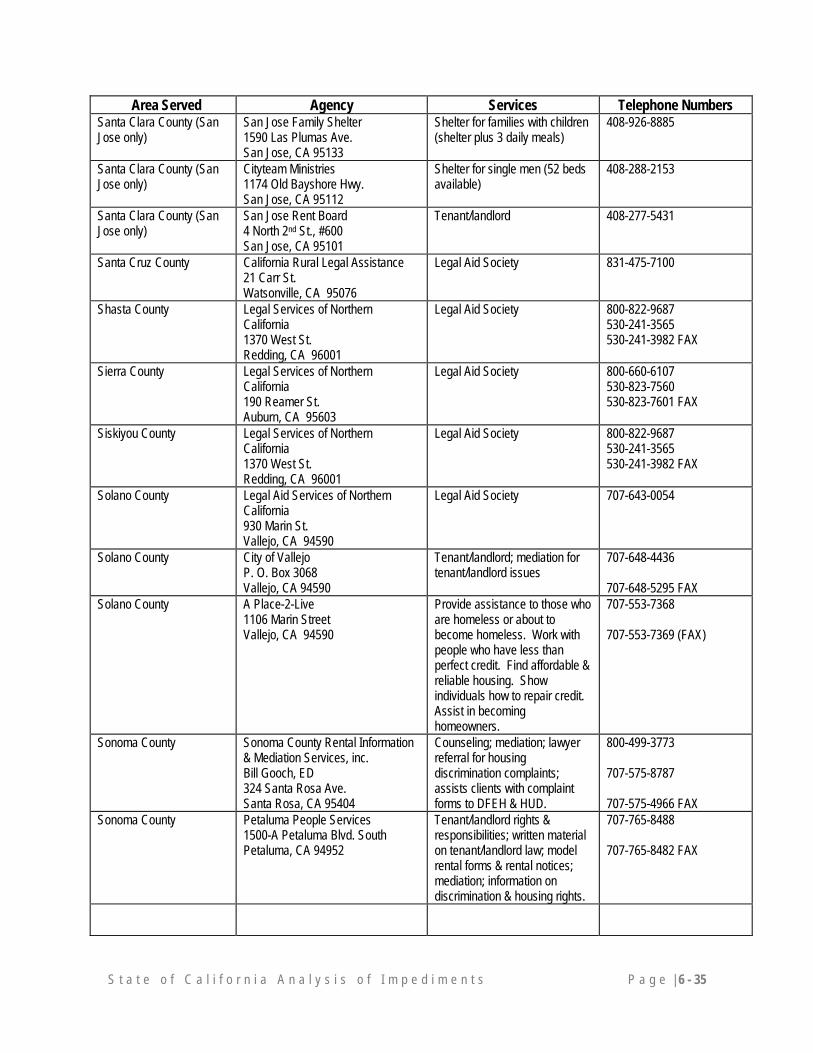
S t a t e o f C a l i f o r n i a A n a l y s i s o f I m p e d i m e n t s P a g e | 6 - 35
Area Served Agency Services Telephone Numbers Santa Clara County (San Jose only)
San Jose Family Shelter 1590 Las Plumas Ave. San Jose, CA 95133
Shelter for families with children (shelter plus 3 daily meals)
408-926-8885
Santa Clara County (San Jose only)
Cityteam Ministries 1174 Old Bayshore Hwy. San Jose, CA 95112
Shelter for single men (52 beds available)
408-288-2153
Santa Clara County (San Jose only)
San Jose Rent Board 4 North 2nd St., #600 San Jose, CA 95101
Tenant/landlord 408-277-5431
Santa Cruz County California Rural Legal Assistance 21 Carr St. Watsonville, CA 95076
Legal Aid Society 831-475-7100
Shasta County Legal Services of Northern California 1370 West St. Redding, CA 96001
Legal Aid Society 800-822-9687 530-241-3565 530-241-3982 FAX
Sierra County Legal Services of Northern California 190 Reamer St. Auburn, CA 95603
Legal Aid Society 800-660-6107 530-823-7560 530-823-7601 FAX
Siskiyou County Legal Services of Northern California 1370 West St. Redding, CA 96001
Legal Aid Society 800-822-9687 530-241-3565 530-241-3982 FAX
Solano County Legal Aid Services of Northern California 930 Marin St. Vallejo, CA 94590
Legal Aid Society 707-643-0054
Solano County City of Vallejo P. O. Box 3068 Vallejo, CA 94590
Tenant/landlord; mediation for tenant/landlord issues
707-648-4436 707-648-5295 FAX
Solano County A Place-2-Live 1106 Marin Street Vallejo, CA 94590
Provide assistance to those who are homeless or about to become homeless. Work with people who have less than perfect credit. Find affordable & reliable housing. Show individuals how to repair credit. Assist in becoming homeowners.
707-553-7368 707-553-7369 (FAX)
Sonoma County Sonoma County Rental Information & Mediation Services, inc. Bill Gooch, ED 324 Santa Rosa Ave. Santa Rosa, CA 95404
Counseling; mediation; lawyer referral for housing discrimination complaints; assists clients with complaint forms to DFEH & HUD.
800-499-3773 707-575-8787 707-575-4966 FAX
Sonoma County Petaluma People Services 1500-A Petaluma Blvd. South Petaluma, CA 94952
Tenant/landlord rights & responsibilities; written material on tenant/landlord law; model rental forms & rental notices; mediation; information on discrimination & housing rights.
707-765-8488 707-765-8482 FAX
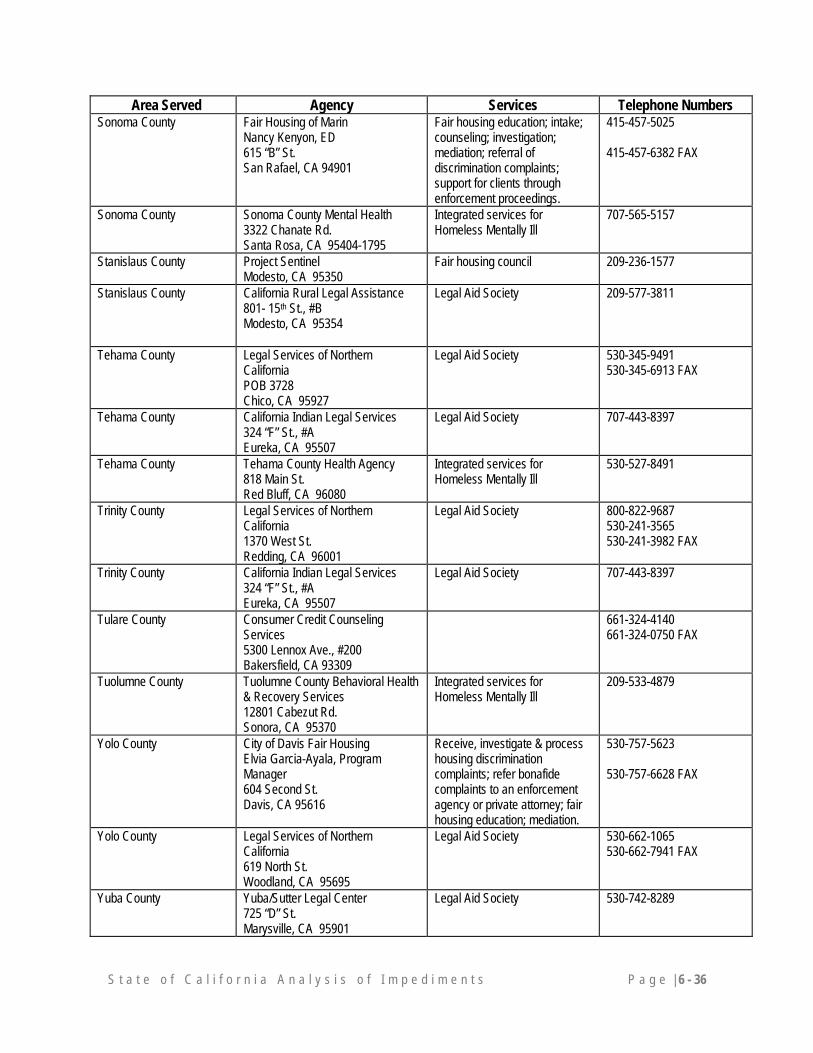
S t a t e o f C a l i f o r n i a A n a l y s i s o f I m p e d i m e n t s P a g e | 6 - 36
Area Served Agency Services Telephone Numbers Sonoma County Fair Housing of Marin
Nancy Kenyon, ED 615 “B” St. San Rafael, CA 94901
Fair housing education; intake; counseling; investigation; mediation; referral of discrimination complaints; support for clients through enforcement proceedings.
415-457-5025 415-457-6382 FAX
Sonoma County Sonoma County Mental Health 3322 Chanate Rd. Santa Rosa, CA 95404-1795
Integrated services for Homeless Mentally Ill
707-565-5157
Stanislaus County Project Sentinel Modesto, CA 95350
Fair housing council 209-236-1577
Stanislaus County California Rural Legal Assistance 801- 15th St., #B Modesto, CA 95354
Legal Aid Society 209-577-3811
Tehama County Legal Services of Northern California POB 3728 Chico, CA 95927
Legal Aid Society 530-345-9491 530-345-6913 FAX
Tehama County California Indian Legal Services 324 “F” St., #A Eureka, CA 95507
Legal Aid Society 707-443-8397
Tehama County Tehama County Health Agency 818 Main St. Red Bluff, CA 96080
Integrated services for Homeless Mentally Ill
530-527-8491
Trinity County Legal Services of Northern California 1370 West St. Redding, CA 96001
Legal Aid Society 800-822-9687 530-241-3565 530-241-3982 FAX
Trinity County California Indian Legal Services 324 “F” St., #A Eureka, CA 95507
Legal Aid Society 707-443-8397
Tulare County Consumer Credit Counseling Services 5300 Lennox Ave., #200 Bakersfield, CA 93309
661-324-4140 661-324-0750 FAX
Tuolumne County Tuolumne County Behavioral Health & Recovery Services 12801 Cabezut Rd. Sonora, CA 95370
Integrated services for Homeless Mentally Ill
209-533-4879
Yolo County City of Davis Fair Housing Elvia Garcia-Ayala, Program Manager 604 Second St. Davis, CA 95616
Receive, investigate & process housing discrimination complaints; refer bonafide complaints to an enforcement agency or private attorney; fair housing education; mediation.
530-757-5623 530-757-6628 FAX
Yolo County Legal Services of Northern California 619 North St. Woodland, CA 95695
Legal Aid Society 530-662-1065 530-662-7941 FAX
Yuba County Yuba/Sutter Legal Center 725 “D” St. Marysville, CA 95901
Legal Aid Society 530-742-8289

S t a t e o f C a l i f o r n i a A n a l y s i s o f I m p e d i m e n t s P a g e | 6 - 37