Embed Size (px)
Citation preview
www.q2s.ntnu.no Eirik Larsen Følstad 12-10-2011
Failures and changes in cellular access networks;
a study of field data
Eirik Larsen Følstad Bjarne E. Helvik

www.q2s.ntnu.no
2
Eirik Larsen Følstad 12-10-2011
Outline
• Introduction • Incident and change management processes • Data set analyzed • Failure analysis • Correlation between failures and changes • Summary

www.q2s.ntnu.no
3
Background
• Increasing competition in wireless and cellular access networks
• Cooperation are between network operators are become more advanced – Site sharing, houses, towers – Site infrastructure sharing; power, cooling – Transmission sharing/leasing – RAN sharing – Etc
• How does the cooperation affect the dependencies between the access networks?
Eirik Larsen Følstad 12-10-2011

www.q2s.ntnu.no
4
GSM/UMTS network - general view
Eirik Larsen Følstad 12-10-2011
• Various technologies and structures in transport network • BSC and RNC might be co-located. • Node B and BTS might be co-located
www.q2s.ntnu.no
5
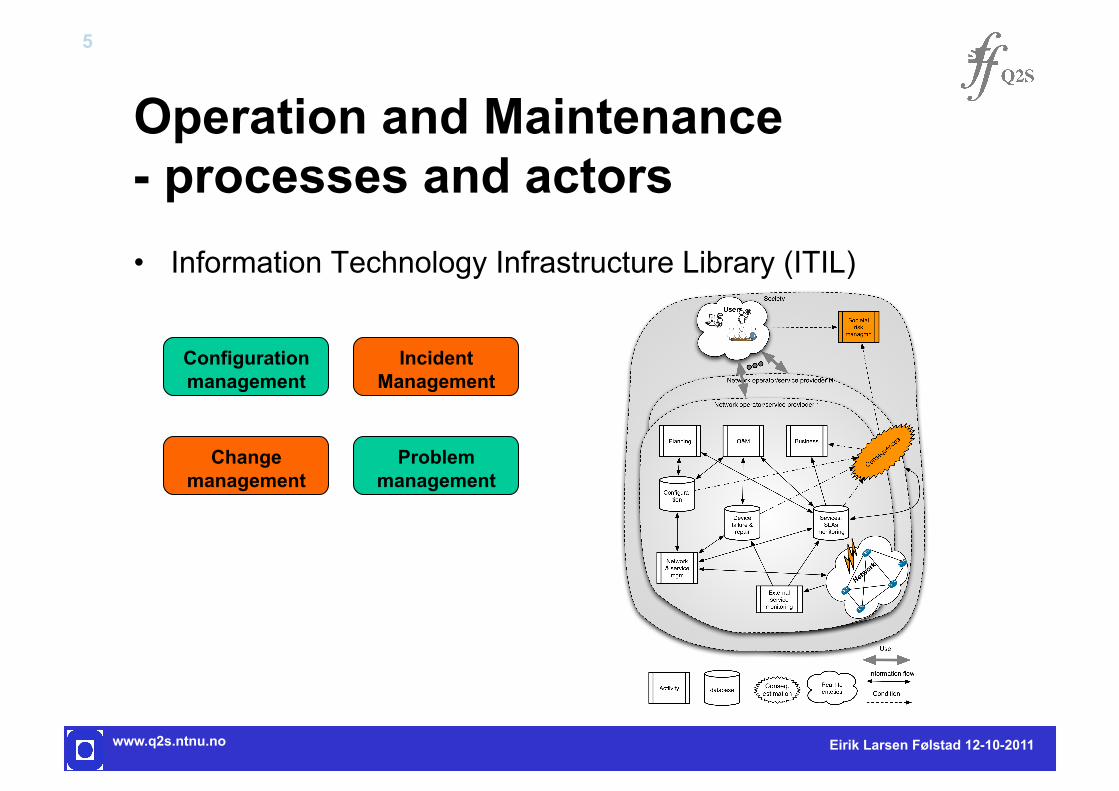
Operation and Maintenance - processes and actors • Information Technology Infrastructure Library (ITIL)
Eirik Larsen Følstad 12-10-2011
Configuration management
Incident Management
Problem management
Change management
www.q2s.ntnu.no
6
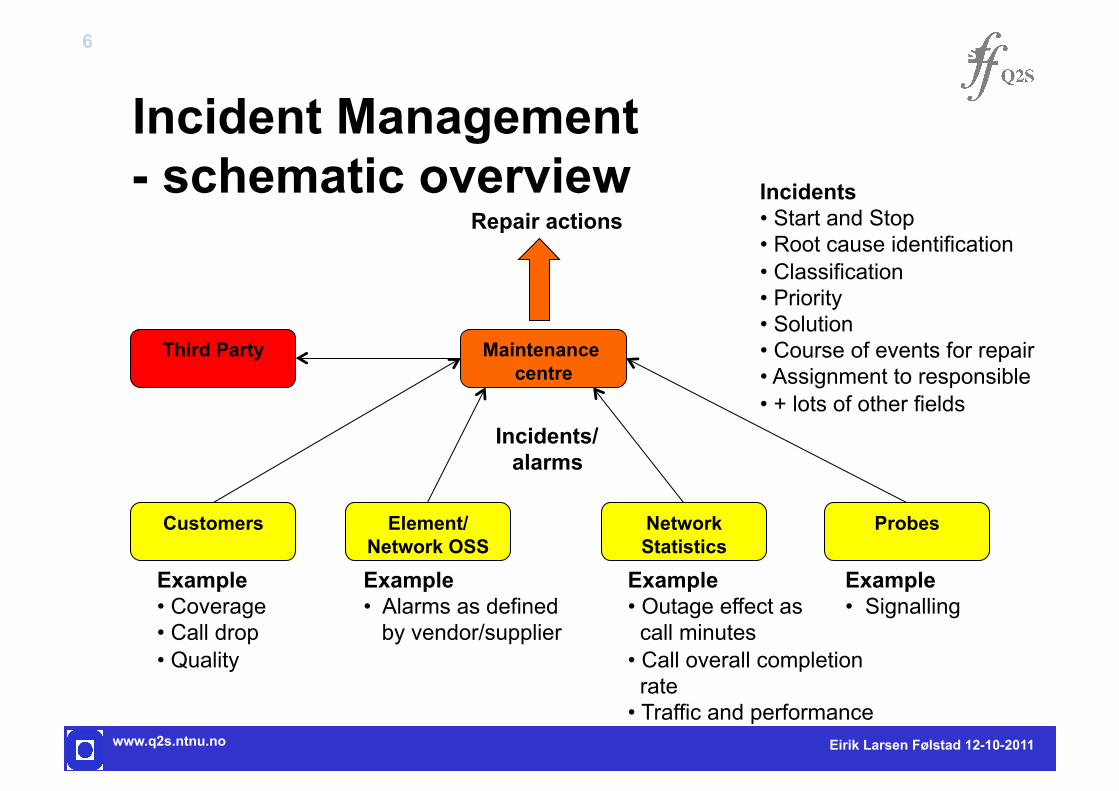
Incident Management - schematic overview
Eirik Larsen Følstad 12-10-2011
Element/Network OSS
Customers Network Statistics
Probes
Maintenance centre
Incidents/ alarms
Incidents • Start and Stop • Root cause identification • Classification • Priority • Solution • Course of events for repair • Assignment to responsible • + lots of other fields
Third Party
Repair actions
Example • Outage effect as call minutes • Call overall completion rate • Traffic and performance
Example • Alarms as defined by vendor/supplier
Example • Signalling
Example • Coverage • Call drop • Quality

www.q2s.ntnu.no
7
Change Management - schematic overview
Eirik Larsen Følstad 14-04-2011
Infrastructure Planning
Radio Planning
Network Planning
Transmission Planning
Config mgm Decision board
Work Orders
Access Operations
Field Engineers
Transmission Operations
Work Orders • Several different types • Organization oriented • Affecting one or several equipment
Third Party
Service Window • Dependent on risks • Operator vs. Third party
Network Changes

www.q2s.ntnu.no
8
Data set analysed; Incident and Changed records • GSM/UMTS operator
– Network keeps changing – Increasing usage
• Data set containing covering more than 1000 days – Several thousand BTS/NodeB – Network resources from BTS/NodeB to BSC/RNC – Several thousand incidents – Several thousand changes
• Normalization of numbers according to an “undisclosed constant”
Eirik Larsen Følstad 12-10-2011

www.q2s.ntnu.no
9
Network incidents - mapped to service failures
Eirik Larsen Følstad 12-10-2011
What is a service failure? • We have used the definition as used by the operator • Operator's repair actions and processes are governed by the failure risk/consequences.

www.q2s.ntnu.no
10
Service failure categorization - dependencies between actors
Eirik Larsen Følstad 12-10-2011
Incident record
Incident database
Location
Start time
Closure time
Category
Failure
Category={Operator | Leased | Power}
www.q2s.ntnu.no
11
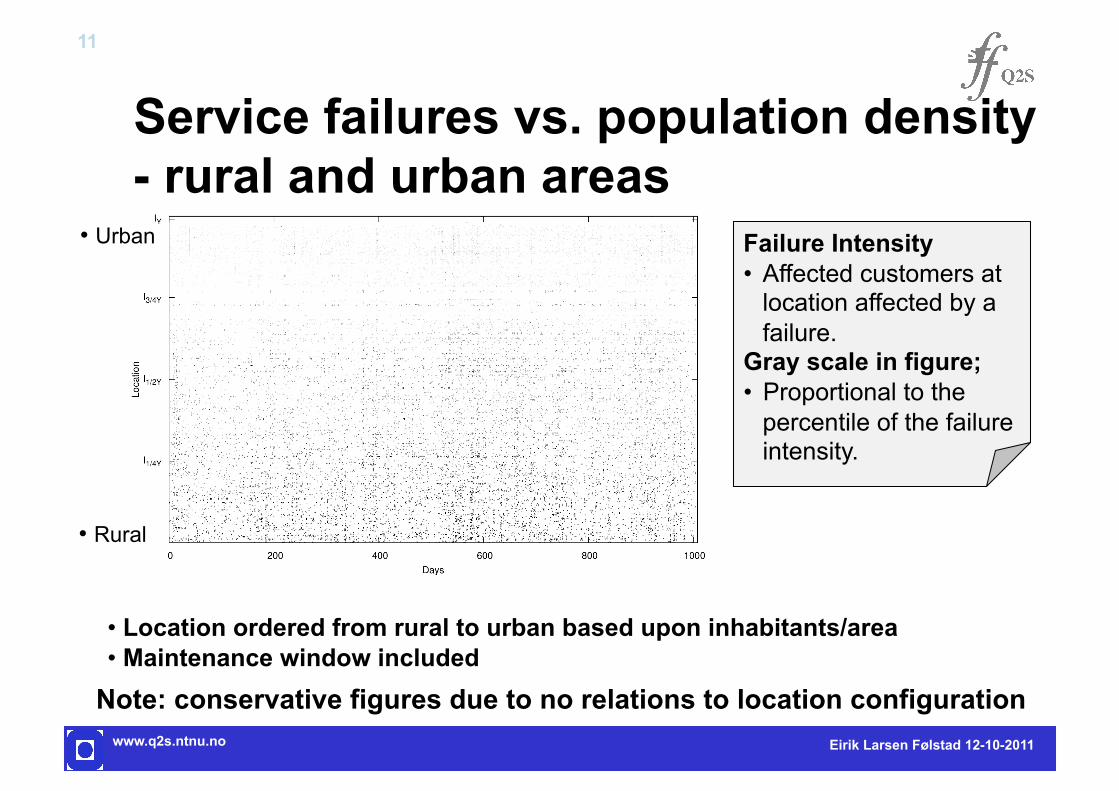
Service failures vs. population density - rural and urban areas
Eirik Larsen Følstad 12-10-2011
Note: conservative figures due to no relations to location configuration
• Location ordered from rural to urban based upon inhabitants/area • Maintenance window included
Failure Intensity • Affected customers at
location affected by a failure.
Gray scale in figure; • Proportional to the
percentile of the failure intensity.
• Urban
• Rural
www.q2s.ntnu.no
12
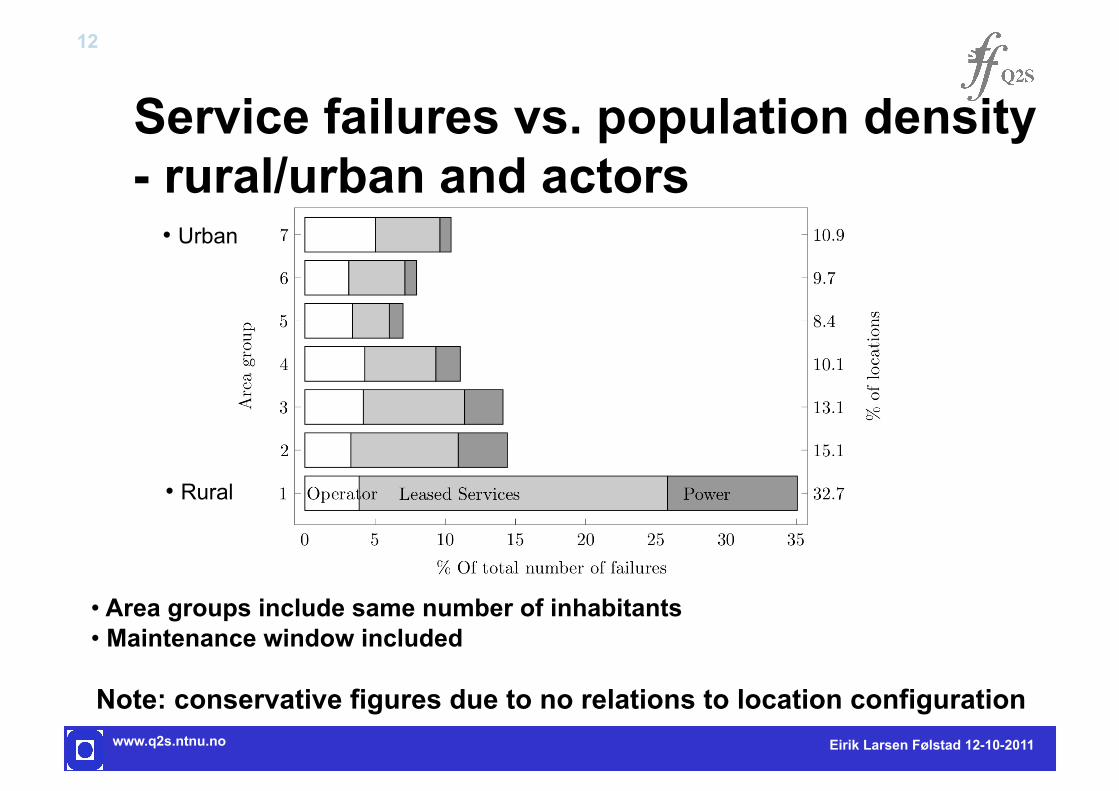
Service failures vs. population density - rural/urban and actors
Eirik Larsen Følstad 12-10-2011
Note: conservative figures due to no relations to location configuration
• Area groups include same number of inhabitants • Maintenance window included
• Urban
• Rural
www.q2s.ntnu.no
13
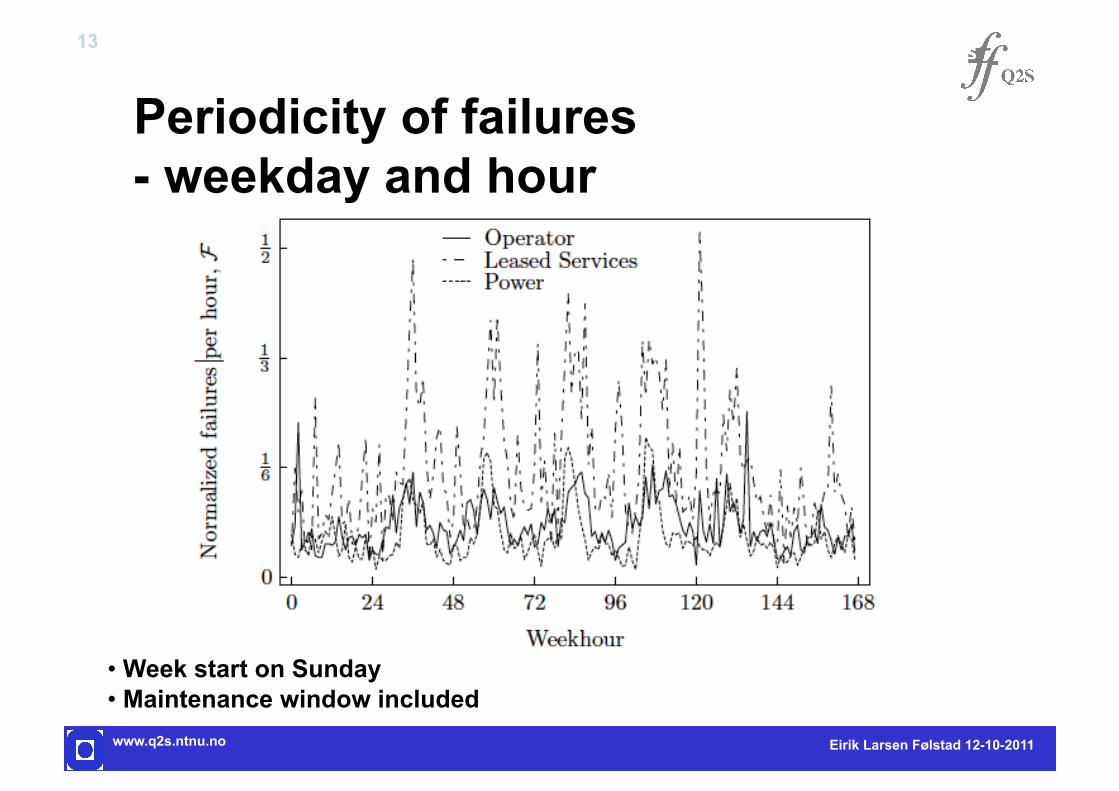
Periodicity of failures - weekday and hour
Eirik Larsen Følstad 12-10-2011
• Week start on Sunday • Maintenance window included

www.q2s.ntnu.no
14
Periodicity of total number of failures - Discrete Fourier Transform
Eirik Larsen Følstad 12-10-2011
• The mean is not included • Linear trend is removed before the discrete Fourier transform

www.q2s.ntnu.no
15
Failures with common root cause - schematic overview
Eirik Larsen Følstad 12-10-2011
www.q2s.ntnu.no
16
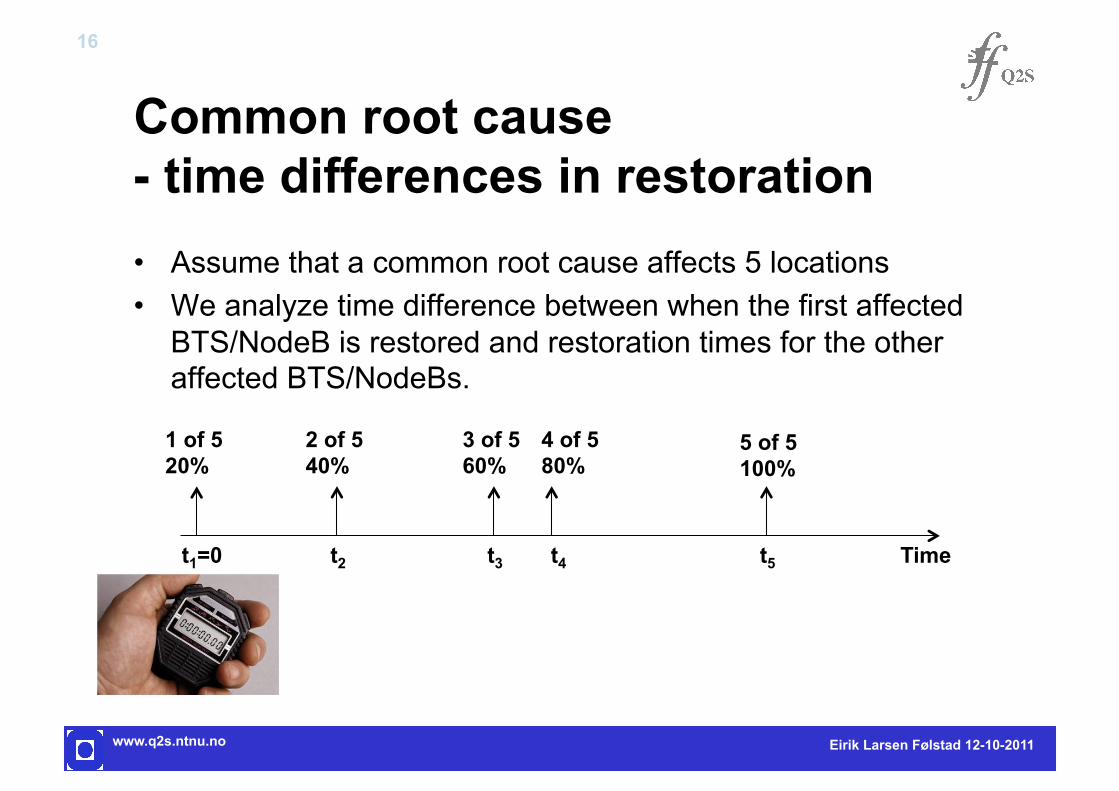
Common root cause - time differences in restoration
Eirik Larsen Følstad 12-10-2011
Time t1=0
• Assume that a common root cause affects 5 locations • We analyze time difference between when the first affected
BTS/NodeB is restored and restoration times for the other affected BTS/NodeBs.
1 of 5 20%
2 of 5 40%
3 of 5 60%
4 of 5 80%
5 of 5 100%
t2 t3 t4 t5

www.q2s.ntnu.no
17
Failures with common root cause - only included service “down”
Eirik Larsen Følstad 12-10-2011
A; 90% of the common root causes have restored 25% affected BTS/NodeB B; After 10s median climbs towards 100% C; After 100s 90% of common root cause have restored 50% affected BTS/NodeB; D; After 200s 75% have restored 50% of the BTS/NodeB. E; Expected proportion of restored BTS/NodeB after 70s is 75%.

www.q2s.ntnu.no
18
Changes - as defined by operator
Eirik Larsen Følstad 14-04-2011
• Granularity hour, given when last part of change is implemented • Week start on Sunday. • Box representing 50% IQR • Middle, mean (+), near outliers (o) and far outliers (*)
www.q2s.ntnu.no
19
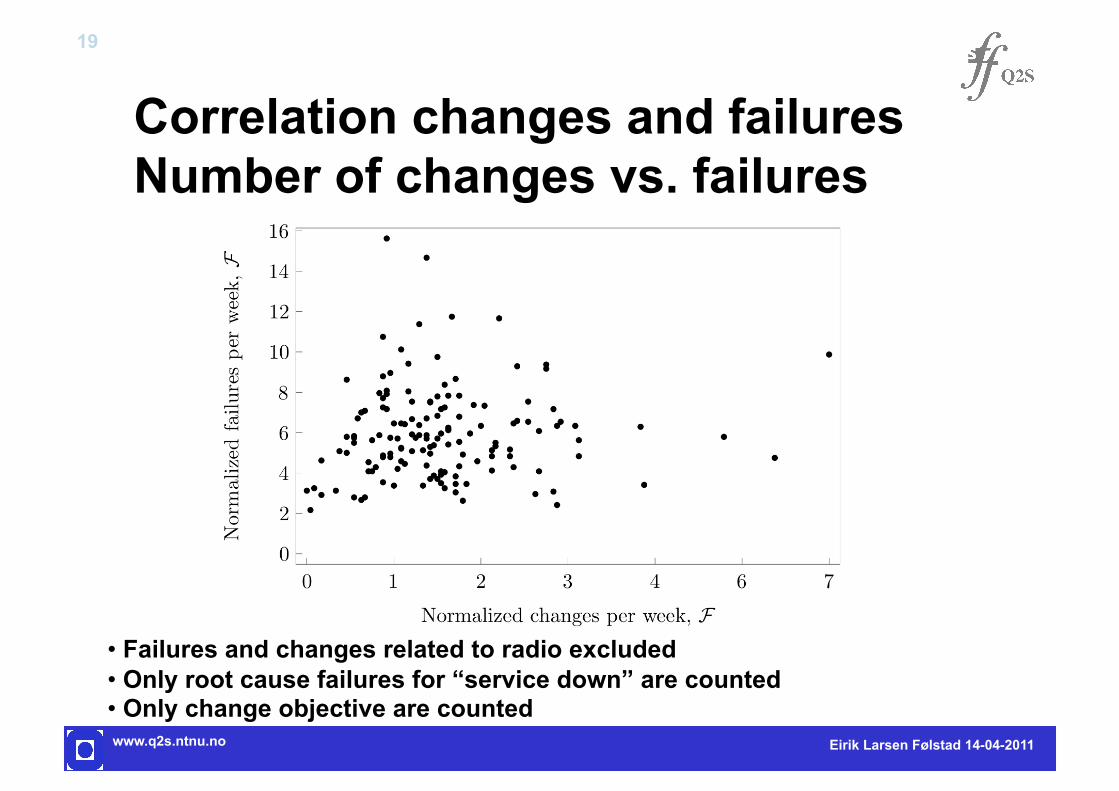
Correlation changes and failures Number of changes vs. failures
Eirik Larsen Følstad 14-04-2011
• Failures and changes related to radio excluded • Only root cause failures for “service down” are counted • Only change objective are counted

www.q2s.ntnu.no
20
Summary
• The analysis of failures categorized into operator, leased services and power related gives new insight of potential dependencies between the different operators.
• The failure intensity is provided for rural and urban areas. This provides new insight of how failures impact on the actual services offered to the customers in rural and urban areas.
• An analysis of failures with common root cause, shows that restoration times for affected services are not identical.
• The number of changes in the network is significant compared with the number of failures.
Eirik Larsen Følstad 12-10-2011