Embed Size (px)
Citation preview
Failure to Apply Signal Detection Theory to the Montreal Battery of Evaluation of AmusiaMay Misdiagnose AmusiaAuthor(s): Molly J. HenryJ. Devin McAuleySource: Music Perception: An Interdisciplinary Journal, Vol. 30, No. 5 (June 2013), pp. 480-496Published by: University of California PressStable URL: http://www.jstor.org/stable/10.1525/mp.2013.30.5.480 .
Accessed: 21/01/2015 09:55
Your use of the JSTOR archive indicates your acceptance of the Terms & Conditions of Use, available at .http://www.jstor.org/page/info/about/policies/terms.jsp
.JSTOR is a not-for-profit service that helps scholars, researchers, and students discover, use, and build upon a wide range ofcontent in a trusted digital archive. We use information technology and tools to increase productivity and facilitate new formsof scholarship. For more information about JSTOR, please contact [email protected].
.
University of California Press is collaborating with JSTOR to digitize, preserve and extend access to MusicPerception: An Interdisciplinary Journal.
http://www.jstor.org
This content downloaded from 194.95.183.252 on Wed, 21 Jan 2015 09:55:45 AMAll use subject to JSTOR Terms and Conditions

FAILU R E TO APP LY SIGNA L DET ECTIO N THEORY T O THE MONT REAL BAT TERY
OF EVALUATION O F AMUSIA MAY MISDIAGNO SE AMUSIA
MOL LY J. HENRY
Michigan State University & Bowling Green StateUniversity
J. DE V I N MCAULEY
Michigan State University
THIS ARTICLE CONSIDERS A SIGNAL DETECTION
theory (SDT) approach to evaluation of performanceon the Montreal Battery of Evaluation of Amusia(MBEA). One hundred fifty-five individuals completedthe original binary response version of the MBEA(n ¼ 62) or a confidence rating version (MBEA-C;n ¼ 93). Confidence ratings afforded construction ofempirical receiver operator characteristic (ROC) curvesand derivation of bias-free performance measuresagainst which we compared the standard performancemetric, proportion correct (PC), and an alternative sig-nal detection metric, d 0. Across the board, PC wastainted by response bias and underestimated perfor-mance as indexed by Az, a nonparametric ROC-basedperformance measure. Signal detection analyses furtherrevealed that some individuals performing worse thanthe standard PC-based cutoff for amusia diagnosisshowed large response biases. Given that PC is contam-inated by response bias, this suggests the possibility thatcategorizing individuals as having amusia or not, usinga PC-based cutoff, may inadvertently misclassify someindividuals with normal perceptual sensitivity as amusicsimply because they have large response biases. In linewith this possibility, a comparison of amusia classifica-tion using d0- and PC-based cutoffs showed potentialmisclassification of 33% of the examined cases.
Received: April 29, 2011, accepted September 30, 2012.
Key words: Montreal Battery of Evaluation of Amusia(MBEA), signal detection theory (SDT), amusia, ROCcurves, music perception
C ONGENITAL AMUSIA, OR TONE-DEAFNESS, IS
a lifelong impairment in musical ability that hasbeen primarily linked to a pitch processing def-
icit (Hyde & Peretz, 2004) that is unrelated to normalhearing acuity, general neurological functioning, or
exposure to music (Ayotte, Peretz, & Hyde, 2002). Theassessment tool that has been most widely used over thepast decade to diagnose congenital and acquired formsof amusia (Ayotte et al., 2002; Cuddy, Balkwill, Peretz, &Holden, 2005; Hyde & Peretz, 2004; Peretz et al., 2008)is the Montreal Battery of Evaluation of Amusia(MBEA; Peretz, Champod, & Hyde, 2003); for an onlineversion of the test, see http://www.brams.umontreal.ca/amusia-general/. The MBEA consists of six subtests,which assess melodic organization (Scale, Contour, andInterval), temporal organization (Rhythm and Meter),and musical memory (Memory). For four of the subt-ests (Scale, Contour, Interval, and Rhythm), listeners arepresented with pairs of melodies and asked to judgewhether the two melodies are the same or different,while for the remaining two subtests (Meter and Mem-ory), listeners are presented with a single melody oneach trial. For the Meter subtest, listeners judge whetherthe presented melody is a march or waltz, while for theMemory subtest, listeners judge whether the melody isone that they’ve heard before on the previous subtests(an old melody) or is previously unheard (a newmelody).
The tests of melodic organization differ in the type ofmelodic change that is introduced on different trials. Forthe Scale subtest, the different melody contains one notethat violates the key of the first melody, while keepingthe overall melodic contour intact. For the Contoursubtest, different melodies contain one note that violatesthe contour of the first melody in each pair withoutdisrupting the key. For the Interval subtest, the alterednote changes the pitch interval while preserving themelodic contour and key. For the Rhythm subtest,rather than a melodic change, different melodies arecreated by altering the onset time of one note so thatthe preceding and following inter-note onset intervalsare changed. For all same-different subtests, half of themelody pairs are the same and half are different. For theMeter subtest, half of the melodies are marches (identi-fied by a repeating strong-weak subjective accent pat-tern) and half are waltzes (identified by a repeatingstrong-weak-weak subjective accent pattern). For thefinal Memory subtest, half of the melodies are old andhalf are new.
Music Perception, VOLUME 30, ISSUE 5, PP. 480–496, ISSN 0730-7829, ELEC TRONIC ISSN 1533-8312. © 2013 BY THE REGENTS OF THE UNIVERSIT Y OF CALIFORNIA ALL
RIGHTS RESERVED. PLEASE DIRECT ALL REQUESTS FOR PERMISSION TO PHOTOCOPY OR REPRODUC E ARTICLE CONTENT THROUGH THE UNIVERSIT Y OF CALIFORNIA PRESS’S
RIGHTS AND PERMISSIONS WEBSITE, HT TP://WWW.UCPRESSJOURNALS.COM/REPRINTINFO.ASP. DOI: 10.1525/MP.2013.30.5.480
480 Molly J. Henry & J. Devin McAuley
This content downloaded from 194.95.183.252 on Wed, 21 Jan 2015 09:55:45 AMAll use subject to JSTOR Terms and Conditions
To assess performance on the MBEA, proportioncorrect (PC) on each of the subtests is typically averagedto produce a composite PC score; an equivalent methodis simply to sum the number of correct responses oneach of the subtests (as in, e.g., McDonald & Stewart,2008; Tillmann, Schulze, & Foxton, 2009; Williamson,McDonald, Deutsch, Griffiths, & Stewart, 2010). Thediagnostic criteria for amusia using the MBEA vary(Ayotte et al., 2002; Douglas & Bilkey, 2007; Loui, Alsop,& Schlaug, 2009), but one commonly used method is todetermine whether an individual’s composite PC or rawscore falls more than two standard deviations (SDs)below the mean score of a normative sample (Peretzet al., 2003).
The use of PC (or equivalently a raw score) as a per-formance metric for the MBEA has been shown byPeretz and colleagues (2003) to demonstrate a numberof favorable psychometric properties including approx-imate normality, test-rest reliability, and convergentvalidity. However, PC may not be the best measure toassess MBEA performance because PC, by itself, doesnot permit a distinction between listeners’ ability tohear differences between the melodies (i.e., perceptualsensitivity) and any general tendency to make oneresponse or the other (i.e., response bias). Moreover,PC decreases with increasing response bias, indepen-dent from sensitivity. Thus, as we will show below, usinga PC-based criterion on the MBEA to categorize anindividual as amusic or not (typical of many previousstudies) has the potential to misclassify non-amusicindividuals as amusic simply because they have a largeresponse bias.
To address this issue, the present article takes a signaldetection theory (SDT) approach to measuring MBEAperformance. To permit a comprehensive SDT analy-sis, we asked listeners to provide confidence ratingsrather than binary judgments. We will refer to theconfidence-rating version of the test as the MBEA-Cto distinguish it from the MBEA. The potential benefitof using confidence ratings and associated signaldetection measures to evaluate MBEA performance isthat it affords derivation of nonparametric sensitivitymeasures against which we can compare PC and d0 (analternative signal detection performance metric) toassess any potential biases in these measures. Theremainder of the introduction provides a short tutorialon SDT and its application to the MBEA and MBEA-C,followed by an overview of the present study.MATLAB code for calculation of the SDT measuresof MBEA performance is included in the Appendix,and can be downloaded from http://psychology.msu.edu/TAPlab/publications.htm.
A Signal Detection Theory (SDT) Perspectiveon the MBEA
SDT (Green & Swets, 1966) is a principled psychophys-ical approach to measuring performance that has beenapplied to a wide range of experimental tasks anddomains (Durlach & Braida, 1969; Ratcliff, McKoon,& Tindall, 1994; Rousseau, Rogeaux, & O’Mahoney,1999; Snodgrass & Corwin, 1988; Yonelinas, 1999). Ingeneral, the SDT approach assumes a decision modelthat provides a distinction between an individual’s abil-ity to discriminate between stimulus classes (i.e., sensi-tivity) and their tendency to make one response or theother (i.e., response bias). For the subtests of the MBEA,sensitivity refers to listeners’ ability to discriminatebetween same versus different melodies, march versuswaltz meters, and new versus old melodies. High sensi-tivity refers to good ability to discriminate between stim-ulus classes and low sensitivity refers to poor ability todiscriminate between stimulus classes. Bias, in contrast,refers to listeners’ general tendency to make one responseor the other (e.g., a general tendency to respond ‘‘same’’or ‘‘different’’).
Sensitivity and response bias make independent con-tributions to MBEA performance, but they cannot beseparated when PC is used as the dependent variable.Taking as an example the same-different subtests, it iscritical to understand that poor performance (asindexed by PC) can be caused by responding ‘‘same’’to different trials, responding ‘‘different’’ to same trials,or a combination of the two. Making errors of bothtypes equally often decreases sensitivity; that is, the par-ticipant is less able to discriminate between the twocategories of melodies. On the other hand, responding‘‘same’’ to different trials and not vice versa indicates thepresence of a response bias. SDT allows separation ofthese two contributions to performance.
Within SDT, the specific decision model varies withdifferent task characteristics (MacMillan & Creelman,2005), but for all of the subtests of the MBEA the deci-sion model can be conceptualized as follows. Thebrain’s response to a stimulus is assumed to be imper-fect (i.e., noisy); as a result, stimuli comprising two clas-ses form two normal distributions that vary along aninformation dimension that is used to make a decisionabout which stimulus class was presented (see Figure 1).For the subtests of the MBEA, there are two stimulusclasses associated with same versus different,1 march
1 Although the Scale, Contour, Interval, and Rhythm subtests requirea same versus different response, the task does not constitute a same-different task in strict signal detection terms. The reason is that the intact
A Signal Detection Approach to the MBEA 481
This content downloaded from 194.95.183.252 on Wed, 21 Jan 2015 09:55:45 AMAll use subject to JSTOR Terms and Conditions
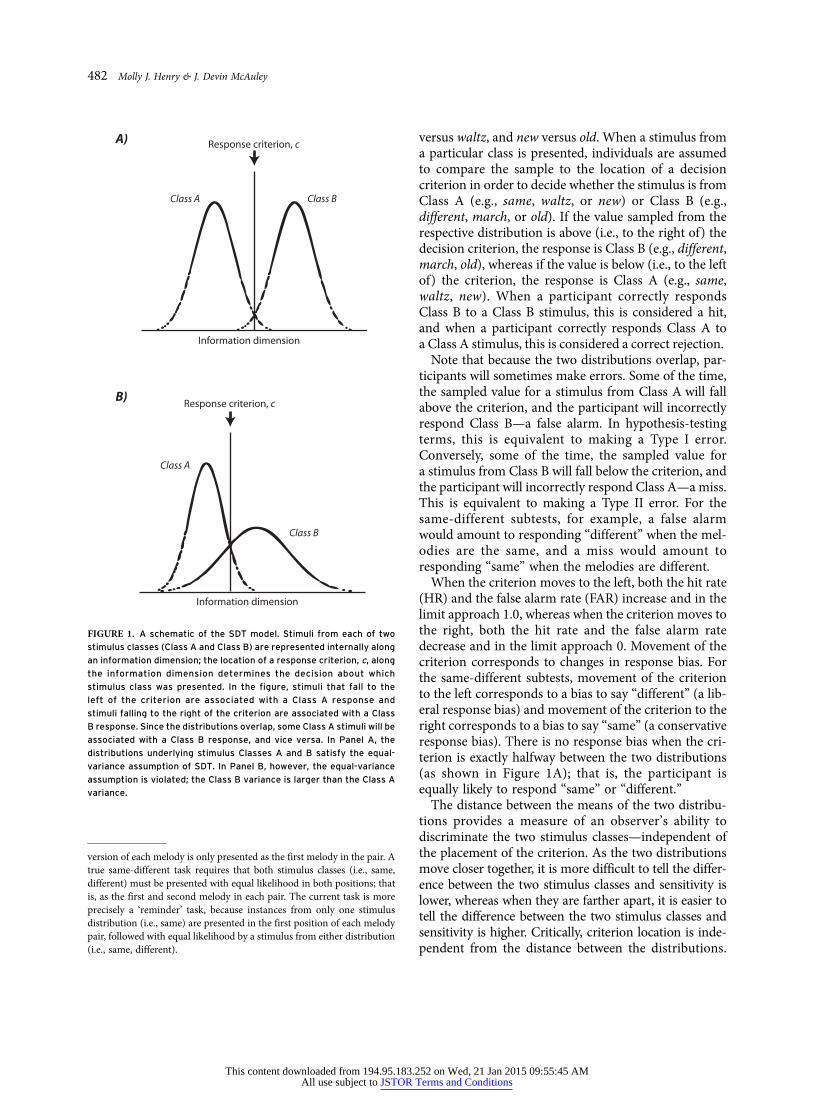
versus waltz, and new versus old. When a stimulus froma particular class is presented, individuals are assumedto compare the sample to the location of a decisioncriterion in order to decide whether the stimulus is fromClass A (e.g., same, waltz, or new) or Class B (e.g.,different, march, or old). If the value sampled from therespective distribution is above (i.e., to the right of) thedecision criterion, the response is Class B (e.g., different,march, old), whereas if the value is below (i.e., to the leftof) the criterion, the response is Class A (e.g., same,waltz, new). When a participant correctly respondsClass B to a Class B stimulus, this is considered a hit,and when a participant correctly responds Class A toa Class A stimulus, this is considered a correct rejection.
Note that because the two distributions overlap, par-ticipants will sometimes make errors. Some of the time,the sampled value for a stimulus from Class A will fallabove the criterion, and the participant will incorrectlyrespond Class B—a false alarm. In hypothesis-testingterms, this is equivalent to making a Type I error.Conversely, some of the time, the sampled value fora stimulus from Class B will fall below the criterion, andthe participant will incorrectly respond Class A—a miss.This is equivalent to making a Type II error. For thesame-different subtests, for example, a false alarmwould amount to responding ‘‘different’’ when the mel-odies are the same, and a miss would amount toresponding ‘‘same’’ when the melodies are different.
When the criterion moves to the left, both the hit rate(HR) and the false alarm rate (FAR) increase and in thelimit approach 1.0, whereas when the criterion moves tothe right, both the hit rate and the false alarm ratedecrease and in the limit approach 0. Movement of thecriterion corresponds to changes in response bias. Forthe same-different subtests, movement of the criterionto the left corresponds to a bias to say ‘‘different’’ (a lib-eral response bias) and movement of the criterion to theright corresponds to a bias to say ‘‘same’’ (a conservativeresponse bias). There is no response bias when the cri-terion is exactly halfway between the two distributions(as shown in Figure 1A); that is, the participant isequally likely to respond ‘‘same’’ or ‘‘different.’’
The distance between the means of the two distribu-tions provides a measure of an observer’s ability todiscriminate the two stimulus classes—independent ofthe placement of the criterion. As the two distributionsmove closer together, it is more difficult to tell the differ-ence between the two stimulus classes and sensitivity islower, whereas when they are farther apart, it is easier totell the difference between the two stimulus classes andsensitivity is higher. Critically, criterion location is inde-pendent from the distance between the distributions.
Information dimension
Class A Class B
Response criterion, c A)
B)
Information dimension
Class A
Class B
Response criterion, c
FIGURE 1. A schematic of the SDT model. Stimuli from each of two
stimulus classes (Class A and Class B) are represented internally along
an information dimension; the location of a response criterion, c, along
the information dimension determines the decision about which
stimulus class was presented. In the figure, stimuli that fall to the
left of the criterion are associated with a Class A response and
stimuli falling to the right of the criterion are associated with a Class
B response. Since the distributions overlap, some Class A stimuli will be
associated with a Class B response, and vice versa. In Panel A, the
distributions underlying stimulus Classes A and B satisfy the equal-
variance assumption of SDT. In Panel B, however, the equal-variance
assumption is violated; the Class B variance is larger than the Class A
variance.
version of each melody is only presented as the first melody in the pair. Atrue same-different task requires that both stimulus classes (i.e., same,different) must be presented with equal likelihood in both positions; thatis, as the first and second melody in each pair. The current task is moreprecisely a ‘reminder’ task, because instances from only one stimulusdistribution (i.e., same) are presented in the first position of each melodypair, followed with equal likelihood by a stimulus from either distribution(i.e., same, different).
482 Molly J. Henry & J. Devin McAuley
This content downloaded from 194.95.183.252 on Wed, 21 Jan 2015 09:55:45 AMAll use subject to JSTOR Terms and Conditions
An important feature of the basic signal detection modelis that the information axis is typically represented instandardized (z-score) units. This allows for both theplacement of the criterion and the separation of thetwo distributions to be measured in units of standarddeviation, which are comparable across tasks andconditions.
Perceptual sensitivity (d0) and criterion location (c)can be calculated for each participant and subtest usingthe proportion of hits (HR) and the proportion of falsealarms (FAR). Sensitivity, d 0, is determined by z(HR) –z(FAR), and the criterion location, c, is determined by�0.5*[z(HR) þ z(FAR)]. Since both d0 and c are mea-sured in standard deviation units (i.e., z-scores), animportant assumption of the basic SDT approach isthat the two distributions have equal variance (as inFigure 1A). Otherwise (see Figure 1B), estimates ofd0 and c would depend on whether they were calculatedwith respect to the standard deviation of StimulusClass A or the standard deviation of Stimulus ClassB. Critically, d0 and c only represent independent per-formance measures if the equal-variance assumption issatisfied. When this assumption is violated, d0 is nolonger independent of response bias, and instead varieswith c.
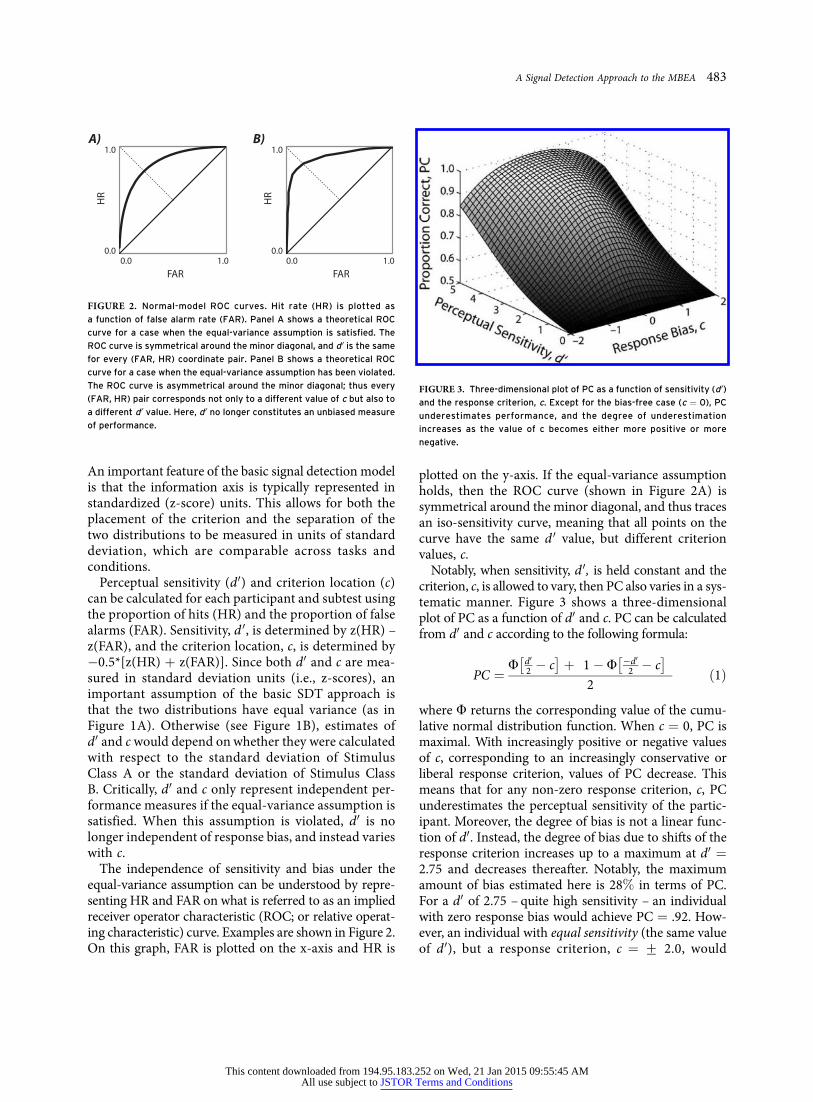
The independence of sensitivity and bias under theequal-variance assumption can be understood by repre-senting HR and FAR on what is referred to as an impliedreceiver operator characteristic (ROC; or relative operat-ing characteristic) curve. Examples are shown in Figure 2.On this graph, FAR is plotted on the x-axis and HR is
plotted on the y-axis. If the equal-variance assumptionholds, then the ROC curve (shown in Figure 2A) issymmetrical around the minor diagonal, and thus tracesan iso-sensitivity curve, meaning that all points on thecurve have the same d 0 value, but different criterionvalues, c.
Notably, when sensitivity, d 0, is held constant and thecriterion, c, is allowed to vary, then PC also varies in a sys-tematic manner. Figure 3 shows a three-dimensionalplot of PC as a function of d0 and c. PC can be calculatedfrom d0 and c according to the following formula:
PC ¼F d0
2 � c� �
þ 1� F �d02 � c
� �� �
2ð1Þ
where F returns the corresponding value of the cumu-lative normal distribution function. When c ¼ 0, PC ismaximal. With increasingly positive or negative valuesof c, corresponding to an increasingly conservative orliberal response criterion, values of PC decrease. Thismeans that for any non-zero response criterion, c, PCunderestimates the perceptual sensitivity of the partic-ipant. Moreover, the degree of bias is not a linear func-tion of d0. Instead, the degree of bias due to shifts of theresponse criterion increases up to a maximum at d0 ¼2.75 and decreases thereafter. Notably, the maximumamount of bias estimated here is 28% in terms of PC.For a d0 of 2.75 – quite high sensitivity – an individualwith zero response bias would achieve PC ¼ .92. How-ever, an individual with equal sensitivity (the same valueof d 0), but a response criterion, c ¼ + 2.0, would
FAR
HR
0.00.0
1.0
1.0A) B)
HR
0.0
1.0
FAR0.0 1.0
FIGURE 2. Normal-model ROC curves. Hit rate (HR) is plotted as
a function of false alarm rate (FAR). Panel A shows a theoretical ROC
curve for a case when the equal-variance assumption is satisfied. The
ROC curve is symmetrical around the minor diagonal, and d0 is the same
for every (FAR, HR) coordinate pair. Panel B shows a theoretical ROC
curve for a case when the equal-variance assumption has been violated.
The ROC curve is asymmetrical around the minor diagonal; thus every
(FAR, HR) pair corresponds not only to a different value of c but also to
a different d0 value. Here, d0 no longer constitutes an unbiased measure
of performance.
FIGURE 3. Three-dimensional plot of PC as a function of sensitivity (d0)
and the response criterion, c. Except for the bias-free case (c ¼ 0), PC
underestimates performance, and the degree of underestimation
increases as the value of c becomes either more positive or more
negative.
A Signal Detection Approach to the MBEA 483
This content downloaded from 194.95.183.252 on Wed, 21 Jan 2015 09:55:45 AMAll use subject to JSTOR Terms and Conditions
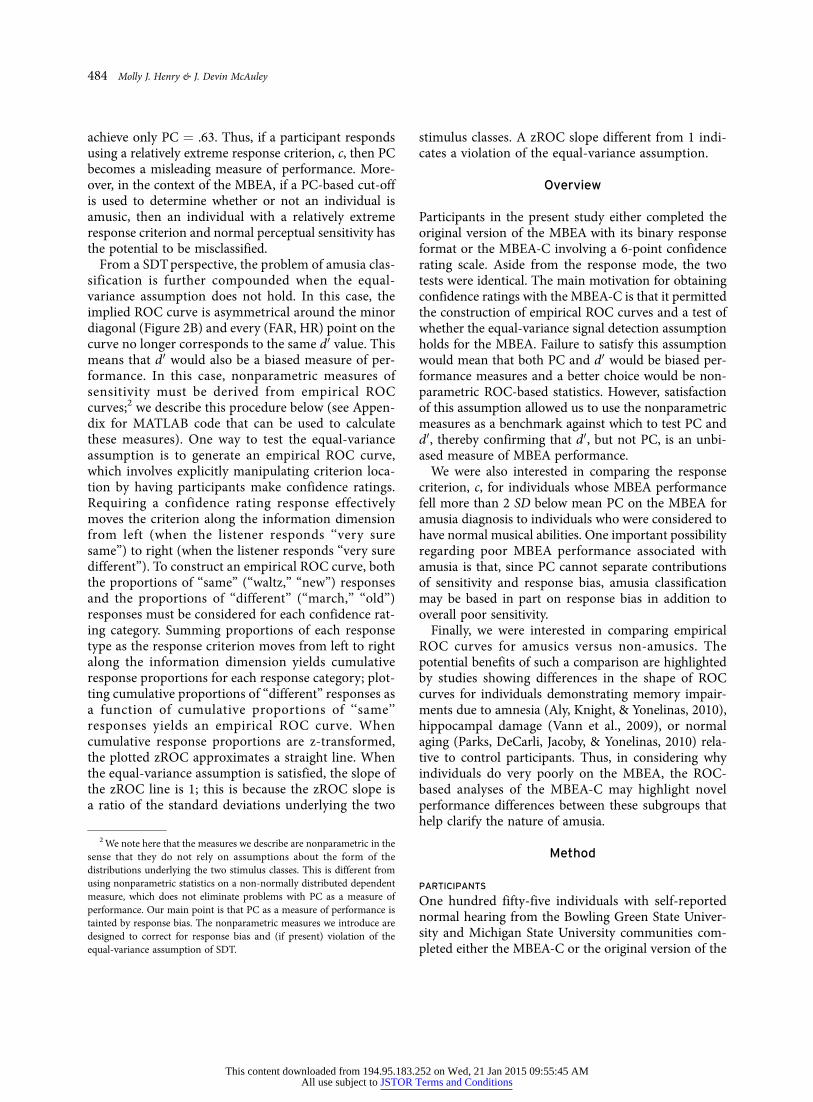
achieve only PC ¼ .63. Thus, if a participant respondsusing a relatively extreme response criterion, c, then PCbecomes a misleading measure of performance. More-over, in the context of the MBEA, if a PC-based cut-offis used to determine whether or not an individual isamusic, then an individual with a relatively extremeresponse criterion and normal perceptual sensitivity hasthe potential to be misclassified.
From a SDT perspective, the problem of amusia clas-sification is further compounded when the equal-variance assumption does not hold. In this case, theimplied ROC curve is asymmetrical around the minordiagonal (Figure 2B) and every (FAR, HR) point on thecurve no longer corresponds to the same d0 value. Thismeans that d0 would also be a biased measure of per-formance. In this case, nonparametric measures ofsensitivity must be derived from empirical ROCcurves;2 we describe this procedure below (see Appen-dix for MATLAB code that can be used to calculatethese measures). One way to test the equal-varianceassumption is to generate an empirical ROC curve,which involves explicitly manipulating criterion loca-tion by having participants make confidence ratings.Requiring a confidence rating response effectivelymoves the criterion along the information dimensionfrom left (when the listener responds ‘‘very suresame’’) to right (when the listener responds ‘‘very suredifferent’’). To construct an empirical ROC curve, boththe proportions of ‘‘same’’ (‘‘waltz,’’ ‘‘new’’) responsesand the proportions of ‘‘different’’ (‘‘march,’’ ‘‘old’’)responses must be considered for each confidence rat-ing category. Summing proportions of each responsetype as the response criterion moves from left to rightalong the information dimension yields cumulativeresponse proportions for each response category; plot-ting cumulative proportions of ‘‘different’’ responses asa function of cumulative proportions of ‘‘same’’responses yields an empirical ROC curve. Whencumulative response proportions are z-transformed,the plotted zROC approximates a straight line. Whenthe equal-variance assumption is satisfied, the slope ofthe zROC line is 1; this is because the zROC slope isa ratio of the standard deviations underlying the two
stimulus classes. A zROC slope different from 1 indi-cates a violation of the equal-variance assumption.
Overview
Participants in the present study either completed theoriginal version of the MBEA with its binary responseformat or the MBEA-C involving a 6-point confidencerating scale. Aside from the response mode, the twotests were identical. The main motivation for obtainingconfidence ratings with the MBEA-C is that it permittedthe construction of empirical ROC curves and a test ofwhether the equal-variance signal detection assumptionholds for the MBEA. Failure to satisfy this assumptionwould mean that both PC and d0 would be biased per-formance measures and a better choice would be non-parametric ROC-based statistics. However, satisfactionof this assumption allowed us to use the nonparametricmeasures as a benchmark against which to test PC andd0, thereby confirming that d0, but not PC, is an unbi-ased measure of MBEA performance.
We were also interested in comparing the responsecriterion, c, for individuals whose MBEA performancefell more than 2 SD below mean PC on the MBEA foramusia diagnosis to individuals who were considered tohave normal musical abilities. One important possibilityregarding poor MBEA performance associated withamusia is that, since PC cannot separate contributionsof sensitivity and response bias, amusia classificationmay be based in part on response bias in addition tooverall poor sensitivity.
Finally, we were interested in comparing empiricalROC curves for amusics versus non-amusics. Thepotential benefits of such a comparison are highlightedby studies showing differences in the shape of ROCcurves for individuals demonstrating memory impair-ments due to amnesia (Aly, Knight, & Yonelinas, 2010),hippocampal damage (Vann et al., 2009), or normalaging (Parks, DeCarli, Jacoby, & Yonelinas, 2010) rela-tive to control participants. Thus, in considering whyindividuals do very poorly on the MBEA, the ROC-based analyses of the MBEA-C may highlight novelperformance differences between these subgroups thathelp clarify the nature of amusia.
Method
PARTICIPANTS
One hundred fifty-five individuals with self-reportednormal hearing from the Bowling Green State Univer-sity and Michigan State University communities com-pleted either the MBEA-C or the original version of the
2 We note here that the measures we describe are nonparametric in thesense that they do not rely on assumptions about the form of thedistributions underlying the two stimulus classes. This is different fromusing nonparametric statistics on a non-normally distributed dependentmeasure, which does not eliminate problems with PC as a measure ofperformance. Our main point is that PC as a measure of performance istainted by response bias. The nonparametric measures we introduce aredesigned to correct for response bias and (if present) violation of theequal-variance assumption of SDT.
484 Molly J. Henry & J. Devin McAuley
This content downloaded from 194.95.183.252 on Wed, 21 Jan 2015 09:55:45 AMAll use subject to JSTOR Terms and Conditions
MBEA in exchange for course credit or a cash paymentof $10/hr. Ninety-three individuals (68 female) com-pleted the MBEA-C (age, M ¼ 20.6 yrs, SD ¼ 3.3 yrs;education, M ¼ 15.2 yrs, SD ¼ 2.4 yrs; formal musictraining, M ¼ 4.2 yrs, SD ¼ 4.0 yrs). Sixty-two indivi-duals (39 female) completed the original version ofthe MBEA (age, M ¼ 20.4 yrs, SD ¼ 3.3 yrs; education,M ¼ 14.5 yrs, SD ¼ 1.8 yrs; formal music training,M ¼ 3.9 yrs, SD ¼ 4.3 yrs). Demographic informationfor all participants is summarized in Table 1. The twoparticipant groups did not differ in terms of age(p ¼ .73) or years of music training (p ¼ .66), but weremarginally different with respect to years of education(p ¼ .06), with the sample completing the MBEA-C hav-ing on average slightly more education (MBEA: M¼ 14.5years, SD ¼ 1.8; MBEA-C: M ¼ 15.2 years, SD ¼ 2.4).
STIMULI, EQUIPMENT, AND PROCEDURE
The original MBEA and MBEA-C consist of thirtynovel melodies plus fifteen additional melodies thatserve as new melodies on the Memory subtest (Peretzet al., 2003). Each same-different subtest also includesone catch trial where the difference between melodiesis very obvious; catch trials were included to ensurethat participants were attending to the task. Mean mel-ody duration is 5.1 s for the melodies presented in theScale, Contour, Interval, Rhythm, and Memory subt-ests and 11 s for the melodies presented in the Metersubtest. Melodies comprising the Meter subtest alsoincluded an accompaniment that emphasized therepeating strong-weak-strong-weak or strong-weak-weak-strong-weak-weak accent patterns associatedwith marches and waltzes, respectively. For the Scale,Contour, Interval, and Rhythm subtests, participantsheard a pair of melodies on each trial and then ratedhow confident they were that the two melodies in eachpair were the same or different on a scale ranging from‘‘1’’ (‘‘sure same’’) to ‘‘6’’ (‘‘sure different’’); participants
completing the original version of the MBEA, simplyresponded ‘‘same’’ or ‘‘different.’’ For all same-differentsubtests, half of the melody pairs were the same andhalf were different. For the Scale subtest, different mel-odies contain one note that violates the key of theintact version of the melody, while keeping the overallmelodic contour intact. For the Contour subtest, dif-ferent melodies contain one note that violates the con-tour of the intact melody in each pair withoutdisrupting the key. For the Interval subtest, the alterednote changes the pitch interval while preserving themelodic contour and key. For the Rhythm subtest,rather than a melodic change, different melodies arecreated by shifting the temporal location of one note sothat the preceding and following inter-note onsetintervals are altered.
For the Meter subtest, a single melody was presentedon each trial and participants were asked to rate theextent to which they were confident that the melodywas a march or waltz on a scale ranging from ‘‘1’’(‘‘sure march’’) to ‘‘6’’ ( ‘‘sure waltz’’); participantscompleting the original version of the MBEA simplyresponded ‘‘march’’ or ‘‘waltz.’’ Prior to completing theMeter subtest, participants were told that marchessound like groups of two, with an alternating strong-weak-strong-weak accent pattern, and waltzes soundlike groups of three, with a strong-weak-weak-strong-weak-weak accent pattern. They then heard examplesof a march and a waltz and completed four trainingtrials with feedback. Half of the melodies on the Metersubtest were marches and half were waltzes.
For the final Memory subtest, 15 old and 15 newmelodies were presented; old melodies had been heardpreviously in the earlier subtests, while new melodieshad not been heard previously, but had similar charac-teristics to the old melodies. Participants completing theMBEA-C rated the familiarity of the melody on a scaleranging from ‘‘1’’ (‘‘sure new’’) to ‘‘6’’ (‘‘sure old’’); par-ticipants completing the original version of the MBEAsimply responded ‘‘new’’ or ‘‘old.’’
Both the MBEA-C and original version of the MBEAwere adapted to be administered using E-Prime soft-ware (Psychology Software Tools, Inc.) running ina Microsoft Windows environment on a Dell Optiplexcomputer. All stimuli were presented at a comfortablevolume (*70 dB) over Sennheiser HD280 head-phones. Subtests were presented in the followingorder: Scale, Contour, Interval, Rhythm, Meter, andMemory. This order of subtest presentation is the sameas in Peretz et al. (2003). Following administration ofthe MBEA-C or original version of the MBEA, listenersfilled out several surveys that included questions about
TABLE 1. Demographic Information for the Participants CompletingBoth the Original Version of the MBEA with Binary Eesponses andthe MBEA-C Involving Confidence Rating Responses.
MBEA-C MBEA
n (female) 93 (68) 62 (39)Age (years + SD) 20.6 (3.3) 20.4 (3.3)Education (years + SD) 15.2 (2.4) 14.5 (1.8)Music Training (years + SD) 4.2 (4.0) 3.9 (4.3)
Note: Aside from the response mode, the two versions were otherwise identical.Sample size (n) is shown with the number of female participants in parentheses,while mean age, education, and music training (all given in years) are shown withstandard deviation (SD) in parentheses.
A Signal Detection Approach to the MBEA 485
This content downloaded from 194.95.183.252 on Wed, 21 Jan 2015 09:55:45 AMAll use subject to JSTOR Terms and Conditions

participant age, gender, music training, and level ofeducation. Overall, the battery and additional surveystook between 60 and 90 min to administer.
DATA ANALYSIS
First, catch trials were removed from the analysis; allparticipants performed 100% correct on catch trials. Topermit a comparison between the MBEA-C and originalversion of the MBEA, confidence ratings for the MBEA-Cwere collapsed into binary response categories; ratingsof ‘‘1,’’ ‘‘2,’’ and ‘‘3’’ were coded as ‘‘same,’’ ‘‘march,’’ or‘‘new’’ responses (depending on the subtest), whileratings of ‘‘4,’’ ‘‘5,’’ and ‘‘6’’ were coded as ‘‘different,’’‘‘waltz,’’ or ‘‘old.’’ Then, binary response proportionswere used to calculate PC, d0, and c for participantscompleting the MBEA-C and original version of theMBEA. PC was taken as the proportion of correctresponses out of 30 trials on each subtest; d0 and cwere calculated according to the following standardformulas:
d0 ¼ zðHRÞ � zðFARÞ ð2Þ
c ¼ �1=2½zðHRÞ þ zðFARÞ� ð3ÞHits were defined as the proportions of ‘‘different,’’‘‘march,’’ or ‘‘old’’ responses given for different, march,or old trials, respectively, and false alarms were definedas the proportions of ‘‘different,’’ ‘‘march,’’ or ‘‘old’’responses given for same, waltz, or new trials, respec-tively. For all subtests, values of d0 equal to 0 correspondto chance performance, and larger values of d0 corre-spond to increased perceptual sensitivity and betterperformance. For all but the Meter subtest, negativevalues of c can be interpreted as a liberal response strat-egy (i.e., a tendency to respond ‘‘different’’ or ‘‘old’’)whereas positive values of c can be interpreted as a con-servative response strategy (i.e., a tendency to respond‘‘same’’ or ‘‘new’’). Values of c ¼ 0 indicate no responsebias. We note here that the value of c for the Metersubtest does not meaningfully align with either a liberalor conservative response strategy, but rather reflectsa tendency to respond ‘‘march’’ or ‘‘waltz,’’ respectively.
Confidence ratings for participants completing theMBEA-C were then used to construct empirical ROCcurves for each subtest. When an individual respondsusing the extremes on the rating scale (e.g., ‘‘very suresame’’ and ‘‘very sure different’’) without making use ofthe middle of the scale (i.e., they fail to make use of thefull rating scale), it is not possible to construct empiricalROC curves for that individual. This is especially likelyfor participants who perform extremely well on the
MBEA. Thus, for the current study, we aggregated dataover small numbers of participants (n ¼ 4) and itera-tively constructed empirical ROC curves based on aver-age data in the following manner. First, we randomlyselected data for four participants. We chose fourbecause this was the number of amusic participants inour MBEA-C sample (see below), and we wanted tomatch sample sizes when comparing amusic and non-amusic individuals. Then, we calculated proportions of‘‘different’’/‘‘march’’/‘‘old’’ responses and ‘‘same’’/‘‘waltz’’/‘‘new’’ responses for each rating category aver-aged over the four randomly selected participants andused these values to construct ROC curves by plottingcumulative response proportions as described in theIntroduction. Next, we z-transformed the cumulativeresponse proportions to create zROCs, correcting forproportions of 0 and 1 using 1/2N and 1 – 1/2N, respec-tively, where N ¼ 15 trials (Macmillan & Creelman,2005).
Several dependent measures were then derived fromthe empirical ROCs. First, the slope, s, of the zROCs foreach subtest is given by:
s ¼ d02=d01 ð4Þ
where, theoretically, d01 corresponds to the horizontaldistance from the zROC to the major diagonal at thepoint where z(HR) ¼ 0, and d02 corresponds to thevertical distance from the zROC to the major diagonalwhere z(FAR) ¼ 0. Practically, s is estimated from thebest-fit regression line through the zROC data points.The values d01 and d02 depend on the standard devia-tions of the distributions underlying the stimulus classesfor a given subtest. The slope of the zROC, s, gives theratio of the standard deviations of the distributionsunderlying the two stimulus classes; thus, when thestandard deviations of the two distributions are equal,s ¼ 1, and d0 is an accurate measure of perceptual sen-sitivity. When, s 6¼ 1, a more appropriate measure ofperceptual sensitivity is da, which corrects for violationof the equal-variance assumption:
da ¼ 2= 1þ s2� �� �1=2� z HRð Þ � s � z FARð Þ½ � ð5Þ
The measure da is given in units of root-mean-squarestandard deviation for the two stimulus classes. We alsocalculated Az, which corresponds to the area under thenormal-model ROC and increases from .5 at zero sen-sitivity (i.e., chance) to 1.0 for perfect performance. Az isa nonparametric performance measure, corrected fornon-unit slope zROCs and response bias, and can becompared to PC:
486 Molly J. Henry & J. Devin McAuley
This content downloaded from 194.95.183.252 on Wed, 21 Jan 2015 09:55:45 AMAll use subject to JSTOR Terms and Conditions
Az ¼ F da=p
2ð Þ ð6Þ
On each of 10,000 iterations, we estimated s, da, and Az
as described above. These estimates formed a samplingdistribution from which we estimated a test statistic foreach dependent variable (Ernst, 2004).
Results
COMPARISON OF THE MBEA-C TO THE MBEA
We first compared performance on the MBEA for thetwo response modes. Table 2 summarizes performanceon the MBEA-C and the original version of the MBEAfor PC, d0, and c for each subtest and combined acrosssubtests. Overall performance on the MBEA-C wasslightly better than performance on the MBEA for bothPC (.84 + 0.01 versus .80 + .01, t(153) ¼ �2.52,p < .05, Cohen’s d ¼ 2.43) and d0 (2.00 + 0.09 versus2.24 + 0.07, t(153)¼�2.30, p < .05, Cohen’s d¼ 2.23).In contrast, no differences were observed in responsecriterion, c, for the two versions of the test (MBEA-C:c¼ 0.02 + 0.02; MBEA: c¼ 0.04 + 0.04, t(153)¼ 0.44,p ¼ .66, Cohen’s d ¼ 0.45). To explore the slight per-formance advantage on the MBEA-C further, we com-pared performance on the MBEA-C and the MBEA foreach subtest by conducting separate families ofBonferroni-corrected independent-samples t-tests(per-comparison a ¼ .017). For both PC and d0, perfor-mance on the Rhythm and Meter subtests was signifi-cantly better on the MBEA-C than on the MBEA (PC,Rhythm: t(153)¼�2.52, p¼ .01, Cohen’s d¼ 2.63; PC,Meter: t(153) ¼ �2.91, p ¼ 0.004, Cohen’s d ¼ 2.55; d0,Rhythm: t(153)¼�2.63, p¼ .009, Cohen’s d¼ 2.57; d0,Meter: t(153) ¼ 2.74, p ¼ .007, Cohen’s d ¼ 2.63), but
did not differ for any of the other subtests. This sug-gests that the slight performance advantage observedfor the MBEA-C compared to the original MBEA wasdriven by the Rhythm and Meter subtests only. Explor-atory analyses of these subtest differences revealed thatperformance on the Rhythm subtest correlated signif-icantly with years of education (PC: r(141) ¼ .18,p ¼ .03, d 0: r(141) ¼ .18, p ¼ .03), and when thisvariable was included as a covariate, the differencebetween the MBEA and the MBEA-C on the Rhythmsubtest did not reach statistical significance with a cor-rected a-level (PC: p¼ .04, d0: p¼ .03). Including yearsof education as a covariate did not influence results forthe Meter subtest.
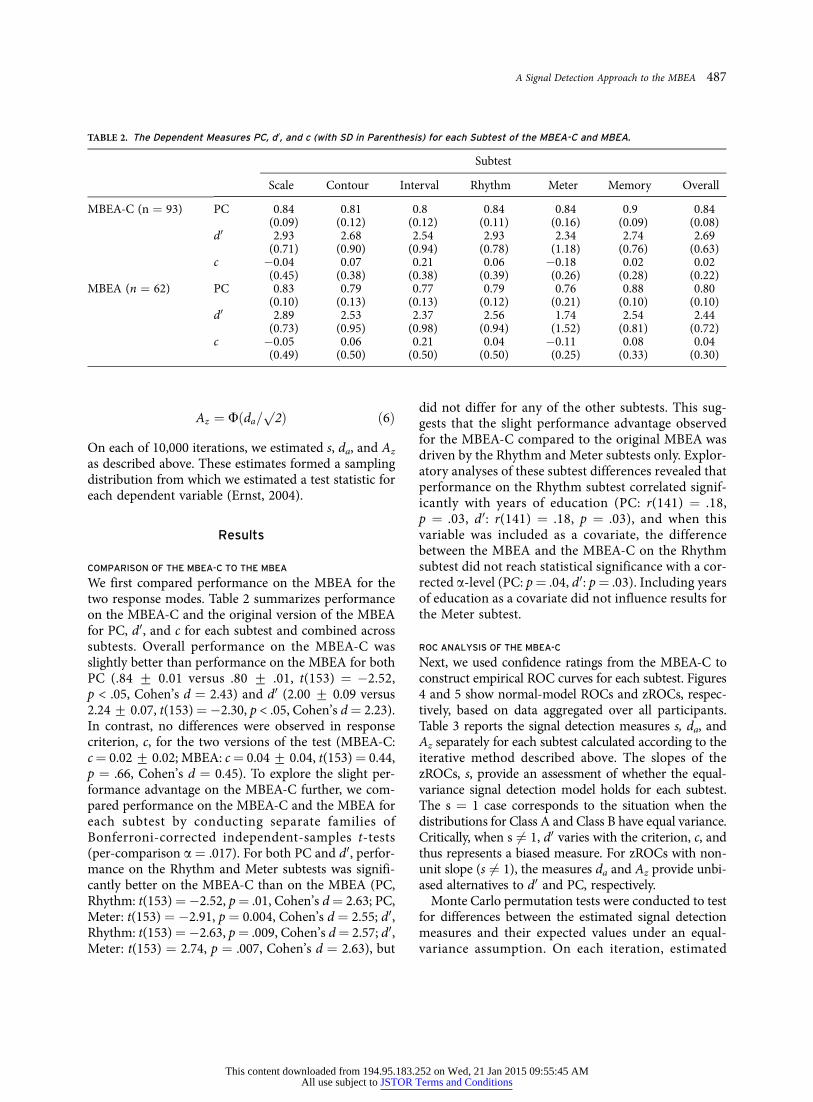
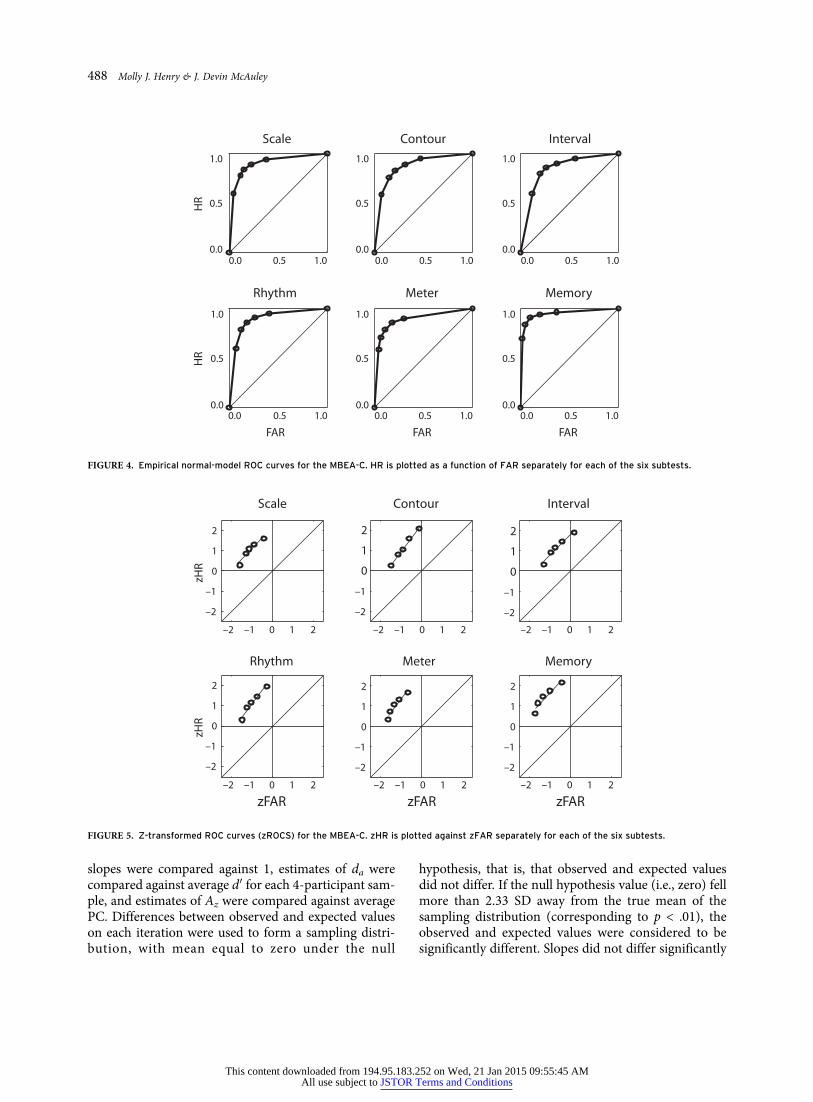
ROC ANALYSIS OF THE MBEA-C
Next, we used confidence ratings from the MBEA-C toconstruct empirical ROC curves for each subtest. Figures4 and 5 show normal-model ROCs and zROCs, respec-tively, based on data aggregated over all participants.Table 3 reports the signal detection measures s, da, andAz separately for each subtest calculated according to theiterative method described above. The slopes of thezROCs, s, provide an assessment of whether the equal-variance signal detection model holds for each subtest.The s ¼ 1 case corresponds to the situation when thedistributions for Class A and Class B have equal variance.Critically, when s 6¼ 1, d0 varies with the criterion, c, andthus represents a biased measure. For zROCs with non-unit slope (s 6¼ 1), the measures da and Az provide unbi-ased alternatives to d0 and PC, respectively.
Monte Carlo permutation tests were conducted to testfor differences between the estimated signal detectionmeasures and their expected values under an equal-variance assumption. On each iteration, estimated
TABLE 2. The Dependent Measures PC, d0, and c (with SD in Parenthesis) for each Subtest of the MBEA-C and MBEA.
Subtest
Scale Contour Interval Rhythm Meter Memory Overall
MBEA-C (n ¼ 93) PC 0.84 0.81 0.8 0.84 0.84 0.9 0.84(0.09) (0.12) (0.12) (0.11) (0.16) (0.09) (0.08)
d0 2.93 2.68 2.54 2.93 2.34 2.74 2.69(0.71) (0.90) (0.94) (0.78) (1.18) (0.76) (0.63)
c �0.04 0.07 0.21 0.06 �0.18 0.02 0.02(0.45) (0.38) (0.38) (0.39) (0.26) (0.28) (0.22)
MBEA (n ¼ 62) PC 0.83 0.79 0.77 0.79 0.76 0.88 0.80(0.10) (0.13) (0.13) (0.12) (0.21) (0.10) (0.10)
d0 2.89 2.53 2.37 2.56 1.74 2.54 2.44(0.73) (0.95) (0.98) (0.94) (1.52) (0.81) (0.72)
c �0.05 0.06 0.21 0.04 �0.11 0.08 0.04(0.49) (0.50) (0.50) (0.50) (0.25) (0.33) (0.30)
A Signal Detection Approach to the MBEA 487
This content downloaded from 194.95.183.252 on Wed, 21 Jan 2015 09:55:45 AMAll use subject to JSTOR Terms and Conditions
slopes were compared against 1, estimates of da werecompared against average d0 for each 4-participant sam-ple, and estimates of Az were compared against averagePC. Differences between observed and expected valueson each iteration were used to form a sampling distri-bution, with mean equal to zero under the null
hypothesis, that is, that observed and expected valuesdid not differ. If the null hypothesis value (i.e., zero) fellmore than 2.33 SD away from the true mean of thesampling distribution (corresponding to p < .01), theobserved and expected values were considered to besignificantly different. Slopes did not differ significantly
1.0 1.0 1.0
1.01.01.0
0.5
0.0
0.5
0.0
0.5
0.0
0.5
0.0
0.5
0.0
0.5
0.00.0 0.5 1.0 0.0 0.5 1.0 0.0 0.5 1.0
0.0 0.5 1.00.0 0.5 1.00.0 0.5 1.0
HR
HR
FAR FAR FAR
Scale Contour Interval
Rhythm Meter Memory
FIGURE 4. Empirical normal-model ROC curves for the MBEA-C. HR is plotted as a function of FAR separately for each of the six subtests.
2
1
0
–1
–2
2
1
0
–1
–2
2
1
0
–1
–2
2
1
0
–1
–2
2
1
0
–1
–2
2
1
0
–1
–2
–2 –1 0 1 2 –2 –1 0 1 2 –2 –1 0 1 2
–2 –1 0 1 2–2 –1 0 1 2–2 –1 0 1 2
zFAR zFAR zFAR
zHR
zHR
Scale Contour Interval
Rhythm Meter Memory
FIGURE 5. Z-transformed ROC curves (zROCS) for the MBEA-C. zHR is plotted against zFAR separately for each of the six subtests.
488 Molly J. Henry & J. Devin McAuley
This content downloaded from 194.95.183.252 on Wed, 21 Jan 2015 09:55:45 AMAll use subject to JSTOR Terms and Conditions
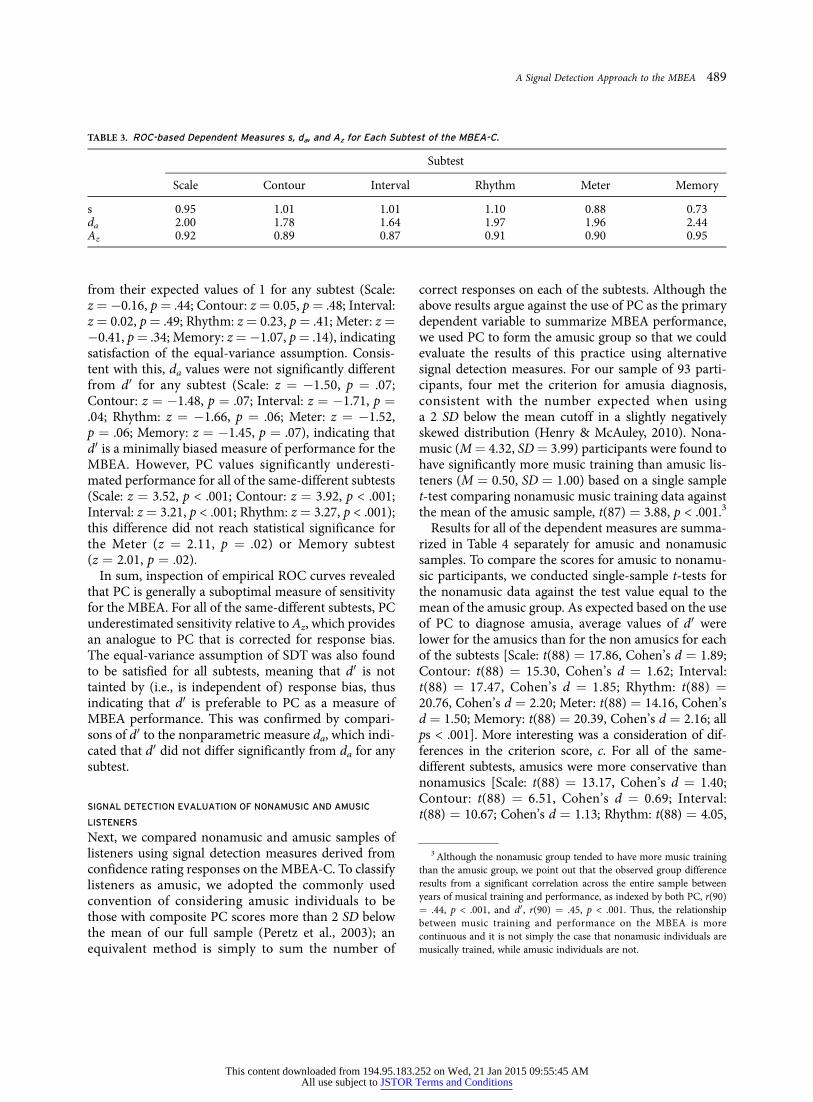
from their expected values of 1 for any subtest (Scale:z¼ �0.16, p ¼ .44; Contour: z ¼ 0.05, p¼ .48; Interval:z ¼ 0.02, p ¼ .49; Rhythm: z ¼ 0.23, p ¼ .41; Meter: z ¼�0.41, p¼ .34; Memory: z¼�1.07, p¼ .14), indicatingsatisfaction of the equal-variance assumption. Consis-tent with this, da values were not significantly differentfrom d0 for any subtest (Scale: z ¼ �1.50, p ¼ .07;Contour: z ¼ �1.48, p ¼ .07; Interval: z ¼ �1.71, p ¼.04; Rhythm: z ¼ �1.66, p ¼ .06; Meter: z ¼ �1.52,p ¼ .06; Memory: z ¼ �1.45, p ¼ .07), indicating thatd0 is a minimally biased measure of performance for theMBEA. However, PC values significantly underesti-mated performance for all of the same-different subtests(Scale: z ¼ 3.52, p < .001; Contour: z ¼ 3.92, p < .001;Interval: z ¼ 3.21, p < .001; Rhythm: z ¼ 3.27, p < .001);this difference did not reach statistical significance forthe Meter (z ¼ 2.11, p ¼ .02) or Memory subtest(z ¼ 2.01, p ¼ .02).
In sum, inspection of empirical ROC curves revealedthat PC is generally a suboptimal measure of sensitivityfor the MBEA. For all of the same-different subtests, PCunderestimated sensitivity relative to Az, which providesan analogue to PC that is corrected for response bias.The equal-variance assumption of SDT was also foundto be satisfied for all subtests, meaning that d0 is nottainted by (i.e., is independent of) response bias, thusindicating that d0 is preferable to PC as a measure ofMBEA performance. This was confirmed by compari-sons of d0 to the nonparametric measure da, which indi-cated that d0 did not differ significantly from da for anysubtest.
SIGNAL DETECTION EVALUATION OF NONAMUSIC AND AMUSIC
LISTENERS
Next, we compared nonamusic and amusic samples oflisteners using signal detection measures derived fromconfidence rating responses on the MBEA-C. To classifylisteners as amusic, we adopted the commonly usedconvention of considering amusic individuals to bethose with composite PC scores more than 2 SD belowthe mean of our full sample (Peretz et al., 2003); anequivalent method is simply to sum the number of
correct responses on each of the subtests. Although theabove results argue against the use of PC as the primarydependent variable to summarize MBEA performance,we used PC to form the amusic group so that we couldevaluate the results of this practice using alternativesignal detection measures. For our sample of 93 parti-cipants, four met the criterion for amusia diagnosis,consistent with the number expected when usinga 2 SD below the mean cutoff in a slightly negativelyskewed distribution (Henry & McAuley, 2010). Nona-music (M¼ 4.32, SD¼ 3.99) participants were found tohave significantly more music training than amusic lis-teners (M ¼ 0.50, SD ¼ 1.00) based on a single samplet-test comparing nonamusic music training data againstthe mean of the amusic sample, t(87) ¼ 3.88, p < .001.3
Results for all of the dependent measures are summa-rized in Table 4 separately for amusic and nonamusicsamples. To compare the scores for amusic to nonamu-sic participants, we conducted single-sample t-tests forthe nonamusic data against the test value equal to themean of the amusic group. As expected based on the useof PC to diagnose amusia, average values of d0 werelower for the amusics than for the non amusics for eachof the subtests [Scale: t(88) ¼ 17.86, Cohen’s d ¼ 1.89;Contour: t(88) ¼ 15.30, Cohen’s d ¼ 1.62; Interval:t(88) ¼ 17.47, Cohen’s d ¼ 1.85; Rhythm: t(88) ¼20.76, Cohen’s d ¼ 2.20; Meter: t(88) ¼ 14.16, Cohen’sd ¼ 1.50; Memory: t(88) ¼ 20.39, Cohen’s d ¼ 2.16; allps < .001]. More interesting was a consideration of dif-ferences in the criterion score, c. For all of the same-different subtests, amusics were more conservative thannonamusics [Scale: t(88) ¼ 13.17, Cohen’s d ¼ 1.40;Contour: t(88) ¼ 6.51, Cohen’s d ¼ 0.69; Interval:t(88) ¼ 10.67; Cohen’s d ¼ 1.13; Rhythm: t(88) ¼ 4.05,
TABLE 3. ROC-based Dependent Measures s, da, and Az for Each Subtest of the MBEA-C.
Subtest
Scale Contour Interval Rhythm Meter Memory
s 0.95 1.01 1.01 1.10 0.88 0.73da 2.00 1.78 1.64 1.97 1.96 2.44Az 0.92 0.89 0.87 0.91 0.90 0.95
3 Although the nonamusic group tended to have more music trainingthan the amusic group, we point out that the observed group differenceresults from a significant correlation across the entire sample betweenyears of musical training and performance, as indexed by both PC, r(90)¼ .44, p < .001, and d0 , r(90) ¼ .45, p < .001. Thus, the relationshipbetween music training and performance on the MBEA is morecontinuous and it is not simply the case that nonamusic individuals aremusically trained, while amusic individuals are not.
A Signal Detection Approach to the MBEA 489
This content downloaded from 194.95.183.252 on Wed, 21 Jan 2015 09:55:45 AMAll use subject to JSTOR Terms and Conditions
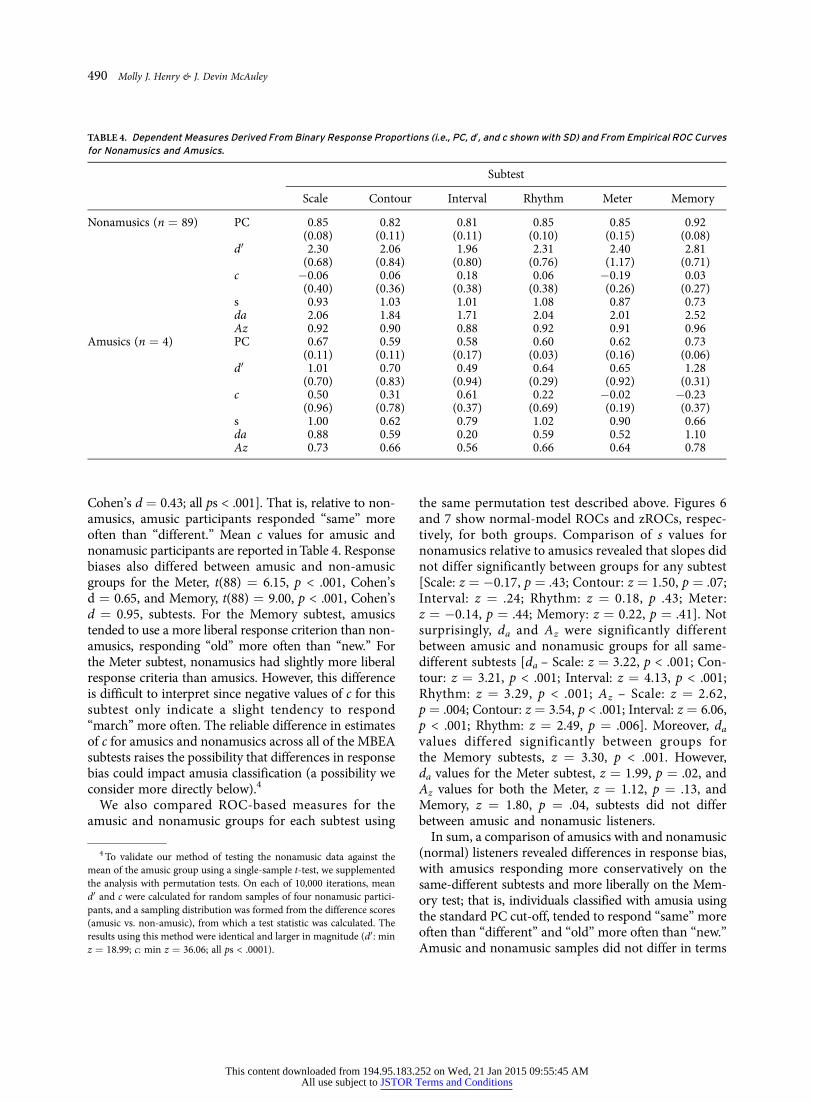
Cohen’s d ¼ 0.43; all ps < .001]. That is, relative to non-amusics, amusic participants responded ‘‘same’’ moreoften than ‘‘different.’’ Mean c values for amusic andnonamusic participants are reported in Table 4. Responsebiases also differed between amusic and non-amusicgroups for the Meter, t(88) ¼ 6.15, p < .001, Cohen’sd ¼ 0.65, and Memory, t(88) ¼ 9.00, p < .001, Cohen’sd ¼ 0.95, subtests. For the Memory subtest, amusicstended to use a more liberal response criterion than non-amusics, responding ‘‘old’’ more often than ‘‘new.’’ Forthe Meter subtest, nonamusics had slightly more liberalresponse criteria than amusics. However, this differenceis difficult to interpret since negative values of c for thissubtest only indicate a slight tendency to respond‘‘march’’ more often. The reliable difference in estimatesof c for amusics and nonamusics across all of the MBEAsubtests raises the possibility that differences in responsebias could impact amusia classification (a possibility weconsider more directly below).4
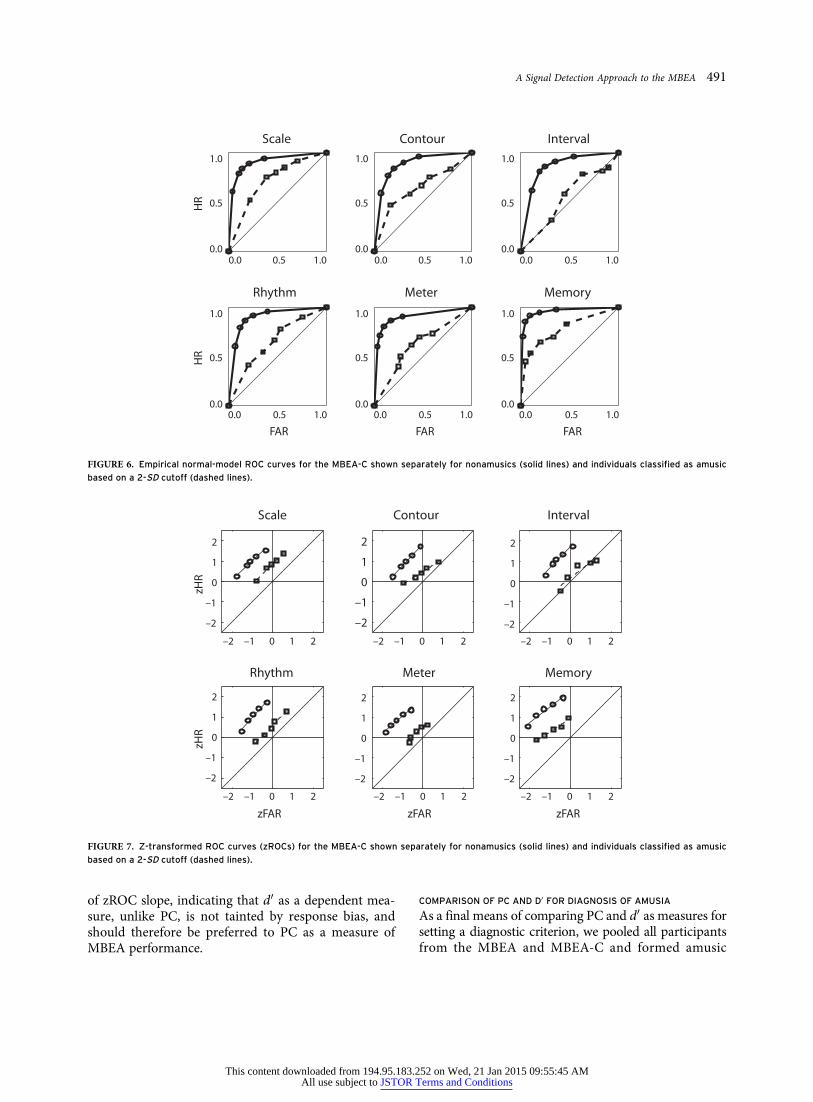
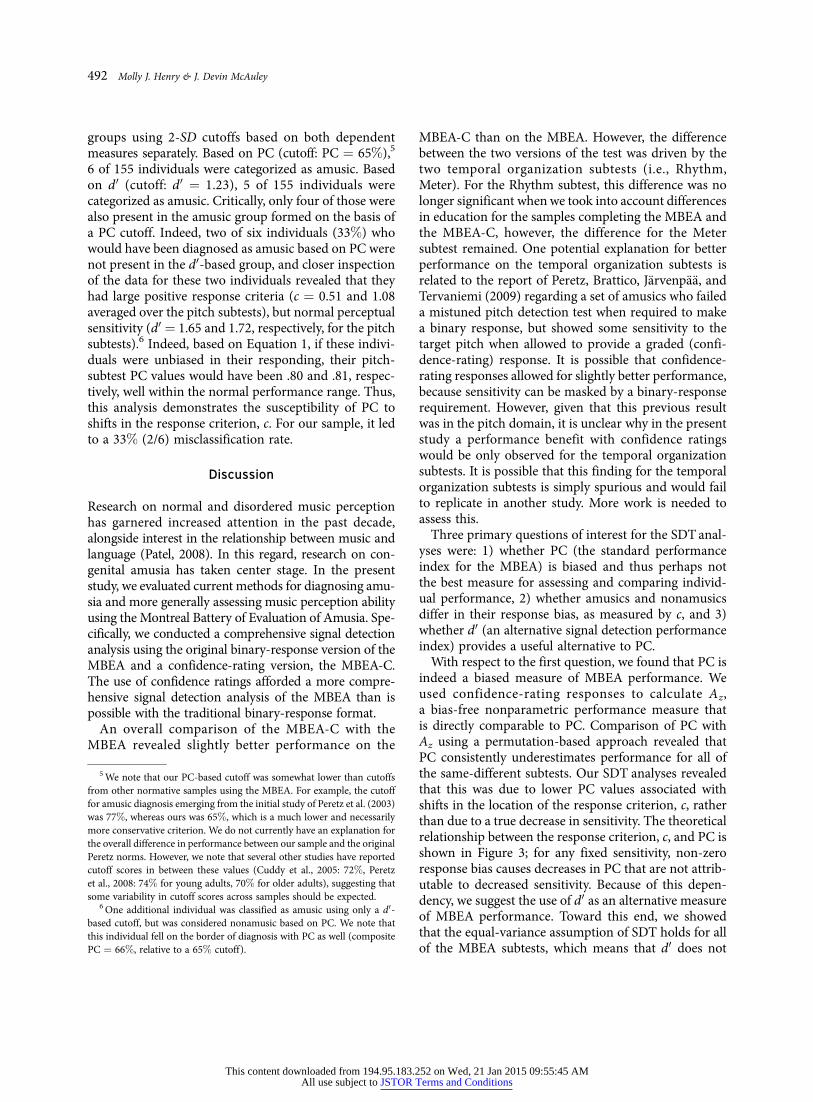
We also compared ROC-based measures for theamusic and nonamusic groups for each subtest using
the same permutation test described above. Figures 6and 7 show normal-model ROCs and zROCs, respec-tively, for both groups. Comparison of s values fornonamusics relative to amusics revealed that slopes didnot differ significantly between groups for any subtest[Scale: z ¼ �0.17, p ¼ .43; Contour: z ¼ 1.50, p ¼ .07;Interval: z ¼ .24; Rhythm: z ¼ 0.18, p .43; Meter:z ¼ �0.14, p ¼ .44; Memory: z ¼ 0.22, p ¼ .41]. Notsurprisingly, da and Az were significantly differentbetween amusic and nonamusic groups for all same-different subtests [da – Scale: z ¼ 3.22, p < .001; Con-tour: z ¼ 3.21, p < .001; Interval: z ¼ 4.13, p < .001;Rhythm: z ¼ 3.29, p < .001; Az – Scale: z ¼ 2.62,p ¼ .004; Contour: z ¼ 3.54, p < .001; Interval: z ¼ 6.06,p < .001; Rhythm: z ¼ 2.49, p ¼ .006]. Moreover, da
values differed significantly between groups forthe Memory subtests, z ¼ 3.30, p < .001. However,da values for the Meter subtest, z ¼ 1.99, p ¼ .02, andAz values for both the Meter, z ¼ 1.12, p ¼ .13, andMemory, z ¼ 1.80, p ¼ .04, subtests did not differbetween amusic and nonamusic listeners.
In sum, a comparison of amusics with and nonamusic(normal) listeners revealed differences in response bias,with amusics responding more conservatively on thesame-different subtests and more liberally on the Mem-ory test; that is, individuals classified with amusia usingthe standard PC cut-off, tended to respond ‘‘same’’ moreoften than ‘‘different’’ and ‘‘old’’ more often than ‘‘new.’’Amusic and nonamusic samples did not differ in terms
TABLE 4. Dependent Measures Derived From Binary Response Proportions (i.e., PC, d0, and c shown with SD) and From Empirical ROC Curvesfor Nonamusics and Amusics.
Subtest
Scale Contour Interval Rhythm Meter Memory
Nonamusics (n ¼ 89) PC 0.85 0.82 0.81 0.85 0.85 0.92(0.08) (0.11) (0.11) (0.10) (0.15) (0.08)
d0 2.30 2.06 1.96 2.31 2.40 2.81(0.68) (0.84) (0.80) (0.76) (1.17) (0.71)
c �0.06 0.06 0.18 0.06 �0.19 0.03(0.40) (0.36) (0.38) (0.38) (0.26) (0.27)
s 0.93 1.03 1.01 1.08 0.87 0.73da 2.06 1.84 1.71 2.04 2.01 2.52Az 0.92 0.90 0.88 0.92 0.91 0.96
Amusics (n ¼ 4) PC 0.67 0.59 0.58 0.60 0.62 0.73(0.11) (0.11) (0.17) (0.03) (0.16) (0.06)
d0 1.01 0.70 0.49 0.64 0.65 1.28(0.70) (0.83) (0.94) (0.29) (0.92) (0.31)
c 0.50 0.31 0.61 0.22 �0.02 �0.23(0.96) (0.78) (0.37) (0.69) (0.19) (0.37)
s 1.00 0.62 0.79 1.02 0.90 0.66da 0.88 0.59 0.20 0.59 0.52 1.10Az 0.73 0.66 0.56 0.66 0.64 0.78
4 To validate our method of testing the nonamusic data against themean of the amusic group using a single-sample t-test, we supplementedthe analysis with permutation tests. On each of 10,000 iterations, meand0 and c were calculated for random samples of four nonamusic partici-pants, and a sampling distribution was formed from the difference scores(amusic vs. non-amusic), from which a test statistic was calculated. Theresults using this method were identical and larger in magnitude (d0 : minz ¼ 18.99; c: min z ¼ 36.06; all ps < .0001).
490 Molly J. Henry & J. Devin McAuley
This content downloaded from 194.95.183.252 on Wed, 21 Jan 2015 09:55:45 AMAll use subject to JSTOR Terms and Conditions
of zROC slope, indicating that d0 as a dependent mea-sure, unlike PC, is not tainted by response bias, andshould therefore be preferred to PC as a measure ofMBEA performance.
COMPARISON OF PC AND D0 FOR DIAGNOSIS OF AMUSIA
As a final means of comparing PC and d0 as measures forsetting a diagnostic criterion, we pooled all participantsfrom the MBEA and MBEA-C and formed amusic
1.0 1.0 1.0
1.01.01.0
0.5
0.0
0.5
0.0
0.5
0.0
0.5
0.0
0.5
0.0
0.5
0.00.0 0.5 1.0 0.0 0.5 1.0 0.0 0.5 1.0
0.0 0.5 1.00.0 0.5 1.00.0 0.5 1.0
HR
HR
FAR FAR FAR
Scale Contour Interval
Rhythm Meter Memory
FIGURE 6. Empirical normal-model ROC curves for the MBEA-C shown separately for nonamusics (solid lines) and individuals classified as amusic
based on a 2-SD cutoff (dashed lines).
2
1
0
–1
–2
2
1
0
–1
–2
2
1
0
–1
–2
2
1
0
–1
–2
2
1
0
–1
–2
2
1
0
–1
–2
–2 –1 0 1 2 –2 –1 0 1 2 –2 –1 0 1 2
–2 –1 0 1 2–2 –1 0 1 2–2 –1 0 1 2
zFAR zFAR zFAR
zHR
zHR
Scale Contour Interval
Rhythm Meter Memory
FIGURE 7. Z-transformed ROC curves (zROCs) for the MBEA-C shown separately for nonamusics (solid lines) and individuals classified as amusic
based on a 2-SD cutoff (dashed lines).
A Signal Detection Approach to the MBEA 491
This content downloaded from 194.95.183.252 on Wed, 21 Jan 2015 09:55:45 AMAll use subject to JSTOR Terms and Conditions
groups using 2-SD cutoffs based on both dependentmeasures separately. Based on PC (cutoff: PC ¼ 65%),5
6 of 155 individuals were categorized as amusic. Basedon d 0 (cutoff: d0 ¼ 1.23), 5 of 155 individuals werecategorized as amusic. Critically, only four of those werealso present in the amusic group formed on the basis ofa PC cutoff. Indeed, two of six individuals (33%) whowould have been diagnosed as amusic based on PC werenot present in the d0-based group, and closer inspectionof the data for these two individuals revealed that theyhad large positive response criteria (c ¼ 0.51 and 1.08averaged over the pitch subtests), but normal perceptualsensitivity (d0 ¼ 1.65 and 1.72, respectively, for the pitchsubtests).6 Indeed, based on Equation 1, if these indivi-duals were unbiased in their responding, their pitch-subtest PC values would have been .80 and .81, respec-tively, well within the normal performance range. Thus,this analysis demonstrates the susceptibility of PC toshifts in the response criterion, c. For our sample, it ledto a 33% (2/6) misclassification rate.
Discussion
Research on normal and disordered music perceptionhas garnered increased attention in the past decade,alongside interest in the relationship between music andlanguage (Patel, 2008). In this regard, research on con-genital amusia has taken center stage. In the presentstudy, we evaluated current methods for diagnosing amu-sia and more generally assessing music perception abilityusing the Montreal Battery of Evaluation of Amusia. Spe-cifically, we conducted a comprehensive signal detectionanalysis using the original binary-response version of theMBEA and a confidence-rating version, the MBEA-C.The use of confidence ratings afforded a more compre-hensive signal detection analysis of the MBEA than ispossible with the traditional binary-response format.
An overall comparison of the MBEA-C with theMBEA revealed slightly better performance on the
MBEA-C than on the MBEA. However, the differencebetween the two versions of the test was driven by thetwo temporal organization subtests (i.e., Rhythm,Meter). For the Rhythm subtest, this difference was nolonger significant when we took into account differencesin education for the samples completing the MBEA andthe MBEA-C, however, the difference for the Metersubtest remained. One potential explanation for betterperformance on the temporal organization subtests isrelated to the report of Peretz, Brattico, Jarvenpaa, andTervaniemi (2009) regarding a set of amusics who faileda mistuned pitch detection test when required to makea binary response, but showed some sensitivity to thetarget pitch when allowed to provide a graded (confi-dence-rating) response. It is possible that confidence-rating responses allowed for slightly better performance,because sensitivity can be masked by a binary-responserequirement. However, given that this previous resultwas in the pitch domain, it is unclear why in the presentstudy a performance benefit with confidence ratingswould be only observed for the temporal organizationsubtests. It is possible that this finding for the temporalorganization subtests is simply spurious and would failto replicate in another study. More work is needed toassess this.
Three primary questions of interest for the SDT anal-yses were: 1) whether PC (the standard performanceindex for the MBEA) is biased and thus perhaps notthe best measure for assessing and comparing individ-ual performance, 2) whether amusics and nonamusicsdiffer in their response bias, as measured by c, and 3)whether d0 (an alternative signal detection performanceindex) provides a useful alternative to PC.
With respect to the first question, we found that PC isindeed a biased measure of MBEA performance. Weused confidence-rating responses to calculate Az,a bias-free nonparametric performance measure thatis directly comparable to PC. Comparison of PC withAz using a permutation-based approach revealed thatPC consistently underestimates performance for all ofthe same-different subtests. Our SDT analyses revealedthat this was due to lower PC values associated withshifts in the location of the response criterion, c, ratherthan due to a true decrease in sensitivity. The theoreticalrelationship between the response criterion, c, and PC isshown in Figure 3; for any fixed sensitivity, non-zeroresponse bias causes decreases in PC that are not attrib-utable to decreased sensitivity. Because of this depen-dency, we suggest the use of d0 as an alternative measureof MBEA performance. Toward this end, we showedthat the equal-variance assumption of SDT holds for allof the MBEA subtests, which means that d0 does not
5 We note that our PC-based cutoff was somewhat lower than cutoffsfrom other normative samples using the MBEA. For example, the cutofffor amusic diagnosis emerging from the initial study of Peretz et al. (2003)was 77%, whereas ours was 65%, which is a much lower and necessarilymore conservative criterion. We do not currently have an explanation forthe overall difference in performance between our sample and the originalPeretz norms. However, we note that several other studies have reportedcutoff scores in between these values (Cuddy et al., 2005: 72%, Peretzet al., 2008: 74% for young adults, 70% for older adults), suggesting thatsome variability in cutoff scores across samples should be expected.
6 One additional individual was classified as amusic using only a d0-based cutoff, but was considered nonamusic based on PC. We note thatthis individual fell on the border of diagnosis with PC as well (compositePC ¼ 66%, relative to a 65% cutoff).
492 Molly J. Henry & J. Devin McAuley
This content downloaded from 194.95.183.252 on Wed, 21 Jan 2015 09:55:45 AMAll use subject to JSTOR Terms and Conditions
suffer from the same contamination from response biasthat PC does. One advantage of d0 is that it can becalculated from binary response proportions obtainedusing the standard binary-response version of theMBEA.
With respect to the second question, we found thatparticipants classified as amusic using the PC-basedcriterion were much more conservative in theirresponding (they had reliably more extreme values of c)than nonamusic participants. Several other studies areworth noting in this regard. First, Peretz et al. (2009)found that the relatively poor performance of amusicsrelative to nonamusics on a task that required detec-tion of an out-of-key note was in part due to frequent‘congruous’ responses to incongruous melodies con-taining a mistuned note. Second, Williamson et al.(2010) reported larger proportions of misses than falsealarms on a pitch memory task requiring same-different responses (i.e., more ‘‘same’’ than ‘‘different’’responses) for amusics relative to nonamusics. Finally,Omigie and Stewart (2011) found differences betweenresponse biases for amusic versus nonamusic partici-pants. However, response bias in this study wasdefined somewhat differently than the standard SDTdefinition in order to assess implicit versus explicitlearning (Kunimoto, Miller, & Pashler, 2001; Tunney& Shanks, 2003). As far as we are aware, however, thecurrent study is the first to explicitly report systematicdifferences in response bias between amusic and non-amusic participants using estimates of the response cri-terion, c, on the MBEA.
There are at least two possible interpretations of theobserved response bias differences between amusic andnonamusic individuals. On the one hand, it could be thecase that individuals with a musical impairment aremore strongly biased than nonamusic individuals. Onthis account, shifts in the response criterion are a symp-tom. However, on the other hand, because PC is taintedby response bias and a PC-based criterion is typicallyused to create samples of amusic and nonamusic parti-cipants in many research studies on congenital amusia,simply having a large response bias could cause an indi-vidual with normal sensitivity to be diagnosed as amu-sic. Indeed, these possibilities are not mutuallyexclusive. We have shown that 33% of our diagnosedamusics showed perceptual sensitivity in the normalrange (based on d0) but had large response biases thatled to amusia diagnosis when using a PC-based cutoff.These individuals constitute a clear case of the lattersituation, where increased response bias causes an amu-sia diagnosis. However, the rest our amusic sampleshowed high response bias concomitant with low
sensitivity, suggesting that for these individuals, extremeresponse bias may be a symptom of a true musical dis-order. Using PC as a dependent measure does not allowseparating these two possibilities. Thus, the solutionoffered in this article is to abandon the use of a PC-based criterion for amusia classification in favor of anunbiased performance metric. In this regard, with respectto the third primary question, we’ve shown that for theMBEA, d0 is an unbiased alternative.
For cases where having a conservative response crite-rion is a symptom of amusia rather than contributing topotential misdiagnosis, one obvious question is whythese amusic individuals would demonstrate such a con-servative response strategy. One possibility is motiva-tional in origin. Previous work on regulatory focustheory has shown that when an individual performsa diagnostic test with a preconceived notion about howshe should perform, one potential consequence is adop-tion of a more conservative response criterion (Crowe &Higgins, 1997). In the domain of the MBEA, previouswork has shown that nonmusicians (who were criticallytold that they were likely to perform poorly relative tomusicians on the task) were more conservative thanmusicians (who were told they were likely to performwell; McAuley, Henry, & Tuft, 2011). On this basis, oursuggestion is that individuals who expect to performpoorly on a task that they know will be diagnostic(i.e., the MBEA) may adopt a more conservativeresponse criterion in an effort to hedge their losses. Atest of this hypothesis is currently underway.
It is interesting here to consider a possible connectionbetween (1) potential misclassification of a musicalimpairment based on extreme response biases and(2) perception-action mismatch observed for someamusic individuals. Consider, for example, thatalthough some amusics perform very poorly whenasked to identify the direction of a pitch change (byresponding ‘lower’ or ‘higher’), they are capable of cor-rectly singing the direction of the change (Loui,Guenther, Mathys, & Schlaug, 2008). One possibilitythat deserves some consideration based on the presentstudy is that the quantification of perceptual deficitsmay be based, at least in part, on response biases,whereas production tasks by nature require responsesthat are bias-free. This suggestion is supported bya recent study indicating that the degree of a percep-tion-action mismatch in amusics depends on the natureof the perception task (Williamson, Liu, Peryer, Grier-son, & Stewart, 2012). Perception thresholds were foundto be much higher than production thresholds whenamusics were asked to identify the direction of a pitchchange (as in Loui et al., 2008); however, when
A Signal Detection Approach to the MBEA 493
This content downloaded from 194.95.183.252 on Wed, 21 Jan 2015 09:55:45 AMAll use subject to JSTOR Terms and Conditions
perception abilities were evaluated using an AXB taskintended to reduce response bias, no such dissociationwas found. In general, future work should carefullyconsider the role of response bias in conclusions regard-ing the nature of amusia.
Finally, it is worth noting that although in the currentstudy we were able to examine only a small number ofdiagnosed amusics (n ¼ 4 on the MBEA-C), the con-clusions we have drawn regarding the biases inherent inPC as a measure of performance are based on a signaldetection analysis of our full sample of 93 participants.Thus, our primary conclusion (PC is a biased measureof performance on the MBEA and should be avoided)could not be an artifact of the small number of amusicparticipants. Nonetheless, an important future goal ofamusia research should be to better explicate the natureof response biases in amusics using larger sample sizes.
In sum, we prescribe use of the signal detectionmeasure, d0, in evaluation of MBEA performance anddiagnosis of amusia. The current study shows that PCis a biased performance measure, due to its variationwith response criterion location. Moreover, amusicindividuals (diagnosed based on PC) were more biasedthan nonamusic listeners. However, we argue that thisis, in some cases, not a hallmark of amusia per se, butinstead can be a consequence of using an inappropriatedependent measure that has the potential to misdiag-nose amusia when individuals use relatively extreme
response criteria but have sensitivity in the normalrange. The use of a bias-free performance metric foramusia diagnosis is necessary to avoid this problem.The SDT analyses we performed based on confidencerating data revealed satisfaction of the equal-variancesassumption of SDT for all subtests of the MBEA, thussupporting the use of d0 as a preferred performancemetric and diagnostic criterion. From this perspective,the use of bias-free criteria tightens the criteria foramusic classification by restricting diagnoses to sub-groups of ‘‘poor performers’’ who show true sensitivitydeficits.
Author Note
We thank Bryan Gruschow and Elizabeth Wieland forassistance with data collection and organization. We arealso grateful to Barbara Tillmann for comments thatgreatly improved this manuscript and to Bjorn Herrmannfor fruitful discussion related to permutation-basedanalyses.
Correspondence concerning this article should beaddressed to Molly J. Henry, Max Planck Institute forHuman Cognitive and Brain Sciences, Stephanstrasse1a, Leipzig, Germany. Email: [email protected] or toJ. Devin McAuley, Department of Psychology, MichiganState University, East Lansing, MI 48824. E-mail:[email protected]
References
ALY, M., KNIGHT, R. T., & YONELINAS, A. P. (2010). Faces arespecial but not too special: Spared face recognition in amnesiais based on familiarity. Neuropsychologia, 48, 3941-3948.
AYOTTE, J., PERETZ, I., & HYDE, K. (2002). Congenital amusia:A group study of adults afflicted with a music-specific disorder.Brain, 125, 238-251.
CROWE, E., & HIGGINS, E. T. (1997). Regulatory focus andstrategic inclinations: Promotion and prevention indecision-making. Organizational Behavior and HumanDecision Processes, 69, 117-132.
CUDDY, L. L., BALKWILL, L. L., PERETZ, I., & HOLDEN, R. R.(2005). Musical difficulties are rare: A study of ‘‘tone deafness’’among university students. Annals of the New York Academy ofSciences, 1060, 311-324.
DOUGLAS, K. M., & BILKEY, D. K. (2007). Amusia is associatedwith deficits in spatial processing. Nature Neuroscience, 10,915-921.
DURLACH, N. I., & BRAIDA, L. D. (1969). Intensity perception I:Preliminary theory of intensity resolution. Journal of theAcoustical Society of America, 46, 372-383.
ERNST, M. D. (2004). Permutation methods: A basis for exactinference. Statistical Science, 19, 676-685.
GREEN, D. M., & SWETS, J. A. (1966). Signal detection theory andpsychophysics. New York: Wiley.
HENRY, M. J., & MCAULEY, J. D. (2010). On the prevalence ofcongenital amusia. Music Perception, 27, 413-418.
HYDE, K. L., & PERETZ, I. (2004). Brains that are out of tune butin time. Psychological Science, 15, 356-360.
KUNIMOTO, C., MILLER, J., & PASHLER, H. (2001). Confidenceand accuracy of near-threshold discrimination responses.Consciousness and Cognition, 10, 294-340.
LOUI, P., ALSOP, D., & SCHLAUG, G. (2009). Tone deafness: Anew disconnection syndrome? The Journal of Neuroscience, 29,10215-10220.
LOUI, P., GUENTHER, F., MATHYS, C., & SCHLAUG, G. (2008).Action–perception mismatch in tone-deafness. CurrentBiology, 18, 331-332.
MACMILLAN, N. A., & CREELMAN, C. D. (2005). Detectiontheory: A user’s guide. Mahwah, NJ: Lawrence ErlbaumAssociates.
494 Molly J. Henry & J. Devin McAuley
This content downloaded from 194.95.183.252 on Wed, 21 Jan 2015 09:55:45 AMAll use subject to JSTOR Terms and Conditions
MCAULEY, J. D., HENRY, M. J., & TUFT, S. (2011). Musicianadvantages in music perception: An issue of motivation, notjust ability. Music Perception, 28, 505-518.
MCDONALD, C., & STEWART, L. (2008). Uses and functions ofmusic in congenital amusia. Music Perception, 25, 345-355.
OMIGIE, D., & STEWART, L. (2011). Preserved statistical learningof tonal and linguistic material in congenital amusia. Frontiersin Psychology, 2, 1-11.
PARKS, C. M., DECARLI, C., JACOBY, L. L., & YONELINAS, A. P.(2010). Aging effects on recollection and familiarity: The roleof white matter hyperintensities. Aging, Neuropsychology,Cognition, 17, 422-438.
PATEL, A. D. (2008). Music, language, and the brain. New York:Oxford University Press.
PERETZ, I., BRATTICO, E., JARVENPAA, M., & TERVANIEMI, M.(2009). The amusic brain: In tune, out of key, and unaware.Brain, 132, 1277-1286.
PERETZ, I., CHAMPOD, A. S., & HYDE, K. L. (2003). Varieties of musicaldisorders: The Montreal Battery of Evaluation of Amusia.Annals of the New York Academy of Sciences, 999, 58-75.
PERETZ, I., GOSSELIN, N., TILLMAN, B., CUDDY, L. L., GAGNON,B., TRIMMER, C. G. ET AL. (2008). On-line identification ofcongenital amusia. Music Perception, 25, 331-343.
RATCLIFF, R., MCKOON, G., & TINDALL, M. (1994).Experimental generality of data from recognition memoryreceiver-operating characteristic functions andimplications for the glocal memory models. Journal ofExperimental Psychology: Learning, Memory, and Cognition,20, 763-785.
ROUSSEAU, B., ROGEAUX, M., & O’MAHONEY, M. (1999).Mustard discrimination by same-different and triangle tests:
Aspects of irritation, memory, and t criteria. Food Quality andPreference, 10, 173-184.
SNODGRASS, J. G., & CORWIN, J. (1988). Pragmatics of measur-ing recognition memory: Applications to dementia andamnesia. Journal of Experimental Psychology: General, 117,34-50.
TILLMANN, B., SCHULZE, K., & FOXTON, J. (2009). Congenitalamusia: A short-term memory deficit for non-verbal, but notverbal sounds. Brain and Cognition, 71, 259-264.
TUNNEY, R. J., & SHANKS, D. R. (2003). Subjective measures ofawareness and implicit cognition. Memory and Cognition, 31,1060-1071.
VANN, S. D., TSILVILIS, D., DENBY, C. E., QUAMME, J. R.,YONELINAS, A. P., AGGLETON, J. P. ET AL. (2009). Impairedrecollection but spared familiarity in patients with extendedhippocampal system damage revealed by 3 convergent meth-ods. Proceedings of the National Academy of Sciences, 106,5442-5447.
WILLIAMSON, V. J., LIU, F., PERYER, G., GRIERSON, M., &STEWART, L. (2012). Perception and action de-coupling incongenital amusia: Sensitivity to task. Neuropsychologia, 50,172-180.
WILLIAMSON, V. J., MCDONALD, C., DEUTSCH, D., GRIFFITHS, T.D., & STEWART, L. (2010). Faster decline of pitch memory overtime in congenital amusia. Advances in Cognitive Psychology, 6,15-22.
YONELINAS, A. P. (1999). The contribution of recollection andfamiliarity to recognition and source-memory judgments: Aformal dual-process model and an analysis of receiver operatorcharacteristics. Journal of Experimental Psychology: Learning,Memory, and Cognition, 25, 1415-1434.
A Signal Detection Approach to the MBEA 495
This content downloaded from 194.95.183.252 on Wed, 21 Jan 2015 09:55:45 AMAll use subject to JSTOR Terms and Conditions
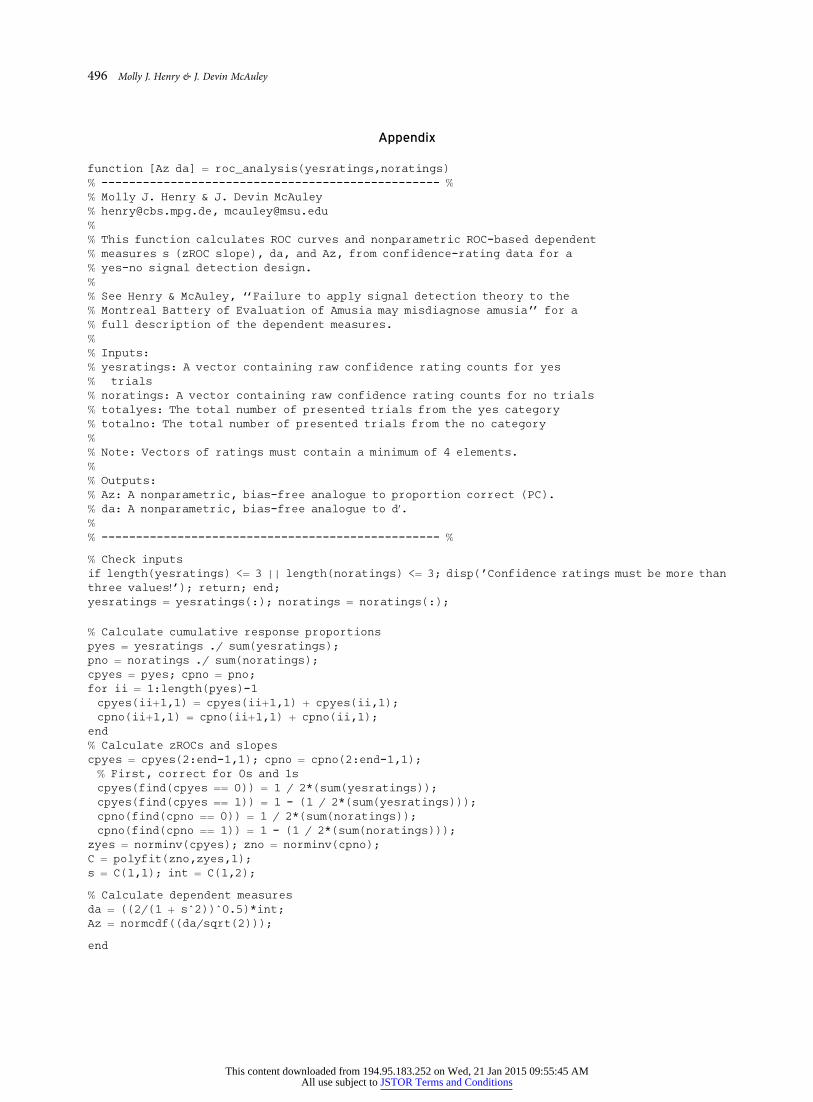
Appendix
function [Az da] ¼ roc_analysis(yesratings,noratings)% ------------------------------------------------- %
% Molly J. Henry & J. Devin McAuley% [email protected], [email protected]%
% This function calculates ROC curves and nonparametric ROC-based dependent% measures s (zROC slope), da, and Az, from confidence-rating data for a% yes-no signal detection design.%
% See Henry & McAuley, ‘‘Failure to apply signal detection theory to the% Montreal Battery of Evaluation of Amusia may misdiagnose amusia’’ for a% full description of the dependent measures.%
% Inputs:% yesratings: A vector containing raw confidence rating counts for yes% trials% noratings: A vector containing raw confidence rating counts for no trials% totalyes: The total number of presented trials from the yes category% totalno: The total number of presented trials from the no category%
% Note: Vectors of ratings must contain a minimum of 4 elements.%
% Outputs:% Az: A nonparametric, bias-free analogue to proportion correct (PC).% da: A nonparametric, bias-free analogue to d0.%
% ------------------------------------------------- %
% Check inputsif length(yesratings) <¼ 3 || length(noratings) <¼ 3; disp(’Confidence ratings must be more thanthree values!’); return; end;yesratings ¼ yesratings(:); noratings ¼ noratings(:);
% Calculate cumulative response proportionspyes ¼ yesratings ./ sum(yesratings);pno ¼ noratings ./ sum(noratings);cpyes ¼ pyes; cpno ¼ pno;for ii ¼ 1:length(pyes)-1cpyes(iiþ1,1) ¼ cpyes(iiþ1,1) þ cpyes(ii,1);cpno(iiþ1,1) ¼ cpno(iiþ1,1) þ cpno(ii,1);
end% Calculate zROCs and slopescpyes ¼ cpyes(2:end-1,1); cpno ¼ cpno(2:end-1,1);
% First, correct for 0s and 1scpyes(find(cpyes ¼¼ 0)) ¼ 1 / 2*(sum(yesratings));cpyes(find(cpyes ¼¼ 1)) ¼ 1 - (1 / 2*(sum(yesratings)));cpno(find(cpno ¼¼ 0)) ¼ 1 / 2*(sum(noratings));cpno(find(cpno ¼¼ 1)) ¼ 1 - (1 / 2*(sum(noratings)));
zyes ¼ norminv(cpyes); zno ¼ norminv(cpno);C ¼ polyfit(zno,zyes,1);s ¼ C(1,1); int ¼ C(1,2);
% Calculate dependent measuresda ¼ ((2/(1 þ s^2))^0.5)*int;Az ¼ normcdf((da/sqrt(2)));
end
496 Molly J. Henry & J. Devin McAuley
This content downloaded from 194.95.183.252 on Wed, 21 Jan 2015 09:55:45 AMAll use subject to JSTOR Terms and Conditions