Embed Size (px)
Citation preview
Dr. Bob GeeDean Scott Bonney
Professor William G. JourniganAmerican Meridian University
Failure Mode Effects Analysis(FMEA)
1AMU / Bon-Tech, LLC, Journi-Tech Corporation Copyright 2015
Upon successful completion of this module, the student should be able to:
Understand the definition and purpose of an FMEA
Understand the different types of FMEAs
Understand the FMEA process and how it ties to process mapping
Understand the relationship between Failure Mode, Cause, and Effect
Understand how to construct an FMEA
Learning Objectives
AMU / Bon-Tech, LLC, Journi-Tech Corporation Copyright 2015
2
FMEA (Failure Mode and Effects Analysis) is a systematic method for identifying, analyzing, prioritizing and documenting potential failure modes, their effects on system, product and process performance, and the possible causes of failure.
FMEA
AMU / Bon-Tech, LLC, Journi-Tech Corporation Copyright 2015
3
Identify potential failure modes and analyze risks
Identify critical process parameters
Rank order potential process deficiencies
Help focus on prevention of process problems
Document and track actions taken to reduce risk associated with failure modes
Increase client satisfaction
Improve quality, reliability, and safety of product
Why Use FMEAs
AMU / Bon-Tech, LLC, Journi-Tech Corporation Copyright 2015
4
When new processes are being developed
When existing processes are being changed
When processes fail to perform as intended
When potential problems are envisioned, or there are many unknowns
When the process requires major improvement
When to Start an FMEA
How will your project benefit from an FMEA ?
AMU / Bon-Tech, LLC, Journi-Tech Corporation Copyright 2015
5
Wrong team make-up Size, expertise, attitude, experience, etc.
Taking on too much; analyzing every step Focus on big hitter steps
Failure modes not linked to Ys on process map
Causes not linked to Xs on process map
Inconsistent rankings from start to finish Be sure to review each column of rankings, and adjust for consistency, before calculating final RPNs
Agonizing over rankings Keep the process and the team flowing; review/adjust later
Common Pitfalls in Preparing FMEAs
AMU / Bon-Tech, LLC, Journi-Tech Corporation Copyright 2015
6
Motivated team members
Cross-functional representation on the team
Analyze the process as is, not how it could be
Start small and learn from your successes
Treat as a living document; reflect latest changes
Execute recommended actions
Integrate into your development process
Follow the spirit, not the form
Practice, practice, practice!
Keys to Successful Implementation
AMU / Bon-Tech, LLC, Journi-Tech Corporation Copyright 2015
7
8
Two major approaches:
Starting with the Process Map
Starting with the Cause & Effect Matrix
Three Approaches To The FMEA
AMU / Bon-Tech, LLC, Journi-Tech Corporation Copyright 2015
9
The C&E Matrix defined the important issues by helping to prioritize:
Important customer requirements
Process inputs that could potentially impact these requirements
Prioritize the Key Process Inputs Variables (KPIV) according to their impact on the output variables
Starting With C&E Matrix
Focus on inputs that highly impact
a large number of outputsAMU / Bon-Tech, LLC, Journi-Tech Corporation Copyright 2015
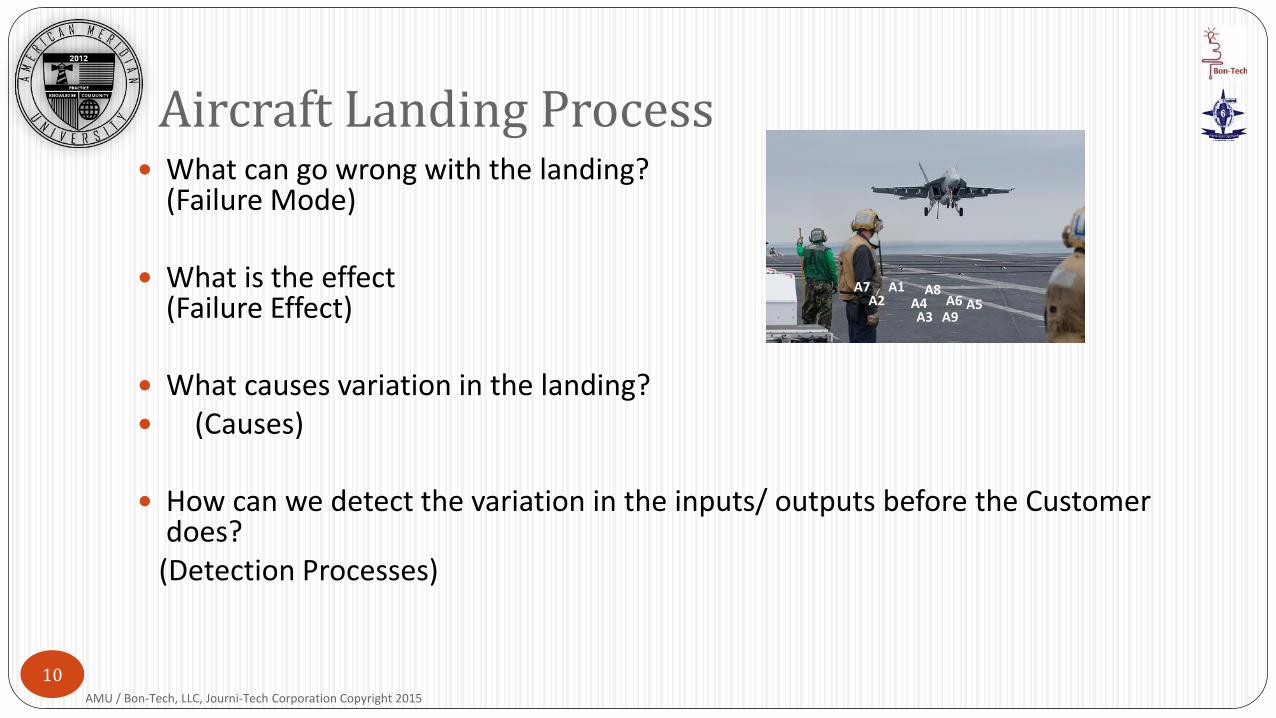
What can go wrong with the landing? (Failure Mode)
What is the effect on the customer? (Failure Effect)
What causes variation in the landing? (Causes)
How can we detect the variation in the inputs/ outputs before the Customer does?
(Detection Processes)
Aircraft Landing Process
A6A1
A5A4A3
A2A7 A8
A9
AMU / Bon-Tech, LLC, Journi-Tech Corporation Copyright 2015
10
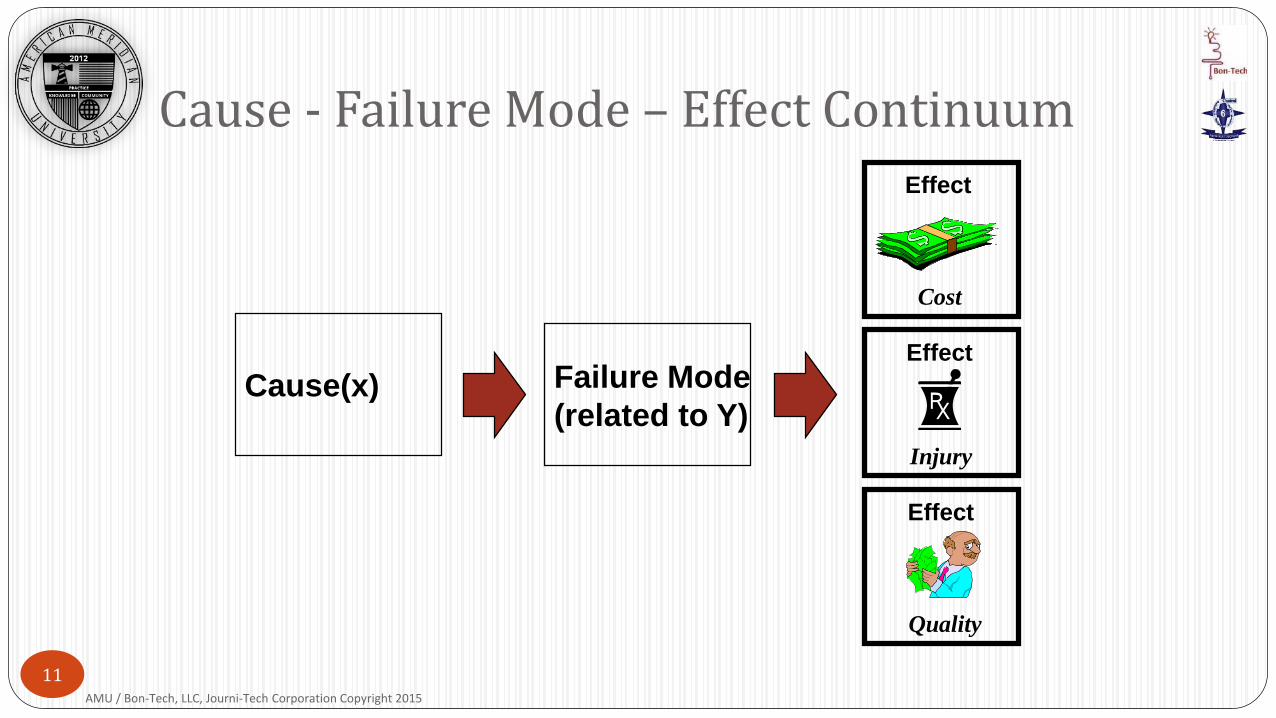
Cause(x) Failure Mode
(related to Y)
Effect
Effect
Effect
Cause - Failure Mode – Effect Continuum
Cost
Injury
Quality
AMU / Bon-Tech, LLC, Journi-Tech Corporation Copyright 2015
11
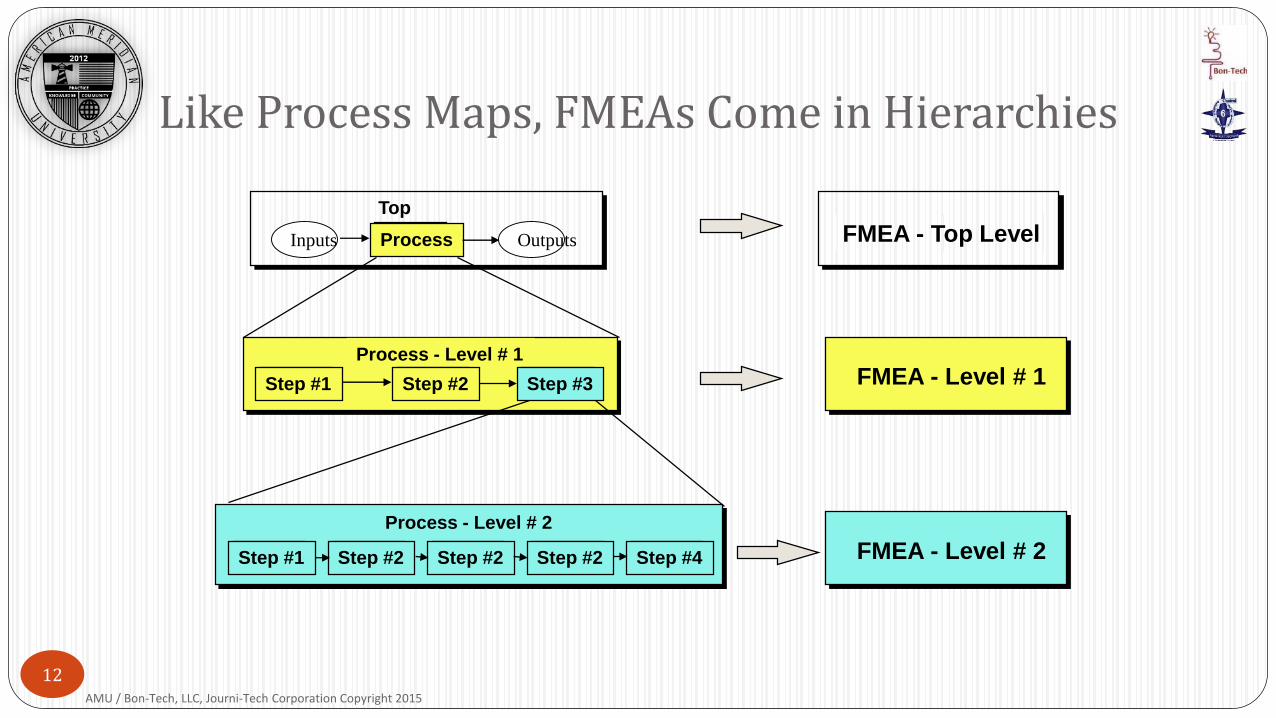
Top
Process FMEA - Top Level
FMEA - Level # 1
FMEA - Level # 2
Process - Level # 1
Step #1 Step #2
Process - Level # 2
Step #1 Step #2Step #2 Step #4Step #2
OutputsInputs
Step #3
Like Process Maps, FMEAs Come in Hierarchies
AMU / Bon-Tech, LLC, Journi-Tech Corporation Copyright 2015
12
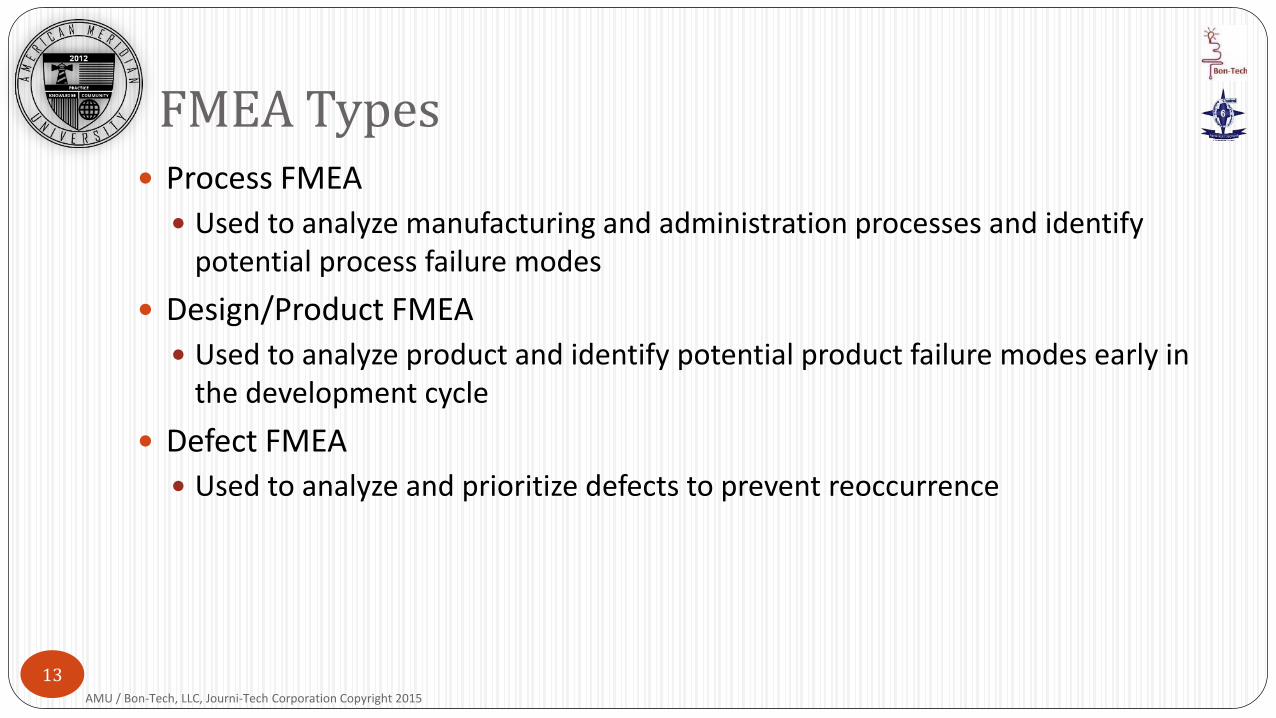
Process FMEA
Used to analyze manufacturing and administration processes and identify potential process failure modes
Design/Product FMEA
Used to analyze product and identify potential product failure modes early in the development cycle
Defect FMEA
Used to analyze and prioritize defects to prevent reoccurrence
FMEA Types
AMU / Bon-Tech, LLC, Journi-Tech Corporation Copyright 2015
13
14
Helps analyze manufacturing and assembly processes to reduce the occurrence and improve detection of defects.
Assists in the development of process control plans.
Establishes a priority for process improvement activities.
Documents the rationale behind process changes and helps guide future process improvement plans.
IS PROACTIVE! Should be started when new processes are designed or when old processes are changed.
Process FMEA
AMU / Bon-Tech, LLC, Journi-Tech Corporation Copyright 2015
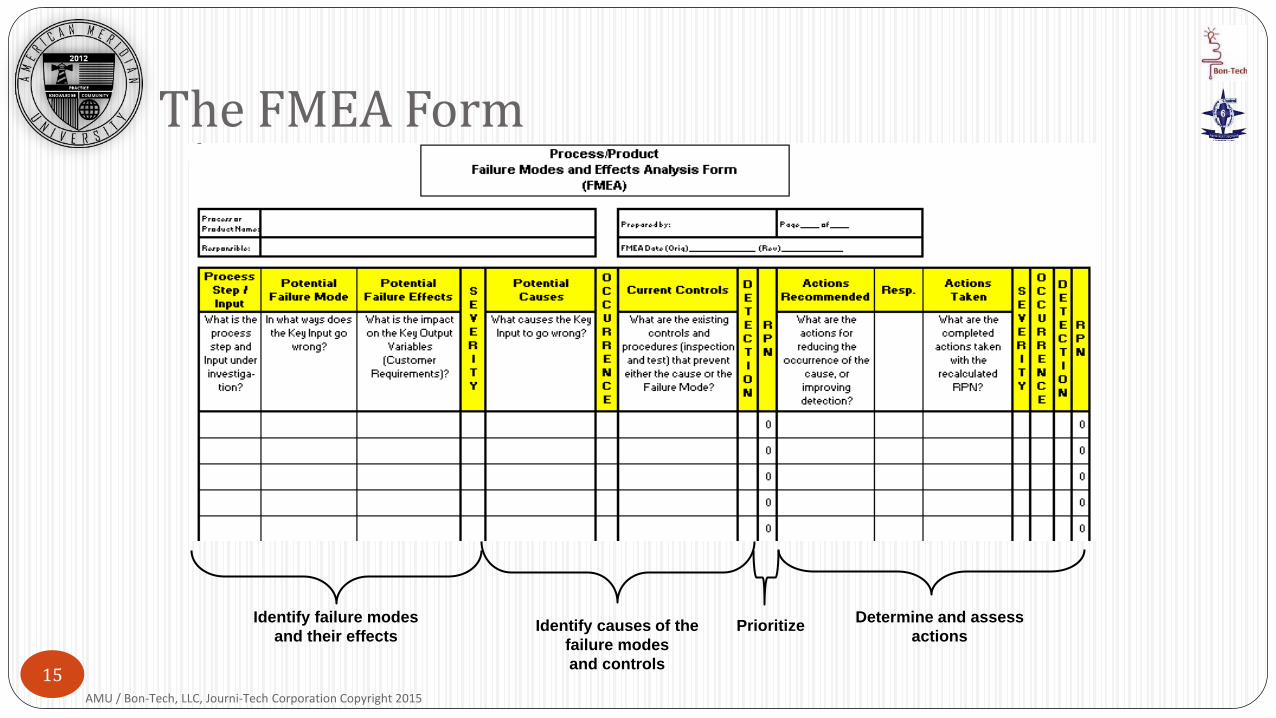
The FMEA Form
Identify failure modes
and their effectsIdentify causes of the
failure modes
and controls
PrioritizeDetermine and assess
actions
AMU / Bon-Tech, LLC, Journi-Tech Corporation Copyright 2015
15
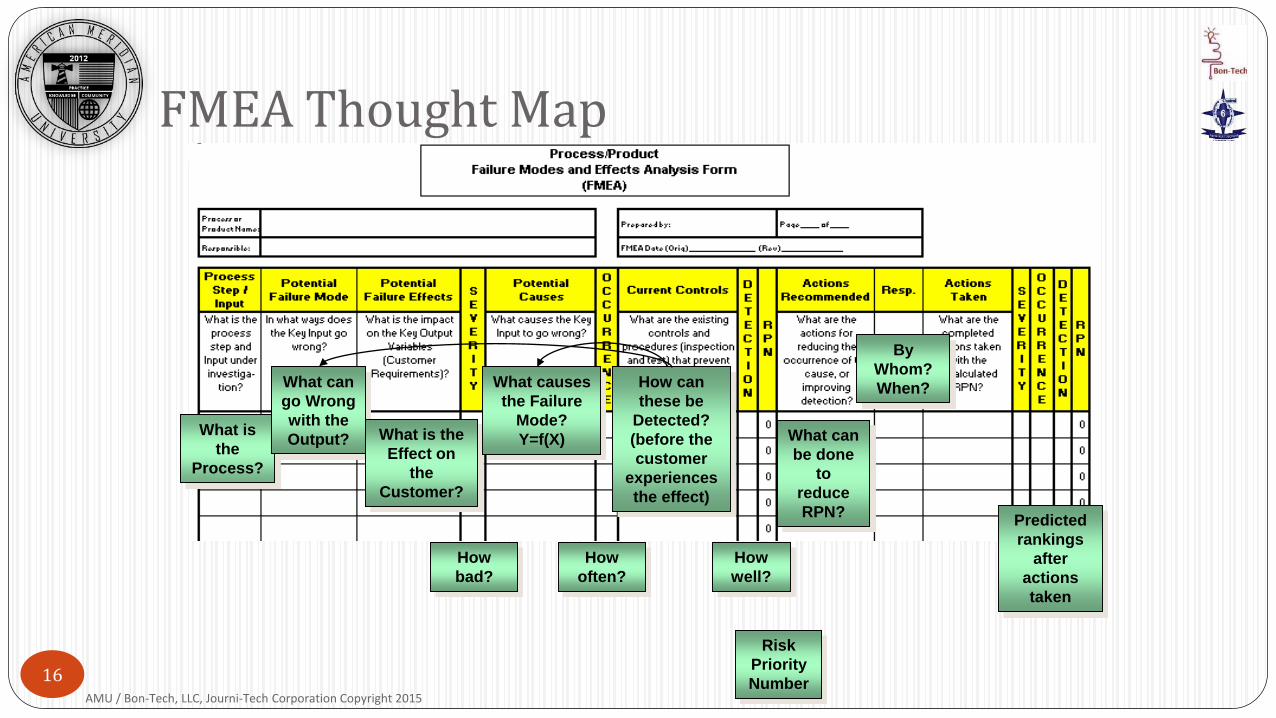
FMEA Thought Map
What is
the
Process?
What can
go Wrong
with the
Output? What is the
Effect on
the
Customer?
How
bad?
What causes
the Failure
Mode?
Y=f(X)
How
often?
How can
these be
Detected?
(before the
customer
experiences
the effect)
How
well?
Predicted
rankings
after
actions
taken
Risk
Priority
Number
What can
be done
to
reduce
RPN?
By
Whom?
When?
AMU / Bon-Tech, LLC, Journi-Tech Corporation Copyright 2015
16
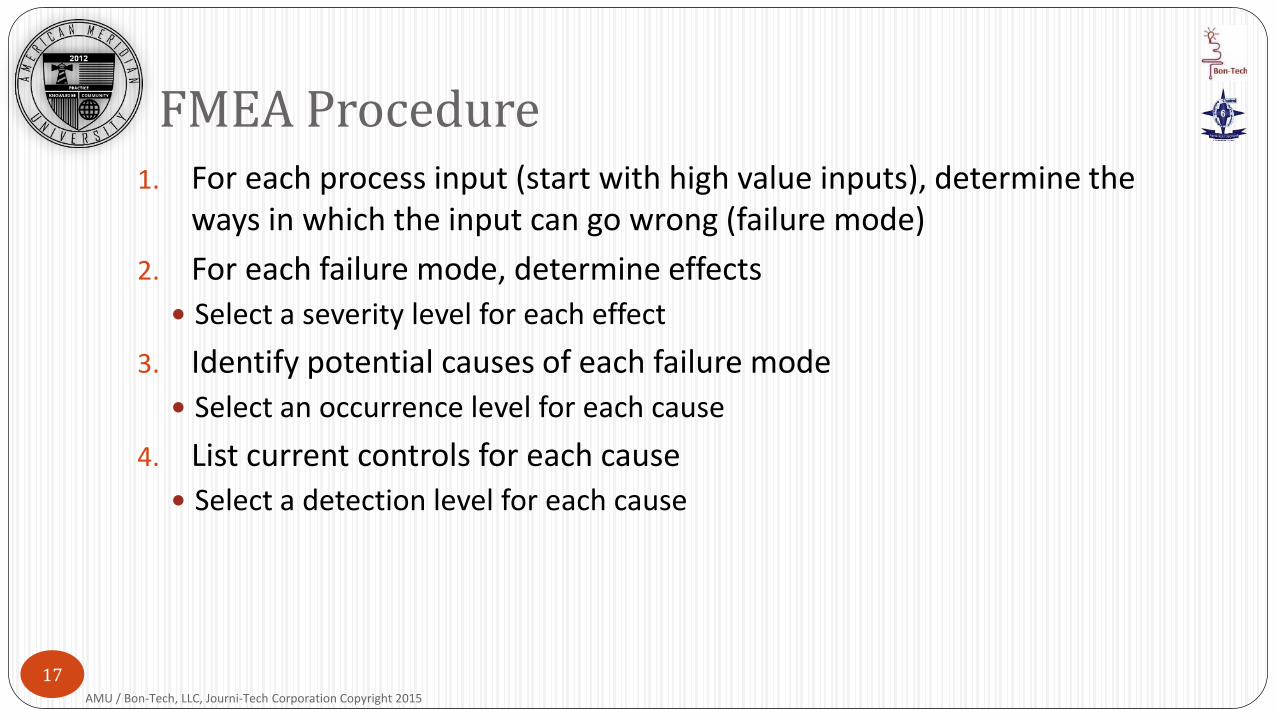
1. For each process input (start with high value inputs), determine the ways in which the input can go wrong (failure mode)
2. For each failure mode, determine effects
Select a severity level for each effect
3. Identify potential causes of each failure mode
Select an occurrence level for each cause
4. List current controls for each cause
Select a detection level for each cause
FMEA Procedure
AMU / Bon-Tech, LLC, Journi-Tech Corporation Copyright 2015
17
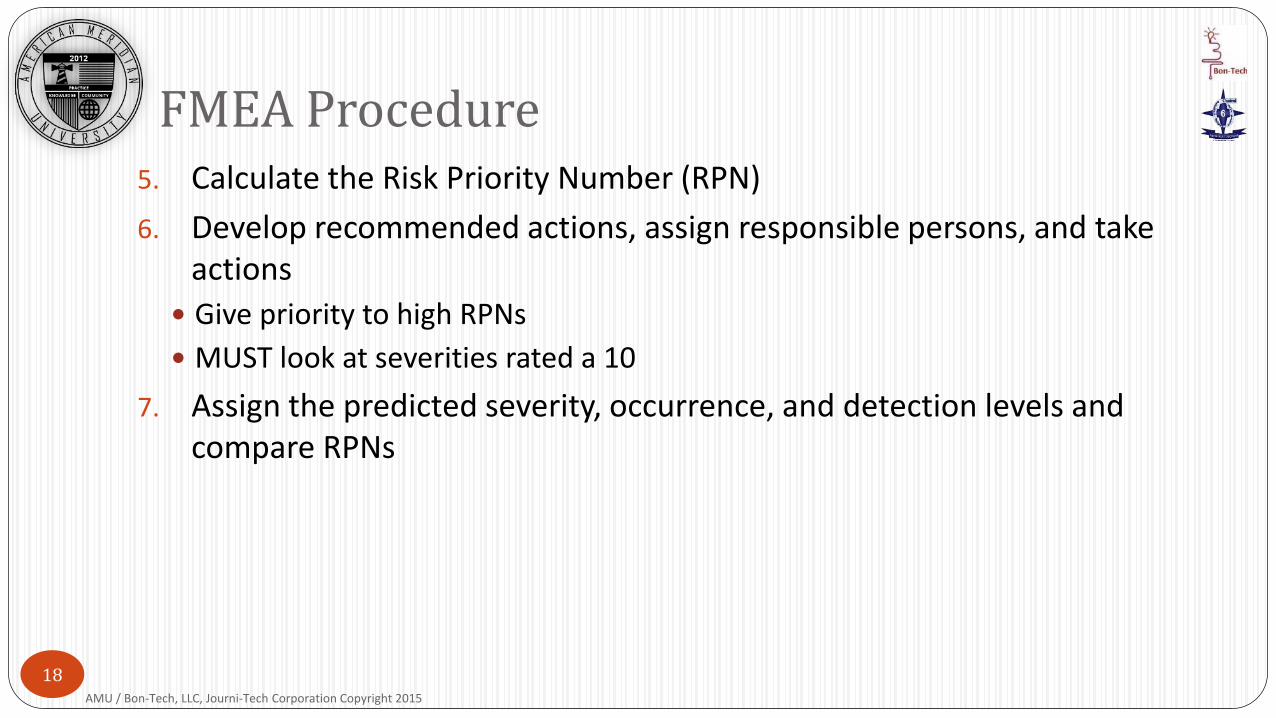
5. Calculate the Risk Priority Number (RPN)
6. Develop recommended actions, assign responsible persons, and take actions
Give priority to high RPNs
MUST look at severities rated a 10
7. Assign the predicted severity, occurrence, and detection levels and compare RPNs
FMEA Procedure
AMU / Bon-Tech, LLC, Journi-Tech Corporation Copyright 2015
18
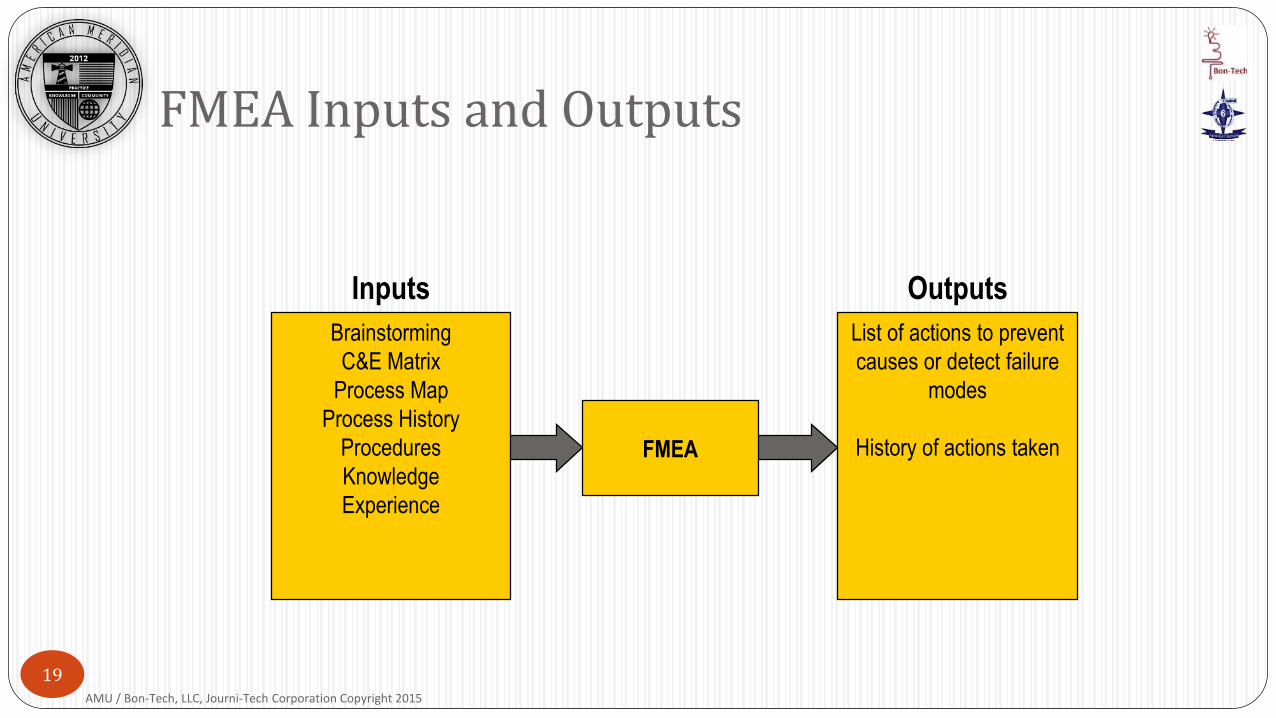
FMEA Inputs and Outputs
FMEA
Brainstorming
C&E Matrix
Process Map
Process History
Procedures
Knowledge
Experience
List of actions to prevent
causes or detect failure
modes
History of actions taken
Inputs Outputs
AMU / Bon-Tech, LLC, Journi-Tech Corporation Copyright 2015
19
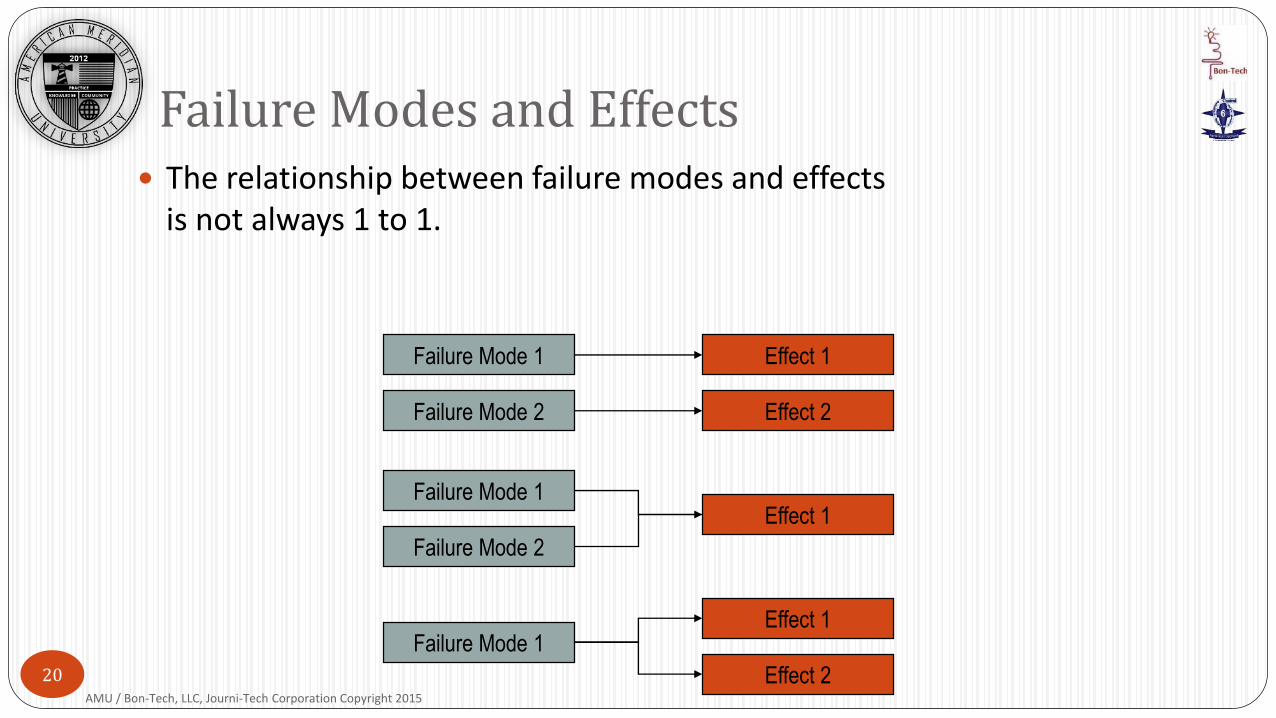
The relationship between failure modes and effects is not always 1 to 1.
Failure Modes and Effects
Failure Mode 1
Failure Mode 2
Effect 1
Effect 2
Failure Mode 1
Failure Mode 2
Effect 1
Failure Mode 1Effect 1
Effect 2AMU / Bon-Tech, LLC, Journi-Tech Corporation Copyright 2015
20
Severity
Importance of the effect on customer requirements Often can’t do anything about this
Occurrence
Frequency with which a given cause occurs and creates failure modes
Detection
The ability of the current control scheme to detect or prevent a given cause
Severity, Occurrence, and Detection
AMU / Bon-Tech, LLC, Journi-Tech Corporation Copyright 2015
21
There are a wide variety of scoring anchors, both quantitative or qualitative
Two types of scales are 1-5 or 1-10
The 1-5 scale makes it easier for the teams to decide on scores
The 1-10 scale allows for better precision in estimates and a wide variation in scores (most common)
Rating Scales
AMU / Bon-Tech, LLC, Journi-Tech Corporation Copyright 2015
22
Severity
1 = Not Severe, 10 = Very Severe
Occurrence
1 = Not Likely, 10 = Very Likely
Detection
1 = Likely to Detect, 10 = Not Likely to Detect
Rating Scales
AMU / Bon-Tech, LLC, Journi-Tech Corporation Copyright 2015
23
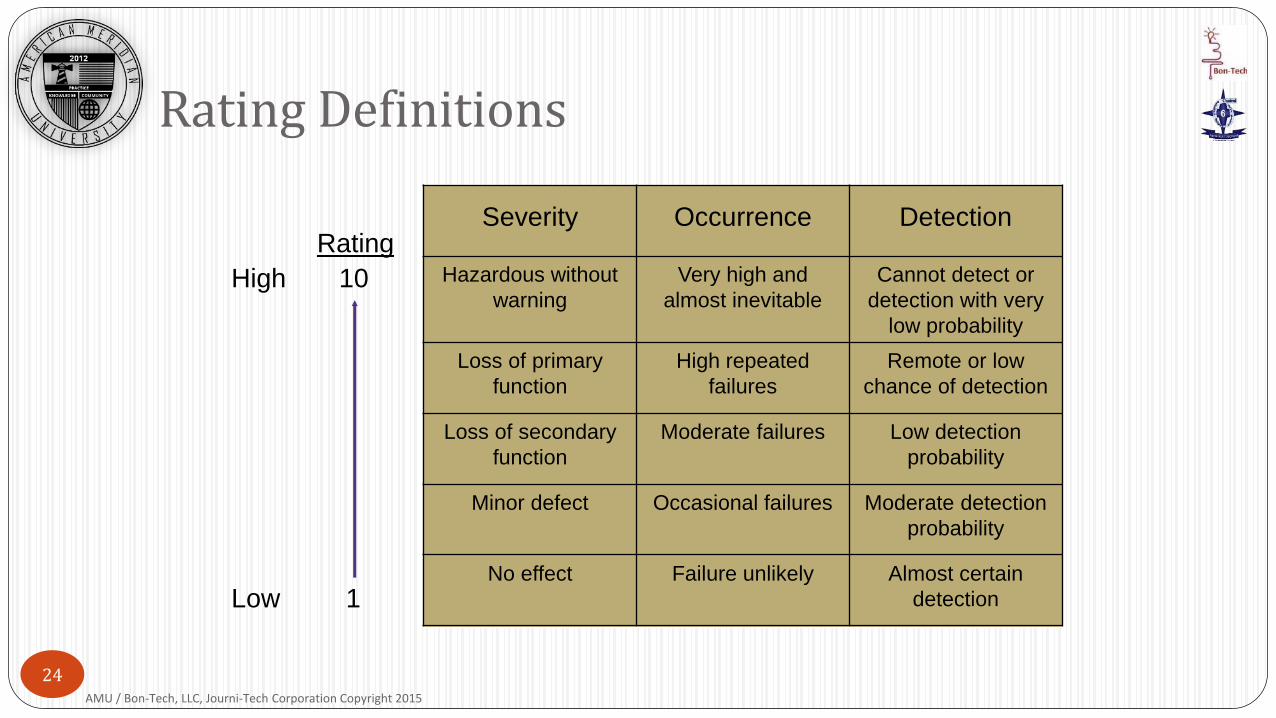
Rating Definitions
Severity Occurrence Detection
Hazardous without
warning
Very high and
almost inevitable
Cannot detect or
detection with very
low probability
Loss of primary
function
High repeated
failures
Remote or low
chance of detection
Loss of secondary
function
Moderate failures Low detection
probability
Minor defect Occasional failures Moderate detection
probability
No effect Failure unlikely Almost certain
detection
High 10
Low 1
RatingSeverity Occurrence Detection
Hazardous without
warning
Very high and
almost inevitable
Cannot detect or
detection with very
low probability
Loss of primary
function
High repeated
failures
Remote or low
chance of detection
Loss of secondary
function
Moderate failures Low detection
probability
Minor defect Occasional failures Moderate detection
probability
No effect Failure unlikely Almost certain
detection
AMU / Bon-Tech, LLC, Journi-Tech Corporation Copyright 2015
24
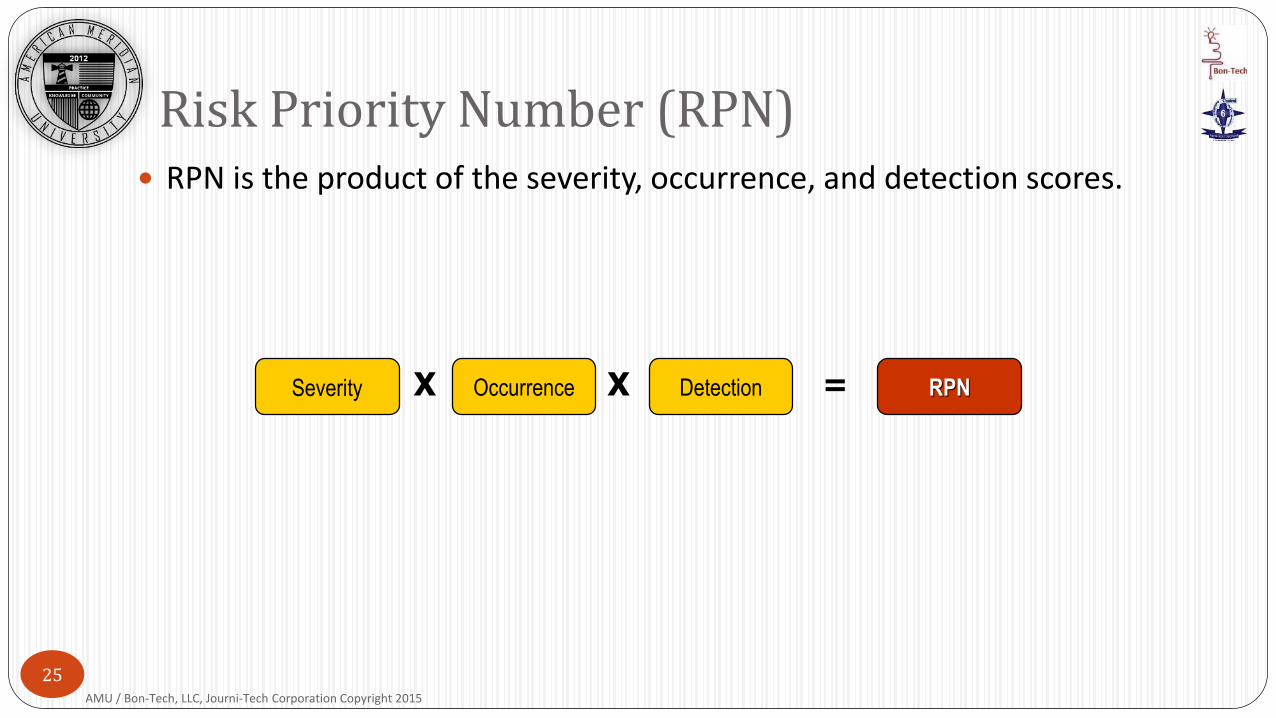
RPN is the product of the severity, occurrence, and detection scores.
Risk Priority Number (RPN)
Severity Occurrence Detection RPNX X =
AMU / Bon-Tech, LLC, Journi-Tech Corporation Copyright 2015
25
We will conduct an FMEA on a truck stop example used to create a C&E Matrix.
A Black Belt wants to improve customer satisfaction with the coffee served at the truck stop.
The process map and completed C&E matrix follow.
FMEA Example
AMU / Bon-Tech, LLC, Journi-Tech Corporation Copyright 2015
26
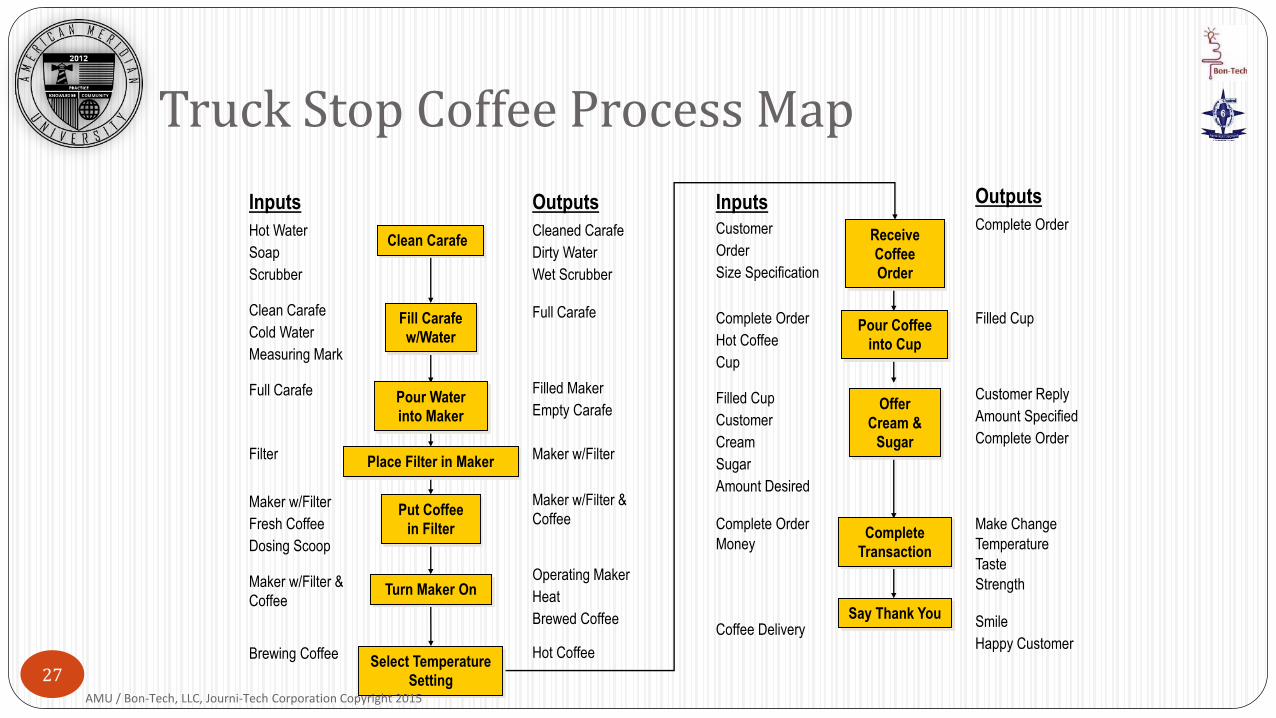
Truck Stop Coffee Process Map
Inputs OutputsInputs Outputs
Hot Water
Soap
Scrubber
Clean Carafe
Cold Water
Measuring Mark
Full Carafe
Filter
Maker w/Filter
Fresh Coffee
Dosing Scoop
Maker w/Filter &
Coffee
Brewing Coffee
Cleaned Carafe
Dirty Water
Wet Scrubber
Full Carafe
Filled Maker
Empty Carafe
Maker w/Filter
Maker w/Filter &
Coffee
Operating Maker
Heat
Brewed Coffee
Hot Coffee
Customer
Order
Size Specification
Complete Order
Hot Coffee
Cup
Filled Cup
Customer
Cream
Sugar
Amount Desired
Complete Order
Money
Coffee Delivery
Complete Order
Filled Cup
Customer Reply
Amount Specified
Complete Order
Make Change
Temperature
Taste
Strength
Smile
Happy Customer
Pour Coffee
into Cup
Offer
Cream &
Sugar
Complete
Transaction
Say Thank You
Receive
Coffee
Order
Clean Carafe
Fill Carafe
w/Water
Pour Water
into Maker
Place Filter in Maker
Put Coffee
in Filter
Select Temperature
Setting
Turn Maker On
AMU / Bon-Tech, LLC, Journi-Tech Corporation Copyright 2015
27
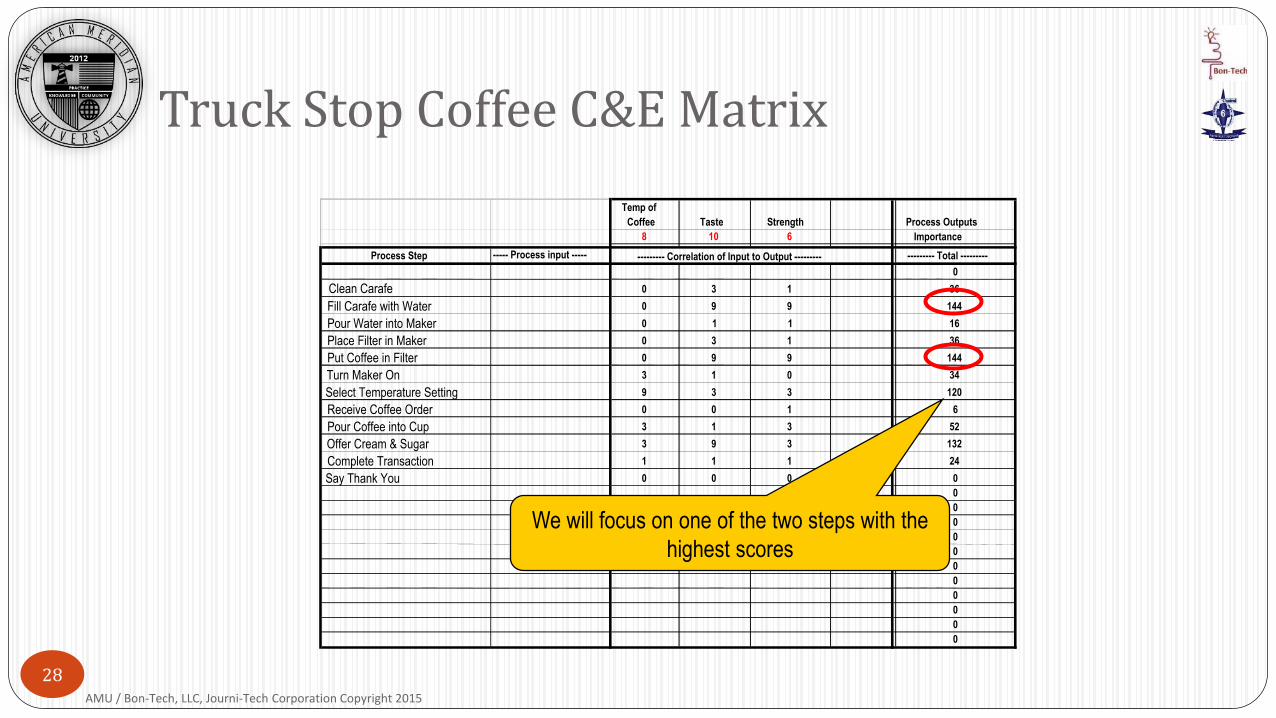
Truck Stop Coffee C&E Matrix
Temp of
Coffee Taste Strength Process Outputs
8 10 6 Importance
Process Step ----- Process input ----- --------- Total ---------
0
Clean Carafe 0 3 1 36
Fill Carafe with Water 0 9 9 144
Pour Water into Maker 0 1 1 16
Place Filter in Maker 0 3 1 36
Put Coffee in Filter 0 9 9 144
Turn Maker On 3 1 0 34
Select Temperature Setting 9 3 3 120
Receive Coffee Order 0 0 1 6
Pour Coffee into Cup 3 1 3 52
Offer Cream & Sugar 3 9 3 132
Complete Transaction 1 1 1 24
Say Thank You 0 0 0 0
0
0
0
0
0
0
0
0
0
0
0
--------- Correlation of Input to Output ---------
We will focus on one of the two steps with the
highest scores
AMU / Bon-Tech, LLC, Journi-Tech Corporation Copyright 2015
28
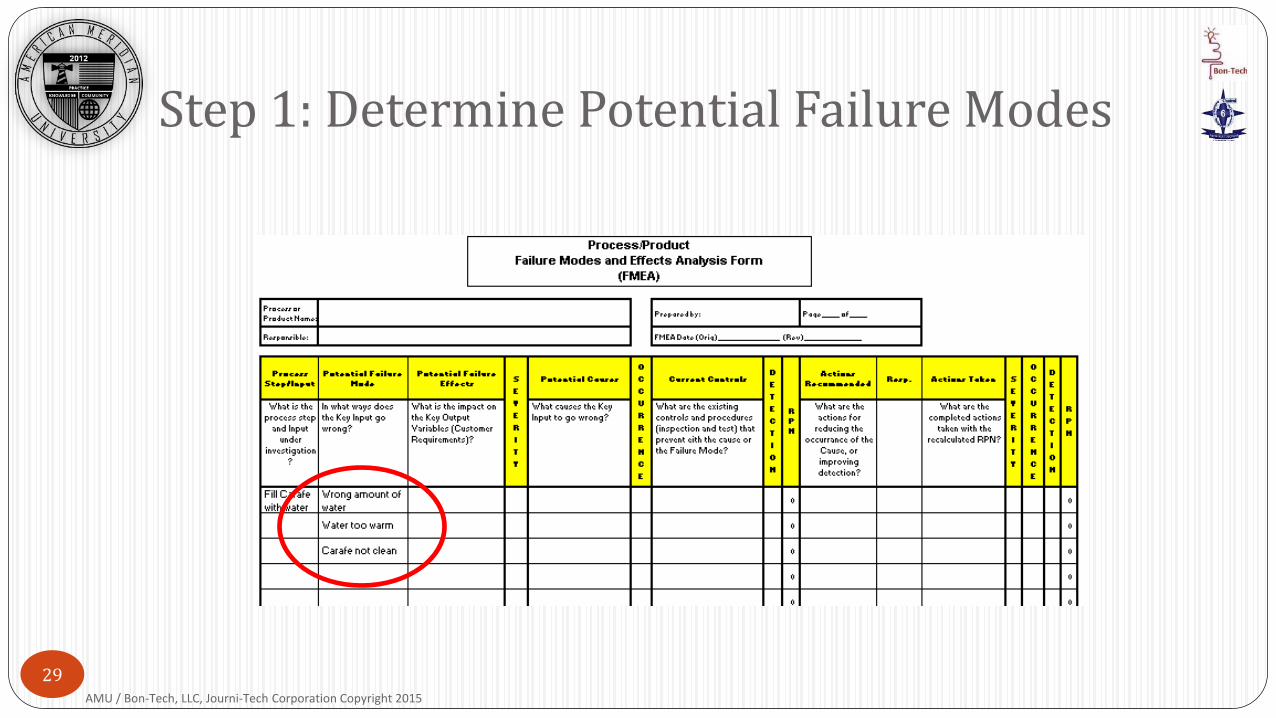
Step 1: Determine Potential Failure Modes
AMU / Bon-Tech, LLC, Journi-Tech Corporation Copyright 2015
29
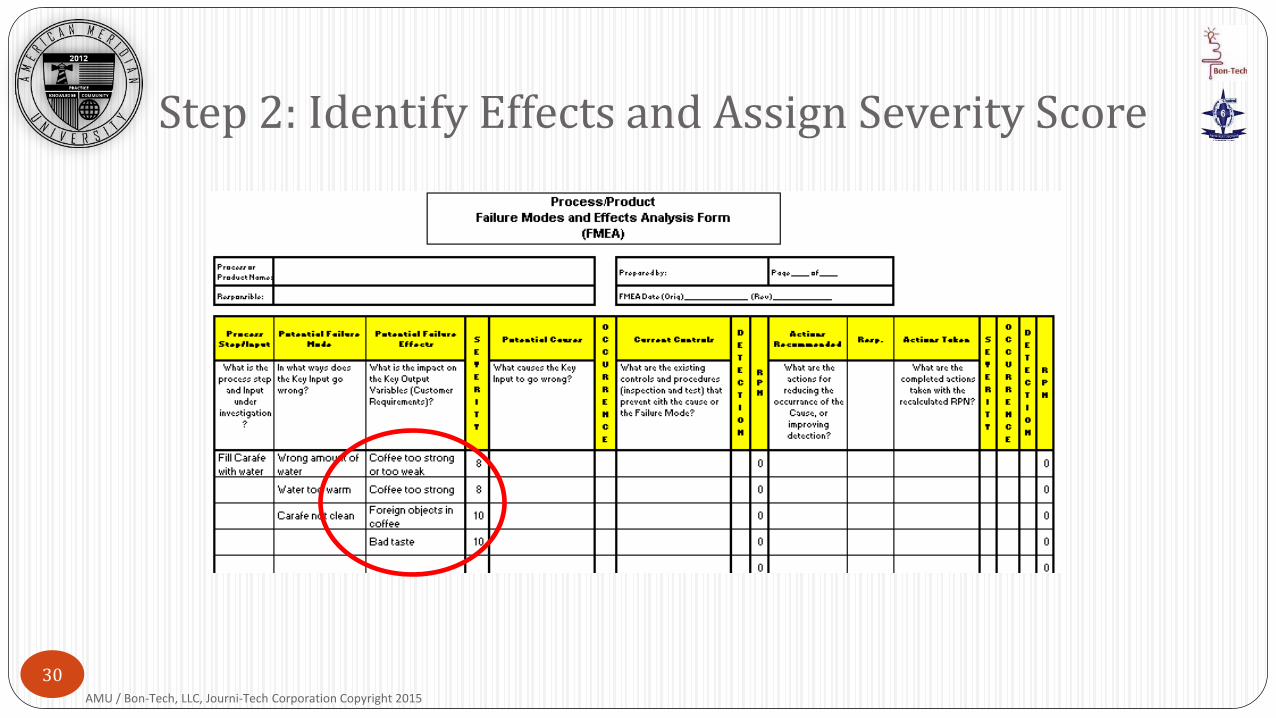
Step 2: Identify Effects and Assign Severity Score
AMU / Bon-Tech, LLC, Journi-Tech Corporation Copyright 2015
30
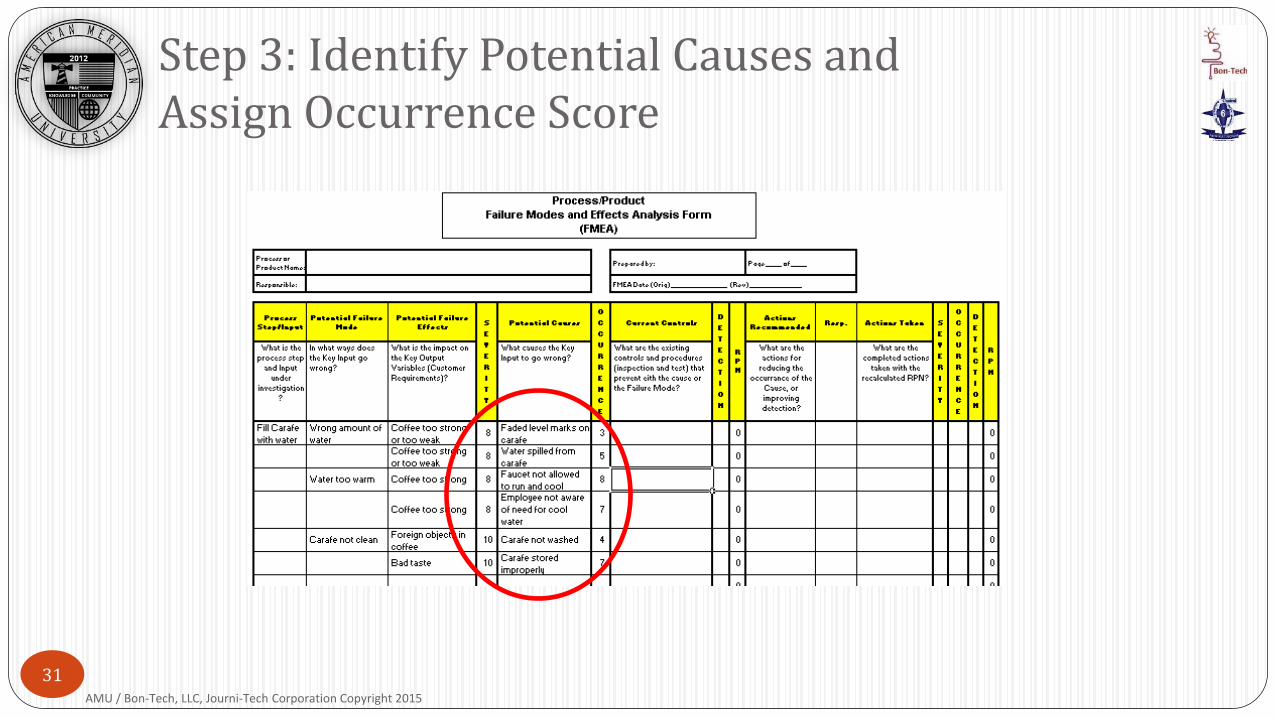
Step 3: Identify Potential Causes andAssign Occurrence Score
AMU / Bon-Tech, LLC, Journi-Tech Corporation Copyright 2015
31
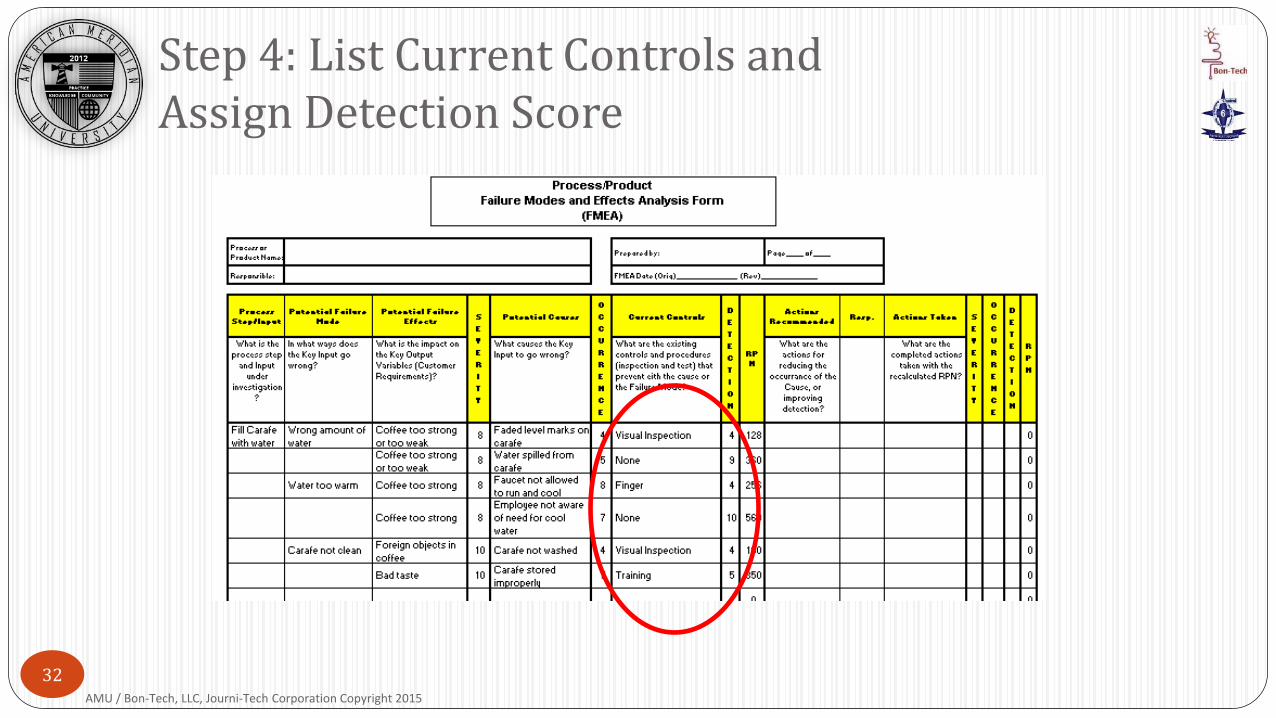
Step 4: List Current Controls andAssign Detection Score
AMU / Bon-Tech, LLC, Journi-Tech Corporation Copyright 2015
32
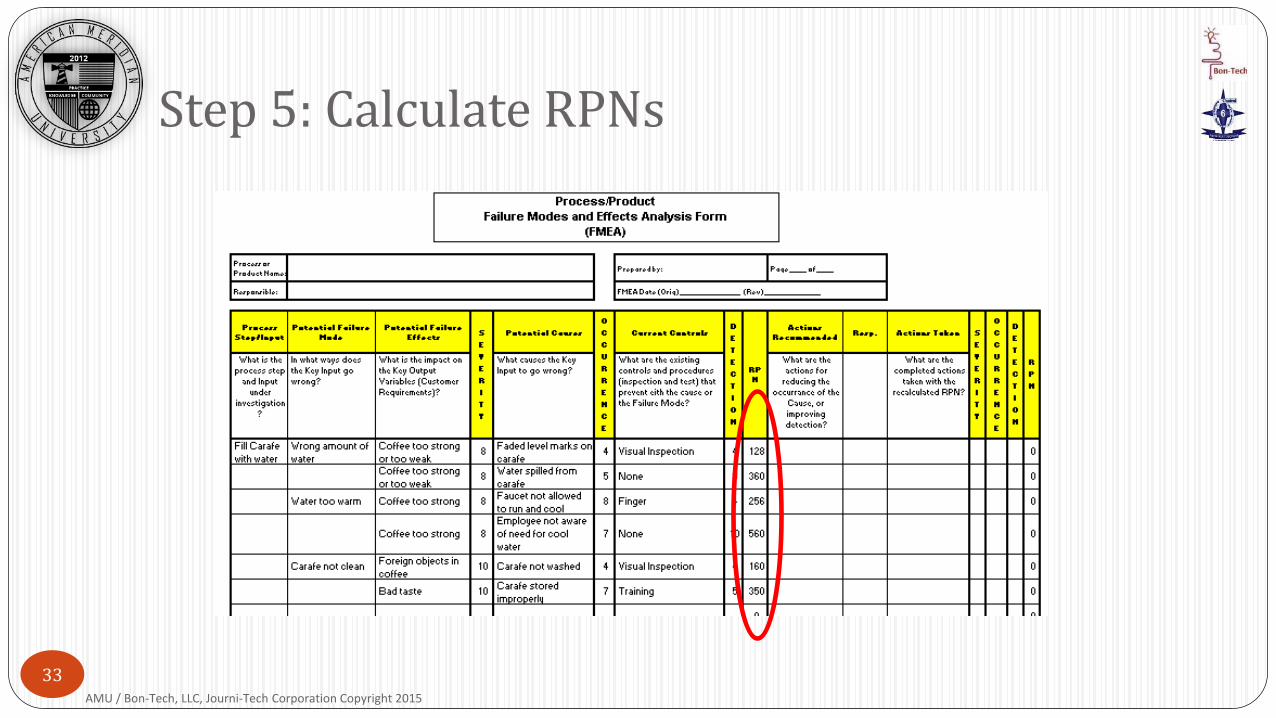
Step 5: Calculate RPNs
AMU / Bon-Tech, LLC, Journi-Tech Corporation Copyright 2015
33
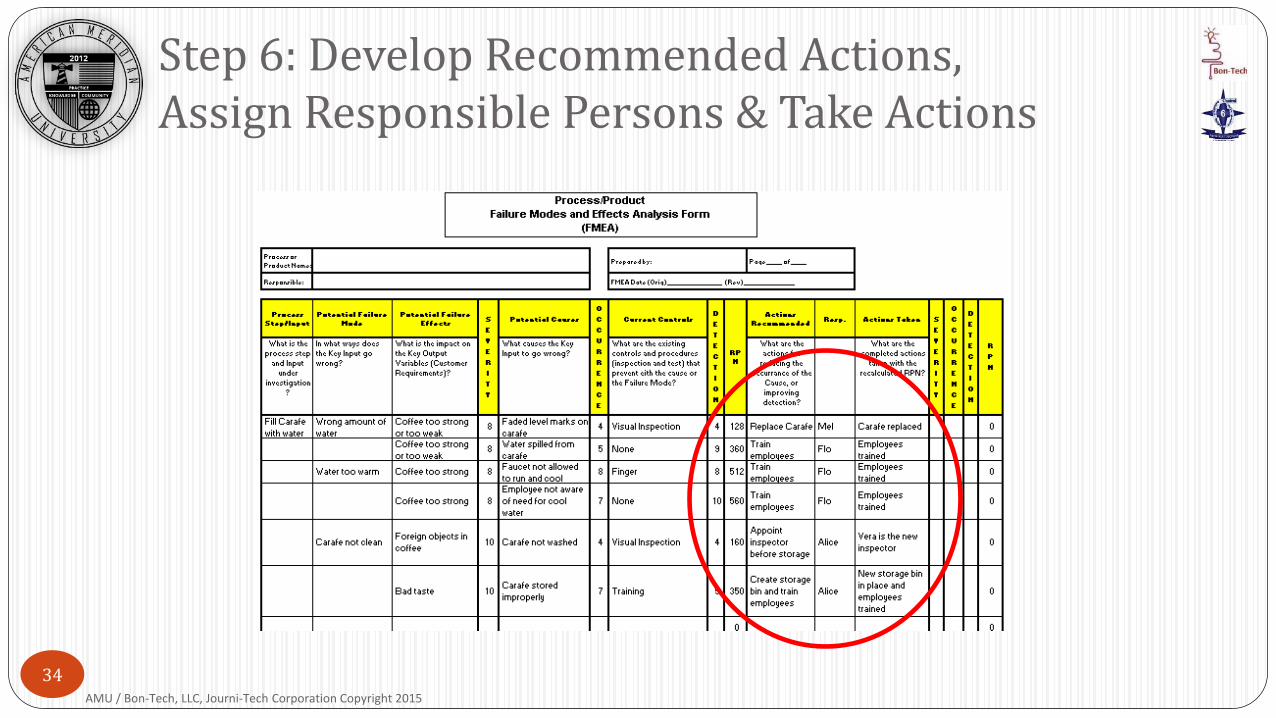
Step 6: Develop Recommended Actions,Assign Responsible Persons & Take Actions
AMU / Bon-Tech, LLC, Journi-Tech Corporation Copyright 2015
34
The objective of corrective action is to reduce one or more of the ratings:
Severity Rating Generally the only way to reduce the severity rating is through a design change
Occurrence Rating The occurrence rating can be reduced by removing or mitigating the causes, through
various process improvement methods
Detection Rating Improving the detection processes are generally the only way to reduce the detection
rating
Assignment of RESPONSIBILITY and target COMPLETION DATES are required at this point
Take Action
AMU / Bon-Tech, LLC, Journi-Tech Corporation Copyright 2015
35
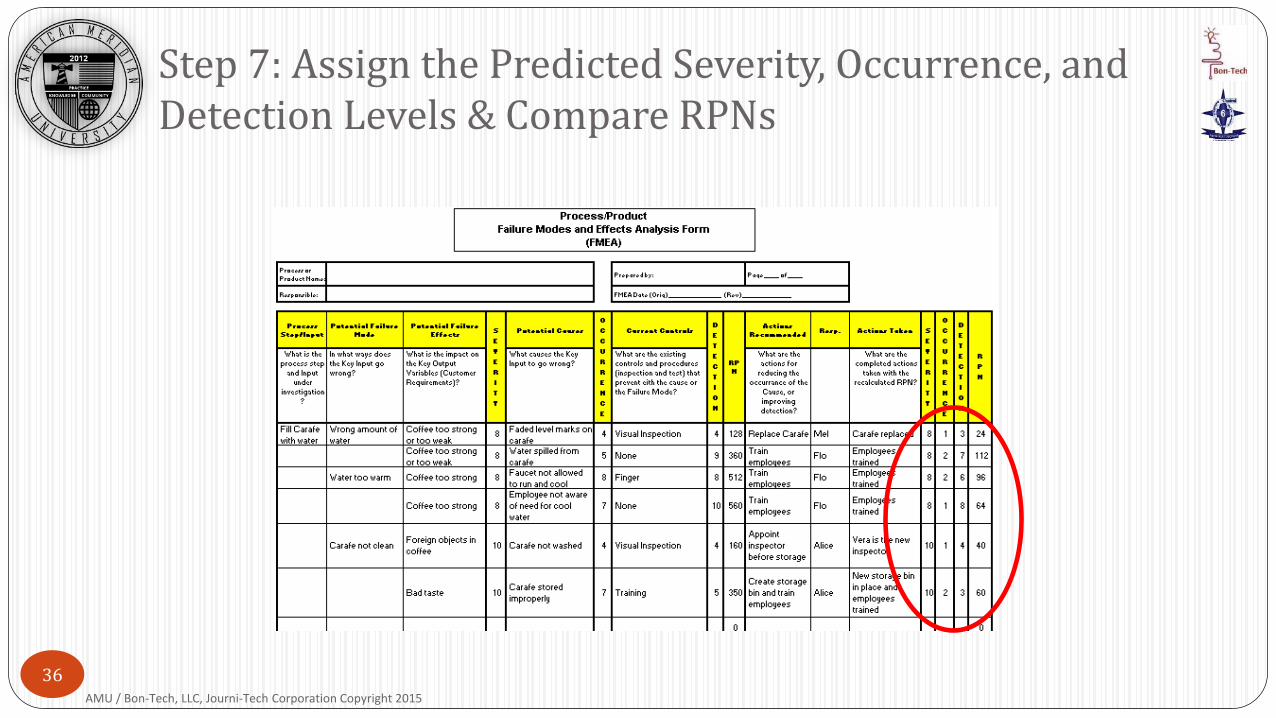
Step 7: Assign the Predicted Severity, Occurrence, and Detection Levels & Compare RPNs
AMU / Bon-Tech, LLC, Journi-Tech Corporation Copyright 2015
36
37
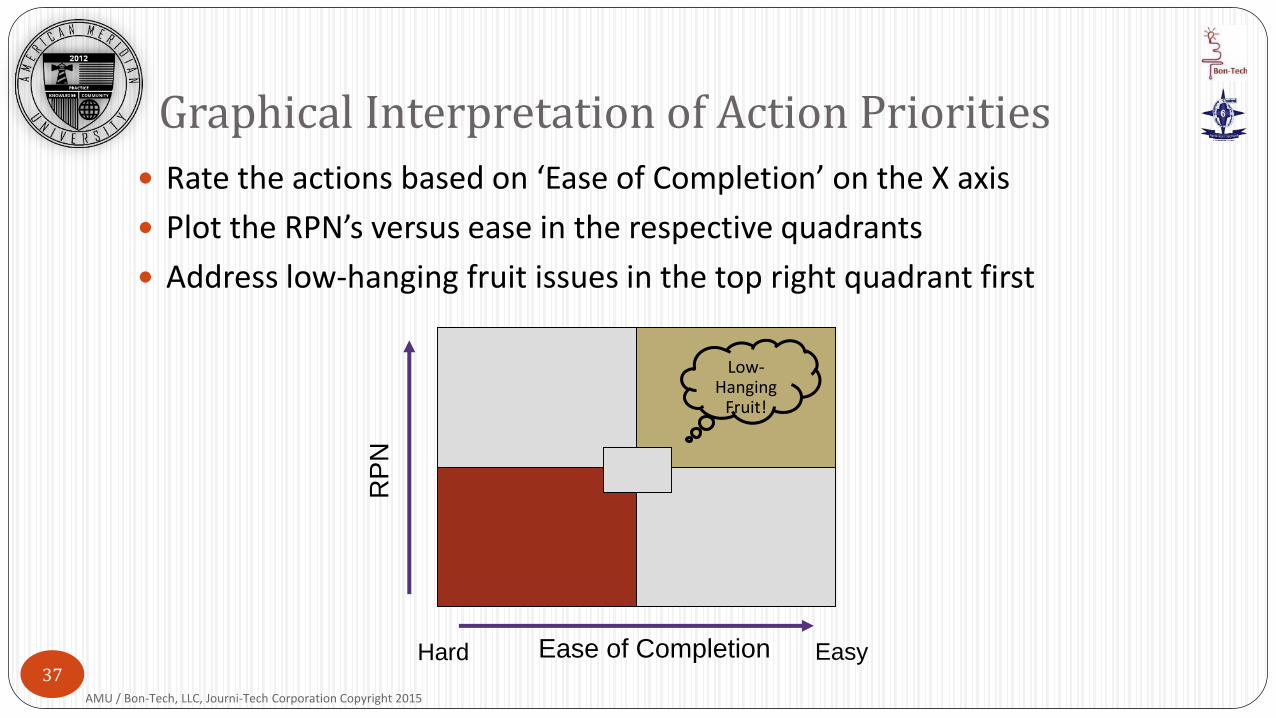
Rate the actions based on ‘Ease of Completion’ on the X axis
Plot the RPN’s versus ease in the respective quadrants
Address low-hanging fruit issues in the top right quadrant first
Graphical Interpretation of Action Priorities
Ease of CompletionHard Easy
RP
NLow-
Hanging Fruit!
AMU / Bon-Tech, LLC, Journi-Tech Corporation Copyright 2015
Are levels of the failure mode consistent?
Are the failure modes specific?
Have all the Ys been considered?
Are the assigned values for SEV, OCC, and DET consistent?
Are all failure modes & causes linked to the Process Map?
FMEA Checklist
AMU / Bon-Tech, LLC, Journi-Tech Corporation Copyright 2015
38
FMEAs are updated whenever a change is being considered
to a product’s design, application, material, etc.
to a product’s manufacturing or assembly process.
to an administrative process.
When is an FMEA complete?
a Design/Product FMEA is considered complete when the original or updated design is released.
a Product FMEA is never complete and can always be updated.
a Process FMEA is never complete unless the process is removed.
FMEAs are Living Documents
AMU / Bon-Tech, LLC, Journi-Tech Corporation Copyright 2015
39
In this module you have learned about:
The definition and purpose of an FMEA
The different types of FMEAs
The FMEA process and how it ties to process mapping
The relationship between Failure Mode, Cause, and Effect
Constructing an FMEA
Summary
AMU / Bon-Tech, LLC, Journi-Tech Corporation Copyright 2015
40