Embed Size (px)
DESCRIPTION
Optimizing the delamination failure in bamboofiber reinforced polyester composite.
Citation preview

Journal of King Saud University – Engineering Sciences (2013) xxx, xxx–xxx
King Saud University
Journal of King Saud University – Engineering Sciences
www.ksu.edu.sawww.sciencedirect.com
ORIGINAL ARTICLE
Optimizing the delamination failure in bamboo
fiber reinforced polyester composite
N. Abilash *, M. Sivapragash
Department of Mechanical Engineering, N.I. University, Kumaracoil 629180, Tamilnadu, India
Received 3 June 2013; accepted 9 September 2013
*
E
ga
Pe
10
ht
Pc
KEYWORDS
Bamboo natural fibers;
FRP composites;
Polyester;
Delamination;
Taguchi;
Grey
Corresponding author.-mail addresses: niceabi@
[email protected] (M. Siva
er review under responsibilit
Production an
18-3639 ª 2013 Production
tp://dx.doi.org/10.1016/j.jksu
lease cite this article in presomposite. Journal of King
rediffmai
pragash).
y of King
d hostin
and hosti
es.2013.0
s as: AbiSaud Un
Abstract Delamination is represented to be the most prevalent failure in composite structures. The
use of composites in the manufacturing sector plays a very important role in the industry in general.
Moreover these materials have unique characteristics when analyzed separately from constituents
which are a part of them. In this paper, a partially ecological composite was made, using natural
fibers as reinforcement (bamboo fiber), in the
polyester resin matrix to form a composite, seeking to improve the mechanical behavior among its
class of materials. The characteristics of a composite material are determined by how it behaves
while machining, Drilling is the most predominant machining process because of its cost effective-
ness when compared with other processes. Obviously delamination is the major problem that is
focused by many researchers while selecting drilling as the machining process in polymeric compos-
ites. This research mainly emphasizes on the critical parameters by varying its speed, feed, and
diameter of the cutting tool, their contribution to delamination was analyzed. Reduced delamina-
tions were identified by varying the speed and feed rate.ª 2013 Production and hosting by Elsevier B.V. on behalf of King Saud University.
1. Introduction
Composite materials have been dominant among all emergingmaterials because of its greater mechanical properties. The uti-lization of composite materials proved that it conquered new
markets relentlessly. The mechanical properties of polymers
l.com (N. Abilash), mspra-
Saud University.
g by Elsevier
ng by Elsevier B.V. on behalf of K
9.004
lash, N., Sivapragash, M. Optimiiversity – Engineering Sciences (
have shortcomings in fulfilling many structural functions. Gen-erally the mechanical strength of polymers is less compared
with metals. However such limitations can be overcome byusing treated natural fiber reinforced polymeric composites.While focusing on composite materials, the main points to
be considered are cost effectiveness and environmental friend-liness. The two main phases of composites are, a discontinuousphase called as ‘‘reinforcement’’ and a continuous phase called
as ‘‘matrix’’ which is the major constituent of the product. Thematrix separately shows less properties than when combinedwith reinforcement. It bears the load acting over it and distrib-
utes it evenly to the reinforcement. It helps in increasing theoverall mechanical properties of the composites. Moreoverfactors like constituents, concentration, and geometry of thereinforcement determine the properties of the composite to a
ing Saud University.
zing the delamination failure in bamboo fiber reinforced polyester2013), http://dx.doi.org/10.1016/j.jksues.2013.09.004
2 N. Abilash, M. Sivapragash
greater extent. Orientation of the reinforcement also has a ma-jor role in determining the mechanical properties. Volume frac-tion or concentration influences the contribution of individual
constituents to the overall properties of the composites. Hoch-eng et al. (1992) concluded that a range of cutting parametersboth feed rate and cutting speed should be conservative, since
an increase in the feed rate can cause delamination, while anincrease in the cutting speed raises the torque and consequentlyreduces the tool life. Won et al. (2002) observed that an in-
crease in feed rate has an important influence on the chiseledge effect, while an increase of tool diameter decreases this ef-fect. Delamination is mainly caused by the thrust force actingon the chisel edge. Mohan et al. (2007) have studied the influ-
ence of cutting parameters, drill diameter and thickness whilemachining GFRP composites and analyzing the delamination.Paulo Davim et al. (2004) have studied the influence of cutting
parameters (cutting velocity and feed) while machining GFRPwith two different matrices in order to study its influence alongwith those parameters on delamination.
Tsao et al. (2004) have studied the drilling of CFRP com-posite, the approach was carried out based on Taguchi tech-niques and analysis of variance. From the above literature, it
has been identified that the delamination due to the thrustforce and torque produced in drilling are important and is tobe modeled. For modeling thrust force and torque in drillinga second order polynomial regression modeling is used. Vari-
ous researchers developed several mathematical and predictivemodels to suit a particular situation but still there is a need forgood predictive model persists in order to save time and labor.
Therefore the present research initiative is to develop a predic-tive model using regression modeling to predict delaminationfactor for a particular cutting speed and feed rate in drilling
of bamboo based polyester composite. Additionally, the re-sults of delamination are compared with the oscilloscopicimages obtained during drilling. To predict the delamination
factor at the entry and exit of the hole, empirical models aredeveloped. Production of high quality holes with minimaldamage in composite materials is a key challenge. In this pa-per, delamination caused in bamboo fiber reinforced polyester
laminate plates by drilling is evaluated.
2. Natural fiber reinforced composites
Natural Fiber-Reinforced Polymeric (NFRP) composites arequickly springing up in terms of research and industrial appli-cations. Natural fiber serves as an important alternative to
man-made fibers because they are abundantly available, eco-nomical, recyclable, biodegradable and possess a high mechan-ical strength. Lingo cellulosic plant fibers like bamboo, sisal,
kenaf, cotton, jute, pineapple, banana, etc., are mainly usedas reinforcement for NFRP composites. Nowadays they areused in various applications like transportation, defense, civilengineering applications, packaging, consumer products, etc.
Natural fibers have many significant advantages over syntheticfibers. Currently, bamboo has been proved to be excellent inmechanical properties with strength and modulus (Navin
chand et al., 2007). Evolution of next generation materials isonly possible with polymeric composites with biodegradability.Biodegradable plastics take up the part of giving eco-friendly
products that can compete with products made of petroleumfeedstock and capture the changing markets. Natural or bio
Please cite this article in press as: Abilash, N., Sivapragash, M. Optimicomposite. Journal of King Saud University – Engineering Sciences (
fiber composites are emerging as a feasible alternative to syn-thetic fiber reinforced composites especially in the field of auto-motive and civil engineering applications. Combining bio
fibers such as bamboo with polymer matrices produce compos-ite materials that are competitive with synthetic compositematerials which require special attention; however bamboo fi-
ber polyester composites are not fully eco-friendly because ofthe non biodegradable nature of the polymer matrix. But theutilization of natural fibers with such polymers will allow many
environmental consequences to be solved. Natural fibers withunsaturated polyester matrix is highly beneficial than thoseof the unreinforced plastics because of the resulting strengthand toughness of the composites. Moreover, cellulosic natural
fibers are strong enough, light in weight, cheap, abundant, andrenewable (Abdalla Rashdi et al., 2010).
3. Compression molding
Bamboo fiber reinforced polymeric composite is preparedusing hand layup and compression molding. Initially NaOH
is treated with bamboo fabric mesh with 10% concentration,then it is washed using distilled water till the entire chemicalconcentration was eliminated, it is then dried in hot air oven
for 30 s and samples were weighed based on the requirement(Dhakal et al., 2006). Treating the fibers with NaOH helps inmending the interfacial bonding between the resin and fiber
ensuing better mechanical properties. Several authors statethat mechanical properties of composites can be improvedby chemically treating the fibers (Yuhazri et al., 2011). Herethe mesh is weaved with 0/90� orientation. Knitted bamboo
fabric after fiber treatment is washed in water to remove thealkalinity and is dried at around 100 �C to remove completelythe moisture content present in the fabric using hot air oven
(Valadez-Gonzalez et al., 1999). Known amount of unsatu-rated polyester resin mixed with Kerox ME-50 (MEKP) cata-lyst and Kerox C-20 accelerator at a concentration of 0.01 w/w
for rapid curing was coated on a pre-weighed bamboo fibermat after applying resin, it was uniformly leveled with minorpressure using roller to remove the air packets within the lay-
ers. The bamboo fiber and polyester resin were left free for2 min to allow air bubbles to escape from the surface of the re-sin, and then the coated layers were placed in a mold whichwas sealed with Teflon sheet coated with polymer release
agents like silicone spray and grease all around. The moldwas then closed and made compact using a hydraulic pressat a temperature of 35 �C and at a pressure of 10 bar for about
3 min. After being taken out from the hydraulic press, it is keptin a vaccum furnace where high fiber bonding happens withthe matrix thereby the delaminating tendency tends to reduce
and then it is allowed for cooling at room temperature forfew hours. After that the specimens of required dimensionswere cut using a diamond tool cutter.
In compression molding the preheated polymeric composite
is kept in a mold cavity with heating coils inbuilt to provideuniform heat as per the requirement. The upper cover plateof the mold is closed when the plunger of hydraulic press gets
lowered and pressure is applied to act evenly on all surfaces.Uniform heat and pressure are maintained to create a homoge-neous layer, and then the polymeric composite is held in a vac-
cum furnace which reduces the nature of debonding, it isfollowed by curing at room temperature for some time. Most
zing the delamination failure in bamboo fiber reinforced polyester2013), http://dx.doi.org/10.1016/j.jksues.2013.09.004

Table 1 Details of Parameters and Levels.
Parameters Level-1 Level-2 Level-3
A Dia of tool (mm) 4 6 8
B Spindle speed (RPM) 500 860 1360
C Feed rate (mm/min) 18 26 34
Figure 1 Radial drilling machine set-up.
Optimizing the delamination failure in bamboo fiber reinforced polyester composite 3
compression molding applications use thermoset as polymersnowadays; because of its ease in processing and minimizationof debonding. Compression molding is best suitable for mold-
ing complex elements where high-strength is required. Becauseof the advantage in producing complex parts major industrieschoose compression molding techniques to produce parts in re-
duced cycle time.
4. Theoretical background
Design of experiments is a potential tool for modeling andanalyzing the influence of process variables (Mohana et al.,2007). The main requirement in the design of experiment
dwells in the choice of selecting the control factors. The tagu-chi approach provides a systematic direction to gather, exam-ine, and understand data to meet the objectives of this
research. Using taguchi approach, in design of experiments,one can gather maximum information about the experimenta-tion carried over. By setting design parameters and their levelsas shown in Table 1, taguchi parameter design can optimize
the performance characteristics and reduce the source of vari-ation (Basavarajappa et al., 2009). Taguchi method employs apeculiar design of orthogonal array to examine the entire
parameter with minimum experiments conducted. The experi-mental results are then transformed into a signal-to-noise (S/N) ratio by considering noise factors. The S/N ratio for each
level of process parameters is calculated based on the S/Nanalysis. Usually, there are three quality characteristics in S/N ratio analysis. They are, lower-the-better, higher-the-better,and nominal-the-better. Therefore by selecting the suitable
characteristics, the optimal process parameters level is identi-fied. Moreover, a statistical analysis of variance (ANOVA) isperformed to see which process parameters are statistically sig-
nificant. With the S/N and ANOVA analyses, the optimalcombination of the process parameters can be predicted. Final-ly, optimization is conducted to verify the contribution of each
parameter and their significance in obtaining the result.To receive higher quality yields while optimizing the pro-
cess parameters, it is essential to follow some steps in selecting
the factors, which mainly affect the process results. Then theselected factors should be divided into several levels based ondesign and ensure that all maximum combinations are takeninto consideration. In this case, the number of all possible
potential combinations represents the number of needed
Table 2 L18 Orthogonal Array for Input variables.
Exp. No 1 2 3 4 5 6 7 8
Tool dia (mm) A1 A1 A1 A2 A2 A2 A3 A
Spindle speed (RPM) B1 B2 B3 B1 B2 B3 B1 B
Feed rate (mm/min) C1 C2 C3 C1 C2 C3 C2 C
Please cite this article in press as: Abilash, N., Sivapragash, M. Optimicomposite. Journal of King Saud University – Engineering Sciences (
experiments. Here, orthogonal arrays make it possible toaccomplish fractional factorial experiments in order to avoidnumber of experimental works and also to provide shortcuts
for optimizing elements. The influence of orthogonal arraysdepends mainly on the number of factors and process levelsconsidered. Mostly, output factors like thrust force, torque
and delamination depend mainly on the machining conditions,such as feed, cutting speed, and tool diameter. Here the exper-iment is carried out with three input factors at three different
levels and output values are tabulated. Table 2 shows the detaildesign of L18 orthogonal array for input variables.
5. Machining the composite
Drilling process is conducted in SMT radial drilling machine.The drilling variables include the speed ranges of 500, 860,
1360 rpm, feed ranges of 18, 26, 34 mm/min and drill tooldiameter ranges of 4, 6, 8 mm are selected based on L18 orthog-onal array. For different cutting conditions the thrust forceand torque were measured using IEICOS two-channel piezo-
electric type drill tool dynamometer.The general arrangement of the experimental set-up is
shown in Fig. 1, Burrs and dust particles generated during dril-
ling were removed using a vaccum blower. The dynamometerwas connected by a data acquisition system that is assembledin a personal computer (PC) to monitor the test values and fre-
quency waves through RIGOL DS1000D series DSO (Digitalsignal oscilloscope). The output signals received from thedynamometer were filtered and amplified using charge amplifi-ers and then the amplified signals of thrust and torque were fed
as input to a personal computer through the digital storageoscilloscope for further analysis. The electrical output signals(DC volt) from strain gauges for both thrust force and torque
were calibrated using thrust and torque calibration trigger inthe data acquisition system for any known value. The variation
9 10 11 12 13 14 15 16 17 18
3 A3 A1 A1 A1 A2 A2 A2 A3 A3 A3
2 B3 B1 B2 B3 B1 B2 B3 B1 B2 B3
3 C1 C3 C1 C2 C2 C3 C1 C3 C1 C2
zing the delamination failure in bamboo fiber reinforced polyester2013), http://dx.doi.org/10.1016/j.jksues.2013.09.004

Figure 2 Frequency waves in DSO.
4 N. Abilash, M. Sivapragash
in values of thrust force and torque while drilling a hole withrespect to machining time were plotted as frequency wave
forms in the digital signal oscilloscope shown in Fig. 2, Theoutput signals from the oscilloscope is noticed in terms of timesignal and frequency amplitudes, variation in amplitudes hap-
pens because of the frictional component arising due to thephenomenon of rubbing mechanism over a larger surface areaof contact is the reason for this increase. Frequency bandwidth
is narrower with the lower frequency occurring from a valueapproximately 20 kHz and ending at 245 kHz are also ob-served here. Frequency plots shown in Fig. 2 reveal that the
amplitudes of the time signal are very largely rising to a max-imum of about 500 ms and decreasing exponentially to 2 ms,over that time the voltage is varied from 510 mV to 25 mV.The variation in signal is more conspicuous than in contact
Figure 3 Top and bottom surface of
Please cite this article in press as: Abilash, N., Sivapragash, M. Optimicomposite. Journal of King Saud University – Engineering Sciences (
and actual drilling. Pure bamboo composite laminates shouldshow different behavior from resin to fibers. Observing the16th hole contact friction reveals a greater variation in ampli-
tudes, which rise to a peak value of approximately 210 mVand reduces approximately to 25 mV at 150 ms. The presenceof fibers, which have different surface characteristics compared
with resin, could contribute to this behavior. The most inter-esting observations are made while observing 18th hole. Thepeak frequency occurs at 146.4 kHz with a secondary lower
peak on the left occurring at 122 kHz. The time signal valuesdo not get delayed and are sustained over the entire lengthof the process. The values of the amplitudes are large and norepetitions are noticed from several waveforms, which are ob-
tained. By referring to the figure, random fluctuations in theamplitude are noticed. The reason for randomness in theamplitudes is due to the non-uniformity and irregularity in
the cutting dynamics caused due to the fiber and matrix inter-phase meets alternately the cutting edges when drill bit ismoved in the axial direction as well as during rotation. The fre-
quency signals were used to investigate the influence of cuttingvariables on thrust force and torque.
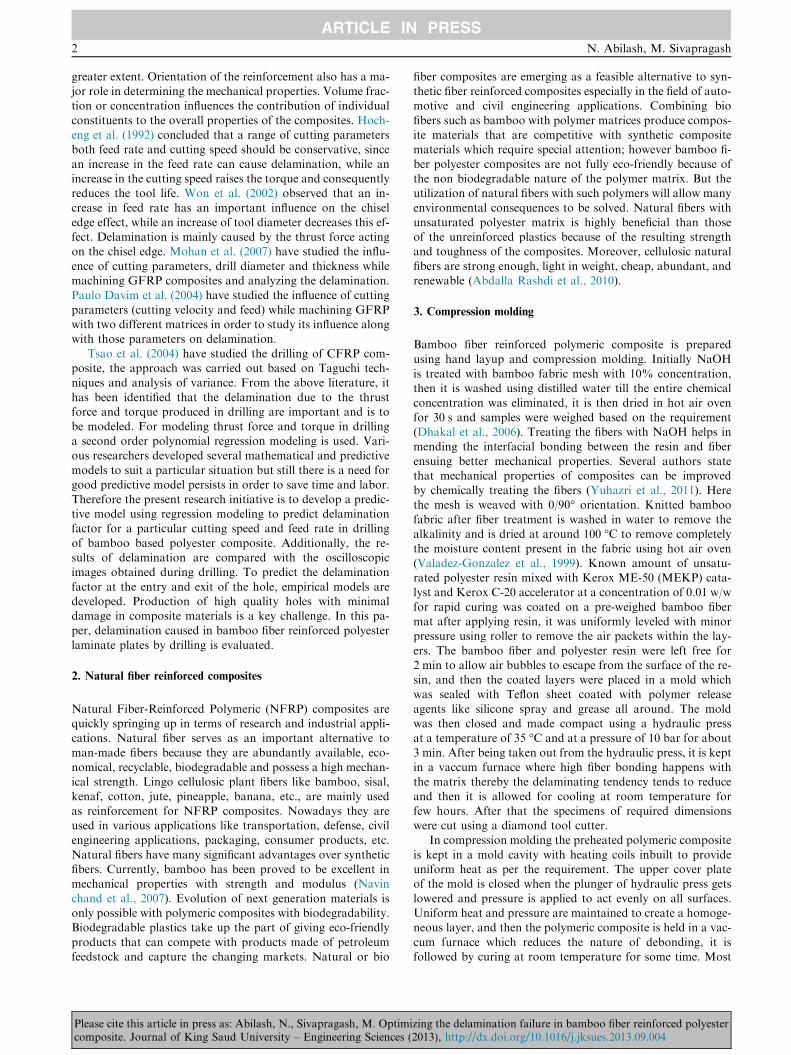
6. Delamination measurements
The delamination factor is the level to categorize the damageon the test specimen at the entry and exit of the drill during
the machining process. The delamination factor (Fd) is the ra-tio of the maximum diameter (Dmax) of the delamination areato the drill diameter (D0), this can be calculated as
Fd ¼Dmax
D0
drilled specimen with dimensions.
zing the delamination failure in bamboo fiber reinforced polyester2013), http://dx.doi.org/10.1016/j.jksues.2013.09.004
Table
3L18OrthogonalArraywithmeasuredoutput.
Expt.No
Dia
oftool(m
m)
Spindle
speed(R
PM)
Feedrate
(mm/m
in)
Fd
FdA
Thrust
force(N
)Torque(N
m)
Peelup
Push
out
Peelup
Push
out
14
500
18
1.11
1.073
1.096
1.096
4.847
1.3
24
860
26
1.05
1.075
1.102
1.685
4.917
1.404
34
1360
34
1.298
1.383
1.657
1.734
5.001
1.349
46
500
18
1.166
1.366
1.157
1.32
3.723
1.254
56
860
26
1.14
1.228
1.152
1.342
4.571
1.285
66
1360
34
1.292
1.387
1.563
1.838
5.041
1.261
78
500
26
1.062
1.122
1.485
1.838
5.07
1.389
88
860
34
1.248
1.337
1.593
1.937
4.988
1.405
98
1360
18
1.22
1.322
1.66
1.918
5.056
1.311
10
4500
34
1.235
1.1
1.44
1.21
4.411
1.332
11
4860
18
1.22
11.454
1.401
4.112
1.317
12
41360
26
1.257
1.111
1.584
1.378
4.988
1.365
13
6500
26
1.197
1.1
1.315
1.21
4.225
1.311
14
6860
34
1.283
1.283
1.307
1.316
6.295
1.577
15
61360
18
1.143
1.277
1.283
1.387
5.182
1.281
16
8500
34
1.162
1.381
1.423
1.66
5.698
1.315
17
8860
18
1.112
1.317
1.176
1.69
4.217
1.459
18
81360
26
1.3
1.389
1.618
1.927
5.117
1.469
Optimizing the delamination failure in bamboo fiber reinforced polyester composite 5
Please cite this article in press as: Abilash, N., Sivapragash, M. Ocomposite. Journal of King Saud University – Engineering Scien
ptimices (
Fd which is the conventional delamination factor represents the
crack propagation size, whereas Fda represents the area ofdamage caused because of drilling (Paulo Davim et al.,2007). Parameters like a and b represents the weights. Davim
et al. proposed an approach to find the value of the conven-tional (Fd) and adjusted (Fda) delamination factors (Rubioet al., 2008). Therefore,
Fda ¼ a � þb � F2d
Fda ¼ aDmax
D0
þ bAmax
A0
Fda ¼ ð1� bÞ � Fd þ b � F2d
Fda ¼ Fd þAd
ðAmax � A0ÞðF2
d � FdÞ
where Amax is the area that corresponds to the maximum diam-eter of damage zone (Dmax) and A0 is the area related to thenominal hole (D0).
In this paper an accurate inexpensive method for measuring
the delamination size has been considered. The equipments re-quired for this technique are PC, color flatbed scanner, DSOand image software (CorelDraw). The specimen to be tested
was placed directly on the scanning bed of the scanner. Thescanner used is ‘‘Canon color scanner’’. The image of thedrilled specimen was acquired, with 400 DPI resolution, using
the scanning software, delamination zone of the compositespecimens was clearly observed around the drilled hole dueto transmitted light passing through it.
By using the features such as contrast, brightness and
focusing utilities the shadow zone can easily distinguish fromthe other undamaged areas. Then this image is saved in aBMP format. Then, this file was imported to the coreldraw
software and the photo was magnified up to 30X. Circles weredrawn to the delamination zone and to the original drill size.The dimensions of the delaminated zone were measured using
ruler tool of photoshop software. Fig. 3 shows the specimenswith dimensions drawn. The size of delamination is definedas the difference between the maximum damage radius and
the drilled hole radius. This technique was calibrated by mea-suring the area of delamination using an optical microscope.Since, the error lies in the range of 0.2–0.5%. This range wasaccepted when compared with the measurements carried out
using CCD sensor (Khashaba, 2004).Table 3 shows the output obtained after measuring the
dimensions of the drilled hole and delamination factors were
calculated based on the formulas mentioned and thrust andtorque values were monitored using a dynamometer while dril-ling was carried out.
7. Analysis of S/N ratio
The desirable value (mean) is represented by the term signal
for the output characteristics and the undesirable value (S.D)is represented by the term noise for the output characteristicsof taguchi method given in Table 4. Hence, S/N ratio is the ra-
tio of the mean to the standard deviation. Taguchi methoduses the S/N ratio to measure the deviation from the desiredvalue of quality characteristics. The S/N ratio suited for thisapproach is lower-the-better defined as g = �10 log10
zing the delamination failure in bamboo fiber reinforced polyester2013), http://dx.doi.org/10.1016/j.jksues.2013.09.004

Table 4 Analysis of S/N ratio.
Expt.
No
Dia of
tool (mm)
Spindle speed
(RPM)
Feed rate
mm/min
S/N
Fd-Ent
S/N
Fd-Exit
S/N
Fda-Ent
S/N
Fda-Exit
S/N
Thrust
S/N
Torque
1 4 500 18 �0.9065 �0.612 �0.7962 �0.7962 �13.7095 �2.27892 4 860 26 �0.4238 �0.6282 �0.8436 �4.532 �13.834 �2.94733 4 1360 34 �2.2655 �2.8164 �4.3865 �4.781 �13.9811 �2.60024 6 500 18 �1.334 �2.709 �1.2667 �2.4115 �11.4179 �1.9665 6 860 26 �1.1381 �1.784 �1.229 �2.5551 �13.2002 �2.17816 6 1360 34 �2.2253 �2.8415 �3.8792 �5.2869 �14.0503 �2.01437 8 500 26 �0.5225 �0.9999 �3.4345 �5.2869 �14.1002 �2.8548 8 860 34 �1.9243 �2.5226 �4.0443 �5.7426 �13.9585 �2.95359 8 1360 18 �1.7272 �2.4246 �4.4022 �5.657 �14.0761 �2.352110 4 500 34 �1.8333 �0.8279 �3.1672 �1.6557 �12.8907 �2.490111 4 860 18 �1.7272 0 �3.2513 �2.9288 �12.2811 �2.391712 4 1360 26 �1.9867 �0.9143 �3.9951 �2.785 �13.9585 �2.702713 6 500 26 �1.5619 �0.8279 �2.3785 �1.6557 �12.5165 �2.352114 6 860 34 �2.1645 �2.1645 �2.3255 �2.3851 �15.9799 �3.956615 6 1360 18 �1.1609 �2.1238 �2.1645 �2.8415 �14.2899 �2.15116 8 500 34 �1.3041 �2.8039 �3.0641 �4.4022 �15.1144 �2.378517 8 860 18 �0.9221 �2.3917 �1.4081 �4.5577 �12.5001 �3.281118 8 1360 26 �2.2789 �2.854 �4.1796 �5.6976 �14.1803 �3.3404
6 N. Abilash, M. Sivapragash
(M.S.D) where, M.S.D is the mean-square deviation for theoutput characteristics. In order to obtain an optimal cutting
performance, a lower-the-better quality characteristic is se-lected for giving minimum delamination. The optimum processdesign is achieved by scoring a maximum S/N ratio. Since �logis a monotonically decreasing function, it implies that weshould maximize the M.S.D. Lower-the-better quality charac-teristic can be represented by the relation given below
S
N¼ �10 log 1
nðX
y2Þ
Figure 4 S/N ratio for Fd entry.
Figure 5 S/N ratio for Fd exit.
Please cite this article in press as: Abilash, N., Sivapragash, M. Optimicomposite. Journal of King Saud University – Engineering Sciences (
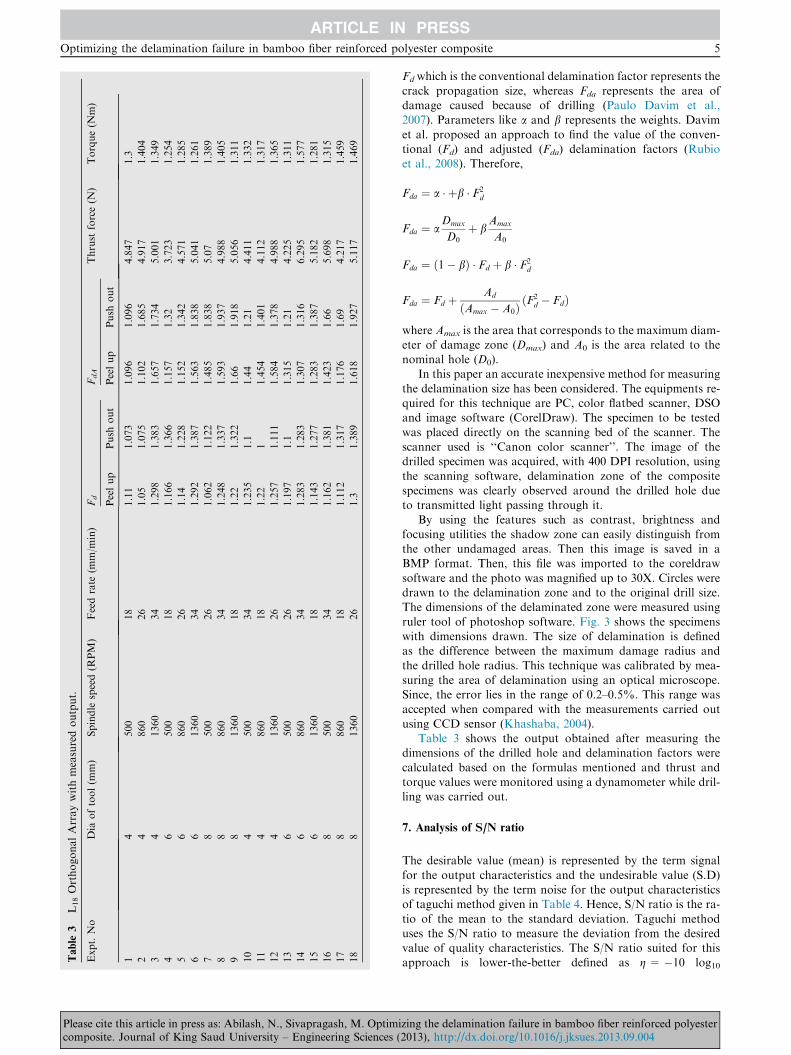
Figs. 4 and 5 show the S/N ratio for Fd entry and exit. Thevalue corresponding to �0.423 for the second experiment in
Fig. 4 and the value corresponding to zero for the eleventhexperiment in Fig. 5 show that the process is optimum at theselevels to show a minimum delamination at entry and exit lev-
els. Similarly Figs. 6 and 7 show the S/N ratio for adjusteddelamination factors at entry and exit. The value correspond-ing to �0.796 for the first experiment in Fig. 6 and the value
corresponding to �0.796 for the first experiment in Fig. 7 showthe process is optimum at these levels to show a minimum ad-justed delamination at entry and exit levels. Thrust force isoptimum in the fourth experiment with S/N ratio �11.417
Figure 6 S/N ratio for Fda entry.
Figure 7 S/N ratio for Fda exit.
zing the delamination failure in bamboo fiber reinforced polyester2013), http://dx.doi.org/10.1016/j.jksues.2013.09.004
shownin
Fig.8;moreo
ver
torqueis
optim
um
inthefourth
experim
entwith
S/N
ratio�1.966given
inFig.9.Asallthese
values
are
optim
um
attheir
single
objectiv
elev
elbyconsid
er-ingthetaguchiapproach
which
isnotsufficien
tforthisanaly-
sis.Hence
amultifu
nctio
nalobjectiv
eapproach
grey
hasto
be
used
tofind
theovera
llsin
gle
optim
um
valueofthetests
conducted
.
8.Grey
relatio
nalanalysis
forS/N
ratio
Table
5showstheresp
onse
table
formean.In
grey
relatio
nal
analysis,
adata
prep
rocessin
gis
conducted
first
inorder
to
no
isperfo
rmed
intherangeof(0–1),which
iscalled
grey
relatio
ngenera
tion(T
arnget
al.,
2002).Thenorm
alized
S/N
ratio
xij
forthei th
perfo
rmance
characteristic
inthej th
experim
ent
canbeexpressed
as
Xij ¼
gij �
minj
gij
max
jgij �
minj
gij
Figure
8S/N
ratio
forthrust
force.
Figure
9S/N
ratio
fortorque.
Table
5Resp
onse
table
formean.
Parameters
Table
formean
1-M
EAN
2-M
EAN
3-M
EAN
Speed
0.8463
0.8233
0.7585
Feed
0.8547
0.8297
0.7438
Drill
dia
0.8523
0.8245
0.7513
Total
2.5533
2.4775
2.2537
Meangrey
0.8094
Table 6 Grey relation analysis.
S/N
Fd-Ent
Normalize Coefficient S/N
Fd-Exit
Normalize Coefficient S/N
Fd-En
Normalize Coefficient S/N
Fd-Exait
Normalize Coefficient S/N
Thurst force
Normalize Coefficient S/N
Torque
Normalize Coefficient Grade
0.79 0.825 0.851 �0.7962 0.864 0.880 �13.7095 1.393 1.649 �2.2789 0.456 0.648 0.928
0.84 0.815 0.844 �4.532 0.225 0.563 �13.834 1.385 1.627 �2.9473 0.413 0.630 0.888
4.38 0.038 0.510 �4.781 0.182 0.550 �13.9811 1.376 1.603 �2.6002 0.435 0.639 0.719
1.26 0.722 0.783 �2.4115 0.587 0.708 �11.4179 1.541 2.177 �1.966 0.476 0.656 0.912
1.22 0.730 0.788 �2.5551 0.563 0.696 �13.2002 1.426 1.743 �2.1781 0.462 0.650 0.861
3.87 0.149 0.540 �5.2869 0.095 0.525 �14.0503 1.372 1.591 �2.0143 0.473 0.655 0.721
3.43 0.246 0.570 �5.2869 0.095 0.525 �14.1002 1.368 1.583 �2.854 0.419 0.633 0.812
4.04 0.113 0.530 �5.7426 0.018 0.504 �13.9585 1.377 1.606 �2.9535 0.413 0.630 0.725
4.40 0.034 0.509 �5.657 0.032 0.508 �14.0761 1.370 1.587 �2.3521 0.451 0.646 0.728
3.16 0.305 0.590 �1.6557 0.717 0.779 �12.8907 1.446 1.805 �2.4901 0.442 0.642 0.858
3.25 0.287 0.584 �2.9288 0.499 0.666 �12.2811 1.485 1.943 �2.3917 0.449 0.645 0.901
3.99 0.123 0.533 �2.785 0.524 0.677 �13.9585 1.377 1.606 �2.7027 0.429 0.636 0.791
2.37 0.478 0.657 �1.6557 0.717 0.779 �12.5165 1.470 1.887 �2.3521 0.451 0.646 0.890
2.32 0.490 0.662 �2.3851 0.592 0.710 �15.9799 1.248 1.329 �3.9566 0.348 0.605 0.732
2.16 0.525 0.678 �2.8415 0.514 0.673 �14.2899 1.356 1.553 �2.151 0.464 0.651 0.799
3.06 0.328 0.598 �4.4022 0.247 0.570 �15.1144 1.303 1.435 �2.3785 0.450 0.645 0.732
1.40 0.691 0.764 �4.5577 0.220 0.562 �12.5001 1.471 1.891 �3.2811 0.392 0.622 0.850
4.17 0.083 0.522 �5.6976 0.025 0.506 �14.1803 1.363 1.570 �3.3404 0.388 0.620 0.704
Optim
izingthedela
minatio
nfailu
rein
bamboofiber
reinforced
polyester
composite
7
Please
citeth
isarticle
inp
ressas:
Ab
ilash,
N.,
Sivap
ragash,
M.
Op
timizin
gth
ed
elamin
ation
failure
inb
amb
oo
fib
errein
forced
po
lyesterco
mp
osite.
Jou
rnal
of
Kin
gS
aud
Un
iversity–
En
gineerin
gS
ciences
(2013),h
ttp://d
x.do
i.org/10.1016/j.jk
sues.2013.09.004
�0.9065 0.602 0.715 �0.612 0.791 0.827 ��0.4238 0.814 0.843 �0.6282 0.785 0.823 ��2.2655 0.006 0.501 �2.8164 0.036 0.509 ��1.334 0.415 0.631 �2.709 0.073 0.519 ��1.1381 0.501 0.667 �1.784 0.390 0.621 ��2.2253 0.024 0.506 �2.8415 0.028 0.507 ��0.5225 0.771 0.813 �0.9999 0.658 0.745 ��1.9243 0.156 0.542 �2.5226 0.137 0.537 ��1.7272 0.242 0.569 �2.4246 0.170 0.547 ��1.8333 0.196 0.554 �0.8279 0.717 0.779 ��1.7272 0.242 0.569 0 1.000 1.000 ��1.9867 0.128 0.534 �0.9143 0.687 0.762 ��1.5619 0.315 0.593 �0.8279 0.717 0.779 ��2.1645 0.050 0.513 �2.1645 0.259 0.575 ��1.1609 0.491 0.663 �2.1238 0.273 0.579 ��1.3041 0.428 0.636 �2.8039 0.041 0.510 ��0.9221 0.595 0.712 �2.3917 0.182 0.550 ��2.2789 0.000 0.500 �2.854 0.023 0.506 �
rmalize
theraw
data.A
linearnorm
aliza
tionofS/N
ratio
t
62
36
65
67
9
92
45
43
22
72
13
51
85
55
45
41
81
96

Figure 11 % Contribution vs parameters.
Table 7 ANOVA showing percentage contribution of
parameters.
SSQ MEANSQ F P % DOF
SST 0.1013 100.0000
Speed 0.0249 0.0041 1.3233 0.2459 24.5891 6.0000
Feed 0.0406 0.0068 2.1557 0.4006 40.0560 6.0000
Drill dia 0.0327 0.0065 2.0833 0.3226 32.2580 5.0000
Error 0.0031 3.0969 0.0000
Total 100.0000 17.0000
Table 8 ANOVA table for regression Fd entry sample-1.
Source DF Seq SS Adj SS Adj MS F P
Regression 9 0.077143 0.077143 0.008571 2.01 0.156
Linear 3 0.059941 0.006692 0.002231 3.52 0.067
Square 3 0.010010 0.007319 0.002440 3.57 0.047
Interaction 3 0.007191 0.007191 0.002397 0.96 0.453
Residual error 8 0.038337 0.038337 0.004260 * *
Total 26 0.192622
Table 9 ANOVA table for regression Fd entry sample-1.
Source DF Seq SS Adj SS Adj MS F P
Regression 9 0.250880 0.250880 0.027876 3.93 0.034
Linear 3 0.164290 0.080794 0.026931 3.75 0.058
Square 3 0.066391 0.058601 0.019534 3.79 0.042
8 N. Abilash, M. Sivapragash
The grey relation coefficient is calculated based on thenormalized value. The grey relational coefficient fij for the ith
performance characteristic in the jth experiment can be
expressed as
fij ¼min
imin
jjv0
i � vijj þ fmaximax
jjv0
i � vijj
jv0i � vijj þ fmax
imax
jjv0
i � vijj
where v0i is the ideal normalized S/N ratio for the ith perfor-
mance characteristic and f the distinguishing coefficient whichis defined in the range 0 6 f 6 1. Finally averaging the greyrelation coefficient gives the grey relation grade. The grey rela-
tional grade cj can be obtained using,
cj ¼1
m
Xn
k¼1wifij
where ‘cj‘ is the grey relational grade for the jth experiment, ‘wi‘the weight factor for the ith performance characteristic, and ‘m’the number of performance characteristics. These results show
that complex multiple performance characteristics can be con-verted into a single response grey relation grade. The grey rela-tional coefficient is calculated to depict the relationship between
the best and actual normalized values. The optimal processparameters are achieved at the level where the S/N ratio is high-est. This is reliable for the optimization of single performancecharacteristics and for multiple performance characteristics
which cannot be straightforward. Higher S/N ratio for one per-formance characteristic may represent lower S/N ratio for an-other performance characteristic. Hence, the overall
evaluation of the S/N ratio is required for the optimization ofthe multiple performance characteristics. Therefore grey rela-tional analysis adopted in this work is given in Table 6. The grey
relational grade is calculated by averaging the grey relationalcoefficient corresponding to each performance characteristic.The optimal level of the process parameters is the level with
highest grey relational grade as shown in Fig. 10. Furthermore,ANOVA is performed to see which process parameters are sta-tistically significant with the grey relational analysis. Hence,optimal combination of process parameters can be predicted.
The highest grade value obtained for speed, feed, and drilldiameter shown in Fig. 10 is achieved in level-1 based on themean values given in Table 5.
Figure 10 Grey grade vs level of variables.
Interaction 3 0.020199 0.020199 0.006733 0.95 0.462
Residual error 8 0.056774 0.056774 0.007097 * *
Total 26 0.558534
Please cite this article in press as: Abilash, N., Sivapragash, M. Optimicomposite. Journal of King Saud University – Engineering Sciences (
Mean grade value of 0.8094 is predicted in the analysis andhigher grade value of 0.928 is achieved in level-1 where the
input parameters have minimum values as shown in Table 6.The contribution of parameters for this level is formulatedby ANOVA.
Table 10 Confirmation grey values.
Confirmation test
Pred.grey value Exp.grey value
0.809 0.928
zing the delamination failure in bamboo fiber reinforced polyester2013), http://dx.doi.org/10.1016/j.jksues.2013.09.004

Optimizing the delamination failure in bamboo fiber reinforced polyester composite 9
9. Analysis of variance
Analysis of variance (ANOVA) test is performed to justify thegoodness of fit in the developed model. The purpose of
ANOVA is to investigate the significance of design parametersthat affect the quality characteristics of a product or process.
Figure 12 Response surface pl
Please cite this article in press as: Abilash, N., Sivapragash, M. Optimicomposite. Journal of King Saud University – Engineering Sciences (
This can be achieved by classifying the total variability of theS/N ratios, which is measured by the sum of the squared devia-tions from the total mean. Contributions of each parameter are
given in Fig. 11.Mean square is the ratio of sumof squares to thedegrees of freedom (Gaitonde et al., 2008). The results of ANO-VA justifying the closeness of fit of the developedmodel are pre-
ots for peelup and pushout.
zing the delamination failure in bamboo fiber reinforced polyester2013), http://dx.doi.org/10.1016/j.jksues.2013.09.004

10 N. Abilash, M. Sivapragash
sented in Table 7. It is found that the developed model is quiteadequate at 95% confidence limit. The delamination relatedwith push-out is more severe than that of peel-up and is identi-
fied by the conventional drilling process using different diame-ters of twist drill (Liu et al., 2012).This happens not onlybecause of low interlaminar shear strength between the fiber
and resin interface at the exit side but also, due to higher thrustforce experienced during machining the specimen.
The influence of cutting speed on peel-up delamination is
comparatively low to push-out delamination while the peel-up and push-out delaminations of woven bamboo/polyestercomposite were decreased with increasing cutting speed. Thesize of delamination increases with increase in feed, as a result
of increase in thrust force and drill diameter. The delaminationassociated with push-out is more severe than that of peel-up.The axial thrust force exerted by twist drill is the major cause
for delamination. The most popular way of reducing delamina-tion damage is to support the bottom plies of the laminatewhile machining (Capello et al., 2004). The axial thrust force
exerted by the drill point on the composite laminate is the maincause for delamination damage in the work piece, and thishappens when the thrust force exceeds the critical thrust force
because of the nature of weak interlaminar shear strength thathappens at critical thrust force. This work outlines a method-ology to optimize the process parameters in drilling of bamboofiber reinforced polyester composite for minimum delamina-
tion damage. Taguchi experimental design and optimizationwere carried out using grey analysis and the significance ofprocess parameters and their contribution based on results
were analyzed with ANOVA given in Fig. 11 based on the val-ues obtained in Table 7. It is clear that feed rate has a maxi-mum contribution of 40.05 percentage followed by drill
diameter of 32.25 percentage and then the influence of speedwith 24.58 percentage.
10. Regression modeling
Quadratic equation is used to describe the functional relation-ship between the estimated variable (delamination factor) and
the input variables {drill diameter (D), speed (S) and feed rate(F)}, with regression coefficients and coded units utilized whenthe response function is unknown or nonlinear. This modelcan predict 95% of the variance indicating that the model fits
the data verywell andhas an adequate predictive ability.Regres-sion coefficients, of the multivariable second order regressionmodel for delamination factor is estimated by the method of
least square shown in equations. The ‘P’ value is called as prob-ability of determination and it varies between zero and unity.
Tables 8 and 9 show ANOVA for the full quadratic model.
The second-order response surface model is used to predictwhether the parameters are adequate within 95% confidenceintervals. In this table, the F-value is an indicator that showsthe importance of input parameters. ‘F’ value is the ratio of
mean of squared deviations to the mean of the squared error.Usually, when ‘F’ value is greater than four means that thechange of the design parameter has a significant effect on the
quality characteristics. The interaction value shows the depen-dency of one parameter on the other two parameters. Theprobability ‘P’ value which is the deciding criteria to check
whether the process is significant or not that is if P > 0.05 itis insignificant. By referring to the probability values of the
Please cite this article in press as: Abilash, N., Sivapragash, M. Optimicomposite. Journal of King Saud University – Engineering Sciences (
tables, it is evident that all the ‘P’ values are less than 0.05for the squared terms and hence all the values lie within theconfidence interval.
11. Confirmation test
After selecting the optimal level of design parameters the qual-
ity characteristics have to be improved using the optimal levelof design parameters. The predicted grey value can be esti-mated using the relation
g ¼ gm þXm
i¼1ð~g� gmÞ
where gm is the total mean S/N ratio, ~g the mean S/N ratio at
the optimal level, m is the number of the main design param-eter that affect the quality characteristics. Table 10 shows thecomparison of predicted grey level and experimental grey level.Response surface analysis shown in Fig. 12 indicates the min-
imum delamination at the exit is obtained at a low level of feedrate at low speed and at low drill diameter. The confirmationexperiments were conducted to verify the predicted optimal
parameters with the experimental results. The comparison ofthe predicted grey value for the delamination factor with theexperimental value using optimal cutting parameters is made,
good agreement between the predicted and experimental re-sults is observed.
12. Conclusions
The following observations were identified while testing thedelamination in bamboo fiber reinforced polyester composites.
It is interesting to compare the results of delamination proper-ties of bamboo fiber composites with glass and royal fiber com-posites. While analyzing bamboo fiber composite the pushoutdelamination failure effect can be minimized by controlling the
feed rate at 18 mm/min with a minimum speed of 500 rpm with4 mm diameter drill bit, whereas the optimal condition forglass and royal fiber composite is around 2000 rpm with same
size of drill and at a feed rate of 200 mm/min. however there ismuch variation in the feed and speed, for both cases delamina-tion is getting minimized at a lower feed rate and speed.
The feed rate and drill diameter are seen to make the largestcontribution to the delamination effect. Generally, the use ofsmall diameter drills and low feed favor the minimum delam-ination while drilling that leads to better quality holes.
� As taguchi parameter design is applicable for single objec-tive function, the S/N ratio obtained for each process
parameters are different, therefore suitable multi objectivefunction were carried out using grey analysis.� Grade value of 0.928 is achieved in the first experiment
where level-1 shows the input process parameters with smal-ler grades.� Analysis of varience which gives the influence of input
parameters and feed rate is known to have a maximum con-tribution followed by the drill diameter and spindle speedwhich has a minor part in delamination.� By analyzing the mean squares the error percentage is
found to be 3.09 percentage which is within the acceptablerange.
zing the delamination failure in bamboo fiber reinforced polyester2013), http://dx.doi.org/10.1016/j.jksues.2013.09.004

Optimizing the delamination failure in bamboo fiber reinforced polyester composite 11
� Confirmation test is carried out to compare the predicted
grey value with the experimental grey value and found tobe close. Finally experiments were conducted with the sameinput parameters of higher grade value and found to have
the same value as obtained earlier.
References
Navin chand et al, 2007. Anisotropic abrasive wear behaviour of
bamboo (Dentrocalamus strictus). Wear 262, 1031–1037.
Rashdi, Abdalla, 2010. Water absorption behaviour of kenaf rein-
forced unsaturated polyester composites and its influence on
their mechanical properties. Pertanika J. Sci. Technol. 18 (2),
433–440.
Basavarajappa et al, 2009. Effect of filler materials on dry sliding wear
behavior of polymer matrix composites – a taguchi approach. J.
Miner. Mater. Character. Eng. 8 (5), 379–391.
Yuhazri, Mohd et al, 2011. Mechanical properties of kenaf/polyester
composites. Int. J. Eng. Technol. IJET-IJENS 11 (01).
Gaitonde et al, 2008. Analysis of parametric influence on delamina-
tion in high-speed drilling of carbon fiber reinforced plastic
composites. J. Mater. Process. Technol. 203, 431–438.
Rubio, Campos, 2008. Effects of high speed in the drilling of glass fiber
reinforced plastic: evaluation of the delamination factor. Int. J.
Mach. Tools Manuf. 48, 715–720.
Khashaba, 2004. Delamination in drilling GFR-thermoset composites.
Compos. Struct. 63, 313–327.
Capello, Edoardo, 2004. Workpiece damping and its effect on
delamination damage in drilling thin composite laminates. J.
Mater. Process. Technol. 148, 186–195.
Please cite this article in press as: Abilash, N., Sivapragash, M. Optimicomposite. Journal of King Saud University – Engineering Sciences (
Valadez-Gonzalez et al, 1999. Effect of fiber surface treatment on the
fiber-matrix bond strength of natural fiber reinforced composites.
Compos. Part B 30, 309–320.
Mohana et al, 2007. Delamination analysis in drilling process of glass
fiber reinforced plastic (GFRP) composite materials. J. Mater.
Process. Technol. 186, 265–271.
Tarng, Y.S. et al, 2002. The use of grey-based Taguchi methods to
determine submerged arc welding process parameters in hardfac-
ing. J. Mater. Process. Technol. 128, 1–6.
J. PauloDavim et al.’’,A novel approach based on digital image analysis
to evaluate the delamination factor after drilling composite lami-
nates’’Composites, Science and Technology 67 (2007) 1939–1945.
Dhakal, H.N. et al, 2006. Effect of water absorption on the mechan-
ical properties of hemp fiber reinforced unsaturated polyester
composites. Compos. Sci. Technol..
Liu, DeFu et al, 2012. A review of mechanical drilling for composite
laminates. Compos. Struct. 94, 1265–1279.
Hocheng, H. et al. 1992. Experimental aspects of drilling of some fiber
reinforced plastics. In: Proceedings of the Machining of Composite
Materials Symposium – ASM Materials week, pp. 127–138.
Won, M. et al, 2002. Drilling of aramid and carbon fiber polymer
composites. J. Manuf. Sci. Eng. 124, 778–783.
Mohan, N.S. et al, 2007. Delamination analysis in drilling process of
glass fiber reinforced plastics (GFRP) composite materials. J.
Mater. Process. Technol. 186, 265–271.
Paulo Davim, J. et al, 2004. Experimental study of drilling glass fiber
reinforced plastics manufactured by hand layup. Compos. Sci.
Technol. 64, 289–297.
Tsao, C.C. et al, 2004. Taguchi analysis of delamination associated
with various drill bits in drilling of composite material. Int. J.
Mach. Tools Manuf. 44, 1085–1090.
zing the delamination failure in bamboo fiber reinforced polyester2013), http://dx.doi.org/10.1016/j.jksues.2013.09.004