Embed Size (px)
Citation preview
389
Towards Green Marine Technology and Transport – Guedes Soares, Dejhalla & Pavleti (Eds)© 2015 Taylor & Francis Group, London, ISBN 978-1-138-02887-6
Design charts for quick estimation of wave loads on damaged oil tanker in the Adriatic Sea
J. Parunov & M. ĆorakFaculty of Mechanical Engineering and Naval Architecture, Zagreb, Croatia
ABSTRACT: If ship is damaged in collision or grounding accidents, there is a need for rapid evalua-tion of loads acting on ship hull and residual structural strength in order to plan salvage operation. The aim of the paper is to develop design charts enabling quick assessment of vertical wave bending moments acting on damaged Aframax oil tanker in the Adriatic Sea. Transfer functions are calculated by 3D panel code using added mass method for the response analysis of damaged ship. Response spectrum of vertical wave bending moment is evaluated using Tabain’s wave spectrum, valid for the Adriatic Sea, for different sea states, heading angles and ship’s speed. Response variance is then presented in form of design charts. Discussion how to use design charts for ship in different damage situations is also provided. Although results are applicable for Aframax tanker only, the procedure for development of design charts may be readily employed for oil tankers of different sizes as well as for other ship types.
RAOs due to the effects of damage. That study indicated that the change in global hull loading may be much smaller for tankers than for Ro-Ro ferries and cruise ships.
Folsø et al. (2008) have performed seakeeping computations on a damaged ship by the 3D linear hydrodynamic method. The damage scenarios cor-responded to water ingress into the forepeak and/or the double hull ballast tanks of the ship sail-ing in full load. For the case of the flooded bal-last tank in the midship area, they obtained RAOs of the VWBM larger than those evaluated for the intact condition. Interesting conclusion from the paper is that keeping a bow quartering encounter angle, with the higher freeboard on the weather side, minimizes VWBM.
Lee et al. (2012) applied a computational tool based on a two dimensional linear method to pre-dict the hydrodynamic loads of damaged warship. They obtained larger VWBM for damaged, com-pared to the intact ship. The global dynamic wave induced loads calculated using 2D linear method was also compared to measurements. In head and stern quartering waves, differences between com-putations and measurements of global dynamic wave induced load response amplitudes were rea-sonable. In general, however, linear strip theory overestimated measurements for both intact and damaged ship.
Parunov et al. (2015) compared two simplified methods that may be used for modelling wave- induced motion and resulting structural loads of ship damaged in collision or grounding accident.
1 INTRODUCTION
Damage of merchant ship may occur due to col-lision with another ship, grounding or some other type of human mistake. In case of such an acci-dent, the ship strength is reduced, still water loads increase while wave loads could become cause of the structural overloading (Luis et al. 2009, Khan and Das, 2008). Therefore, ship operators need to propose immediate repair actions to avoid hull girder collapse of the vessel (Santos and Guedes Soares 2008). In order to facilitate emergency response actions, it is useful to have charts enabling quick estimation of pertinent variables. For quick estimation of the loss of damaged ship strength, such design charts are provided e.g. by Žiha and Pedišić (2002).
The purpose of this paper is to develop charts for estimation of Wave Bending Moments (VWBM) on damaged Aframax oil tanker in the Adriatic Seas. In closed sea basin, as the Adriatic, major oil spill could cause irreversible environmental dis-aster with enormous economic losses. That is the reason for concern and motivation to develop fast and useful tools that could help in rapid decision making process during salvage operation in case of such an accident (Burić et al. 2012).
Wave loads on damaged ship are studied by Downes et al. (2007) where it has be shown that the Response Amplitude Operators (RAOs) peak value of VWBM increases, with increasing dam-age size and heel angle. It can also be seen however, that there is no significant difference between the
390
The first method is the added mass method, in which it is assumed that the mass of the flooded seawater becomes integral part of the ship mass and moves with the ship. The second approach is the lost buoy-ancy method, where structure of damaged tanks and all of its contents are removed from the vessel. The former method is applicable for small dam-ages while the latter is more suited for large dam-age extents. For the case of Aframax tanker, it was shown that RAOs of VWBM at amidships increase with increase of the damage size. The added mass method systematically provides larger maximum RAOs compared to the lost buoyancy method. Validation of methods is performed by comparison with experiments on damaged warship. The added mass method produced larger RAOs while the lost buoyancy method resulted in slightly lower values compared to the experimental RAOs of VWBM.
Wave loads on intact oil tankers in the Adriatic Sea have been studied by Parunov and Senjanović (2005). They considered three oil tankers of differ-ent sizes using closed-form expressions for compu-tation of RAOs of VWBM at amidships. Short- and long-term predictions of extreme VWBM are per-formed using design wave spectrum appropriate for the Adriatic Sea and available wave statistics respectively. The study showed that the probability of a structural failure of an intact oil tanker due to purely environmental loads was almost negligible. However, the structural failure may occur due to collision, grounding or some other accident. In that case, the ship strength could be considerably reduced making wave loads, even of the relatively low level, important for the structural safety assess-ment (Luis et al. 2009). This is demonstrated by Burić et al. (2012) in the case study of damaged oil tanker in the Adriatic Sea.
The present work is organized as follows. In the next section, description of studied Aframax oil tanker and damage cases is given. After that, results of seakeeping assessment of damaged ship are presented, using the added mass method. Next section contains description of wave conditions in the Adriatic Sea. Design charts are then provided and instructions how to use charts in practice are given. Finally, some discussion and conclusions from the study are also drawn. Although results of the work are directly applicable to Aframax tanker only, the procedure for development of design charts may be readily employed for oil tankers of different sizes as well as for other ship types.
2 DECRIPTION OF SHIP AND DAMAGE CASES
The studied ship is an Aframax oil tanker with main particulars presented in Table 1. Cargo hold
Table 1. Main particulars of the Aframax oil tanker.
Dimension Unit (m, dwt)
Length between perp., LPP 234Breadth, B 40Depth, D 20Draught, T 15Deadweight, DWT 105000
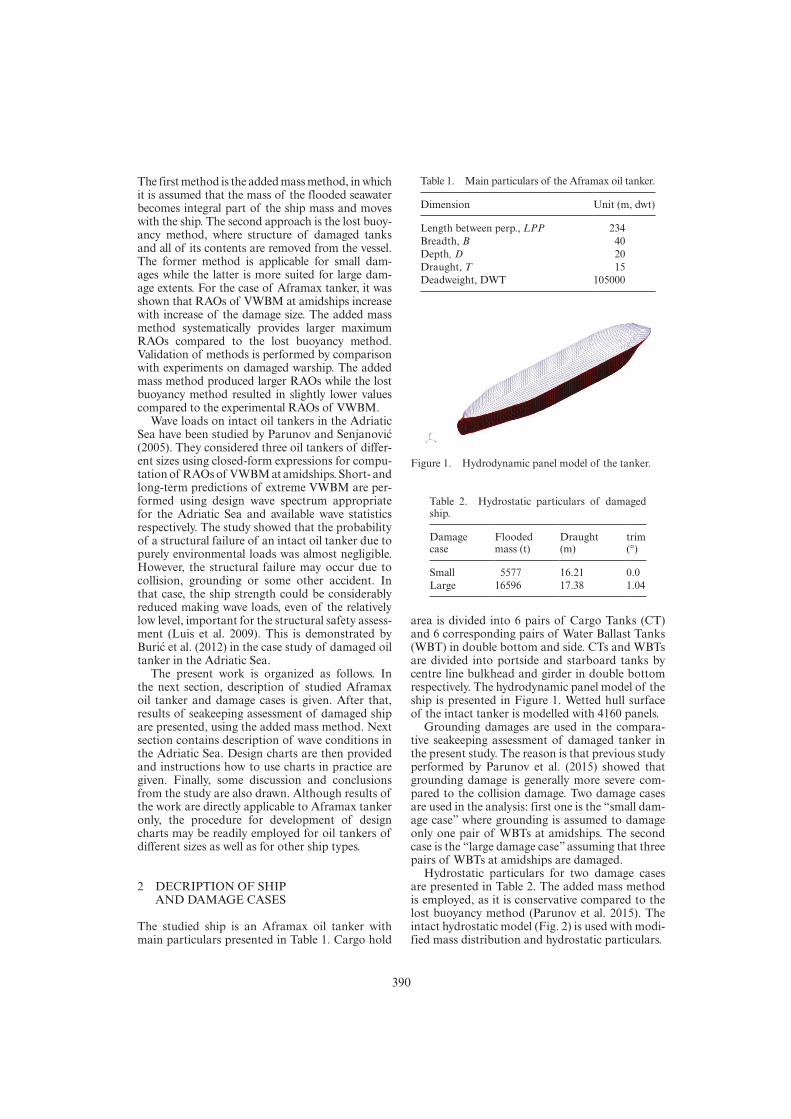
Figure 1. Hydrodynamic panel model of the tanker.
Table 2. Hydrostatic particulars of damaged ship.
Damage case
Flooded mass (t)
Draught (m)
trim ( )
Small 5577 16.21 0.0Large 16596 17.38 1.04
area is divided into 6 pairs of Cargo Tanks (CT) and 6 corresponding pairs of Water Ballast Tanks (WBT) in double bottom and side. CTs and WBTs are divided into portside and starboard tanks by centre line bulkhead and girder in double bottom respectively. The hydrodynamic panel model of the ship is presented in Figure 1. Wetted hull surface of the intact tanker is modelled with 4160 panels.
Grounding damages are used in the compara-tive seakeeping assessment of damaged tanker in the present study. The reason is that previous study performed by Parunov et al. (2015) showed that grounding damage is generally more severe com-pared to the collision damage. Two damage cases are used in the analysis: first one is the “small dam-age case” where grounding is assumed to damage only one pair of WBTs at amidships. The second case is the “large damage case” assuming that three pairs of WBTs at amidships are damaged.
Hydrostatic particulars for two damage cases are presented in Table 2. The added mass method is employed, as it is conservative compared to the lost buoyancy method (Parunov et al. 2015). The intact hydrostatic model (Fig. 2) is used with modi-fied mass distribution and hydrostatic particulars.
391
3 RESULTS OF THE SEAKEEPING ANALYSIS OF DAMAGED SHIP
3.1 Results for ship motions
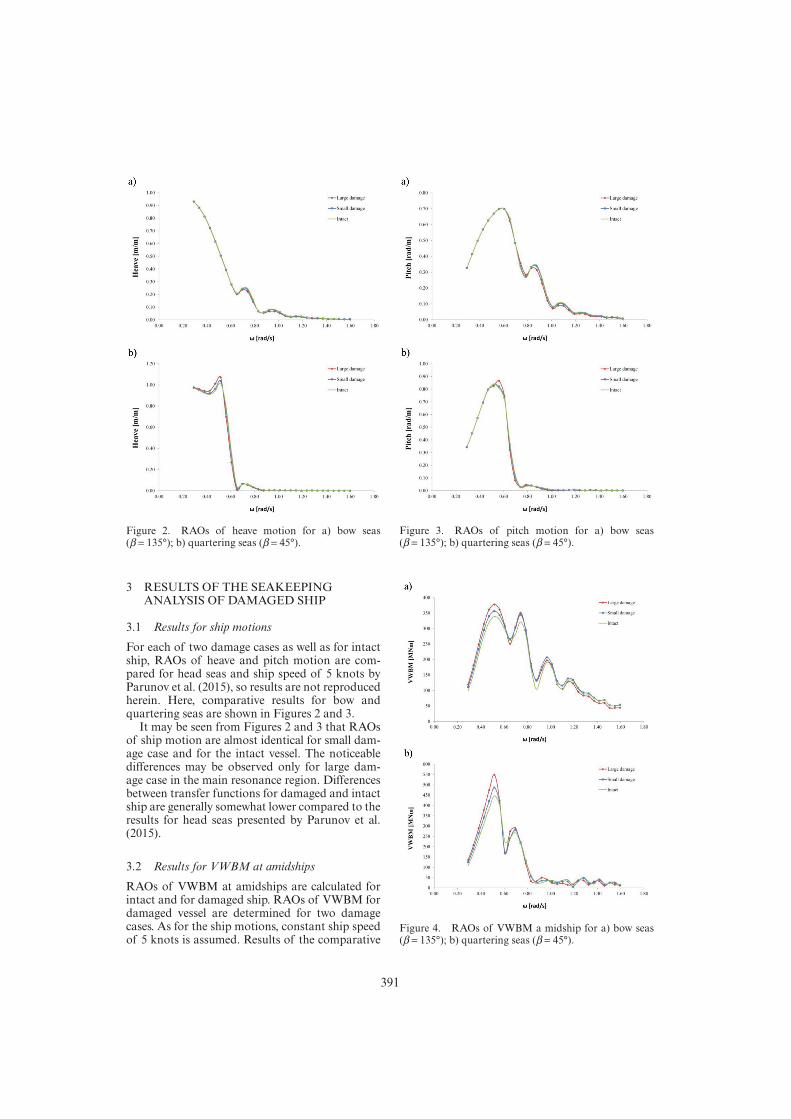
For each of two damage cases as well as for intact ship, RAOs of heave and pitch motion are com-pared for head seas and ship speed of 5 knots by Parunov et al. (2015), so results are not reproduced herein. Here, comparative results for bow and quartering seas are shown in Figures 2 and 3.
It may be seen from Figures 2 and 3 that RAOs of ship motion are almost identical for small dam-age case and for the intact vessel. The noticeable differences may be observed only for large dam-age case in the main resonance region. Differences between transfer functions for damaged and intact ship are generally somewhat lower compared to the results for head seas presented by Parunov et al. (2015).
3.2 Results for VWBM at amidships
RAOs of VWBM at amidships are calculated for intact and for damaged ship. RAOs of VWBM for damaged vessel are determined for two damage cases. As for the ship motions, constant ship speed of 5 knots is assumed. Results of the comparative
Figure 2. RAOs of heave motion for a) bow seas ( 135°); b) quartering seas ( 45°).
Figure 3. RAOs of pitch motion for a) bow seas ( 135°); b) quartering seas ( 45°).
Figure 4. RAOs of VWBM a midship for a) bow seas ( 135°); b) quartering seas ( 45°).
392
analysis for different heading angles for bow and quartering seas are presented in Figure 4. Comparison for head seas is already provided by Parunov et al (2015).
It may be seen from Figure 4 that RAOs of VWBM are increasing with increasing damage size. The general trend of presented results is very simi-lar to Figure 2 of Downes et al. (2007). It should be noticed that results for damaged and intact ship are almost identical in the high frequency region. That may cause mixing-up results of spectral analysis for low seas states with short wave lengths as some results for intact ship may become larger compared to the damaged vessel. Also, rather high secondary resonance for bow seas case may be seen in Figure 4a, that may cause that in certain cases bow sea results in the largest response spectrum of VWBM.
4 WAVE CONDITIONS IN THE ADRIATIC
The Adriatic Sea is a rather closed and elongated sea basin about 800 km in length and 200 km in breadth, connected to the Mediterranean Sea by the relatively narrow Strait of Otranto. Dominant wind events that cause surface waves are bura (N-NE to E-NE, Italian bora) and jugo (E-SE to SS-E, sirocco family) in the winter and maestral (W-NW to NW) in the summer (Katalinić et al. 2015). The statistics of the sea states in the Adriatic Sea is studied by Parunov et al. (2011). Maximum recorded significant wave height and wave height in the Adriatic was 7.5 and 10.8 meters respectively. Theoretical predictions of most probable extreme significant wave heights for 20 and 100 year return periods are 7.20 and 8.57 meters respectively.
The specific nature of the Adriatic Sea wave spectrum was studied by Tabain (1997) and it is proposed in a form of a one-parameter wave spectrum:
Sg
eH pSH
0 8620 0135
1 63
2
5
5 1864 2H
..
.1 61 6
.
(1)
where
p ep ep e m mm mm mm mm mm mm mm mm mm m;
mSHS
0 321 8
0 60.0 30 3
.1 81 8
.0 60 6
0 08 0. ;. ;fo8 08 0. ;. ;r f8 0 1. ;8 0m mr fr f8 0. ;. ; . orr fr f
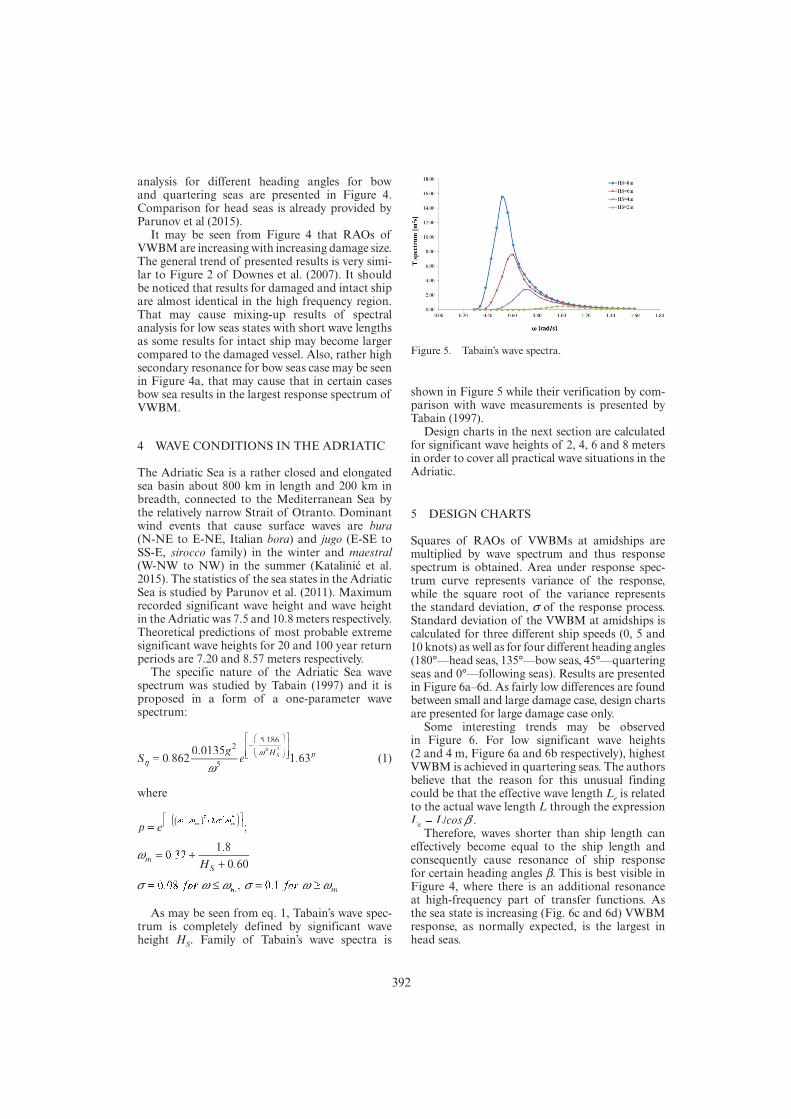
As may be seen from eq. 1, Tabain’s wave spec-trum is completely defined by significant wave height HS. Family of Tabain’s wave spectra is
shown in Figure 5 while their verification by com-parison with wave measurements is presented by Tabain (1997).
Design charts in the next section are calculated for significant wave heights of 2, 4, 6 and 8 meters in order to cover all practical wave situations in the Adriatic.
5 DESIGN CHARTS
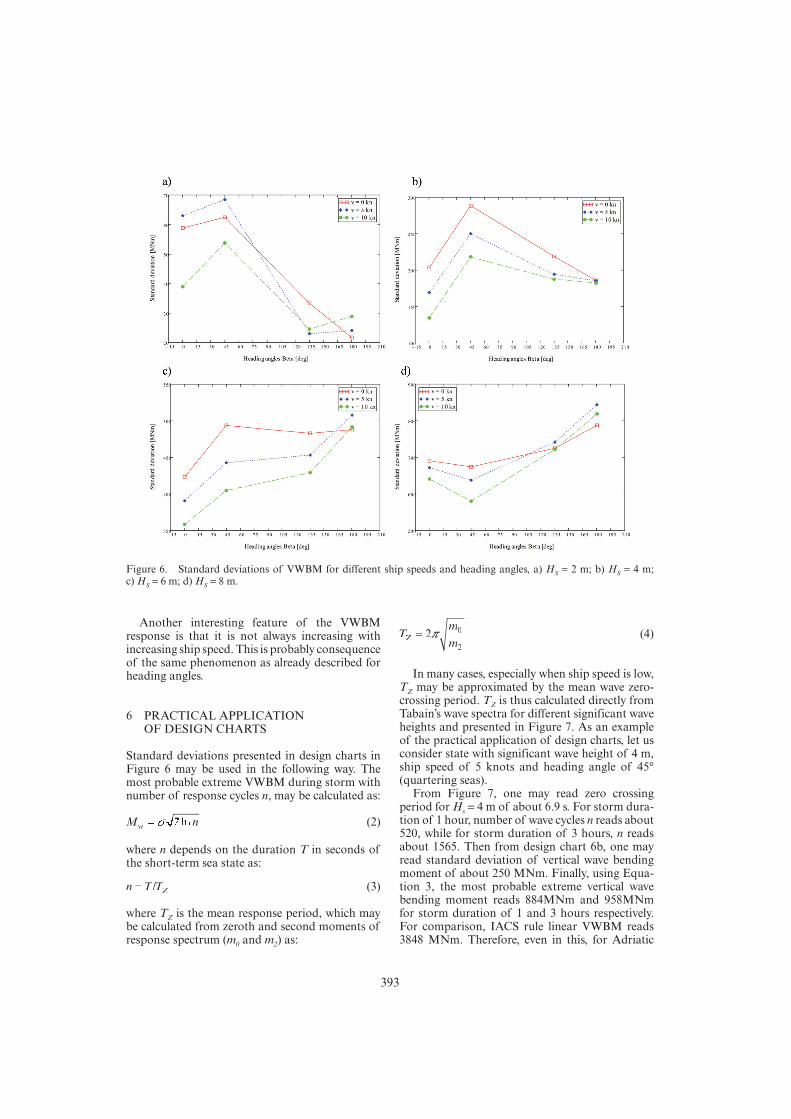
Squares of RAOs of VWBMs at amidships are multiplied by wave spectrum and thus response spectrum is obtained. Area under response spec-trum curve represents variance of the response, while the square root of the variance represents the standard deviation, of the response process. Standard deviation of the VWBM at amidships is calculated for three different ship speeds (0, 5 and 10 knots) as well as for four different heading angles (180°—head seas, 135°—bow seas, 45°—quartering seas and 0°—following seas). Results are presented in Figure 6a–6d. As fairly low differences are found between small and large damage case, design charts are presented for large damage case only.
Some interesting trends may be observed in Figure 6. For low significant wave heights (2 and 4 m, Figure 6a and 6b respectively), highest VWBM is achieved in quartering seas. The authors believe that the reason for this unusual finding could be that the effective wave length Le is related to the actual wave length L through the expression L L coseL LL LL LL L/ .
Therefore, waves shorter than ship length can effectively become equal to the ship length and consequently cause resonance of ship response for certain heading angles . This is best visible in Figure 4, where there is an additional resonance at high-frequency part of transfer functions. As the sea state is increasing (Fig. 6c and 6d) VWBM response, as normally expected, is the largest in head seas.
Figure 5. Tabain’s wave spectra.
393
Another interesting feature of the VWBM response is that it is not always increasing with increasing ship speed. This is probably consequence of the same phenomenon as already described for heading angles.
6 PRACTICAL APPLICATION OF DESIGN CHARTS
Standard deviations presented in design charts in Figure 6 may be used in the following way. The most probable extreme VWBM during storm with number of response cycles n, may be calculated as:
M nM nwM nM nM nM nM nM n2 lM nM nM nM n (2)
where n depends on the duration T in seconds of the short-term sea state as:
n T TZTTn Tn T/n Tn T TT (3)
where TZ is the mean response period, which may be calculated from zeroth and second moments of response spectrum (m0 and m2) as:
Tm
mZTT 2 0
2
(4)
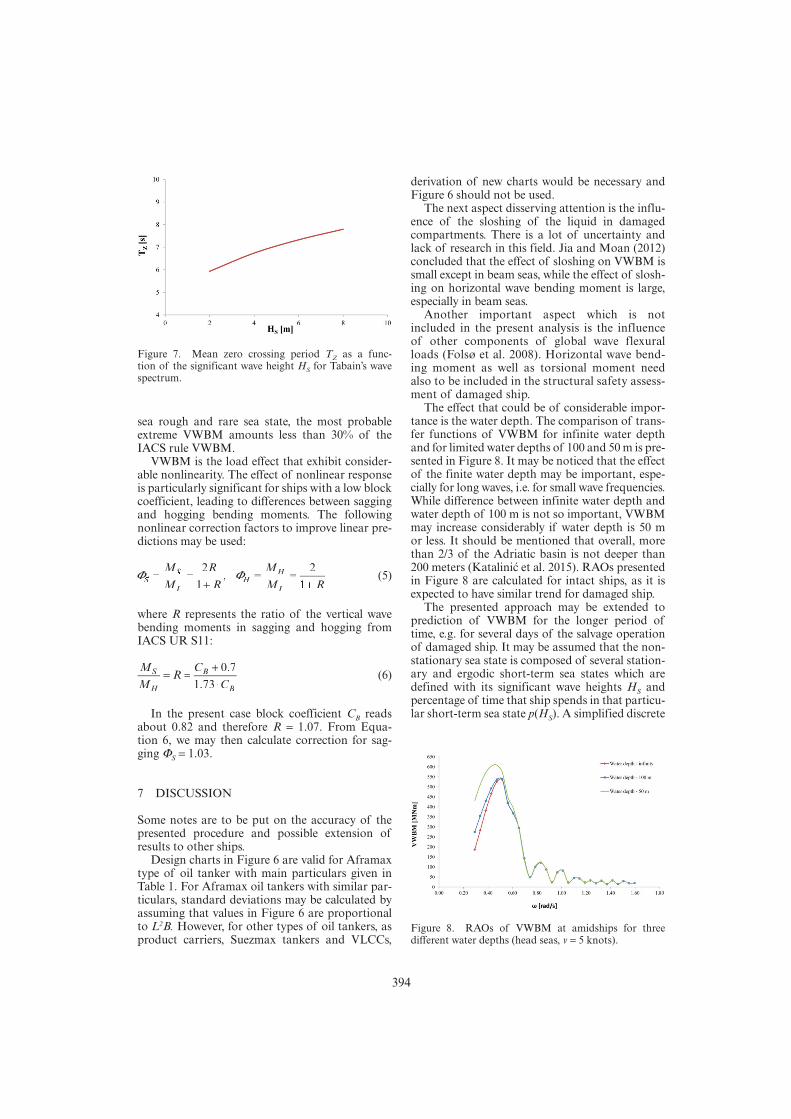
In many cases, especially when ship speed is low, TZ may be approximated by the mean wave zero-crossing period. TZ is thus calculated directly from Tabain’s wave spectra for different significant wave heights and presented in Figure 7. As an example of the practical application of design charts, let us consider state with significant wave height of 4 m, ship speed of 5 knots and heading angle of 45° (quartering seas).
From Figure 7, one may read zero crossing period for Hs 4 m of about 6.9 s. For storm dura-tion of 1 hour, number of wave cycles n reads about 520, while for storm duration of 3 hours, n reads about 1565. Then from design chart 6b, one may read standard deviation of vertical wave bending moment of about 250 MNm. Finally, using Equa-tion 3, the most probable extreme vertical wave bending moment reads 884MNm and 958MNm for storm duration of 1 and 3 hours respectively. For comparison, IACS rule linear VWBM reads 3848 MNm. Therefore, even in this, for Adriatic
Figure 6. Standard deviations of VWBM for different ship speeds and heading angles, a) HS 2 m; b) HS 4 m; c) HS 6 m; d) HS 8 m.
394
sea rough and rare sea state, the most probable extreme VWBM amounts less than 30% of the IACS rule VWBM.
VWBM is the load effect that exhibit consider-able nonlinearity. The effect of nonlinear response is particularly significant for ships with a low block coefficient, leading to differences between sagging and hogging bending moments. The following nonlinear correction factors to improve linear pre-dictions may be used:
SS
LH
H
L
MS
ML
R
R
MH
M RLM RM R
2
1
2
1M RM R, (5)
where R represents the ratio of the vertical wave bending moments in sagging and hogging from IACS UR S11:
M
MR
C
C
SM
HM
BC
BCR
0 7
1 73
.0 70 7
.1 71 7 (6)
In the present case block coefficient CB reads about 0.82 and therefore R 1.07. From Equa-tion 6, we may then calculate correction for sag-ging S 1.03.
7 DISCUSSION
Some notes are to be put on the accuracy of the presented procedure and possible extension of results to other ships.
Design charts in Figure 6 are valid for Aframax type of oil tanker with main particulars given in Table 1. For Aframax oil tankers with similar par-ticulars, standard deviations may be calculated by assuming that values in Figure 6 are proportional to L2B. However, for other types of oil tankers, as product carriers, Suezmax tankers and VLCCs,
derivation of new charts would be necessary and Figure 6 should not be used.
The next aspect disserving attention is the influ-ence of the sloshing of the liquid in damaged compartments. There is a lot of uncertainty and lack of research in this field. Jia and Moan (2012) concluded that the effect of sloshing on VWBM is small except in beam seas, while the effect of slosh-ing on horizontal wave bending moment is large, especially in beam seas.
Another important aspect which is not included in the present analysis is the influence of other components of global wave flexural loads (Folsø et al. 2008). Horizontal wave bend-ing moment as well as torsional moment need also to be included in the structural safety assess-ment of damaged ship.
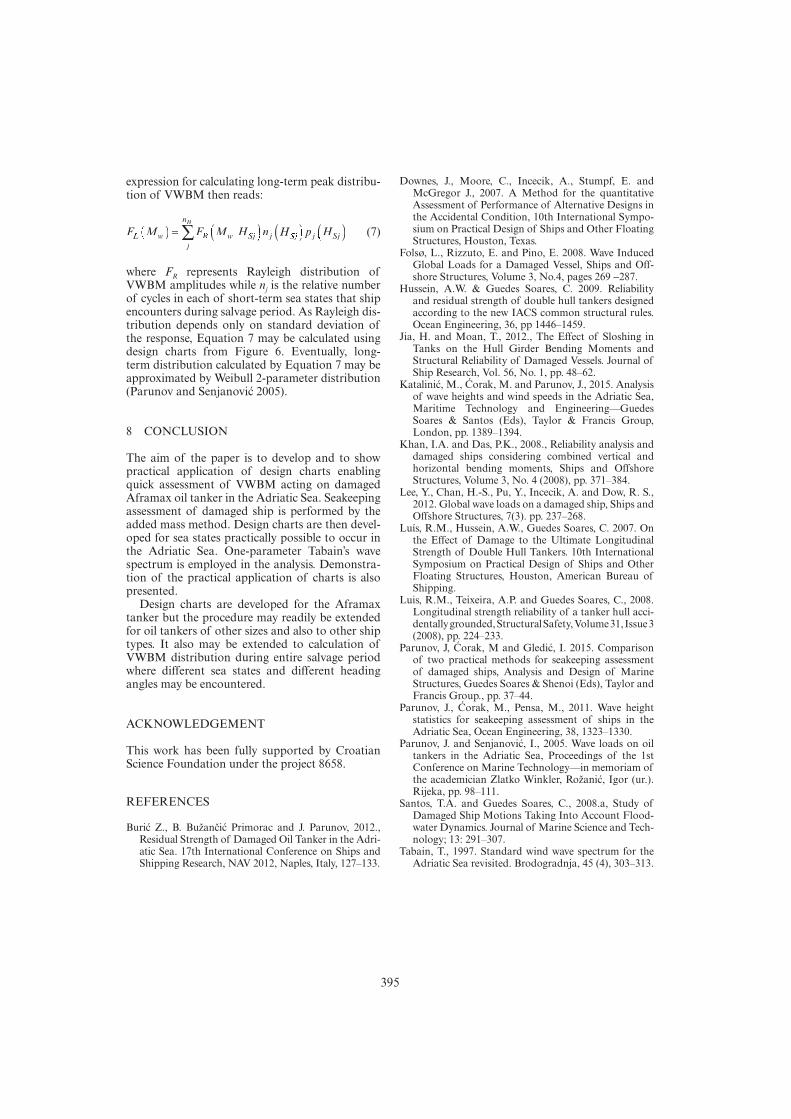
The effect that could be of considerable impor-tance is the water depth. The comparison of trans-fer functions of VWBM for infinite water depth and for limited water depths of 100 and 50 m is pre-sented in Figure 8. It may be noticed that the effect of the finite water depth may be important, espe-cially for long waves, i.e. for small wave frequencies. While difference between infinite water depth and water depth of 100 m is not so important, VWBM may increase considerably if water depth is 50 m or less. It should be mentioned that overall, more than 2/3 of the Adriatic basin is not deeper than 200 meters (Katalinić et al. 2015). RAOs presented in Figure 8 are calculated for intact ships, as it is expected to have similar trend for damaged ship.
The presented approach may be extended to prediction of VWBM for the longer period of time, e.g. for several days of the salvage operation of damaged ship. It may be assumed that the non-stationary sea state is composed of several station-ary and ergodic short-term sea states which are defined with its significant wave heights HS and percentage of time that ship spends in that particu-lar short-term sea state p(HS). A simplified discrete
Figure 7. Mean zero crossing period TZ as a func-tion of the significant wave height HS for Tabain’s wave spectrum.
Figure 8. RAOs of VWBM at amidships for three different water depths (head seas, v 5 knots).
395
expression for calculating long-term peak distribu-tion of VWBM then reads:
F M F M H n H pL wF MF M RF MF Mj
n
j jH n j S
H
F MF ML wL wF MF MF M F MF M H nH nw Sw SF MF M H nH nj jj jH nH nH nw SH nH n H pH pSjH pH p Hj Sj SH jj Sj S (7)
where FR represents Rayleigh distribution of VWBM amplitudes while nj is the relative number of cycles in each of short-term sea states that ship encounters during salvage period. As Rayleigh dis-tribution depends only on standard deviation of the response, Equation 7 may be calculated using design charts from Figure 6. Eventually, long-term distribution calculated by Equation 7 may be approximated by Weibull 2-parameter distribution (Parunov and Senjanović 2005).
8 CONCLUSION
The aim of the paper is to develop and to show practical application of design charts enabling quick assessment of VWBM acting on damaged Aframax oil tanker in the Adriatic Sea. Seakeeping assessment of damaged ship is performed by the added mass method. Design charts are then devel-oped for sea states practically possible to occur in the Adriatic Sea. One-parameter Tabain’s wave spectrum is employed in the analysis. Demonstra-tion of the practical application of charts is also presented.
Design charts are developed for the Aframax tanker but the procedure may readily be extended for oil tankers of other sizes and also to other ship types. It also may be extended to calculation of VWBM distribution during entire salvage period where different sea states and different heading angles may be encountered.
ACKNOWLEDGEMENT
This work has been fully supported by Croatian Science Foundation under the project 8658.
REFERENCES
Burić Z., B. Bužančić Primorac and J. Parunov, 2012., Residual Strength of Damaged Oil Tanker in the Adri-atic Sea. 17th International Conference on Ships and Shipping Research, NAV 2012, Naples, Italy, 127–133.
Downes, J., Moore, C., Incecik, A., Stumpf, E. and McGregor J., 2007. A Method for the quantitative Assessment of Performance of Alternative Designs in the Accidental Condition, 10th International Sympo-sium on Practical Design of Ships and Other Floating Structures, Houston, Texas.
Folsø, L., Rizzuto, E. and Pino, E. 2008. Wave Induced Global Loads for a Damaged Vessel, Ships and Off-shore Structures, Volume 3, No.4, pages 269 287.
Hussein, A.W. & Guedes Soares, C. 2009. Reliability and residual strength of double hull tankers designed according to the new IACS common structural rules. Ocean Engineering, 36, pp 1446–1459.
Jia, H. and Moan, T., 2012., The Effect of Sloshing in Tanks on the Hull Girder Bending Moments and Structural Reliability of Damaged Vessels. Journal of Ship Research, Vol. 56, No. 1, pp. 48–62.
Katalinić, M., Ćorak, M. and Parunov, J., 2015. Analysis of wave heights and wind speeds in the Adriatic Sea, Maritime Technology and Engineering—Guedes Soares & Santos (Eds), Taylor & Francis Group, London, pp. 1389–1394.
Khan, I.A. and Das, P.K., 2008., Reliability analysis and damaged ships considering combined vertical and horizontal bending moments, Ships and Offshore Structures, Volume 3, No. 4 (2008), pp. 371–384.
Lee, Y., Chan, H.-S., Pu, Y., Incecik, A. and Dow, R. S., 2012. Global wave loads on a damaged ship, Ships and Offshore Structures, 7(3). pp. 237–268.
Luís, R.M., Hussein, A.W., Guedes Soares, C. 2007. On the Effect of Damage to the Ultimate Longitudinal Strength of Double Hull Tankers. 10th International Symposium on Practical Design of Ships and Other Floating Structures, Houston, American Bureau of Shipping.
Luis, R.M., Teixeira, A.P. and Guedes Soares, C., 2008. Longitudinal strength reliability of a tanker hull acci-dentally grounded, Structural Safety, Volume 31, Issue 3 (2008), pp. 224–233.
Parunov, J, Ćorak, M and Gledić, I. 2015. Comparison of two practical methods for seakeeping assessment of damaged ships, Analysis and Design of Marine Structures, Guedes Soares & Shenoi (Eds), Taylor and Francis Group., pp. 37–44.
Parunov, J., Ćorak, M., Pensa, M., 2011. Wave height statistics for seakeeping assessment of ships in the Adriatic Sea, Ocean Engineering, 38, 1323–1330.
Parunov, J. and Senjanović, I., 2005. Wave loads on oil tankers in the Adriatic Sea, Proceedings of the 1st Conference on Marine Technology—in memoriam of the academician Zlatko Winkler, Rožanić, Igor (ur.). Rijeka, pp. 98–111.
Santos, T.A. and Guedes Soares, C., 2008.a, Study of Damaged Ship Motions Taking Into Account Flood-water Dynamics. Journal of Marine Science and Tech-nology; 13: 291–307.
Tabain, T., 1997. Standard wind wave spectrum for the Adriatic Sea revisited. Brodogradnja, 45 (4), 303–313.