Embed Size (px)
Citation preview

Influence of multiphase processes on the chemistry and measurement
of organic compounds in indoor and outdoor environments
by
Demetrios Pagonis
B.S., Davidson College, 2013
A thesis submitted to the
Faculty of the Graduate School of the
University of Colorado in partial fulfillment
of the requirement for the degree of
Doctor of Philosophy
Department of Chemistry
2018

ii
This thesis entitled:
Influence of multiphase processes on the chemistry and measurement of
organic compounds in indoor and outdoor environments
written by Demetrios Pagonis
has been approved for the Department of Chemistry
____________________________________
Professor Paul Ziemann
____________________________________
Professor Joost de Gouw
Date ___________
The final copy of this thesis has been examined by the signatories, and we
find that both the content and the form meet acceptable presentation standards
of scholarly work in the above-mentioned discipline.

iii
Pagonis, Demetrios (Ph.D., Chemistry, Department of Chemistry)
Influence of multiphase processes on the chemistry and measurement of organic compounds in
indoor and outdoor environments
Thesis directed by Paul Ziemann
Abstract
Organic compounds are ubiquitous in indoor and outdoor environments, with organic
aerosols and gases impacting air quality, global climate, and human health. The life cycle of
volatile organic compounds (VOCs) in the atmosphere includes emission from indoor and
outdoor sources, oxidation in the atmosphere to form secondary organic aerosol (SOA), and
eventual deposition to a surface. Understanding each of these processes is necessary to predict
the impact of organic compounds on indoor and outdoor environments, and this thesis presents
the results of a series of studies across the life cycle of VOCs, examining the chemical and
physical processes that transform organic compounds in the atmosphere.
First, the chemistry of multifunctional hydroperoxides in SOA is studied by a series of
laboratory studies utilizing a model hydroperoxyaldehyde designed to represent the highly
oxidized multifunctional compounds that impact SOA growth in pristine environments.
Measurements of reaction rates, equilibrium constants, and decomposition mechanisms provide
insight into how chemical structure and aerosol properties affect the chemistry of multifunctional
hydroperoxides in SOA. Second, emission rates, deposition velocities, reaction rates, and
reaction products from a field study in a university art museum are presented. This study
quantifies the significant impact of human activities on indoor VOC emissions, as well as the
effect of indoor surfaces and indoor oxidants on the fate of those emissions. Lastly, this thesis

iv
presents a study aimed to improve researchers’ ability to make time-resolved measurements of
gas-phase organic compounds that partition to instrument surfaces and to Teflon tubing
commonly used for sampling lines. The simple chromatography model presented here accurately
predicts the delay in instrument response caused by gas-surface partitioning across all the tubing
lengths, diameters, flow rates, and analytes tested. Together, the studies presented in this thesis
advance the understanding of, and the ability to measure, the fate of organic compounds in
indoor and outdoor environments.

v
Acknowledgements
First, Paul — thank you for your mentorship and everything you’ve taught me over the
last five years. Your attention to detail across every aspect of a research project has made my
experiments more creative, my writing more succinct, and my figure design more aesthetically
pleasing. You taught me how to keep excitement and curiosity at the center of my research, and I
am truly grateful for all the ways you’ve made me a better chemist.
Joost and Jose — thank you for all the advice and guidance on the many projects we’ve
collaborated on and I’m looking forward to continuing to work with you in the future.
Many, many thanks to all the members of the Ziemann group. None of the work I’ve
done could have been done without all the hard work you put in every day maintaining the
instruments and chambers or all the time you’ve spent teaching me new methods. Megan —
thank you for all the chemistry insights and your patience working with and teaching me for
years. Luke — thank you for always having your door open to talk through whatever idea I’m
struggling to articulate that day. Anne — all your help in the field and in lab is truly invaluable.
Lastly, Amanda — you’ve been a part of this entire journey and I never would have made
it to this point without your love and support. Thank you.

vi
Contents
Introduction .................................................................................................................................. 1
1.1. Organic compounds in the atmosphere .............................................................................. 1
1.2. Indoor Air Quality.............................................................................................................. 2
1.3. Measurements of Gas-Phase Organic Compounds ............................................................ 2
1.4. Thesis Overview ................................................................................................................ 3
Chemistry of Hydroperoxycarbonyls in Secondary Organic Aerosol .................................... 5
2.1. Introduction ........................................................................................................................ 5
2.2. Materials and Methods ....................................................................................................... 7
Chemicals. ................................................................................................................. 7
AHPA Solution Synthesis. ........................................................................................ 8
Environmental Chamber Reactions. ......................................................................... 8
Mass Spectrometric Analysis. ................................................................................. 10
Filter Sampling........................................................................................................ 11
Functional Group Analysis. .................................................................................... 12
NMR Analysis. ....................................................................................................... 12
2.3. Results and Discussion .................................................................................................... 13
Mechanism of Formation of AHPA. ....................................................................... 13
Yield of AHPA Formed From the Gas-Phase Reaction of Cyclodecene with O3 in
the Presence of 1-Propanol. ........................................................................................ 13

vii
Potential Reaction Pathways of AHPA................................................................... 14
Mass Spectra of AHPA Standards. ......................................................................... 18
Rate and Equilibrium Constants for AHPA Cyclization. ....................................... 19
Peroxide Decomposition. ........................................................................................ 23
Identification of Peroxide Decomposition Products. .............................................. 27
Particle Phase Alcohol and Water Exchange Reactions. ........................................ 36
2.4. Conclusions ...................................................................................................................... 38
Time-Resolved Measurements of Indoor Chemical Emission Rates, Deposition Velocities,
and Reactions in a University Art Museum ....................................................................... 41
3.1. Introduction ...................................................................................................................... 41
3.2. Materials and Methods ..................................................................................................... 44
Art Museum Site. .................................................................................................... 44
Measurements and Instrumentation. ....................................................................... 44
Art Museum Model. ................................................................................................ 46
3.3. Results and Discussion .................................................................................................... 50
VOC Emission Rates. ............................................................................................. 50
VOC Deposition Rates. ........................................................................................... 56
Ozone Loss Rates. ................................................................................................... 59
VOC Oxidation and Autoxidation. ......................................................................... 61
3.4. Conclusions ...................................................................................................................... 67

viii
Effects of Gas-Wall Partitioning in Teflon Tubing and Instrumentation on Time-Resolved
Measurements of Gas-Phase Organic Compounds ........................................................... 70
4.1. Introduction ...................................................................................................................... 70
4.2. Materials and Methods ..................................................................................................... 72
Measurements of Tubing Delay .............................................................................. 72
Chemicals ................................................................................................................ 73
Model for Transport of an Organic Compound Through Teflon Tubing ............... 74
4.3. Results and Discussion .................................................................................................... 79
Effect of Volatility, Tubing Length, and Flow Rate on Tubing Delays. ................ 79
Estimating Cw for Teflon Tubing. ........................................................................... 87
Effect of Tubing Diameter on Tubing Delays. ....................................................... 88
Effect of Instrumentation on Delays. ...................................................................... 92
4.4. Conclusions ...................................................................................................................... 93
Thesis Conclusions ..................................................................................................................... 96
References ................................................................................................................................. 100
ix
List of Figures
Figure 2.1. Simple representation of the autoxidation mechanism that leads to HOM formation
from an alkylperoxy radical (Crounse et al. 2013). The resulting HOM in this scheme is a
hydroperoxycarbonyl, like the AHPA model compound studied here. .............................. 6
Figure 2.2. Mechanism of reaction of cyclodecene with O3 in the presence of 1-propanol to form
10-n-propoxy-10-hydroperoxy decanal (AHPA). ............................................................... 8
Figure 2.3. Potential reactions of AHPA in SOA. In the concerted elimination and strong acid
decomposition pathways H2, water, and propanol co-products are not shown. ............... 15
Figure 2.4. Mass spectra of AHPA standard obtained via EI-TDPBMS and CI-ITMS. ............. 16
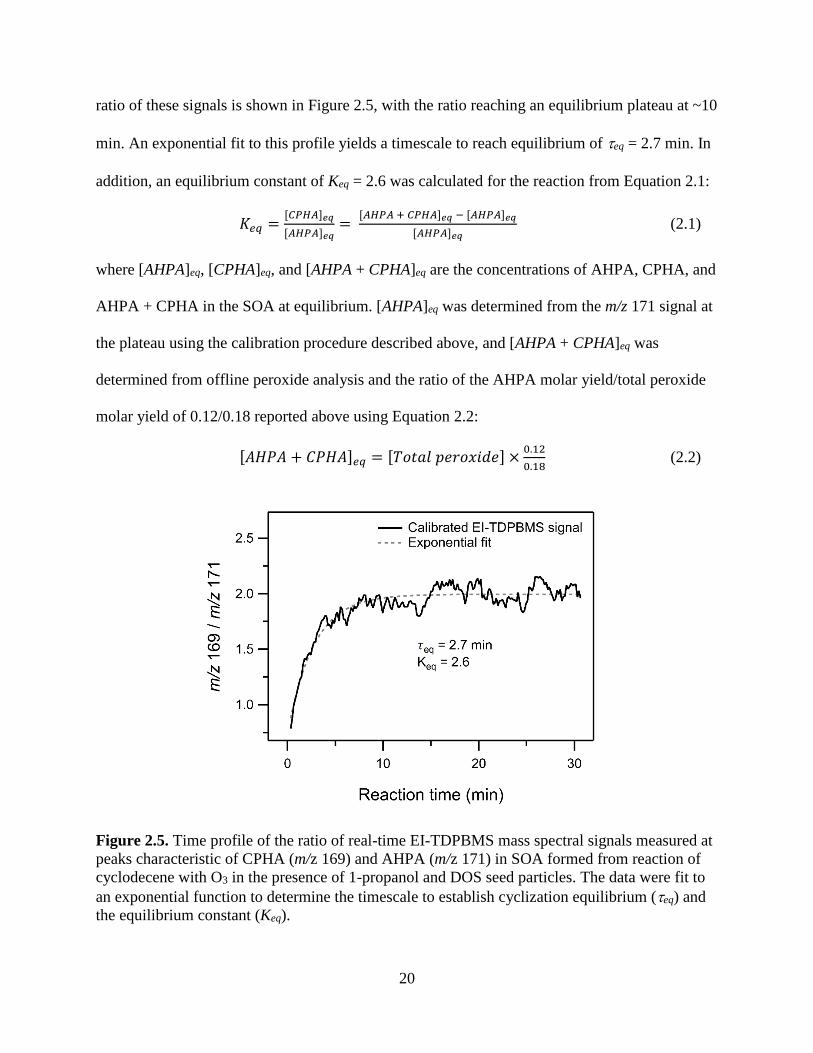
Figure 2.5. Time profile of the ratio of real-time EI-TDPBMS mass spectral signals measured at
peaks characteristic of CPHA (m/z 169) and AHPA (m/z 171) in SOA formed from
reaction of cyclodecene with O3 in the presence of 1-propanol and DOS seed particles.
The data were fit to an exponential function to determine the timescale to establish
cyclization equilibrium (eq) and the equilibrium constant (Keq). ..................................... 20
Figure 2.6. Time profiles of peroxide functional group content of SOA formed from the reaction
of cyclodecene with O3 in the presence of 1-propanol and seed particles with the
following composition: (squares) aqueous ammonium sulfate/sulfuric acid at 50% RH
and pH = 1, (circles) dry DOS, and (diamonds) dry DOS/sulfuric acid. .......................... 25
Figure 2.7. Real-time EI-TDPBMS mass spectra measured at different times for SOA formed
from the reaction of cyclodecene with O3 in the presence of 1-propanol and seed particles
with different compositions as follows: (A) immediately after formation on dry DOS, (B)
4 h after formation on dry DOS, (C) immediately after formation on dry DOS/sulfuric

x
acid, and (D) 4 h after formation on aqueous ammonium sulfate/sulfuric acid at 50% RH
and pH = 1. ........................................................................................................................ 29
Figure 2.8. Reference EI spectra of dipropoxy acetals: 1,1-dipropoxyheptane (A), 1,1-
dipropoxypropane (B), and 1,1-dipropoxytrimethylamine (C) (Stein 2016; SDBSWeb,
2017). The characteristic fragmentation pattern is -cleavage at the acetal carbon (m/z
131) followed by neutral loss of propene (m/z 89). .......................................................... 30
Figure 2.9. CI-ITMS mass spectra of filter extracts of SOA collected at different times from the
reaction of cyclodecene with O3 in the presence of 1-propanol in the absence or presence
of seed particles as follows: (A) immediately after formation in the absence of seed
particles, (B) 4 h after formation in the absence of seed particles, and (C) immediately
after formation on dry sulfuric acid seed particles. DOS seed particles were not used in
these experiments because DOS is the dominant signal in CI-ITMS at the concentrations
used in chamber experiments. ........................................................................................... 32
Figure 2.10. EI-TDPBMS spectrum of SOA produced from ozonolysis of cyclodecene in the
presence of a large excess of carbon monoxide (A). NIST reference spectrum of sebacic
acid (B) (Stein, 2016). ....................................................................................................... 35
Figure 2.11. Real-time EI-TDPBMS mass spectra of (A) SOA formed from the reaction of
cyclodecene with O3 in the presence of 1-propanol and dry DOS/sulfuric acid seed
particles, and with the subsequent addition of (B) methanol, and then (C) water. ........... 37
Figure 2.12. Potential reactions of hydroperoxyaldehydes in SOA. In the concerted elimination
and strong acid decomposition pathways coproducts of hydrogen and water are not
shown. ............................................................................................................................... 40

xi
Figure 3.1. Schematic of the box model used to describe the transport, emission, deposition, and
reaction of compounds in the University of Colorado Art Museum. The air exchange rate
of the gallery is 10 hr-1 and the indoor-outdoor air exchange rate is 0.8 hr-1. The museum
is represented by two compartments, the gallery and the supply air + rest of the building,
corresponding to the two sampling locations of this study. Air in each compartment is
assumed to be perfectly mixed. ......................................................................................... 47
Figure 3.2. Time series of carbon dioxide (A) and lactic acid (B) concentration measured by
Picarro and iodide-CIMS, respectively, during an exhibit opening at the University of
Colorado Art Museum. After the conclusion of the opening at 7:00 PM carbon dioxide is
removed from the museum at the rate of indoor-outdoor air exchange, while lactic acid is
lost at a faster rate due to deposition to surfaces. ............................................................. 54
Figure 3.3. Correlation of human emission factors for this study and Tang et al. 2016. Data
points are plotted as the mass-to-charge ratio measured by the quadrupole PTR-MS.
Emission factors between the two studies generally agree within a factor of two. Elevated
ethanol emissions (m/z 47) observed in this study are likely due to alcohol consumption
and decreased monoterpene emissions (m/z 137) are likely due to lower emissions from
personal care products. Additionally, lower O3 concentrations during this study led to
lower secondary emissions of O3 with squalene on occupants’ skin. ............................... 56
Figure 3.4. Deposition rates of organic compounds measured in the University of Colorado Art
Museum as a function of volatility (C*) and Henry’s law coefficient (H) calculated using
SIMPOL (Pankow and Asher, 2008) and GROMHE (Raventos-Duran et al. 2010),
respectively. Deposition rate increases with decreasing volatility and with increasing

xii
Henry’s law coefficient. The dashed lines represent the bounds of measurable removal
rates from the museum supply air given the sampling configuration used....................... 58
Figure 3.5. O3 loss rate in the University of Colorado Art Museum gallery apportioned between
reactions with gallery surfaces, occupants, NO, and NO2. The art exhibit opening can be
clearly seen as the dramatic increase in the loss rate to occupants at 5:00 PM on April
28th. ................................................................................................................................... 61
Figure 3.6. Measured and modeled time series of limonene concentrations in the University of
Colorado Art museum following the consumption of an orange showing removal by
ventilation and chemistry (A). Measured and modeled concentrations of highly oxidized
multifunctional compounds (HOMs) produced from limonene ozonolysis (B). The model
outputs using the two published yields for limonene HOMs bracket the measured HOM
concentrations. .................................................................................................................. 63
Figure 3.7. Comparison of nitrate-CIMS mass spectra of HOMs formed from limonene
ozonolysis in a laboratory (Jokinen et al. 2014) and in the University of Colorado Art
Museum............................................................................................................................. 65
Figure 4.1. Schematic of the chromatography model used to describe delays caused by gas-wall
partitioning of organic compounds in Teflon tubing. Compounds flow through a series of
perfectly mixed bins, undergoing gas-wall partitioning within each bin. The rates of flow
between bins (kf), absorption (ka) and desorption (kd) are dependent on tubing diameter,
flow rate, and the saturation vapor concentration c* of the compound being measured. . 75
Figure 4.2. Simulated time profiles of compound concentrations at the tubing exit assuming flow
in bins is perfectly mixed rather than laminar. The mixed flow profile was generated by
xiii
running the model with gas-wall partitioning turned off. The profiles are for 1 m of
tubing with 3/16 in. ID at a flow rate of 1 L min-1............................................................ 78
Figure 4.3. (A) PTR-MS time profiles measured in response to a step function increase in the
concentration of 2-ketones. All compounds were measured simultaneously through 1 m
of 3/16 in. ID PFA Teflon tubing at a flow rate of 0.36 L min-1. Profiles are normalized to
peak signal. The decline in signal over time is due to drift in instrument response
following start-up. (B) PTR-MS time profiles measured in response to a step function
decrease in the concentration of 2-ketones for tubing + PTR-MS (thick lines) and the
PTR-MS alone (thin lines). The tubing used was a 3 m length of 3/16 in. ID PFA Teflon,
and the flow rate for both traces was 0.36 L min-1. Profiles are normalized to the
equilibrium concentration measured prior to the step change. The signal-to-noise ratio is
lower at higher carbon numbers due to gas-wall partitioning in the chamber lowering
sample concentration as well as mass discrimination within the PTR-MS quadrupole
mass analyzer. For visual clarity the traces for 2-octanone are not shown since they
overlap with the traces for 2-decanone. ............................................................................ 81
Figure 4.4. (A) Tubing delays for PTR-MS analysis of 2-ketones sampled using 1 and 3 m of
3/16 in. ID tubing at a flow rate of 0.36 L min-1. The dashed line corresponds to the
model case where the delay is proportional to the length of the tubing, which for these
experiments is a factor of three. (B) Tubing delays for PTR-MS analysis of 2-ketones
sampled using 3 m of 3/16 in. ID tubing and flow rates of 0.36 and 2.7 L min-1. The
dashed line corresponds to the model case where the delay is inversely proportional to the
flow rate, which for these experiments is a factor of 0.13. ............................................... 83

xiv
Figure 4.5. Comparison of modeled and measured tubing delays for homologous series of 2-
ketones and 1-alkenes with a range of c* values using short (ST = 1 m) and long (LT = 3
m) lengths of 3/16 in. ID tubing with low (LF = 0.36 L min-1) flow, and long tubing with
low and high (HF = 2.7 L min-1) flow. The instrument delay for the PTR-MS is also
shown. Values of c* were calculated using SIMPOL.1 (Pankow and Asher, 2007). Error
bars are only shown for the 2-ketones LF/ST case, and represent the variability (std. dev.)
of the observations. Note that for the larger delays, the error bars are smaller than the data
points. ................................................................................................................................ 85
Figure 4.6. Simulated tubing delays presented as a function of c* and flow rate for 3/16 in. ID
PFA Teflon tubing. The range of conditions for measurements made in this study are
shown by the dashed box. Values of c* were calculated using SIMPOL.1 (Pankow and
Asher, 2007). ..................................................................................................................... 87
Figure 4.7. Simulated tubing delays presented as a function of tubing ID at various flow rates for
a compound with c* = 105 μg m-3 sampled through PFA tubing. ..................................... 90
Figure 4.8. Comparison of measured and modeled tubing delays for 1/16 in. ID and 3/16 ID
PFA Teflon tubing sampling at 0.36 L min-1. Values of c* were calculated using
SIMPOL.1 (Pankow and Asher, 2008). ............................................................................ 90
Figure 4.9. Simulated tubing delays presented as a function of tubing ID and flow rate for a
compound with c* = 105 μg m-3 sampled through PFA tubing. Reynolds numbers are
overlaid to illustrate the nonlinear relationship between tubing delay, flow rate and tubing
diameter............................................................................................................................. 91
Figure 4.10. Measured and modeled time series for a 60-second pulse of 2-ketones measured by
the PTR-MS through 1 m of 3/16 in. ID PFA Teflon tubing at 0.36 L min-1. The tubing

xv
model output was convolved with the instrument response function for each 2-ketone to
generate the traces. ............................................................................................................ 93

xvi
List of Tables
Table 2.1. Characteristic ions and fragmentation pathways for major products in SOA analyzed
by EI-TDPBMS and CI-ITMS. ......................................................................................... 19
Table 2.2. Peak shifts and assignments for 1H-NMR spectrum of AHPA-CPHA equilibrium.
Molecular structures with assignment labels are included to show which protons undergo
a change in chemical environment following the cyclization reaction (depicted in bold).
........................................................................................................................................... 22
Table 2.3. Molar yields of functional groups in SOA formed in the presence of CO without seed
particles or 1-propanol with sulfuric acid seed particles. ................................................. 35
Table 3.1. Chemical reactions included in the box model of the museum. Rate constants for
VOC reactions are those of limonene (Ziemann and Atkinson, 2012). All other rate
constants were taken from the 2015 Jet Propulsion Lab Evaluation (Burkholder et al.
2015). Ozone deposition velocities vd were fitted to minimize the error in model estimates
of gallery ozone concentration. ......................................................................................... 49
Table 3.2. Emission factors and peak concentrations for volatile chemical products emissions
following application of paint to 12 m2 of wall in the University of Colorado Art
Museum............................................................................................................................. 51
Table 3.3. Mass and peak concentrations for VOCs emitted inside the University of Colorado
Art Museum during the ARTISTIC campaign. ................................................................ 52
Table 3.4. Assigned molecular formulas and detected m/z’s for HOMs formed from limonene
ozonolysis in the University of Colorado Art Museum. ................................................... 66

1
Chapter 1
Introduction
1.1. Organic compounds in the atmosphere
Organic compounds are ubiquitous in the atmosphere, impacting global climate, human
health, and air quality (Atkinson and Arey, 2003; Ziemann and Atkinson, 2012). Atmospheric
organic compounds exist in the gas phase (volatile organic compounds, VOCs) and in suspended
solid and liquid particles (organic aerosol, OA). Roughly half of submicron aerosol mass in the
atmosphere is OA, with OA impacting global climate through its role in cloud formation and
interactions with solar radiation (Jimenez et al. 2009). Gas-phase VOCs are oxidized in the
atmosphere to form less-volatile products that condense onto existing aerosols, forming
secondary organic aerosol (SOA), a significant component of the global OA burden. SOA has
significant negative impacts on human health and is an important determinant of air quality
(Pope et al. 2009). However, many aspects of the formation of SOA from VOCs and subsequent
reactions as SOA ages in the atmosphere are poorly understood, and research is needed to
elucidate the chemical mechanisms that form and process SOA.
The reaction mechanisms that lead to SOA formation are modulated by the
concentrations of nitrogen oxides (NOx) in the atmosphere through reactions of nitric oxide with
peroxy (RO2) radicals, an intermediate in all major VOC oxidation pathways (Orlando and
Tyndall, 2012). In the last 60 years, VOC and NOx emissions in urban areas have declined
dramatically, in large part because of reductions in emissions from automobiles (Warneke et al.
2012). The reduction in NOx concentrations has led to changes in the gas-phase oxidative

2
chemistry of VOCs, increasing the lifetime of RO2 radicals and allowing for intramolecular RO2
radical reactions (autoxidation) to take place (Crounse et al. 2013; Praske et al. 2018). The
products of autoxidation reactions tend to be large, peroxide-rich multifunctional molecules with
sufficiently low vapor pressure to condense and form SOA. Little is known about the fate of
these multifunctional hydroperoxides.
1.2. Indoor Air Quality
The average person in the United States spends 87% of their time indoors, indicating that
indoor air quality and the concentration of pollutants indoor are key determinants of lifetime
exposures (Klepeis et al. 2001). Anthropogenic emissions of VOCs that occur indoors directly
impact the chemistry of the space where they are emitted, and they also have a significant impact
on the total VOC burden in urban areas, with the total contribution of volatile chemical products
(VCPs) to urban SOA potential exceeding that of automobile emissions in Los Angeles
(McDonald et al. 2018). The spatial, temporal, and chemical evolution of these VCP emissions in
the indoor environment is not well constrained, and there is a need to investigate the ways that
human activities impact indoor air quality by making time-resolved measurements of indoor
chemistry.
1.3. Measurements of Gas-Phase Organic Compounds
Gas-phase organic compounds in indoor and outdoor environments have a large range of
volatilities, with the most volatile species having a saturation vapor concentration (C*) roughly
ten orders of magnitude higher than compounds that partition equally between gas and aerosol
phases in the atmosphere (Pankow, 1994). Accordingly, gas-phase organic compounds show a
wide range of partitioning behaviors in the presence of surfaces, with semi-, intermediate- and
low-volatility compounds having an increased tendency to partition to the condensed phase. This

3
phenomenon is evident in the partitioning of organic compounds with C* below 106 μg m-3 to
Teflon used to construct the environmental chambers and the sampling lines used throughout
studies of atmospheric chemistry. Partitioning of organic compounds to the Teflon walls in
environmental chambers has been studied and systematically characterized (Matsunaga and
Ziemann, 2010; Yeh and Ziemann 2015; Krechmer et al. 2016; Huang et al. 2018), but
partitioning of organic compounds to the walls of Teflon tubing has not.
1.4. Thesis Overview
This thesis presents advances in the understanding of secondary organic aerosol
chemistry in pristine environments, the chemistry of the indoor environment, and the effects of
inlet tubing and instrument surfaces on time-resolved measurements of organic gases.
Chapter 2 describes the chemistry of multifunctional hydroperoxides in SOA. The
chemical fate of a model hydroperoxide was studied under a variety of conditions in an
environmental chamber. We present the first measurements of reaction rates and equilibrium
constants for peroxyhemiacetal formation in SOA. Oligomeric decomposition products were
identified for this model system, indicating a role for hydroperoxides in accretion reactions in
SOA. We also present results suggesting that aerosol phase state can significantly impact the
nature of acid catalysis in SOA. The reaction rates and mechanisms presented in this chapter will
facilitate future studies of hydroperoxide chemistry in SOA.
Chapter 3 presents results from field measurements of indoor chemistry at the University
of Colorado Art Museum. The time-resolved measurements presented in this chapter allow for
quantification of emission rates from occupants and their activities, deposition rates of organic
compounds to indoor surfaces, and ozone-driven oxidation chemistry. This work provides new
insights into how indoor emissions are transported and reacted through the indoor environment.

4
Chapter 4 describes results from a study characterizing the effects of organic gases
partitioning to Teflon tubing and instrument surfaces on time-resolved measurements. The time
required for analytes to equilibrate with Teflon tubing and instrument surfaces can be on the
order of minutes for compounds found in the gas phase in the indoor and outdoor environments,
significantly impacting the measured time series of the analyte. We present a simple
chromatography model that accurately captures the time needed for Teflon tubing to equilibrate
with organic gases at variable tubing lengths, tubing diameters, sample flow rates, and organic
functionality. This model will aid researchers in building sampling inlets and designing
experiments in ways that minimize the impacts of gas-surface partitioning.

5
Chapter 2
Chemistry of Hydroperoxycarbonyls in Secondary Organic Aerosol
Reprinted with permission from Pagonis, D. and Ziemann, P. J.: Chemistry of
Hydroperoxycarbonyls in secondary organic aerosol, Aerosol Science and Technology, 2018.
DOI: 10.1080/02786826.2018.1511046, Copyright 2018.
2.1. Introduction
Highly oxidized multifunctional compounds (HOMs) formed from the reaction of ozone
with -pinene and by the oxidation of other volatile organic compounds (VOCs) have been
measured as gas-phase (Ehn et al. 2012; Krapf et al. 2016) and particle-phase (Mutzel et al.
2015; Kristensen et al. 2016) reaction products in the laboratory and in the atmosphere. These
HOMs have low volatility and are estimated to contribute over 50% of secondary organic aerosol
(SOA) mass formed under pristine conditions (Ehn et al. 2014), and are expected to become a
larger fraction of future SOA mass in urban areas as NOx concentrations decrease due to air
quality regulations (Praske et al. 2018). HOMs are believed to be labile multifunctional
hydroperoxides formed through gas-phase autoxidation reactions (Crounse et al. 2013) that allow
a single VOC-oxidant reaction to lead to multiple additions of oxygen to organic molecules. A
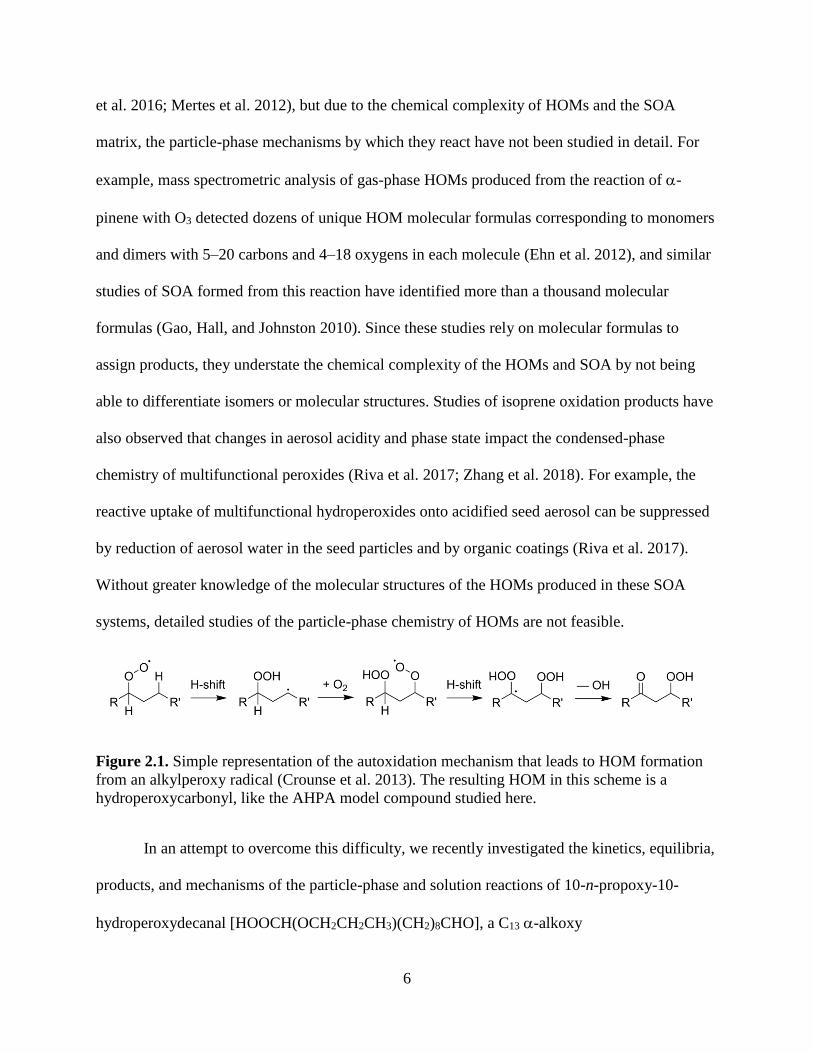
simple example of the formation of a hydroperoxycarbonyl through an autoxidation mechanism
is shown in Figure 2.1 (Crounse et al. 2013), where the initial alkylperoxy radical (RO2•) is a key
intermediate formed in the oxidation of nearly all VOCs (Orlando and Tyndall 2012). Upon
condensing into particles HOMs can decompose on timescales of tens of minutes or more (Krapf
6
et al. 2016; Mertes et al. 2012), but due to the chemical complexity of HOMs and the SOA
matrix, the particle-phase mechanisms by which they react have not been studied in detail. For
example, mass spectrometric analysis of gas-phase HOMs produced from the reaction of -
pinene with O3 detected dozens of unique HOM molecular formulas corresponding to monomers
and dimers with 5–20 carbons and 4–18 oxygens in each molecule (Ehn et al. 2012), and similar
studies of SOA formed from this reaction have identified more than a thousand molecular
formulas (Gao, Hall, and Johnston 2010). Since these studies rely on molecular formulas to
assign products, they understate the chemical complexity of the HOMs and SOA by not being
able to differentiate isomers or molecular structures. Studies of isoprene oxidation products have
also observed that changes in aerosol acidity and phase state impact the condensed-phase
chemistry of multifunctional peroxides (Riva et al. 2017; Zhang et al. 2018). For example, the
reactive uptake of multifunctional hydroperoxides onto acidified seed aerosol can be suppressed
by reduction of aerosol water in the seed particles and by organic coatings (Riva et al. 2017).
Without greater knowledge of the molecular structures of the HOMs produced in these SOA
systems, detailed studies of the particle-phase chemistry of HOMs are not feasible.
Figure 2.1. Simple representation of the autoxidation mechanism that leads to HOM formation
from an alkylperoxy radical (Crounse et al. 2013). The resulting HOM in this scheme is a
hydroperoxycarbonyl, like the AHPA model compound studied here.
In an attempt to overcome this difficulty, we recently investigated the kinetics, equilibria,
products, and mechanisms of the particle-phase and solution reactions of 10-n-propoxy-10-
hydroperoxydecanal [HOOCH(OCH2CH2CH3)(CH2)8CHO], a C13 -alkoxy

7
hydroperoxyaldehyde (AHPA) that is an appropriate model for HOMs. This compound was
chosen because in addition to being hydroperoxide-rich, HOM monomers in SOA produced by
-pinene ozonolysis have been reported to contain 1–2 carbonyl groups per molecule (Krapf et
al. 2016; Mutzel et al. 2015). The highly reactive hydroperoxide and carbonyl groups in these
HOMs are expected to play a critical role in their particle-phase chemistry (Ziemann and
Atkinson 2012), so it was necessary that the model compound employed here contain both
structural features. A recent study also suggested that production rates of AHPA in the
atmosphere can be significant under certain conditions (McGillen et al. 2017). Additional
advantages of studying this AHPA are that it can be easily synthesized with high yields either in
solution or in an environmental chamber as a major component of SOA, thus allowing for
detailed studies on a single hydroperoxycarbonyl compound under well-characterized conditions,
and that it has sufficiently low vapor pressure that its chemistry involves only particle-phase
reactions (Ziemann 2003). The results of this study provide information that will be useful for
understanding and predicting the atmospheric fate of HOMs and their contributions to SOA
formation, lifetime, and composition.
2.2. Materials and Methods
Chemicals. Chemicals with purities/grades and suppliers were as follows: trans-
cyclodecene (98%), 1-propanol (99.5%), (Sigma-Aldrich); tridecanoic acid (98%) (Aldrich); 3-
hexadecanone (99%) (Alfa Aesar); ethyl acetate (ACS) (Millipore); bis-diethylhexyl sebacate
(DOS) (97%) (Fluka); ammonium sulfate (99.5%) (Fisher Scientific); sulfuric acid (ACS)
(Macron); nitric oxide (>99%) (Matheson Gas); oxygen (UHP), carbon monoxide (CP) (AirGas).
Ozone was produced from oxygen using a Del Ozone LG7 ozone generator. The reagents and
8
solvents used in functional group analysis have been described previously (Aimanant and
Ziemann 2013a).
AHPA Solution Synthesis. AHPA standards were prepared by dissolving 10 µL of
cyclodecene in 10 mL of 1-propanol [CH3CH2CH2OH] and bubbling 2% O3 through the solution
at 1 L min–1 for 10 seconds to react all the alkene. The mechanism of the reaction is shown in
Figure 2.2 and discussed below, but in solution produces AHPA with yields of ≥ 95% (Zelikman
et al. 1971). Due to the potentially explosive nature of organic peroxides researchers should take
care when using this procedure. Total amounts of concentrated hydroperoxide should be kept to
a minimum, especially when working with smaller peroxides than those synthesized here.
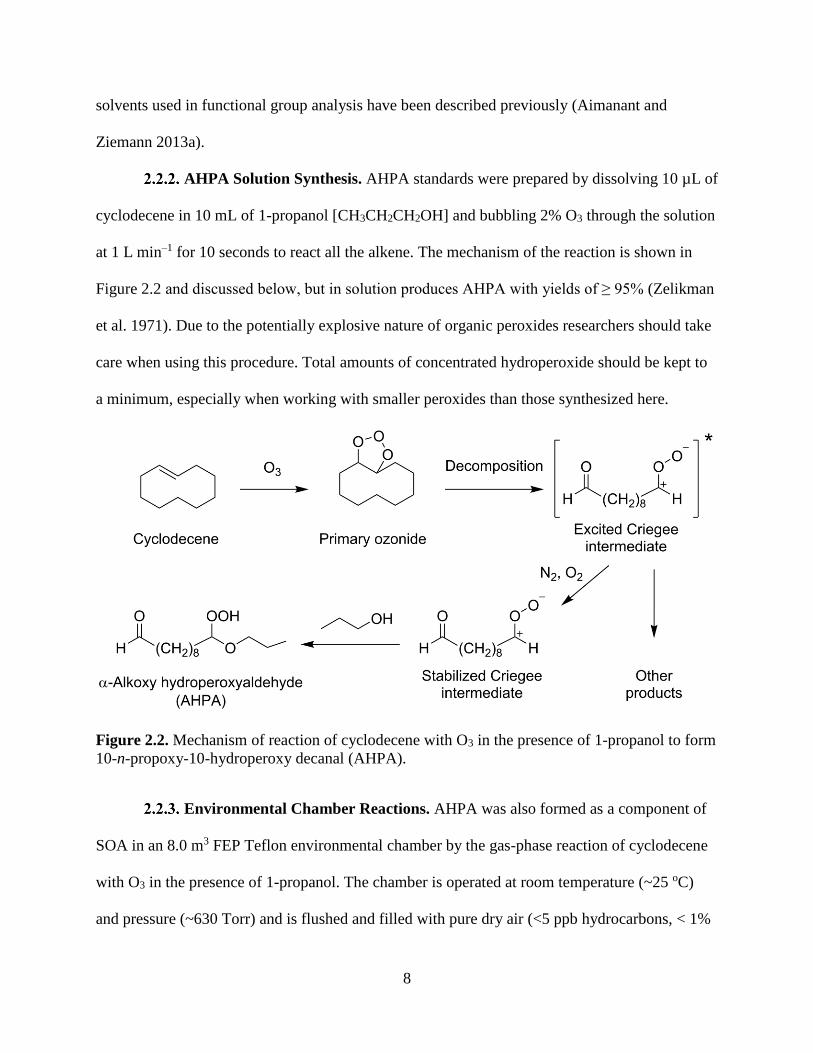
Figure 2.2. Mechanism of reaction of cyclodecene with O3 in the presence of 1-propanol to form
10-n-propoxy-10-hydroperoxy decanal (AHPA).
Environmental Chamber Reactions. AHPA was also formed as a component of
SOA in an 8.0 m3 FEP Teflon environmental chamber by the gas-phase reaction of cyclodecene
with O3 in the presence of 1-propanol. The chamber is operated at room temperature (~25 oC)
and pressure (~630 Torr) and is flushed and filled with pure dry air (<5 ppb hydrocarbons, < 1%

9
RH) from an AADCO clean air generator. Reactions were typically conducted by adding seed
particles, 1 ppm of cyclodecene, 1500 ppm of 1-propanol, and then 30 ppm of O3 to initiate the
reaction. Aerosol growth was complete within ~5 min. After 10 min of reaction, which was
sufficient to react >95% of the cyclodecene (indicated by the cyclodecene decay measured with a
proton transfer reaction-mass spectrometer (de Gouw and Warneke 2007) and estimated from the
~1 min lifetime calculated from the rate constant of 2.9 10–17 cm3 molec–1 s–1 for cis-cyclodecene
(Atkinson and Arey 2003) and the 30 ppm concentration of O3), 60 ppm of NO was added to
remove the remaining O3 (O3 + NO NO2 + O2). Also, in one experiment particle-phase
exchange reactions were probed by adding ~4000 ppm of methanol from 15–30 min after the
aerosol stopped growing, and then adding ~6000 ppm of water (~18% RH) 30–60 min later. And
in another experiment 630 ppm of carbon monoxide was used in place of 1-propanol as an SCI
scavenger (>95% efficiency), with 50 ppm of cyclohexane used as an OH radical scavenger
(Tobias and Ziemann, 2001; Docherty and Ziemann 2003). All reactants were added by flushing
measured amounts from a glass bulb (with or without heating) into the chamber using ultra-high
purity (UHP) N2. Seed particles were either dioctyl sebacate (DOS), DOS/sulfuric acid, or
aqueous ammonium sulfate/sulfuric acid. DOS was chosen because it is an inert, liquid organic
compound with a sufficiently low vapor pressure to be essentially nonvolatile, for which we have
developed methods for forming a nearly monodisperse seed aerosol. Use of DOS seed aerosol
also allows for monitoring of particle wall losses using real-time mass spectrometry and the
detection of SOA evaporation during a chamber reaction (Aimanant and Ziemann, 2013b). The
DOS particles were formed using an evaporation-condensation generator, and the DOS/sulfuric
acid particles were formed by evaporating 0.25 mL of 0.1% sulfuric acid/water from a glass bulb
and allowing the small sulfuric acid particles generated following the addition to coagulate with

10
DOS seed particles produced by the evaporation-condensation generator. The coagulation was
monitored with a scanning mobility particle sizer (SMPS) and the presence of sulfuric acid in the
aerosol was confirmed by thermal desorption particle beam mass spectrometric (TDPBMS)
analysis. These instruments are described below. The aqueous ammonium sulfate/sulfuric acid
particles were formed by atomizing an aqueous solution of 8 × 10⁻³ M ammonium sulfate and 8
× 10–5 M sulfuric acid from a Collison atomizer into the chamber at 50% RH. According to E-
AIM calculations (www.aim.env.uea.ac.uk/aim/aim.php; Clegg, Brimblecombe, and Wexler
1998; Wexler and Clegg, 2002) this aerosol had pH ~ 1 once it equilibrated with the water vapor
in the chamber. Throughout each experiment the aerosol size distribution was measured using a
scanning mobility particle sizer (SMPS) (Docherty and Ziemann 2003), aerosol composition was
analyzed with a thermal desorption particle beam mass spectrometer (Tobias et al. 2000), and O3
was monitored with a Dasibi 1003 Ozone Monitor. After each experiment aerosol was collected
onto filters for offline analyses.
Mass Spectrometric Analysis. Aerosol is sampled directly into the thermal
desorption particle beam mass spectrometer (TDPBMS) (Tobias et al. 2000) through an
aerodynamic lens, which focuses the particles into a narrow beam for transport into a
differentially-pumped high-vacuum chamber. There they impact and vaporize on a polymer-
coated copper rod that is heated to 160˚C, and the vapors are ionized by 70 eV electrons for
analysis in an Extrel triple quadrupole mass spectrometer. To make explicit that TDPBMS mass
spectra are obtained by electron ionization we hereafter refer to this as the EI-TDPBMS.
The EI-TDPBMS response to AHPA aerosol was calibrated by generating known mass
concentrations of aerosol containing synthesized AHPA. A 6.3 mM solution of the AHPA
standard in 1-propanol (synthesized as described above) was atomized in a Collison atomizer

11
that was coupled to a syringe pump (Chemyx Nexus 3000) and operated at 0.1 mL min–1. The
aerosol produced was dried by passing through charcoal and silica gel diffusion dryers and then
the flow was split, with 0.75 L min–1 entering the EI-TDPBMS and 5 L min–1 passing through a
filter sampler for collection of particles onto pre-weighed PTFE filters (Millipore Fluoropore
0.45 m) for 50 min. Filters were reweighed to determine the mass concentration of the AHPA
aerosol entering the EI-TDPBMS and analyzed using peroxide functional group analysis to
determine AHPA purity, which was >95%.
Solution-synthesized hydroperoxides and SOA collected on filter samples were
also analyzed using a Thermo Finnigan PolarisQ chemical ionization ion trap mass spectrometer
(CI-ITMS) equipped with a direct insertion probe (Ranney and Ziemann 2017). Samples were
prepared for CI-ITMS analysis by drying ~3 L of 5 mg mL–1 solution inside a small glass vial.
The vials were then loaded into the tip of the direct insertion probe and thermally desorbed from
the tip of the probe into the ionization region, where they underwent chemical ionization with
isobutane as a reagent gas.
Filter Sampling. Aerosol was collected onto pairs of pre-weighed PTFE filters
(Millipore Fluoropore 0.45 m) by sampling air at 15 L min–1 through two 30 cm long, ¼” outer
diameter stainless steel tubes. Filters were re-weighed after sampling and the mass of SOA
collected was determined by difference. All mass measurements were conducted with a Mettler
Toledo XS3DU microbalance (1 g precision). The collected SOA was extracted into ethyl
acetate without sonication (three 5-min extractions into 5 mL of ethyl acetate, which were then
pooled) immediately following weighing to minimize the amount of time for SOA components
to react while on the filter. Extraction efficiencies determined previously for these methods were
>95% (Matsunaga and Ziemann 2009). When necessary, samples were stored overnight in a

12
freezer at –25 ˚C. Peroxide functional group analysis was always conducted immediately after
extraction (never frozen), and all other functional group analyses were conducted within 18 h of
filter collection.
Functional Group Analysis. Derivatization-spectrophotometric methods we
developed previously (Aimanant and Ziemann 2013a) were used to quantify the moles of
peroxide [HC–OOH] (M = 46), carboxyl [O=C–OH] (M = 45), carbonyl [C=O] (M = 28), ester
[O=C–O]–R (M = 44), hydroxyl [HC–OH] (M = 30), and methylene [CH2] (M = 14) functional
groups in SOA, with the number of methylene groups being determined from the difference in
the measured SOA mass and the mass of other functional groups calculated by assuming they
have molecular weights corresponding to the structures shown in brackets. For convenience it
was assumed that all the products have 10 carbons, the same number of as cyclodecene. This
assumption is likely the largest source of error in our estimate of molecular weight, but since
there was no evidence for the presence of oligomers in the SOA the error should not be large.
Each derivatization technique involves the formation of a chromophore specific to the functional
group being measured, and solutions were then analyzed using an Ocean Optics USB4000 UV-
Vis spectrophotometer.
NMR Analysis. Proton nuclear magnetic resonance spectroscopy (1H-NMR)
analysis was carried out at the University of Colorado Department of Chemistry and
Biochemistry NMR Spectroscopy Facility using a Bruker Avance-300 NMR. AHPA standards
were synthesized as described above and either analyzed as is or purified by collecting fractions
manually from HPLC eluent. Fractions were dried under UHP N2 and reconstituted in deuterated
dimethyl sulfoxide (d6-DMSO) for analysis. Spectra were processed using the MestReNova

13
software package. Without and with purification the purity of AHPA determined from the NMR
analysis was ≥95%.
2.3. Results and Discussion
Mechanism of Formation of AHPA. The mechanism of formation of the AHPA
model HOM from reaction of cyclodecene with O3 in the presence of 1-propanol is shown in
Figure 2.2 (Ziemann 2003). The reaction is initiated by addition of O3 to the C=C double bond to
form an unstable primary ozonide, which rapidly decomposes to an excited Criegee intermediate
(ECI). In solution, essentially all ECI are thermalized by collisions with solvent to form
stabilized Criegee intermediates (SCI), which react almost exclusively with 1-propanol to form
the AHPA, 10-n-propoxy-10-hydroperoxydecanal (Zelikman, et al. 1971). In the gas phase, the
ECI can be thermalized by collisions with air to form SCI, which can undergo ring closure to
form a secondary ozonide (SOZ) (Donahue et al. 2011), or in the presence of a high
concentration of 1-propanol the SCI can react to form the AHPA. Using the approach presented
in Docherty et al. (2005) we estimate that the large excess of 1-propanol scavenges >95% of the
stabilized Criegee intermediates and >99% of the OH radicals produced from the reaction. ECI
also undergo isomerization and decomposition reactions that lead to stable products and the
formation of RO2• radicals, which for the high VOC concentrations used here are expected to
react with other RO2• radicals and HO2
radicals to form a variety of products containing
carbonyl, hydroxyl, carboxyl, hydroperoxy, peroxycarboxyl (Ziemann 2002), and possibly ester
(Müller et al. 2008) groups.
Yield of AHPA Formed From the Gas-Phase Reaction of Cyclodecene with O3
in the Presence of 1-Propanol. In order to interpret the experimental results of this study, it was
necessary to determine the molar yield of AHPA (same as the molar yield of SCI) formed from

14
the gas-phase reaction of cyclodecene with O3 in the presence of 1-propanol. This was
determined from the difference in the molar yields of peroxide in SOA (moles of peroxide in
SOA/moles of cyclodecene reacted) formed when 1-propanol and CO were used as SCI
scavengers, since reaction of CO with the SCI forms CO2 and a volatile C10 dialdehyde
(Atkinson 1997) rather than AHPA. From the measured molar yields of peroxide in SOA of 0.18
and 0.06 for the 1-propanol and CO experiments we obtained a molar yield of AHPA of 0.12.
For this reaction we thus estimate that 12% of the products are formed through the SCI pathway
and 88% through other pathways.
Potential Reaction Pathways of AHPA. A previous study of AHPA (Ziemann
2003) has shown that its hydroperoxide and carbonyl groups readily undergo an intramolecular
reaction in SOA to form a cyclic peroxyhemiacetal (CPHA), as shown in Figure 2.3, and that
these are the dominant early reaction products. Intermolecular peroxyhemiacetal oligomer
formation is also possible for AHPA, as it has been observed from the reaction of the C14 -
methoxy hydroperoxide and C13 aldehyde products of the ozonolysis of 1-tetradecene in the
presence of methanol (Tobias and Ziemann, 2000). In that study the C27 peroxyhemiacetal was
thermally desorbed intact for mass spectral analysis using temperature-programmed TDPBMS,
and when the same technique was applied to AHPA SOA no C26 peroxyhemiacetal oligomer
(which would have been the product formed from reaction of two C13 AHPA molecules) was
detected, indicating that AHPA does not undergo intermolecular peroxyhemiacetal formation
(Ziemann 2003). It is also worth noting that evidence for the stability of peroxides during
thermal desorption under the conditions used here can be found in the EI-TDPBMS and CI-
ITMS mass spectra shown in Figure 2.4, which can only be explained by fragmentation of the
[M]+• and [M + H]+ ions formed by ionization of the intact AHPA.

15
Figure 2.3. Potential reactions of AHPA in SOA. In the concerted elimination and strong acid
decomposition pathways H2, water, and propanol co-products are not shown.

16
Figure 2.4. Mass spectra of AHPA standard obtained via EI-TDPBMS and CI-ITMS.
Since relatively little is known about the reactions of hydroperoxides in SOA beyond
peroxyhemiacetal formation, and since CPHA have structures similar to the cyclic hemiacetals
(CHA) formed in SOA from cyclization of 1,4-hydroxycarbonyls (Aimanant and Ziemann
2013b; Ranney and Ziemann 2016), we have looked to the chemistry of 1,4-hydroxycarbonyls
and to the synthetic organic chemistry literature to develop a more complete scheme for
describing the potential fate of AHPA.
After 1,4-hydroxycarbonyls cyclize to form CHA they can undergo dehydration to form
dihydrofurans, or oligomerization in which CHA undergo self-reactions to form acetals

17
(Aimanant and Ziemann 2013b). Studies conducted on CHA in dry SOA in the presence of
added HNO3 showed that the dehydration of CHA is catalyzed by undissociated molecular
HNO3 (general acid catalysis) (Ranney and Ziemann 2016), whereas acetal formation is
apparently catalyzed by H+ (specific acid catalysis) (Ziemann and Atkinson 2012). On the basis
of these studies, CPHA is expected to undergo either dehydration or reaction with 1-propanol to
form a peroxyacetal. 1-Propanol is shown as the reacting alcohol in Figure 2.3 because its
mixing ratio in the chamber (1500 ppm to ensure high-efficiency scavenging of SCI) was so high
that it provided a controlled source of hydroxyl groups for particle-phase reactions. Knowing the
identity of the reacting alcohol in the SOA facilitated the identification of products of accretion
reactions.
Two studies of the decomposition of organic hydroperoxides in the presence of aldehydes
(Durham, Wurster, and Mosher 1958) and strong acid (Griesbaum and Neumeister, 1982)
reported in the synthetic organic chemistry literature are also relevant to the current work, even
though they were conducted in bulk solutions instead of SOA. In particular, they are informative
since they establish that AHPA cyclize to CPHA, and they point to the importance of
peroxyhemiacetals as key intermediates in decomposition reactions. In their study of the
decomposition of n-butyl hydroperoxide in the presence of butanal, Durham, Wurster and
Mosher (1958) observed a high yield (0.52) of gaseous H2, and experiments with deuterated
peroxide showed that the source of H2 was the alkyl chains of the hydroperoxide and aldehyde.
The primary products in solution were butyric acid, butyraldehyde, butyl butyrate, butyl alcohol,
and a small amount of butyl formate, indicating that decomposition did not proceed by a single
pathway under these conditions. And when Griesbaum and Neumeister (1982) investigated the
decomposition of 6-methoxy-6-hydroperoxyhexanal (an AHPA similar to ours) in methanol in

18
the presence of strong acid, they observed a 1:2:1 yield ratio of diester, acetal ester, and diacetal,
and proposed a simpler decomposition mechanism in which a peroxyacetal intermediate
decomposed to give these products. These results have been incorporated into Figure 2.3 as the
concerted elimination and strong acid decomposition pathways for CHPA, respectively.
Knowing then that CPHA and peroxyacetals are likely to be key intermediates in AHPA
decomposition in SOA, we set out to characterize the cyclization reaction of AHPA and identify
decomposition products with and without strong acid present to determine which of these
pathways are likely applicable to HOMs.
Mass Spectra of AHPA Standards. Mass spectra of the AHPA (M = 246)
standard acquired using EI-TDPBMS and CI-ITMS are shown in Figure 2.4. The electron
ionization fragmentation pattern has been established previously (Ziemann 2003), with dominant
peaks at m/z 213 and 171. Under chemical ionization conditions the AHPA shows a similar
fragmentation pattern, but with an additional peak at m/z 229. These fragmentation pathways are
described further in Table 2.1.

19
Table 2.1. Characteristic ions and fragmentation pathways for major products in SOA analyzed
by EI-TDPBMS and CI-ITMS.
EI-TDPBMS [M]+• CI-ITMS [M + H]+
Compound Structure M Neutral loss m/z Neutral loss m/z
AHPA
246
H2O 229
HO2 213 H2O2 213
HO2 + C3H6 171 H2O2 + C3H6 171
HO2 + C3H7OH 153 H2O2 + C3H7OH 153
CPHA
246 OH 229
OH + C3H7OH 169
Diester
286
287
C3H6 245
C3H7O 227 C3H7OH 227
C3H7O + C3H6 185 C3H7OH + C3H6 185
Acetal ester
330
C3H7O 271 C3H7OH 271
C3H7O + C3H6 229 C3H7OH + C3H6 229
-cleavage 131
-cleavage + C3H6 89
Diacetal
374
C3H7O + C3H7OH 255
-cleavage 131
-cleavage + C3H6 89
Rate and Equilibrium Constants for AHPA Cyclization. Rate and equilibrium
constants for cyclization of hydroperoxyaldehydes have not been previously reported, and SOA
models (Capouet et al. 2008) have only included peroxyhemiacetal formation from bimolecular
reactions using values obtained from measurements conducted in bulk solutions (Antonovskii
and Terent’ev 1967). In an effort to gain more quantitative information on this reaction, the
formation of AHPA and cyclization to CPHA in SOA produced in the environmental chamber
from the reaction of cyclodecene with O3 in the presence of 1-propanol and DOS seed particles
were monitored using the EI-TDPBMS signals at m/z 169 and 171, which are characteristic ions
formed by electron ionization of CPHA and AHPA, respectively (Ziemann 2003). A plot of the
20
ratio of these signals is shown in Figure 2.5, with the ratio reaching an equilibrium plateau at ~10
min. An exponential fit to this profile yields a timescale to reach equilibrium of eq = 2.7 min. In
addition, an equilibrium constant of Keq = 2.6 was calculated for the reaction from Equation 2.1:
𝐾𝑒𝑞 =[𝐶𝑃𝐻𝐴]𝑒𝑞
[𝐴𝐻𝑃𝐴]𝑒𝑞=
[𝐴𝐻𝑃𝐴 + 𝐶𝑃𝐻𝐴]𝑒𝑞 − [𝐴𝐻𝑃𝐴]𝑒𝑞
[𝐴𝐻𝑃𝐴]𝑒𝑞 (2.1)
where [AHPA]eq, [CPHA]eq, and [AHPA + CPHA]eq are the concentrations of AHPA, CPHA, and
AHPA + CPHA in the SOA at equilibrium. [AHPA]eq was determined from the m/z 171 signal at
the plateau using the calibration procedure described above, and [AHPA + CPHA]eq was
determined from offline peroxide analysis and the ratio of the AHPA molar yield/total peroxide
molar yield of 0.12/0.18 reported above using Equation 2.2:
[𝐴𝐻𝑃𝐴 + 𝐶𝑃𝐻𝐴]𝑒𝑞 = [𝑇𝑜𝑡𝑎𝑙 𝑝𝑒𝑟𝑜𝑥𝑖𝑑𝑒] ×0.12
0.18 (2.2)
Figure 2.5. Time profile of the ratio of real-time EI-TDPBMS mass spectral signals measured at
peaks characteristic of CPHA (m/z 169) and AHPA (m/z 171) in SOA formed from reaction of
cyclodecene with O3 in the presence of 1-propanol and DOS seed particles. The data were fit to
an exponential function to determine the timescale to establish cyclization equilibrium (eq) and
the equilibrium constant (Keq).

21
We also measured a similar equilibrium constant of 2.8 for the cyclization of AHPA in
d6-DMSO using 1H-NMR. Peak shifts, areas, and assignments are presented below in Table 2.2.
We normalize all peaks using the methyl triplet at 0.87 ppm, since the peak is large, isolated, and
straightforward to assign. All peak splitting is consistent with assignments in Table 2.2, with
long-range splitting observed across the alcohol and propoxy oxygens, giving rise to a doublet of
multiplets, a doublet of triplets, and a quintet for assignments 11, CHPA 1, and CPHA 10,
respectively. The methylene hydrogens (2-9, 11-12) and the methyl hydrogens (13) do not
undergo any significant change in chemical environment upon cyclization, and so they each give
an integrated area of ~1. We observe that three peaks in AHPA undergo a change in chemical
environment upon cyclization to CPHA: the aldehydic hydrogen (1), the hydroperoxide
hydrogen (14), and the hydrogen bonded to the hydroperoxide carbon (10). Since 1H-NMR peak
areas are quantitative, we can use the average integrated areas of the peaks assigned to AHPA
and CPHA to determine the relative concentration of each species and calculate the equilibrium
constant using Equation 2.1.

22
Table 2.2. Peak shifts and assignments for 1H-NMR spectrum of AHPA-CPHA equilibrium.
Molecular structures with assignment labels are included to show which protons undergo a
change in chemical environment following the cyclization reaction (depicted in bold).
(ppm) Area Multiplicity Assignment
0.87 3.00a 3 CH3: 13 1.24 11.71 m CH2: 3-8 1.50 6.18 m CH2: 2, 9, 12 3.57 1.96 2 mb CH2-OR: 11 4.69 0.26 3 HOO-CH-OR: AHPA 10 4.88 0.69 2 3 ROO-CH-OH: CPHA 1 5.02 0.66 5 ROO-CH-OR: CPHA 10 6.43 0.65 2 ROH: CPHA 14 9.66 0.22 3 C(O)H: AHPA 1
11.44 0.24 1 ROOH: AHPA 14
a Used for area normalization. b Doublet of multiplets.
Taking the values presented in Figure 2.5, the rate constants for the cyclization (kf) and
ring-opening reactions (kr) were then calculated from eq = 2.7 min and Keq = 2.6 to be kf = 4.4 ×
10–3 s–1 and kr = 1.7 × 10⁻³ s–1 using Equations 2.3 and 2.4 (Schwarzenbach, Gschwend, and
Imboden 2003):
𝐾𝑒𝑞 =𝑘𝑓
𝑘𝑟 (2.3)
𝜏𝑒𝑞 =1
𝑘𝑓+𝑘𝑟 (2.4)
This measured timescale of ~3 min for cyclization can be compared with values expected
for particle-phase bimolecular reactions. From experiments conducted with tert-butyl
hydroperoxide (a tertiary hydroperoxide with a structure most similar to the secondary

23
hydroperoxide used here) and acetaldehyde in different solvents, Antonovskii and Terent’ev
(1967) report a range of room temperature rate constants of 1.2 × 10⁻² to 1.3 × 10⁻⁴ M–1 s–1 for
bimolecular peroxyhemiacetal formation and 2.0× 10⁻⁴ to 8.3× 10⁻⁵ s–1 for the reverse reaction.
These rate constants were used in kinetic simulations conducted in KinSim v3.1 (Peng et
al. 2015) with the following quantities to give a range of timescales for establishing equilibrium
of about 6 to 80 min: initial concentrations of hydroperoxide and aldehyde groups of 2 M
(estimated assuming an SOA density of 1.2 g cm–3), an average SOA molecular weight of 250 g
mol–1 (calculated from the results of the functional group analysis (Aimanant and Ziemann
2013a)), and a mole fraction of AHPA in the SOA of 0.43 (calculated from the product of the
molar yields of AHPA (0.12) and SOA (0.36), with the latter value calculated as (mass of
SOA/molecular weight of SOA)/moles of cyclodecene reacted). Cyclization is faster than all of
these reactions, probably because unimolecular reactions do not have the same unfavorable loss
of entropy as bimolecular reactions (Bruckner 2002). The rates of both cyclization and oligomer
formation could be increased by the presence of a strong acid catalyst, but this also affects rates
of decomposition reactions as discussed below.
Peroxide Decomposition. Prior to investigating the decomposition of peroxides
present in SOA, the possible effects of filter sampling, extraction, and weighing on their stability
was determined by atomizing synthesized AHPA (purity ≥95%) onto a PTFE filter, extracting
the AHPA in ethyl acetate, and measuring the mass and peroxide content of the extract.
Comparison of the extracted moles of AHPA based on measured SOA mass (moles AHPA =
SOA mass/AHPA molecular weight) and measured peroxide (moles AHPA = moles peroxide)
showed that the sample was still ≥95% AHPA, indicating that filter collection and extraction did

24
not contribute to the peroxide decomposition reported here for SOA. In addition, filter mass was
stable over the 3 min required to take replicate measurements on the microbalance.
The rate of decomposition of AHPA (and other peroxides present in smaller amounts)
was then measured for SOA formed under the following three conditions: DOS seed particles at
~0% RH, DOS/sulfuric acid seed particles at ~0% RH, and aqueous ammonium sulfate/sulfuric
acid seed particles at pH ~ 1 and 50% RH, which is typical of atmospheric conditions (Guo et al.
2015; Guo et al. 2017). After SOA formation, 3–6 filter samples were collected at different
intervals over a period of ~4 h, extracted, and analyzed immediately for peroxide content. We
note that no nucleation was observed in any experiment with seed aerosol, and that functional
group analysis of experiments without seed aerosol gave the same results as those using dry DOS
seed. Furthermore, the SOA mass concentration in the chamber was constant after correcting for
particle wall loss, indicating that no significant particle evaporation occurred during the
experiments.
The results of the peroxide decomposition measurements are shown in Figure 2.6, where
the number of moles of SOA was calculated from the SOA mass and the average SOA molecular
weight of 250 g mol–1. Under dry conditions with inert DOS seed particles the decomposition
rate was 17% hour–1. This is similar to the rates of 13% h–1 and 15% h–1 measured by Mertes et
al. (2012) and Krapf et al. (2016) for SOA formed from -pinene ozonolysis. Despite the
differences in peroxide structure and SOA composition, the emerging trend is that organic
peroxides in SOA decompose within a few hours when there are no strong acids present. In
experiments conducted with seed particles containing sulfuric acid, the effect of the sulfuric acid
on peroxide decomposition varied with the type of particles used. In experiments using dry
DOS/sulfuric acid seed particles the peroxide content of the SOA had fallen to almost zero by the

25
time a filter sample could be collected after 30 min of reaction (Figure 2.6), indicating a
timescale less than ~10 min. When aqueous ammonium sulfate/sulfuric acid seed particles were
used, however, the peroxide decomposition rate was similar to that for dry DOS seed particles
without added acid.
Figure 2.6. Time profiles of peroxide functional group content of SOA formed from the reaction
of cyclodecene with O3 in the presence of 1-propanol and seed particles with the following
composition: (squares) aqueous ammonium sulfate/sulfuric acid at 50% RH and pH = 1, (circles)
dry DOS, and (diamonds) dry DOS/sulfuric acid.
We attribute the difference in decomposition observed with dry DOS/sulfuric acid and
aqueous ammonium sulfate/sulfuric acid seed particles to the phase state of the particles and its
effect on partitioning of sulfuric acid. The parameterization of Bertram et al. (2011) shows that
SOA with an O/C ratio of 0.3 (calculated from the functional group composition) and an
ammonium sulfate component will exhibit liquid-liquid phase separation between the organic
and aqueous phases below 95% RH. The experiments in this work using aqueous ammonium
sulfate/sulfuric acid seed particles were conducted at 50% RH, so we expect two phases to be

26
present when AHPA SOA condenses onto the seed particles. Although the morphology of these
phase-separated particles is unknown, for organic aerosol with an average molecular weight of
250 g mol-1 and no oligomers, the estimated timescale for a molecule to diffuse through a
particle of the size generated in these experiments is ~1 ms (Docherty and Ziemann, 2006). Since
this timescale is much shorter than the observed timescale for peroxide decomposition (~6 h), the
organic phase is likely well-mixed during peroxide decomposition regardless of morphology.
Furthermore, although published research investigating the partitioning of sulfuric acid between
aqueous and organic phases is sparse, one reported study (Hayes and Pepper, 1961) conducted
with dichloroethane indicates that only a trace amount of undissociated molecular sulfuric acid
partitions to the organic phase. This is consistent with our E-AIM (Wexler and Clegg 2002)
calculations that show that 100% of the sulfuric acid is dissociated in the aqueous phase, making
molecular sulfuric acid unavailable for partitioning to the organic SOA phase. Together these
results suggest that sulfuric acid exists almost entirely in the aqueous phase in these experiments
and so is probably not available to catalyze AHPA decomposition in the organic phase.
These results highlight the uncertain nature of acid catalysis in aerosol where there is
little water or there is phase separation between organic and aqueous phases. Recent results
showing that the pH range of ambient submicron aerosols is typically 0–4 assume that
hygroscopic organic components are in the aqueous phase and contribute to total aerosol water
uptake (Guo et al. 2015; Guo et al. 2017). Our results indicate, however, that for phase-
separated aerosol with low O/C ratios, such as AHPA, most of the acid remains in the aqueous
phase and so is not available to catalyze reactions in the organic phase. Phase separation may
thus create a potential barrier to acid catalysis in aerosol particles. In light of the results of
Ranney and Ziemann (2016) that demonstrated occurrence of general acid catalysis by

27
undissociated molecular nitric acid in dry organic aerosol, it seems plausible that the acid-
catalyzed decomposition that we observe in dry aerosol using organic seed is general acid
catalysis by undissociated molecular sulfuric acid. The mechanisms of general acid catalysis in
concentrated solutions are well documented, with prior studies of the acid-catalyzed hydration of
alkenes and acid-catalyzed dehydration of alcohols showing that these reactions can proceed
through a wide variety of general acid catalysis mechanisms, depending on the identity and
concentration of the acid catalyst and the properties of the solvent (Vinnik and Obraztsov, 1990).
It seems likely, therefore, that acid catalysis in aerosols proceeds by different mechanisms in
different aerosol phases, and that the mechanisms of reaction will vary with aerosol phase and
humidity.
Identification of Peroxide Decomposition Products. Using the EI-TDPBMS and
CI-ITMS mass spectra, functional group composition, and potential reaction pathways outlined
above as guides, we have identified several decomposition products of AHPA. The structure,
molecular weight, characteristic ions, and EI and CI fragmentation pathways for all the major
identified reaction products are shown in Table 2.1. Figure 2.7 shows real-time EI-TDPBMS
spectra of the SOA formed in the absence and presence of sulfuric acid and humidity. Figure
2.7A shows the mass spectrum immediately following SOA formation on dry DOS seed particles
in the absence of sulfuric acid and Figure 2.7B shows the mass spectrum of this SOA after 4 h of
peroxide decomposition. Most notable is the similarity of the two mass spectra. Whereas we
attribute the peaks at m/z 213 and 171 in Figure 2.7A to AHPA, and m/z 229 and 169 to CPHA
(Ziemann, 2003), their presence in Figure 2.7B must also be due to other compounds since we
know from functional group analysis that ~60% of the peroxides have decomposed within 4 h
(Figure 2.6). Products that are expected to have peaks at m/z 229, 213, 171, and 169 could be

28
formed from a bimolecular Baeyer-Villager reaction (Wurster, Durham, and Mosher 1958)
between two AHPA, which are present in significant amounts ([AHPA]eq/[CPHA]eq ~ 0.4) after
rapid equilibration with CPHA. In this reaction, a hydroperoxide group in one AHPA oxidizes
the carbonyl group of another AHPA to a carboxyl group and in the process is reduced to a
hydroxyl group (Figure 2.3). The resulting products are an alkoxy hydroperoxyacid and alkoxy
hydroxycarbonyl, with the latter compound rapidly cyclizing to an alkoxy cyclic hemiacetal
(Ranney and Ziemann 2016). They should undergo EI fragmentation by pathways similar to
those of AHPA and CHPA (Ziemann, 2003) to form ions at m/z 229, 213, 171, and m/z 169. It is
also likely that over the 4 h period of peroxide decomposition that the peroxyacetal is formed
(Figure 2.3) in significant amounts and contributes to the m/z 229 and 169 peaks by
fragmentation pathways similar to the CPHA.

29
Figure 2.7. Real-time EI-TDPBMS mass spectra measured at different times for SOA formed
from the reaction of cyclodecene with O3 in the presence of 1-propanol and seed particles with
different compositions as follows: (A) immediately after formation on dry DOS, (B) 4 h after
formation on dry DOS, (C) immediately after formation on dry DOS/sulfuric acid, and (D) 4 h
after formation on aqueous ammonium sulfate/sulfuric acid at 50% RH and pH = 1.
30
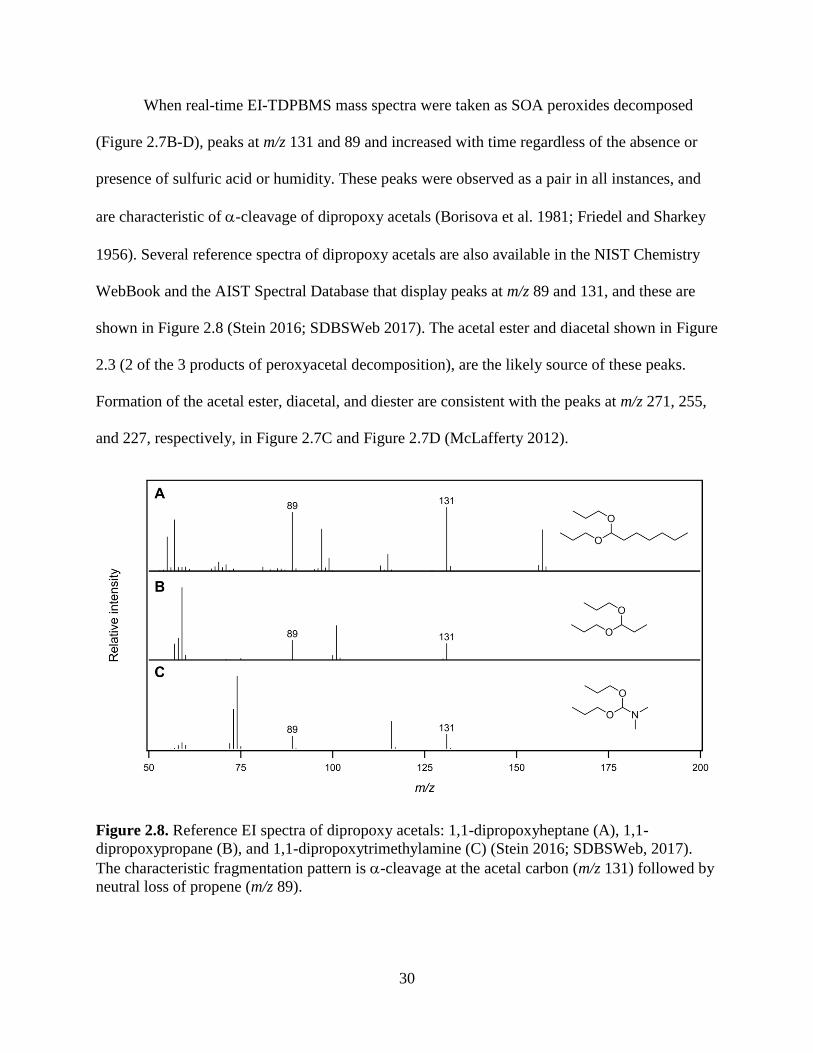
When real-time EI-TDPBMS mass spectra were taken as SOA peroxides decomposed
(Figure 2.7B-D), peaks at m/z 131 and 89 and increased with time regardless of the absence or
presence of sulfuric acid or humidity. These peaks were observed as a pair in all instances, and
are characteristic of -cleavage of dipropoxy acetals (Borisova et al. 1981; Friedel and Sharkey
1956). Several reference spectra of dipropoxy acetals are also available in the NIST Chemistry
WebBook and the AIST Spectral Database that display peaks at m/z 89 and 131, and these are
shown in Figure 2.8 (Stein 2016; SDBSWeb 2017). The acetal ester and diacetal shown in Figure
2.3 (2 of the 3 products of peroxyacetal decomposition), are the likely source of these peaks.
Formation of the acetal ester, diacetal, and diester are consistent with the peaks at m/z 271, 255,
and 227, respectively, in Figure 2.7C and Figure 2.7D (McLafferty 2012).
Figure 2.8. Reference EI spectra of dipropoxy acetals: 1,1-dipropoxyheptane (A), 1,1-
dipropoxypropane (B), and 1,1-dipropoxytrimethylamine (C) (Stein 2016; SDBSWeb, 2017).
The characteristic fragmentation pattern is -cleavage at the acetal carbon (m/z 131) followed by
neutral loss of propene (m/z 89).

31
Further evidence of the formation of peroxyacetals and subsequent decomposition to the
acetal ester and diester are seen in the CI-ITMS mass spectra in Figure 2.9 of SOA formed in the
absence (Figure 2.9A and Figure 2.9B) and presence (Figure 2.9C) of dry sulfuric acid seed
particles. Looking first at Figure 2.9C, ionization of the acetal ester should create an [M + H]+
ion that fragments to form m/z 271 and 229 ions that are characteristic of acetals (Lin, Tien, and
Chang 1989; Borisova et al. 1981). Evidence for the diester was obtained by comparing the mass
spectrum with that of bis-diethylhexyl sebacate (DOS), a sebacate diester standard, for which we
observed a [M + H]+ peak along with peaks corresponding to losses of an alkene, alcohol, and
both simultaneously, from the alkyl substituents. The corresponding peaks for the diester are m/z
287, 245, 227, and 185, all of which are intense in the mass spectrum. Peaks from the acetal ester
and (to a lesser extent) the diester are also present in mass spectra of the SOA formed and aged
in the absence of sulfuric acid seed particles (Figure 2.9A and Figure 2.9B), though they are less
intense due to the reduced decomposition of peroxides. In the mass spectra in Figure 2.9B and
Figure 2.9C it is likely that the CPHA and peroxyacetal, which are precursors to acetal ester and
diester formation, also contribute to the m/z 229 and 169 and peaks. The formation of the acetal
ester, diester, and diacetal products is consistent with the mechanism proposed by Griesbaum
and Neumeister (1982), but only the real-time EI-TDPBMS mass spectrum provides plausible
evidence for the formation of the diacetal that they propose. It is possible that peaks due to the
diacetal are absent in the CI-ITMS mass spectrum because of ion suppression by the esters,
which is a phenomenon we have observed in some analyses. The presence of the acid ester,
aldoacid, and aldoester products of CPHA decomposition (Figure 2.3) cannot be verified from
the mass spectra, since their dominant peaks in EI-TDPBMS and CI-ITMS analysis are likely to

32
be m/z 185 and or 169, which overlap with peaks assigned to fragmentation of other products
that are more definitively identified from characteristic high-mass peaks.
Figure 2.9. CI-ITMS mass spectra of filter extracts of SOA collected at different times from the
reaction of cyclodecene with O3 in the presence of 1-propanol in the absence or presence of seed
particles as follows: (A) immediately after formation in the absence of seed particles, (B) 4 h
after formation in the absence of seed particles, and (C) immediately after formation on dry
sulfuric acid seed particles. DOS seed particles were not used in these experiments because DOS
is the dominant signal in CI-ITMS at the concentrations used in chamber experiments.
33
The formation of the acetal ester, diester, and diacetal from decomposition of the
peroxyacetal is also supported by the results of SOA functional group analysis presented in Table
2.3. By comparing the functional group composition of SOA produced in the presence of CO
(which does not include products formed by the SCI pathway) to that produced in the presence of
1-propanol (which includes the same products as in the CO experiment plus AHPA formed by
the SCI pathway) and sulfuric acid seed aerosol (which leads to rapid peroxide decomposition),
one can infer the functionality of the products of peroxyacetal decomposition since they are
formed from AHPA. Complications can occur in the interpretation of functional group analyses
when significant amounts of peroxides decompose during an analysis, which is why we do not
present results for experiments where significant amounts of AHPA are still present. For the two
experiments presented in Table 2.3 that was not an issue since almost no peroxide was present in
either SOA. The greater yield of ester (0.20 compared to 0.10) and carbonyl (0.47 compared to
0.20) groups in the SOA formed in the presence of 1-propanol and sulfuric acid is indicative of
the formation of the acetal ester, diester, and diacetal, since during carbonyl analysis acetals are
hydrolyzed to form carbonyl (and hydroxyl) groups, and these carbonyl groups are then
derivatized and contribute to the measured carbonyl content. The higher SOA molar yield for
that experiment (0.36 compared to 0.19), which is close to the sum of the yields (0.31) for the
CO experiment (0.19) and AHPA (0.12), is also to be expected since AHPA is the sole product
of the SCI reaction with 1-propanol and is the precursor to the peroxyacetal. The observed lower
yield of carboxyl groups (0.14 compared to 0.18) is not as easily explained, but is possibly due to
particle-phase reactions of oxoacids and hydroxyacids in the aerosol. These compounds comprise
a significant fraction of SOA produced from cycloalkene ozonolysis (Gao et al. 2004), and could
have undergone acid-catalyzed cyclization to form more volatile hydroxylactones and cyclic

34
esters that evaporated from the aerosol and so lowered the yield of carboxyl groups. The
consistency of the functional group analysis results (which are obtained without use of high
temperatures) with the products of AHPA decomposition identified using EI-TDPBMS and CI-
ITMS give us confidence that the high temperatures used to vaporize SOA in those instruments
did not introduce significant artifacts in our results. It is also worth noting that the occurrence of
peroxide decomposition in the presence of either DOS or DOS/sulfuric acid seed particles
suggests that a strong acid is not necessary to catalyze this process. For example, from EI-
TDPBMS mass spectra (Figure 2.10) we identified sebacic acid as a major component of the
SOA produced by a non-SCI pathway, and it is possible that organic acids such as this are able to
catalyze CHPA and peroxyacetal decomposition. The larger decrease in the amount of peroxide
groups and larger increase in the amounts of carbonyl and ester groups and the peaks at m/z 89
and 131 in EI-TDPBMS mass spectra, in experiments when sulfuric acid seed was present,
indicate that sulfuric acid is more efficient than organic acids at catalyzing peroxide
decomposition.

35
Table 2.3. Molar yields of functional groups in SOA formed in the presence of CO without seed
particles or 1-propanol with sulfuric acid seed particles.
Molar yield
Functional groupa
CO no seed
1-Propanol sulfuric acid seed
Carbonyl 0.20 0.47
Carboxyl 0.18 0.14
Ester 0.10 0.20
Peroxide 0.06 0.03
SOAb 0.19 0.36
aCalculated from the measured moles of each functional group in SOA/moles of cyclodecene reacted.
bCalculated as (mass of SOA/molecular weight of SOA)/moles of cyclodecene reacted.
Figure 2.10. EI-TDPBMS spectrum of SOA produced from ozonolysis of cyclodecene in the
presence of a large excess of carbon monoxide (A). NIST reference spectrum of sebacic acid (B)
(Stein, 2016).

36
Particle Phase Alcohol and Water Exchange Reactions. Since the
decomposition products identified above are oligomers formed from reactions involving the most
abundant alcohol in the SOA (1-propanol), understanding the reactions between CPHA and
alcohols in SOA is central to understanding how HOMs will react with alcohols in atmospheric
aerosol. To explore this question, an environmental chamber experiment was conducted to probe
the exchange of alkoxy groups in SOA products due to competition with other alcohols or water.
After forming SOA from the reaction of cyclodecene with O3 in the presence of 1-propanol and
dry DOS/sulfuric acid seed particles, ~4000 ppm of methanol was added to the chamber, and
then ~6000 ppm of water (18% RH). As shown in Figure 2.11, upon addition of methanol peaks
at m/z 103 and 75 grew in relative to that at m/z 131 due to exchange of one and then two
propoxy groups for methoxy groups in the acetal ester and diacetal. High-mass peaks at m/z 243,
227, and 201 also grew in relative to those at m/z 271, 255, and 229 due to these exchange
reactions, but since fragmentation of the acetal ester and diacetal occur by loss of alcohols,
alkenes, and alkoxy radicals, changes in high-mass peaks did not provide information beyond the
exchange of one methoxy and propoxy group. When water was then added, peaks at m/z 131,
103, 89, and 75 all decreased significantly, due to exchange of methoxy and propoxy for
hydroxyl groups. Although the relative intensities of some of the high-mass peaks also changed,
no significant new peaks grew in. This is probably due to dissociation of the hemiacetal and
gemdiol products to aldehydes, alcohols, and water that then evaporated from the particles
because of their high volatility.

37
Figure 2.11. Real-time EI-TDPBMS mass spectra of (A) SOA formed from the reaction of
cyclodecene with O3 in the presence of 1-propanol and dry DOS/sulfuric acid seed particles, and
with the subsequent addition of (B) methanol, and then (C) water.

38
2.4. Conclusions
The results of this study provide new information on the potential influence of particle-
phase chemistry on the atmospheric fate of hydroperoxycarbonyl compounds that can be formed
under low-NO conditions, including HOMs that are formed through autoxidation reactions.
Experiments conducted in an environmental chamber and in solution using a model -alkoxy
hydroperoxyaldehyde formed from the ozonolysis of cyclodecene in the presence of 1-propanol
indicate that these compounds rapidly cyclize in particles to cyclic peroxyhemiacetals, reaching
an ~3:1 equilibrium mixture of the cyclic and acyclic forms in ~3 min. Based on results of SOA
mass spectral and functional group analysis we propose that a number of different reaction
pathways then lead to cleavage of the O–O peroxide bond and formation of a variety of
decomposition products. In particular, it appears that the -alkoxy hydroperoxyaldehyde
decomposes through a bimolecular Baeyer-Villager self-reaction and that the cyclic
peroxyhemiacetal either decomposes by a unimolecular reaction or first reacts with alcohol (in
this case 1-propanol) to form a peroxyacetal that then undergoes unimolecular decomposition. In
SOA formed in the absence of sulfuric acid or in particles apparently containing separate SOA
and aqueous ammonium sulfate/sulfuric acid phases decomposition occurred on a timescale of
~4 h, similar to other reported studies, whereas in dry SOA containing sulfuric acid the timescale
was at most ~10 min. These timescales are all significantly shorter than the 6-day peroxide
photolysis lifetime measured for SOA produced from -pinene ozonolysis (Epstein, Blair, and
Nizkorodov 2014), indicating that non-photolytic decomposition reactions of the type observed
here are the dominant loss processes for hydroperoxycarbonyls in SOA. The fate of these
compounds in the atmosphere should thus depend on the composition of the SOA, particle
acidity, and relative humidity.

39
It is important to note here that because of differences in gas-phase reaction mechanisms
hydroperoxycarbonyls formed in the atmosphere would most likely contain an alkyl group
instead of the alkoxy group that is present in the model -alkoxy hydroperoxyaldehyde, cyclic
peroxyhemiacetal, and their decomposition products. Despite this difference, the consistency of
our results with prior studies of rates (Mertes et al. 2012; Krapf et al. 2016) and products of
decomposition of peroxyhemiacetals (Durham, Wurster, and Mosher 1958) leads us to believe
that the decomposition pathways of a hydroperoxycarbonyl with an alkoxy substituent are
similar to those of a hydroperoxycarbonyl with an alkyl substituent. The alkoxy
hydroperoxyacid, alkoxy hydroxycarbonyl, alkoxy cyclic hemiacetal, acid ester, aldoacid, and
aldoester decomposition products (Figure 2.3) would then become a hydroperoxyacid,
hydroxycarbonyl, cyclic hemiacetal, ketoacid, and dicarbonyl (Figure 2.12). And for the
peroxyacetal and its decomposition products one of the alkoxy groups would be replaced by an
alkyl group, so that the diester, acetal ester, and diacetal would then become a ketoester,
ketoacetal, hydroxyester, and hydroxyacetal (Figure 2.12). Furthermore, in the atmosphere the
alkoxy groups in all these compounds would have been added by reactions with the large variety
of low volatility multifunctional compounds containing hydroxyl groups (instead of 1-propanol)
that are present in SOA, leading to the formation of much larger oligomeric compounds. These
compounds would in turn be amenable to acid-catalyzed exchange reactions with other alcohols
or water.
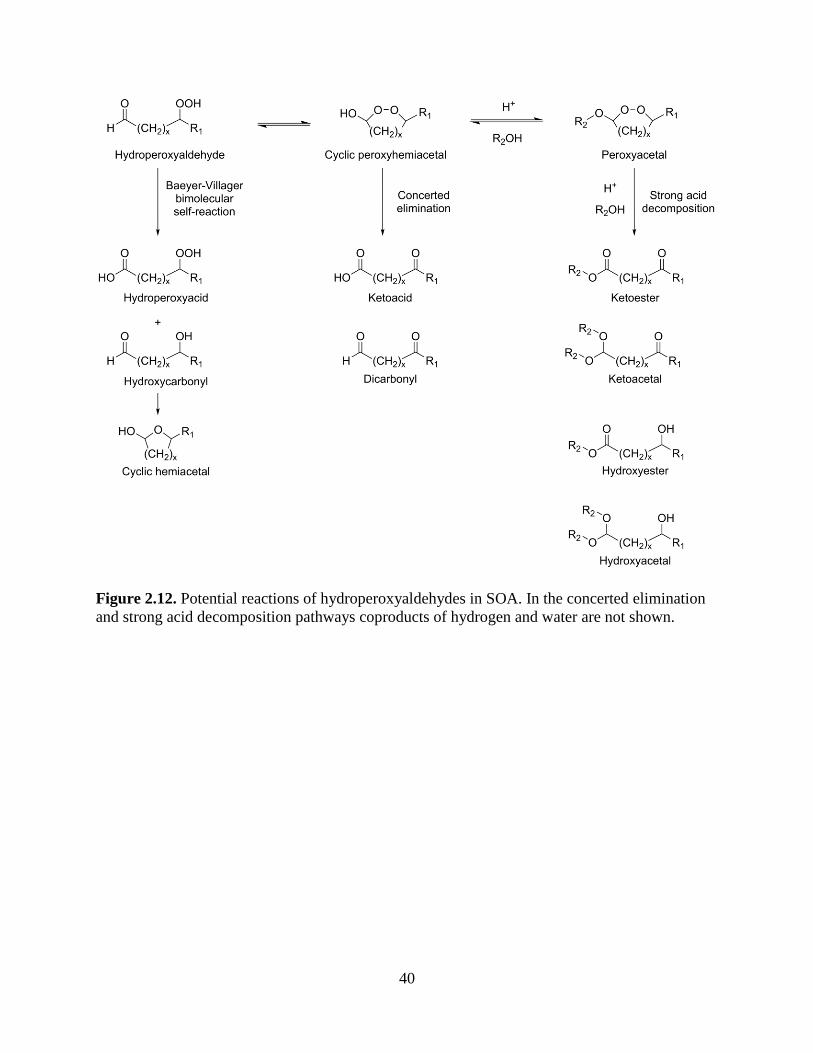
40
Figure 2.12. Potential reactions of hydroperoxyaldehydes in SOA. In the concerted elimination
and strong acid decomposition pathways coproducts of hydrogen and water are not shown.

41
Chapter 3
Time-Resolved Measurements of Indoor Chemical Emission Rates,
Deposition Velocities, and Reactions in a University Art Museum
3.1. Introduction
Online measurements of trace gases in the indoor environment have allowed for new
insights into how pollutants are emitted, transported, and transformed through chemical reactions
indoors. Measurements of volatile organic compounds (VOCs) in university classrooms using
proton transfer reaction mass spectrometry (PTRMS) have allowed for quantitative source
attribution of VOC emissions from occupants, ventilation, and surfaces (Liu et al. 2016), and
determination of emission rates by occupants for a wide variety of VOCs (Tang et al. 2016). Use
of high-resolution, time-of-flight chemical ionization mass spectrometers (CIMS) have allowed
for novel source attributions of oxygenated semivolatile compounds (SVOCs) (Liu et al. 2017)
and chlorinated emissions following application of cleaning products containing bleach (Wong et
al. 2017). These studies have consistently documented a significant contribution of humans to
indoor VOC concentrations, with human influence even being detectable in an open-air soccer
stadium (Veres et al. 2013).
Even with these advances, significant questions remain surrounding the variability of
emission profiles across different indoor environments as occupancy rates, construction
materials, and activities undergone in the space being studied change. Additionally, broader
changes in emissions (McDonald et al. 2018) are indicating that in some cities volatile chemical
products (VCPs) are emerging as the dominant source of anthropogenic VOCs outdoors. These

42
emissions include personal care products, cleaning supplies, paints, and other compounds that
are initially emitted indoors, and so characterizing the indoor emissions of these compounds is
necessary to improve understanding of both indoor and outdoor air quality.
Many of the VCPs emitted indoors are SVOCs, and the fate of these compounds
following their emission is not well understood. SVOCs undergo partitioning to indoor surfaces,
partitioning to indoor particulate matter (Bennett and Furtaw, 2004; Weschler and Nazaroff,
2017), reactions with indoor oxidants such as O3 and OH radicals (Weschler and Carslaw, 2018),
and transport to the outdoor environment through heating, ventilation and cooling (HVAC)
systems as well as through open windows and doors. Partitioning to indoor surfaces is an aspect
of SVOC fate that is being actively researched. Models of impermeable indoor surfaces describe
the formation of organic films on top of those surfaces by SVOCs with octanol-air partitioning
coefficients below 1010 (Weschler and Nazaroff, 2017). The contribution of permeable indoor
surfaces such as paints and plastics to indoor SVOC partitioning has received less attention, and
these surfaces have the potential to be a significant indoor SVOC sink (Won et al. 2001).
Additionally, water-soluble organic compounds are expected to be absorbed into films of surface
water indoors (Duncan et al. 2017).
Recent research has also focused on the mechanisms by which indoor VOCs are
oxidized. Indoor O3 chemistry has received considerable attention, and recent measurements of
indoor photolysis have indicated that OH radicals can also play a role in indoor VOC oxidation
(Weschler and Carslaw, 2018). After the initiation of VOC oxidation by one of the oxidants
mentioned above, most reactions proceed through the formation of an alkyl peroxy radical (RO2•)
intermediate (Orlando and Tyndall, 2012). A key factor in determining the products of VOC
oxidation is the fate of these RO2• radicals, specifically whether they react with another RO2
•
43
radical, a molecule of NO, an HO2 radical, or through an intramolecular autoxidation reaction
(Ziemann and Atkinson, 2012; Crounse et al. 2013). The products produced by each of these
reaction pathways are chemically different, and these differences can impact the amount of
secondary organic aerosol (SOA) formed from VOC oxidation. In polluted environments where
NO concentrations are high, RO2• radicals react primarily with NO, forming an alkoxy radical
(RO•) and NO2, a key step in the photochemical production of O3. As NO emissions have
declined, however, the rate of RO2• reaction with NO has declined and the relative contribution
of autoxidation reactions has increased (Praske et al. 2018). In autoxidation reactions, RO2•
radicals react intramolecularly to abstract a hydrogen, producing a hydroperoxy group and a new
RO2• radical at the site from which the hydrogen was abstracted. These reactions form highly
oxidized multifunctional compounds (HOMs) that are particularly efficient in forming SOA,
with HOMs comprising the majority of SOA produced in pristine environments (Ehn et al.
2014). With the reactions of RO2• radicals being a key determinant of SOA and O3 production,
understanding the indoor fate of RO2• radicals is central to understanding the transformation of
pollutants indoors.
In this study we present results from six weeks of indoor measurements at a university art
museum. We present emission rates from occupants consistent with the studies described above,
emission rates of VCPs emitted from painting and other occupant activities, the volatility
dependence of SVOC deposition to indoor surfaces, and what we believe are the first
measurements of indoor HOMs produced through autoxidation. This work provides the most
comprehensive picture to date of how indoor pollutants are emitted, transported, deposited, and
chemically transformed in a single indoor setting, and these results will be particularly useful for
improving models describing the chemistry of the indoor environment.

44
3.2. Materials and Methods
Art Museum Site. The art museum study of indoor chemistry (ARTISTIC)
campaign was conducted from April 13th to May 23rd at the University of Colorado Art Museum
(40.0072 deg. lat. -105.2701 deg. lon. 1,650 m above mean sea level). The museum has a volume
of 6,000 m3 and is ventilated at a constant volume flow rate of 48,000 m3 hr-1, with 4,800 m3 hr-1
being outside air. The temperature and relative humidity (RH) of the museum are tightly
controlled at constant values of 21˚C and 45%, respectively. From April 13th to May 9th we
sampled from one of the museum’s galleries (“the gallery”, 780 m3, constant ventilation at 7,800
m3 hr-1) that was exhibiting art by the university’s students, and from May 9th to May 23rd
measurements were conducted from the museum’s collections room (1,400 m3, constant
ventilation at 8,200 m3 hr -1), where the university’s permanent collections are stored.
Measurements and Instrumentation. VOCs were measured using a quadrupole
proton transfer reaction mass spectrometer (PTR-MS) (de Gouw and Warneke, 2007), and more
oxygenated organic compounds were measured using a high-resolution time-of-flight chemical
ionization mass spectrometer that was operated using iodide (I-CIMS) or nitrate (NO3-CIMS) as
reagent ions (Bertram et al. 2011, Jokinen et al. 2012). Carbon dioxide, carbon monoxide,
methane, and water were measured using a Picarro G2401 cavity ringdown spectrometer. Ozone,
nitrogen oxides (NOx) and sulfur dioxide (SO2) were measured with a Thermo 49i O3 analyser,
Thermo 42i-TL NOx analyser, and a Thermo 43i-TLE SO2 analyser, respectively. Aerosol size
distributions and mass concentration were measured with a TSI scanning mobility particle sizer
(SMPS). Relative humidity and temperature were measured with a Vaisala RH probe. Zero air
was generated on-site using a Thermo 1160 zero air generator. Photolysis rates were measured
using an Ocean Optics USB 2000+ spectrometer, with calibration details presented below. Trace

45
gases were sampled through 0.47 cm inner diameter (ID) FEP Teflon tubing, and aerosols were
sampled through 0.47 cm ID copper tubing. The NO3-CIMS sampled through a 1.5 cm ID
stainless steel tube 0.7 m in length.
In the gallery and collections rooms the instruments sampled air from inside each room
and from the supply air from the HVAC system. The supply air was sampled after all
conditioning had occurred, with the supply air sampling lines located immediately (< 30 cm)
upstream of the diffusers where the supply air enters either room. The instruments sampled using
an automated valve system that alternated sampling between room air and supply air every 5
min, with makeup flows applied so that air was being pulled through both sampling lines at all
times. The valve timing was chosen to balance the ability to sample both air masses as frequently
as possible after considering the delays in response times of the instruments and sampling lines
to semivolatile organic compounds (SVOCs) (Pagonis et al. 2017). Because analytes detected by
the NO3-CIMS tend to show irreversible losses to the walls of the inlet tubing, and sampling
from the supply air registers would have required prohibitively long sampling lines, the NO3-
CIMS only sampled air in the gallery or the collections room.
The proton transfer reaction mass spectrometer (PTRMS) was calibrated using a standard
cylinder containing approximately 1 ppb each of methanol, acetonitrile, acetaldehyde, acetone,
isoprene, 2-butanone, benzene, toluene, o-xylene, and 1,2,4-trimethylbenzene. Six-point
calibration curves were generated by diluting the calibration gas with air that had VOCs
scrubbed by a heated platinum catalyst. A generic calibration factor for other VOCs was derived
by averaging the calibration factors of all calibrants besides methanol, which is excluded because
its quantification at m/z 33 is impacted by the large O2+ signal at m/z 32. The Thermo 43i-TLE
SO2 analyser, Thermo 42i-TL NOx analyser, and Picarro G2401 cavity ringdown spectrometer

46
were calibrated by generating five-point calibration curves in the field every week. Standard
cylinders of SO2, NO, CO and CO2 were purchased from Scott-Marrin, Inc. and had
concentrations of 1.01 ppm, 5.2 ppm, 9.72 ppm, and 39,800 ppm respectively. Standard
cylinders were diluted with zero air (Ultra Zero grade, Airgas). The Thermo 49i O3 analyser was
calibrated against the Thermo 42i-TL NOx analyser in lab by reacting O3 + NO → NO2 in a 23
m3 Teflon environmental chamber. Photolysis rates were measured by collecting ambient light
using a flat circular quartz diffuser plate (5 mm diameter), coupled to a commercial spectrometer
(Ocean Optics USB 2000+) via a 10-meter UV-grade fiber. Absolute spectral actinic fluxes were
calibrated using NIST-calibrated light sources. Details of the calibration setup can be found Stark
et al., 2007. Photolysis rates were calculated from the spectral actinic flux using reference
absorption spectra and quantum yields (Sander et al., 2003). Compounds detected by the NO3-
CIMS were quantified by assuming that analytes cluster with nitrate anions at the collisional
limit (Ehn et al. 2014; Krechmer et al. 2015) and that 35% of HOMs are lost irreversibly to the
walls of the inlet.
Art Museum Model. A simple box model was used to quantify emissions,
deposition, and reaction rates of chemicals inside the museum, as depicted in Figure 3.1. In the
model the museum is represented by two compartments: the gallery and the supply air + rest of
the museum. For consistency with the discussion of measurements we refer to the two
compartments as the gallery and the supply air, since these correspond to the two air sampling
locations. The measured supply air concentration was used to represent the rest of the museum
because the supply air is 74% recirculated air from the rest of the museum, 16% recirculated
gallery air, and 10% outside air. Exchange between (a) the gallery and the supply air and (b) the
supply air and outside air were determined from the ventilation rates given above, both

47
compartments assumed to be well mixed. The model was numerically integrated using the Euler
method at a time step of 0.36 s. Shortening the time step did not affect the model outputs.
Figure 3.1. Schematic of the box model used to describe the transport, emission, deposition, and
reaction of compounds in the University of Colorado Art Museum. The air exchange rate of the
gallery is 10 hr-1 and the indoor-outdoor air exchange rate is 0.8 hr-1. The museum is represented
by two compartments, the gallery and the supply air + rest of the building, corresponding to the
two sampling locations of this study. Air in each compartment is assumed to be perfectly mixed.
Emissions of VOCs inside the gallery were quantified using Equation 3.1 (Tang et al.
2015),
𝐸(𝑡)𝑔 = 𝑉𝑔 [𝐴𝐸𝑅𝑔 ([𝐴]𝑔 − [𝐴]𝑠) + 𝑑[𝐴]𝑔
𝑑𝑡] (3.1)
where E(t)g is the mass emission rate at time t, Vg is the gallery volume, AERg is the gallery’s air
exchange rate, and [A]g and [A]s are the VOC concentrations in the gallery and supply air.
Emissions occurring inside the museum but outside the gallery were quantified similarly using
Equation 3.2,
𝐸(𝑡)𝑚 = 𝑉𝑚 [𝐴𝐸𝑅𝑚 ([𝐴]𝑠 − [𝐴]𝑜) + 𝑑[𝐴]𝑠
𝑑𝑡] − 𝐸(𝑡)𝑔 (3.2)

48
where E(t)m is the mass emission rate, Vm is the volume, and AERm is the outside air exchange
rate, all for the rest of the museum, and [A]o is the VOC concentration in outdoor air. Outdoor air
concentrations during the integrated period were assumed to remain constant at the levels
measured in the supply air immediately before the start of an emission event (Veres et al. 2013).
Deposition rates of VOCs to museum surfaces following emission in the gallery were
calculated as first-order removal rates using Equation 3.3,
𝑘𝑑𝑒𝑝 = −𝐸(𝑡)𝑚
[𝐴]𝑔 (3.3)
where kdep is the first-order removal rate constant. When a VOC that is emitted inside the gallery
deposits to surfaces in the museum before it recirculates through the supply air, the measured
increase in the supply air concentration d[A]s/dt in Equation 3.2 is smaller than the expected
increase based on the gallery emission rate E(t)g in Equation 3.2. Accordingly, VOC deposition
leads to a negative value of E(t)m by Equation 3.2, and the minus sign in Equation 3.3 then gives
a positive value for kdep.
The model was also configured to account for reactions of O3, NO, NO2, and VOCs
inside the gallery. Because of variability in outdoor chemistry, we do not assume outdoor
concentrations for these species but instead constrain the model using their measured supply air
concentrations. The chemical reactions that were included in the model and the accompanying
rate constants are presented in Table 3.1. Rate constants for VOC reactions are those of limonene
(Ziemann and Atkinson, 2012), and all other rate constants were taken from the 2015 Jet
Propulsion Lab Evaluation (Burkholder et al. 2015). Reaction of O3 with the surfaces inside the
gallery was modelled using a constant deposition velocity, and reaction of O3 with people was
modeled as a constant deposition velocity that scales with the number of people inside the room,
with occupancy calculated as described above. These O3 deposition velocities were varied to find

49
the values that gave a minimum chi-squared error when model predictions of gallery O3, NO,
and NO2 concentrations were evaluated against their respective measured concentrations in the
gallery. Measurements of photon fluxes inside the gallery gave upper limits of photolysis rates of
NO2 and NO3 of 4.6 × 10⁻⁷ and 1.2 × 10⁻⁴ s-1, respectively. These photolysis reactions were
included in the model but were too slow to affect model outputs.
Table 3.1. Chemical reactions included in the box model of the museum. Rate constants for
VOC reactions are those of limonene (Ziemann and Atkinson, 2012). All other rate constants
were taken from the 2015 Jet Propulsion Lab Evaluation (Burkholder et al. 2015). Ozone
deposition velocities vd were fitted to minimize the error in model estimates of gallery ozone
concentration.
Reaction Rate constant
(cm3 molec-1 sec-1)
NO + O3 → NO3 + O2 2.0 × 10⁻¹⁴
NO2 + O3 → NO3 + O3 3.2 × 10⁻¹⁷
NO3 + NO → 2 NO2 2.6 × 10⁻¹¹
NO3 + NO2 → N2O5 1.3 × 10⁻¹³
N2O5 → NO3 + NO2 3.5 × 10⁻³ sec-1
OH + NO2 → HNO3 1.1 × 10⁻¹¹
Limonene + O3 → Products 2.0 × 10⁻¹⁶
Limonene + OH → Products 1.6 × 10⁻¹⁰
Limonene + NO3 → Products 1.2 × 10⁻¹¹
O3 + surfaces → Products vd = 0.021 cm s-1
O3 + people → Products vd = 0.38 cm s-1 person-1

50
From the model outputs of O3 and NOx concentrations we also estimated the net
production rate of NO3 and OH radicals inside the gallery. We estimated NO3 radical production
from the reactions presented in Table 3.1. Since NO3 radical photolysis is very slow inside the
gallery, it is not significant and the dominant loss pathways for NO3 radicals were reaction with
NO, NO2, and VOCs. Typical sources of indoor OH radicals are photolysis of precursors like
HONO (Gligorovski, 2016) and ozonolysis of alkenes (Waring and Wells, 2015). We assumed
an OH radical yield of 0.5 from alkene ozonolysis (Ziemann and Atkinson, 2012), and that the
only loss processes are reactions with VOCs and NO2. Measured photon fluxes in the gallery
gave an upper limit for the HONO photolysis rate (jHONO) of 6 × 10⁻⁸ s-1, and assuming
conditions that would maximize OH radical production from HONO photolysis and minimize
OH radical production from ozonolysis (10 ppb HONO, 1 ppb alkenes) we calculate that
photochemistry accounts for <5% of the OH radical production in the museum.
3.3. Results and Discussion
VOC Emission Rates. VOC emission rates quantified for the gallery during
different periods and activities using measurements and the model are presented in Table 3.2 and
Table 3.3.

51
Table 3.2. Emission factors and peak concentrations for volatile chemical products emissions
following application of paint to 12 m2 of wall in the University of Colorado Art Museum.
Ion m/z Assigned compound Paint emission factor
(mg m-2) Peak concentration
(ppb)
43 Carboxylic acids 160 22
45 Ethylene glycol 480 46
47 Formic acid 33 15
57 Alkanes >75 43
59 Acetone 150 42
61 Acetic acid 190 14
71 Methyl vinyl ketone or
methacrolein 2.7 1.2
73 Acrylic acid 7.1 1.1
75 Propanoic acid 8.1 2.8
87 Methacrylic acid 3.2 0.8
91 Unknown 0.8 0.4
93 Toluene 1.9 1.5
107 C8 aromatics 4.3 1.8
121 C9 aromatics 2.7 1.0
135 C10 aromatics 0.5 0.2

52
Table 3.3. Mass and peak concentrations for VOCs emitted inside the University of Colorado
Art Museum during the ARTISTIC campaign.
Ion m/z Assigned compound
Emission date and time
Mass emitted (mg)
Peak concentration
(ppb)
33 Methanol 4/20, 19:30 4,500 1,020
43 Carboxylic acids 4/20, 8:00 65 13
43 Carboxylic acids 5/19, 10:15 150 17
47 Ethanol 4/20, 19:30 1,200 270
47 Ethanol 5/19, 10:15 2,000 210
57 Alkanes 4/24, 8:45 120 25
57 Alkanes 5/22, 10:00 790 27
59 Acetone 5/6, 7:00 180 13
59 Acetone 5/22, 10:00 640 21
91 Unknown 4/26,17:00 610 0.6
91 Unknown 5/6, 7:00 6.3 0.4
93 Toluene 4/21, 12:45 17 1.5
93 Toluene 4/27, 9:30 12 0.9
93 Toluene 4/28, 12:15 9.4 0.8
93 Toluene 5/2, 7:15 22 1.2
93 Toluene 5/6, 7:00 620 18
93 Toluene 5/15, 13:30 212 5.0
95 Phenol 4/26, 17:00 610 0.6
107 C8 aromatic 4/30, 13:15 26 1.1
135 C10 aromatic 4/24, 10:45 20 0.2
137 Monoterpenes 4/20, 12:30 27 0.7
137 Monoterpenes 5/3, 14:15 39 1.3

53
On April 21st, museum staff re-painted a wall inside the gallery to prepare for an
upcoming exhibit. A single coat of primer and a single coat of white paint were applied to 12 m2
of wall, directly on top of the existing paint. For compounds where unambiguous identification
was not possible using the quadrupole PTRMS (e.g., distinguishing propanol from acetic acid,
which are both detected at m/z 47), paint samples were collected and analysed in the laboratory
using a high-resolution time-of-flight VOCUS PTR-MS (Krechmer et al. 2018) to determine
which compound was emitted. The compounds emitted in the painting event are consistent with
several of the major classes of VCPs described by McDonald et al. (2018), including alkanes,
glycol ethers, and acetone. As is discussed below, deposition of these compounds to building
surfaces prior to being ventilated to outdoor air is a significant fate for VCPs emitted indoors and
is a key parameter for bridging VCP emission measurements like those presented here with
outdoor measurements.
On April 28th an exhibit opening was held for the thesis exhibition of the university’s
Bachelor of Fine Arts (BFA) program from 5:00 to 7:00 PM local time. The CO2 mass emission
rates in the museum (gallery and the rest of the building) during the opening were calculated
using Equations 3.1 and 3.2, the measured time series of CO2 in the gallery and supply air shown
in Figure 3.2a, an assumed CO2 concentration in outdoor air of 400 ppb, and the building
parameters given above. Assuming an emission rate of 21 g CO2 person-1 hr-1 (Tang et al. 2016),
we then estimated that the average occupancies of the gallery and the rest of the building during
the opening were 108 and 68 people, respectively. Museum staff counted 300 attendees at the
opening, indicating that the average attendee spent 70 min (120 min × 176/300) inside the
museum.

54
Figure 3.2. Time series of carbon dioxide (A) and lactic acid (B) concentration measured by
Picarro and iodide-CIMS, respectively, during an exhibit opening at the University of Colorado
Art Museum. After the conclusion of the opening at 7:00 PM carbon dioxide is removed from
the museum at the rate of indoor-outdoor air exchange, while lactic acid is lost at a faster rate
due to deposition to surfaces.
VOC emission rates were calculated for the gallery during the opening using Equation
3.1, the measured time series of VOCs in the gallery and supply air, and the building parameters
given above. These values were more accurate than those that would be calculated for the whole

55
museum using Equation 3.2, because all the quantities in Equation 3.1 were known whereas the
concentrations of VOCs in outdoor air that would be needed in Equation 3.2 must be assumed.
Those gallery emission rates that correlated with CO2 were then used to calculate average per-
person VOC emission rates during the entire opening. The results are shown in Figure 3.3, where
they are compared to human emission factors measured by Tang et al. (2016) in a classroom.
Most values agree within a factor of two, except for monoterpenes (m/z 81 and 137), ethanol (m/z
47), and products of reactions of O3 with skin oil, such as 6-methyl-5-hepten-2-one (6-MHO, m/z
127 and 109) and 4-oxopentanal (4-OPA, m/z 101). The elevated ethanol emission rate during
the exhibit opening compared to the classroom is likely due to alcohol consumption by attendees
prior to the opening since no alcohol was served at the opening. The ethanol emissions are
consistent with 16% of gallery occupants (18 people) having a blood alcohol content of 0.03,
which is roughly equivalent to having consumed one standard drink in the hour prior to the
opening (Kypri et al. 2005, Wright et al. 1975). Measured emissions of acetaldehyde (m/z 45)
were also higher than prior studies, likely because breath acetaldehyde concentrations are also
elevated following alcohol consumption (Wong et al. 1992). Lower observed emission rates of
monoterpenes were likely due to reduced emissions from personal care products – either because
these products wore off over the course of the day (Coggon et al. 2018) or because less product
was used. The lower emission rates of skin oil-O3 reaction products measured in this study
compared to Tang et al. (2016) were likely due to the lower O3 concentrations inside the
museum. The average O3 concentration in the gallery during the opening was 4.5 ppb, while the
O3 concentration in the Tang et al. study ranged from 10-25 ppb (personal communication).
Additional emission events monitored in the museum are presented in Table 3.3.

56
Figure 3.3. Correlation of human emission factors for this study and Tang et al. 2016. Data
points are plotted as the mass-to-charge ratio measured by the quadrupole PTR-MS. Emission
factors between the two studies generally agree within a factor of two. Elevated ethanol
emissions (m/z 47) observed in this study are likely due to alcohol consumption and decreased
monoterpene emissions (m/z 137) are likely due to lower emissions from personal care products.
Additionally, lower O3 concentrations during this study led to lower secondary emissions of O3
with squalene on occupants’ skin.
VOC Deposition Rates. Following emission of a compound at some point inside
the museum, the compound is distributed throughout the museum via the building’s HVAC
system. As this happens one expects the concentration of the compound to rise in the supply air.
For many of the emissions measured, however, the increase in supply air concentration was
significantly lower than that predicted by the model and the measured gallery emission rate,
museum volume, and air exchange rates. For example, the difference in recirculation behaviour
of CO2 and lactic acid can clearly be seen in Figure 3.2. Although lactic acid and CO2 were co-

57
emitted by museum occupants during the opening, the relative increase in lactic acid
concentration in the supply air was significantly less than that of CO2. This result suggests a loss
process for lactic acid that occurs between when it is emitted in the gallery and when it re-enters
the gallery via the supply air. The first-order removal rates of VOCs in the gallery were
calculated using Equation 3.3, the calculated VOC emission rates in the museum, and the
concentrations of VOCs in the gallery. The results are shown in Figure 3.4. The values correlate
inversely with the saturation vapor concentration (C*) estimated using SIMPOL.1 (Pankow and
Asher, 2008) and proportionally with Henry’s law coefficients (H) estimated using GROMHE
(Raventos-Duran et al. 2010), suggesting that removal occurs by deposition to surfaces in the
museum and the HVAC system. For compounds with C* below 108 g m-3 deposition to
surfaces should be a significant sink. As is discussed below, the rates of gas-phase reactions of
VOCs in the museum are too slow to account for the loss rates observed here.

58
Figure 3.4. Deposition rates of organic compounds measured in the University of Colorado Art
Museum as a function of volatility (C*) and Henry’s law coefficient (H) calculated using
SIMPOL (Pankow and Asher, 2008) and GROMHE (Raventos-Duran et al. 2010), respectively.
Deposition rate increases with decreasing volatility and with increasing Henry’s law coefficient.
The dashed lines represent the bounds of measurable removal rates from the museum supply air
given the sampling configuration used.

59
Models have been developed previously that relate gas-surface partitioning indoors to
compound volatility and Henry’s Law coefficient (Bennett and Furtaw Jr., 2004), and key
parameters that must typically be assumed are the amount of organic material and water sorbed
to surfaces, which determines the volatility and Henry’s Law coefficient at which a gas-phase
compound will sorb to a surface. In Figure 3.4 we have plotted the deposition rate of VOCs in
the museum as a function of both volatility (C*) and Henry’s law coefficient (H), but are unable
to determine the relative contributions of sorption to surface water and to organic films. This is
because compound saturation vapor concentrations and Henry’s Law coefficients tend to show
an inverse relationship (i.e., low-volatility compounds have high Henry’s Law coefficients), and
since the museum relative humidity is held constant we could not systematically explore the role
of surface water in gas-surface partitioning. Replicating this analysis in an environment where
relative humidity can vary would allow one to uncouple the two effects and determine if indoor
VOC-surface partitioning is better modeled as partitioning to aqueous or organic surface films.
Ozone Loss Rates. We used measurements of O3, NOx, and CO2 in the gallery and
the supply air to quantify the total loss rate of O3 in the gallery and the relative loss rates to
gallery surfaces, people, and reactions with NO and NO2. Typical depletion of O3 observed in the
gallery relative to the supply air was 1 ppb. To simulate this, the model depicted in Figure 3.1
was run with the reactions given in Table 3.1 included and with the supply air concentration of
O3, NO, and NO2 constrained to the measured concentration for each compound. Ozone
deposition velocities were then fitted to give the best agreement between the measured and
modeled gallery concentrations of O3, NO, and NO2. The estimated per-person deposition
velocity calculated for the gallery of 0.38 cm s-1 person-1 is consistent with the range of 0.40-0.62
cm s-1 reported in past studies carried out in well-controlled test rooms (Fadeyi et al. 2013;

60
Wisthaler and Weschler 2010) and in classrooms (Fischer et al. 2013). The O3 deposition
velocity to surfaces of 0.021 cm s-1 is also consistent with prior measurements of indoor
environments (Reiss et al. 2004). The agreement of these results gives us confidence both in our
model and in the generalizability of the test room results.
The modeled loss rates of O3 to reaction with surfaces, occupants, and NOx during two
days of the ARTISTIC campaign are presented in Figure 3.5. Averaged over the three weeks of
gallery measurements surfaces accounted for 62% of the O3 loss, NO for 31%, occupants for 5%,
and NO2 for 2%. Especially notable in Figure 3.5 is the temporal variability of the contributions
of NO to O3 loss. Depending on the NO concentration and gallery occupancy the O3 removal rate
inside the gallery varied by a factor of four. The NO concentrations in the museum supply air for
the period presented in Figure 3.5 varied between 0 to 4 ppb, with the rapid variations in
concentration indicating a nearby source that was likely traffic emissions from surrounding
streets or possibly emissions from pottery kilns located in an adjacent building. These rapid
variations in NO concentration drastically affected the O3 loss rate, reducing the amount of O3
reacting with other sinks when NO concentrations were high. The opening for the BFA exhibit
took place on April 28th, and the high occupancy inside the gallery led to people being the
dominant sink for O3 in the gallery. Conversely, on Saturday April 29th museum occupancy and
NO concentrations were both low (Figure 3.5), which was typical of weekend days in our study,
and under those conditions surfaces were the dominant O3 sink. These results show that the
reactive loss of O3 indoors is highly variable in time, and an accurate accounting of the fate of O3
in a particular indoor environment must account for the variability in occupancy and NOx in the
space being studied. This behaviour also has significant implications for production of indoor
NO3 and OH radicals, as discussed below.

61
Figure 3.5. O3 loss rate in the University of Colorado Art Museum gallery apportioned between
reactions with gallery surfaces, occupants, NO, and NO2. The art exhibit opening can be clearly
seen as the dramatic increase in the loss rate to occupants at 5:00 PM on April 28th.
VOC Oxidation and Autoxidation. To evaluate the relative contributions of
reactions with O3, OH radicals, and NO3 radicals to VOC chemistry inside the gallery we used
our O3 concentration measurements along with model estimates of OH and NO3 radical
concentrations. Because the primary source of OH radicals inside the museum is alkene
ozonolysis (due to low photolysis rates), a surrogate alkene was incorporated into the model to
react with O3 and generate OH radicals. The surrogate alkene has a concentration of 5 ppb (twice
the average measured alkene concentration in the museum) and reacts with ozone at the rate
constant of limonene (2.1 × 10⁻¹⁶ cm3 molec-1 s-1) (Atkinson and Arey, 2003). These conditions
were chosen to maximize estimates of OH radical production, giving upper limits for the OH
radical concentration and oxidation rates presented below. The maximum concentrations of O3,

62
OH radicals and NO3 radicals in the museum were 2.4 × 10¹¹ molecules cm-3 (12 ppb), 1.2 × 10⁵
molecules cm-3 (0.0059 ppt) and 2.0 × 10⁶ molecules cm-3 (0.098 ppt). From these concentrations
and the known rate constants for reactions of limonene with each oxidant (Table 3.1), we
estimated the lifetime of the surrogate alkene with respect to reaction with O3, OH radicals and
NO3 radicals in the museum to be 5.5 h, 15 h, and 12 h. Since saturated compounds react almost
exclusively with OH radicals and the rate constant for reaction of OH radicals with most of these
compounds is smaller than that for limonene (Atkinson and Arey, 2003), the lifetimes for most
saturated VOCs with respect to oxidation will be greater than 15 hr. These upper-limit values
indicate that VOC removal by ventilation (1.25 h timescale) and deposition ( >1 h timescale for
compounds with C* below 108 μg m-3) dominates over oxidation, especially for saturated VOCs
because of their slow reactions with O3 and NO3.
We evaluated the model predictions regarding the chemistry of the surrogate alkene using
an experiment in which a navel orange was peeled and eaten inside the museum in order to
release monoterpenes, all of which were detected by the PTR-MS at m/z 81 and 137. Since
measurements by Arey et al. (1991) indicated that >90% of the monoterpene emissions from a
navel orange were limonene, for this discussion we assumed that those emitted in the museum
consisted entirely of this compound. The increase in concentration of limonene above the
background due to the orange emissions was ~1 ppb, corresponding to a total mass of emitted
limonene of 77 mg. As can be seen in Figure 3.6A, the timescale for limonene removal following
emission was 0.87 h, which is faster than the expected loss rate due to the exchange of indoor
and outdoor air by the museum’s HVAC system (1.25 h). The model prediction for the
timescales for limonene removal by reactions with O3, OH radicals and NO3 radicals are 8.3 h,
17 h, and 7.7 h, giving a combined removal timescale of 3.25 h. The saturation vapor

63
concentration of limonene is 2 × 10⁷ μg m-3, and using Figure 3.4 we estimate that the deposition
timescale of limonene is between 1.1 h and 6.6 h, and for the following calculations we use 2 h,
the timescale calculated from the average of the two rate constants. When oxidation happens in
parallel with removal by ventilation and deposition to indoor surfaces, the predicted timescale for
removal of limonene from the museum is 0.62 h. As shown in Figure 3.6A, this value is in
reasonable agreement with the measured timescale of 0.87 h. Under these conditions, 19% of the
limonene reacts, 31% deposits to indoor surfaces and the remainder is ventilated to outdoor air.
Figure 3.6. Measured and modeled time series of limonene concentrations in the University of
Colorado Art museum following the consumption of an orange showing removal by ventilation
and chemistry (A). Measured and modeled concentrations of highly oxidized multifunctional

64
compounds (HOMs) produced from limonene ozonolysis (B). The model outputs using the two
published yields for limonene HOMs bracket the measured HOM concentrations.
We also used the limonene emission event to evaluate model predictions of product
formation by comparing NO3-CIMS measurements of HOMs formed from limonene ozonolysis
to model predictions. The two published HOM yields for limonene ozonolysis are 5.3% (Jokinen
et al. 2015) and 17% (Ehn et al. 2014), and the model predictions using each of these yields and
their average are shown alongside our measurements of indoor HOMs in Figure 3.6B. The mass
spectrum and assigned molecular formulas of the highly oxygenated multifunctional compounds
(HOMs) measured with NO3-CIMS following the emission of limonene in the museum are
presented in Figure 3.7 and Table 3.4. The observed mass spectrum is similar to that observed by
Jokinen et al. (2014) in a laboratory study of limonene ozonolysis, providing additional support
for our assignments. To our knowledge this is the first measurement of HOMs in the indoor
environment. The average HOM yield of 11% is in excellent agreement with our measurements.
Since HOMs are low-volatility species and are expected to condense to the aerosol phase we
included a term in the model to account for the condensational sink as measured by the SMPS of
CS = 13 min. We also assumed that the HOMs were sufficiently low-volatility that they were
quantitatively removed from the museum supply air so that the concentration being brought into
the gallery was zero.

65
Figure 3.7. Comparison of nitrate-CIMS mass spectra of HOMs formed from limonene
ozonolysis in a laboratory (Jokinen et al. 2014) and in the University of Colorado Art Museum.

66
Table 3.4. Assigned molecular formulas and detected m/z’s for HOMs formed from limonene
ozonolysis in the University of Colorado Art Museum.
Assigned formula m/z
C9H14O5•NO3- 264.07249
C9H16O5•NO3- 266.08814
Unassigned 268.039813
C9H16O6•NO3- 281.07523
Unassigned 282.061145
C7H11NO7•NO3- 283.041918
C10H15O6•NO3- 293.07523
C9H14O7•NO3- 296.062319
C9H15O7•NO3- 297.070144
C9H16O7•NO3- 298.077969
C10H14O7•NO3- 308.062319
C10H15O7•NO3- 309.070144
C9H14NO7•NO3- 310.065393
C10H17O7•NO3- 311.085794
C9H14O8•NO3- 312.057234
C9H15O8•NO3- 313.065059
C7H17O10•NO3- 323.070538
C10H14O8•NO3- 324.057234
Assigned formula m/z
C10H15O8•NO3- 325.065059
C10H16O8•NO3- 326.072884
C9H13O9•NO3- 327.044323
C9H16NO8•NO3- 328.075958
C10H15NO8•NO3- 339.068133
C10H14O9•NO3- 340.052148
Unassigned 341.069504
C9H14NO9•NO3- 342.055222
C9H15NO9•NO3- 343.063047
C10H15NO9•NO3- 355.063047
C9H12NO10•NO3- 356.034487
C10H15O10•NO3- 357.054888
Unassigned 371.048385
C10H14O11•NO3- 372.041978
C19H32O7•NO3- 434.20317
C19H30O12•NO3- 512.162093
C20H30O14•NO3- 556.151922
C20H30O16•NO3- 588.141751
C20H30O18•NO3- 620.131581
Because HOMs are known to contribute significantly to total particulate matter in pristine
outdoor environments (Ehn et al. 2014), we evaluated the impact of HOM formation in this
experiment on the total mass of submicron particulate matter (PM1) inside the museum. Using

67
the reaction and ventilation timescales described above and assuming a 25% SOA yield (Waring
2016), we predicted an increase in aerosol mass concentration inside the museum of 0.19 g m-3,
consistent with the increase in PM1 concentration measured by our SMPS of 0.22 g m-3.
The observed HOM production in the gallery shows that autoxidation is a significant fate
for organic peroxy radicals indoors. Using the method outlined in Praske et al. (2018) and our
measurements of NO in the museum, we estimated that the bimolecular reaction lifetime of
organic peroxy radicals in the museum was over 10 s 85% of the time, indicating that
bimolecular organic peroxy radical reactions inside the museum were sufficiently slow to allow
indoor autoxidation to proceed. It is important to note that low NO conditions inside the museum
sometimes occurred even when significant NO was entering the museum from outdoors, but that
indoor conversion of NO to NO2 by reaction with O3 maintained NO at sufficiently low
concentrations for autoxidation to proceed. As the atmospheric chemistry community continues
to conduct research on VOC autoxidation and subsequent SOA formation the results will also be
broadly applicable to indoor air chemistry.
3.4. Conclusions
The results of this study show that when real-time measurements of VOCs and other trace
gases are combined with relatively simple box modeling that it is possible to extract a wealth of
qualitative and quantitative information about the transport, emission, deposition, and
transformation of chemicals in the indoor environment. In our case, the box modeling was
greatly simplified by the museum’s constant volume flow ventilation system. Many indoor
environments do not have such consistent air exchange rates, and accurately modeling transport
within those environments requires significant effort to determine the variability in air exchange
rates over time. Emissions of volatile chemical products were identified as the dominant source

68
of VOCs inside the museum, and often occurred in discrete events. The variability in the
compounds emitted in each event demonstrates a continued need for real-time characterization of
the composition and concentrations of chemical products used indoors.
The observed effect of a VOC’s vapor pressure and Henry’s law coefficient on deposition
indicates that VOC sorption to indoor surfaces is analogous to gas-particle partitioning in the
atmosphere, with the high indoor surface area concentrations extending the upper limit of
volatility for compounds that will partition to the condensed phase by several orders of
magnitude. The volatility range of compounds that deposit to indoor surfaces in the museum
extends to higher volatility than is expected for partitioning to impermeable surfaces, indicating
that absorption of VOCs by permeable surfaces, including paints and plastics, may play a
significant role in VOC deposition indoors.
Deposition and ventilation to outside air are the dominant removal processes of VOCs
indoors, with some removal of alkenes by O3 and NO3 oxidation. Simple reaction lifetime
calculations using our estimates of indoor oxidant concentrations show that indoor VOC
oxidation is generally slower than indoor-outdoor air exchange rates and deposition, and in
environments without a photolytic OH source saturated VOCs have lifetimes of tens of hours,
rendering them essentially inert indoors. Our measurements of rapid changes of the indoor O3
reaction rate caused by variations in NO concentration demonstrate the importance of O3-NOx
reactions in determining the oxidation regime of indoor air for the small fraction of VOCs that
react before being ventilated or depositing to a surface. In this study rapid titration of NO by
excess O3 and low rates of photolysis created an environment that favored low-NOx chemistry
initiated by O3, where RO2• radical intermediates reacted with HO2
• radicals, other RO2• radicals,
and by autoxidation to form peroxide-containing products. However, in environments where O3
69
is instead titrated by excess NOx, such as buildings with indoor combustion, high-NOx chemistry
is likely dominant. Oxidation is then initiated primarily by reaction with OH radicals, and RO2•
radical intermediates react with NO to form organic nitrates along with other products. As in
outdoor air, defining the oxidation regime of an indoor environment allows for placement of
better constraints when modeling oxidation rates, reaction products, and SOA yields.

70
Chapter 4
Effects of Gas-Wall Partitioning in Teflon Tubing and Instrumentation
on Time-Resolved Measurements of Gas-Phase Organic Compounds
Reprinted with permission from Pagonis, D., Krechmer, J. E., de Gouw, J., Jimenez, J. L., and
Ziemann, P. J.: Effects of gas-wall partitioning in Teflon tubing and instrumentation on time-
resolved measurements of gas-phase organic compounds, Atmospheric Measurement Techniques
10, 4687-4696, doi: 10.5194/amt-10-4687-2017, 2017.
4.1. Introduction
Teflon tubing is widely used for sampling organic gases in field and laboratory studies,
primarily because it is chemically inert and flexible. These properties also make Teflon the
material of choice for environmental “smog” chambers, most of which are constructed using
fluorinated ethylene-propylene (FEP) or perfluoroalkoxy (PFA) Teflon film (Hallquist et al.
2009). Although it has been known for decades that Teflon is permeable to small organic
compounds (Yi-Yan et al., 1980; Chemours, 2016), only recently have environmental chamber
studies shown that it can also absorb large gaseous organic compounds in an equilibrium
partitioning process that is rapid (time scale ~10–60 min), reversible, and independent of the age
of the chamber (Matsunaga and Ziemann, 2010; Yeh and Ziemann, 2015; Zhang et al., 2015;
Krechmer et al., 2016; Ye et al., 2016). The equilibrium reached in this process can be
conveniently described using a model that is analogous to gas-particle partitioning theory
(Matsunaga and Ziemann, 2010), in which the chamber walls are treated as an equivalent mass

71
concentration of liquid organic aerosol, Cw. Values of Cw reported by Matsunaga and Ziemann
(2010), Yeh and Ziemann (2015), and Krechmer et al. (2016) range from 0.3-30 mg m-3 for an 8
m3 chamber, a range indicating that a significant fraction of organic products formed from
oxidation reactions regularly studied in environmental chambers (and even some less-volatile
precursors) will be absorbed into the walls at equilibrium. Using typical values for Cw and the
time scale for reaching gas-wall partitioning equilibrium, one can incorporate the effect into box
models to estimate the effect of partitioning on chamber measurements, as has been done in
several studies of secondary organic aerosol (SOA) yields (Matsunaga and Ziemann, 2010;
Shiraiwa et al., 2013; McVay et al., 2014; Bian et al., 2015; Krechmer et al., 2015; La et al.,
2016).
Although gas-wall partitioning of organic compounds in Teflon environmental chambers
has now been systematically investigated in a number of studies, this is not the case for Teflon
tubing used for sampling lines. Delays in instrument response have been observed and
documented repeatedly, with many references to “sticky” compounds and “memory effects”
inside tubing and instrumentation. For example: Teflon O-rings are used inside the proton
transfer reaction-mass spectrometer (PTR-MS) because other materials caused significant delays
(Warneke et al., 2003); measured eddy covariance frequencies are dampened by sticky
compounds (Park et al., 2013); heated instruments have been developed specifically to reduce
delays for semivolatile compounds (Mikoviny et al., 2010); and instrument surfaces are often
heated when measuring aerosol components through thermal desorption (Holzinger et al., 2010).
Memory effects in the inlet of the PTR-MS have been modeled previously, but the concept was
not extended to tubing (Schuhfried et al., 2012).

72
In the study presented here, we quantified delays observed when a set of organic
compounds with a range of volatilities were sampled through Teflon tubing for analysis in a
PTR-MS, and then developed a model that applies the principles of gas chromatography and gas-
wall partitioning in Teflon environmental chambers to predict the delays measured for different
tubing lengths and diameters, flow rates, and organic functional groups. The results quantify the
potential effects of tubing on measurements of organic gases and enable better design of
sampling systems, in particular when fast instrument response is needed.
4.2. Materials and Methods
Measurements of Tubing Delay. Experiments were conducted by sampling
homologous series of either C11, C12, C14–C16 1-alkenes (1-undecene, 1-dodecene, 1-tetradecene,
1-pentadecene, 1-hexadecene) or C8, C10, C12–C14 2-ketones (2-octanone, 2-decanone, 2-
dodecanone, 2-tridecanone, 2-tetradecanone) from an 8 m3 FEP Teflon environmental chamber
into a quadrupole PTR-MS using Teflon tubing. The PTR-MS has been described previously (de
Gouw and Warneke, 2007). For each experiment approximately 20 ppb of each of the
compounds in a homologous series were added to the chamber by evaporating a known amount
from a glass bulb (with heating as necessary) into a 5 L min-1 stream of ultra high purity (UHP)
N2. The chamber was then mixed with a Teflon-coated fan for 1 min and allowed to sit for 30
min to ensure that gas-wall partitioning equilibrium had been achieved inside the chamber
(Matsunaga and Ziemann, 2010). The combined passivation time of the tubing + PTR-MS for
compounds in the chamber was determined by moving the tubing from sampling room air (a
clean air source for the conditions of these experiments) to sampling chamber air containing the
compounds. This procedure produces a step function in the concentration of compounds
sampled, and is identical to frontal analysis, a long-standing technique for characterizing
73
chromatography columns (James and Phillips, 1954; Schay and Szekely, 1954). After the
instrument response reached steady state (meaning that the PTR-MS and tubing were fully
equilibrated with the incoming air), either the tubing was moved back to sampling room air,
allowing the PTR-MS and tubing to approach a new equilibrium state, or the PTR-MS was
investigated separately by detaching the inlet tubing so that it sampled room air directly. The
effect of the tubing on the equilibration time was isolated by comparing the response times when
the PTR-MS was sampling room air with and without the tubing.
The base case measurements of delays were conducted with 2-ketones sampled through
1.0 m of PFA Teflon tubing (1/4 in. OD, 3/16 in. ID) at a flow rate of 0.36 L min-1, with the 1-
alkenes evaluated under the same conditions. The effect of tubing length on the delay was
evaluated by also using 3.0 m of PFA Teflon tubing with the same OD and ID at a flow rate of
0.36 L min-1. The effect of flow rate on the delay was evaluated by increasing the flow rate from
0.36 to 2.7 L min-1 by adding a line sampling an additional 2.3 L min-1 flow (controlled by a
critical orifice) in parallel with the PTR-MS. In this experiment a 3.0 m length of PFA Teflon
tubing was used to achieve a sufficiently large delay. The effect of tubing diameter on the delay
was investigated using a 3.0 m length of 1/8 in. OD, 1/16 in. ID PFA Teflon tubing at a flow rate
of 0.36 L min-1. Flow was laminar in the tubing during all experiments, with calculated Reynolds
numbers of 90 and 650 for the low and high flow experiments in the 3/16 in. ID tubing and 260
in the experiment using 1/16 in. ID tubing. The tests were conducted at ambient laboratory
temperature (23 oC) and when the instruments had been pumped down and operated for several
weeks, thus representing typical operating conditions.
Chemicals The following chemicals, purities, and suppliers were used in this
study: 1-undecene (97%), 1-dodecene (95%), 1-tetradecene (92%), 1-pentadecene (98%), 2-

74
octanone (98%), 2-decanone (98%), and 2-tridecanone (99%) from Aldrich; 2-dodecanone
(98%) and 2-tetradecanone (98%) from ChemSampCo; and 1-hexadecene (99.8%) from Fluka.
Model for Transport of an Organic Compound Through Teflon Tubing
The model used to describe the effect of tubing on the delay is a linear kinetic
chromatography model, where the affinity of a compound for the walls of the Teflon tubing (the
stationary phase) is determined by its saturation concentration (c*). This approach seems
reasonable, considering the nature of the processes involved, the dependence of gas-wall
partitioning on c* (Matsunaga and Ziemann 2010; Krechmer et al., 2016), and the observation
that the extent of partitioning of an organic compound in a Teflon chamber correlates well with
its retention time measured by gas chromatography (Yeh and Ziemann, 2015). Based on the
chamber results, we assume that the rate of absorption of a compound into the walls is controlled
by gas-phase diffusion to the walls (and thus does not depend on mass accommodation), and
treat absorption and desorption as first-order processes. For a numerical solution the tubing is
divided into a series of perfectly mixed bins, with compound flowing into and out of each bin
and also undergoing gas-wall partitioning, as shown in Figure 4.1.

75
Figure 4.1. Schematic of the chromatography model used to describe delays caused by gas-wall
partitioning of organic compounds in Teflon tubing. Compounds flow through a series of
perfectly mixed bins, undergoing gas-wall partitioning within each bin. The rates of flow
between bins (kf), absorption (ka) and desorption (kd) are dependent on tubing diameter, flow
rate, and the saturation vapor concentration c* of the compound being measured.
Our assumption of diffusion-limited absorption is consistent with the criteria developed
by McMurry and Stolzenburg (1987), who compared time scales for diffusion and uptake at the
walls to determine whether mass accommodation affects the uptake kinetics of sticky compounds
passing through tubing. They estimate the time scale for diffusion (𝜏𝑑𝑖𝑓𝑓) as in Equation 4.1:
𝜏𝑑𝑖𝑓𝑓 =𝑑𝑡
2
8 𝐷𝑔 (4.1)
and the time scale for accommodation into the wall (𝜏𝑎𝑐) as in Equation 4.2:
𝜏𝑎𝑐 =𝑑𝑡
2 𝛼 𝑐̅ (4.2)
where Dg is the compound’s diffusion coefficient in air, is its mass accommodation coefficient
on the tubing wall, 𝑐̅ is its mean thermal speed, and dt is the ID of the tubing. The mass
accommodation coefficient has an impact on the rate of uptake at the walls when the time scale

76
for accommodation is comparable to or larger than the time scale for diffusion, as in Equation
4.3:
𝜏𝑎𝑐
𝜏𝑑𝑖𝑓𝑓=
4 𝐷𝑔
𝛼 𝑐̅ 𝑑𝑡≳ 1 (4.3)
Using a diffusion coefficient of 0.067 cm2 s-1, the average of values calculated for the
compounds studied here (range = 0.055 – 0.088 cm2 s-1) using three methods (Tucker and
Nelken, 1986), and a tubing ID of 0.47 cm, Equation 4.3 indicates that mass accommodation
does not affect the rate of uptake to the walls for values of α > 3 × 10⁻⁵. Since this threshold is
similar to that determined in studies of gas-wall partitioning in Teflon environmental chambers,
where it has been shown that the rate of turbulent mixing within the chamber is the rate-limiting
process in establishing partitioning equilibrium for compounds with mass accommodation
coefficients greater than ~10-5 (Matsunaga and Ziemann, 2010; Krechmer et al., 2016), our
assumption that absorption of compounds into the walls is limited by gas-phase diffusion seems
justified.
The first-order rate constant for absorption of compounds into the tubing walls (ka) was
calculated using Equation 4.4:
𝑘𝑎 =8 𝐷𝑔
𝑑𝑡2 (4.4)
which is the inverse of the time scale for diffusion-limited transport to the walls given by
Equation 4.1. For the 0.47 cm ID tubing used in our experiments, τa = 0.4 s. Rate constants for
desorption of compounds out of the walls (kd) were calculated using Equation 4.5:
𝑘𝑑 =𝑘𝑎
𝐾𝑔𝑤 (4.5)

77
where Kgw is the equilibrium constant for gas-wall partitioning inside the tubing. The most and
least volatile compounds measured here had desorption time scales of 0.2 s and 50 s,
respectively, in 0.47 cm ID tubing. Values of Kgw were calculated using Equation 4.6:
𝐾𝑔𝑤 =𝐶𝑤
𝑐∗ (4.6)
which was employed by Matsunaga and Ziemann (2010) in their model for gas-wall partitioning
in Teflon environmental chambers. Values of c* were estimated using the SIMPOL.1 group
contribution method (Pankow and Asher, 2007), and the effective wall mass Cw for PFA Teflon
tubing was determined by fitting the model output for our base experimental case (0.47 cm ID
tubing sampling at 0.36 L min-1) to the experimentally determined tubing delays under those
conditions. We varied Cw in the model to generate tubing delays as a function of c*, and we then
used an orthogonal-distance regression to minimize a sum-of-squares residual. These residuals
were calculated in log-log space (log(delay) vs log(c*), as the data is shown in Figure 4.5)
because both compound c* and tubing delays vary across several orders of magnitude and we
wished to avoid biasing the fitting towards data acquired at high c* or at longer tubing delays.
The Cw value assumed by the model was then varied to find the minimum residual, giving an
optimal Cw value of 4 g m-3. The delays predicted for this Cw value are plotted in Figure 4.5.
For perfectly mixed flow in the bins, flow is modeled as a first-order process as in
Equation 4.7:
𝑘𝑓 =𝑄
𝐴 𝑙 (4.7)
where Q is the volumetric flow rate inside the tubing, A is the cross-sectional area of the
tubing, and l is the length of a bin in the model (2 cm). A comparison of the concentration
profiles of compounds at the tubing exit simulated assuming perfectly mixed or laminar flow is

78
presented in Figure 4.2. The concentration profile for laminar flow was produced using the
residence time distribution E(t) shown in Equation 4.8:
𝐸(𝑡) = 𝑡𝑚
2
2 𝑡3 (4.8)
where tm is the mean residence time and t is the time elapsed (Fogler, 2006). The error this
assumption causes in transfer time through a 1 m length of tubing is generally smaller than the
effect of gas-wall partitioning within the tubing and so does not affect the model results
presented here.
Figure 4.2. Simulated time profiles of compound concentrations at the tubing exit assuming flow
in bins is perfectly mixed rather than laminar. The mixed flow profile was generated by running
the model with gas-wall partitioning turned off. The profiles are for 1 m of tubing with 3/16 in.
ID at a flow rate of 1 L min-1.
Diffusion of compounds absorbed into the walls of the Teflon tubing is fast compared to
the time scales investigated here, and thus it is not explicitly included in our model. This is
similar to the assumption often made in chromatography models that diffusion within the
stationary phase does not affect mass transfer within the column (Guiochon et al., 2006). Using
the formulation developed by Krechmer et al. (2016), we estimate that the depth to which

79
organic compounds effectively partition into the Teflon tubing is 2.2 nm for the Cw value derived
here. This value is consistent with our estimates for Teflon chambers, which ranged from 1.5 –
4.5 nm (Krechmer et al., 2016). Diffusion coefficients of larger organic molecules in Teflon
(e.g., toluene and benzene) are Dt ~ 2 x 10⁻⁹ cm2 s-1 (Tokarev et al., 2006), resulting in a time
scale for diffusion in the walls of τdw ~ lw2 / Dt ~ 0.1 ms. This is much smaller than the minimum
time scale for gas-phase diffusion and accommodation of ~400 ms, indicating that this process is
too fast to limit partitioning and thus does not need explicit representation in the model.
Using the rate constants defined above, the rates of change in concentration of
compounds in the gas phase and wall compartments in bin i, [Gi] and [Wi], can be expressed as in
Equations 4.9 and 4.10:
𝑑[𝐺𝑖]
𝑑𝑡= 𝑘𝑓[𝐺𝑖−1] − 𝑘𝑓[𝐺𝑖] − 𝑘𝑎[𝐺𝑖] + 𝑘𝑑[𝑊𝑖] (4.9)
𝑑[𝑊𝑖]
𝑑𝑡= 𝑘𝑎[𝐺𝑖] − 𝑘𝑑[𝑊𝑖] (4.10)
where both [Gi] and [Wi] are expressed in units of moles per cubic meter of air. These units are
consistent with our treatment of gas-wall partitioning as being analogous to gas-particle
partitioning, where the concentration of compounds in the condensed phase is represented as
moles (or mass) per cubic meter of air (Pankow 1994, Donahue et al., 2006).
The model was solved numerically using the Euler method with at a time step of 1 ms
and 50 bins per meter of tubing, using IGOR Pro (Wavemetrics, v7.02). Shortening the time step
and/or increasing the number of bins per meter of tubing did not appreciably change the
numerical results.
4.3. Results and Discussion
Effect of Volatility, Tubing Length, and Flow Rate on Tubing Delays. Tubing
delays were measured by introducing step function changes in the concentration of organic

80
compounds measured by the PTR-MS, with all compounds of a homologous series being
measured simultaneously, as shown in Figure 4.3. We quantify delays in this study as the amount
of time required for the PTR-MS signal to achieve 90% of the total change caused by the step
function change in sample concentration. As can be seen in Figure 4.3A for 2-ketones, the total
(PTR-MS + tubing) delay increases with increasing compound carbon number and therefore
decreasing compound volatility. This can be explained by noting that the criteria for gas-wall
partitioning equilibrium is that the rates of absorption and desorption are equal throughout the
system, so for tubing (a similar equation holds for the PTR-MS) this condition is everywhere
given by Equation 4.11:
𝑘𝑎[𝐺] = 𝑘𝑑[𝑊] (4.11)
Substituting Equations 4.5 and 4.6 and rearranging, the equilibrium condition is then given by
Equation 4.12:
[𝑊] =𝐶𝑤 [𝐺]
𝑐∗ (4.12)
Since Cw, [G] (the input concentration), and the rate of absorption are essentially the same for all
compounds, the time required for [W] to reach the equilibrium value given by Equation 4.12
increases with decreasing compound volatility. This reflects the need for the tubing to absorb a
larger amount of the less volatile compounds to reach equilibrium, while only a very small
amount of the more volatile species needs to be absorbed to meet that condition.

81
Figure 4.3. (A) PTR-MS time profiles measured in response to a step function increase in the
concentration of 2-ketones. All compounds were measured simultaneously through 1 m of 3/16
in. ID PFA Teflon tubing at a flow rate of 0.36 L min-1. Profiles are normalized to peak signal.
The decline in signal over time is due to drift in instrument response following start-up. (B)
PTR-MS time profiles measured in response to a step function decrease in the concentration of
2-ketones for tubing + PTR-MS (thick lines) and the PTR-MS alone (thin lines). The tubing used
was a 3 m length of 3/16 in. ID PFA Teflon, and the flow rate for both traces was 0.36 L min-1.
Profiles are normalized to the equilibrium concentration measured prior to the step change. The
signal-to-noise ratio is lower at higher carbon numbers due to gas-wall partitioning in the
chamber lowering sample concentration as well as mass discrimination within the PTR-MS
quadrupole mass analyzer. For visual clarity the traces for 2-octanone are not shown since they
overlap with the traces for 2-decanone.

82
The effects of the PTR-MS and tubing were uncoupled by comparing the equilibration
times for the PTR-MS + tubing with the equilibration time of the PTR-MS alone. The
differences in equilibration times are significant and easily observed in the time profiles of 2-
ketones shown in Figure 4.3B. Here we define the tubing delay as the difference in the time it
takes for the signal to drop to 10% of its initial value, with and without the tubing attached to the
PTR-MS. Both tubing and instrument delays are substantial.
The tubing delays measured for 2-ketones sampled through two lengths of 0.47 cm ID
tubing (1 and 3 m) at a single flow rate (0.36 L min-1) and through a single length of 0.47 cm ID
tubing (3 m) at two flow rates (0.36 and 2.7 L min-1) are shown in Figure 4.4A and Figure 4.4B,
respectively. The tubing delay increases almost proportionally with tubing length, similar to the
effect of column length on retention time established in the chromatography literature, captured
in Equation 4.13:
𝑡𝑟 =𝐵 𝐿
𝑣𝑓 (4.13)
where tr is retention time, L is column length, vf is the bulk flow velocity, and B is a constant that
incorporates the partitioning coefficient and volumes of stationary and mobile phases (Poole,
2003; Skoog et al., 2007). The tubing delay decreases as flow rate is increased (Figure 4.4B)
because compounds have less time to partition to the walls, but the observed change is less than
inversely proportional to the flow velocity (0.20 instead of 0.13) as predicted by Equation 4.13.
This discrepancy is thought to occur because, unlike chromatography, where the time scale for
absorption of compound to the walls is much shorter than the time scale for flow in the tube, in
the tubing experiments the time scales are comparable.

83
Figure 4.4. (A) Tubing delays for PTR-MS analysis of 2-ketones sampled using 1 and 3 m of
3/16 in. ID tubing at a flow rate of 0.36 L min-1. The dashed line corresponds to the model case
where the delay is proportional to the length of the tubing, which for these experiments is a
factor of three. (B) Tubing delays for PTR-MS analysis of 2-ketones sampled using 3 m of 3/16
in. ID tubing and flow rates of 0.36 and 2.7 L min-1. The dashed line corresponds to the model
case where the delay is inversely proportional to the flow rate, which for these experiments is a
factor of 0.13.

84
The dependence of tubing delays measured for 2-ketones and 1-alkenes on c* for a range
of conditions are shown in Figure 4.5. Because delays increase proportionally with increasing
tubing length, they are plotted as minutes of delay per meter of tubing. Delays are inversely
proportional to c*, eventually levelling off at the residence time of the tubing when c* ≫ Cw and
gas-wall partitioning becomes insignificant. This trend is driven by the change in the time scale
to reach partitioning equilibrium with c*, as described in Equation 4.12. Figure 4.5 also
compares model output to our experimental results, and shows that the model accurately predicts
the tubing delay as a function of c* across all functional groups, tubing lengths, and flow rates
tested. No effect of functional group on tubing delay was observed, consistent with past studies
of gas-wall partitioning in Teflon chambers, where compound volatility is the property that best
predicts the extent of sorption (Matsunaga 2010). We note here that past work has shown that
gas-wall partitioning equilibrium established in Teflon chambers is independent of sample
concentration (Matsunaga and Ziemann, 2010) and relative humidity (Krechmer et al., 2017).
Limited experiments conducted here were consistent with those findings, indicating that this
model can be used to estimate tubing delays in both lab and field settings.
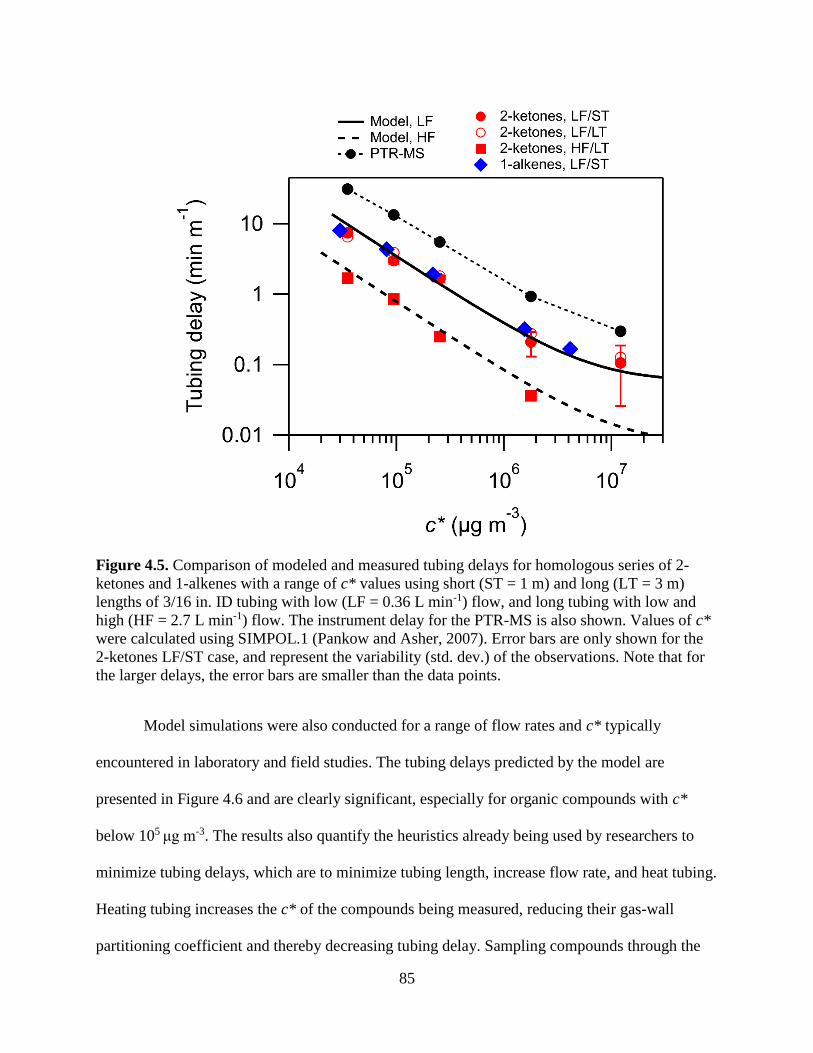
85
Figure 4.5. Comparison of modeled and measured tubing delays for homologous series of 2-
ketones and 1-alkenes with a range of c* values using short (ST = 1 m) and long (LT = 3 m)
lengths of 3/16 in. ID tubing with low (LF = 0.36 L min-1) flow, and long tubing with low and
high (HF = 2.7 L min-1) flow. The instrument delay for the PTR-MS is also shown. Values of c*
were calculated using SIMPOL.1 (Pankow and Asher, 2007). Error bars are only shown for the
2-ketones LF/ST case, and represent the variability (std. dev.) of the observations. Note that for
the larger delays, the error bars are smaller than the data points.
Model simulations were also conducted for a range of flow rates and c* typically
encountered in laboratory and field studies. The tubing delays predicted by the model are
presented in Figure 4.6 and are clearly significant, especially for organic compounds with c*
below 105 μg m-3. The results also quantify the heuristics already being used by researchers to
minimize tubing delays, which are to minimize tubing length, increase flow rate, and heat tubing.
Heating tubing increases the c* of the compounds being measured, reducing their gas-wall
partitioning coefficient and thereby decreasing tubing delay. Sampling compounds through the

86
tubing at higher flows than necessary for instruments and dumping excess flow (oversampling)
also reduces tubing delays by decreasing the time available for compounds to partition to the
walls. The delays for 3/16 in. ID Teflon tubing presented in Figure 4.6 can be estimated using the
empirical parameterization in Equation 4.14:
𝐷𝑒𝑙𝑎𝑦 (𝑚𝑖𝑛 𝑚−1) =3.18 × 10⁻³
𝑄
4.73+ 𝑄 ×
𝑐∗
8.11×10⁶ + 𝑐∗
(4.14)
where Q is flow rate (L min-1) and c* is the saturation vapor concentration (μg m-3) at the
temperature of the tubing calculated using SIMPOL.1. This parameterization matches the model
predictions of tubing delay within a factor of 1.2 for delays between 5 sec m-1 and 60 min m-1
across the range of flow rates and c* plotted in Figure 4.6. We note that although the
parameterization in Equation 4.14 is based on diffusion coefficients D estimated at 23 °C,
changes in D due to temperature produce only small changes in predicted delay (~10% when
raising temperature from 23 °C to 100 °C). This effect is negligible compared to the change in
delay caused by the accompanying shift in c* (several orders of magnitude for the same
temperature change), making this parameterization a useful predictive tool for the changes in
tubing delay caused by changes in temperature. The parameterization does not, however, take
into account changes in the absorptive properties of Teflon that may occur at lower or higher
temperatures.

87
Figure 4.6. Simulated tubing delays presented as a function of c* and flow rate for 3/16 in. ID
PFA Teflon tubing. The range of conditions for measurements made in this study are shown by
the dashed box. Values of c* were calculated using SIMPOL.1 (Pankow and Asher, 2007).
Estimating Cw for Teflon Tubing. As mentioned above, the value of Cw used in
the model for the 0.47 cm ID PFA Teflon tubing was estimated by fitting the model predictions
to the experimental data in Figure 4.5. The optimal value for Cw was 4 g m-3 (grams of absorbing
phase per m3 of internal tube volume). In order to directly compare Cw in tubing and chambers
one must correct for differences in the surface area to volume ratios. Since we model gas-wall
partitioning as occurring within a finite depth at the surface of the Teflon tubing or chamber, the
volume of Teflon into which partitioning occurs is the product of the Teflon surface area (SA)
and the partitioning depth (). Cw can then be expressed as in Equation 4.15:
𝐶𝑤 =𝑆𝐴 𝛿 𝜌
𝑉 (4.15)

88
where is the density of Teflon and V is the volume of gas exposed to the given surface area of
Teflon. The equivalent wall mass measured for tubing can then be scaled for comparison with
chamber values using Equation 4.16:
𝐶𝑤,𝑐ℎ = 𝐶𝑤,𝑡𝑆𝐴𝑐ℎ 𝑉𝑡 𝛿𝑐ℎ 𝜌𝑐ℎ
𝑆𝐴𝑡 𝑉𝑐ℎ 𝛿𝑡 𝜌𝑡 (4.16)
where the subscripts ch and t denote the chamber and tubing. As discussed above, ch/ t~ 0.7–
2, and since PFA (tubing) and FEP (chambers) Teflon have the same density, ch/ t = 1.
When scaled according to Equation 4.16, the value of Cw,t = 4 g m-3 reported above is
equivalent to ~10–30 mg m-3 of liquid organic aerosol in an 8 m3 chamber. This is comparable to
the values of Cw determined in FEP Teflon chambers: 16 mg m-3 for 1-alkenes and 24 and 78 mg
m-3 for 2-ketones (Matsunaga and Ziemann, 2010; Yeh and Ziemann, 2015), where values from
Matsunaga and Ziemann (2010) were recalculated with c* values obtained using SIMPOL.1
(Pankow and Asher, 2007). The similarity in Cw values indicates that gas-wall partitioning of
organic compounds is similar for PFA and FEP Teflon. We also note that since gas-wall
partitioning in tubing depends on Cw (Equation 4.6), and since estimates of Cw depend on the
method used to estimate compound vapor pressures, researchers applying the results of this work
to other compounds should use SIMPOL.1 to estimate c* values, even when measured vapor
pressures are available.
Effect of Tubing Diameter on Tubing Delays. We find that tubing delays are
shortest for small diameter tubing, provided that flow rate or Reynolds number is held constant.
When the tubing is being depassivated following a step-function decrease in sample
concentration one can treat the residence time of compound in the walls of the tubing (w) as the
limiting step in depassivation. By substituting Equations 4.4, 4.6 and 4.14 into Equation 4.5 one

89
arrives at an expression for the residence time of a compound in the walls of the tubing given in
Equation 4.17:
𝜏𝑤 =𝐶𝑤
𝑘𝑎 𝑐∗=
𝛿𝑡 𝜌𝑡 𝑑𝑡
2 𝑐∗ 𝐷𝑔 (4.17)
which shows a linear relationship between w and tubing diameter. While this approach is clearly
a simplification and ignores the effect of flow rate on the rate of equilibration, we show in Figure
4.7 that our numerical model also predicts a linear relationship between tubing delay and tubing
diameter when flow rate is held constant. This linear relationship also aligns well with our
experimental results. In Figure 4.8 we present tubing delays and model results for 1/16 and 3/16
in. ID tubing. In the region where delays are dominated by gas-wall partitioning inside the tubing
(c* < 106 μg m-3) we observe that modeled and measured delays are three times longer for 3/16
in. ID tubing compared to 1/16 in. ID tubing. This relationship breaks down at higher volatilities
(c* > 106 μg m-3) since c* > Cw, and the extent of gas-wall partitioning is small, giving very short
residence times in the walls. With this in mind, one can conclude that tubing delays scale directly
with tubing diameter at a constant flow rate when delays are larger than a few seconds.

90
Figure 4.7. Simulated tubing delays presented as a function of tubing ID at various flow rates for
a compound with c* = 105 μg m-3 sampled through PFA tubing.
Figure 4.8. Comparison of measured and modeled tubing delays for 1/16 in. ID and 3/16 ID
PFA Teflon tubing sampling at 0.36 L min-1. Values of c* were calculated using SIMPOL.1
(Pankow and Asher, 2008).

91
To quantify the effect of simultaneous changes in tubing diameter and flow rate we
generated model predictions of tubing delay for a compound with c* = 105 μg m-3 across a range
of tubing diameters and flow rates. These results are presented in Figure 4.9, and provide
guidance for designing a sampling system that minimizes tubing delay. As expected, the model
predictions indicate that smaller diameter tubing has shorter tubing delays when flow rate or
Reynolds number is held constant. The results in Figure 4.9 also suggest that one may be able to
reduce tubing delays by sampling under turbulent flow conditions. We did not attempt to
quantify delays under such conditions, however, in part due to the larger pressure drops
experienced in that flow regime, which are undesirable under many circumstances.
Figure 4.9. Simulated tubing delays presented as a function of tubing ID and flow rate for a
compound with c* = 105 μg m-3 sampled through PFA tubing. Reynolds numbers are overlaid to
illustrate the nonlinear relationship between tubing delay, flow rate and tubing diameter.
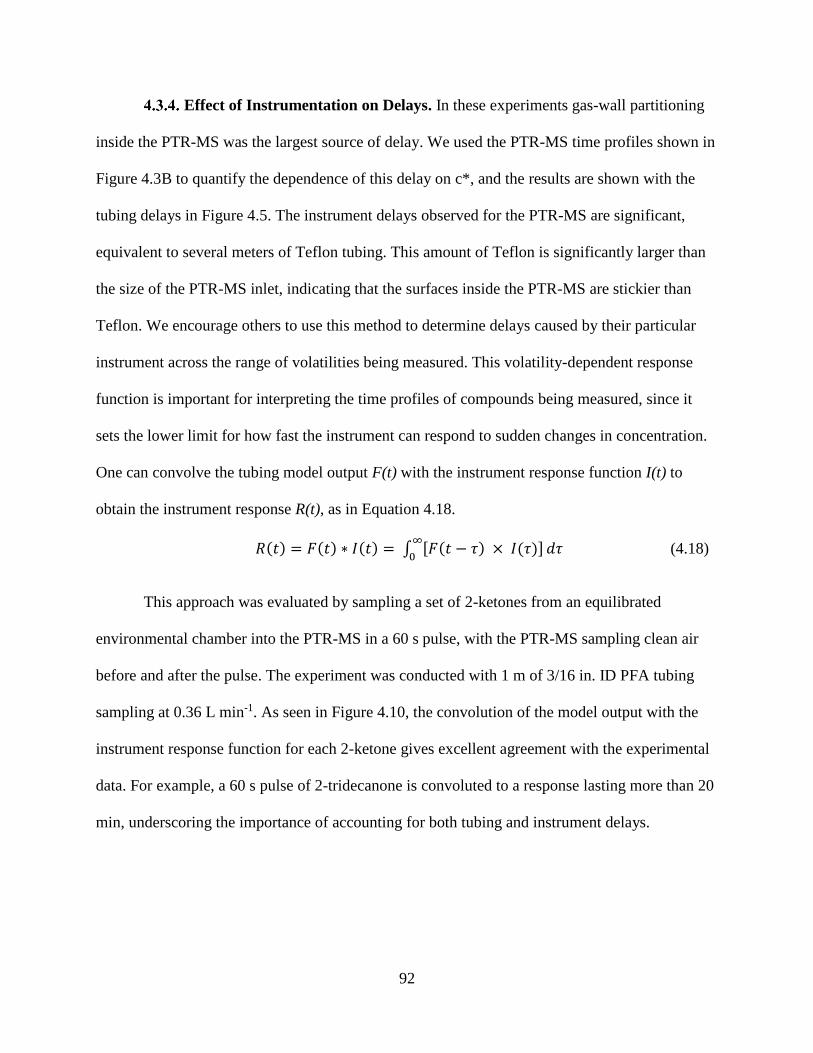
92
Effect of Instrumentation on Delays. In these experiments gas-wall partitioning
inside the PTR-MS was the largest source of delay. We used the PTR-MS time profiles shown in
Figure 4.3B to quantify the dependence of this delay on c*, and the results are shown with the
tubing delays in Figure 4.5. The instrument delays observed for the PTR-MS are significant,
equivalent to several meters of Teflon tubing. This amount of Teflon is significantly larger than
the size of the PTR-MS inlet, indicating that the surfaces inside the PTR-MS are stickier than
Teflon. We encourage others to use this method to determine delays caused by their particular
instrument across the range of volatilities being measured. This volatility-dependent response
function is important for interpreting the time profiles of compounds being measured, since it
sets the lower limit for how fast the instrument can respond to sudden changes in concentration.
One can convolve the tubing model output F(t) with the instrument response function I(t) to
obtain the instrument response R(t), as in Equation 4.18.
𝑅(𝑡) = 𝐹(𝑡) ∗ 𝐼(𝑡) = ∫ [𝐹(𝑡 − 𝜏) × 𝐼(𝜏)]∞
0𝑑𝜏 (4.18)
This approach was evaluated by sampling a set of 2-ketones from an equilibrated
environmental chamber into the PTR-MS in a 60 s pulse, with the PTR-MS sampling clean air
before and after the pulse. The experiment was conducted with 1 m of 3/16 in. ID PFA tubing
sampling at 0.36 L min-1. As seen in Figure 4.10, the convolution of the model output with the
instrument response function for each 2-ketone gives excellent agreement with the experimental
data. For example, a 60 s pulse of 2-tridecanone is convoluted to a response lasting more than 20
min, underscoring the importance of accounting for both tubing and instrument delays.
93
Figure 4.10. Measured and modeled time series for a 60-second pulse of 2-ketones measured by
the PTR-MS through 1 m of 3/16 in. ID PFA Teflon tubing at 0.36 L min-1. The tubing model
output was convolved with the instrument response function for each 2-ketone to generate the
traces.
After the experiments described in this work were completed we removed all extraneous
tubing from the inlet of the PTR-MS in an attempt to minimize the instrument response time for
future work. This was a success, and we decreased the instrument response time by a factor of 5
by reconfiguring the inlet. This result again shows the importance of minimizing the total
amount of tubing in a sampling configuration when fast instrument response is needed.
4.4. Conclusions
We found that gas-wall partitioning of organic compounds inside Teflon tubing
significantly affects time-resolved measurements of compounds with saturation concentration
(c*) below 107 μg m-3. The compounds measured in this study (SIMPOL.1-calculated c* values

94
ranging from 3 × 10⁴ μg m-3 to 1 × 10⁷ μg m-3) are all expected to exist entirely in the gas phase
in the atmosphere (Donahue et al, 2006). We found that measurements of compounds in this
volatility range were significantly affected by delays caused by partitioning to the walls of the
tubing and the PTR-MS. We modeled the delays caused by Teflon tubing using a simple
chromatography model and the gas-wall partitioning framework of Matsunaga and Ziemann
(2010). This model accurately predicts tubing delays across all compound volatilities, functional
groups, tubing lengths and diameters, and flow rates tested. The measurements and model
simulations indicate that delays can shift compound time profiles by minutes to hours – time
scales that are highly relevant to both laboratory and atmospheric measurements.
A potential application of these delays is for estimating compound saturation
concentration, even when the identity of the compound is unknown. Past work has proposed
using desorption kinetics inside an inlet as a technique for identifying compounds (Schuhfried et
al., 2012), and the model presented here can be used in a similar way. Another possible
application is to induce time separation among different compounds that are otherwise
indistinguishable to the analytical instrumentation (e.g., compounds with the same accurate mass
in CIMS; Stark et al., 2015), since the c* of multifunctional compounds with the same molecular
formula can often differ by 5 orders-of-magnitude (Krechmer et al., 2015). The separation in
time can then be exploited via manual analyses or factor analysis techniques (e.g., Ulbrich et al.,
2009). This is equivalent to a “poor-person’s chromatography,” but using ambient temperature
and Teflon surfaces that avoid thermal decomposition of multifunctional species that can occur
in gas chromatography due to use of high temperatures (Stark et al., 2017).
Accounting for tubing and instrument delays is especially important in circumstances
where concentrations of the compounds are changing rapidly, including eddy covariance

95
measurements, mobile platforms such as aircraft, rapidly changing emission sources such as fires
or motor vehicle exhaust, and fast processes such as chemical reactions and gas-particle-wall
partitioning. As CIMS techniques continue to be developed for detecting multifunctional organic
compounds, extra care must be taken to minimize the impact that tubing and instrument surfaces
have on measurements since these compounds are especially sticky.
Based on our results, we recommend that studies measuring intermediate volatility and
semivolatile compounds (c* < 106 μg m-3) minimize the length of Teflon tubing used; and since
increased flow rates and smaller tubing diameters also help to mitigate tubing delays, use the
fastest flow rate in the smallest diameter tubing that still maintains laminar flow. We also
recommend that researchers determine the volatility-dependent time response function of their
instrument. This sets the lower limit for the response time for a given compound and allows for
deconvolution of the effects of gas-wall partitioning in the instrument from those in the inlet
tubing. The instrument response function can then be convolved with the output of the model
presented in this study to correct for delay artifacts caused by gas-wall partitioning in Teflon
tubing. This method can also be used to characterize other tubing materials, the effect of
temperature and other variables, and enable improved inlet system designs.
96
Chapter 5
Thesis Conclusions
This thesis presents three studies of the physical and chemical processes that govern the
transport and transformation of organic compounds in indoor and outdoor environments. Chapter
2 presents results of a study of the reactions of a hydroperoxyaldehyde (AHPA) in SOA. AHPA
was found to cyclize rapidly, establishing equilibrium between a cyclic peroxyhemiacetal and a
ring-open hydroperoxyaldehyde in approximately 3 minutes. The equilibrium constant for this
cyclization reaction was measured to be 2.6. Following cyclization, the peroxide functionality of
AHPA in SOA decomposes at a rate of 17% per hour when organic seed aerosol is used, a result
consistent with past studies of other peroxide-containing SOA. The decomposition rate is
dependent on the acid content and phase state of the SOA, with sulfuric acid / dioctyl sebacate
(DOS) seed aerosol promoting the complete decomposition of AHPA in 30 minutes, while
aqueous sulfuric acid / ammonium sulfate seed aerosol showed the same AHPA decomposition
rate as DOS seed. This result indicates that the sulfuric acid in aqueous seed aerosol is not
available to catalyze decomposition reactions in the organic phase of phase-separated SOA.
Several decomposition pathways of AHPA are proposed, including bimolecular Baeyer-Villager
oxidation, concerted elimination of hydrogen or alkyl groups from the cyclic peroxyhemiacetal,
and acid-catalyzed decomposition of the peroxyhemiacetal and peroxyacetal form of AHPA.
Most notable is the incorporation of alcohols from the SOA into the structure of AHPA as ester
and acetal groups, indicating that as peroxide-rich HOMs decompose in SOA they may form
large oligomers. The insights provided by this study into the chemistry of multifunctional

97
hydroperoxides in SOA advance our knowledge of how oligomers form in SOA, improving our
ability to predict SOA yields, composition, and lifetime in the atmosphere.
Chapter 3 of this thesis presents the results of a six-week indoor air quality study at the
University of Colorado Art Museum, including the emission rates, deposition velocities, and
chemical reactions of organic compounds. Human VOC emission factors were determined
during a high-occupancy event and were found to agree within a factor of two with prior studies
that used similar methodology. The emission factors that do not agree within a factor of two are
explained by the difference in outdoor air quality and the activities conducted in each
environment, with the emission factors for ethanol, monoterpenes, and ozone-squalene oxidation
products explained by increased alcohol consumption, reduced personal care product use, and
lower ozone concentrations, respectively. Following the application of paint to a gallery wall,
emission factors were quantified for VCPs in paint. Using a simple box model of the museum’s
HVAC system, the deposition velocities of organic compounds to museum surfaces was
determined as a function of volatility, with compounds having C* below 108 μg m-3 showing
measurable partitioning to the surfaces. The reaction rate of ozone inside an art gallery was
found to be highly variable in time, with reactions with gallery surfaces, occupants, and NO all
serving as the primary loss process under different conditions. On average, reaction with
surfaces, NO, occupants, and NO2 contributed 62%, 31%, 5%, and 2% to ozone loss,
respectively. The deposition velocities of ozone to surfaces and to occupants were within the
ranges previously reported in the literature, and we note that in the conditions observed in the
museum, ozone deposition to occupants could not be quantified accurately if reactions with NOx
were not taken into account. The oxidation rates of VOCs in the museum were estimated using a
simple box model, and the measured concentration of HOMs from limonene ozonolysis were

98
found to be consistent with the model predictions of limonene oxidation rate. Additionally, the
predicted SOA yield of limonene HOMs was within the measurement uncertainty of the PM1 in
the museum. The results of this study will enable future predictions of indoor air quality based
on outdoor air quality, building ventilation rates, occupancy levels, occupant activities, and
indoor VCP use.
In Chapter 4 results are presented of a study examining the impact of gas-surface
partitioning of organic compounds on measurements of gas-phase organic compounds. Delays in
instrument response times due to gas-wall partitioning of organic compounds in Teflon tubing
can be described using a simple chromatography model, where the partitioning of a given
compound is determined by the compound’s C* and the equivalent absorbing mass (Cw) of the
tubing. Using this model, the Cw for PFA Teflon tubing was found to be 4 g m-3, causing delays
of seconds to minutes in instrument response for compounds with C* < 107 μg m-3. This value of
Cw for PFA Teflon tubing is consistent with values of Cw measured in FEP Teflon chambers,
indicating that the surface properties of the two materials are similar. The chromatography model
presented in this chapter accurately predicted delays in instrument response time across all flow
rates, tubing diameters, tubing lengths, and analyte functional groups tested. Increasing flow rate,
decreasing tubing diameter, and decreasing tubing length all shorten delay times when all other
parameters are held constant. No effect of functional groups on tubing delays was observed. The
output of the model presented in this chapter can be convolved with an instrument response
function to predict the measured time series of a compound that has significant instrument and
tubing delays. The results of this study will enable better design of inlets and instruments,
allowing for faster instrument response timescales and improved measurements of gas-phase
organic compounds with C* below 107 μg m-3.

99
This thesis presents advances in knowledge of the chemistry of multifunctional
hydroperoxides in secondary organic aerosol; the emission, deposition, and chemistry of organic
compounds in the indoor environment; and the effect of gas-surface partitioning on
measurements of gas-phase organic compounds. In all of these research areas there is still much
to be learned, and future work should examine: 1) the effect of aerosol phase on acid and metal-
ion catalysis, including Fenton chemistry; 2) the rates and products of Baeyer-Villager chemistry
in peroxide-rich SOA; 3) the fate of VOCs sorbed to surfaces in the indoor environment; 4) gas-
wall partitioning in additional tubing materials besides Teflon; and 5) mathematical techniques to
deconvolve tubing and instrument delays from measured time series.
100
References
Aimanant, S. and P. J. Ziemann. 2013a. Development of spectrophotometric methods for the
analysis of functional groups in oxidized organic aerosol. Aerosol Sci. Technol., 47:581–
591. doi:10.1080/02786826.2013.773579.
Aimanant, S. and P. J. Ziemann. 2013b. Chemical mechanisms of aging of aerosol formed from
the reaction of n-pentadecane with OH radicals in the presence of NOx. Aerosol Sci.
Technol., 47:979–990. doi:10.1080/02786826.2013.804621.
Alwarda, R., S. Zhou, and J. P. D. Abbatt. 2018. Heterogeneous oxidation of indoor surfaces by
gas-phase hydroxyl radicals. Indoor Air, 00:1-10.
Antonovskii, V. L. and V. A. Terent’ev. 1967. Effect of the structure of hydroperoxides and
some aldehydes on the kinetics of the noncatalytic formation of a-hydroxy peroxides.
Zhurnal Org. Khimii, 3:1011–1015.
Arey, J., A. M. Winer, R. Atkinson, S. M. Aschmann, W. D. Long, C. L. Morrisson, and D. M.
Olszyk. 1991. Terpenes emitted from agricultural species found in California's Central
Valley. J. Geophys. Res., 96:9329-9336.
Atkinson, R. 1997. Gas-phase tropospheric chemistry of volatile organic compounds: 1. Alkanes
and alkenes. J. Phys. Chem. Ref. Data, 26:215–290. doi:10.1063/1.556012.
Atkinson, R., and J. Arey. 2003.Atmospheric degradation of volatile organic compounds. Chem.
Rev., 103:4605–4638. doi:10.1021/cr0206420.
Bennett, D. H., and E. J. Furtaw. 2004. Fugacity-based indoor residential pesticide fate model.
Environ. Sci. Technol., 38:2142-2152.
Bertram, A. K., S. T. Martin, S. J. Hanna, M. L. Smith, A. Bodsworth, Q. Chen, M. Kuwata, A.
Liu, Y. You, and S. R. Zorn. 2011. Predicting the relative humidities of liquid-liquid
101
phase separation, efflorescence, and deliquescence of mixed particles of ammonium
sulfate, organic material, and water using the organic-to-sulfate mass ratio of the particle
and the oxygen-to-carbon elemental ratio of the organic component. Atmos. Chem. Phys.,
11:10995–11006. doi:10.5194/acp-11-10995-2011.
Bertram, T. H., J. R. Kimmel, T. A. Crisp, O. S. Ryder, R. L. N. Yatavelli, J. A. Thornton, M. J.
Cubison, M. Gonin, and D. R. Worsnop. 2011. A field-deployable, chemical ionization
time-of-flight mass spectrometer. Atmos. Meas. Tech., 4:1471-1479.
Bian, Q., A. A. May, S. M. Kreidenweis, and J. R. Pierce. 2015. Investigation of particle and
vapor wall-loss effects on controlled wood-smoke smog-chamber experiments. Atmos.
Chem. Phys., 15:11027-11045. doi:10.5194/acp-15-11027-2015.
Borisova, I. A., V. I. Kadentsev, S. S. Zlotskii, O. S. Chizhov, M. R. Skurko, D. L.
Rakhmankulov and R. A. Karakhanov. 1981. Behavior of acetals under chemical
ionization conditions. Russ. Chem. Bull., 30:1219–1224. doi:10.1007/BF01417976.
Bruckner, R. 2002. Advanced Organic Chemistry. Harcourt/Academic Press, San Diego, CA,
USA.
Burkholder, J. B., S. P. Sander, J. Abbatt, J. R. Barker, R. E. Huie, C. E. Kolb, M. J. Kurylo, V.
L. Orkin, D. M. Wilmouth, and P. H. Wine. 2015. Chemical Kinetics and Photochemical
Data for Use in Atmospheric Studies, Evaluation No. 18. JPL Publication 15-10, Jet
Propulsion Laboratory, Pasadena, CA.
Capouet, M., J. F. Müller, K. Ceulemans, S. Compernolle, L. Vereecken, and J. Peeters. 2008.
Modeling aerosol formation in alpha-pinene photo-oxidation experiments. J. Geophys.
Res., 113:D02308. doi:10.1029/2007JD008995.

102
Chemours: Teflon FEP fluoroplastic film:
https://www.chemours.com/Teflon_Industrial/en_US/assets/downloads/teflon-fep-film-
properties.pdf Accessed July 2017.
Clegg, S. L., P. Brimblecombe, and A. S. Wexler. 1998. A thermodynamic model of the system
H+ - NH4+ - Na+ - SO42- - NO3- - Cl- - H2O at 298.15 K. J. Phys. Chem. A, 102:2155–
2171. doi:10.1021/jp973043j.
Coggon, M. M., B. C. McDonald, A. Vlasenko, P. R. Veres, F. Bernard, A. R. Koss, B. Yuan, J.
B. Gilman, J. Peischl, K. C. Aikin, J. DuRant, C. Warneke, S. M. Li, and J. A. de Gouw.
2018. Diurnal variability and emission pattern of decamethylcyclopentasiloxane (D5)
from the application of personal care products in two North American cities. Environ.
Sci. Technol., 52:5610-5618.
Crounse, J. D., L. B. Nielsen, S. Jørgensen, H. G. Kjaergaard, and P. O. Wennberg. 2013.
Autoxidation of organic compounds in the atmosphere. J. Phys. Chem. Lett., 4:3513–
3520. doi:10.1021/jz4019207.
de Gouw, J. and C. Warneke. 2007. Measurements of volatile organic compounds in the Earth’s
atmosphere using proton-transfer-reaction mass spectrometry. Mass Spec. Rev., 26:223–
257. doi:10.1002/mas.20119.
Docherty, K. S. and P. J. Ziemann. 2003. Effects of stabilized Criegee intermediate and OH
radical scavengers on aerosol formation from reactions of b-pinene with O3. Aerosol Sci.
Technol., 37:877–891. doi:10.1080/02786820300930.
Docherty, K. S. and P. J. Ziemann. 2006. Reaction of oleic acid particles with NO3 radicals:
Products, mechanism, and implications for radical-initiated organic aerosol oxidation. J.
Phys. Chem. A, 110:3567–3577. doi:10.1021/jp0582383.

103
Docherty, K. S., W. Wu, Y. B. Lim, and P. J. Ziemann. 2005. Contributions of organic peroxides
to secondary aerosol formed from reactions of monoterpenes with O3. Environ. Sci.
Technol., 39:4049–4059. doi:10.1021/es050228s.
Donahue, N. M., G. T. Drozd, S. A. Epstein, A. A. Presto, and J. H. Kroll. 2011. Adventures in
ozoneland: Down the rabbit-hole. Phys. Chem. Chem. Phys., 13:10848–10857.
doi:10.1039/c0cp02564j.
Donahue, N. M., A. L. Robinson, C. O. Stainer, and S. N. Pandis. 2006. Coupled partitioning,
dilution, and chemical aging of semivolatile organics. Environ. Sci. Technol., 40:2635–
2643. doi:10.1021/es052297c.
Duncan, S. M., K. G. Sexton, and B. J. Turpin. 2017. Oxygenated VOCs, aqueous chemistry, and
potential impacts on residential indoor air composition. Indoor Air, 28:198-212.
Durham, L. J., C. F. Wurster, and H. S. Mosher. 1958. Peroxides. VIII. The Mechanism for the
thermal decomposition of n-butyl hydroperoxide and n-butyl 1-hydroxybutyl peroxide. J.
Am. Chem. Soc., 80:332–337. doi:10.1021/ja01535a020.
Ehn, M., E. Kleist, H. Junninen, T. Petäjä, G. Lönn, S. Schobesberger, M. Dal Maso, A.
Trimborn, M. Kulmala, D. R. Worsnop, A. Wahner, J. Wildt, and T. F. Mentel. 2012.
Gas phase formation of extremely oxidized pinene reaction products in chamber and
ambient air. Atmos. Chem. Phys., 12:5113–5127. doi:10.5194/acp-12-5113-2012.
Ehn, M., J. A. Thornton, E. Kleist, M. Sipilä, H. Junninen, I. Pullinen, M. Springer, F. Rubach,
R. Tillmann, B. Lee, F. Lopez-Hilfiker, S. Andres, I. H. Acir, M. Rissanen, T. Jokinen, S.
Schobesberger, J. Kangasluoma, J. Kontkanen, T. Nieminen, T. Kurtén, L. B. Nielsen, S.
Jørgensen, H. G. Kjaergaard, M. Canagaratna, M. Dal Maso, T. Berndt, T. Petäjä, A.
Wahner, V.M. Kerminen, M. Kulmala, D. R. Worsnop, J. Wildt, and T. F. Mentel. 2014.

104
A large source of low-volatility secondary organic aerosol. Nature, 506:476–479.
doi:10.1038/nature13032.
Epstein, S. A., S. L. Blair, and S. A. Nizkorodov. 2014. Direct photolysis of a-pinene ozonolysis
secondary organic aerosol: Effect on particle mass and peroxide content. Environ. Sci.
Technol., 48:11251–11258. doi:10.1021/es502350u.
Fadeyi, M. O., C. J. Weschler, K. W. Tham, and Z. M. Sultan. 2013. Impact of human presence
on secondary organic aerosols derived from ozone-initiated chemistry in a sumulated
office environment. Environ. Sci. Technol., 47:3933-3941.
Fischer, A., E. Ljungstrom, and S. Langer. 2013. Ozone removal by occupants in a classroom.
Atmos. Environ., 314:11-17.
Fogler, S. H. 2006. Elements of chemical reaction engineering, 4th ed., Prentice Hall, Upper
Saddle River, NJ
Friedel, R. A., and A. G. Sharkey. 1956. Mass spectra of acetal-type compounds. Anal. Chem.,
28:940–944. doi:10.1021/ac60114a004.
Gao, S., M. Keywood, N. L. Ng, J. Surratt, V. Varutbangkul, R. Bahreini, R. C. Flagan, and J. H.
Seinfeld. 2004. Low-molecular-weight and oligomeric components in secondary organic
aerosol from the ozonolysis of cycloalkenes and a-pinene. J. Phys. Chem. A, 108:10147–
10164. doi:10.1021/jp047466e.
Gao, Y., W. A. Hall, and M. V. Johnston. 2010. Molecular composition of monoterpene
secondary organic aerosol at low mass loading. Environ. Sci. Technol., 44:7897–7902.
doi:10.1021/es101861k.
Gligorovski, S. 2016. Nitrous acid (HONO): An emerging indoor pollutant. J. Photochem.
Photobiol. A, 314:1-5.

105
Griesbaum, K., and J. Neumeister. 1982. Ozonolysis of symmetrically 1,2-disubstituted
ethylenes in HCl/methanol solutions: Acid catalyzed reactions of primary cleavage
products. Chem. Berichte-Recueil, 115:2697–2706. doi:10.1002/cber.19821150803.
Grosjean, D. 1985. Wall loss of gaseous pollutants in outdoor Teflon chambers. Environ. Sci.
Technol., 79:1059–1065. doi:10.1021/es00141a006.
Guiochon, G., A. Felinger, D. G. Shirazi, and A. M. Katti. 2006. Fundamentals of Preparative
and Nonlinear Chromatography, 1st ed., Elsevier Inc, San Diego, CA.
Guo, H., J. Liu, K. D. Froyd, J. M. Roberts, P. R. Veres, P. L. Hayes, J. L. Jimenez, A. Nenes,
and R. J. Weber. 2017. Fine particle pH and gas–particle phase partitioning of inorganic
species in Pasadena, California, during the 2010 CalNex campaign. Atmos. Chem. Phys.,
17:5703–5719. doi:10.5194/acp-17-5703-2017.
Guo, H., L. Xu, A. Bougiatioti, K. M. Cerully, S. L. Capps, J. R. Hite Jr., A. G. Carlton, S.-H.
Lee, M. H. Bergin, N. L. Ng, A. Nenes, and R. J. Weber. 2015. Fine-particle water and
pH in the southeastern United States. Atmos. Chem. Phys., 15:5211–5228.
doi:10.5194/acp-15-5211-2015.
Hallquist, M., J. C. Wenger, U. Baltensperger, Y. Rudich, D. Simpson, M. Claeys, J. Dommen,
N. M. Donahue, C. George, A. H. Goldstein, J. F. Hamilton, H. Herrmann, T. Hoffmann,
Y. Iinuma, M. Jang, M. E. Jenkin, J. L. Jimenez, A. Kiendler-Scharr, W. Maenhaut, G.
McFiggans, T. F. Mentel, A. Monod, A. S. H. Prévôt, J. H. Seinfeld, J. D. Surratt, R.
Szmigielski, and Wildt, J. 2009. The formation, properties and impact of secondary
organic aerosol: Current and emerging issues. Atmos. Chem. Phys., 9:5155–5236.
doi:10.5194/acp-9-5155-2009.

106
Hayes, M. J., and D. C. Pepper. 1961. The solubility of H2SO4 in 1,2-dichloroethane. Trans.
Farad. Soc., 57:432–435. doi:10.1039/TF9615700432.
Holzinger, R., J. Williams, F. Herrmann, J. Lelieveld, N. M. Donahue, and T. Rockmann. 2010.
Aerosol analysis using a Thermal-Desorption Proton-Transfer-Reaction Mass
Spectrometer (TD-PTR-MS): A new approach to study processing of organic aerosols.
Atmos. Chem. Phys., 10:2257–2267. doi:10.5194/acp-10-2257-2010.
Huang, Y., R. Zhao, S. M. Charan, C. M. Kenseth, X. Zhang, and J. H. Seinfeld. 2018. Inified
theory of vapor-wall mass transport in Teflon-walled environmental chambers. Environ.
Sci. Technol., 52:2134-2142.
James, D. H. and C. S. G. Phillips. 1954. The chromatography of gases and vapours. Part III. The
determination of adsorption isotherms, J. Chem. Soc., 1066–1070.
Jimenez, J. L., M. R. Canagaratna, N. M. Donahue, A. S. H. Prevot, Q. Zhang, J. H. Kroll, P. F.
DeCarlo, J. D. Allan, H. Coe, N. L. Ng, A. C. Aiken, K. S. Docherty, I. M. Ulbrich, A. P.
Grieshop, A. L. Robinson, J. Duplissy, J. D. Smith, K. R. Wilson, V. A. Lanz, C.
Hueglin, Y. L. Sun, J. Tian, A. Laaksonen, T. Raatikainen, J. Rautiainen, E. J. Dunlea, J.
A. Huffman, T. B. Onasch, M. R. Alfarra, P. I. Williams, K. Bower, P. Vaattovaara, M.
Ehn, M. Kulmala, J. M. Tomlinson, D. R. Collins, M. J. Cubison, Y. Kondo, J.
Schneider, F. Drewnick, S. Borrmann, S. Weimer, K. Demerjian, D. Salcedo, L. Cottrell,
R. Griffin, A. Takami, T. Miyoshi, S. Hatakeyama, A. Shimono, J. Y Sun, Y. M. Zhang,
K. Dzepina, J. R. Kimmel, D. Sueper, J. T. Jayne, S. C. Herndon, A. M. Trimborn, L. R.
Williams, E. C. Wood, A. M. Middlebrook, C. E. Kolb, U. Baltensperger, and D. R.
Worsnop. 2009. Evolution of organic aerosols in the atmosphere. Science, 326:1525-
1529.

107
Jimenez Group Publications: Pagonis AMT tubing model.
http://cires1.colorado.edu/jimenez/group_pubs.html, last access: November 2017.
Jokinen, T., M. Sipila, H. Juuninen, M. Ehn, G. Lonn, J. Hakala, T. Petaja, R. L. Mauldin III, M.
Kulmala, and D. R. Worsnop. 2012. Atmospheric sulphuric acid and neutral cluster
measurements using CI-APi-TOF. Atmos. Chem. Phys., 12:4117-4125.
Jokinen, T., M. Sipila, S. Richters, V.-M. Kerminen, P. Paasonen, F. Stratman, D. Worsnop, M.
Kulmala, M. Ehn, H. Herrmann, and T. Berndt. 2014. Rapid autoxidation forms highly
oxidized RO2 radicals in the atmosphere. Angew. Comm., 53:14596-14600.
Jokinen, T., T. Berndt, R. Makkonen, V. Kerminen, H. Junninen, P. Paasonen, F. Stratmann, H.
Hermann, A. B. Guenther, D. R. Worsnop, M. Kilmala, M. Ehn, and M. Sipila. 2015.
Production of extremely low volatile organic compounds from biogenic emissions:
Measured yields and atmospheric implications. Proc. Nat. Acad. Sci., 112:7123-7128.
Klepeis, N. E., W. C. Nelson, W. R. Ott, J. P. Robinson, A. M. Tsang, P. Switzer, J. V. Behar, S.
C. Hern, and W. H. Engelmann. and W. H. Engelmann. 2001. The national human
activity pattern survey (NHAPS): A resource for assessing exposure to environmental
pollutants. J. Exp. Sci. & Environ. Epidem., 11:231-252.
Krapf, M., I. El Haddad, E. A. Bruns, U. Molteni, K. R. Daellenbach, A. S. H. Prévôt, U.
Baltensperger, and J. Dommen. 2016. Labile peroxides in secondary organic aerosol.
Chem, 1:603–616. doi:10.1016/j.chempr.2016.09.007.
Krechmer, J.E., M. M. Coggon, P. Massoli, T. B. Nguyen, J. D. Crounse, W. Hu, D. A. Day, G.
S. Tyndall, D. K. Henze, J. C. Rivera-Rios, J. B. Nowak, J. R. Kimmel, R. L. Mauldin, H.
Stark, J. T. Jayne, M. Sipilä, H. Junninen, J. St. Clair, X. Zhang, P. A. Feiner, W. H.
Brune, F. N. Keutsch, P. O. Wennberg, J. H. Seinfeld, D. R. Worsnop, J. L. Jimenez, and

108
M. R. Canagaratna. 2015. Formation of low volatility organic compounds and secondary
organic aerosol from isoprene hydroxyhydroperoxide low-NO oxidation. Environ. Sci.
Technol., 49:10330-10339. doi:10.1021/acs.est.5b02031.
Krechmer, J. E., D. Pagonis, P. J. Ziemann, and J. L. Jimenez. 2016. Quantification of gas-wall
partitioning in Teflon environmental chambers using rapid bursts of low-volatility
oxidized species generated in situ. Environ. Sci. Technol., 50:5757–5765.
doi:10.1021/acs.est.6b00606.
Krechmer, J. E., D. A. Day, P. J. Ziemann, and J. L. Jimenez. 2017. Direct measurements of
gas/particle partitioning and mass accommodation coefficients in environmental
chambers. Environ. Sci. Technol., 51:11867–11875. doi:10.1021/acs.est.7b02144.
Krechmer, J., F. Lopez-Hilfiker, A. Koss, M. Hutterli, C. Stoermer, B. Deming, J. Kimmel, C.
Warneke, R. Holzinger, J. Jayne, D. Worsnop, K. Fuhrer, M. Gonin, and J. de Gouw.
2018. Evaluation of a new reagent-ion source and focusing ion-molecule reactor for use
in proton-transfer-reaction mass spectrometry. Anal. Chem.
Kristensen, K., Å. K. Watne, J. Hammes, A. Lutz, T. Petäjä, M. Hallquist, M. Bilde, and M.
Glasius. 2016. High-molecular weight dimer esters are major products in aerosols from
α-pinene ozonolysis and the boreal forest. Environ. Sci. Technol. Lett., 3:280–285.
doi:10.1021/acs.estlett.6b00152.
Kypri, K., J. Langley, and S. Stephenson. 2005. Episode-centred analysis of drinking to
intoxication in university students. Alcohol Alcohol., 40:447-452.
La, Y. S., M. Camredon, P. J. Ziemann, R. Valorso, A. Matsunaga, V. Lannuque, J. Lee-Taylor,
A. Hodzic, S. Madronich, and B. Aumont. 2016. Impact of chamber wall loss of gaseous
organic compounds on secondary organic aerosol formation: Explicit modeling of SOA

109
formation from alkane and alkene oxidation. Atmos. Chem. Phys., 16:1417–1431.
doi:10.5194/acp-16-1417-2016.
Lin, S. T., L. L. Tien,and N. C. Chang. 1989. Mass spectra of some acetals. Analyst, 114:1083–
1085. doi:10.1039/AN9891401083.
Liu, S., R. Li, R. J. Wild, C. Warneke, J. A. de Gouw, S. S. Brown, S. L. Miller, J. C. Luongo,
and P. J. Ziemann. 2016. Contribution of human-related sources to indoor volatile
organic compounds in a university classroom. Indoor Air, 26:925-938.
Liu, S., S. L. Thompson, H. Stark, P. J. Ziemann, and J. L. Jimenez. 2017. Gas-phase carboxylic
acids in a university classroom: Abundance, variability, and sources. Environ. Sci.
Technol., 51:5454-5463.
Matsunaga, A. and P. J. Ziemann. 2009. Yields of β-hydroxynitrates and dihydroxynitrates in
aerosol formed from OH radical-initiated reactions of linear alkenes in the presence of
NOx. J. Phys. Chem. A, 113:599–606. doi:10.1021/jp807764d.
Matsunaga, A. and P. J. Ziemann. 2010. Gas-wall partitioning of organic compounds in a Teflon
film chamber and potential effects on reaction product and aerosol yield measurements.
Aerosol Sci. Technol., 44:881–892. doi:10.1080/02786826.2010.501044.
McDonald, B. C., J. A. de Gouw, J. B. Gilman, S. H. Jathar, A. Akherati, C. D. Cappa, J. L.
Jimenez, J. Lee-Taylor, P. L. Hayes, S. A. McKeen, Y. Y. Cui, S. Kim, D. R. Gentner, G.
Isaacman-VanWertz, A. H. Goldstein, R. A. Harley, G. J. Frost, J. M. Roberts, T. B.
Ryerson, and M. Trainer. 2018. Volatile chemical products are emerging as largest
petrochemical source of urban organic emissions. Science, 359:760-764.
McGillen, M. R., B. F. E. Curchod, R. Chhantyal-Pun, J. M. Beames, N. Watson, M. A. H.
Khan, L. McMahon, D. E. Shallcross, and A. J. Orr-Ewing. 2017. Criegee intermediate-

110
alcohol reactions, a potential source of functionalized hydroperoxides in the atmosphere.
Earth Space Chem., 1:664–672. doi:10.1021/acsearthspacechem.7b00108.
McLafferty, F. W. 2012. Mass Spectrometry of Organic Ions. Fourth Ed. University Science
Books, Sausalito, CA, USA.
McMurry, P. H. and M. R. Stolzenburg. 1987. Mass accommodation coefficients from
penetration measurements in laminar tube flow. Atmos. Environ., 21:1231–1234.
doi:10.1016/0004-6981(87)90251-4.
McVay, R. C., C. D. Cappa, and J. H. Seinfeld. 2014. Vapor-wall deposition in chambers:
Theoretical considerations. Environ. Sci. Technol., 48:10251–10258.
doi:10.1021/es502170j.
Mertes, P., L. Pfaffenberger, J. Dommen, M. Kalberer, and U. Baltensperger. 2012.
Development of a sensitive long path absorption photometer to quantify peroxides in
aerosol particles (Peroxide-LOPAP). Atmos. Meas. Tech., 5:2339–2348.
doi:10.5194/amt-5-2339-2012.
Mikoviny, T., L. Kaser, and A. Wisthaler. 2010. Development and characterization of a High-
Temperature Proton-Transfer-Reaction Mass Spectrometer (HT-PTR-MS). Atmos. Meas.
Tech., 3: 537–544. doi:10.5194/amt-3-537-2010.
Müller, L., M. C. Reinnig, J. Warnke, and T. Hoffmann. 2008. Unambiguous identification of
esters as oligomers in secondary organic aerosol formed from cyclohexene and
cyclohexene/α-pinene ozonolysis. Atmos. Chem. Phys., 8:1423–1433. doi:10.5194/acp-8-
1423-2008.
Mutzel, A., L. Poulain, T. Berndt, Y. Iinuma, M. Rodigast, O. Böge, S. Richters, G. Spindler, M.
Sipila¨, T. Jokinen, M. Kulmala, and H. Herrmann. 2015. Highly oxidized
111
multifunctional organic compounds observed in tropospheric particles: A field and
laboratory study. Environ. Sci. Technol., 49:7754–7761. doi:10.1021/acs.est.5b00885.
Orlando, J. J. and G. S. Tyndall. 2012. Laboratory studies of organic peroxy radical chemistry:
an overview with emphasis on recent issues of atmospheric significance. Chem. Soc.
Rev., 41:6294–6317. doi:10.1039/c2cs35166h.
Pagonis, D., J. E. Krechmer, J. de Gouw, J. L. Jimenez, and P. J. Ziemann. 2017. Effects of gas–
wall partitioning in Teflon tubing and instrumentation on time-resolved measurements of
gas-phase organic compounds. Atmos. Meas. Tech., 10:4687-4696.
Pankow, J. F. and W. E. Asher. 2008. SIMPOL.1: A simple group contribution method for
predicting vapor pressures and enthalpies of vaporization of multifunctional organic
compounds. Atmos. Chem. Phys. 8:2773-2796. doi:10.5194/acpd-7-11839-2007.
Pankow, J. F.: An absorption model of gas/particle partitioning of organic compounds in the
atmosphere, Atmos. Environ., 28, 185–188, doi:10.1016/1352-2310(94)90093-0, 1994.
Park, J. H., A. H. Goldstein, J. Timkovsky, S. Fares, R. Weber, J. Karlik, and R. Holzinger.
2013. Eddy covariance emission and deposition flux measurements using proton transfer
reaction - time of flight - mass spectrometry (PTR-TOF-MS): Comparison with PTR-MS
measured vertical gradients and fluxes. Atmos. Chem. Phys., 13:1439–1456,
doi:10.5194/acp-13-1439-2013.
Peng, Z., D. A. Day, H. Stark, R. Li, B. B. Palm, W. H. Brune, J. L. Jimenez. 2015. HOx radical
chemistry in oxidation flow reactors with low-pressure mercury lamps systematically
examined by modeling. Atmos. Meas. Tech., 8:4863−4890. doi:10.5194/amt-8-4863-
2015.
Poole, C. F. 2003. The Essence of Chromatography, 1st ed., Elsevier, Boston, MA.

112
Pope III, C. A., R. T. Burnett, D. Krewski, M. Jerrett, Y. Shi, E. E. Calle, and M. J. Thun. 2009.
Cardiovascular mortality and exposure to airborne fine particulate matter and cigarette
smoke. Circulation, 120:941-948.
Praske, E., R. V. Otkjær, J. D. Crounse, J. C. Hethcox, B. M. Stoltz, H. G. Kjaergaard, and P. O.
Wennberg. 2018. Atmospheric autoxidation is increasingly important in urban and
suburban North America. Proceed. Natl. Acad. Sci. USA, 115:64–69.
doi:10.1073/pnas.1715540115.
Ranney, A. P. and P. J. Ziemann. 2016. Kinetics of acid-catalyzed dehydration of cyclic
hemiacetals in organic aerosol particles in equilibrium with nitric scid vapor. J. Phys.
Chem. A, 120:2561–2568. doi:10.1021/acs.jpca.6b01402.
Ranney, A. P. and P. J. Ziemann. 2017 Identification and quantification of oxidized organic
aerosol compounds using derivatization, liquid chromatography,and chemical ionization
mass spectrometry. Aerosol Sci. Technol., 51:342–353.
doi:10.1080/02786826.2016.1271108.
Raventos-Duran, T., M. Camderon, R. Valorso, C. Mouchel-Vallon, and B. Aumont. 2010.
Structure-activity relationships to estimate the effective Henry’s law constants of
organics of atmospheric interest. Atmos. Chem. Phys., 10:7643-7654.
Reiss, R., P. B. Ryan, and P. Koutrakis. 1994. Modeling ozone deposition onto indoor residential
surfaces. Environ. Sci. Technol., 28:303-307.
Riva, M., S. H. Budisulistiorini, Z. Zhang, A. Gold, J. A. Thornton, B. J. Turpin, and J. D. Suratt.
2017. Multiphase reactivity of gaseous hydroperoxide oligomers produced from isoprene
ozonolysis in the presence of acidified aerosols. Atmos. Environ., 152:314–322.
doi:10.1016/j.atmosenv.2016.12.040.

113
Sander, S. P., R. R. Friedl, D. M. Golden, M. J. Kurylo, R. E. Huie, V. L. Orkin, B. J. Finlayson-
Pitts. 2003. Chemical kinetics and photochemical data for use in atmospheric studies. JPL
Publication 02-05.
Schay, G. and G. Szekely. 1954. Gas adsorption measurements in flow systems. Acta Chim.,
5:167-182.
Schuhfried, E., E. Aprea, L. Cappellin, C. Soukoulis, R. Viola, T. D. Märk, F. Gasperi, and F.
Biasioli. 2012. Desorption kinetics with PTR-MS: Isothermal differential desorption
kinetics from a heterogeneous inlet surface at ambient pressure and a new concept for
compound identification. Int. J. Mass Spectrom., 314:33–41,
doi:10.1016/j.ijms.2012.01.013.
Schwarzenbach, R. P., P. M. Gschwend, and D. M. Imboden. 2003. Environmental Organic
Chemistry. JohnWiley & Sons, Inc., Hoboken, NJ, USA.
SDBSWeb : http://sdbs.db.aist.go.jp National Institute of Advanced Industrial Science and
Technology. Accessed December 2017.
Shiraiwa, M., L. D. Yee, K. A. Schilling, C. L. Loza, J. S. Craven, A. Zuend, P. J. Ziemann, and
J. H. Seinfeld. 2013. Size distribution dynamics reveal particle-phase chemistry in
organic aerosol formation. Proc. Natl. Acad. Sci. U. S. A., 110:11746–11750.
doi:10.1073/pnas.1307501110.
Skoog, D. A., F. J. Holler, and S. R. Crouch. 2007. Principles of Instrumental Analysis, Cengage
Learning, Boston, MA..
Stark, H., B. M. Lerner, R. Schmitt, R. Jakoubek, E. J. Williams, T. B. Ryerson, F. C.
Fehsenfeld. 2007. Atmospheric in situ measurement of nitrate radical (NO3) and other

114
photolysis rates using spectroradiometry and filter radiometry. J. Geophys. Res. Atmos.,
112:D10.
Stark, H., R. L. N. Yatavelli, S. L. Thompson, J. R. Kimmel, M. J. Cubison, P. S. Chhabra, M. R.
Canagaratna, J. T. Jayne, D. R. Worsnop, and J. L. Jimenez. 2015. Methods to extract
molecular and bulk chemical information from series of complex mass spectra with
limited mass resolution. Int. J. of Mass Spectrom., 389:26-38.
doi:10.1016/j.ijms.2015.08.011.
Stark, H., R. L. N. Yatavelli, S. L. Thompson, H. Kang, J. E. Krechmer, J. R. Kimmel, B. B.
Palm, W. Hu, P. L. Hayes, D. A. Day, P. Campuzano Jost, M. R. Canagaratna, J. T.
Jayne, D. R. Worsnop, and J. L. Jimenez. 2017. Impact of thermal decomposition on
thermal desorption instruments: advantage of thermogram analysis for quantifying
volatility distributions of organic species. Environ. Sci. Technol., 51:8491-8500.
doi:10.1021/acs.est.7b00160.
Stein, S.E. 2016. Mass Spectra., in NIST Chemistry WebBook, NIST Standard Reference
Database Number 69, Eds. Linstrom, P. J. and Mallard, W. G., National Institute of
Standards and Technology, Gaithersburg, MD 20899.
Tang, X., P. K. Misztal, W. W. Nazaroff, and A. H. Goldstein. 2015. Siloxanes are the most
abundant volatile organic compound emitted from engineering students in a classroom.
Environ. Sci. Technol. Lett., 2:303-307.
Tang, X., P. K. Misztal, W. W. Nazaroff, and A. H. Goldstein. 2016. Volatile organic compound
emissions from humans indoors. Environ. Sci. Technol., 50:12686-12694.
Tobias, H. J. and P. J. Ziemann. 2000. Thermal desorption mass spectrometric analysis of
organic aerosol formed from reactions of 1-tetradecene and O3 in the presence of

115
alcohols and carboxylic acids. Environ. Sci. Technol., 34:2105–2115.
doi:10.1021/es9907156.
Tobias, H. J. and P. J. Ziemann. 2001. Kinetics of the gas-phase reactions of alcohols, aldehydes,
carboxylic acids, and water with the C13 stabilized Criegee intermediate formed from
ozonolysis of 1-tetradecene. J. Phys. Chem. A, 105:6129–6135. doi:10.1021/jp004631r.
Tobias, H. J., P. M. Kooiman, K. S. Docherty, and P. J. Ziemann. 2000. Real-time chemical
analysis of organic aerosols using a thermal desorption particle beam mass spectrometer.
Aerosol Sci. Technol., 33:170–190. doi:10.1080/027868200410912.
Tokarev, A., K. Friess, J. Machkova, M. Šipek, Yu. Yampolskii. 2006. Sorption and diffusion of
organic vapors in amorphous Teflon AF2400. J. Polymer Sci. B, 44:832–844.
doi:10.1002/polb.20725.
Tucker, W. A. and L. H. Nelken. 1982. Diffusion coefficients in air and water, in Handbook of
Chemical Property Estimation Methods, edited by Lyman, W. J., Reehl, W. F., and
Rosenblatt, D. H., McGraw-Hill, New York, NY., 17.1-17.35.
Ulbrich, I. M., M. R. Canagaratna, Q. Zhang, D. R. Worsnop, and J. L. Jimenez. Interpretation of
organic components from positive matrix factorization of aerosol mass spectrometric
data. Atmos. Chem. Phys., 9:2891-2918. doi:10.5194/acp-9-2891-2009.
Veres, P. R., P. Faber, F. Drewnick, J. Lelieveld, and J. Williams. 2013. Anthropogenic sources
of VOC in a football stadium: Assessing human emissions in the atmosphere. Atmos.
Environ., 77:1025-1059.
Vinnik, M. I. and P. A. Obraztsov. 1990. The mechanism of the dehydration of alcohols and the
hydration of alkenes in acid solution. Russ. Chem. Rev., 59:63–77.
doi:10.1070/RC1990v059n01ABEH003510.

116
Waring, M. S., and J. R. Wells. 2015. Volatile organic compound conversion by ozone, hydroxyl
radicals, and nitrate radicals in residential indoor air: Magnitudes and impacts of oxidant
sources. Atmos. Environ., 106:382-391.
Warneke, C., J. A. De Gouw, W. C. Kuster, P. D. Goldan, and R. Fall. 2003. Validation of
atmospheric VOC measurements by proton-transfer-reaction mass spectrometry using a
gas-chromatographic preseparation method. Environ. Sci. Technol., 37:2494–2501.
doi:10.1021/es026266i.
Warneke, C., J. A. de Gouw, J. S. Holloway, J. Peischl, T. B. Ryerson, E. Atlas, D. Blake, M.
Trainer, and D. D. Parrish. 2012. Multiyear trends in volatile organic compounds in Los
Angeles, California: Five decades of decreasing emissions. J. Geophys. Res.,
117:D00V17.
Weschler, C. J., and N. Carslaw. 2018. Indoor chemistry. Environ. Sci. Technol., 52:2419-2428.
Weschler, C. J., and W. W. Nazaroff. 2017. Growth of organic films on indoor surfaces. Indoor
Air., 27:1101-1112.
Wexler, A. S. and S. L. Clegg. 2002. Atmospheric aerosol models for systems including the ions
H+, NH4+, Na+, SO42–, NO3–, Cl–, Br–, and H2O. J. Geophys. Res., 107:ACH14.1–
ACH14.14. doi:10.1029/2001JD000451.
Wisthaler, A., and C. J. Weschler. 2010. Reactions of ozone with human skin lipids: Sources of
carbonyls, dicarbonyls, and hydroxycarbonyls in indoor air. Proc. Nat. Acad. Sci. U.S.A.,
107:6568-6575.
Won, D., R. Corsi, and M. Rynes. 2001. Sorptive interactions between VOCs and inddor
materials. Indoor Air, 11:246-256.

117
Wong, J. P. S., N. Carslow, R. Zhao, S. Zhou, and J. P. D. Abbatt. 2017. Observations and
impacts of bleach washing on indoor chlorine chemistry. Indoor Air, 27:1082-1090.
Wong, M. K. C., B. K. Scott, and C. M. Peterson. 1992. Breath acetaldehyde following ethanol
consumption. Alcohol, 9:189-192.
Wright, B. M., T. P. Jones, and A. W. Jones. 1975. Breath alcohol analysis and the blood : breath
ratio. Med. Sci. Law, 15:205-210.
Wurster, C. F., L. J. Durham, and H. S. Mosher. 1958. Peroxides. VII. The thermal
decomposition of primary hydroperoxides. J. Am. Chem. Soc., 80:327–331.
doi:10.1021/ja01535a019.
Ye, P., X. Ding, J. Hakala, V. Hofbauer, E. S. Robinson, and N. M. Donahue. 2016. Vapor wall
loss of semi-volatile organic compounds in a Teflon chamber. Aerosol Sci. Technol.,
50:822–834. doi:10.1080/02786826.2016.1195905.
Yeh, G. K. and P. J. Ziemann. 2015. Gas-wall partitioning of oxygenated organic compounds:
Measurements, structure–activity relationships, and correlation with gas chromatographic
retention factor. Aerosol Sci. Technol., 49:727–738.
doi:10.1080/02786826.2015.1068427.
Yi-Yan, N., R. M. Felder, and W. J. Koros. Selective permeation of hydrocarbon gases in
poly(tetrafluoroethylene) and poly(fluoroethylene-propylene) copolymer. J. Appl. Polym.
Sci., 25:1755–1774. doi:10.1002/app.1980.070250822.
Zelikman, E. S., Y. N. Yur’ev, L. B. Berezova, and V. K. Tsyskovskii. 1971. Ozonolysis of
olefins in the presence of aliphatic alcohols and acids. Zhurnal Org. Khimii1, 7:633–636.

118
Zhang, X., R. H. Schwantes, R. C. McVay, H. Lignell, M. M. Coggon, R. C. Flagan, and J. H.
Seinfeld. 2015. Vapor wall deposition in Teflon chambers. Atmos. Chem. Phys.,
15:4197–4214. doi:10.5194/acp-15-4197-2015.
Zhang, Y., Y. Chen, A. T. Lambe, N. E. Olson, Z. Lei, R. L. Craig, Z. Zhang, A. Gold, T. B.
Onasch, J. T. Jayne, D. R. Worsnop, C. J. Gaston, J. A. Thornton, W. Vizuete, A. P. Ault,
and J. D. Surratt. 2018. Effect of the aerosol-phase state on secondary organic aerosol
formation from the reactive uptake of isoprene-derived epoxydiols (IEPOX). Environ.
Sci. Technol. Lett., 5:167–174. doi:10.1021/acs.estlett.8b00044.
Zhou, S., M. W. Forbes, and J. P. D. Abbatt. 2016. Kinetics and products from heterogeneous
oxidation of squalene with ozone. Environ. Sci. Technol., 50:11688-11697.
Ziemann, P. J. 2002. Evidence for low-volatility diacyl peroxides as a nucleating agent and
major component of aerosol formed from reactions of O3 with cyclohexene and
homologous compounds. J. Phys. Chem. A, 106:4390–4402. doi:10.1021/jp012925m.
Ziemann, P. J. 2003. Formation of alkoxyhydroperoxy aldehydes and cyclic peroxyhemiacetals
from reactions of cyclic alkenes with O3 in the presence of alcohols. J. Phys. Chem. A,
107:2048–2060. doi:10.1021/jp022114y.
Ziemann, P. J. and R. Atkinson. 2012. Kinetics, products, and mechanisms of secondary organic
aerosol formation. Chem. Soc. Rev., 41:6582–6605. doi:10.1039/c2cs35122f.