Embed Size (px)
Citation preview
FACULTY OF TECHNOLOGY
NITROGEN IN MINING RUNOFF WATERS AT THE SUHANKO
MINE. METHODS TO REDUCE EMISSIONS AND THEIR
ENVIRONMENTAL IMPACTS
Markus Piekkari
Master’s Thesis
Environmental Engineering
January 2014
2
ABSTRACT
FOR THESIS University of Oulu Faculty of Technology
Degree Programme (Bachelor's Thesis, Master’s Thesis) Major Subject (Licentiate Thesis)
Degree Programme of Environmental Engineering
Author Thesis Supervisor
Piekkari, Markus Juhani Ronkanen A-K, PhD (Tech.)
Title of Thesis
Nitrogen in mining runoff waters at the Suhanko mine. Methods to reduce emissions and their environmental
impacts.
Major Subject Type of Thesis Submission Date Number of Pages
Water and Geoenvironmental
engineering
Master’s Thesis January 2014 102 p., 12 App.
Abstract
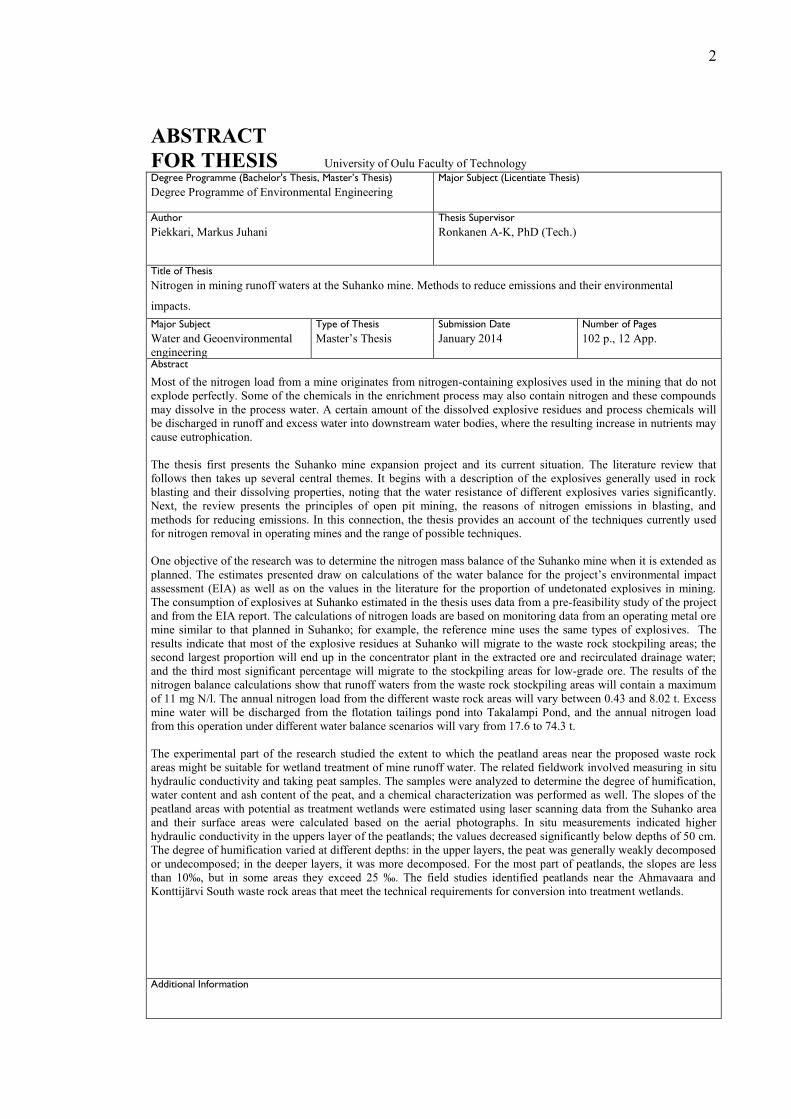
Most of the nitrogen load from a mine originates from nitrogen-containing explosives used in the mining that do not
explode perfectly. Some of the chemicals in the enrichment process may also contain nitrogen and these compounds
may dissolve in the process water. A certain amount of the dissolved explosive residues and process chemicals will
be discharged in runoff and excess water into downstream water bodies, where the resulting increase in nutrients may
cause eutrophication.
The thesis first presents the Suhanko mine expansion project and its current situation. The literature review that
follows then takes up several central themes. It begins with a description of the explosives generally used in rock
blasting and their dissolving properties, noting that the water resistance of different explosives varies significantly.
Next, the review presents the principles of open pit mining, the reasons of nitrogen emissions in blasting, and
methods for reducing emissions. In this connection, the thesis provides an account of the techniques currently used
for nitrogen removal in operating mines and the range of possible techniques.
One objective of the research was to determine the nitrogen mass balance of the Suhanko mine when it is extended as
planned. The estimates presented draw on calculations of the water balance for the project’s environmental impact
assessment (EIA) as well as on the values in the literature for the proportion of undetonated explosives in mining.
The consumption of explosives at Suhanko estimated in the thesis uses data from a pre-feasibility study of the project
and from the EIA report. The calculations of nitrogen loads are based on monitoring data from an operating metal ore
mine similar to that planned in Suhanko; for example, the reference mine uses the same types of explosives. The
results indicate that most of the explosive residues at Suhanko will migrate to the waste rock stockpiling areas; the
second largest proportion will end up in the concentrator plant in the extracted ore and recirculated drainage water;
and the third most significant percentage will migrate to the stockpiling areas for low-grade ore. The results of the
nitrogen balance calculations show that runoff waters from the waste rock stockpiling areas will contain a maximum
of 11 mg N/l. The annual nitrogen load from the different waste rock areas will vary between 0.43 and 8.02 t. Excess
mine water will be discharged from the flotation tailings pond into Takalampi Pond, and the annual nitrogen load
from this operation under different water balance scenarios will vary from 17.6 to 74.3 t.
The experimental part of the research studied the extent to which the peatland areas near the proposed waste rock
areas might be suitable for wetland treatment of mine runoff water. The related fieldwork involved measuring in situ
hydraulic conductivity and taking peat samples. The samples were analyzed to determine the degree of humification,
water content and ash content of the peat, and a chemical characterization was performed as well. The slopes of the
peatland areas with potential as treatment wetlands were estimated using laser scanning data from the Suhanko area
and their surface areas were calculated based on the aerial photographs. In situ measurements indicated higher
hydraulic conductivity in the uppers layer of the peatlands; the values decreased significantly below depths of 50 cm.
The degree of humification varied at different depths: in the upper layers, the peat was generally weakly decomposed
or undecomposed; in the deeper layers, it was more decomposed. For the most part of peatlands, the slopes are less
than 10‰, but in some areas they exceed 25 ‰. The field studies identified peatlands near the Ahmavaara and
Konttijärvi South waste rock areas that meet the technical requirements for conversion into treatment wetlands.
Additional Information
3
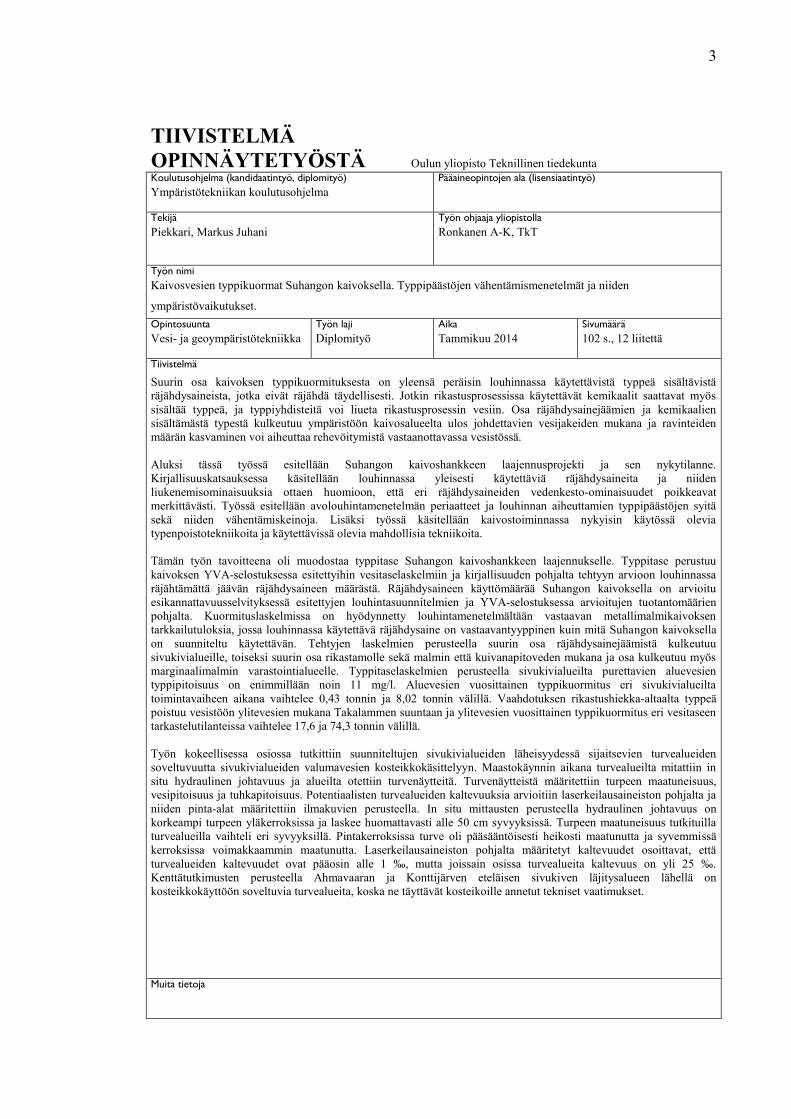
TIIVISTELMÄ
OPINNÄYTETYÖSTÄ Oulun yliopisto Teknillinen tiedekunta
Koulutusohjelma (kandidaatintyö, diplomityö) Pääaineopintojen ala (lisensiaatintyö)
Ympäristötekniikan koulutusohjelma
Tekijä Työn ohjaaja yliopistolla
Piekkari, Markus Juhani Ronkanen A-K, TkT
Työn nimi
Kaivosvesien typpikuormat Suhangon kaivoksella. Typpipäästöjen vähentämismenetelmät ja niiden
ympäristövaikutukset.
Opintosuunta Työn laji Aika Sivumäärä
Vesi- ja geoympäristötekniikka Diplomityö Tammikuu 2014 102 s., 12 liitettä
Tiivistelmä
Suurin osa kaivoksen typpikuormituksesta on yleensä peräisin louhinnassa käytettävistä typpeä sisältävistä
räjähdysaineista, jotka eivät räjähdä täydellisesti. Jotkin rikastusprosessissa käytettävät kemikaalit saattavat myös
sisältää typpeä, ja typpiyhdisteitä voi liueta rikastusprosessin vesiin. Osa räjähdysainejäämien ja kemikaalien
sisältämästä typestä kulkeutuu ympäristöön kaivosalueelta ulos johdettavien vesijakeiden mukana ja ravinteiden
määrän kasvaminen voi aiheuttaa rehevöitymistä vastaanottavassa vesistössä.
Aluksi tässä työssä esitellään Suhangon kaivoshankkeen laajennusprojekti ja sen nykytilanne.
Kirjallisuuskatsauksessa käsitellään louhinnassa yleisesti käytettäviä räjähdysaineita ja niiden
liukenemisominaisuuksia ottaen huomioon, että eri räjähdysaineiden vedenkesto-ominaisuudet poikkeavat
merkittävästi. Työssä esitellään avolouhintamenetelmän periaatteet ja louhinnan aiheuttamien typpipäästöjen syitä
sekä niiden vähentämiskeinoja. Lisäksi työssä käsitellään kaivostoiminnassa nykyisin käytössä olevia
typenpoistotekniikoita ja käytettävissä olevia mahdollisia tekniikoita.
Tämän työn tavoitteena oli muodostaa typpitase Suhangon kaivoshankkeen laajennukselle. Typpitase perustuu
kaivoksen YVA-selostuksessa esitettyihin vesitaselaskelmiin ja kirjallisuuden pohjalta tehtyyn arvioon louhinnassa
räjähtämättä jäävän räjähdysaineen määrästä. Räjähdysaineen käyttömäärää Suhangon kaivoksella on arvioitu
esikannattavuusselvityksessä esitettyjen louhintasuunnitelmien ja YVA-selostuksessa arvioitujen tuotantomäärien
pohjalta. Kuormituslaskelmissa on hyödynnetty louhintamenetelmältään vastaavan metallimalmikaivoksen
tarkkailutuloksia, jossa louhinnassa käytettävä räjähdysaine on vastaavantyyppinen kuin mitä Suhangon kaivoksella
on suunniteltu käytettävän. Tehtyjen laskelmien perusteella suurin osa räjähdysainejäämistä kulkeutuu
sivukivialueille, toiseksi suurin osa rikastamolle sekä malmin että kuivanapitoveden mukana ja osa kulkeutuu myös
marginaalimalmin varastointialueelle. Typpitaselaskelmien perusteella sivukivialueilta purettavien aluevesien
typpipitoisuus on enimmillään noin 11 mg/l. Aluevesien vuosittainen typpikuormitus eri sivukivialueilta
toimintavaiheen aikana vaihtelee 0,43 tonnin ja 8,02 tonnin välillä. Vaahdotuksen rikastushiekka-altaalta typpeä
poistuu vesistöön ylitevesien mukana Takalammen suuntaan ja ylitevesien vuosittainen typpikuormitus eri vesitaseen
tarkastelutilanteissa vaihtelee 17,6 ja 74,3 tonnin välillä.
Työn kokeellisessa osiossa tutkittiin suunniteltujen sivukivialueiden läheisyydessä sijaitsevien turvealueiden
soveltuvuutta sivukivialueiden valumavesien kosteikkokäsittelyyn. Maastokäynnin aikana turvealueilta mitattiin in
situ hydraulinen johtavuus ja alueilta otettiin turvenäytteitä. Turvenäytteistä määritettiin turpeen maatuneisuus,
vesipitoisuus ja tuhkapitoisuus. Potentiaalisten turvealueiden kaltevuuksia arvioitiin laserkeilausaineiston pohjalta ja
niiden pinta-alat määritettiin ilmakuvien perusteella. In situ mittausten perusteella hydraulinen johtavuus on
korkeampi turpeen yläkerroksissa ja laskee huomattavasti alle 50 cm syvyyksissä. Turpeen maatuneisuus tutkituilla
turvealueilla vaihteli eri syvyyksillä. Pintakerroksissa turve oli pääsääntöisesti heikosti maatunutta ja syvemmissä
kerroksissa voimakkaammin maatunutta. Laserkeilausaineiston pohjalta määritetyt kaltevuudet osoittavat, että
turvealueiden kaltevuudet ovat pääosin alle 1 ‰, mutta joissain osissa turvealueita kaltevuus on yli 25 ‰.
Kenttätutkimusten perusteella Ahmavaaran ja Konttijärven eteläisen sivukiven läjitysalueen lähellä on
kosteikkokäyttöön soveltuvia turvealueita, koska ne täyttävät kosteikoille annetut tekniset vaatimukset.
Muita tietoja

4
ACKNOWLEDGEMENTS
This master’s thesis was completed as part of the Suhanko mining project implemented
by Gold Fields Arctic Platinum Oy and the University of Oulu.
Firstly, I would like to thank Gold Fields Arctic Platinum Oy and Erkki Kantola, MSc
(Tech.), for giving me the opportunity to write my thesis on an interesting and topical
issue and for supervising the work. Thanks are also due to my supervisors, Anna-Kaisa
Ronkanen, PhD (Tech.), and Anne Tuomela, MSc (Tech.), as well as to Prof. Kauko
Kujala, PhD (Tech.) and Prof. Bjørn Kløve, PhD (Tech.). In addition, I am grateful to
the employees of Gold Fields Arctic Platinum Oy for their assistance in the field
studies. During the research, I received valuable advice from several persons, of whom
I would like to thank in particular Jaakko Saukkoriipi at Pöyry Finland Oy. Thanks are
also due to Timo Halme of Forcit Oy. The language of the manuscript was checked by
Richard Foley, and I am grateful to him for this work.
Lastly, I would like to express my gratitude to my family and friends, especially Mikko
and Susanna, for their support while I was working on this thesis. Enormous thanks are
also in order to Tiina.
Oulu, 10 January 2014 Markus Piekkari

5
TABLE OF CONTENTS
ABSTRACT ........................................................................................................................... 2
TIIVISTELMÄ ...................................................................................................................... 3
ACKNOWLEDGEMENTS ................................................................................................... 4
TABLE OF CONTENTS ....................................................................................................... 5
1 INTRODUCTION .............................................................................................................. 8
2 THE SUHANKO MINING PROJECT ............................................................................. 10
3 OPEN PIT MINING ......................................................................................................... 12
3.1 Rock blasting explosives ............................................................................................ 13
3.1.1 Different type of explosives .............................................................................. 14
3.1.2 Nitrogen contents .............................................................................................. 16
3.1.3 Solubility........................................................................................................... 17
3.2 Rock blasting theory and explosion chemistry .......................................................... 18
3.3 Principles of mining techniques in open pit mining ................................................... 20
3.3.1 Bench blasting .................................................................................................. 20
3.3.2 Selective blasting .............................................................................................. 22
3.3.3 Drilling and charging ........................................................................................ 22
3.3.4 Specific charge .................................................................................................. 24
3.3.5 Firing systems ................................................................................................... 26
4 SOURCES OF NITROGEN IN MINES .......................................................................... 28
4.1 Nitrogen originating from explosions ........................................................................ 28
4.2 Proportion of undetonated explosives in mining ....................................................... 31
4.3 Nitrogen loads and mitigation measures in operating mines ..................................... 32
5 TREATMENT METHODS AND MITIGATION MEASURES ..................................... 35
5.1 Mitigation measures for nitrogen emissions .............................................................. 36
5.2 The nitrification-denitrification process ..................................................................... 38
5.2.1 Wetland treatment areas on peatland ................................................................ 39
5.2.2 Bioreactors ........................................................................................................ 40
5.2.3 Barrier system ................................................................................................... 40
5.3 Reverse osmosis and membrane separation ............................................................... 41
5.4 Ion exchange .............................................................................................................. 42
5.5 Adsorption .................................................................................................................. 42
6
5.6 Electrocoagulation ...................................................................................................... 42
5.7 Freeze crystallization ................................................................................................. 43
6 ESTIMATION OF NITROGEN MASS BALANCE AND FIELD STUDIES................ 44
6.1 Water balance ............................................................................................................. 44
6.2 Origin of nitrogen and migration of explosive residues in Suhanko mine ................ 48
6.2.1 Open pits ........................................................................................................... 49
6.2.2 Waste rock stockpiling areas ............................................................................ 53
6.2.3 Stockpiling areas for low-grade ore .................................................................. 54
6.2.4 Enrichment process ........................................................................................... 54
6.3 Assumptions regarding the nitrogen balance ............................................................. 55
6.3.1 Explosive residues with rock from open pits .................................................... 55
6.3.2 Explosive residues in runoff waters from waste rock stockpiling areas ........... 55
6.3.3 Explosive residues in open pit drainage water ................................................. 57
6.3.4 Explosive residuals and enrichment chemicals in the concentrator ................. 59
6.4 Field studies ............................................................................................................... 60
6.4.1 Treatment wetlands ........................................................................................... 60
6.4.2 Field studies of peatlands used for wetland treatment ...................................... 61
7 RESULTS ......................................................................................................................... 66
7.1 Estimation of the nitrogen mass balance .................................................................... 66
7.1.1 Explosive residues in rock ................................................................................ 66
7.1.2 Nitrogen load of runoff water from waste rock and low-grade ore
stockpiling areas ............................................................................................... 67
7.1.3 Nitrogen load from open pit drainage water ..................................................... 70
7.1.4 Nitrogen load of process water ......................................................................... 75
7.2 Results of field studies ............................................................................................... 81
7.2.1 In situ hydraulic conductivity and degree of humification ............................... 82
7.2.2 Water content, porosity and ash content ........................................................... 85
7.2.3 Surface slopes and areas of the peatlands ......................................................... 86
8 DISCUSSION ................................................................................................................... 90
8.1 Nitrogen mass balance and quality of runoff water ................................................... 90
8.2 Treatment methods and mitigation measures ............................................................. 93
8.3 Potential treatment wetlands ...................................................................................... 94
8.4 Further investigations ................................................................................................. 95
9 CONCLUSIONS ............................................................................................................... 96

7
10 REFERENCES ................................................................................................................ 98
11 APPENDIXES ............................................................................................................ 11-1
8
1 INTRODUCTION
Mining increases emissions of nitrogen into watercourses. In general, most of the
nitrogen load entering to water bodies from mining originates from explosives, although
some chemicals used in enrichment processes also contain nitrogen. Additionally,
nitrogen occurs naturally at mine sites; for example, mined rock can contain nitrogen,
and air contains 78 % nitrogen, whereby some nitrogen end up in mine water (Atkins et
al. 2006: 349). Some explosive residues and chemicals migrate into the environment in
excess water. This master’s thesis evaluates the sources and amount of nitrogen
originating from explosives and assesses the quality of runoff waters in the area
comprising the Suhanko mine expansion project.
In general, the concentration of nitrogen and phosphorus in the Finnish environment is
quite low, and lack of these nutrients limits eutrophication even where other conditions
would favor it. An increased amount of these nutrients in a recipient water body can
lead to microbial growth, which can be seen in the form of algae blooms and plankton
growth (Lyytimäki & Hakala 2008: 46-47). In addition, ammonia in water is harmful to
aquatic fauna (Kauppila et al 2011: 127).
Gold Fields Arctic Platinum Oy has a mining concession in Suhanko area and the
company holds a valid permit for environmental and water management in the area. The
current permit is specific to open pit mining of the Konttijärvi and Ahmavaara deposits,
with the permitted annual ore mining rate being 10 Mt. In light of previous feasibility
studies, the currently envisaged mining and concentration processes will not be
profitable. Plans call for enhancing the mining process and improving ore beneficiation.
The annual amount of ore production will remain at the currently permitted level and a
hydrometallurgical refining process, the Platsol process, will be added after flotation.
This thesis examines the sources and amount of nitrogen from explosives based on a
literature review, with a focus on how to reduce the amounts of nitrogen from
explosions through proper explosive selection and optimization of blasting techniques.
The review includes data about different types of explosives and their nitrogen content
9
and solubility. In addition, it presents information on how nitrogen loads and mitigation
measures are handled in operating mines.
One major objective of this thesis was to establish estimates for the Suhanko mining
project of the nitrogen mass balance under different weather conditions. The nitrogen
mass balance is based on the water balance analyzed as part of the environmental
impact assessment (EIA) for the mine expansion and the estimated consumption of
explosives in the project. The proportion of undetonated explosive agents in open pit
blasting has been estimated based on a literature review. The solubility of explosives in
the drainage waters of the open pits and the nitrogen migration in blasted rock have also
been assessed. The estimates of the dissolving properties of explosive residues and of
nitrogen loads in runoff water from waste rock stockpiling areas are based on the water
quality monitoring data from an operating mine similar to that planned at Suhanko and
on research carried out by the Geological Survey of Finland (GTK).
The thesis presents different treatment methods which can be used with varying
amounts of water and nitrogen. The target of the experimental study conducted as part
of this research was to find peatland areas near proposed waste rock stockpile areas that
would be suitable for treating nitrogen-containing runoff waters from waste rock
stockpiling areas.
10
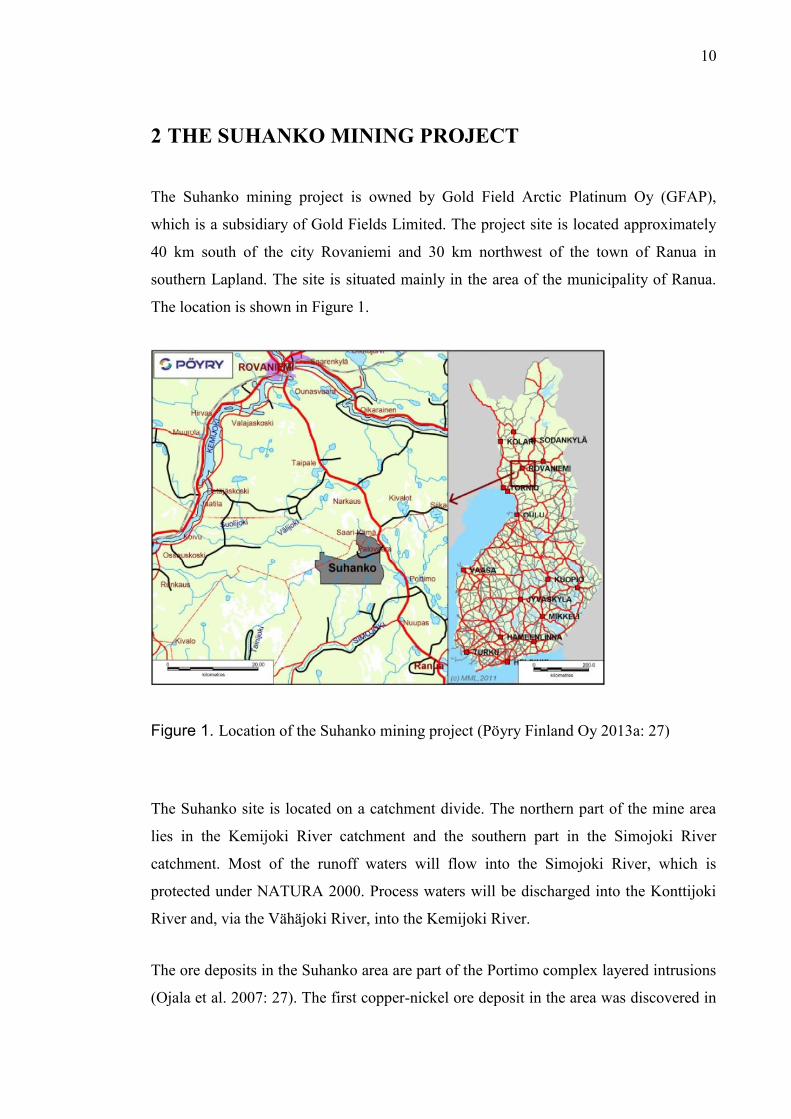
2 THE SUHANKO MINING PROJECT
The Suhanko mining project is owned by Gold Field Arctic Platinum Oy (GFAP),
which is a subsidiary of Gold Fields Limited. The project site is located approximately
40 km south of the city Rovaniemi and 30 km northwest of the town of Ranua in
southern Lapland. The site is situated mainly in the area of the municipality of Ranua.
The location is shown in Figure 1.
Figure 1. Location of the Suhanko mining project (Pöyry Finland Oy 2013a: 27)
The Suhanko site is located on a catchment divide. The northern part of the mine area
lies in the Kemijoki River catchment and the southern part in the Simojoki River
catchment. Most of the runoff waters will flow into the Simojoki River, which is
protected under NATURA 2000. Process waters will be discharged into the Konttijoki
River and, via the Vähäjoki River, into the Kemijoki River.
The ore deposits in the Suhanko area are part of the Portimo complex layered intrusions
(Ojala et al. 2007: 27). The first copper-nickel ore deposit in the area was discovered in

11
1980 by Outokumpu. In 2003, Gold Fields Ltd purchased the project and in 2004 the
name of the company was changed to Gold Fields Arctic Platinum Oy (GFAP) and this
is the company developing the project. In 2005, GFAP prepared a pre-feasibility study
of the Konttijärvi and Ahmavaara open pits in light of the conditions set out in the
current environmental permit. The planned concentration process was traditional
flotation and plans called for shipping the concentrate to a smelter. The quality of the
concentrate was considered unsatisfactory and the project was deemed unprofitable. In
2008, a Canadian company, North American Palladium, and Gold Fields conducted
another pre-feasibility study using the same specifications; the result was also negative.
In late 2008, North American Palladium withdrew from the project and GFAP has
continued the project alone. After 2008, a hydrometallurgical process, known as the
Platsol process, was tested for enriching the concentrate after flotation. In 2010–2011,
the Platsol process was tested in the laboratory and at the pilot scale for ore from
Konttijärvi and Ahmavaara. The results indicated that the process is suitable for use and
that the mining project can be profitable. (Pöyry Finland 2013a: 43). The pre-feasibility
study in 2013 examined three deposits: Konttijärvi, Ahmavaara and Suhanko North.
The main product at Suhanko will be palladium, but other precious metal commodities,
such as platinum and gold, will be produced as well. The base metal commodities to be
produced are copper, nickel and cobalt. (Lycopodium Minerals Pty Ltd 2013: 2.4)
Currently, an environmental impact assessment (EIA) is being carried out for more
extensive mining operations than the company’s presently valid environmental permit
covers. The number of open pits would be increased to six and the area of the mining
concession would be expanded. The objective of the expansion project is to exploit the
Konttijärvi and Ahmavaara deposits to a greater extent than the current environmental
permit allows. In addition, four new open pits - Suhanko North, Tuumasuo, Vaaralampi
and Little Suhanko deposit – would be mined. The projected total amount of ore to be
mined in the expansion project is around 310 Mt. (Pöyry Finland 2013a: 44)
12
3 OPEN PIT MINING
Every mining project is unique. In the mining industry, the objective is to extract the
largest possible quantity of valuable resources from the ground in a cost-effective way
(Bhandari 1997, XI). Generally, mining can be done as open pit or underground mining.
Both methods may be used simultaneously or production can be shifted to underground
mining after open pit mining. The selection of mining method depends on the
properties, location and shape of the ore body. The grade of ore also has an impact on
the selection of mining method. The mining method is then one factor influencing the
choice of explosives. (Merta & Kaartinen 2013: 12)
In practice, open pit mining is more economical than underground mining, but the
determination of the most suitable mining method depends on the position of the ore
body. If ore deposits are situated under a water body or deep in bedrock, underground
mining may be the only choice. Open pit mining changes the environment and
landscape radically. (Hakanpää & Lappalainen 2010: 92)
When planning a new mine, it is important to ascertain certain basic information about
the ore deposit and bedrock. In open pit mining, for example, the properties of the rock
mass, suitable slopes for open pits and the height and the width of the benches should be
evaluated. The optimum size of the open pits has to be calculated and the boundaries of
the mining works set. (Hakanpää & Lappalainen 2011: 72) The optimal depth and the
form of the open pit depend on the waste rock/ore stripping ratio, the costs of mining,
the recovery of ore and the dilution of ore during mining (Hakanpää & Lappalainen
2010: 100). The shape of the ore body affects the amount of waste rock that has to be
mined. If the ore body extends to the ground surface, the mining of ore can be started
without massive waste rock mining. But if the ore body is located under the ground
surface, the waste rock has to be removed before the ore can be mined. As mining
progresses, the amount of waste rock increases, because the pit has to be extended
continually. The amount of waste rock should be kept to a minimum.
A special feature of open pit mining is that intermediate stockpiles of excavated rock are
commonly used. Some ore-bearing rock is extracted during waste rock mining, but the

13
grade of this rock will be so low that it is not profitable to process it. Usually the best
part of the mixed waste rock and low-grade ore is heaped in intermediate stockpiling
areas, where it can wait to be processed until the open pits are closed. Different types of
ore, low-grade ore and waste rock are heaped continuously in stockpiling areas. It is
also possible that many open pits operate simultaneously and that the quality of the ore
from the different pits varies. (Hakanpää & Lappalainen 2011: 78)
3.1 Rock blasting explosives
Explosives are used in open pit mining to extract rock from the ground by blasting.
Because the quality of rock masses and the structure of rock are not constant, and the
properties of the explosives used are different, the requirements regarding the use of
explosives vary in every open pit (Vuolio & Halonen 2012: 125). Blasting is typically
the primary rock fragmentation method in mining (Seppälä 2011: 9).
There are two fundamentally different kinds of explosive materials, single explosive
substances and composite explosive mixtures. Single explosives are chemical
substances that contain all the compounds needed for an explosion. The molecules
decompose mainly into gaseous reaction products, such as carbon dioxide (CO2),
nitrogen gas (N2) and water (H2O). Trinitrotoluene (TNT) and nitroglycerin (NG) are
examples of single explosive substances. A composite explosive can be a mixture of
two single explosive substances, a mixture of a fuel and an oxidizer, or an intermediate
mixture containing one or more single explosive substances together with fuel and
oxidizer ingredients. Most rock blasting explosives are composites containing single
explosive substances as well as a fuel and oxidizer. (Persson et al. 2001: 66)
Explosives are divided into two groups: primary and secondary explosives. Primary
explosives are cap sensitive and can be ignited by a detonator. A detonator is a device
which contains a detonation charge that is used to initiate a primary explosive (Olofsson
1990: 7). Secondary explosives are not cap sensitive and have to be initiated by a
primer, which is a primary explosive. An explosive that needs a highly explosive primer
to initiate it is also called a blasting agent (Bhandari 1997: 10). Blasting agent
ingredients are not classified as explosives (Olofsson 1990: 18).
14
The most important technical properties of explosives used in surface rock excavations
are safety in handling, efficiency and stability. Easy detonation, non-toxicity, water
resistance and good storage properties are also important. In a cold environment,
resistance to freezing is necessary. (Heiniö 1999: 93) The efficiency and stability of an
explosive determines the way it is used in blasting. The other characteristics should be
more or less common to all explosives.
3.1.1 Different type of explosives
The following sections present explosives commonly used in rock blasting and mining.
Explosives used in mining can be divided into dynamite explosives, ANFO explosives,
water-gel and slurry explosives, and emulsion explosives (Persson et al. 2001: 74–77,
Merta & Kaartinen 2013: 8).
Dynamite explosives
The classic dynamite explosives contain nitroglycerin (NG) and nitroglycol (EGDN)
(Persson et al. 2001: 75). Today, dynamite contains only nitroglycol. Dynamites used in
rock blasting contain oxidizers, such as ammonium nitrate or sodium nitrate, and fuels,
such as wood-meal. (Vuolio & Halonen 2012: 60) Nowadays nitroglycerin has been
replaced for the most part by ammonium nitrate (Heiniö 1999: 101). Dynamite is a
highly adaptable cartridge explosive which is widely used because of its excellent
performance in smaller-diameter holes. If mining takes place in sub-freezing
temperatures, nitroglycerin cannot be used, because its freezing point is +3o C
(Persson
et.al 2001: 75).
The water resistance of dynamite depends on the amount of nitroglycerin in it. The
higher the proportion of nitroglycerin, the more water resistant the explosive becomes
(Heiniö 1999: 102). Compared to emulsion explosives, almost all dynamite explosives
are cap sensitive. A blasting cap containing less than 1 g of a high explosive can be used
to initiate dynamite (Persson et al. 2001: 75).
15
ANFO
A mixture of ammonium nitrate (AN) and fuel oil (FO) is called ANFO (Bhandari 1997:
13). The ammonium nitrate acts as an oxidizer and the fuel oil as the fuel. ANFO offers
great economy and safety in blasting applications, but it is not water resistant. ANFO is
not ignition sensitive and it cannot be detonated by a normal detonator. ANFO must be
initiated with a cap-sensitive primer, for example dynamite (Vuolio & Halonen 2012:
59). The velocity of detonation (VOD) of ANFO is typically between 2000 and 4400
m/s (Heiniö 1999: 103).
Slurries and water-gels
Slurry explosives, also known as water-gel explosives, are designed to be used in large-
hole blasting and wet conditions. Slurries are not cap sensitive and therefore must be
initiated with a primer such as ANFO (Heiniö 1999: 103). A slurry contains ammonium
nitrate and often aluminum, water and substances to keep the slurry homogenous. In
some cases, a slurry can contain trinitrotoluene (TNT). In many cases, emulsion
explosives have replaced slurry explosives (Merta & Kaartinen 2013: 8). The detonation
velocity of a slurry explosive is typically from 3400 to 5500 m/s (Heiniö 1999: 104).
Emulsion explosives
Emulsion explosives are a mixture of fuel and oxidant components. The oxidizer is
generally ammonium nitrate and the fuel most often consists of mineral or organic
hydrocarbon derivatives. The structure of the emulsion exhibits a polyhedral shape, with
each droplet surrounded by a thin film of oil. (Heiniö 1999: 103) This structure leads to
excellent water resistance. The extremely small droplet size and the submicron
thickness of the oil film provide an excellent contact surface between the fuel and the
oxidizer. Emulsion explosives with different levels of sensitivity can be produced by
adding gas bubbles or microballoons. (Persson et al. 2001: 76) The strength of emulsion
explosives can be adjusted by adding aluminum powder and micro balloons or by
changing the proportions of fuel and oxidant. In general, the oxidant/fuel ratio in
emulsion explosives is approximately 10:1 (Heiniö 1999: 104–105). Accordingly,
16
emulsion explosives can be as strong as dynamite or as weak as the explosives used in
cautious blasting (Vuolio & Halonen 2012: 59).
Emulsion explosives are also known as water-on-oil emulsions, where oil acts as a
continuous phase (Merta & Kaartinen 2013: 8). The viscosity and density of an
emulsion explosive is largely determined by the physical characteristics of the organic
fuel phase, which can vary from liquid fuel oil to viscous waxes. The detonation
velocity of emulsion explosive is typically from 5000 to 6000 m/s. (Heiniö 1999: 104)
A mixture of ANFO and emulsion explosive is called “heavy ANFO”. In heavy ANFO,
the free space between ANFO prills is filled with emulsion explosive. If the amount of
emulsion explosive exceeds 50 %, the mixture is called an emulsion explosive. Heavy
ANFO is a very widely used explosive because it has the advantages of both ANFO and
emulsion explosives. Heavy ANFO is as effective as a pure emulsion and slightly
cheaper and has better water resistance than regular ANFO. (Vuolio & Halonen 2012:
59). In addition, heavy ANFO has a higher energy content per mass unit than an
emulsion explosive does (Persson et al. 2001: 76).
3.1.2 Nitrogen contents
Almost every explosive that is used in mining contains nitrogen. Different explosives
usually contain water-soluble salts or hygroscopic salts such as nitrogen-rich
ammonium nitrate (NH4NO3) (Forsyth et al. 1995: 796). The higher the nitrogen content
of an explosive is, the higher the potential nitrogen load from the explosion. In general,
the nitrogen content of different rock blasting explosives varies between 20–30 % of
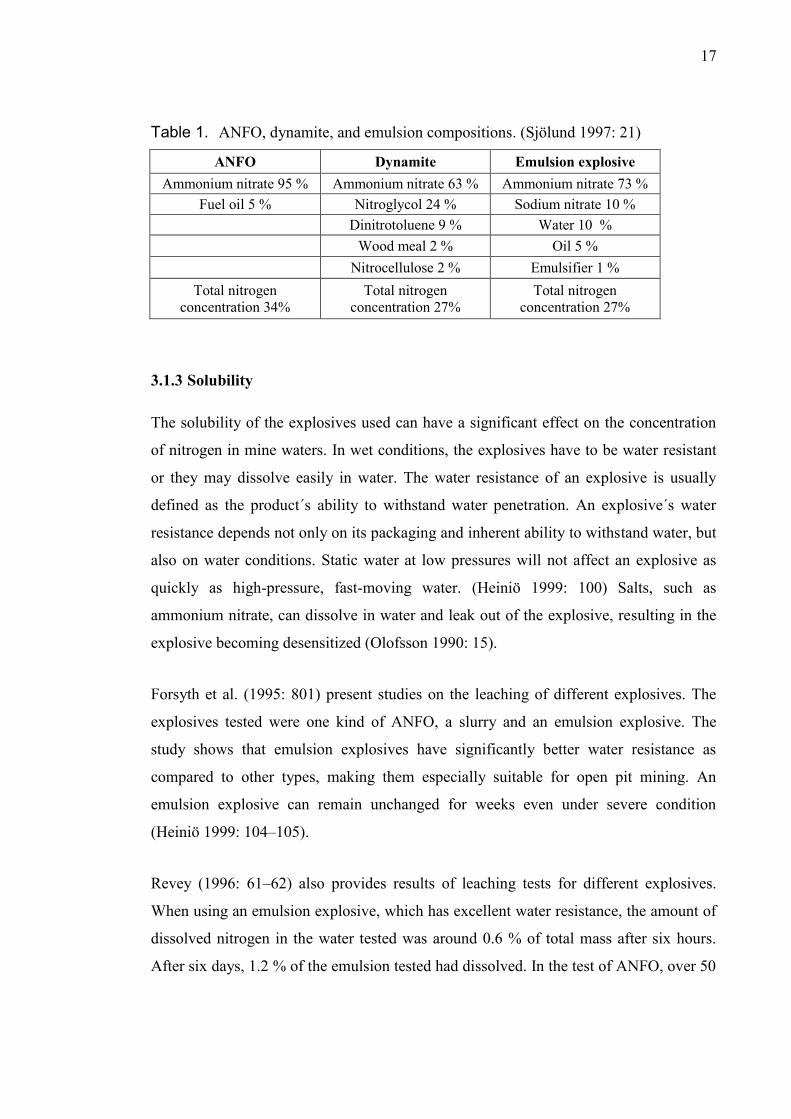
total weight (Chlot 2011: 6). Sjölund (1997: 21) states that the total nitrogen content of
one kind of emulsion explosive, as well as of dynamite, is 27 %, and that the total
nitrogen content in ANFO is higher (34 %) (Table 1). In some mines, for example the
Kiruna mine, emulsion explosive with a nitrogen content of 24 % is used. (Lindeström
2012: 13). In one other mine (Kittilä) where emulsion explosive is used, the ammonium
nitrate content of the explosive used was found to be 75–89 % by weight, which
represents a nitrogen concentration in the explosives of between 26 and 30 % by weight
(Pöyry Finland Oy 2012a: 32).
17
Table 1. ANFO, dynamite, and emulsion compositions. (Sjölund 1997: 21)
ANFO Dynamite Emulsion explosive
Ammonium nitrate 95 % Ammonium nitrate 63 % Ammonium nitrate 73 %
Fuel oil 5 % Nitroglycol 24 % Sodium nitrate 10 %
Dinitrotoluene 9 % Water 10 %
Wood meal 2 % Oil 5 %
Nitrocellulose 2 % Emulsifier 1 %
Total nitrogen
concentration 34%
Total nitrogen
concentration 27%
Total nitrogen
concentration 27%
3.1.3 Solubility
The solubility of the explosives used can have a significant effect on the concentration
of nitrogen in mine waters. In wet conditions, the explosives have to be water resistant
or they may dissolve easily in water. The water resistance of an explosive is usually
defined as the product´s ability to withstand water penetration. An explosive´s water
resistance depends not only on its packaging and inherent ability to withstand water, but
also on water conditions. Static water at low pressures will not affect an explosive as
quickly as high-pressure, fast-moving water. (Heiniö 1999: 100) Salts, such as
ammonium nitrate, can dissolve in water and leak out of the explosive, resulting in the
explosive becoming desensitized (Olofsson 1990: 15).
Forsyth et al. (1995: 801) present studies on the leaching of different explosives. The
explosives tested were one kind of ANFO, a slurry and an emulsion explosive. The
study shows that emulsion explosives have significantly better water resistance as
compared to other types, making them especially suitable for open pit mining. An
emulsion explosive can remain unchanged for weeks even under severe condition
(Heiniö 1999: 104–105).
Revey (1996: 61–62) also provides results of leaching tests for different explosives.
When using an emulsion explosive, which has excellent water resistance, the amount of
dissolved nitrogen in the water tested was around 0.6 % of total mass after six hours.
After six days, 1.2 % of the emulsion tested had dissolved. In the test of ANFO, over 50
18
% dissolved in one hour, while some 25 % of the water-resistant WR-ANFO dissolved
in that same time. In the case of the water-gel tested, 25% dissolved in six hours.
3.2 Rock blasting theory and explosion chemistry
Rock extraction by blasting can be divided into three principal stages. The first stage of
fragmentation starts from the initiation point, when the charged explosive detonates in
the blasthole. The explosive is ignited by heat, impact, friction or a combination of all
three forces. A detonator is used to ignite the primer, which initiates the explosion
reaction in the charged explosive agent. The force of ignition dissipates very rapidly in a
detonation. In the blasthole, a shock wave emanates from the ignition point, changing
the properties of the explosive agent and making them optimal for detonation. (Vuolio
& Halonen 2012: 57) During detonation, the chemical potential energy of the explosive
is liberated in the form of kinetic energy and large quantities of high-pressure gases and
heat are rapidly released. The gases expand rapidly with great force to overcome the
confining forces of the surrounding rock formation. (Heiniö 1999: 93) The detonation
wave proceeds along the hole very rapidly, at a velocity of 3000 to 6000 m/s. The type
of explosive and diameter of the blasthole affect this velocity. The detonation of the
explosive leads to an outgoing compressive shock wave, which travels through the rock
at a velocity of 4000–5000 m/s depending on the properties of the rock mass. (Persson
et al. 2001: 234–235) Hard rock with a high propagation velocity will be blasted using
an explosive with a high velocity of detonation, whereas explosives with a low velocity
of detonation are suitable for breaking rock with a low propagation velocity (Olofsson
1999: 97). During this first stage of fragmentation, there is practically no breakage, but
high-pressure gases form microscopically small cracks in the rock around the blastholes
(Langefors & Kihlström 1963: 19).
When this compressive shock wave has reached the free surface of the bench, it will
reflect back as tensile and shear waves (Persson et al. 2001: 235). Because most rock
has a much higher compression strength than tensile strength, it is enough that the
rock´s tensile strength is exceeded for it to be broken (Olofsson 1999: 97). In the third
stage of fragmentation, the explosion gases enter cracks in the rock and expand under
high pressure (Langefors & Kihlström 1963: 21).

19
In a bench blasting operation, not all of the expansion energy produced by an explosion
is used. As the rock starts to break, cracks open and the detonation products propagate
and escape through them. In this stage, the initial volume of the blasthole expands to
10–20 times its original size. Only 50–70% of the detonation energy is used for
breaking the rock. When comparing different explosives, it has to be taken into account
that all the energy available in the explosive is not used for breaking rock. Especially for
high-energy explosives, for example aluminized ANFO, the detonation energy is much
higher than in the case of regular ANFO, but the performance of such explosives in
terms of rock breakage is not much higher. (Persson et al. 2001: 116)
During explosion, the explosive burns very fast and an explosive containing ammonium
nitrate will form gaseous products. In an ideal explosion, all explosives degrade into
gaseous form: carbon dioxide, water vapor and nitrogen gas. (Persson et al. 2001: 104)
In an explosion, most of an explosive containing nitrogen will be released into the
atmosphere as nitrogen gas. A less-than-ideal explosion will form carbon monoxide,
nitric oxide (NO) and nitrogen dioxide (NO2) (Forsberg & Åkerlund 1999: 13).
The ideal explosive reaction of ammonium nitrate emulsion explosives does not release
nitrogen monoxide or nitrogen dioxide into the air, because the reaction is balanced.
Ammonium nitrate is converted into nitrogen, water and oxygen and the fuel is
converted into carbon dioxide and water. However, conditions during mine blasting are
never ideal. (Merta & Kaartinen 2013: 11)
The equation for an ideal explosive reaction is the following (fuel oil is indicated as
CH2):
(1)
A non-ideal explosive reaction can be described as follows:
(2)

20
NO reacts with oxygen in the atmosphere to produce nitrogen dioxide.
(3)
The oxygen balance of the explosive product controls the production of CO and NO. An
explosive with excess oxygen produces toxic NO and NO2 and an explosive with an
excess amount of fuel leads to increased CO production (Persson et al. 2001: 110, Merta
& Kaartinen 2013: 19).
3.3 Principles of mining techniques in open pit mining
Traditionally, open pit mining is carried out using the bench blasting technique on a free
face. Another possible technique is selective blasting, which makes it possible to
prevent the horizontal movement of blasted rock. Open pit mining can be divided into
four different operations: drilling, blasting (primary breaking), hammering (secondary
breaking), loading and hauling. (Hakanpää & Lappalainen 2010: 93) In focusing on how
to reduce the amounts of nitrogen from blasting, the most important operations are
drilling, charging and firing.
When optimizing blasting performance, it is important to understand that there are
factors which the blaster can and cannot estimate or control. The major factors that
affect the efficiency of blasting are the properties of the rock mass, the properties of the
explosives, the specific charge, the drilling pattern and initiation delays (Vuolio &
Halonen 2012: 100–101). The practical experience and skills of the blaster are the best
predictors of the blasting results (Persson et al. 2001: 183). The ultimate aim of blasting
operations is to achieve safety in operation, maximal production with satisfactory
fragmentation and minimal dilution and environmental impacts. The blasting technique
used at a given mine will be developed constantly during production and will affect the
rates of emissions into the environment (Bhandari 1997: 7).
3.3.1 Bench blasting
Bench blasting is a very commonly used method in open pit mining. In the technique,
blasting proceeds from the level of the ground surface to the eventual bottom of the pit
21
(Hakanpää & Lappalainen 2010: 93). In bench blasting, the blastholes can have a free
face or fixed bottom (Heiniö 1999: 146).
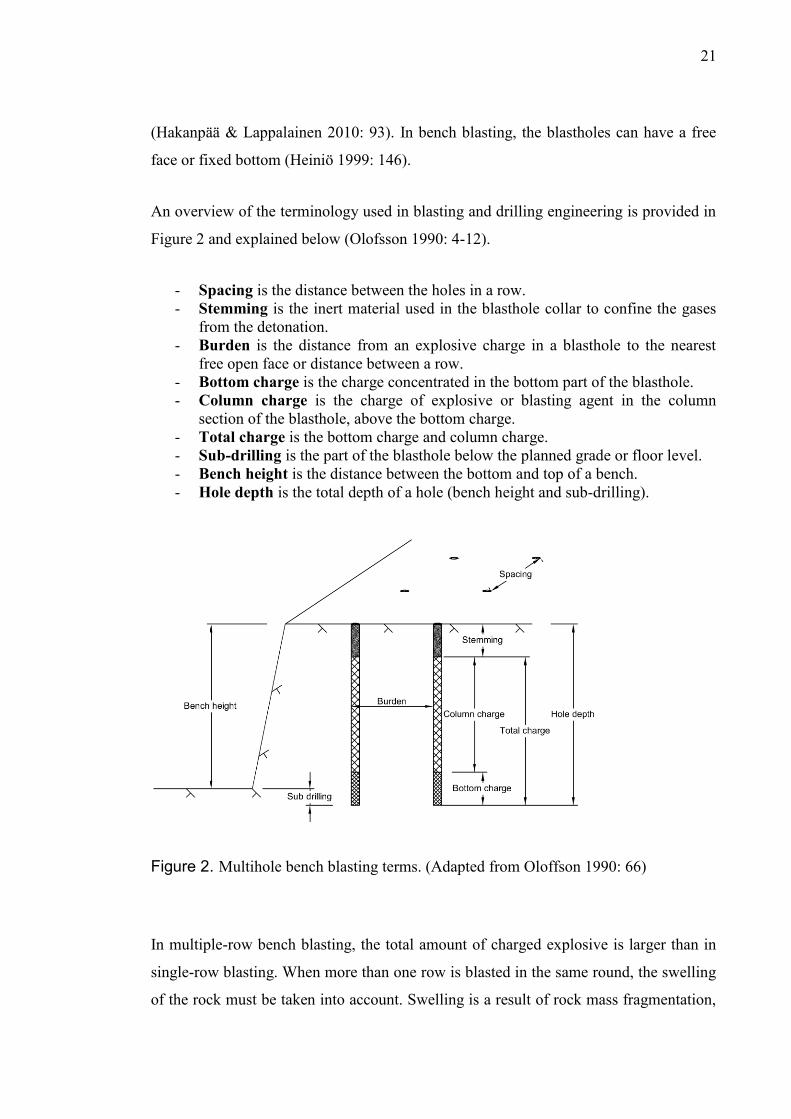
An overview of the terminology used in blasting and drilling engineering is provided in
Figure 2 and explained below (Olofsson 1990: 4-12).
- Spacing is the distance between the holes in a row.
- Stemming is the inert material used in the blasthole collar to confine the gases
from the detonation.
- Burden is the distance from an explosive charge in a blasthole to the nearest
free open face or distance between a row.
- Bottom charge is the charge concentrated in the bottom part of the blasthole.
- Column charge is the charge of explosive or blasting agent in the column
section of the blasthole, above the bottom charge.
- Total charge is the bottom charge and column charge.
- Sub-drilling is the part of the blasthole below the planned grade or floor level.
- Bench height is the distance between the bottom and top of a bench.
- Hole depth is the total depth of a hole (bench height and sub-drilling).
Figure 2. Multihole bench blasting terms. (Adapted from Oloffson 1990: 66)
In multiple-row bench blasting, the total amount of charged explosive is larger than in
single-row blasting. When more than one row is blasted in the same round, the swelling
of the rock must be taken into account. Swelling is a result of rock mass fragmentation,
22
which increases the load of rock in front of each new row (Persson et al. 2001: 207).
Usually the swelling of the rock mass is limited by the size of blasting pattern (Vuolio
& Halonen 2012: 106). In bench blasting, swelling is normally 40–50 % (Heiniö 1999:
152).
3.3.2 Selective blasting
Selective blasting is a variation of bench blasting and is used when higher selectivity
with regard to the ore and waste rock is needed: Ore, low-grade ore and waste rock can
be classified immediately when the extracted rock mass is unloaded from the open pit.
These separated fractions can then be hauled to the concentrator, intermediate storage
areas and stockpiles, respectively. In selective blasting the blastholes are always
vertical. (Hakanpää & Lappalainen 2010: 93).
Selective blasting is a suitable method for mining massive ore deposits. Selective
blasting provides for high production capacity and flexible mining, because hauling and
rock extraction are not interdependent (Hakanpää & Lappalainen 2010: 93). The
consumption of explosives is usually higher when using selective blasting rather than
bench blasting, because during the explosion the rock mass does not have free space to
swell.
3.3.3 Drilling and charging
In open pit mining, vertical or almost vertical drillholes in one or several rows are
drilled and charged. The drillhole diameter chosen depends on the desired production
rate and also influences bench design. Usually a larger drillhole diameter is better.
(Hakanpää & Lappalainen 2010: 94) The larger the drillhole diameter is, the higher the
production rate is when drilling with the same equipment. The rock fragmentation size
tends to increase when the hole length/hole diameter ratio decreases below 60 (Heiniö
1999: 142).
If the drillhole diameter is less than 127 mm, top hammer drilling is a suitable method.
When the hole diameter is between 127–180 mm, a top hammer drill or down-the-hole
23
(DTH) drill is the best option. If the hole diameter is above 200 mm, rotary crushing is
used. (Hakanpää & Lappalainen 2010: 149–150)
The charging method depends on the blasthole diameters used. Blasthole diameters can
be divided into three classes: small (<50 mm), medium (50-100 mm) and large
(>100mm). Small-diameter holes are usually shallow and the inclination can range from
vertically down to horizontal. The holes are usually charged with high explosives. The
inclinations of medium-sized blastholes are regularly vertical or close to vertical
downwards. The main charge may either be a high explosive or a blasting agent. If a
blasting agent is used, the holes will be primed with a high explosive. Large blastholes
are used most commonly in large-scale mining. In that case, the inclination of the
blasthole is usually vertical and the explosives are normally blasting agents primed with
a high explosive. (Olofsson 1990)
In large-scale mining with large-diameter blastholes, the blasting agents may be charged
into the drillhole by a pump truck (Olofsson 1996: 189). Pumpable bulk emulsifying
and the mixing process can be carried out at the emulsion station or on the charging
truck at the mine site (Heiniö 1999: 105). Some of the common delivery systems are
Site Mixed Emulsion (SME) and Plant Mixed Emulsion (PME). SME uses a support
plant located near the mine and a delivery pump truck. Non-explosive ingredients are
delivered to the mine separately and are mixed at the blasting site during charging. The
mix becomes sensitive after a few minutes. In PME, the explosive agent is prepared at
the plant and delivered to the mine site by a pump truck and pumped directly into the
blasthole. (Bhandari 1997: 53–57)
In practice, when the diameter of the blasthole is over 64 mm, all the explosive is loaded
by emulsion and no separate bottom charge is used. The charged hole is detonated from
the bottom of the hole, as always. Generally, the critical blasthole diameter for slurries
and most emulsions is 51 mm. In smaller-diameter blastholes, a more sensitive
explosive, for example dynamite, must be used. (Heiniö 1999: 97)
24
The distribution of explosives in rock is important: With the same specific charge,
small-diameter blastholes with narrow spacing provide much better fragmentation of the
rock than widely spaced large-diameter blastholes. (Heiniö 1999: 147)
In general, the location of the primer affects the fragmentation and reliable ignition of
the explosive agent. If the primer is located on top of the charge, the explosive fumes
may be released into the air before fragmentation is completed. Therefore, the primer is
usually placed at the bottom of the drillhole with the emulsion explosive to be charged
on top of it. The diameter of the primer should be as large as possible to provide
sufficient explosive detonation. In many situations, single-point priming is sufficient;
however, there are some situations in which multiple primers are used in the same
blasthole. Because emulsion explosives and ANFO contain no cap-sensitive compounds
as such, they normally need a booster charge for reliable initiation (Persson et al. 2001:
76). A primer is used to initiate the blasthole, but a booster is usually used to maintain
or intensify the explosive reaction (Olofsson 1996: 189). When using two detonators in
the same blasthole, the detonator in the bottom of the hole normally has a shorter delay
than that for the upper booster. In that case, the detonation is begun from the bottom of
the blasthole. (Vuolio & Halonen 2012: 88)
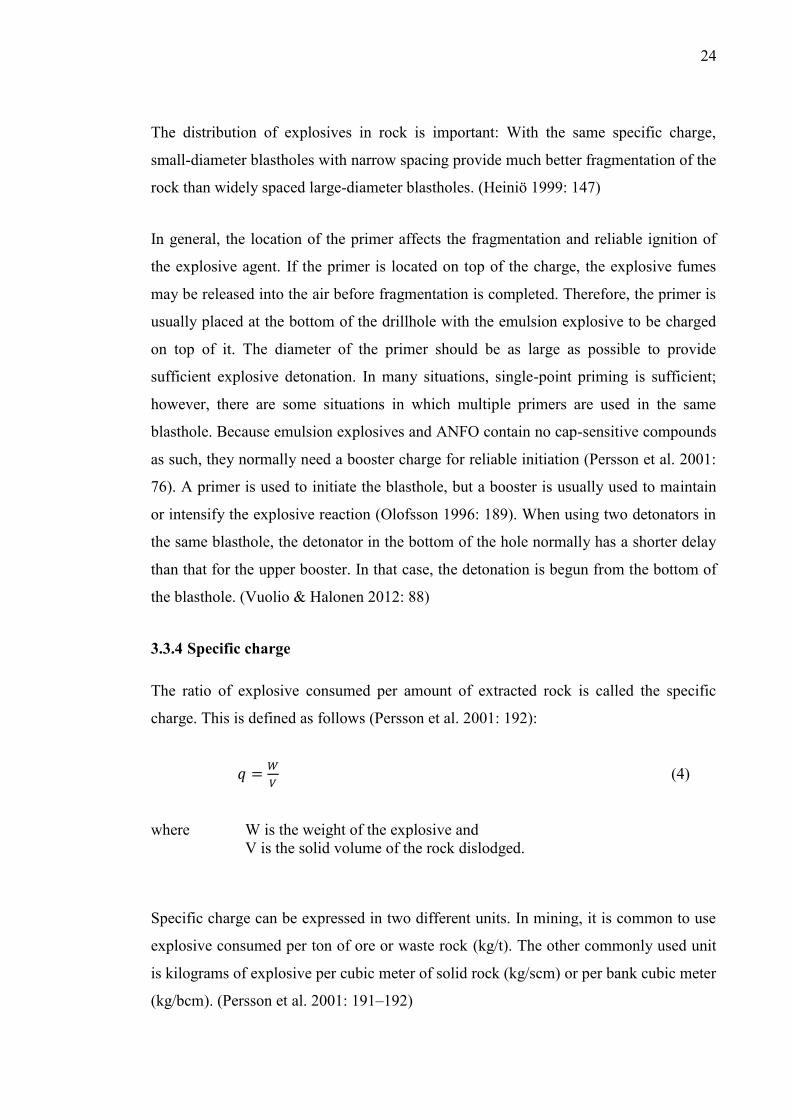
3.3.4 Specific charge
The ratio of explosive consumed per amount of extracted rock is called the specific
charge. This is defined as follows (Persson et al. 2001: 192):
(4)
where W is the weight of the explosive and
V is the solid volume of the rock dislodged.
Specific charge can be expressed in two different units. In mining, it is common to use
explosive consumed per ton of ore or waste rock (kg/t). The other commonly used unit
is kilograms of explosive per cubic meter of solid rock (kg/scm) or per bank cubic meter
(kg/bcm). (Persson et al. 2001: 191–192)
25
The correct specific charge is significant, because the resulting rock fragmentation will
be satisfactory and the heap of blasted rock loose, making loading easier. A slightly
excessive specific charge does not usually cause any harm, but the vibration associated
with the explosion may be greater. If the specific charge is too small, fragmentation
will be incomplete and the size of the rock too large. An insufficient specific charge or
insufficient ignition interval causes toes to form and makes loading more difficult.
(Vuolio & Halonen 2012: 110).
The use of a higher specific charge when mining ore is explained by the fragmentation
requirements. The ore will be crushed in the concentrator plant and the diameter of the
rock has to be suitable for the crusher. Waste rock should be extracted with the lowest
specific charge possible, as this will decrease the consumption of explosives. The
limitations in waste rock mining are the capacity of the loader buckets and of the trucks
used to haul the rock.
The specific charges in different mines can be compared if the explosive agent used has
the same properties (Table 2). If the strength of explosives or the blasting technique
vary, the specific charges may vary as well.. If the blasthole diameter, pattern and
explosive are the same, a higher specific charge will provide smaller fragmentation.
(Bhandari 1997: 357)
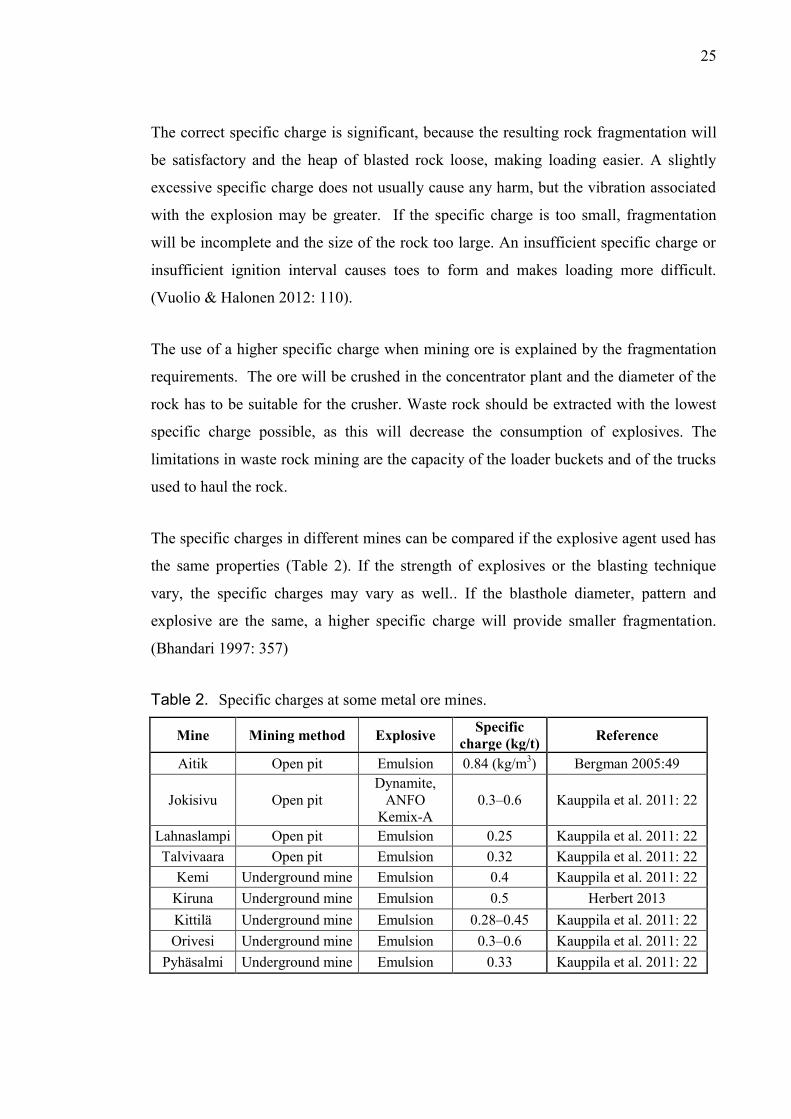
Table 2. Specific charges at some metal ore mines.
Mine Mining method Explosive Specific
charge (kg/t) Reference
Aitik Open pit Emulsion 0.84 (kg/m3) Bergman 2005:49
Jokisivu Open pit
Dynamite,
ANFO
Kemix-A
0.3–0.6 Kauppila et al. 2011: 22
Lahnaslampi Open pit Emulsion 0.25 Kauppila et al. 2011: 22
Talvivaara Open pit Emulsion 0.32 Kauppila et al. 2011: 22
Kemi Underground mine Emulsion 0.4 Kauppila et al. 2011: 22
Kiruna Underground mine Emulsion 0.5 Herbert 2013
Kittilä Underground mine Emulsion 0.28–0.45 Kauppila et al. 2011: 22
Orivesi Underground mine Emulsion 0.3–0.6 Kauppila et al. 2011: 22
Pyhäsalmi Underground mine Emulsion 0.33 Kauppila et al. 2011: 22
26
In traditional bench blasting, the consumption of explosives is usually 0.15–0.6 kg/m3
(Langefors & Kihlström 1963: 20). Vuolio & Halonen (2012: 103) estimate that the
commonly used specific charge in open pit mining is between 0.4 and 1.2 kg/m3 when
using a drill-hole diameter of 30–203 mm. Persson et al. (2001: 54) present a rule of
thumb indicating that the specific charge is 0.5–1.0 kg/m3 solid rock.
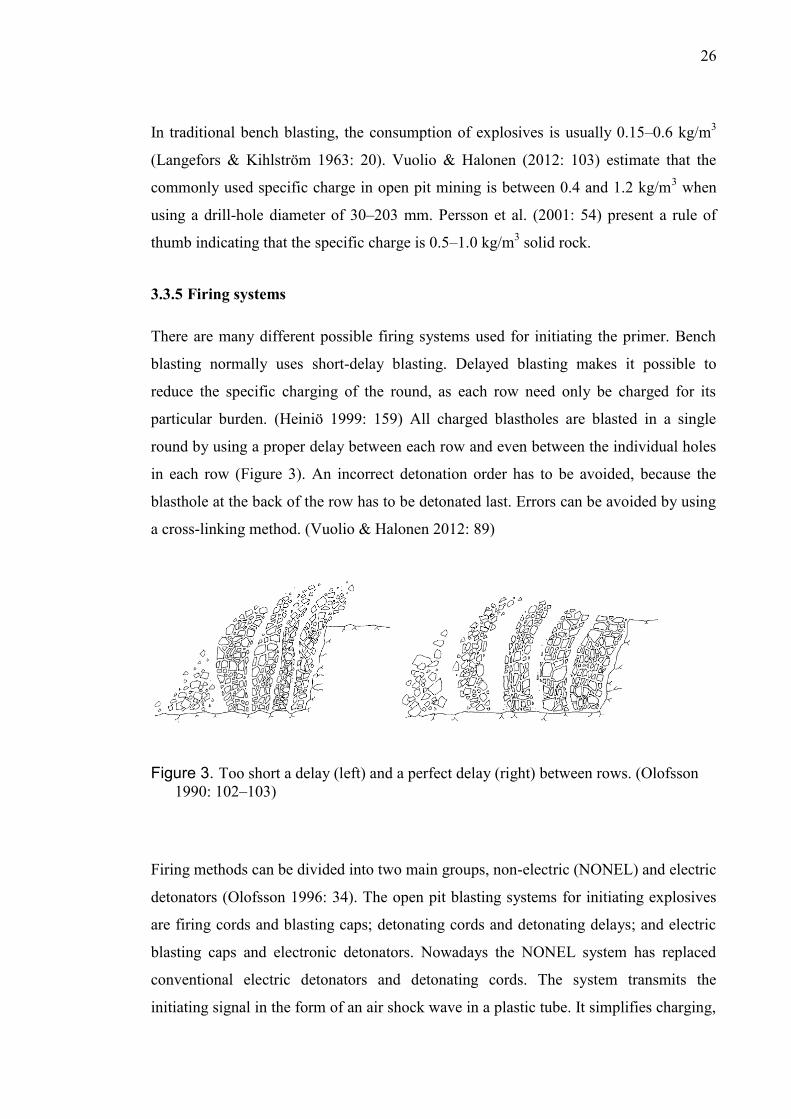
3.3.5 Firing systems
There are many different possible firing systems used for initiating the primer. Bench
blasting normally uses short-delay blasting. Delayed blasting makes it possible to
reduce the specific charging of the round, as each row need only be charged for its
particular burden. (Heiniö 1999: 159) All charged blastholes are blasted in a single
round by using a proper delay between each row and even between the individual holes
in each row (Figure 3). An incorrect detonation order has to be avoided, because the
blasthole at the back of the row has to be detonated last. Errors can be avoided by using
a cross-linking method. (Vuolio & Halonen 2012: 89)
Figure 3. Too short a delay (left) and a perfect delay (right) between rows. (Olofsson
1990: 102–103)
Firing methods can be divided into two main groups, non-electric (NONEL) and electric
detonators (Olofsson 1996: 34). The open pit blasting systems for initiating explosives
are firing cords and blasting caps; detonating cords and detonating delays; and electric
blasting caps and electronic detonators. Nowadays the NONEL system has replaced
conventional electric detonators and detonating cords. The system transmits the
initiating signal in the form of an air shock wave in a plastic tube. It simplifies charging,

27
because the same assembly can be used in all blastholes. The delay times can be decided
after all holes have been charged with explosives and detonators. (Persson et al. 2001:
162–166)

28
4 SOURCES OF NITROGEN IN MINES
Most of the nitrogen load from an operating mine usually originates from explosives
(Forsyth et al. 1995: 800). The main process-based sources of nitrogen in mine water
include cyanide, used in gold extraction; pH regulating agents; enrichment chemicals;
and the use of ammonia as a lixiviant in copper and nickel hydrometallurgy. (Merta &
Kaartinen 2013: 4)
4.1 Nitrogen originating from explosions
It is typical in open pit mining that not all charged explosives do react perfectly.
Undetonated explosives can migrate into a different part of the mine and ultimately
ended up in recipient water bodies, but most of the nitrogen from explosives will be
released into the air during the explosion.
Open pit mining is usually done below groundwater level and groundwater and local
water can flow into the pit. Some rainwater will also end up in the pit. Some of the holes
that have been drilled into the rock can become filled with water. During charging, part
of the charged explosive can dissolve in the water in the blasthole. If the blasthole
contains water, this calls for special attention in charging. The charging has to be started
from the bottom of the hole, in which case the explosive replaces the water there
(Viitala 2010: 12). Care has to be taken that the primer explosive is also water resistant.
The specifications of explosive used are the major factors in the ultimate nitrogen
concentration of drainage water, because different explosives vary considerably in their
water solubility (Revey et al. 1996: 61–62). Careful charging will reduce the amount of
dissolved explosive in water, and spills during charging have to be avoided. (Kauppila
et al. 2013: 65).
The pumpable mining explosives commonly used today ignite poorly and ignition can
be disturbed if the charged explosive column is cut off, for example by rock containing
discontinuities or voids (Olofsson 1990: 113, Hannukainen 2006: 7). Water in rock
voids and varves can also cut off the charge. In open pit mining delaying is used to
prevent simultaneous explosion of the entire pattern. A short time lag can cause a

29
process in which the rock moves and separates or cuts off blastholes within it (Figure 4)
(Bhandari 1997: 64). The blastholes that do not contain energized primers will remain
undetonated (Oy Forcit Ab 2010: 3). In addition, explosion fumes can penetrate the rock
mass in voids and cut off adjacent blastholes (Hannukainen 2009: 7).
Figure 4. Charge cutoffs can be prevented with multiple priming. (Adapted from
Revey et al. 1996: 61)
Drill patterns, stemming length, explosive selection, priming methods and delay timing
are the elements of blast design that can be adjusted to control charge cutoffs or failures.
Sufficient delay times between rows, as well as multiple priming, are one way to
guarantee complete blasthole detonation.
Besides reducing the fracturing of the rock mass, the direction of joints has a significant
effect on blasting results (Figure 5) (Seppälä 2011: 15). Joints can cause problems with
flowing water and may affect explosive consumption if explosives flow into them.
Figure 5. Direction of joints in rock. (Adapted from Olofsson 1990: 98)
30
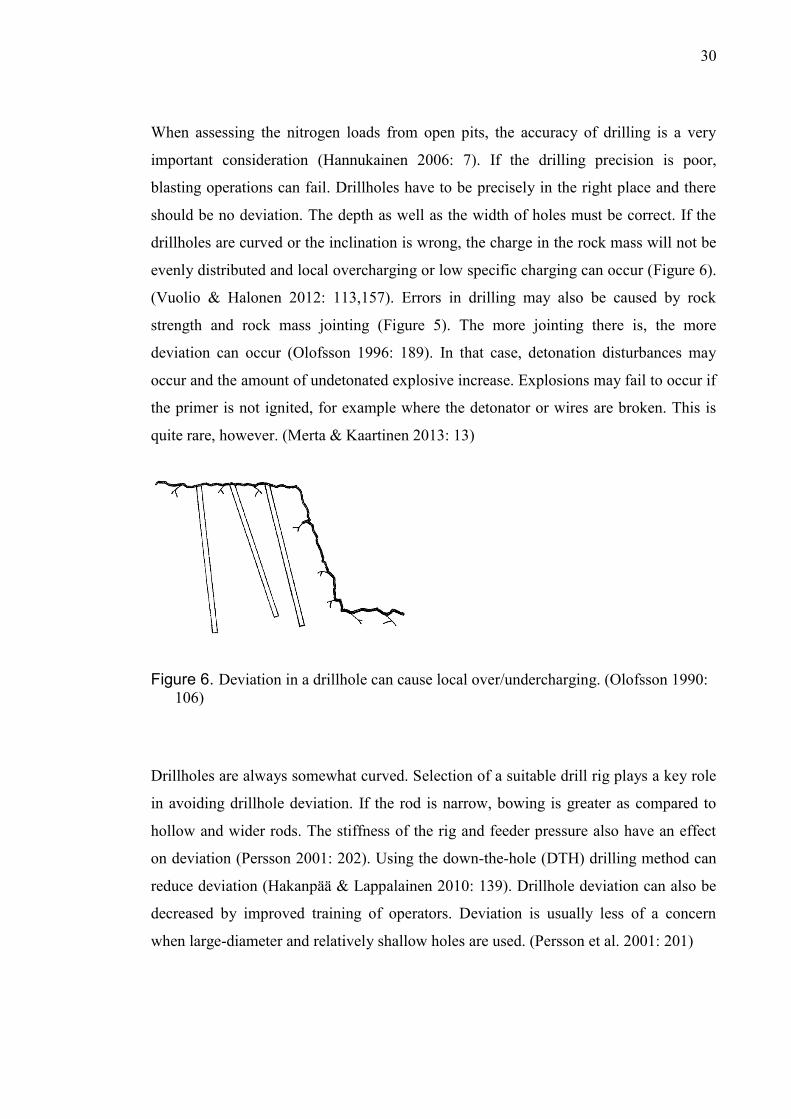
When assessing the nitrogen loads from open pits, the accuracy of drilling is a very
important consideration (Hannukainen 2006: 7). If the drilling precision is poor,
blasting operations can fail. Drillholes have to be precisely in the right place and there
should be no deviation. The depth as well as the width of holes must be correct. If the
drillholes are curved or the inclination is wrong, the charge in the rock mass will not be
evenly distributed and local overcharging or low specific charging can occur (Figure 6).
(Vuolio & Halonen 2012: 113,157). Errors in drilling may also be caused by rock
strength and rock mass jointing (Figure 5). The more jointing there is, the more
deviation can occur (Olofsson 1996: 189). In that case, detonation disturbances may
occur and the amount of undetonated explosive increase. Explosions may fail to occur if
the primer is not ignited, for example where the detonator or wires are broken. This is
quite rare, however. (Merta & Kaartinen 2013: 13)
Figure 6. Deviation in a drillhole can cause local over/undercharging. (Olofsson 1990:
106)
Drillholes are always somewhat curved. Selection of a suitable drill rig plays a key role
in avoiding drillhole deviation. If the rod is narrow, bowing is greater as compared to
hollow and wider rods. The stiffness of the rig and feeder pressure also have an effect
on deviation (Persson 2001: 202). Using the down-the-hole (DTH) drilling method can
reduce deviation (Hakanpää & Lappalainen 2010: 139). Drillhole deviation can also be
decreased by improved training of operators. Deviation is usually less of a concern
when large-diameter and relatively shallow holes are used. (Persson et al. 2001: 201)
31
4.2 Proportion of undetonated explosives in mining
In general, the proportion of explosive residues is lower in open pit mines than in
underground mines. The risk of spills is lower when the explosive is pumped into a
vertical drillhole in open pit mining. In underground mining the explosive has to be
pumped horizontally or upward. In open pit mining, the drilling pattern is coarser than
in underground mining, meaning that the charges in a single blasthole in an open pit
may be much higher than in an underground mine. At the same time, a coarser pattern
decreases the risk that joints or fragments will occur in which explosives can spread and
cause local overcharges or detonation disturbances. (Lindeström 2012: 16)
A report of the Swedish Association of Mines (SveMin) on four Swedish mines
indicates that the proportion of undetonated explosives is significantly smaller in open
pit mining than in the underground mining. In the open pit at the Aitik mine, the
proportion of totally undetonated explosive was 2.5 % on average. The other mines in
the SveMin report were underground mines, and the proportion of undetonated
explosives was around 20 % of the total consumption of explosives. An exception to
this was the Garpenberg mine, where the amount of undetonated explosive was around
10 % on average, because the mining company had paid particular attention to the
nitrogen load in recent years. (Lindeström 2012: 15).
The amount of nitrogen in blasted rock was studied at the Diavik diamond mine in
Canada at a site where waste rock was generated in open pit and underground mining.
Mined waste rock is stockpiled on the site. Leaching tests conducted on freshly blasted
rock at Diavik indicated that the amount of nitrogen released corresponded to a 5.4 %
loss of nitrogen from the blasting explosives. (Bailey 2013: 1) Experiences at another
open pit diamond mine in the Canadian Arctic indicate that the proportion of
undetonated ANFO varied from 0.1 % under dry conditions to 9 % under wet
conditions. (AMEC 2004: 3)
The Finnish KAIRA project studied the biological removal of nutrients from mine
water. During the project, the nitrogen content of blasted rock was analyzed at the
Siilinjärvi, Pahtavaara and Kemi mines. The values obtained were 2 % for Siilinjärvi, 6
32
% for Pahtavaara and 18 % for Kemi. The concentration of total nitrogen measured in
drainage waters was highest at the Siilinjärvi mine (69 mg N/l), but this represented
only 3 % of the total nitrogen used in explosives. The comparison of total nitrogen
content analyzed from water and rock samples showed a 30 % loss of explosive input at
Kemi, 15–19 % at Pahtavaara but only 5 % at Siilinjärvi. (Mattila et al. 2007: 32)
Pommen (1983: 59) reports that 6 % of the explosive used migrated partly into the river
and partly into groundwater at a coal mine in British Columbia. The remaining 94 % of
the nitrogen in the explosives used was released into the atmosphere as nitrogenous
gases during detonation.
The final report of the MINERA project notes that previous investigations from
different mines indicate that the proportion of explosive residues varies significantly. In
dry conditions only 0.2 % of a loaded explosive dissolves into water, but in wetter
conditions some 6 % may dissolve. If the explosive in use is ANFO, 5−15 % of the
explosive used may end up in the recipient water bodies. (Kauppila et al.2013: 65)
Morin & Hutt (2009: 1552) made studies of nitrogen in the drainage water at an
underground mine. They report proportions of 12 % and 28 % for explosive residues in
two separate series of tests.
Sormunen (2000: 68) has studied detonation disturbances in sublevel caving blasting at
the Kiruna iron mine in northern Sweden. The results show that the number of
undetonated drillholes was around 10 % of all charged holes. The amount of
undetonated explosives was between 7 and 13 % of all the explosive charged.
(Sormunen 2000: 68). Forsberg & Åkerlund (1999: 80) have also studied the explosive
residuals at the Kiruna mine. Their results indicate that 15–19 % of all loaded
explosives are transported up from the underground mine along with the raw ore. In
tunneling work at the Botniabanan project in Sweden, explosive contents of 10 to 20 %
were found in blasted rock (Hannukainen 2009: 7−8).
4.3 Nitrogen loads and mitigation measures in operating mines
In Finnish mines, the most popular active water treatment method is to adjust pH by
adding lime, which neutralizes acidic water and causes dissolved metals to be

33
precipitated. Some other chemicals can be used to precipitate harmful compounds in
water. (Kauppila et al. 2011: 125).
Nowadays the reduction of nitrogen in mines is based on recycling nitrogen-
contaminated water via the tailings pond, where the nitrogen is removed during the long
retention time and if the pH is sufficiently high (near 8). It must be taken into account
that in cold environments nitrogen removal can be slowed down. (Kauppila et al 2011:
127, Miazga−Rodriguez 2012: 1). About 64 % of Finnish mines have treatment
wetlands to polish mining waters between the mine and recipient water bodies (Palmer
et al. 2013: 55).
Many operating mines have changed the explosive agent they use to a poorly soluble
option. Environmental permits for mines require the use of poorly soluble explosives
and charging and blasting have to be carried out carefully to mitigate nitrogen emissions
into water. Nowadays the amount of undetonated explosive has declined, because
nitrogen emissions are being taken into account (Lindeström 2012: 41). Nitrogen loads
from the concentration process can be decreased if nitrogen-free alternatives can be
found for the process chemicals. For example, in the Pyhäsalmi mine, nitric acid has
been replaced by sulfuric acid (Maikkula 2013: 53).
When comparing the nitrogen emissions of runoff water from waste rock areas in
different mines, one has to take into account that poorly soluble explosives have not
always been used. ANFO, used commonly earlier, is highly soluble in water. Nowadays
ANFO has been replaced by poorly soluble explosives, mainly emulsion explosives.
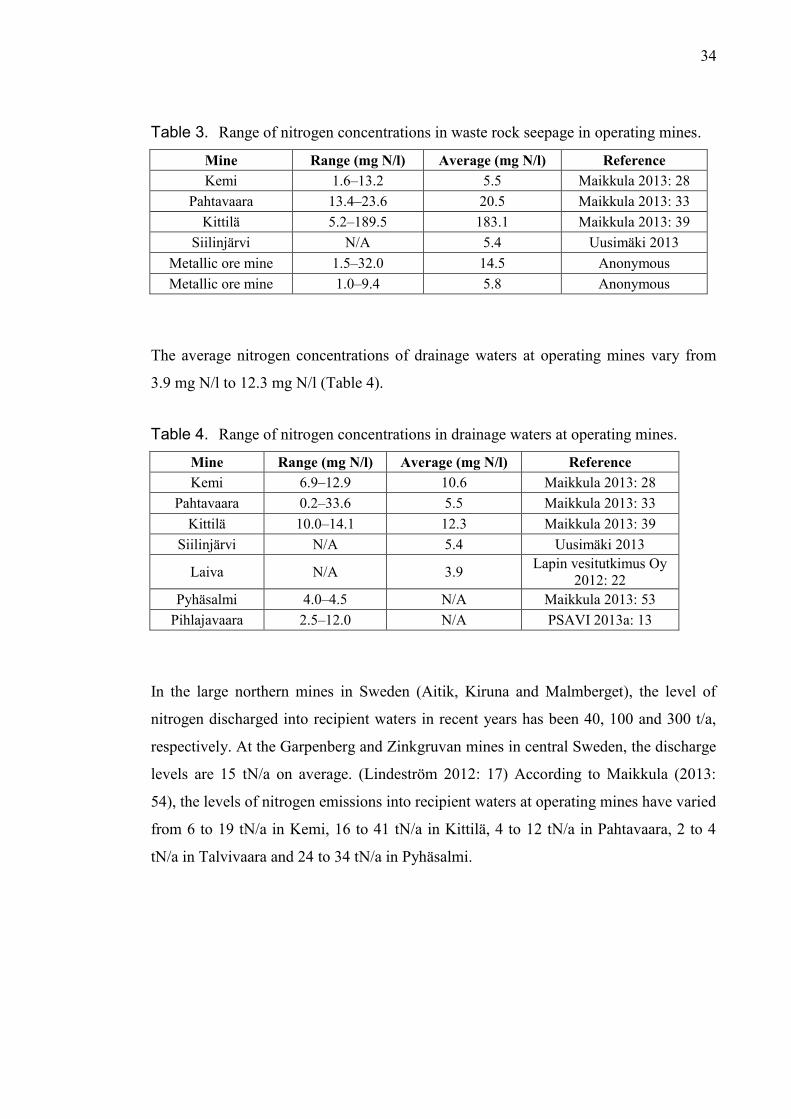
A review of studies by Maikkula (2013) and the environmental reports of mines reveals
that that the amount of total nitrogen in waste rock seepage varies widely. Average
values vary from 5.4 mg N/l to 183.1 mg N/l (Table 3).
34
Table 3. Range of nitrogen concentrations in waste rock seepage in operating mines.
Mine Range (mg N/l) Average (mg N/l) Reference
Kemi 1.6–13.2 5.5 Maikkula 2013: 28
Pahtavaara 13.4–23.6 20.5 Maikkula 2013: 33
Kittilä 5.2–189.5 183.1 Maikkula 2013: 39
Siilinjärvi N/A 5.4 Uusimäki 2013
Metallic ore mine 1.5–32.0 14.5 Anonymous
Metallic ore mine 1.0–9.4 5.8 Anonymous
The average nitrogen concentrations of drainage waters at operating mines vary from
3.9 mg N/l to 12.3 mg N/l (Table 4).
Table 4. Range of nitrogen concentrations in drainage waters at operating mines.
Mine Range (mg N/l) Average (mg N/l) Reference
Kemi 6.9–12.9 10.6 Maikkula 2013: 28
Pahtavaara 0.2–33.6 5.5 Maikkula 2013: 33
Kittilä 10.0–14.1 12.3 Maikkula 2013: 39
Siilinjärvi N/A 5.4 Uusimäki 2013
Laiva N/A 3.9 Lapin vesitutkimus Oy
2012: 22
Pyhäsalmi 4.0–4.5 N/A Maikkula 2013: 53
Pihlajavaara 2.5–12.0 N/A PSAVI 2013a: 13
In the large northern mines in Sweden (Aitik, Kiruna and Malmberget), the level of
nitrogen discharged into recipient waters in recent years has been 40, 100 and 300 t/a,
respectively. At the Garpenberg and Zinkgruvan mines in central Sweden, the discharge
levels are 15 tN/a on average. (Lindeström 2012: 17) According to Maikkula (2013:
54), the levels of nitrogen emissions into recipient waters at operating mines have varied
from 6 to 19 tN/a in Kemi, 16 to 41 tN/a in Kittilä, 4 to 12 tN/a in Pahtavaara, 2 to 4
tN/a in Talvivaara and 24 to 34 tN/a in Pyhäsalmi.
35
5 TREATMENT METHODS AND MITIGATION
MEASURES
Nowadays the problem of nitrogen discharge from mining has been acknowledged and
different attempts have been made to develop a process for removing dissolved nitrogen
compounds from mine waters. Nevertheless, there is no commercially available process
for ammonia and nitrate removal. (Mattila et al. 2007: 5)
The environmental permit currently in force for the Kittilä mine requires that the total
nitrogen concentration in water discharged to the wetland treatment area has to be less
than 30 mg N/l (PSAVI 2013a: 117). Corresponding to the limit values for nitrogen
emissions in wastewater treatment plants, the Finnish Government Decree on Urban
Waste Water Treatment (888/2006) gives limit values for total nitrogen discharged from
wastewater treatment plants. Based on population equivalent (PE), the limit of total
nitrogen is 15 mg N/l if the treatment plant is small (PE 10 000 – 100 000) or 10 mg/l if
the plant is bigger (PE > 100 000). The Decree of the Ministry of Social Affairs and
Health relating to the quality and monitoring of water intended for human consumption
(461/2000) gives limit values of 50 mg/l of nitrate ion and 11.0 mg/l of nitrate nitrogen.
(Merta & Kaartinen 2013: 31)
Nitrogen emissions from mining can be reduced by developing handling and loading
practices at the mine, especially when bulk explosives are used. As poor drilling and
loading practices can increase the amount of undetonated explosives, improving drilling
precision can reduce the amount of explosive residues (Revey 1996: 62).
In addition to proper selection of explosives and optimization of blasting methods,
different types of treatment methods can reduce nitrogen emissions into water bodies.
The available methods for treating mine water can be divided into two categories: active
and passive. Active methods require continuous operation and maintenance. Passive
treatment methods are designed to be self-sustaining after an initial start-up period.
Generally, both active and passive systems are used in operating mines, but in
abandoned or closed mines passive treatment systems are used because no maintenance
is needed. (Brown et al. 2002: 38, Kauppila et al. 2011: 166)
36
Active methods can be subdivided into pH modification, ion exchange, biology-based
treatments, adsorption treatments, electrochemical treatments and physical process
technologies. The conventional active treatment of mine water makes use of
neutralization and precipitation. The materials commonly used to neutralize mine water
are lime, limestone, caustic soda or sodium carbonate (Brown et al. 2002: 39–40).
Passive treatment methods include aerobic and anaerobic wetlands, secondary settling
ponds and anoxic limestone filter beds. A passive treatment can be used as a secondary
treatment at an active treatment facility. Passive methods are based on aerobic or
anaerobic chemical and biochemical processes or their combinations. Microbiological
treatments are also divided into active and passive methods. The active treatment
methods require the addition of carbon to a bacterial energy source and perhaps the
addition of bacterial inoculum. On the other hand, passive microbiological treatment
can take place in clarification ponds, because the degradation products of plants act as a
source of carbon. (Kauppila et al. 2011: 125) Even though passive treatment methods do
not require the regular addition of chemicals or energy supplies, continuous monitoring
of water quality is required to confirm purification efficiency in different situations.
(Kauppila et al. 2011: 125)
Removal of ammonium from water can be done via nitrification, but nitrate is a highly
stable and soluble anion that is difficult to remove using traditional water treatment
methods such as coagulation and adsorption (Crittenden et al. 2012: 1592). In general,
the available techniques for the removal of nitrate from water are biological or chemical
denitrification, reverse osmosis, electrodialysis and ion exchange. (Bhatnagar &
Sillanpää 2011: 494, Hekmatzadeh et al. 2012: 22)
5.1 Mitigation measures for nitrogen emissions
Preventing and decreasing emissions are the most effective ways to reduce
environmental impacts. Contingency plans and contingency systems are important for
preventing emissions. A contingency plan is based on risk assessment and includes a
plan indicating where water can be discharged or stored in an emergency. (Kauppila et
al. 2011: 118)

37
Wastewater management in a mine is usually based on the mine’s water management
plan. The basis of the water management system is hydrological and hydrogeological
data from the mine area and baseline studies, which are generally carried out as part of
the EIA process. For example, it is important to estimate the annual variation in
precipitation in the catchment area and the water requirements of the enrichment
process. The water management system should cover every source where water can
form and the quality of water needs to be evaluated. It is also necessary to estimate the
amounts of wastewater and pit drainage water that will be produced. (Kauppila et al.
2011: 122–123)
The best environmental practice in water management for mitigating emissions to
recipient water bodies is to reduce the amount of fresh water intake and increase the
recycling of water (Kauppila et al. 2011: 164). The latter involves recycling drainage
waters and purified process waters to the concentrator plant. Development of the
concentrating process such that it requires less water is another particularly effective
way to reduce emissions into water bodies. In addition, non-harmful local waters should
be kept separate from process water and runoff waters from waste rock stockpiling
areas. If this is done, the amount of water to be treated remains lower and the treatment
of water containing harmful components can be carried out more efficiently. Moreover,
the concentration of harmful compounds will be higher, as less dilution occurs.
(Kauppila et al. 2011: 122–123)
The fundamental requirement for successful mitigation measures for water emissions
from waste rock stockpiling areas is knowledge of the chemical and physical properties
of the rock in the stockpiles. During production, mitigation measures are focused on
collecting runoff water and treating it if necessary. In addition, constructing proper
foundations for stockpiling areas prevents seepage into groundwater. Generally, at the
least, waste rock piles contain nitrogen-rich explosive residues, and they may also
contain heavy metals and potentially acid-forming rocks. Landscaping of the stockpiles
reduces the amount of seepage and can improve the quality of water. In landscaping, the
piles are covered, which prevents most rain and meltwater runoff from seeping through
the rock and potentially dissolving explosive residues. The runoff from other areas of
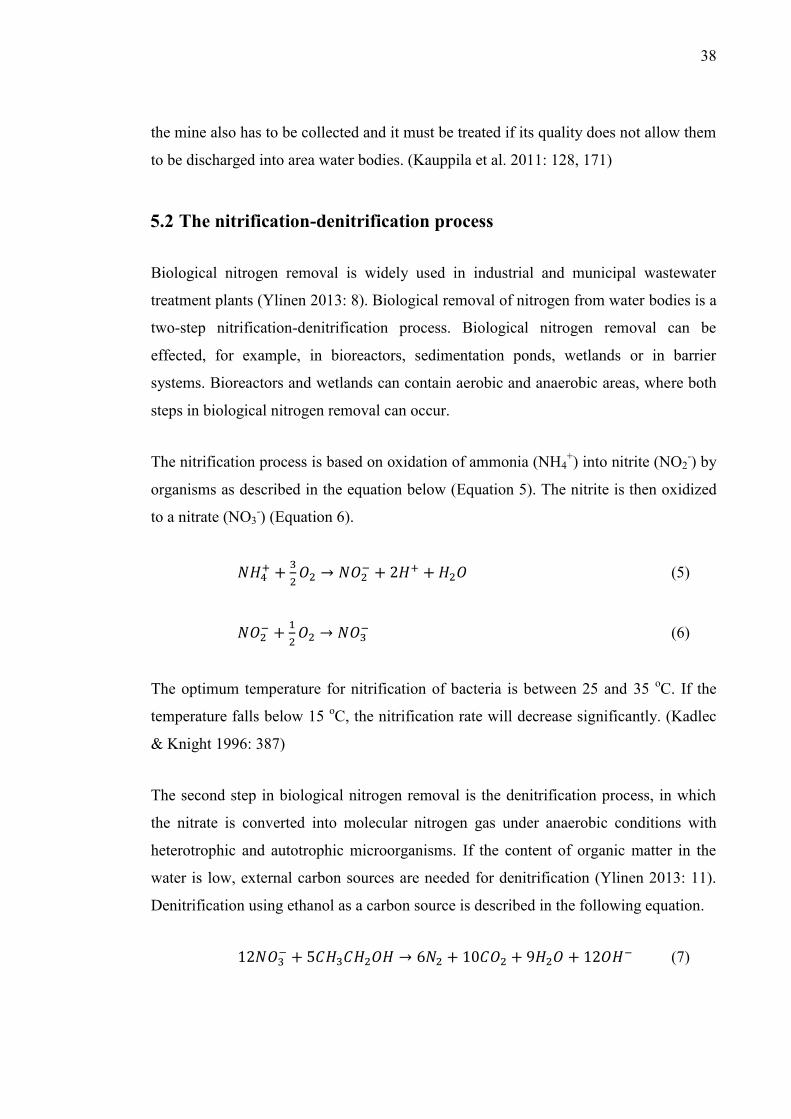
38
the mine also has to be collected and it must be treated if its quality does not allow them
to be discharged into area water bodies. (Kauppila et al. 2011: 128, 171)
5.2 The nitrification-denitrification process
Biological nitrogen removal is widely used in industrial and municipal wastewater
treatment plants (Ylinen 2013: 8). Biological removal of nitrogen from water bodies is a
two-step nitrification-denitrification process. Biological nitrogen removal can be
effected, for example, in bioreactors, sedimentation ponds, wetlands or in barrier
systems. Bioreactors and wetlands can contain aerobic and anaerobic areas, where both
steps in biological nitrogen removal can occur.
The nitrification process is based on oxidation of ammonia (NH4+) into nitrite (NO2
-) by
organisms as described in the equation below (Equation 5). The nitrite is then oxidized
to a nitrate (NO3-) (Equation 6).
(5)
(6)
The optimum temperature for nitrification of bacteria is between 25 and 35 oC. If the
temperature falls below 15 oC, the nitrification rate will decrease significantly. (Kadlec
& Knight 1996: 387)
The second step in biological nitrogen removal is the denitrification process, in which
the nitrate is converted into molecular nitrogen gas under anaerobic conditions with
heterotrophic and autotrophic microorganisms. If the content of organic matter in the
water is low, external carbon sources are needed for denitrification (Ylinen 2013: 11).
Denitrification using ethanol as a carbon source is described in the following equation.
(7)
39
Denitrification will occur at temperatures over 5 oC (Kadlec & Knight 1996: 403). The
process is dependent on temperature and the rate doubles with every 4 o
C increase.
Denitrification is also dependent on pH. The suitable range of pH for denitrification is
6–8 (Kadlec & Knight 1996: 403). At 4.8 pH the denitrification process is inhibited.
Another factor that decreases the denitrification rate is the occurrence of heavy metals
in the water being treated. (Ylinen 2013: 54)
In denitrification, nitrogen gas is produced with OH- ions, which have the potential of
neutralizing acidic pH. Imperfect nitrate reduction results in nitrite. In this case, nitrite
still represents nitrogen pollution. (Papirio et al. 2013: 2)
At all the mines studied in the KAIRA project (Siilinjärvi, Kemi and Pahtavaara), the
total nitrogen concentration decreased significantly when wastewater was circulated via
large water ponds. However, this treatment process is not sufficient to remove all
nitrogen, because the efficiency of treatment was dependent on the seasons. The key
elements for nitrogen removal in the ponds were a sufficiently long retention time and
rich vegetation, which provided a carbon source for the denitrifying process in what
would otherwise have been oligotrophic mine water. (Mattila et al. 2007: 26)
5.2.1 Wetland treatment areas on peatland
Nitrogen can be removed from mine water by discharging it onto wetlands and allowing
it to flow though the peat. Denitrification is a process to remove nitrate nitrogen from
water and it is the most important one for removing inorganic nitrogen in wetland
treatment. In a wetland, a low organic content in mine water effluent is not usually a
problem, as the peat contains carbon and thus no external carbon source is required.
Nitrogen can also be reduced in a wetland by sedimentation of suspended solids and
infiltration of the water through the peat (Heikkinen et al. 1994: 17). In addition, some
plants in the wetland can make use of ammonia and nitrate nitrogen (Lyytimäki &
Hakala 2008: 49).
In wetland treatment, one has to take into account that in spring and late autumn the
temperature of the water from the waste rock areas will be low and the purification
processes will not operate properly in the wetland (Päkkilä 2008: 122). The higher the

40
temperature of the seepage water, the faster the processes will operate (Kløve et al.
2012: 14).
Studies from the Kittilä gold mine show that the reduction of total nitrogen in wetland
treatment varies in different seasons. In August, the reduction was 49.1 %, and in
September 55.7 % (Päkkilä 2008: 117). On the other hand, in April the total reduction
of nitrogen was only 4.3 % (Päkkilä 2008: 116). Wetland treatment has been also used
at the Pahtavaara gold mine, and a reduction of nitrogen of approximately 50 % was
observed in the period 2008–2011 (Maikkula 201: 32). These results are of the same
order of magnitude as those for the efficiency of nitrogen removal in the wetland
treatment of runoff water from peat-harvesting areas. For example, in the Kompasuo,
Puutiosuo and Joutsensuo wetlands, the total reduction of nitrogen during the frost–free
season ranged from 18 % to 49 % (Ihme 1994: 45).
5.2.2 Bioreactors
Ylinen (2013) reports studies of biological nitrogen removal from mine waters using
separate and combined nitrification and denitrification reactors, the two types of
bioreactors (Ylinen 2013: 9). Neutral sludge from a municipal wastewater treatment
plant was used to denitrify water containing nitrate. Average total nitrogen removal in
simultaneous nitrification and denitrification reactors was 47 %. Denitrification was
possible at 7 oC with an inlet water pH of 2.8. Low concentrations of the common heavy
metals Ni, Co, Cu and As did not affect the denitrification process significantly. (Ylinen
2013: 47, 54) Bioreactor tests from the KAIRA project show that total nitrogen can be
almost completely removed from mine water with no suspended solids by using a
biological two-step system consisting of nitrifying and denitrifying bioreactors. (Mattila
et al. 2007:71)
5.2.3 Barrier system
Removal of nitrate from mine waters using a barrier system has been studied at the
Malmberget iron ore mine in northern Sweden. A barrier was constructed and filled
with a reactive mixture of crushed rock, sawdust and sewage sludge. Results indicated
that the barrier system can remove nitrate at concentrations of approximately 30 mg N/l
41
to below detection level with hydraulic residence times of 21 hours. The addition of an
external carbon source for denitrifying bacteria is necessary to sustain nitrate removal.
Near-neutral pH is required for optimal performance. Temperature is a critical
parameter in all water treatment schemes in cold climates. Insulating the barrier system
or burying it below the frost line can lengthen its operative season. (Herbert 2013: 345-
350)
5.3 Reverse osmosis and membrane separation
Reverse osmosis (RO) is a pressure-driven membrane separation process which can
separate ions from water. Because the molecular weight of ammonium and nitrate is
below 70 g/mol, membrane processes such as reverse osmosis and electrodialysis are
viable options for removing nitrogen in water. (Mattila et al.2007: 7) RO membranes
principally allow only water to diffuse though the membrane. Häyrynen et al. (2013: 93)
have studied nitrogen removal with RO at bench scale, where the feed flow rate and
pressure were varied to find the optimal operating conditions. For RO, rejection of
ammonia was 77–97 % and nitrate 81–97 %. Reverse osmosis is an energy-consuming
process, but it can be cost effective if there are other contaminants such as dissolved
solids in the water to be treated (Crittenden et al. 2012: 1596). Electrodialysis is a
membrane technique in which ions are removed using difference in potential.
Electrodialysis is expensive, requires full-time monitoring and is limited to treating soft
waters, which do not contain high concentrations of salts. Under favorable conditions,
electrodialysis provides the same degree of nitrogen removal as reverse osmosis
(Crittenden et al. 2012: 1596).
In studies conducted as part of the KAIRA project, nanofiltration membrane separation
had poor retention of ammonium, nitrate and chloride. Nanofiltration is thus not
applicable as a pretreatment process for a nitrification-denitrification process in a
bioreactor. On the other hand, reverse osmosis membranes removed ammonium and
nitrate from mine water to considerable extents. The overall costs of RO treatment are
high for a mine if all mine water is treated by the method. (Mattila 2007: 70)
42
5.4 Ion exchange
Strong base anion (SBA) exchange resins are used to remove anions (Crittenden et al.
2012: 1596). Ion exchange is considered to be one of the best and most feasible methods
for removing nitrate from water supplies due to the method’s high efficiency, simple
operation and relatively low cost. However, studies indicate that the capacity of the
resins is reduced in the presence of chloride and sulfate (Hekmatzadeh et al. 2012: 30).
Other anions, such as sulfate, will be removed along with nitrate. The impact of sulfate
is very important, for decreases the exchange capacity of resins. There are also resin
types that are designed for nitrate removal (Crittenden et al. 2012: 1596). Strong base
anion resins can be regenerated using sodium chloride (NaCl), but the brine can cause
disposal problems. The barks of Nordic trees have been studied as sources of raw
materials for anion exchangers. Pine sawdust was found to achieve nearly the same
level of nitrate removal capacity as commercial anion exchange resins (Keränen et al.
2013: 67)
5.5 Adsorption
Adsorption technology can be used to remove different types of anions, such as nitrate,
from water. Selection of material that is suitable for the purpose is important to achieve
optimum removal rates. (Bhatnagar & Sillanpää 2011: 494). Finding a suitable
adsorbent medium for nitrate removal from water generally depends on several factors,
making its selection a complex task where effective removal is to be achieved.
(Bhatnagar & Sillanpää 2011: 502) It has been noticed that a sorbent which shows a
high rate of nitrate uptake in the laboratory may fail in field conditions. Moreover, if the
water to be treated contains other pollutants, understanding the sorption mechanisms at
work can be challenging. (Bhatnagar & Sillanpää 2011: 502)
5.6 Electrocoagulation
Electrocoagulation is a technology that combines conventional coagulation and
electricity in treating water. It is based on anodic dissolution of the metal electrode.
43
Electrocoagulation does not require the addition of chemicals and it is more feasible
within a wider pH range than conventional coagulation. Electrocoagulation is applied in
the treatment of cold water. (Kuokkanen et al. 2013: 72) Research done on the removal
of nitrate from water using electrocoagulation reports that the highest nitrate reduction
rate was 26 %. On the other hand, the anode dissolved to a significant extent in water.
The anode material was Al or Fe. (Schäfer 2013: 33)
5.7 Freeze crystallization
Freeze crystallization is one option for the treatment of nitrogen-contaminated water in
a cold environment. Purification is based on a process whereby the water freezes, ice
crystals form from the pure water and impurities are rejected from the ice structure.
(Sallanko & Haanpää 2008: 54) This treatment is available only when the temperature
of the environment is below zero and the temperature of the water being treated is low.
At the Kittilä gold mine, freeze crystallization was evaluated as a treatment method for
drainage water containing nitrogen in 2011. During the test, around 1000 cubic meters
of drainage water were treated and 2000 m3 of snow was formed. Analyses were carried
out of the concentrations of nitrogen in snow samples, water samples from snow
meltwater and influent drainage water. The nitrogen concentration was lower in snow as
compared to the original drainage water. Sulfide, arsenic, and antimony concentrations
were also lower in snow. On the other hand, the solids content was higher. In meltwater,
the concentration of nitrogen was much lower than it was in influent drainage water.
(Angico–Eagle Finland Oy 2011)
44
6 ESTIMATION OF NITROGEN MASS BALANCE AND
FIELD STUDIES
The nitrogen mass balance for the Suhanko mine was estimated based on the water
balance analyzed during the EIA and data on explosive residues from past studies. The
sections below describe the theory of nitrogen mass balance estimation and present data
on the water balance calculated for the Suhanko mine. During the field study, in situ
hydraulic conductivities were measured and peat samples were taken. The theory
underlying the measurements and laboratory assays is presented in below. The
concentration of nitrogen in the runoff water from the waste rock and low-grade ore
stockpiles has been estimated based on water monitoring data for a similar metal ore
mine and on solubility studies conducted by the Geological Survey of Finland (GTK).
The nitrogen content of the open pit drainage water has also been estimated using water
monitoring data from the reference metal ore mine.
6.1 Water balance
The fundamental basis for calculating a water balance is that the net sum of the
incoming and outgoing flows is the same. (Pöyry Finland Oy 2013b: 5) The overall
water flow of the Suhanko mine area is depicted below in Figure 7, which shows the
water flows, open pits, overburden areas, recipient water bodies, tailings ponds,
processing plant and water storage pond.
The drainage waters from the open pits, the water from the tailings drainage system, the
water from the low-grade ore stockpiling areas and the water in the processing plant
area all have to be conducted to the concentrator or tailings pond. Local waters from the
waste rock and overburden areas will be discharged to the recipient water bodies via a
clarification pond and wetland treatment. (PSY 2005: 59).
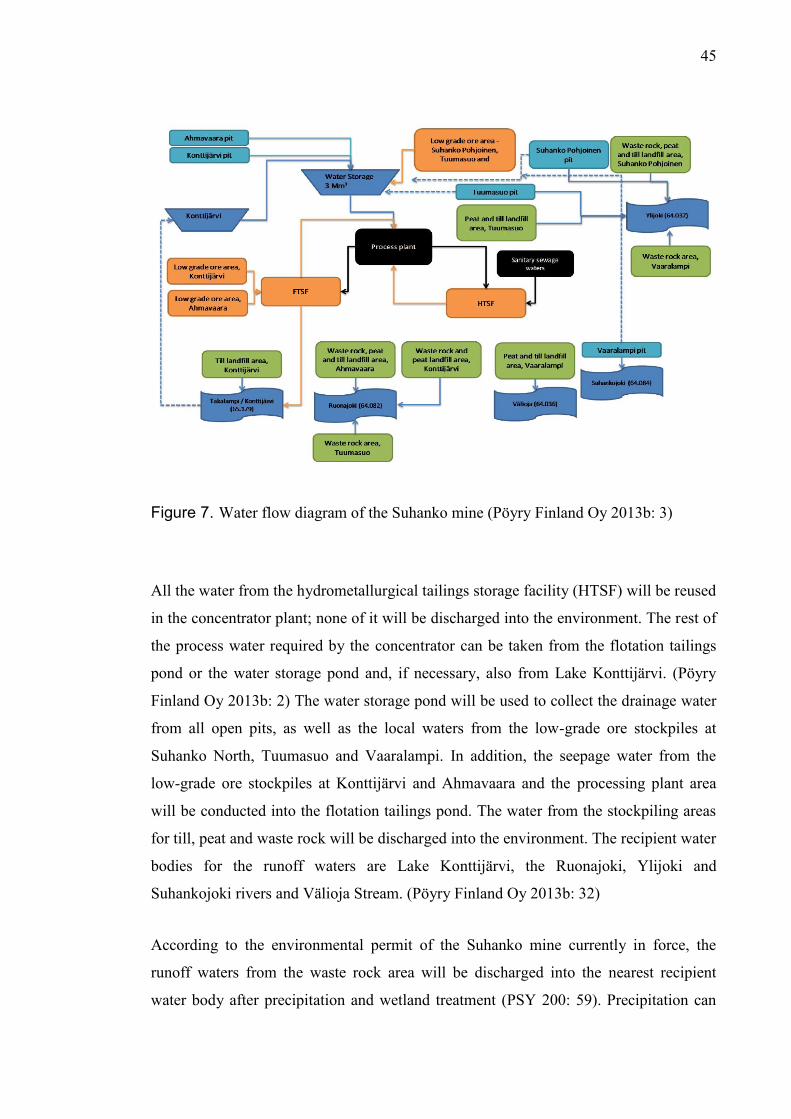
45
Figure 7. Water flow diagram of the Suhanko mine (Pöyry Finland Oy 2013b: 3)
All the water from the hydrometallurgical tailings storage facility (HTSF) will be reused
in the concentrator plant; none of it will be discharged into the environment. The rest of
the process water required by the concentrator can be taken from the flotation tailings
pond or the water storage pond and, if necessary, also from Lake Konttijärvi. (Pöyry
Finland Oy 2013b: 2) The water storage pond will be used to collect the drainage water
from all open pits, as well as the local waters from the low-grade ore stockpiles at
Suhanko North, Tuumasuo and Vaaralampi. In addition, the seepage water from the
low-grade ore stockpiles at Konttijärvi and Ahmavaara and the processing plant area
will be conducted into the flotation tailings pond. The water from the stockpiling areas
for till, peat and waste rock will be discharged into the environment. The recipient water
bodies for the runoff waters are Lake Konttijärvi, the Ruonajoki, Ylijoki and
Suhankojoki rivers and Välioja Stream. (Pöyry Finland Oy 2013b: 32)
According to the environmental permit of the Suhanko mine currently in force, the
runoff waters from the waste rock area will be discharged into the nearest recipient
water body after precipitation and wetland treatment (PSY 200: 59). Precipitation can
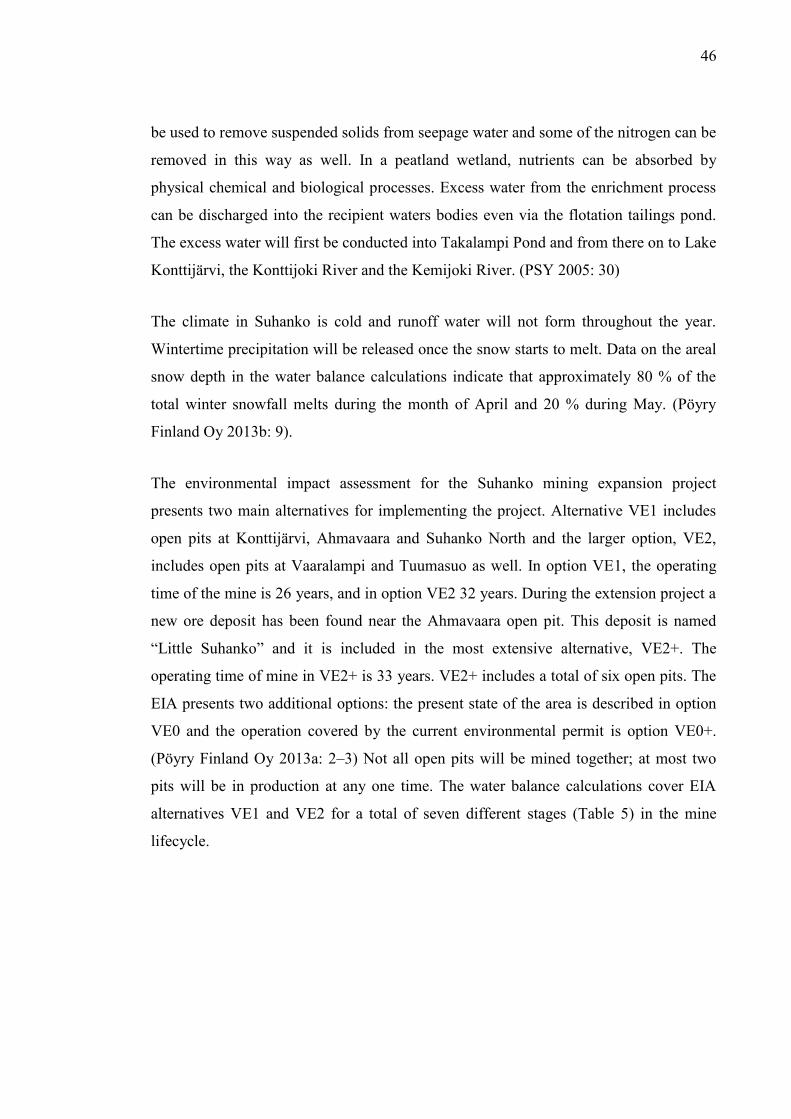
46
be used to remove suspended solids from seepage water and some of the nitrogen can be
removed in this way as well. In a peatland wetland, nutrients can be absorbed by
physical chemical and biological processes. Excess water from the enrichment process
can be discharged into the recipient waters bodies even via the flotation tailings pond.
The excess water will first be conducted into Takalampi Pond and from there on to Lake
Konttijärvi, the Konttijoki River and the Kemijoki River. (PSY 2005: 30)
The climate in Suhanko is cold and runoff water will not form throughout the year.
Wintertime precipitation will be released once the snow starts to melt. Data on the areal
snow depth in the water balance calculations indicate that approximately 80 % of the
total winter snowfall melts during the month of April and 20 % during May. (Pöyry
Finland Oy 2013b: 9).
The environmental impact assessment for the Suhanko mining expansion project
presents two main alternatives for implementing the project. Alternative VE1 includes
open pits at Konttijärvi, Ahmavaara and Suhanko North and the larger option, VE2,
includes open pits at Vaaralampi and Tuumasuo as well. In option VE1, the operating
time of the mine is 26 years, and in option VE2 32 years. During the extension project a
new ore deposit has been found near the Ahmavaara open pit. This deposit is named
“Little Suhanko” and it is included in the most extensive alternative, VE2+. The
operating time of mine in VE2+ is 33 years. VE2+ includes a total of six open pits. The
EIA presents two additional options: the present state of the area is described in option
VE0 and the operation covered by the current environmental permit is option VE0+.
(Pöyry Finland Oy 2013a: 2–3) Not all open pits will be mined together; at most two
pits will be in production at any one time. The water balance calculations cover EIA
alternatives VE1 and VE2 for a total of seven different stages (Table 5) in the mine
lifecycle.
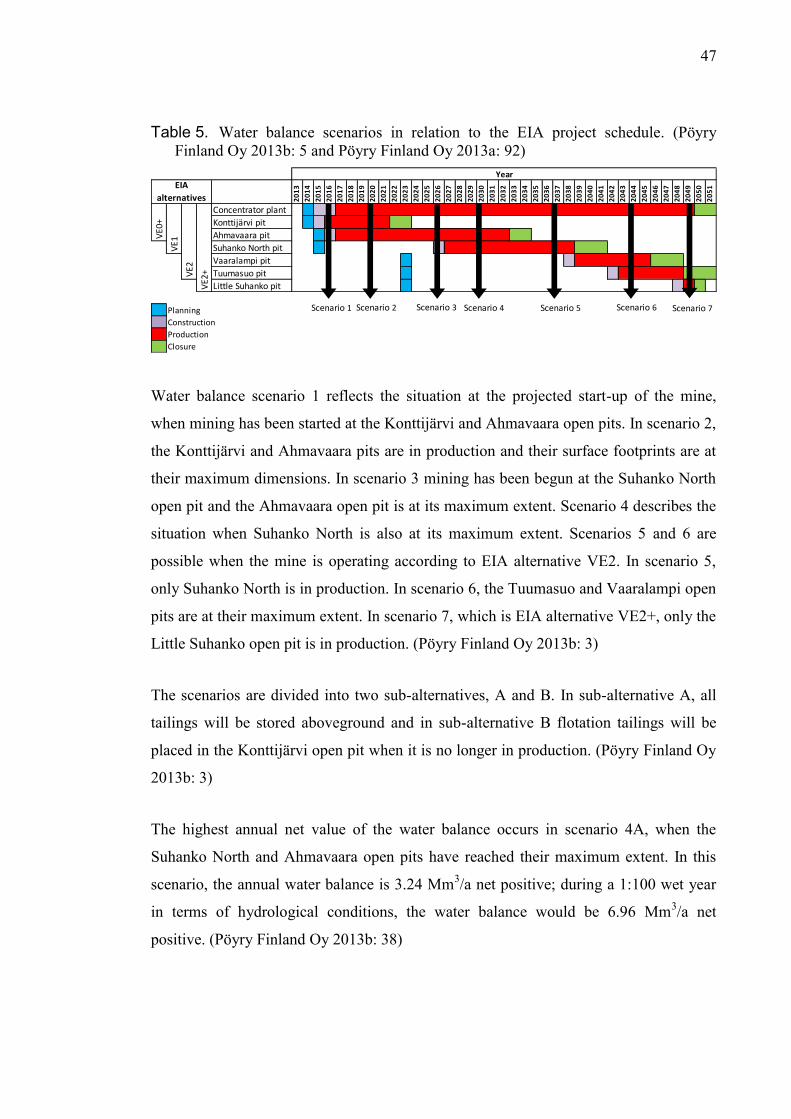
47
Table 5. Water balance scenarios in relation to the EIA project schedule. (Pöyry
Finland Oy 2013b: 5 and Pöyry Finland Oy 2013a: 92)
Water balance scenario 1 reflects the situation at the projected start-up of the mine,
when mining has been started at the Konttijärvi and Ahmavaara open pits. In scenario 2,
the Konttijärvi and Ahmavaara pits are in production and their surface footprints are at
their maximum dimensions. In scenario 3 mining has been begun at the Suhanko North
open pit and the Ahmavaara open pit is at its maximum extent. Scenario 4 describes the
situation when Suhanko North is also at its maximum extent. Scenarios 5 and 6 are
possible when the mine is operating according to EIA alternative VE2. In scenario 5,
only Suhanko North is in production. In scenario 6, the Tuumasuo and Vaaralampi open
pits are at their maximum extent. In scenario 7, which is EIA alternative VE2+, only the
Little Suhanko open pit is in production. (Pöyry Finland Oy 2013b: 3)
The scenarios are divided into two sub-alternatives, A and B. In sub-alternative A, all
tailings will be stored aboveground and in sub-alternative B flotation tailings will be
placed in the Konttijärvi open pit when it is no longer in production. (Pöyry Finland Oy
2013b: 3)
The highest annual net value of the water balance occurs in scenario 4A, when the
Suhanko North and Ahmavaara open pits have reached their maximum extent. In this
scenario, the annual water balance is 3.24 Mm3/a net positive; during a 1:100 wet year
in terms of hydrological conditions, the water balance would be 6.96 Mm3/a net
positive. (Pöyry Finland Oy 2013b: 38)
20
13
20
14
20
15
20
16
20
17
20
18
20
19
20
20
20
21
20
22
20
23
20
24
20
25
20
26
20
27
20
28
20
29
20
30
20
31
20
32
20
33
20
34
20
35
20
36
20
37
20
38
20
39
20
40
20
41
20
42
20
43
20
44
20
45
20
46
20
47
20
48
20
49
20
50
20
51
Concentrator plant
Konttijärvi pit
Ahmavaara pit
Suhanko North pit
Vaaralampi pit
Tuumasuo pit
Little Suhanko pit
Planning
Construction
Production
Closure
EIA
alternatives
Year
VE0
+
VE1
VE2
VE2
+
Scenario 1 Scenario 2 Scenario 4Scenario 3 Scenario 5 Scenario 6 Scenario 7
48
6.2 Origin of nitrogen and migration of explosive residues in Suhanko
mine
Most of the nitrogen load from the Suhanko mine will originate from explosives, which
is typical in the mining industry. The annual explosive consumption of the mine
depends on the ore production target and the amount of waste rock mining required.
The annual mining rates in EIA alternative VE1, which includes the Konttijärvi,
Ahmavaara and Suhanko North open pits, are based on pre-feasibility study data.
Alternative 2 includes (VE2 and VE2+) the Vaaralampi, Tuumasuo and Little Suhanko
open pits, and the annual mining of ore and waste rock has been estimated based on the
waste rock/ore ratio of the of the ore reserves in the deposit. Total mining will not be
constant even if ore is mined at a rate of 10 Mt/a, as the annual mining rate varies
depending on the waste rock/ore ratio. The annually consumption of explosives has
been calculated based on the mining schedule set out in the pre-feasibility study
(Lycopodium Minerals Pty Ltd 2013: 4.101).
The nitrogen load of explosive residues will be formed in open pit mining activities,
where explosive residues will migrate into different parts of the mine. Figure 8 shows a
conceptual model of nitrogen migration routes in the Suhanko mine. The blue arrows
represent water-leached nitrogen migration and the grey arrows show nitrogen
migration within rock. The orange arrow indicates the gases which are released into the
atmosphere during explosions.
49
Figure 8. Conceptual model of nitrogen migration from explosives at in the Suhanko
mine.
6.2.1 Open pits
Ore will be mined at Suhanko from open pits using the bench blasting and selective
blasting methods. The rock will be extracted using pumpable explosives charged into
vertical drillholes.
The specific charge in ore will be 0.28 kg/t and in waste rock 0.23 kg/t. (Lycopodium
Minerals Pty Ltd 2013: 4,118) In this study the specific charge in the case of low-grade
ore is assumed to be the same as that for ore proper, that is, 0.28 kg/t. The total annual
consumption of explosives has been calculated based on the mining schedule for ore,
low-grade ore and waste rock. The project’s current environmental permit requires that
only explosives containing poorly soluble nitrogen may be used in mining (PSY 2005:
60).
The total annual mining rates at Suhanko will vary each year. The major constraint is
the concentrator feed rate, which should be 10 Mt per year (Lycopodium Minerals Pty
Ltd 2013: 4,94). The total mining rate is projected to reach 60 Mt per year by year 2 and
to remain at that level until year 13 (Figure 9). For the first 14 years the annual mining
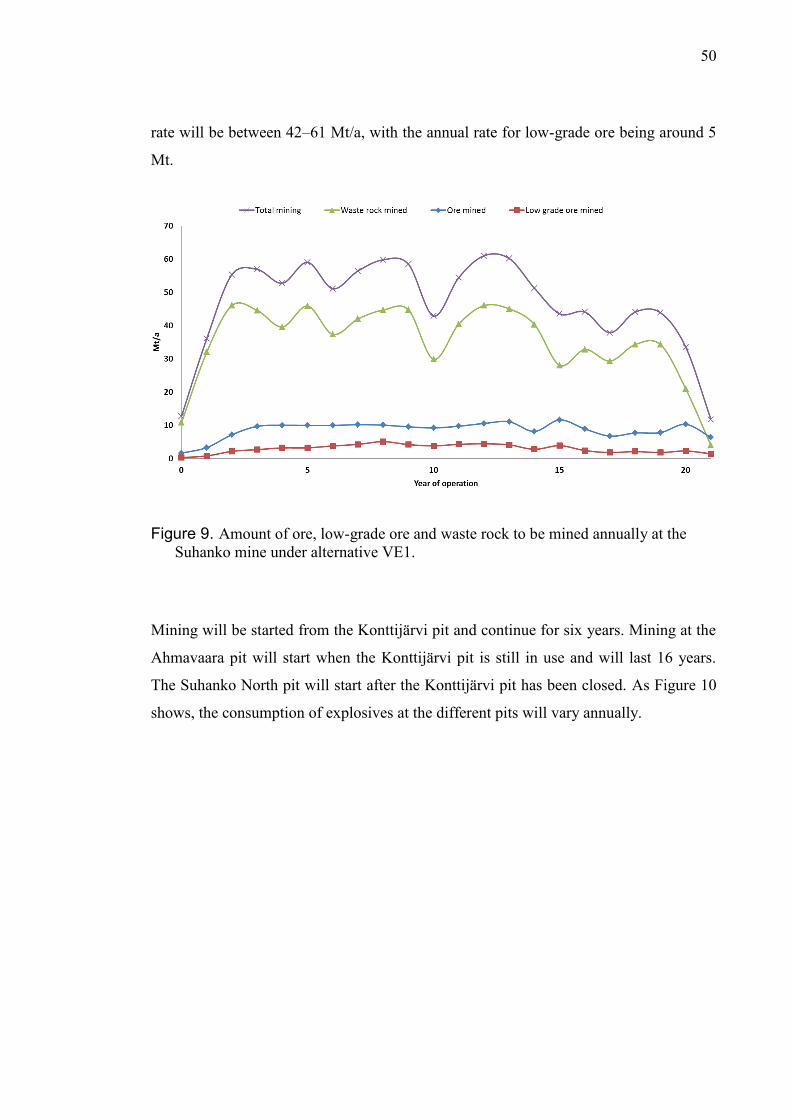
50
rate will be between 42–61 Mt/a, with the annual rate for low-grade ore being around 5
Mt.
Figure 9. Amount of ore, low-grade ore and waste rock to be mined annually at the
Suhanko mine under alternative VE1.
Mining will be started from the Konttijärvi pit and continue for six years. Mining at the
Ahmavaara pit will start when the Konttijärvi pit is still in use and will last 16 years.
The Suhanko North pit will start after the Konttijärvi pit has been closed. As Figure 10
shows, the consumption of explosives at the different pits will vary annually.
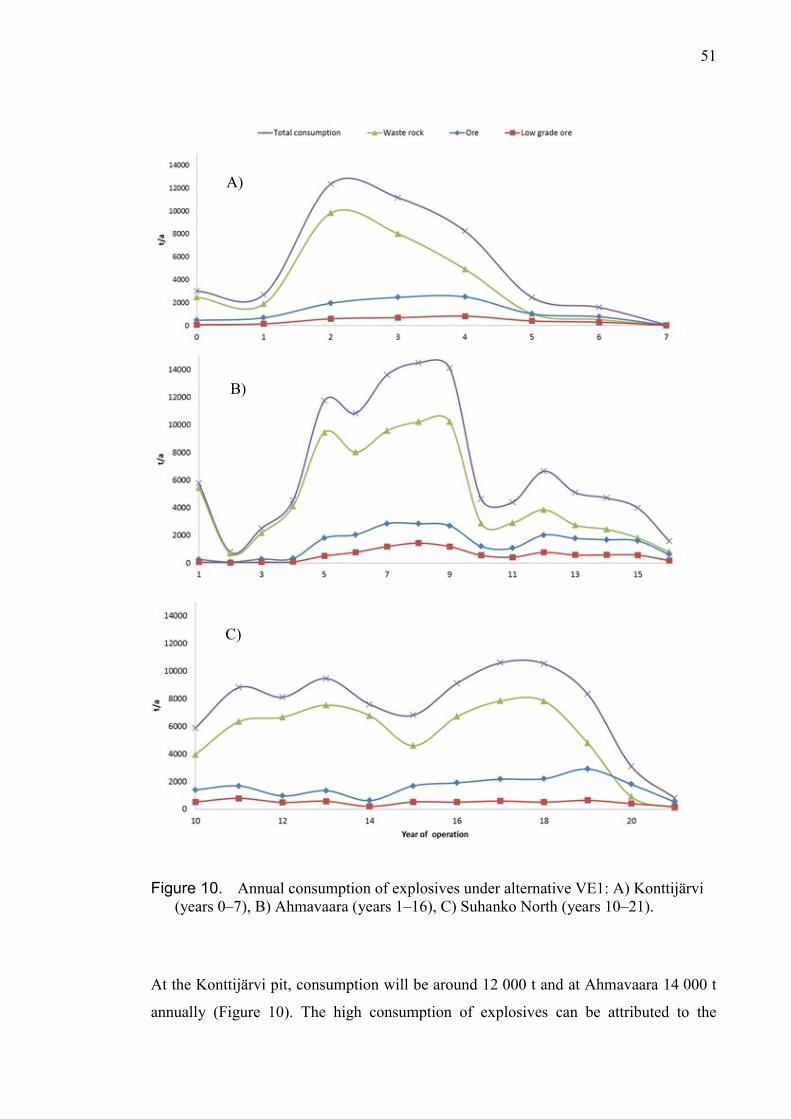
51
Figure 10. Annual consumption of explosives under alternative VE1: A) Konttijärvi
(years 0–7), B) Ahmavaara (years 1–16), C) Suhanko North (years 10–21).
At the Konttijärvi pit, consumption will be around 12 000 t and at Ahmavaara 14 000 t
annually (Figure 10). The high consumption of explosives can be attributed to the
C)
B)
A)
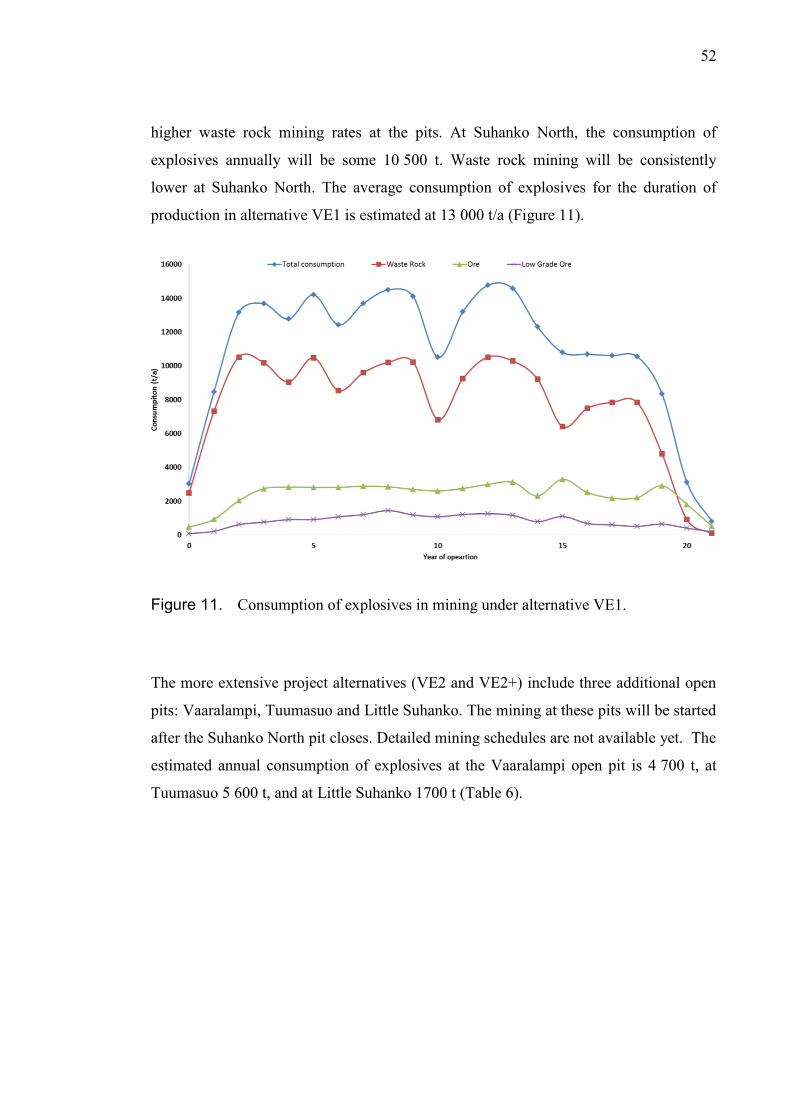
52
higher waste rock mining rates at the pits. At Suhanko North, the consumption of
explosives annually will be some 10 500 t. Waste rock mining will be consistently
lower at Suhanko North. The average consumption of explosives for the duration of
production in alternative VE1 is estimated at 13 000 t/a (Figure 11).
Figure 11. Consumption of explosives in mining under alternative VE1.
The more extensive project alternatives (VE2 and VE2+) include three additional open
pits: Vaaralampi, Tuumasuo and Little Suhanko. The mining at these pits will be started
after the Suhanko North pit closes. Detailed mining schedules are not available yet. The
estimated annual consumption of explosives at the Vaaralampi open pit is 4 700 t, at
Tuumasuo 5 600 t, and at Little Suhanko 1700 t (Table 6).
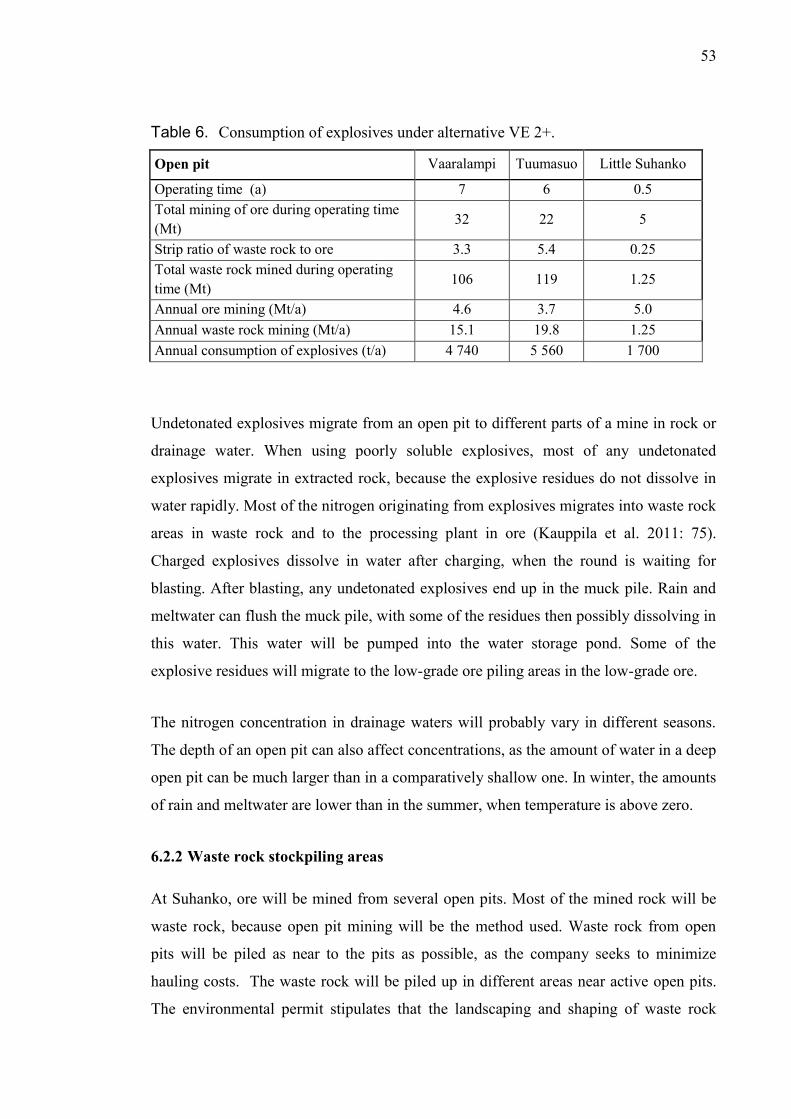
53
Table 6. Consumption of explosives under alternative VE 2+.
Open pit Vaaralampi Tuumasuo Little Suhanko
Operating time (a) 7 6 0.5
Total mining of ore during operating time
(Mt) 32 22 5
Strip ratio of waste rock to ore 3.3 5.4 0.25
Total waste rock mined during operating
time (Mt) 106 119 1.25
Annual ore mining (Mt/a) 4.6 3.7 5.0
Annual waste rock mining (Mt/a) 15.1 19.8 1.25
Annual consumption of explosives (t/a) 4 740 5 560 1 700
Undetonated explosives migrate from an open pit to different parts of a mine in rock or
drainage water. When using poorly soluble explosives, most of any undetonated
explosives migrate in extracted rock, because the explosive residues do not dissolve in
water rapidly. Most of the nitrogen originating from explosives migrates into waste rock
areas in waste rock and to the processing plant in ore (Kauppila et al. 2011: 75).
Charged explosives dissolve in water after charging, when the round is waiting for
blasting. After blasting, any undetonated explosives end up in the muck pile. Rain and
meltwater can flush the muck pile, with some of the residues then possibly dissolving in
this water. This water will be pumped into the water storage pond. Some of the
explosive residues will migrate to the low-grade ore piling areas in the low-grade ore.
The nitrogen concentration in drainage waters will probably vary in different seasons.
The depth of an open pit can also affect concentrations, as the amount of water in a deep
open pit can be much larger than in a comparatively shallow one. In winter, the amounts
of rain and meltwater are lower than in the summer, when temperature is above zero.
6.2.2 Waste rock stockpiling areas
At Suhanko, ore will be mined from several open pits. Most of the mined rock will be
waste rock, because open pit mining will be the method used. Waste rock from open
pits will be piled as near to the pits as possible, as the company seeks to minimize
hauling costs. The waste rock will be piled up in different areas near active open pits.
The environmental permit stipulates that the landscaping and shaping of waste rock

54
piles that have reached their final height and form is to begin while the mine is in
operation and that it is to continue on an annual basis to the extent that such piles have
formed. (PSY 2005: 64) Landscaping of waste rock piles will reduce the amount of
seepage from them.
Undetonated explosives will migrate to the waste rock piling area and some of them will
dissolve in rain and meltwater to create a nitrogen load. This process will probably be
very slow and not all of the explosive residues in waste rock will dissolve into seepage
and meltwater during the lifetime of the mine. Thus, the waste rock piles will become
nitrogen stores (Maikkula 2013: 55). It’s a challenge to estimate the nitrogen load of
seepage water from waste rock areas, because published data on the behavior of
explosive residues in waste rock piles are not available.
6.2.3 Stockpiling areas for low-grade ore
Part of the rock extracted from open pits will be low-grade ore. Low-grade ore will be
processed after all the open pits have been mined out and it will be piled in storage areas
of its own. According to Suhanko’s current environmental permit, the seepage water
from low-grade ore piling areas may not be discharged into the environment but rather
must be conducted into the concentrator process water circuit or the tailings pond (PSY
2005: 59).
The volumes of low-grade ore to be mined are quite low when compared to those of ore
proper and waste rock. Explosive residues will migrate to the concentrator with low-
grade ore, because the residues will probably not all dissolve in the seepage water in the
stockpiling area. The amount of explosive residues that will migrate in low-grade ore to
the concentrator is hard to estimate, because the behavior of such residues in low-grade
ore stockpiles has not been studied.
6.2.4 Enrichment process
The concentrator will process 10 Mt of ore annually. The amount of explosive residues
migrating to the concentrator can vary annually. Drainage waters from all the open pits
55
will be conducted to the water storage pond and explosive residues will migrate to the
concentrator with the intake of process water from the pond.
A nitrogen load will also form from the chemicals used in the concentrator. Flotation
will use polyacrylamide-based flocculants. The amounts of dissolved chemicals that
may end up in the tailings pond and that flow into the process water are not well known.
Typically, flocculants are chemicals which adhere to the concentrate if the dosage has
been appropriate. In that case, they do not usually migrate into a mine’s recipient
waters. (Kauppila et al. 2011: 76).
6.3 Assumptions regarding the nitrogen balance
This section details the assumptions and starting values for formulating the nitrogen
balance. The proportion of undetonated explosives and the concentration of nitrogen in
runoff and drainage waters are estimated based on the assumptions set out below.
6.3.1 Explosive residues with rock from open pits
The proportion of explosive residues in rock varies depending on the mining method,
rock properties and water conditions. The consumption of explosive agents is calculated
separately for ore, waste rock and low-grade ore. In this assessment, 6 % of all charged
explosives are assumed to remain unignited in all mined rock.
6.3.2 Explosive residues in runoff waters from waste rock stockpiling areas
The nitrogen concentration of runoff water from waste rock stockpiling areas has been
assessed based on water analyses from an operating mine using the mining method and
explosive agents to those used at Suhanko.
Water monitoring results at the reference mine showed an average concentration of 5.79
mg N/l in runoff water (Table 7). The variation in concentration was between 1.00 and
9.40 mg N/l. The annual mining rate of waste rock at the reference mine was around 15
Mt and water analyses (n=8) and the amount of discharged water indicated a nitrogen
load in runoff water of 5.15 t N/a. The nitrogen load was calculated based on the
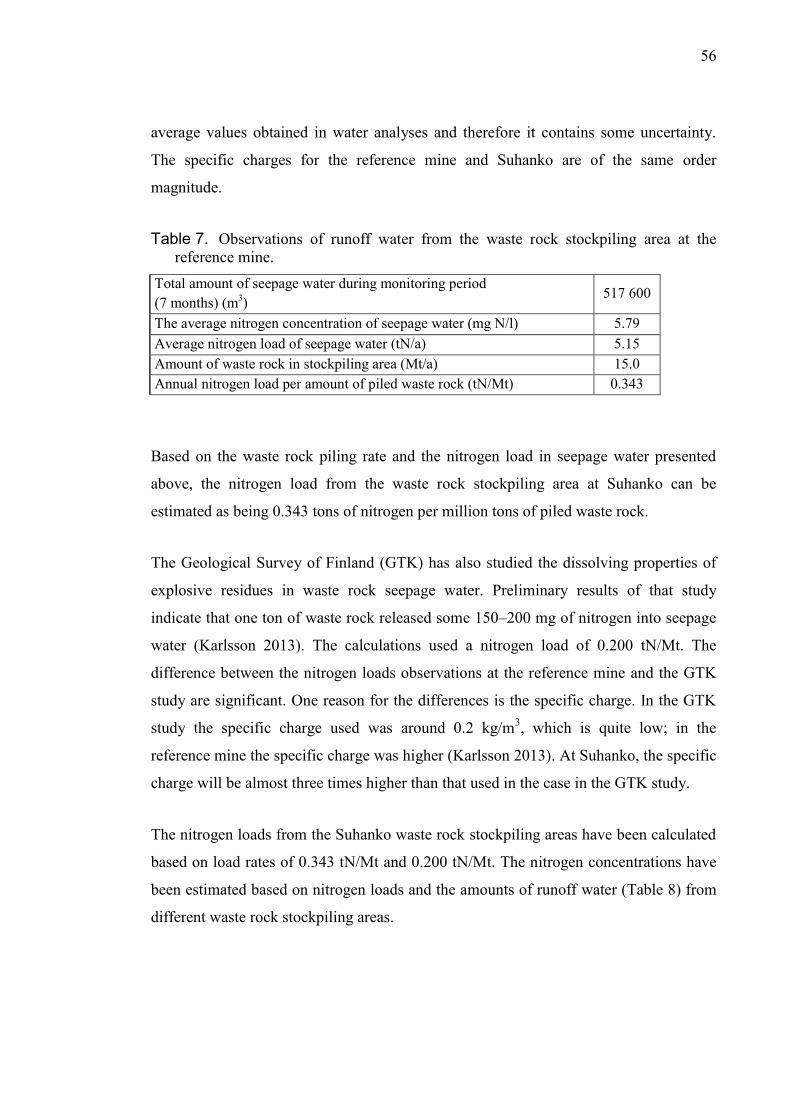
56
average values obtained in water analyses and therefore it contains some uncertainty.
The specific charges for the reference mine and Suhanko are of the same order
magnitude.
Table 7. Observations of runoff water from the waste rock stockpiling area at the
reference mine.
Total amount of seepage water during monitoring period
(7 months) (m3)
517 600
The average nitrogen concentration of seepage water (mg N/l) 5.79
Average nitrogen load of seepage water (tN/a) 5.15
Amount of waste rock in stockpiling area (Mt/a) 15.0
Annual nitrogen load per amount of piled waste rock (tN/Mt) 0.343
Based on the waste rock piling rate and the nitrogen load in seepage water presented
above, the nitrogen load from the waste rock stockpiling area at Suhanko can be
estimated as being 0.343 tons of nitrogen per million tons of piled waste rock.
The Geological Survey of Finland (GTK) has also studied the dissolving properties of
explosive residues in waste rock seepage water. Preliminary results of that study
indicate that one ton of waste rock released some 150–200 mg of nitrogen into seepage
water (Karlsson 2013). The calculations used a nitrogen load of 0.200 tN/Mt. The
difference between the nitrogen loads observations at the reference mine and the GTK
study are significant. One reason for the differences is the specific charge. In the GTK
study the specific charge used was around 0.2 kg/m3, which is quite low; in the
reference mine the specific charge was higher (Karlsson 2013). At Suhanko, the specific
charge will be almost three times higher than that used in the case in the GTK study.
The nitrogen loads from the Suhanko waste rock stockpiling areas have been calculated
based on load rates of 0.343 tN/Mt and 0.200 tN/Mt. The nitrogen concentrations have
been estimated based on nitrogen loads and the amounts of runoff water (Table 8) from
different waste rock stockpiling areas.
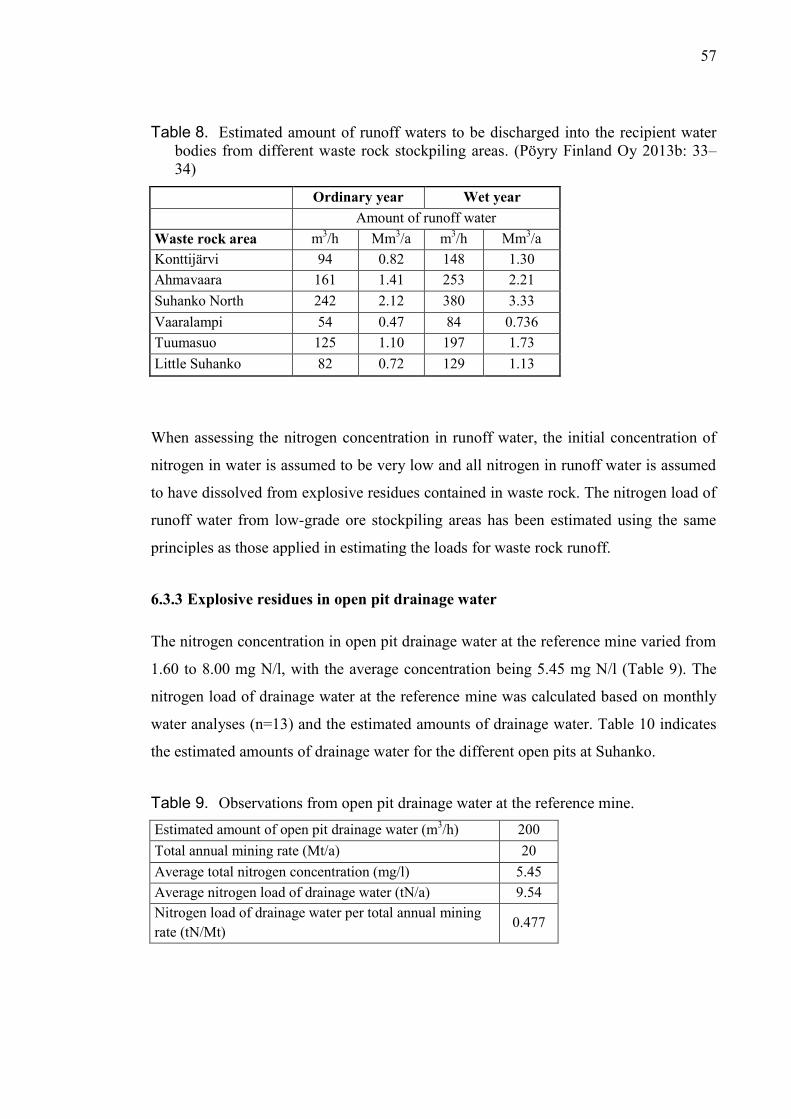
57
Table 8. Estimated amount of runoff waters to be discharged into the recipient water
bodies from different waste rock stockpiling areas. (Pöyry Finland Oy 2013b: 33–
34)
Ordinary year Wet year
Amount of runoff water
Waste rock area m3/h Mm
3/a m
3/h Mm
3/a
Konttijärvi 94 0.82 148 1.30
Ahmavaara 161 1.41 253 2.21
Suhanko North 242 2.12 380 3.33
Vaaralampi 54 0.47 84 0.736
Tuumasuo 125 1.10 197 1.73
Little Suhanko 82 0.72 129 1.13
When assessing the nitrogen concentration in runoff water, the initial concentration of
nitrogen in water is assumed to be very low and all nitrogen in runoff water is assumed
to have dissolved from explosive residues contained in waste rock. The nitrogen load of
runoff water from low-grade ore stockpiling areas has been estimated using the same
principles as those applied in estimating the loads for waste rock runoff.
6.3.3 Explosive residues in open pit drainage water
The nitrogen concentration in open pit drainage water at the reference mine varied from
1.60 to 8.00 mg N/l, with the average concentration being 5.45 mg N/l (Table 9). The
nitrogen load of drainage water at the reference mine was calculated based on monthly
water analyses (n=13) and the estimated amounts of drainage water. Table 10 indicates
the estimated amounts of drainage water for the different open pits at Suhanko.
Table 9. Observations from open pit drainage water at the reference mine.
Estimated amount of open pit drainage water (m3/h) 200
Total annual mining rate (Mt/a) 20
Average total nitrogen concentration (mg/l) 5.45
Average nitrogen load of drainage water (tN/a) 9.54
Nitrogen load of drainage water per total annual mining
rate (tN/Mt) 0.477
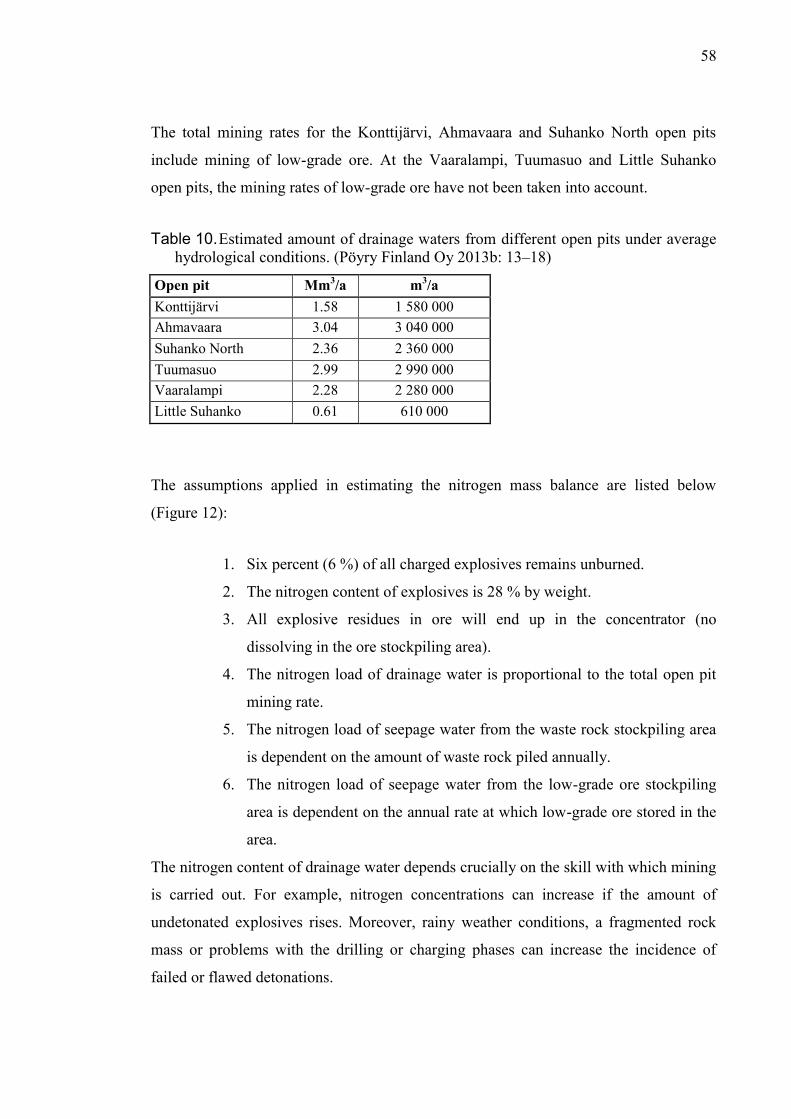
58
The total mining rates for the Konttijärvi, Ahmavaara and Suhanko North open pits
include mining of low-grade ore. At the Vaaralampi, Tuumasuo and Little Suhanko
open pits, the mining rates of low-grade ore have not been taken into account.
Table 10. Estimated amount of drainage waters from different open pits under average
hydrological conditions. (Pöyry Finland Oy 2013b: 13–18)
Open pit Mm3/a m
3/a
Konttijärvi 1.58 1 580 000
Ahmavaara 3.04 3 040 000
Suhanko North 2.36 2 360 000
Tuumasuo 2.99 2 990 000
Vaaralampi 2.28 2 280 000
Little Suhanko 0.61 610 000
The assumptions applied in estimating the nitrogen mass balance are listed below
(Figure 12):
1. Six percent (6 %) of all charged explosives remains unburned.
2. The nitrogen content of explosives is 28 % by weight.
3. All explosive residues in ore will end up in the concentrator (no
dissolving in the ore stockpiling area).
4. The nitrogen load of drainage water is proportional to the total open pit
mining rate.
5. The nitrogen load of seepage water from the waste rock stockpiling area
is dependent on the amount of waste rock piled annually.
6. The nitrogen load of seepage water from the low-grade ore stockpiling
area is dependent on the annual rate at which low-grade ore stored in the
area.
The nitrogen content of drainage water depends crucially on the skill with which mining
is carried out. For example, nitrogen concentrations can increase if the amount of
undetonated explosives rises. Moreover, rainy weather conditions, a fragmented rock
mass or problems with the drilling or charging phases can increase the incidence of
failed or flawed detonations.
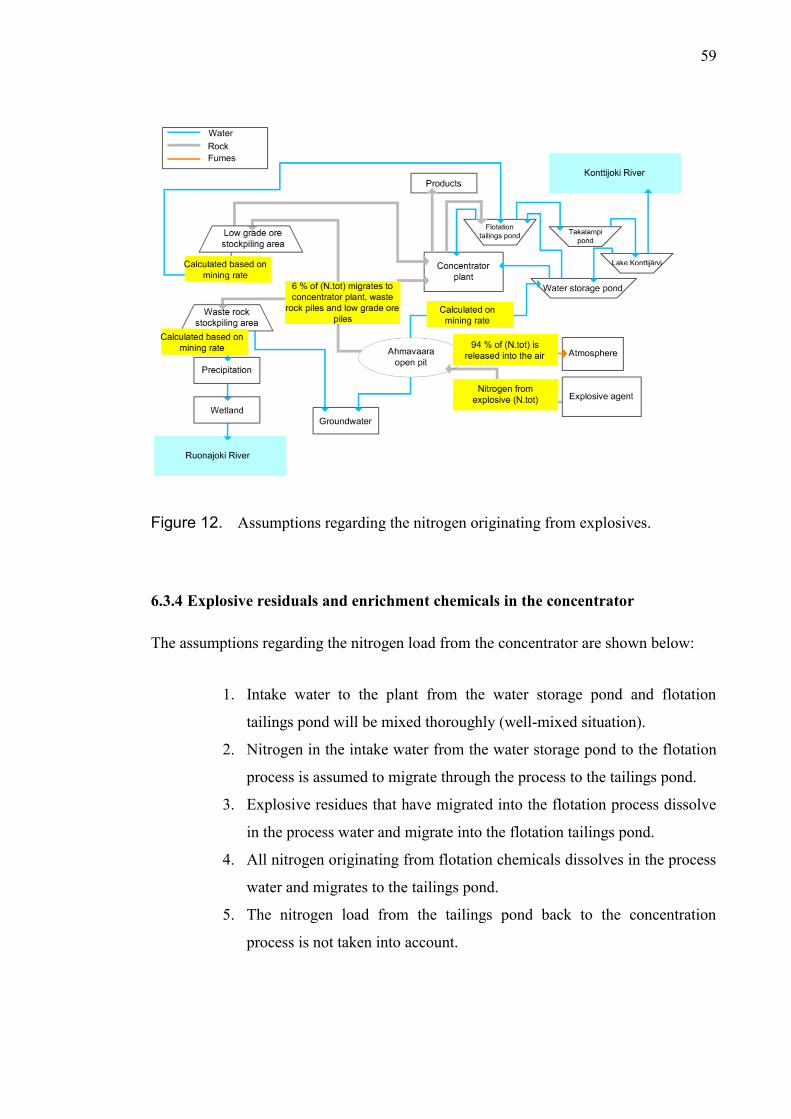
59
Figure 12. Assumptions regarding the nitrogen originating from explosives.
6.3.4 Explosive residuals and enrichment chemicals in the concentrator
The assumptions regarding the nitrogen load from the concentrator are shown below:
1. Intake water to the plant from the water storage pond and flotation
tailings pond will be mixed thoroughly (well-mixed situation).
2. Nitrogen in the intake water from the water storage pond to the flotation
process is assumed to migrate through the process to the tailings pond.
3. Explosive residues that have migrated into the flotation process dissolve
in the process water and migrate into the flotation tailings pond.
4. All nitrogen originating from flotation chemicals dissolves in the process
water and migrates to the tailings pond.
5. The nitrogen load from the tailings pond back to the concentration
process is not taken into account.

60
The annual usage of flocculant is assumed to be around 250 t (Pöyry Finland Oy 2013a:
66). Acrylamide-based flocculant contains around 19.6 % nitrogen, yielding an annual
consumption of 49 t.
6.4 Field studies
The theory of field measurements and the design requirements for wetland water
treatment are presented below.
6.4.1 Treatment wetlands
In general, the structure of a wetland significantly affects nutrient reduction in wetland
treatment. The recommendations for designing wetlands have generally been made with
a focus on purifying water from peat-harvesting areas. The water quality of mine runoff
water can differ significantly from that of runoff from peat-harvesting areas. The
properties of peat, the length of the water flow path in the wetland, the effective area of
a wetland and the shape of the surface will all affect the efficiency of nutrient reduction.
Another factor affecting the reduction of nitrogen is the ratio of the given wetland area
to the relevant catchment area (Kløve et al. 2012: 14–16). Efficient purification in a
wetland also requires that the residence time of the water being treated be long enough.
The residence time of water in a wetland is dependent on the gradient, size and shape of
the wetland, as well as the vegetation and bypass flows. (Ihme 1994: 116)
The current environmental permit for Suhanko requires that the local runoff waters from
the stockpiling areas for waste rock and the stockpiling areas for other overburden
material be treated in precipitation ponds and wetlands before being discharging into the
recipient waters (PSY 2005: 59). The runoff waters from waste rock stockpiling areas
will be collected in ditches dug around the area, and the surface area of the wetlands
used for treating runoff waters from waste rock stockpiles should be 3.8 % of the
catchment areas, that is, the areas of the proposed waste rock stockpiles. (PSY 2005: 13)
The thickness of the peat in wetlands used for treating water should be over 0.5 meter so
that the water will not flow through the peat into the soil (Ihme 1994: 122). Hydraulic
61
loads to the wetland should be less than 340 m3/ha/d. What a suitable hydraulic load is
depends on the quality of the water to be treated. The recommended hydraulic load is
defined based on water from peat-harvesting sites and the quality of mine water can
differ from this. The slope of the peatland should be less than 10 ‰. (Ihme 1994: 118–
119) The slopes of the potential treatment areas were estimated based on laser scanning
data from the Suhanko project area (Pöyry Finland Oy 2012b). The slopes and direction
of slopes made it possible to estimate the possible flow lengths and flow directions in
potential wetland areas.
If the peat in the wetland is only slightly decomposed, the reduction of nitrate and nitrite
nitrogen will probably be higher than in wetlands where the peat is more highly
decomposed. It has also been noticed that the length of the flow path of water can affect
nitrate and nitrite reduction in wetlands. (Tuukkanen et al. 2012: 53–56)
6.4.2 Field studies of peatlands used for wetland treatment
The objective of the field study was to find peatland areas suitable for treating runoff
waters from the waste rock stockpiling areas. A survey was conducted to identify
suitable wetland areas using aerial photographs based on plans from the prefeasibility
study, after which field measurements were carried out on the potential sites. The aim of
the field study was to identify potential peatlands for water treatment near the waste
rock stockpiling areas of the Konttijärvi and Ahmavaara open pits. Mined waste rock
from the Konttijärvi open pit will be piled in two separate stockpiling areas, designated
the Konttijärvi North and the Konttijärvi South waste rock stockpiling areas.
The hydraulic conductivity of peat was measured in situ for potential treatment
wetlands. Peat samples were collected. An analysis was carried out of the degree of
humification (von Post), porosity and ash content, and a chemical characterization was
performed. In addition, pore water samples were taken during peat sampling and total
nitrogen, phosphorus, iron and aluminum concentrations were analyzed. The ratio of
wetland area to the catchment area for each site was determined. The thickness of the
peat was estimated using manual sounding in different parts of the peatlands. The
chemical characterization of the peat in the samples was performed at the laboratory of
Suomen ympäristöpalvelu Oy and the pore water samples were analyzed at the
62
laboratory of Suomen ympäristökeskus (SYKE). Both laboratories are accredited
facilities.
In situ hydraulic conductivity
Hydraulic conductivity (K) is a parameter needed in determining runoff characteristics
in peatlands (Akanegbu 2013: 7). Hydraulic conductivity measurements provide a basis
for assessing the main layer in which water will flow. In most cases, the vertical
component of K can be different than the horizontal component (Ronkanen & Kløve
2005: 53).
In situ hydraulic conductivities of the peatlands studied were measured by a direct push
piezometer using the falling head method. The principle of this method is to push the
instrument into the soil to the required depth. The method is suitable in saturated
conditions. (Ronkanen & Kløve 2005: 47) The instrument contains a water reservoir
and the rate of drop in the water head in the reservoir provides the basis for calculating
the hydraulic conductivity (Akanegbu 2013: 49). In situ hydraulic conductivities were
measured from peatlands near the Konttijärvi North, Konttijärvi South and Ahmavaara
waste rock stockpiling areas. Measurements were taken from 10 cm to 100 cm below
the surface at 10 cm intervals.
The rate of outflow (q) at the piezometer tip at any time (t) is proportional to the
hydraulic conductivity (K) of the soil and to the unrecovered head difference (H-h).
(Hvorslev 1951, after Ronkanen & Kløve 2005: 47)
( )
( ) (8)
where q is outflow at the piezometer tip [dm3/t],
t is time [s],
r is the radius of reservoir [cm],
h is the water level in the reservoir [cm],
F is a shape factor (8.9),
K is hydraulic conductivity [m/s],
H is the water level at the measuring point [cm].
63
The equation can be rewritten as follows:
(9)
Integrating the equation, solving for the integration constant from the initial condition
h(0)=H0 and taking the natural logarithm (Ronkanen & Kløve 2005: 47), we obtain
(
)
(10)
This equation represents a line on a semi-logarithmic graph. The slope of the line gives
K when F is known (Ronkanen & Kløve 2005: 47). Discharge of water through a
porous medium is defined as follows (Darcy’s law):
(11)
where Q is discharge of water [m3/s]
H is hydraulic head [m],
x is distance in direction of flow [m],
q is specific discharge [m/s], or Darcy’s velocity.
The porosity of the soil affects the flow velocity (Ronkanen & Kløve 2005: 48):
(12)
where n is the effective porosity.
Peat sampling
The peat samples were taken using an auger sampler. The samples were taken from 20-
25 cm below the peatland surface by pushing sharpened metal cylinders into the peat.
The samples were stored in a cool and dark place in plastic bags. The dimensions of the
64
metal cylinders were measured in advance. Water content, porosity and ash content
were assayed in a laboratory.
The weights of fresh peat samples were measured, and the peat samples were dried in an
oven at a temperature of 70 oC for 72 hours. After drying, the peat samples were
weighed again. The volume of the voids in the soil sample was then determined based
on the mass of evaporated water from the sample. The volume of the peat sample was
determined from the dimensions of the metal cylinders and the water content was
calculated from the weight of the wet and dried peat samples using the equation:
[
] (13)
where w is water content (%) by weight,
ma is the weight of the wet sample [g],
mb is the weight of the dried sample [g].
Water content can also be calculated from the following equation:
(14)
where mc is the weight of water in the sample [g]
The porosity of the peat affects the flow velocities of water in different peat layers.
(Ronkanen & Kløve 2005: 50–51). Water can move in the pores between peat particles.
Porosity can be calculated by the equation:
(15)
where n is the porosity of the soil sample (%),
Vv is the volume of the voids in the soil sample [dm3],
VT is the total volume of the soil sample [dm3].
65
Ash content was determined by annealing the dried samples in an oven at a temperature
of 550 o
C for two hours. The crucibles used in annealing were weighed before the
samples were put in them. The weights of the dried sample and the crucible were
measured before and after annealing.
Ash content is calculated using the equation:
(16)
where Y is ash content (%) by weight,
md is the weight of the sample after annealing [g]
mb is the weight of the sample before annealing [g]
Decomposition of peat is a process where organic compounds degrade and form humus.
The degree of peat decomposition was determined generally by using von Post’s scale.
The von Post scale conventionally divides peats into ten classes, labelled H1 to H10. H1
means totally undecomposed and H10 totally decomposed peat. (Laine et al. 2012: 144)
66
7 RESULTS
This section presents the results of the nitrogen mass balance estimation and the field
studies conducted for this research.
7.1 Estimation of the nitrogen mass balance
The nitrogen mass balance calculations were divided to calculations for explosive
residues in rock, the nitrogen load of runoff waters from stockpiling areas, the nitrogen
load of open pit drainage water, and excess process water.
7.1.1 Explosive residues in rock
The nitrogen load from the Ahmavaara open pit to the waste rock stockpiling area for
the pit during its projected 16-year operating time will be around 1140 t. The load from
the Suhanko North pit during its 12 years of operation will be 942 t, and that from
Konttijärvi 422 t during its eight years in production (Table 11). The nitrogen load from
the Tuumasuo open pit will be 401 t. The corresponding loads from the Vaaralampi
open pit will be 359 t, and from the Little Suhanko open pit 4.2 t. The projected annual
nitrogen loads from each pit to its respective waste rock stockpiling area presented in
appendix 1
The average annual load of nitrogen from explosive residues that will migrate with ore
to the concentrator is estimated to be 32.0 t. The load reaching the concentrator will
vary annually depending on which open pits are in production. In the case of the
Ahmavaara pit, a total of 349 t of nitrogen will migrate to the concentrator. The
corresponding figure for the Suhanko North pit is 290 t and the Konttijärvi pit 149 t
(appendix 2). The nitrogen load from the Vaaralampi open pit to the concentrator will
be 132 t during the pit’s operating time. The figure for the Tuumasuo pit is 92.1 t and
for the Little Suhanko pit 21.4 t. The annual loads of nitrogen migrating with ore to the
concentrator are shown in appendix 2.
67
The nitrogen load of explosive residues migrating to low-grade ore stockpiling areas
will be 136 tons in the case of the Ahmavaara pit, 89.8 t in the case of Suhanko North
and 46 t in the case of the Konttijärvi (Appendix 3).
7.1.2 Nitrogen load of runoff water from waste rock and low-grade ore stockpiling
areas
The annual average nitrogen load of runoff water from the waste rock stockpiling areas
will be as follows: Suhanko North, 8.02 t; Ahmavaara 7.26 t; Tuumasuo, 6.80 t;
Konttijärvi, 5.39 t; and Vaaralampi 5.18 t. The nitrogen load of runoff water from the
Little Suhanko waste rock stockpiling area will be some 0.43 t in the site’s half-year
production time (Table 11).
The total nitrogen loads of runoff water at the waste rock stockpiling areas over the
entire life time of open pit production will be 116 t at Ahmavaara, 96.3 t at Suhanko
North, and 43.1 t at Konttijärvi. Table 11 shows that the total nitrogen load at the waste
rock stockpiling areas over the entire operating time of the pit will be 40.8 t at
Tuumasuo, 36.3 t at Vaaralampi and 0.43 t at Little Suhanko (half a year).
Based on these calculations, the average nitrogen content of runoff water from waste
rock stockpiling areas in an ordinary hydrological year will be 10.9 mg N/l at
Vaaralampi, 6.54 mg N/l at Konttijärvi, 6.21 mg N/l at Tuumasuo, 5.15 mg N/l at
Ahmavaara, 3.78 mg N/l at Suhanko North and 1.19mg N/l at Little Suhanko.
The average nitrogen concentration of runoff waters from waste rock stockpiling areas
in exceptionally wet hydrological conditions will be 7.04 mg N/l at Vaaralampi, 4.16
mg N/l at Konttijärvi, 3.94 mg N/l at Tuumasuo, 3.28 mg N/l at Ahmavaara, 2.41 mg
N/l at Suhanko North and 0.76 mg N/l at Little Suhanko (Table 11).
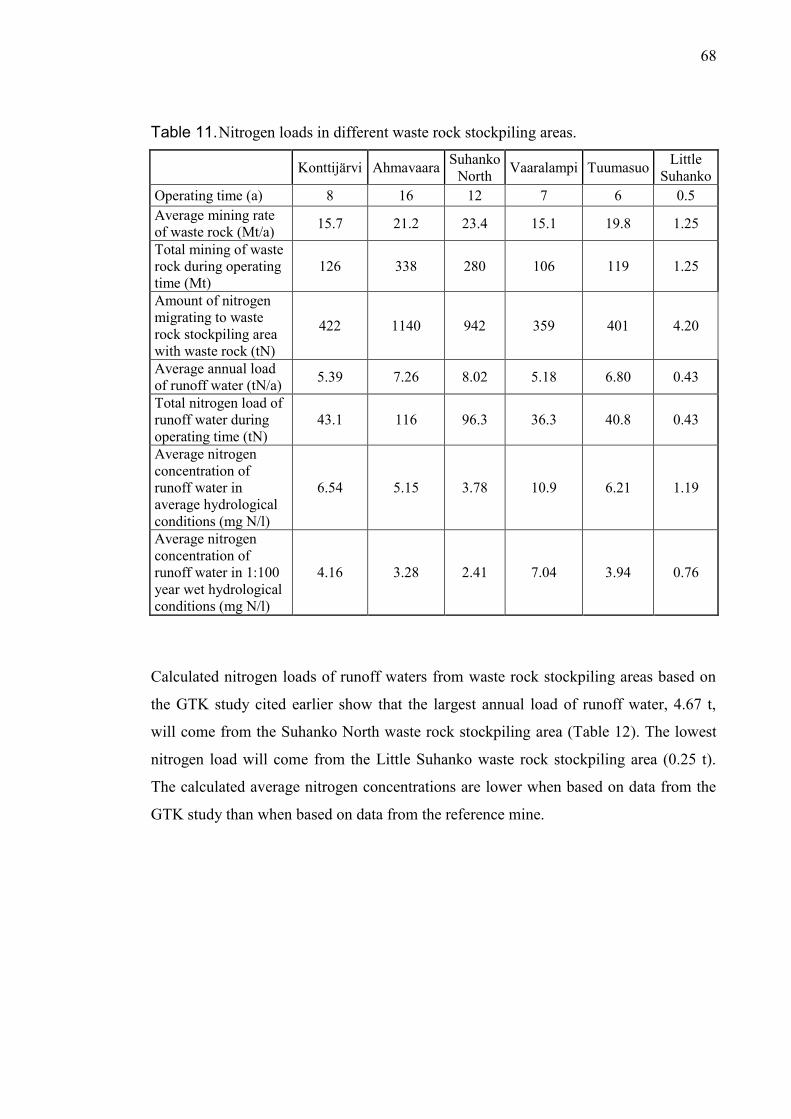
68
Table 11. Nitrogen loads in different waste rock stockpiling areas.
Konttijärvi Ahmavaara Suhanko
North Vaaralampi Tuumasuo
Little
Suhanko
Operating time (a) 8 16 12 7 6 0.5
Average mining rate
of waste rock (Mt/a) 15.7 21.2 23.4 15.1 19.8 1.25
Total mining of waste
rock during operating
time (Mt)
126 338 280 106 119 1.25
Amount of nitrogen
migrating to waste
rock stockpiling area
with waste rock (tN)
422 1140 942 359 401 4.20
Average annual load
of runoff water (tN/a) 5.39 7.26 8.02 5.18 6.80 0.43
Total nitrogen load of
runoff water during
operating time (tN)
43.1 116 96.3 36.3 40.8 0.43
Average nitrogen
concentration of
runoff water in
average hydrological
conditions (mg N/l)
6.54 5.15 3.78 10.9 6.21 1.19
Average nitrogen
concentration of
runoff water in 1:100
year wet hydrological
conditions (mg N/l)
4.16 3.28 2.41 7.04 3.94 0.76
Calculated nitrogen loads of runoff waters from waste rock stockpiling areas based on
the GTK study cited earlier show that the largest annual load of runoff water, 4.67 t,
will come from the Suhanko North waste rock stockpiling area (Table 12). The lowest
nitrogen load will come from the Little Suhanko waste rock stockpiling area (0.25 t).
The calculated average nitrogen concentrations are lower when based on data from the
GTK study than when based on data from the reference mine.
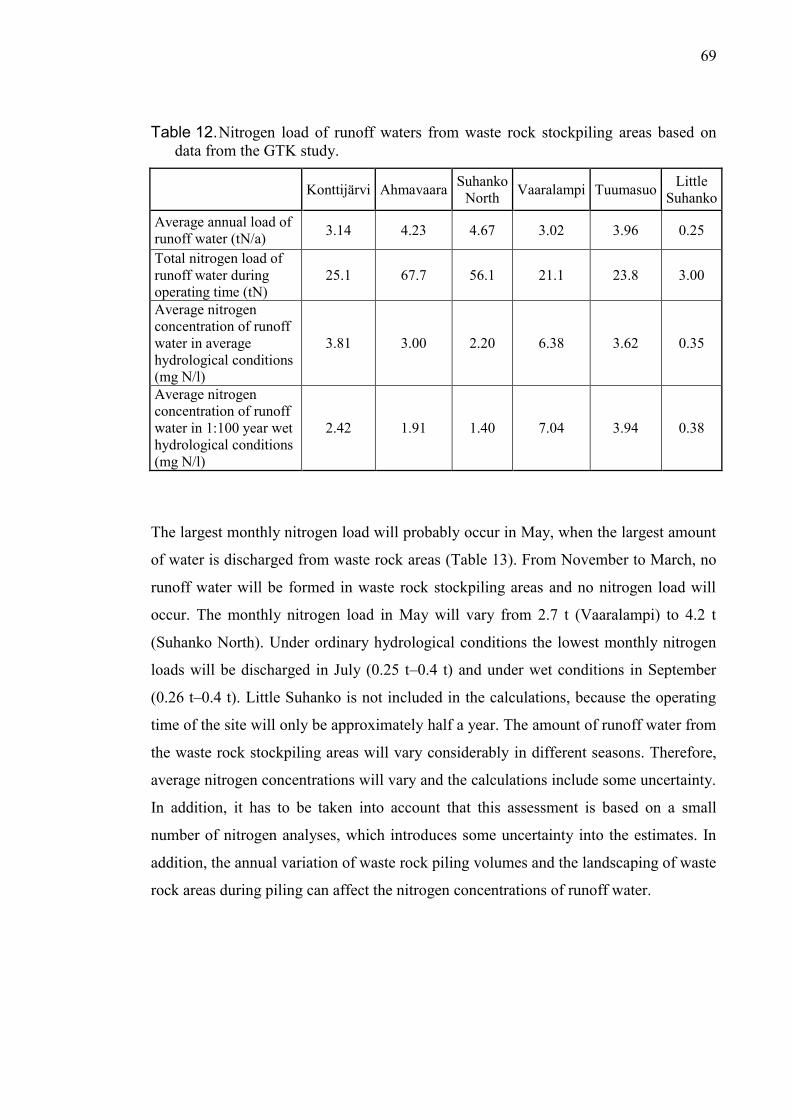
69
Table 12. Nitrogen load of runoff waters from waste rock stockpiling areas based on
data from the GTK study.
Konttijärvi Ahmavaara Suhanko
North Vaaralampi Tuumasuo
Little
Suhanko
Average annual load of
runoff water (tN/a) 3.14 4.23 4.67 3.02 3.96 0.25
Total nitrogen load of
runoff water during
operating time (tN)
25.1 67.7 56.1 21.1 23.8 3.00
Average nitrogen
concentration of runoff
water in average
hydrological conditions
(mg N/l)
3.81 3.00 2.20 6.38 3.62 0.35
Average nitrogen
concentration of runoff
water in 1:100 year wet
hydrological conditions
(mg N/l)
2.42 1.91 1.40 7.04 3.94 0.38
The largest monthly nitrogen load will probably occur in May, when the largest amount
of water is discharged from waste rock areas (Table 13). From November to March, no
runoff water will be formed in waste rock stockpiling areas and no nitrogen load will
occur. The monthly nitrogen load in May will vary from 2.7 t (Vaaralampi) to 4.2 t
(Suhanko North). Under ordinary hydrological conditions the lowest monthly nitrogen
loads will be discharged in July (0.25 t–0.4 t) and under wet conditions in September
(0.26 t–0.4 t). Little Suhanko is not included in the calculations, because the operating
time of the site will only be approximately half a year. The amount of runoff water from
the waste rock stockpiling areas will vary considerably in different seasons. Therefore,
average nitrogen concentrations will vary and the calculations include some uncertainty.
In addition, it has to be taken into account that this assessment is based on a small
number of nitrogen analyses, which introduces some uncertainty into the estimates. In
addition, the annual variation of waste rock piling volumes and the landscaping of waste
rock areas during piling can affect the nitrogen concentrations of runoff water.

70
Table 13. Monthly nitrogen loads of runoff water from waste rock stockpiling areas.
Month
1 2 3 4 5 6 7 8 9 10 11 12
Ordinary year (kg N/month) Total
(tN/a)
Ahmavaara 0 0 0 997 3812 597 360 406 449 655 0 0 7.26
Konttijärvi 0 0 0 740 2824 443 268 302 335 487 0 0 5.39
Suhanko North 0 0 0 1098 4203 657 397 448 496 721 0 0 8.02
Tuumasuo 0 0 0 934 3575 559 337 383 420 614 0 0 6.80
Vaaralampi 0 0 0 710 2705 426 253 285 315 464 0 0 5.18
Wet year (kg N/month) Total
(tN/a)
Ahmavaara 0 0 0 854 3689 595 578 653 366 531 0 0 7.26
Konttijärvi 0 0 0 631 2727 440 427 482 269 393 0 0 5.39
Suhanko North 0 0 0 942 4068 654 638 721 402 584 0 0 8.02
Tuumasuo 0 0 0 800 3447 556 539 610 343 495 0 0 6.80
Vaaralampi 0 0 0 613 2639 426 414 466 264 382 0 0 5.18
Table 14 shows that annual nitrogen loads from low-grade ore stockpiling areas will be
0.46 t at Konttijärvi, 0.68 t at Ahmavaara, and 0.60 t at Suhanko North.
Table 14. Nitrogen loads from low grade ore stockpiling areas in alternative VE1.
Konttijärvi Ahmavaara
Suhanko
North
Total nitrogen load from stockpiling area during
operating time (tN) 3.69 10.9 7.21
Average annual nitrogen load from stockpiling
areas (tN/a) 0.46 0.68 0.60
7.1.3 Nitrogen load from open pit drainage water
In an average hydrological year, the nitrogen content of the drainage water from the
Konttijärvi open pit will be 6.67 mg N/l, from Suhanko North 6.22 mg N/l, and from
Ahmavaara 4.43 mg N/l (Table 15). The estimated nitrogen concentration of drainage
water from the Vaaralampi open pit will be 4.11 mg N/l, from Tuumasuo 3.74 mg N/l,
and from Little Suhanko 9.78 mg N/l.
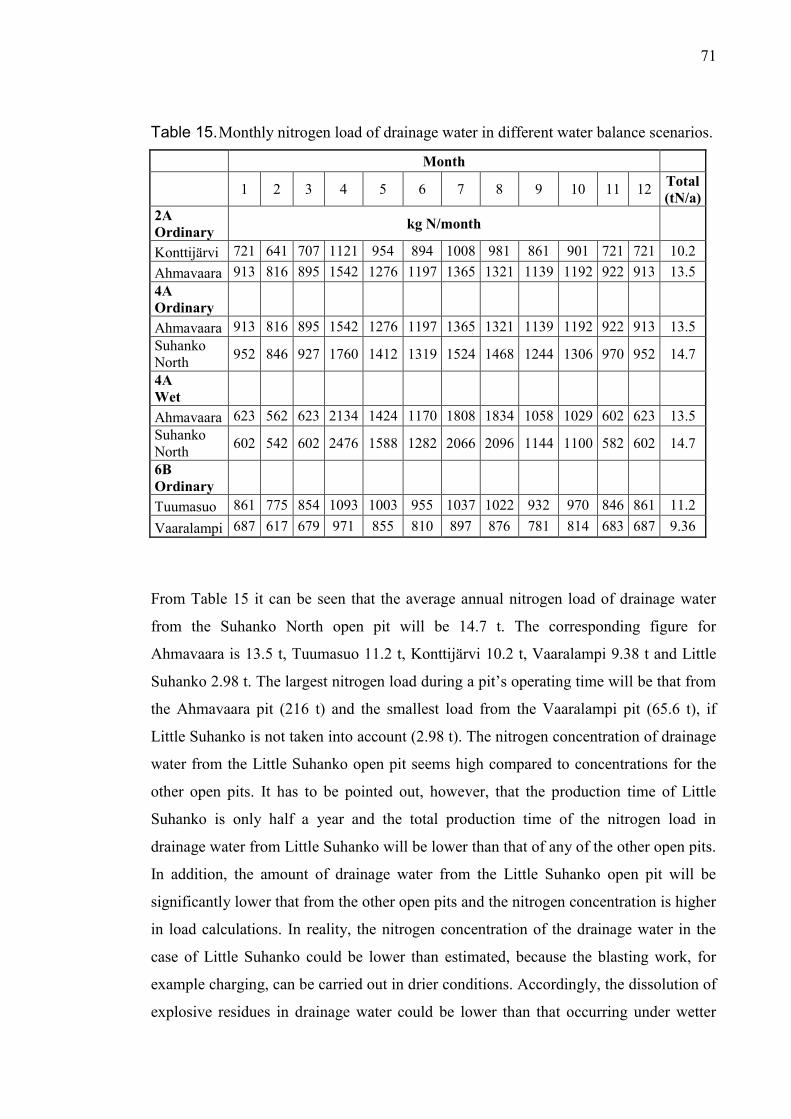
71
Table 15. Monthly nitrogen load of drainage water in different water balance scenarios.
Month
1 2 3 4 5 6 7 8 9 10 11 12
Total
(tN/a)
2A
Ordinary kg N/month
Konttijärvi 721 641 707 1121 954 894 1008 981 861 901 721 721 10.2
Ahmavaara 913 816 895 1542 1276 1197 1365 1321 1139 1192 922 913 13.5
4A
Ordinary
Ahmavaara 913 816 895 1542 1276 1197 1365 1321 1139 1192 922 913 13.5
Suhanko
North 952 846 927 1760 1412 1319 1524 1468 1244 1306 970 952 14.7
4A
Wet
Ahmavaara 623 562 623 2134 1424 1170 1808 1834 1058 1029 602 623 13.5
Suhanko
North 602 542 602 2476 1588 1282 2066 2096 1144 1100 582 602 14.7
6B
Ordinary
Tuumasuo 861 775 854 1093 1003 955 1037 1022 932 970 846 861 11.2
Vaaralampi 687 617 679 971 855 810 897 876 781 814 683 687 9.36
From Table 15 it can be seen that the average annual nitrogen load of drainage water
from the Suhanko North open pit will be 14.7 t. The corresponding figure for
Ahmavaara is 13.5 t, Tuumasuo 11.2 t, Konttijärvi 10.2 t, Vaaralampi 9.38 t and Little
Suhanko 2.98 t. The largest nitrogen load during a pit’s operating time will be that from
the Ahmavaara pit (216 t) and the smallest load from the Vaaralampi pit (65.6 t), if
Little Suhanko is not taken into account (2.98 t). The nitrogen concentration of drainage
water from the Little Suhanko open pit seems high compared to concentrations for the
other open pits. It has to be pointed out, however, that the production time of Little
Suhanko is only half a year and the total production time of the nitrogen load in
drainage water from Little Suhanko will be lower than that of any of the other open pits.
In addition, the amount of drainage water from the Little Suhanko open pit will be
significantly lower that from the other open pits and the nitrogen concentration is higher
in load calculations. In reality, the nitrogen concentration of the drainage water in the
case of Little Suhanko could be lower than estimated, because the blasting work, for
example charging, can be carried out in drier conditions. Accordingly, the dissolution of
explosive residues in drainage water could be lower than that occurring under wetter

72
conditions (Kauppila et al. 2013: 65). The annual nitrogen loads of drainage water from
different open pits are shown in appendix 4.
The monthly nitrogen loads of drainage waters in different water balance scenarios are
shown in Table 16. In general, nitrogen loads will be higher in summertime than in
wintertime Tables 16 and 17 show that significant nitrogen loads of drainage waters will
form in April. In scenario 4A, under wet hydrological conditions, during April around
2.5 t of nitrogen will migrate to the water storage pond from the Suhanko North open
pit, and 2.1 t from the Ahmavaara pit.
Table 16. The monthly nitrogen load of drainage water in different water balance
scenarios at double nitrogen concentrations.
Month
1 2 3 4 5 6 7 8 9 10 11 12
Total
(tN/a)
2A
Ordinary kg N/month
Konttijärvi 1441 1281 1415 2242 1908 1788 2015 1962 1721 1802 1441 1441 20.5
Ahmavaara 1826 1631 1791 3085 2553 2393 2730 2642 2278 2384 1844 1826 27.0
4A
Ordinary
Ahmavaara 1826 1631 1791 3085 2553 2393 2730 2642 2278 2384 1844 1826 27.0
Suhanko
North 1904 1692 1854 3521 2824 2638 3048 2936 2488 2613 1941 1904 29.4
4A
Wet
Ahmavaara 1247 1123 1247 4269 2848 2341 3617 3667 2116 2058 1203 1247 27.0
Suhanko
North 1203 1085 1203 4951 3176 2564 4133 4192 2288 2199 1164 1203 29.4
6B
Ordinary
Tuumasuo 1722 1550 1707 2186 2007 1909 2074 2044 1864 1939 1692 1722 22.4
Vaaralampi 1374 1234 1357 1941 1711 1620 1793 1752 1563 1629 1365 1374 18.7
The monthly nitrogen load of drainage water from Little Suhanko has not been
calculated, because the production time of the pit will be only about half a year. Water
monitoring data from operating mines (Table 3) shows that the nitrogen concentration
can vary significantly compared to the average values. The nitrogen load of drainage
water at the Suhanko mine has also been calculated at double the nitrogen concentration
in order compare the nitrogen loads of drainage water on the concentrator if blasting
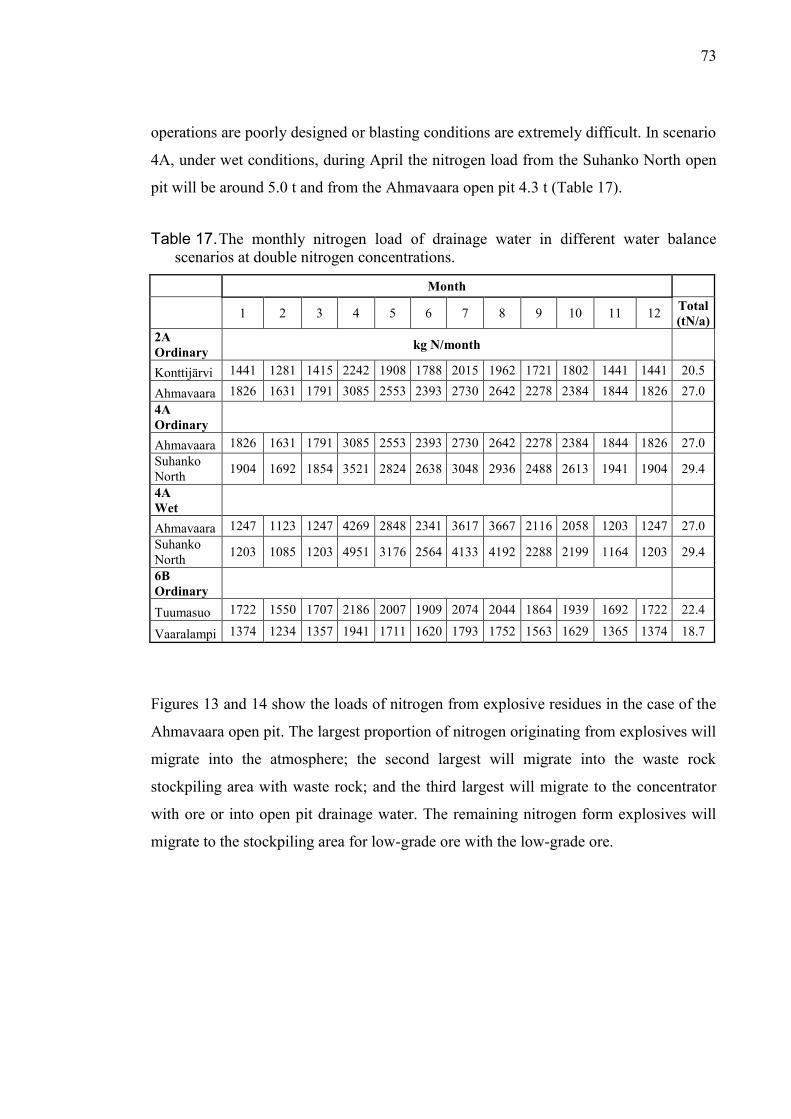
73
operations are poorly designed or blasting conditions are extremely difficult. In scenario
4A, under wet conditions, during April the nitrogen load from the Suhanko North open
pit will be around 5.0 t and from the Ahmavaara open pit 4.3 t (Table 17).
Table 17. The monthly nitrogen load of drainage water in different water balance
scenarios at double nitrogen concentrations.
Month
1 2 3 4 5 6 7 8 9 10 11 12
Total
(tN/a)
2A
Ordinary kg N/month
Konttijärvi 1441 1281 1415 2242 1908 1788 2015 1962 1721 1802 1441 1441 20.5
Ahmavaara 1826 1631 1791 3085 2553 2393 2730 2642 2278 2384 1844 1826 27.0
4A
Ordinary
Ahmavaara 1826 1631 1791 3085 2553 2393 2730 2642 2278 2384 1844 1826 27.0
Suhanko
North 1904 1692 1854 3521 2824 2638 3048 2936 2488 2613 1941 1904 29.4
4A
Wet
Ahmavaara 1247 1123 1247 4269 2848 2341 3617 3667 2116 2058 1203 1247 27.0
Suhanko
North 1203 1085 1203 4951 3176 2564 4133 4192 2288 2199 1164 1203 29.4
6B
Ordinary
Tuumasuo 1722 1550 1707 2186 2007 1909 2074 2044 1864 1939 1692 1722 22.4
Vaaralampi 1374 1234 1357 1941 1711 1620 1793 1752 1563 1629 1365 1374 18.7
Figures 13 and 14 show the loads of nitrogen from explosive residues in the case of the
Ahmavaara open pit. The largest proportion of nitrogen originating from explosives will
migrate into the atmosphere; the second largest will migrate into the waste rock
stockpiling area with waste rock; and the third largest will migrate to the concentrator
with ore or into open pit drainage water. The remaining nitrogen form explosives will
migrate to the stockpiling area for low-grade ore with the low-grade ore.
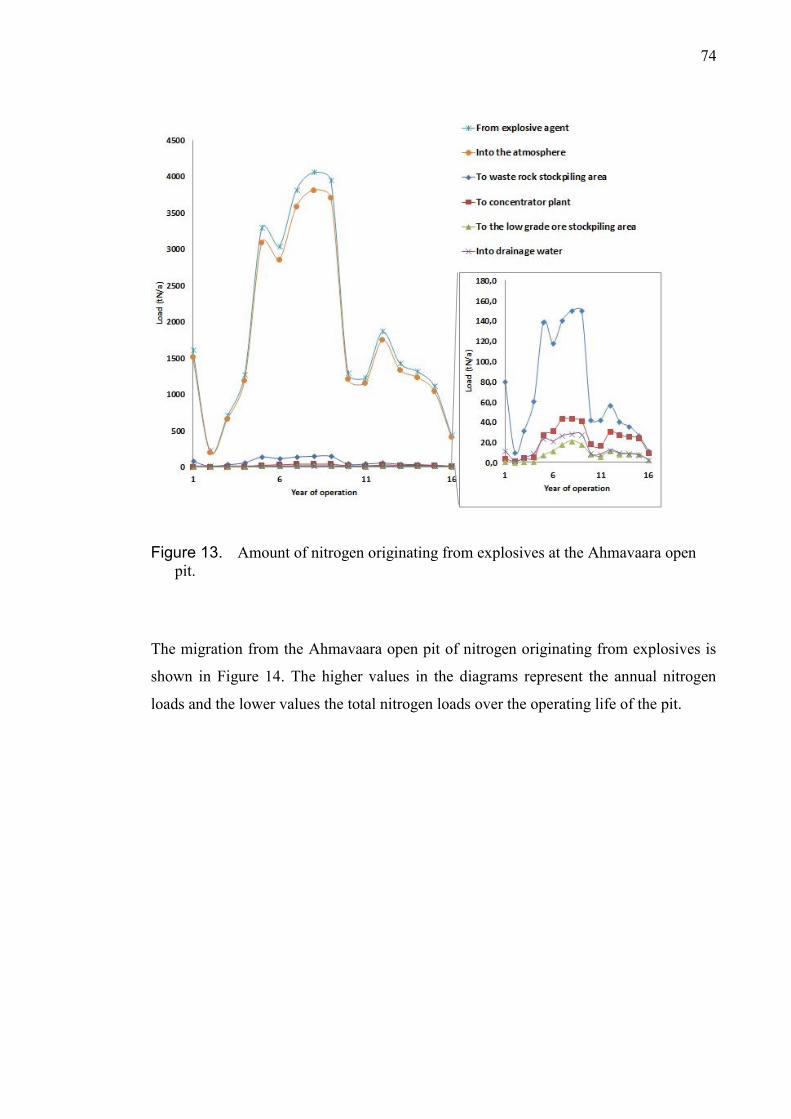
74
Figure 13. Amount of nitrogen originating from explosives at the Ahmavaara open
pit.
The migration from the Ahmavaara open pit of nitrogen originating from explosives is
shown in Figure 14. The higher values in the diagrams represent the annual nitrogen
loads and the lower values the total nitrogen loads over the operating life of the pit.

75
Figure 14. Average annual amount and total amount of nitrogen originating from
explosives at the Ahmavaara open pit.
7.1.4 Nitrogen load of process water
The average annual rate of nitrogen from explosive residues that is conducted to the
concentrator with ore will be around 32.0 t. The variation in the annual amount will be
between 14.1 and 49.7 t. The annual loads of nitrogen are shown in appendix 2.
The open pit drainage water containing nitrogen from explosive residues will be
conducted to the water storage pond. Process water for the concentrator will be taken
from the water storage pond and excess water will be conducted to the flotation tailings
pond. The average nitrogen load of drainage waters to the water storage pond will be
19.0 t and the annual load will vary between 5.6 and 29.1 t (appendix 4).
In water balance scenario 2A, the Konttijärvi and Ahmavaara open pits will be in
production. The annual nitrogen load of drainage waters to the water storage pond from
the Konttijärvi open pit will be 10.2 t and from the Ahmavaara open pit 13.5 t (appendix
4). The annual net amount of incoming waters to the water storage pond in water
76
balance scenario 2 will be 4.94 Mm3 (Pöyry Finland Oy 2013b: 26). Based on the
parameters above, the nitrogen concentration of water in the water storage pond will be
around 4.80 mg N/l (Table 18). The water intake for the concentration process will be
2.89 Mm3/a and, assuming the nitrogen concentration of the water in the water storage
pond to be 4.80 mg N/l, the nitrogen load of the process intake water will be 13.9 t. The
excess water from the water storage pond will be conducted into the flotation tailings
pond. The amount of such excess water in scenario 2 will be 1.8 Mm3 annually. If the
nitrogen content of the water in the water storage pond is still 4.80 mg N/l, the nitrogen
load of the excess water conducted into the flotation tailings pond will be 8.64 t.
The nitrogen load from the Konttijärvi and Ahmavaara stockpiling areas for low-grade
ore will be around 1.14 t in scenario 2A (Table18) and the amount of runoff water will
be 0.21 Mm3/a. The nitrogen concentration of runoff water from low-grade ore is
estimated to be 5.44 mg N/l.
The above calculations indicate that the total annual nitrogen load to the flotation
tailings pond will be 113 t. The annual amount of incoming water to the flotation
tailings pond in scenario 2 is 5.78 Mm3. The nitrogen concentration of the water in the
tailings pond in an ordinary hydrological year will be 19.6 mg N/l (Table 18). In an
exceptionally wet year, the nitrogen concentration of water in the tailings pond will be
13.9 mg N/l. The amount of excess water from the tailings pond in an ordinary year will
be 0.90 Mm3/a and the nitrogen load flowing into Takalampi Pond will be 17.6 t. In an
exceptionally wet year, the nitrogen load in the excess water discharged into Takalampi
Pond will be 47.2 t.
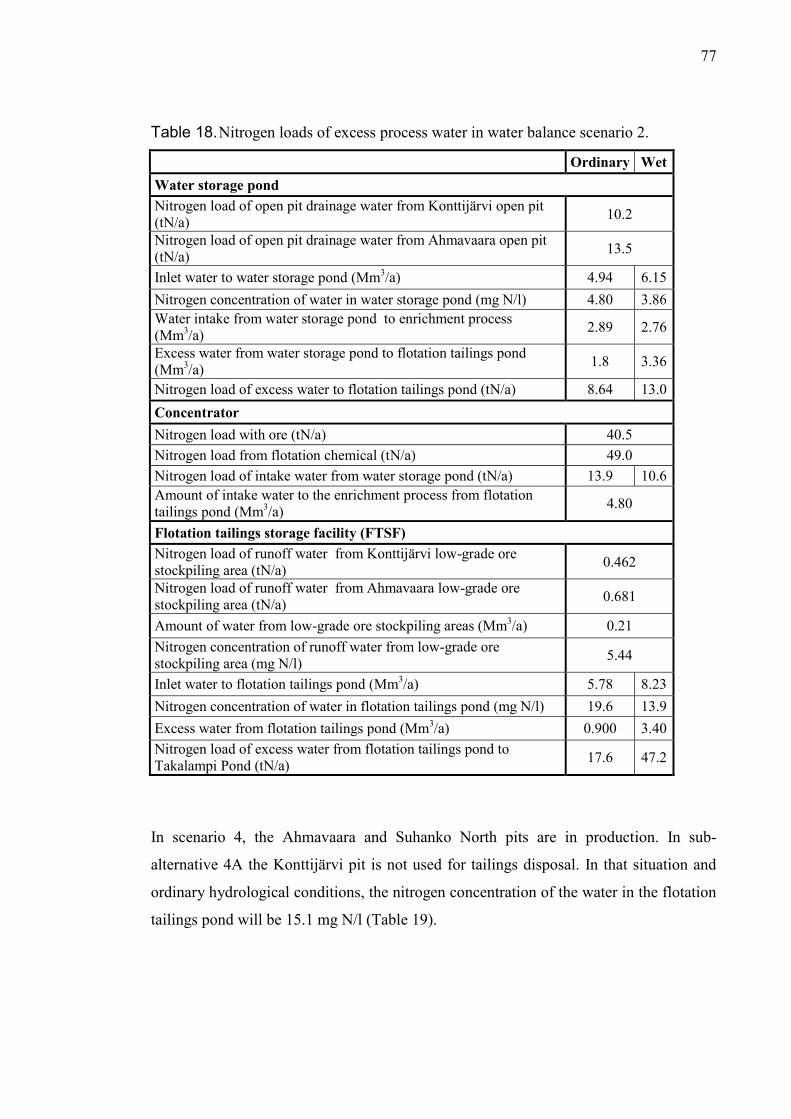
77
Table 18. Nitrogen loads of excess process water in water balance scenario 2.
Ordinary Wet
Water storage pond
Nitrogen load of open pit drainage water from Konttijärvi open pit
(tN/a) 10.2
Nitrogen load of open pit drainage water from Ahmavaara open pit
(tN/a) 13.5
Inlet water to water storage pond (Mm3/a) 4.94 6.15
Nitrogen concentration of water in water storage pond (mg N/l) 4.80 3.86
Water intake from water storage pond to enrichment process
(Mm3/a)
2.89 2.76
Excess water from water storage pond to flotation tailings pond
(Mm3/a)
1.8 3.36
Nitrogen load of excess water to flotation tailings pond (tN/a) 8.64 13.0
Concentrator
Nitrogen load with ore (tN/a) 40.5
Nitrogen load from flotation chemical (tN/a) 49.0
Nitrogen load of intake water from water storage pond (tN/a) 13.9 10.6
Amount of intake water to the enrichment process from flotation
tailings pond (Mm3/a)
4.80
Flotation tailings storage facility (FTSF)
Nitrogen load of runoff water from Konttijärvi low-grade ore
stockpiling area (tN/a) 0.462
Nitrogen load of runoff water from Ahmavaara low-grade ore
stockpiling area (tN/a) 0.681
Amount of water from low-grade ore stockpiling areas (Mm3/a) 0.21
Nitrogen concentration of runoff water from low-grade ore
stockpiling area (mg N/l) 5.44
Inlet water to flotation tailings pond (Mm3/a) 5.78 8.23
Nitrogen concentration of water in flotation tailings pond (mg N/l) 19.6 13.9
Excess water from flotation tailings pond (Mm3/a) 0.900 3.40
Nitrogen load of excess water from flotation tailings pond to
Takalampi Pond (tN/a) 17.6 47.2
In scenario 4, the Ahmavaara and Suhanko North pits are in production. In sub-
alternative 4A the Konttijärvi pit is not used for tailings disposal. In that situation and
ordinary hydrological conditions, the nitrogen concentration of the water in the flotation
tailings pond will be 15.1 mg N/l (Table 19).
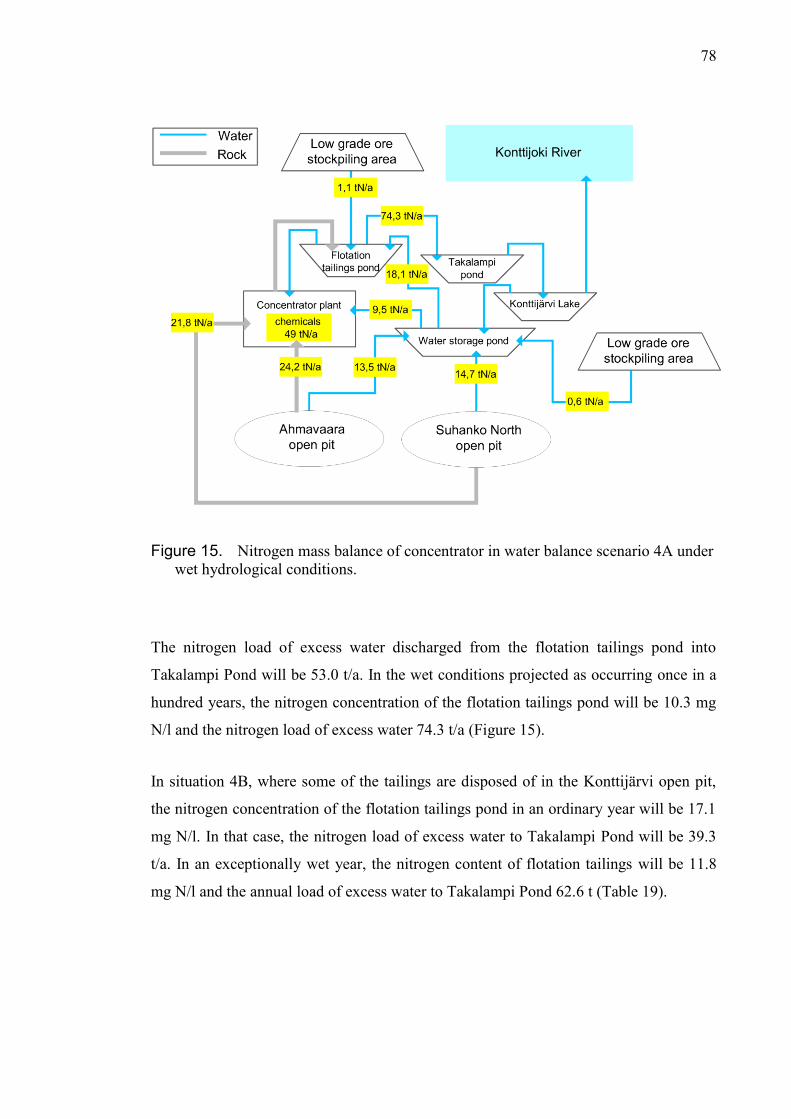
78
Figure 15. Nitrogen mass balance of concentrator in water balance scenario 4A under
wet hydrological conditions.
The nitrogen load of excess water discharged from the flotation tailings pond into
Takalampi Pond will be 53.0 t/a. In the wet conditions projected as occurring once in a
hundred years, the nitrogen concentration of the flotation tailings pond will be 10.3 mg
N/l and the nitrogen load of excess water 74.3 t/a (Figure 15).
In situation 4B, where some of the tailings are disposed of in the Konttijärvi open pit,
the nitrogen concentration of the flotation tailings pond in an ordinary year will be 17.1
mg N/l. In that case, the nitrogen load of excess water to Takalampi Pond will be 39.3
t/a. In an exceptionally wet year, the nitrogen content of flotation tailings will be 11.8
mg N/l and the annual load of excess water to Takalampi Pond 62.6 t (Table 19).
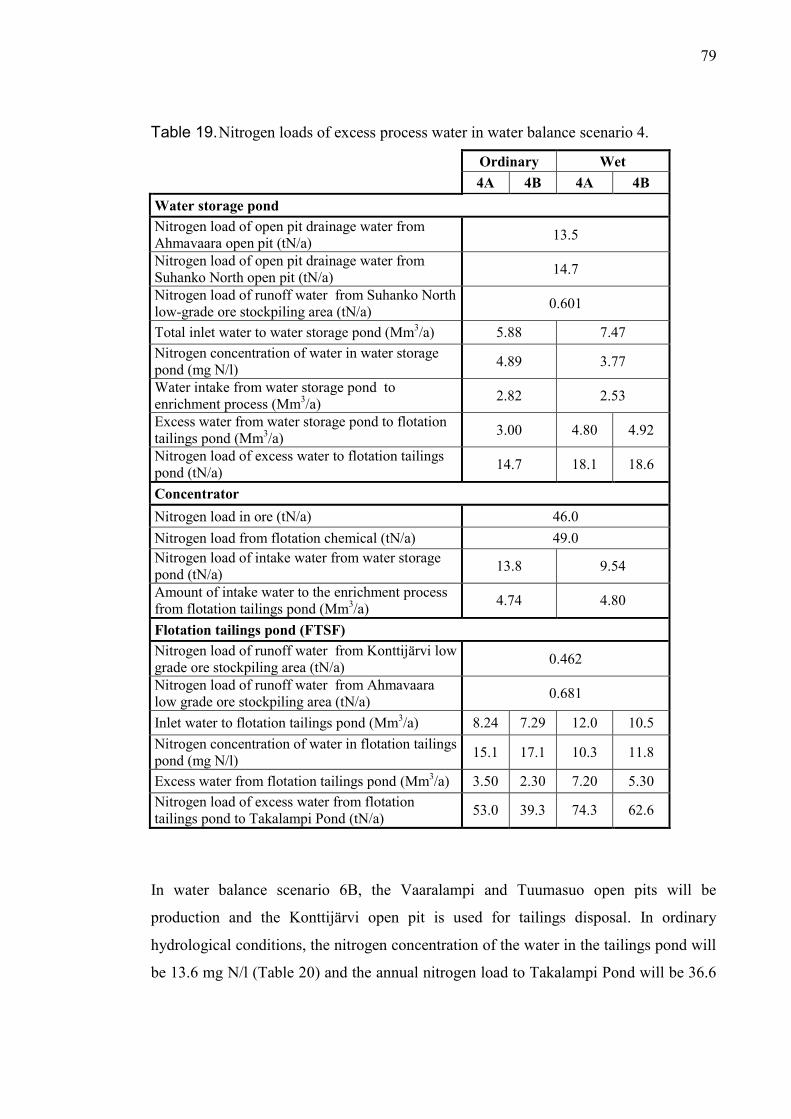
79
Table 19. Nitrogen loads of excess process water in water balance scenario 4.
Ordinary Wet
4A 4B 4A 4B
Water storage pond
Nitrogen load of open pit drainage water from
Ahmavaara open pit (tN/a) 13.5
Nitrogen load of open pit drainage water from
Suhanko North open pit (tN/a) 14.7
Nitrogen load of runoff water from Suhanko North
low-grade ore stockpiling area (tN/a) 0.601
Total inlet water to water storage pond (Mm3/a) 5.88 7.47
Nitrogen concentration of water in water storage
pond (mg N/l) 4.89 3.77
Water intake from water storage pond to
enrichment process (Mm3/a)
2.82 2.53
Excess water from water storage pond to flotation
tailings pond (Mm3/a)
3.00 4.80 4.92
Nitrogen load of excess water to flotation tailings
pond (tN/a) 14.7 18.1 18.6
Concentrator
Nitrogen load in ore (tN/a) 46.0
Nitrogen load from flotation chemical (tN/a) 49.0
Nitrogen load of intake water from water storage
pond (tN/a) 13.8 9.54
Amount of intake water to the enrichment process
from flotation tailings pond (Mm3/a)
4.74 4.80
Flotation tailings pond (FTSF)
Nitrogen load of runoff water from Konttijärvi low
grade ore stockpiling area (tN/a) 0.462
Nitrogen load of runoff water from Ahmavaara
low grade ore stockpiling area (tN/a) 0.681
Inlet water to flotation tailings pond (Mm3/a) 8.24 7.29 12.0 10.5
Nitrogen concentration of water in flotation tailings
pond (mg N/l) 15.1 17.1 10.3 11.8
Excess water from flotation tailings pond (Mm3/a) 3.50 2.30 7.20 5.30
Nitrogen load of excess water from flotation
tailings pond to Takalampi Pond (tN/a) 53.0 39.3 74.3 62.6
In water balance scenario 6B, the Vaaralampi and Tuumasuo open pits will be
production and the Konttijärvi open pit is used for tailings disposal. In ordinary
hydrological conditions, the nitrogen concentration of the water in the tailings pond will
be 13.6 mg N/l (Table 20) and the annual nitrogen load to Takalampi Pond will be 36.6
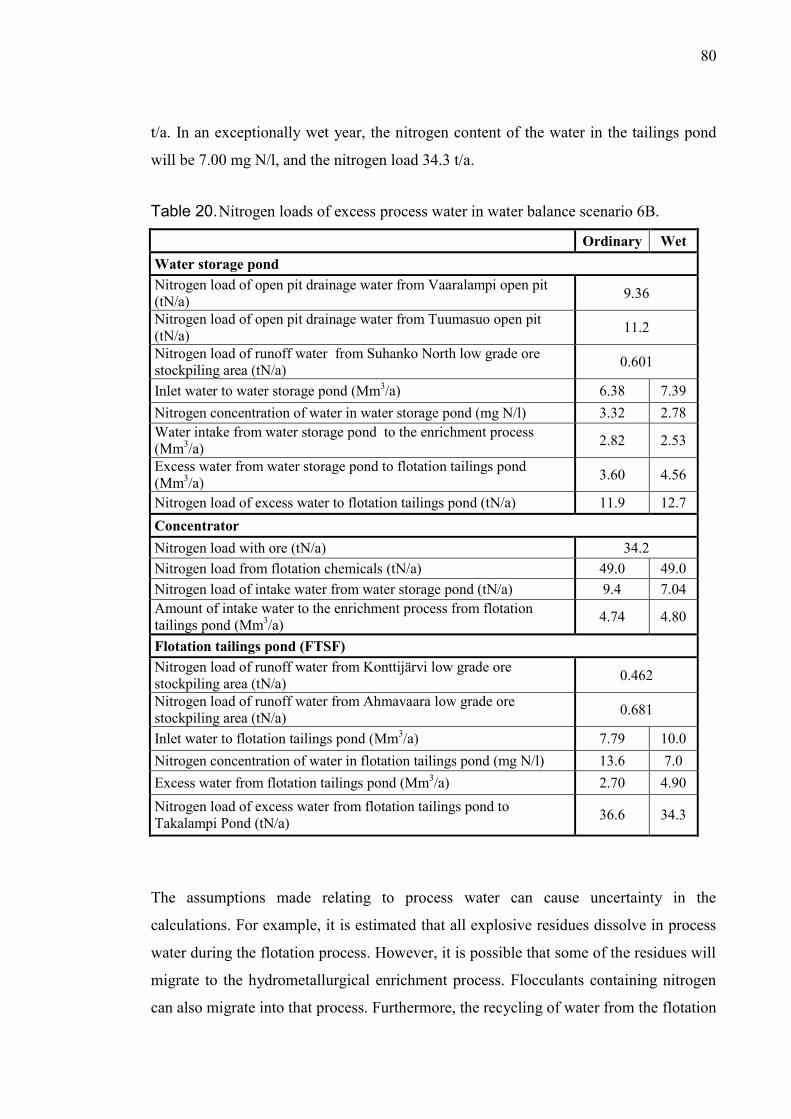
80
t/a. In an exceptionally wet year, the nitrogen content of the water in the tailings pond
will be 7.00 mg N/l, and the nitrogen load 34.3 t/a.
Table 20. Nitrogen loads of excess process water in water balance scenario 6B.
Ordinary Wet
Water storage pond
Nitrogen load of open pit drainage water from Vaaralampi open pit
(tN/a) 9.36
Nitrogen load of open pit drainage water from Tuumasuo open pit
(tN/a) 11.2
Nitrogen load of runoff water from Suhanko North low grade ore
stockpiling area (tN/a) 0.601
Inlet water to water storage pond (Mm3/a) 6.38 7.39
Nitrogen concentration of water in water storage pond (mg N/l) 3.32 2.78
Water intake from water storage pond to the enrichment process
(Mm3/a)
2.82 2.53
Excess water from water storage pond to flotation tailings pond
(Mm3/a)
3.60 4.56
Nitrogen load of excess water to flotation tailings pond (tN/a) 11.9 12.7
Concentrator
Nitrogen load with ore (tN/a) 34.2
Nitrogen load from flotation chemicals (tN/a) 49.0 49.0
Nitrogen load of intake water from water storage pond (tN/a) 9.4 7.04
Amount of intake water to the enrichment process from flotation
tailings pond (Mm3/a)
4.74 4.80
Flotation tailings pond (FTSF)
Nitrogen load of runoff water from Konttijärvi low grade ore
stockpiling area (tN/a) 0.462
Nitrogen load of runoff water from Ahmavaara low grade ore
stockpiling area (tN/a) 0.681
Inlet water to flotation tailings pond (Mm3/a) 7.79 10.0
Nitrogen concentration of water in flotation tailings pond (mg N/l) 13.6 7.0
Excess water from flotation tailings pond (Mm3/a) 2.70 4.90
Nitrogen load of excess water from flotation tailings pond to
Takalampi Pond (tN/a) 36.6 34.3
The assumptions made relating to process water can cause uncertainty in the
calculations. For example, it is estimated that all explosive residues dissolve in process
water during the flotation process. However, it is possible that some of the residues will
migrate to the hydrometallurgical enrichment process. Flocculants containing nitrogen
can also migrate into that process. Furthermore, the recycling of water from the flotation
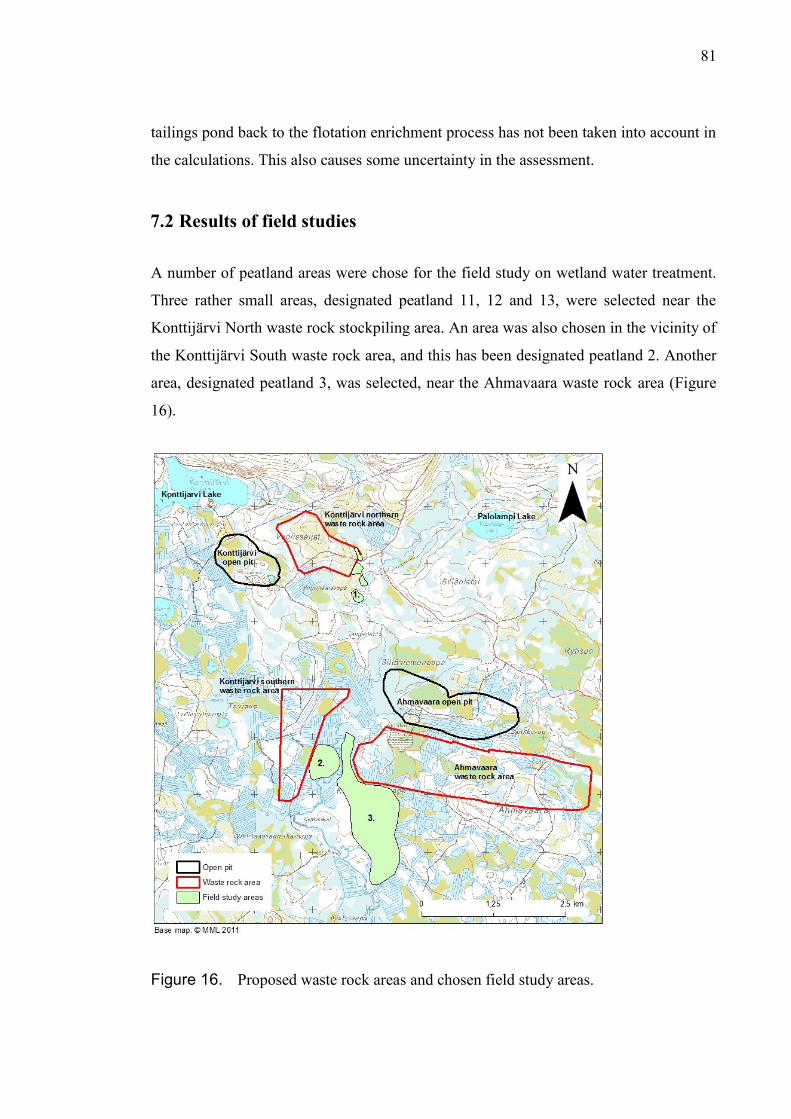
81
tailings pond back to the flotation enrichment process has not been taken into account in
the calculations. This also causes some uncertainty in the assessment.
7.2 Results of field studies
A number of peatland areas were chose for the field study on wetland water treatment.
Three rather small areas, designated peatland 11, 12 and 13, were selected near the
Konttijärvi North waste rock stockpiling area. An area was also chosen in the vicinity of
the Konttijärvi South waste rock area, and this has been designated peatland 2. Another
area, designated peatland 3, was selected, near the Ahmavaara waste rock area (Figure
16).
Figure 16. Proposed waste rock areas and chosen field study areas.
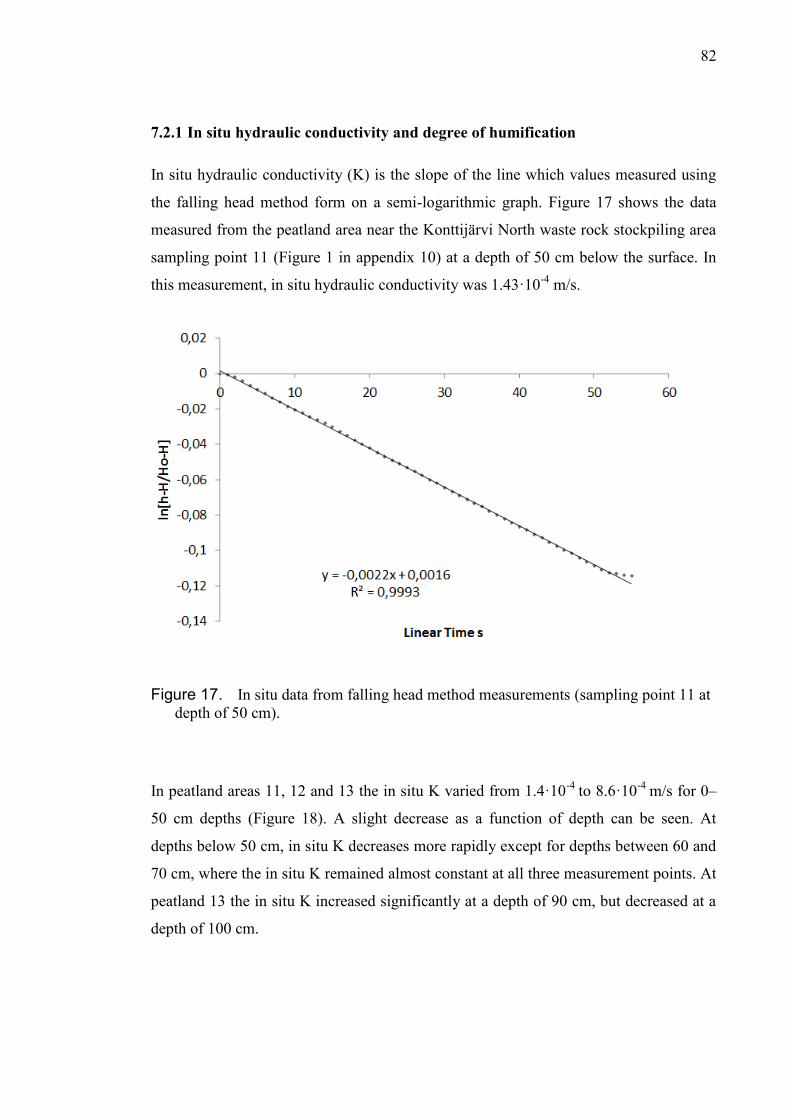
82
7.2.1 In situ hydraulic conductivity and degree of humification
In situ hydraulic conductivity (K) is the slope of the line which values measured using
the falling head method form on a semi-logarithmic graph. Figure 17 shows the data
measured from the peatland area near the Konttijärvi North waste rock stockpiling area
sampling point 11 (Figure 1 in appendix 10) at a depth of 50 cm below the surface. In
this measurement, in situ hydraulic conductivity was 1.43·10-4
m/s.
Figure 17. In situ data from falling head method measurements (sampling point 11 at
depth of 50 cm).
In peatland areas 11, 12 and 13 the in situ K varied from 1.4·10-4
to 8.6·10-4
m/s for 0–
50 cm depths (Figure 18). A slight decrease as a function of depth can be seen. At
depths below 50 cm, in situ K decreases more rapidly except for depths between 60 and
70 cm, where the in situ K remained almost constant at all three measurement points. At
peatland 13 the in situ K increased significantly at a depth of 90 cm, but decreased at a
depth of 100 cm.

83
Figure 18. In situ hydraulic conductivities and average degree of humification in
Konttijärvi North peatlands 11, 12 and 13.
In peatland 2 (Figure 19), the average in situ K varied between 2.3·10-5
and 4.9·10-5
m/s
for depths in the range 0–50 cm (Appendix 5). At a depth of 60 cm below the surface,
the average K decreased significantly. At depths in the range 70–80 cm, average K
increased (2.0·10-5
– 2.9 ·10-5
m/s). In deeper peat layers (90–100 cm) K decreased
rapidly (4.6·10-8
–9.0·10-8
m/s).
In peatland 3 (Figure 19), the average in situ K was also almost constant (5.5·10-4
–
7.0·10-4
m/s) in upper peat layers for depths of 0–40 cm. At depths of 50–70 cm a
significant decrease was observed. At deeper peat layers (70–100 cm), average in situ K
was between 5.3·10-7
and 2.7·10-6
m/s.
The degree of humification varied from H1 to H3 in peatlands 11, 12 and 13 at depths
of 0–35 cm (Figure 18). In the deeper peat layers (35–55 cm) the degree of humification
increased to H4–H6.
In peatland 2, the degree of humification varied from H1 to H3 in the upper peat layers
(0–9 cm)(Figure 19). At depths between 9 and 42 cm the degree of humification was
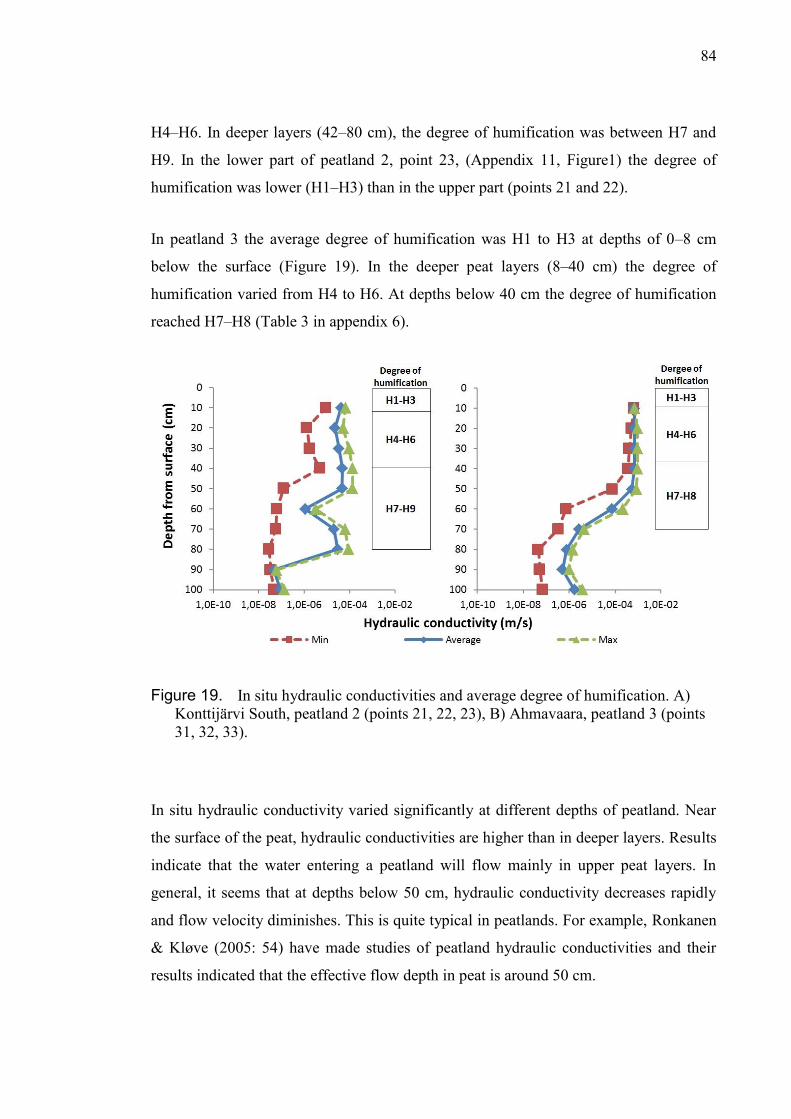
84
H4–H6. In deeper layers (42–80 cm), the degree of humification was between H7 and
H9. In the lower part of peatland 2, point 23, (Appendix 11, Figure1) the degree of
humification was lower (H1–H3) than in the upper part (points 21 and 22).
In peatland 3 the average degree of humification was H1 to H3 at depths of 0–8 cm
below the surface (Figure 19). In the deeper peat layers (8–40 cm) the degree of
humification varied from H4 to H6. At depths below 40 cm the degree of humification
reached H7–H8 (Table 3 in appendix 6).
Figure 19. In situ hydraulic conductivities and average degree of humification. A)
Konttijärvi South, peatland 2 (points 21, 22, 23), B) Ahmavaara, peatland 3 (points
31, 32, 33).
In situ hydraulic conductivity varied significantly at different depths of peatland. Near
the surface of the peat, hydraulic conductivities are higher than in deeper layers. Results
indicate that the water entering a peatland will flow mainly in upper peat layers. In
general, it seems that at depths below 50 cm, hydraulic conductivity decreases rapidly
and flow velocity diminishes. This is quite typical in peatlands. For example, Ronkanen
& Kløve (2005: 54) have made studies of peatland hydraulic conductivities and their
results indicated that the effective flow depth in peat is around 50 cm.
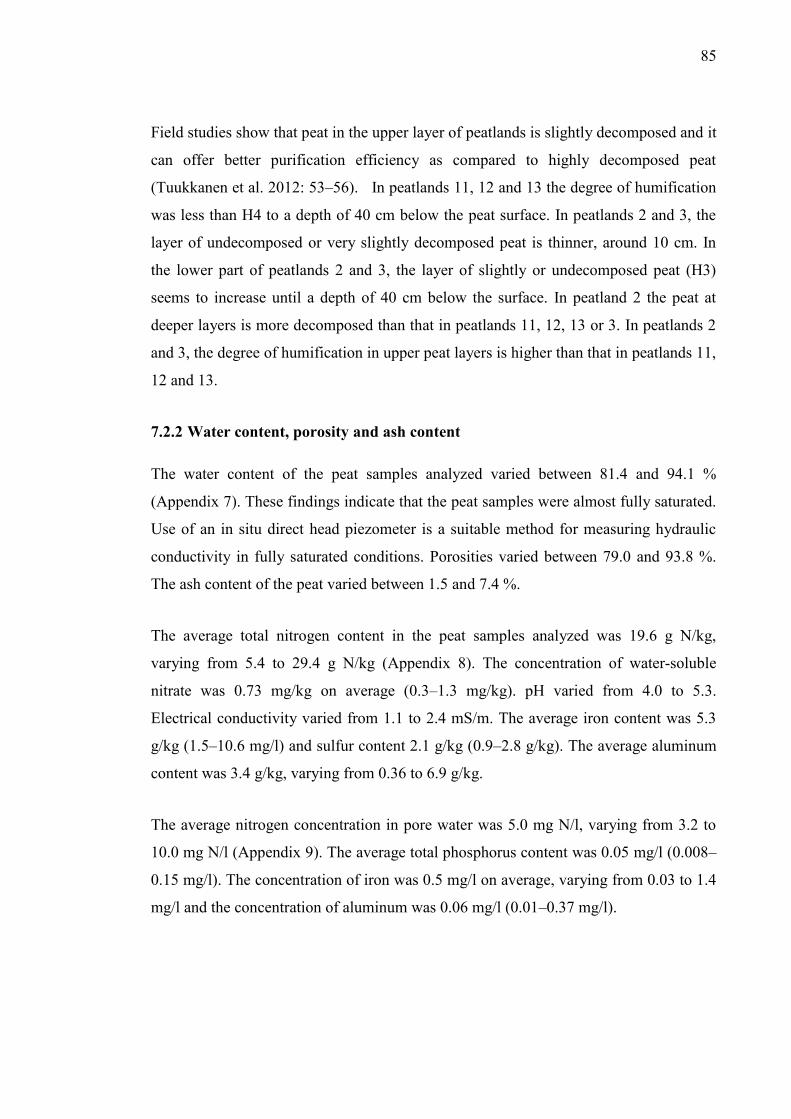
85
Field studies show that peat in the upper layer of peatlands is slightly decomposed and it
can offer better purification efficiency as compared to highly decomposed peat
(Tuukkanen et al. 2012: 53–56). In peatlands 11, 12 and 13 the degree of humification
was less than H4 to a depth of 40 cm below the peat surface. In peatlands 2 and 3, the
layer of undecomposed or very slightly decomposed peat is thinner, around 10 cm. In
the lower part of peatlands 2 and 3, the layer of slightly or undecomposed peat (H3)
seems to increase until a depth of 40 cm below the surface. In peatland 2 the peat at
deeper layers is more decomposed than that in peatlands 11, 12, 13 or 3. In peatlands 2
and 3, the degree of humification in upper peat layers is higher than that in peatlands 11,
12 and 13.
7.2.2 Water content, porosity and ash content
The water content of the peat samples analyzed varied between 81.4 and 94.1 %
(Appendix 7). These findings indicate that the peat samples were almost fully saturated.
Use of an in situ direct head piezometer is a suitable method for measuring hydraulic
conductivity in fully saturated conditions. Porosities varied between 79.0 and 93.8 %.
The ash content of the peat varied between 1.5 and 7.4 %.
The average total nitrogen content in the peat samples analyzed was 19.6 g N/kg,
varying from 5.4 to 29.4 g N/kg (Appendix 8). The concentration of water-soluble
nitrate was 0.73 mg/kg on average (0.3–1.3 mg/kg). pH varied from 4.0 to 5.3.
Electrical conductivity varied from 1.1 to 2.4 mS/m. The average iron content was 5.3
g/kg (1.5–10.6 mg/l) and sulfur content 2.1 g/kg (0.9–2.8 g/kg). The average aluminum
content was 3.4 g/kg, varying from 0.36 to 6.9 g/kg.
The average nitrogen concentration in pore water was 5.0 mg N/l, varying from 3.2 to
10.0 mg N/l (Appendix 9). The average total phosphorus content was 0.05 mg/l (0.008–
0.15 mg/l). The concentration of iron was 0.5 mg/l on average, varying from 0.03 to 1.4
mg/l and the concentration of aluminum was 0.06 mg/l (0.01–0.37 mg/l).

86
7.2.3 Surface slopes and areas of the peatlands
The slope of the peat surface in peatland 11 is 2.4 ‰, peatland 12 5.4 ‰ and peatland
13 3.4 ‰ (Figure 20). The area of peatland 11 is 2.9 ha, peatland 12 1.9 ha and peatland
13 2.1 ha. The total area of these three peatlands is 7.0 ha. The ratios of the areas of
each peatland to the area of the Konttijärvi North waste rock stockpiling area (90 ha) are
3.2 %, 2.1 % and 2.3 % respectively. The estimated lengths of the corresponding flow
paths are 560 m, 150 m and 190 m. The flow paths in peatlands 12 and 13 are quite
short; longer flow paths may provide better nitrogen removal.
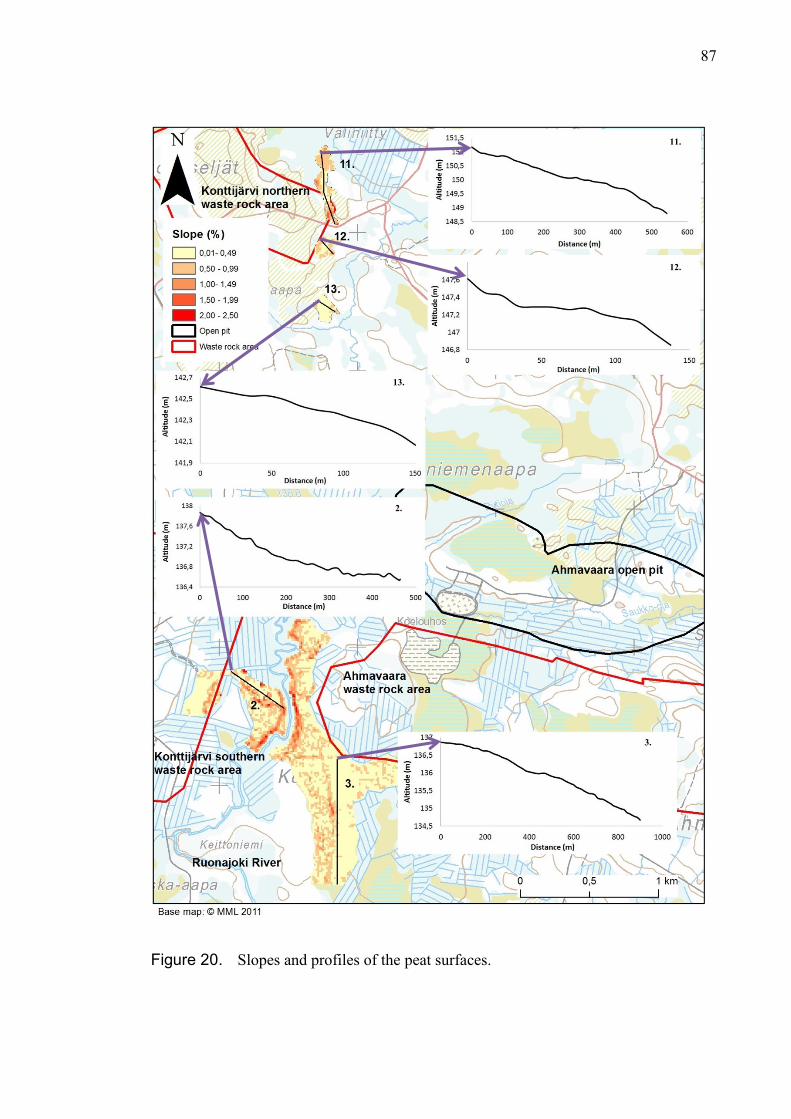
87
Figure 20. Slopes and profiles of the peat surfaces.
3.
2.
13.
12.
11.
88
In the lower part of peatland 11, the slope is mainly over 10 ‰ (Figure 1 in appendix
10). In peatlands 12 and 13, the slopes are generally less than 10 ‰ (Figure 1 in
appendix 10). In all the peatlands studied, the thickness of peat exceeded 0.5 meters and
the thickness of peat over most of the peatland was over 1.1 meters.
In peatland 2 the average slope of the peat surface is 3.2 ‰ (Figure 2 in appendix 11)
and the area of the peatland is 17.6 ha. The ratio of peatland area to the area of the
Konttijärvi South waste rock stockpiling site (120 ha) is 14.7 %. The maximum lengths
of the flow path could be around 480 m, which is long enough to provide nitrogen
removal. In the upper part of peatland 2 the slope of the surface is mostly under 5 ‰. In
the lower part of the peatland the slope is over 20 ‰.
In peatland 3, near the Ahmavaara waste rock stockpiling area, the average slope of the
peat surface is 2.6 ‰ (Figure 2 in appendix 12) and the area of peatland is 63.6 ha. The
ratio of the area of the peatland to the area of the Konttijärvi South waste rock
stockpiling site (360 ha) is 17.7 %. The lengths of flow paths could be around 1100 m.
In the upper part of peatland, near the Ruonajoki River, the slope of surface exceeds 20
‰ (Figure 1 in appendix 12). In the lower part of the peatland, the slope is mainly less
than 10 ‰. On the eastern side of the peatland, in the surroundings of sampling point
32, the slope of the surface is less than 5 ‰.
The slopes of the peatlands studied are mainly suitable for wetland water treatment.
However, in some parts of the peatlands, the slopes of the surface are quite steep and the
flow velocity may increase there. On the other hand, water can reside for a long time in
parts of peatlands where the inclination is very low. In addition, it has to be taken into
account that not all the water discharged will flow through the peat. In peatlands 2 and 3
drainage ditches have been dug, and these will have to be blocked if the peatlands are
converted for use in wetland treatment.
Peatlands 11, 12 and 13 are too small individually to use in wetland treatment, but if
their areas are added together, the requirement that 3.8 % of the catchment area be
available will be exceeded. The area of peatland 2 is 14.7 % of the catchment area and
of peatland 3 17.7 %. The requirement regarding the minimum area/catchment ratio is
89
exceeded, but how the water being treated ultimately spreads in the peatland can affect
its effective area.
The amount of runoff water from the Konttijärvi waste rock area under ordinary
hydrological conditions will be 94 m3/h and under 1:100 year wet conditions 148 m
3/h
(Table 8). The corresponding amounts of runoff water from the Ahmavaara waste rock
area will be 161 m3/h and 253 m
3/h. Based on the proposed area of the waste rock
stockpiles site, the amount of runoff waters will be divided such that 40.3 m3/h will be
discharged from the Konttijärvi North waste rock area and 53.7 m3/h from the
Konttijärvi South waste rock area. Under wet hydrological conditions the amounts of
runoff waters at the two sites will be 63.4 m3/h and 84.6 m
3/h, respectively. Comparing
the recommended hydraulic load of 340 m3/ha/d (Ihme 1994: 118–119) to the amount of
runoff waters from the Konttijärvi North, Konttijärvi South and Ahmavaara waste rock
areas, the minimum area of treatment wetlands required under wet hydrological
conditions should be 4.5 ha, 6.0 ha and 17.9 ha, respectively. The area of peatland 3
(63.6 ha) near the Ahmavaara waste rock area and the area of peatland 2 (17.6 ha) near
the Konttijärvi South waste rock area will exceed the requirement for a wetland area
based on hydraulic load of runoff water. The areas of the peatlands near Konttijärvi
North are 2.9 ha 1.9 ha and 2.1 ha and none of these individually fulfils the minimum
requirements for area based on hydraulic load.
90
8 DISCUSSION
Explosive residues form in open pits when part of a loaded explosive fails to detonate or
some of the explosive agent spills around the collar of the blasthole during charging.
The proportion of undetonated explosives depends mainly on the mining method, the
properties of the rock being blasted and charging practices. In general, the proportion of
undetonated explosives is lower in open pit mines than in underground mines. Choosing
poorly soluble explosives can help reduce the concentration of nitrogen in drainage
waters in wet conditions. Poorly soluble explosives, such as emulsion explosives, can
remain unchanged in a blasthole for a long time under wet conditions, whereas ANFO
or water slurry explosives will dissolve in water and not detonate anymore (Revey
1996: 61–62). Even though emulsion explosives have good water resistance, they also
leach into water over time. The risk of spills is higher in underground mining, because
the explosive agent has to be pumped horizontally or upward into drillholes, in contrast
to open pit mining, where vertical drillholes are used.
8.1 Nitrogen mass balance and quality of runoff water
Most of the nitrogen contained in an explosive is released into the atmosphere during
the explosion, but some of it will migrate into the waste rock stockpiling area in waste
rock, and to the concentrator in ore and in open pit drainage waters. Rain and meltwater
flush waste rock piles, and some undetonated explosive will dissolve in this water.
At the Suhanko mine, the total annual mining rate will be between 40 and 60 Mt/a. The
average consumption of explosives during production in alternative VE1 will be around
13 000 t/a. Given these parameters, on average 32 t of nitrogen will migrate annually to
the concentrator in ore. During the operational time of the mine, the highest amount of
nitrogen will migrate to the Ahmavaara waste rock area; the estimated total is 1140 t.
The amount of nitrogen migrating in low-grade ore to the low-grade ore stockpiling
areas will be lower (3.7–10.9 t) than that migrating to waste rock areas or the
concentrator.

91
The largest nitrogen load in runoff water from waste rock stockpiling areas during the
operational lifetime of a pit will occur at Ahmavaara. The Ahmavaara open pit will be
in production for 16 years and it is there that the largest amount of waste rock, around
388 Mt in total, will be mined. The largest annual nitrogen load from waste rock
stockpiling areas, an estimated 8.02 t, will be released at the Suhanko North waste rock
area. The annual nitrogen load in runoff water from Suhanko North will be higher than
that from the Ahmavaara (7.26 t), because the annual mining rate of waste rock will be
higher at the Suhanko North pit than at the Ahmavaara pit. Annual nitrogen loads from
other waste rock areas will be of the same order of magnitude, except for Little
Suhanko, where the load will be considerably lower, that is, 0.43 tN/a. The total
nitrogen load of runoff waters from different waste rock stockpiling areas during the
lifetime of the mine will vary between 36.3 and 116 t; this figure does not include the
estimate for Little Suhanko (0.43 t).
The nitrogen concentration in runoff waters from the different waste rock stockpiling
areas under ordinary hydrological conditions will vary from 1.19 to 10.9 mg N/l, and
under wet conditions from 0.8 to 7.0 mg N/l. A comparison of the calculated
concentration of nitrogen in runoff waters and the measurement of peatland pore water
samples indicates that these quantities are of same order of magnitude. The nitrogen
concentration in pore water samples varied between 3.2 and 10.0 mg N/l (Appendix 9).
The average concentration of total nitrogen in the peat samples analyzed was 19.6 g/kg
but the average amount of water-soluble nitrate was considerably lower 0.73 mg/kg
(Appendix 8). It seems that there is nitrogen in the peat, but it is not soluble in water.
A comparison of the difference between the total load of nitrogen in waste rock areas
and the nitrogen load of runoff water indicates that most of the nitrogen will remain in
the waste rock stockpile area. For example, in the Ahmavaara waste rock area, the
nitrogen load from waste rock will be 1140 t and the nitrogen load in runoff water 116 t
during the pit’s operating time. Not all explosive residues that migrate to waste rock
stockpiles will totally leach into the seepage water during the operational lifetime of the
mine, meaning that the waste rock stockpiles will become nitrogen stores.
92
Calculations based on data from the GTK show lower concentrations as compared to
calculations using data from a reference mine. The difference can be explained by the
differences in specific charges used at the reference mine and in the GTK study.
The comparison of the estimated nitrogen concentration in runoff water from waste rock
areas at Suhanko to that in the waste rock area runoff water at operating mines (Table 3)
reveals that the estimated values and monitored concentrations from operating mines are
of the same order of magnitude. It has to be pointed out, however, that the range of
concentrations at different operating mines is quite large. When comparing emission
rates of mines, attention must be paid to differences between the facilities. The
explosives in use and the mining method can significantly determine the nitrogen
content of runoff water. The nitrogen load from waste rock areas will also vary
significantly with the seasons. During the winter no water will be discharged from waste
rock areas and, on the other hand, in the spring quite large amounts of water will be
released from the areas (Pöyry Finland Oy 2013b: 9). When evaluating the
concentration of nitrogen in waste rock runoff and open pit drainage water, it must be
taken into account that the estimates presented here are based on a small amount of
monitoring data from a reference mine. The assumptions underlying the methods also
affect the results regarding the nitrogen mass balance.
The average nitrogen load of drainage water from different open pits will vary from
9.38 to 14.7 tN/a. In different stages of operation, two open pits will be in production
simultaneously. However, drainage waters from all open pits will be pumped to the
mine’s water storage pond. Production rates from different open pits will vary and the
amounts of drainage water will often differ. Open pit drainage waters will contain
nitrogen from explosives in all seasons. The amount of drainage water will be lower in
winter than in summer. The nitrogen load in drainage water will be higher in summer
than in winter. If the proportion of undetonated explosives increases or blasting has to
be done under extremely difficult conditions, the nitrogen content of the drainage water
may increase. In that case, the nitrogen load to the water storage pond will increase, and
the concentration of nitrogen in the pond water will increase as well.

93
In water balance scenario 2, the nitrogen load from the flotation tailings pond under
regular water conditions will be 17.6 t, and in an exceptionally wet year 47.2 t. The
difference in nitrogen loads between wet and ordinary conditions is the result of the
discharge of excess water required. For example, under wet conditions in scenario 2, the
amount of water discharged from the flotation tailings pond will be 3.4 Mm3/a, and
under ordinary conditions 0.90 Mm3/a. In scenario 2, the average annual nitrogen load
of runoff waters from the Konttijärvi (5.39 tN/a) and Ahmavaara (7.26 tN/a) waste rock
areas will be 12.7 t. The highest nitrogen load (74.3 tN/a) of excess water will occur in
scenario 4A under wet conditions. In that case, the nitrogen load of runoff water from
the Ahmavaara (7.26 t) and Suhanko North (8.02 t) waste rock areas will be
approximately 15.3 tN/a. In scenario 4, the nitrogen load of excess process water will be
significantly higher than the load of runoff waters from the waste rock areas. In water
balance scenario 6, the nitrogen load of excess water from the water storage pond will
be 36.6 (ordinary year) or 34.3 tN/a (wet year), values which are also higher than the
nitrogen load of runoff water from the Vaaralampi (5.18 tN/a) and Tuumasuo (6.80
tN/a) waste rock areas.
8.2 Treatment methods and mitigation measures
The Suhanko mine is located in northern Finland and during the winter no water will be
discharged from waste rock areas (Pöyry Finland Oy 2013b: 9). When the snow starts to
melt in spring, the amount of runoff waters will increase rapidly.
One possible treatment method to remove nitrogen from mine water is the nitrification-
denitrification process. Its limitations in treating inorganic mine water are the lack of a
carbon source, a quite narrow optimal pH range and the temperature of the water to be
treated. In winter time the temperature of water can be low, which slows the
nitrification-denitrification process. Biological nitrogen removal can be used with
reactors but it is not feasible to treat very large amounts of water using this method.
Where the retention time of water in the tailings pond and water storage pond is long
enough, this will reduce the concentration of nitrogen (Mattila et al. 2007: 26).
94
Many Finnish mines have treatment wetlands to polish mining waters between the mine
and the receiving water body (Palmer et al. 2013: 55). Studies of the he reduction of
nitrogen achieved in wetland treatment in the frost-free season indicate reductions of 18
% to 55.7 % (Päkkilä 2008: 117, Maikkula 2013: 32, Ihme 1994: 45).
Where the nitrogen concentrations in water are high, the treatment methods have to be
effective enough to reduce the concentration of nitrogen to the required level. If the
amount of water becomes unexpectedly large, the treatment method has to
accommodate all of it. Even if the nitrogen concentration is low in normal operation, it
is important to prepare for changes in water quality. Wetland treatment, like other
passive treatment systems, is recommended as a secondary treatment to follow an
available active treatment, such as biological nitrogen removal in bioreactors,
precipitation ponds or reverse osmosis. The primary treatment system has to be
prepared to handle atypical water quality conditions.
8.3 Potential treatment wetlands
The field studies conducted as part of this research identified peatland areas close to the
proposed waste rock areas that fulfil the basic technical conditions for conversion into
treatment wetlands. Peatland 3 is one potential site, because it is large enough in area
for treatment even if the water discharged into it does not spread to all parts of the
peatland. The total slope of the peatland is less than 10 ‰, but in some parts of it the
slope exceeds 20 ‰, meaning that water may flow too rapidly in these areas. The
estimated length of the flow path in peatland is also long enough (1100 m). Peatland 2 is
also a potential wetland treatment area. Its shape is not ideal for the purpose, as the
water discharged into it may not easily spread evenly over the peatland.
Peatlands 11, 12 and 13 would not be very good for wetland treatment, because they are
too small. One possibility would be to connect all three peatlands in series, in which
case the total area of the three peatlands would exceed the minimum recommendations.
The total slope of these three peatlands is less than 1 ‰. In the lower part of peatland
11, the slope is over 20 ‰.
95
The average concentration of total nitrogen in the peat was 19.6 g N/kg, but the
concentration of water-soluble nitrogen was only 0.73 mg N/l (Appendix 8). Laboratory
results show that in the peatlands studied the leaching of nitrogen from peat into the
water being treated would be quite slight. The results of pore water samples from the
peatlands show that the water in the peatlands contains 5.0 mg N/l in average. Pore
water contains small amounts of iron and aluminum and the peat samples analyzed also
contained some of these elements. Their occurrence may reduce the concentration of
nutrients in the water treated in peatlands.
8.4 Further investigations
This study assessed the peatlands near the Konttijärvi and Ahmavaara waste rock areas.
It would be important to conduct more investigations of peatlands near the other
proposed waste rock areas. More peatlands can be found that merit study for conversion
to treatment wetlands.
Investigations of treatment methods which can purify large amounts of nitrogen-
containing water in an efficient way in cold environments would be important. In
addition, developing explosives containing less nitrogen or nitrogen-free explosives
could reduce nitrogen emissions. The behavior of explosive residues and transport
processes in the waste rock stockpiles are not well known. Field studies in operating
mines would be valuable in helping to understand these processes. Data on nitrogen
loads in runoff water after mine closure would also be important. Studies of the
influence of waste rock stockpile landscaping during mine operation would be
beneficial in evaluating nitrogen concentrations in runoff waters. More studies
evaluating the amount of undetonated explosives in different situations would assist in
the estimation of the nitrogen mass balance of mines. Also needed is additional
knowledge of the solubility properties of the nitrogen originating in the chemicals used
in enrichment processes; this would be significant in assessing nitrogen emissions in
excess process waters.
96
9 CONCLUSIONS
Mining increases emissions of nitrogen to watercourses and most of the nitrogen load
from mines into water bodies originates from explosives. Some of the chemicals used in
the enrichment process also contain nitrogen. Some of the explosive residues and
chemicals migrate into the environment in excess water. Even though every mine is
different, the methods for evaluating the emissions from mining are important tools.
Emissions have to be evaluated before impacts on waterways appear. In Finland, where
some of recipient water bodies are nitrogen limited, it is important that nitrogen
emissions are assessed beforehand.
The selection of mining method depends on the location and shape of the ore body and
the grade of ore. In general, the proportion of explosive residues is lower in open pit
mines than in underground mining. There are different kinds of explosive available and
the properties of explosives vary widely. For example the difference in water solubility
between emulsion explosives and ANFO is significant. On the other hand, all
explosives used in mining are containing nitrogen. Undetonated explosives will migrate
from open pits into areas where waste rock and low grade ore are stored and to the
concentrator.
At present, the environmental impact assessment (EIA) for the Suhanko mining project
has been made for more extensive mining operations than the current environmental
permit covers. The mining process is being expanded and ore beneficiation improved.
The estimated average annual consumption of explosives in Suhanko will be 13 000 t.
Most of the runoff water from the mine will flow to the Simojoki River, and the water
from the enrichment process will be discharged to the Kemijoki River. The water
balance covers many different scenarios and nitrogen emissions will vary depending on
hydrological conditions and on which open pits are in production. Estimates of the
nitrogen mass balance for the Suhanko mining project show that the quality of runoff
waters from the waste rock stockpiling areas under average hydrological conditions will
vary from 1.19 to 10.9 mg N/l, and under wet conditions between 0.8 and 7.0 mg N/l.
The concentration of nitrogen in excess process water from the flotation tailings pond
will vary from 10.3 to 19.6 mg N/l.
97
Many operating mines have changed over to poorly soluble explosive agents and many
Finnish mines have established treatment wetlands to polish mining waters. Nitrogen
emissions from mining can be reduced by developing the practices used in handling and
loading explosives and by improving drilling precision. Failed or flawed detonation may
result from drilling errors, blasthole cut-offs, insufficient delay times in a round, a
broken detonator or broken wires. Recirculating water and improving the enrichment
process such that it requires less water are effective ways to reduce emissions to
waterways. Any non-harmful local waters should be kept separate from process water
and runoff water from stockpiling areas. Where this is done, the amount of water
requiring treatment will remain lower. Landscaping of waste rock stockpiles during
mine operation will reduce the amount of water seeping through the piles, and this will
improve the quality of water.
The biological removal of nitrogen from water can be carried out using a two-step
nitrification and denitrification process. If the organic content of the water to be treated
is low, as is usually the case with mine water, an external carbon source is needed for
denitrification. In wetland treatment an external carbon source is not required, because
the peat in the wetland contains carbon. Other treatment methods for removing nitrogen
from water exist, but the large amount of water to be treated in the present case, as well
as the presence of other possible contaminants in the water, has to be taken into account.
In the experimental part of this research, the peatlands near proposed waste rock areas
were studied for their potential as treatment wetlands. In situ hydraulic conductivity
measurements indicate that the water will flow in the upper layers of the peat. At depths
below 50 cm, hydraulic conductivity will decrease rapidly, as will flow velocity. Field
studies show that the peat in the upper layer of the peatlands is slightly decomposed and
can offer better purification of nitrogen than the highly decomposed peat that lies
deeper. Peatland 3 near Ahmavaara is suitable for as a wetland treatment site. It is large
enough and the slope is satisfactory. Peatland 2 is also suitable, but the shape of the area
is not optimal; it is possible that water discharged there will not spread well over the
peatland. Peatlands 11, 12 and 13 are smaller peatlands and are not optimal for use in
wetland treatment separately. If they can be used in together, their purification potential
may improve.
98
10 REFERENCES
Akanegbu J (2013) Comparison of Different Methods of Measuring Hydraulic
Conductivity in Drained Peat Soils using Drainmod as a Verification Tool. Master’s
thesis, University of Oulu. Department of Process and Environmental Engineering.
AMEC Earth & Environmental (2004) Ammonium Nitrate and Explosives Management
Plan Jericho Diamond Mine Nunavut.
Angico-Eagle Finland Oy (2011) Raportti Kittilän kaivoksen kuivanapitovesien
typenpoiston tehostamisesta lumetuksen avulla.
Atkins PW, Overton TL, Rouke JP, Weller MT & Armstrong F (2006) Shiver & Atkins
Inorganic chemistry. 4th
Edition. Oxford: Oxford University Press New York.
Bailey BL, Smith LJD, Blowes DW, Ptacek CJ, Smith L & Sego DC (2012) The Diavik
Waste Rock Project: Persistence of contaminants from blasting agents in waste rock
effluent. Applied Geochemistry 36: 256-270.
Bergman P (2005) Optimisation of Fragmentation and Comminution at Boliden
Mineral, Aitik Operation. Licentiate Thesis. Luleå University of Technology.
Bhandari S (1997) Engineering Rock Blasting Operations. Rotterdam: A.A. Balkema.
Brown M, Barley B &Wood H (2002) Minewater treatment technology, application and
policy. Dorchester UK: IWA publishing.
Chlot S (2011) Nitrogen Effluents From Mine Sites in Northern Sweden. Nitrogen
Transformations and Limiting Nutrient in Receiving Waters. Licenciate Thesis.
Luleå University of Technology. Division of Geosciences and Environmental
Engineering.
Crittenden JC, Trussell R, Hand D, Howe K & Tchobanoglous G (2012) MWH’s Water
Treatment Principles and Design. 3rd
Edition. Hoboken, NJ, USA: John Wiley &
Sons.
Forsberg H & Åkerlund H (1999) Kväve och sprängämnesrester i LKAB:s malm-,
gråbergs- och produktflöden. Master´s thesis. Luleå University of Technology.
Department of Civil engineering and Applied Geology.
Forsyth B, Cameron A & Miller S (1995) Explosives and Water Quality, ISBN-660-
16043-9, CANMET, Ottawa, 795−803.
Hakanpää, Antero & Lappalainen, Pekka (toim.). Kaivos- ja louhintatekniikka. 2.
painos. Kaivannaisteollisuusyhdistys ry, Helsinki 2011.
Hannukainen T (2009) Räjähdysainejäämät ja niiden ympäristövaikutukset
louhintatöissä. Barchelor´s thesis. Helsinki University of technology. Department of
Civil and Environmental engineering.

99
Heikkinen K, Ihme R, & Lakso E (1994) Ravinteiden, orgaanisten aineiden ja raudan
pidättymiseen johtavat prosessit pintavalutuskentällä. Helsinki: Vesi- ja
ympäristöhallitus, Oulun vesi- ja ympäristöpiiri.
Heiniö M (1999) Rock excavation handbook: for civil engineering. Tampere: Sandvik
Tamrock.
Hekmatzadeh A A, Karimi-Jashani A, Talebbeydokhti N & Klove B (2012) Modeling
of nitrate removal for ion exchange resin in batch and fixed bed experiments.
Desalintation 284: 22-31.
Herbert RB (2013) Denitrification in a sawdust and sewage sludge barrier system in
northern Sweden. Mine Water Solutions in extreme environments. Lima, Peru.
Hämäläinen E (2013) Agnico Eagle Finland Oy. Kittilä mine. E-mail message
[29.7.2013].
Hänninen M (2013) Firts Quantum Minerals Ltd. Pyhäsalmi mine. E-mail message.
[19.82013].
Häyrynen P, Galambos I, Szekrényes K, Keiski R & Vatai G (2013) Concentration of
nitrogen compounds and heavy metals by a membrane based hybrid process. Water
research Conference at the University of Oulu. Oulu. Thule institute: 93-96.
Ihme R (1994) Pintavalutus turvetuotantoalueiden valumavesien puhdistuksessa. Espoo:
Valtion teknillinen tutkimuskeskus (VTT).
Itä-Suomen ympäristölupavirasto (2006) Yhtiöiden Siilinjärven tuotantolaitoksia
koskeva ympäristölupa ja Kemphos Oy:n vesitalouslupa, Siilinjärvi. Lupapäätös
79/06/2. Dnro ISY-2004-Y-272. Annettu julkipanon jälkeen 6.10.2006
Kadlec RH & Knight RL (1996) Treatment Wetlands. Boca Raton, U.S.A.:CRC Press
LLC.
Karlsson T (2013) Geological Survey of Finland. E-mail message [10.9.2013].
Kauppila T, Komulainen H, Makkonen S & Tuomisto J (toim.) (2013)
Metallikaivosalueiden ympäristöarviointiosaamisen kehittäminen: MINERA-
hankkeen loppuraportti. Geologian tutkimuskeskus, tutkimusraportti 199.
Keränen A, Leiviskä T, Gao B, Hormi O & Tanskanen J (2013) Preparation of novel
anion exchangers from pine sawdust and bark, spurce bark, birch bark and peat for
the removal of nitrate. Chemical engineering Science 98: 59–68.
Kuokkanen V, Kuokkanen T, Rämö J & Lassi U (2013) Current applications of
electrocoagulation in treatment of different types of water and wastewater. Water
research Conference at the University of Oulu. Oulu. Thule institute: 72–76.
Kløve B, Saukkoriipi J, Tuukkanen T, Heiderscheidt E, Heikkinen K, Marttila H, Ihme
R, Laëtitia D & Karppinen A (2012) Turvetuotannon vesistökuormituksen ennakointi
100
ja uudet hallintamenetelmät. Suomen ympäristö 35/2012. Helsinki: Suomen
ympäristökeskus.
Laine J, Vasander H, Hotane J-P, Nousiainen H, Saarinen M & Penttilä T (2012)
Suotyypit ja turvekankaat. Opas kasvupaikkojen tunnistamiseen. Hämeenlinna:
Metla ja Helsingin yliopisto.
Langefors U & Kihlström B (1963) The modern technique of rock blasting. New York:
John Wiley & Sons Inc.
Lapin vesitutkimus Oy (2012) Nordic Mines Oy, Laiva-kaivoksen ympäristöluvan
muutoshakemus. 20.3.2012.
Lapin vesitutkimus Oy (2006) Scandinavian Minerals Ltd. Kevitsan kaivoshankkeen
ympäristövaikutusten arviointiselostus. Heinäkuu 2006.
Lindeström L (2012) Kväveutsläpp från gruvindustri. Risker för miljöproblem, krav på
utsläppbergränsningar och möjliga åtgärder. Stockholm: SveMin, Föreningen för
gruvor, mineral- och metallproducenter i Sverige.
Lycopodium Minerals Pty Ltd (2013) Arctic Platinum Project. Greater Suhanko Pre-
feasibility study.
Lyytimäki J & Hakala H (2008) Ympäristön tila ja suojelu Suomessa. Helsinki:
Gaudeamus Helsinki University Press: Syke.
Maikkula P (2013) Kaivosteollisuuden vesien typpipäästöt. Diplomityö. Oulun
Yliopisto. Prosessi- ja ympäristötekniikan osasto.
Mattila K Zaitsev G & Langwaldt J (2007) Biological removal of nutrients from mine
waters. Biologinen ravinteiden poisto kaivosvedestä. Final report. Finnish Forest
Research Institute.
Merta E & Kaartinen T (2013) Current operations and practices and their influence on
nitrogen discharges. Background study for MINIMAN project.
Ojala Juhani V, Weidel Pär, Eilu Pasi & Iljina Markku (Eds.). Metallogeny and tectonic
evolution of the Northern Fennoscandian Shield: field trip guidebook. Geological
Survey of Finland, Espoo 2007.
Olofsson SO (1990) Applied explosives technology for construction and mining.
Second edition. Ärla: APPLEX
Oy Forcit Ab (2012) Product information of Kemiitti 510.
http://www.forcit.fi/en/archives/tuote/kemiitti-510-3 [10.6.2013].
Palmer K, Ronkanen A-K, Kløve B (2013) Flow paths and metal sorption in peatlands
polishing mine waters. Water research Conference at the University of Oulu. Oulu.
Thule institute: 55–57.
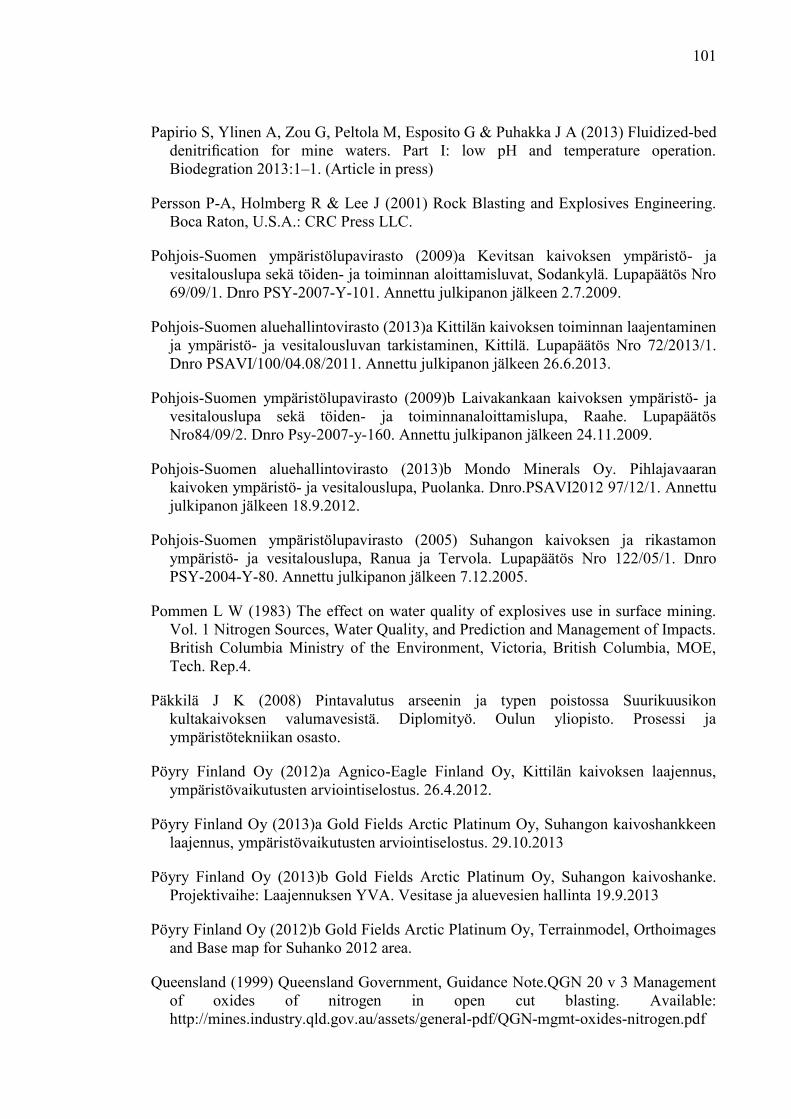
101
Papirio S, Ylinen A, Zou G, Peltola M, Esposito G & Puhakka J A (2013) Fluidized-bed
denitrification for mine waters. Part I: low pH and temperature operation.
Biodegration 2013:1–1. (Article in press)
Persson P-A, Holmberg R & Lee J (2001) Rock Blasting and Explosives Engineering.
Boca Raton, U.S.A.: CRC Press LLC.
Pohjois-Suomen ympäristölupavirasto (2009)a Kevitsan kaivoksen ympäristö- ja
vesitalouslupa sekä töiden- ja toiminnan aloittamisluvat, Sodankylä. Lupapäätös Nro
69/09/1. Dnro PSY-2007-Y-101. Annettu julkipanon jälkeen 2.7.2009.
Pohjois-Suomen aluehallintovirasto (2013)a Kittilän kaivoksen toiminnan laajentaminen
ja ympäristö- ja vesitalousluvan tarkistaminen, Kittilä. Lupapäätös Nro 72/2013/1.
Dnro PSAVI/100/04.08/2011. Annettu julkipanon jälkeen 26.6.2013.
Pohjois-Suomen ympäristölupavirasto (2009)b Laivakankaan kaivoksen ympäristö- ja
vesitalouslupa sekä töiden- ja toiminnanaloittamislupa, Raahe. Lupapäätös
Nro84/09/2. Dnro Psy-2007-y-160. Annettu julkipanon jälkeen 24.11.2009.
Pohjois-Suomen aluehallintovirasto (2013)b Mondo Minerals Oy. Pihlajavaaran
kaivoken ympäristö- ja vesitalouslupa, Puolanka. Dnro.PSAVI2012 97/12/1. Annettu
julkipanon jälkeen 18.9.2012.
Pohjois-Suomen ympäristölupavirasto (2005) Suhangon kaivoksen ja rikastamon
ympäristö- ja vesitalouslupa, Ranua ja Tervola. Lupapäätös Nro 122/05/1. Dnro
PSY-2004-Y-80. Annettu julkipanon jälkeen 7.12.2005.
Pommen L W (1983) The effect on water quality of explosives use in surface mining.
Vol. 1 Nitrogen Sources, Water Quality, and Prediction and Management of Impacts.
British Columbia Ministry of the Environment, Victoria, British Columbia, MOE,
Tech. Rep.4.
Päkkilä J K (2008) Pintavalutus arseenin ja typen poistossa Suurikuusikon
kultakaivoksen valumavesistä. Diplomityö. Oulun yliopisto. Prosessi ja
ympäristötekniikan osasto.
Pöyry Finland Oy (2012)a Agnico-Eagle Finland Oy, Kittilän kaivoksen laajennus,
ympäristövaikutusten arviointiselostus. 26.4.2012.
Pöyry Finland Oy (2013)a Gold Fields Arctic Platinum Oy, Suhangon kaivoshankkeen
laajennus, ympäristövaikutusten arviointiselostus. 29.10.2013
Pöyry Finland Oy (2013)b Gold Fields Arctic Platinum Oy, Suhangon kaivoshanke.
Projektivaihe: Laajennuksen YVA. Vesitase ja aluevesien hallinta 19.9.2013
Pöyry Finland Oy (2012)b Gold Fields Arctic Platinum Oy, Terrainmodel, Orthoimages
and Base map for Suhanko 2012 area.
Queensland (1999) Queensland Government, Guidance Note.QGN 20 v 3 Management
of oxides of nitrogen in open cut blasting. Available:
http://mines.industry.qld.gov.au/assets/general-pdf/QGN-mgmt-oxides-nitrogen.pdf

102
Ruotsalainen E (2010) Louhintatekniikan kehittäminen Talvivaaran kaivoksella. Final
project. Savonia-ammattikorkeakoulu, rakennustekniikka yhdyskuntatekniikka.
Ronkanen A-K & Kløve B (2005) Hydraulic soil properties of peatlands treating
municipal wastewater and peat harvesting runoff. Suo 56(2):43–56.
Sallanko J & Haanpää K-M (2008) Release of Impurities from Melting Snow Made
from Treated Municipal Wastewater. Journal of Cold Regions Engineering 22: 54–61
Schäfer M (2013) Tutkimusprojekti: Elektrokoagulaation sovellutuksia erityyppisten
vesien ja jätevesien käsittelyssä. Oulun yliopisto, Kemian laitos.
Seppälä A (2011) Development of blasting design to optimize fragmentation by
analysing drilling accuracy and loading capacities in the open pit mine Talvivaara.
Master´s thesis. Aalto University. Rock engineering.
Sormunen M (2000) Detonationsstörningar vid Sprängning i Skivras hos LKAB Kiruna.
Disturbances in Sublevel Caving Production Blasting at LKAB Kiruna. Master´s
thesis. Helsinki University of technology. Department of Material Science and Rock
Engineering.
Sjölund G (1997) Kväveläckage från sprängtesmassor. Examensarbete. Luleå Tekniska
Universitet. Institutionen för Samhällsbyggnadsteknik.
Tuukkanen T, Kløve B, Marttila H, Heikkinen K, Karppinen A (2012) Tilastollinen
analyysi turvetuotannon vesistökuormitukseen vaikuttavista tekijöistä. Oulun
yliopisto.
Uusimäki T (2013) Yara Suomi Oy. Siilinjärvi mine. E-mail message [22.7.2013]
Vuolio R & Halonen T (2012) Räjäytystyöt. 2. painos. Helsinki: Suomen
Rakennusmedia Oy.
Ylinen A (2013) Nitrogen removal from mining wastewater in bioreactors. Master’s
Thesis. Tampere University of Technology.
Ympäristöministeriö (2011) Kaivannaisjätteen luokittelu pysyväksi. Louhinnassa
muodostuvat sivukivet. Suomen ympäristö 21/2011. Helsinki:
Ympäristömininsteriön ympäristönsuojelujaosto. Available only in internet:
http://www.ymparisto.fi/download.asp?contentid=129161&lan=fi

11 APPENDIXES
List of appendixes:
Appendix 1. The projected annual nitrogen loads from each pit to its respective waste
rock stockpiling area
Appendix 2. The annual nitrogen loads migrate in ore to the concentrator
Appendix 3. The annual nitrogen loads migrate with low-grade ore to the low-grade
ore stockpiling areas
Appendix 4. The annual nitrogen loads of drainage water from different open pits
Appendix 5. In situ hydraulic conductivities of peatlands
Appendix 6. Humification degree of peat samples
Appendix 7. Water content, porosity and ash content of peat samples
Appendix 8. Chemical characterization of peat samples
Appendix 9. Results of pore water analyses
Appendix 10. Slopes and surface profiles at peatland 11, 12 and 13
Appendix 11. Slope and surface profile at peatland 2
Appendix 12. Slope and surface profile at peatland 3

APPENDIX 1
Appendix 1. The projected annual nitrogen loads from each pit to its respective waste
rock stockpiling area
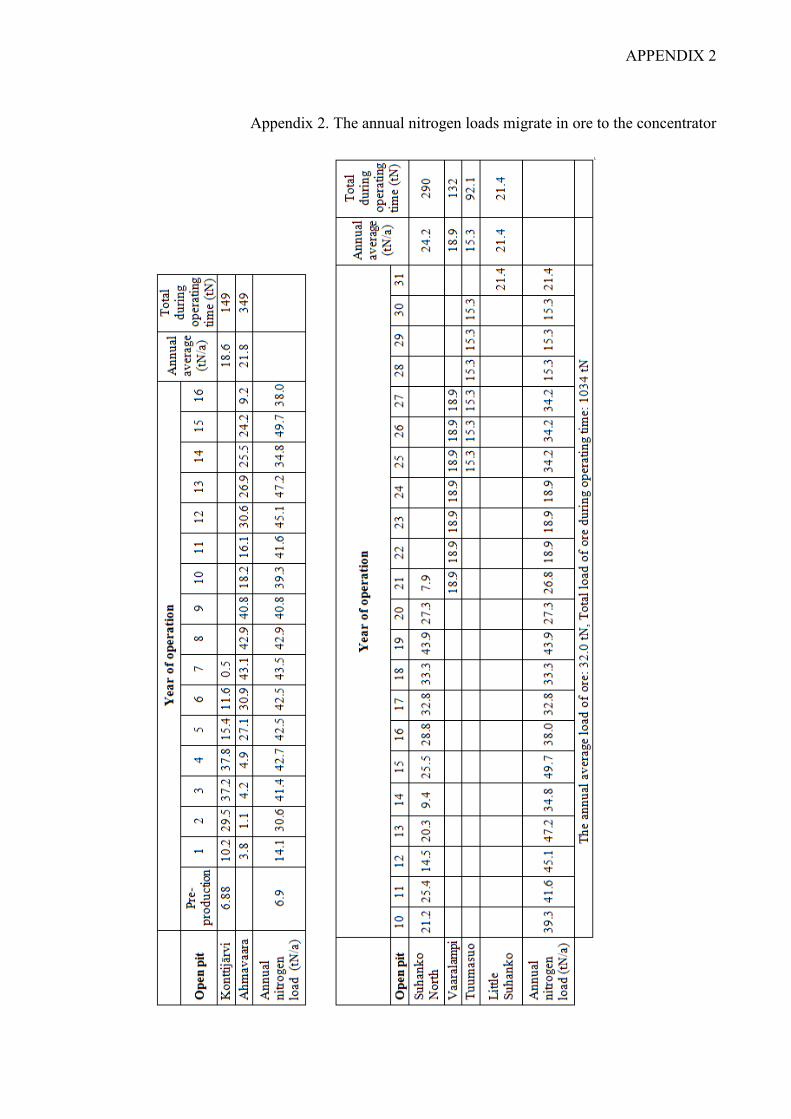
APPENDIX 2
Appendix 2. The annual nitrogen loads migrate in ore to the concentrator

APPENDIX 3
Appendix 3. The annual nitrogen loads migrate with low-grade ore to the low-grade ore
stockpiling areas

APPENDIX 4
Appendix 4. The annual nitrogen loads of drainage water from different open pits

APPENDIX 5
Appendix 5. In situ hydraulic conductivities (m/s) of peatlands
APPENDIX 6
Appendix 6. Humification degree of peat samples
Table 1. Peatlands 11, 12 and 13.
11 12 13
Depth (cm) Degree of
humification Depth (cm)
Degree of
humification Depth (cm)
Degree of
humification
0–2 H1 0–11 H1 0–18 H1
12–20 H2 11–18 H2 18–30 H2–H3
20–35 H3 18–42 H3 30–70 H4–H6
35–46 H4–H6 42–70 H4-H6
46–55 H7
Table 2. Peatland 2.
21 22 23
Depth (cm) Degree of
humification Depth (cm)
Degree of
humification Depth (cm)
Degree of
humification
0–8 H1–H3 0–5 H1 0–10 H1
8–40 H4-6 5–9 H2–H3 10–20 H2
40–70 H8–H9 9–42 H5–H6 20–40 H3
42–80 H7–H9
Table 3. Peatland 3.
31 32 33
Depth (cm) Degree of
humification Depth (cm)
Degree of
humification Depth (cm)
Degree of
humification
0–4 H1–H3 0–8 H1–H3 0-10 H1
4–35 H4–H6 8–29 H4–H5 10–41 H2–H3
35–70 H7–H8 29–55 H7–H8 41–60 H4–H6
60–70 H7
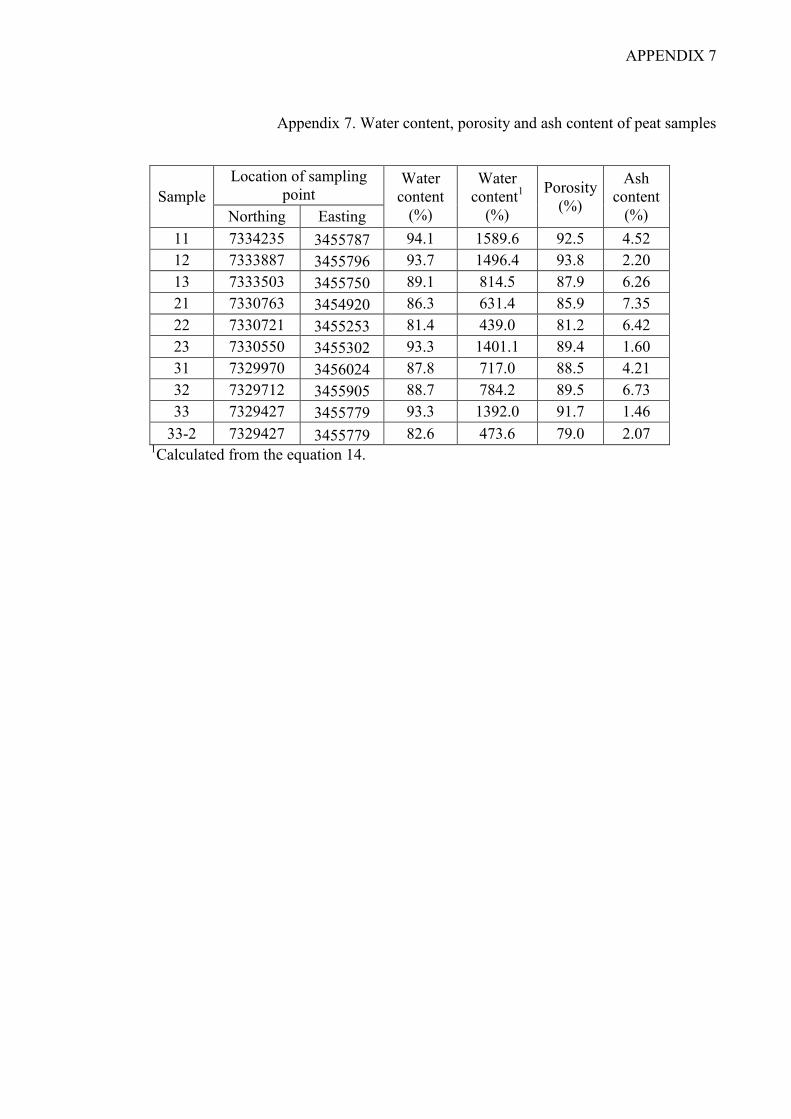
APPENDIX 7
Appendix 7. Water content, porosity and ash content of peat samples
Sample
Location of sampling
point Water
content
(%)
Water
content1
(%)
Porosity
(%)
Ash
content
(%) Northing Easting
11 7334235 3455787 94.1 1589.6 92.5 4.52
12 7333887 3455796 93.7 1496.4 93.8 2.20
13 7333503 3455750 89.1 814.5 87.9 6.26
21 7330763 3454920 86.3 631.4 85.9 7.35
22 7330721 3455253 81.4 439.0 81.2 6.42
23 7330550 3455302 93.3 1401.1 89.4 1.60
31 7329970 3456024 87.8 717.0 88.5 4.21
32 7329712 3455905 88.7 784.2 89.5 6.73
33 7329427 3455779 93.3 1392.0 91.7 1.46
33-2 7329427 3455779 82.6 473.6 79.0 2.07 1Calculated from the equation 14.

APPENDIX 8
Appendix 8. Chemical characterization of peat samples
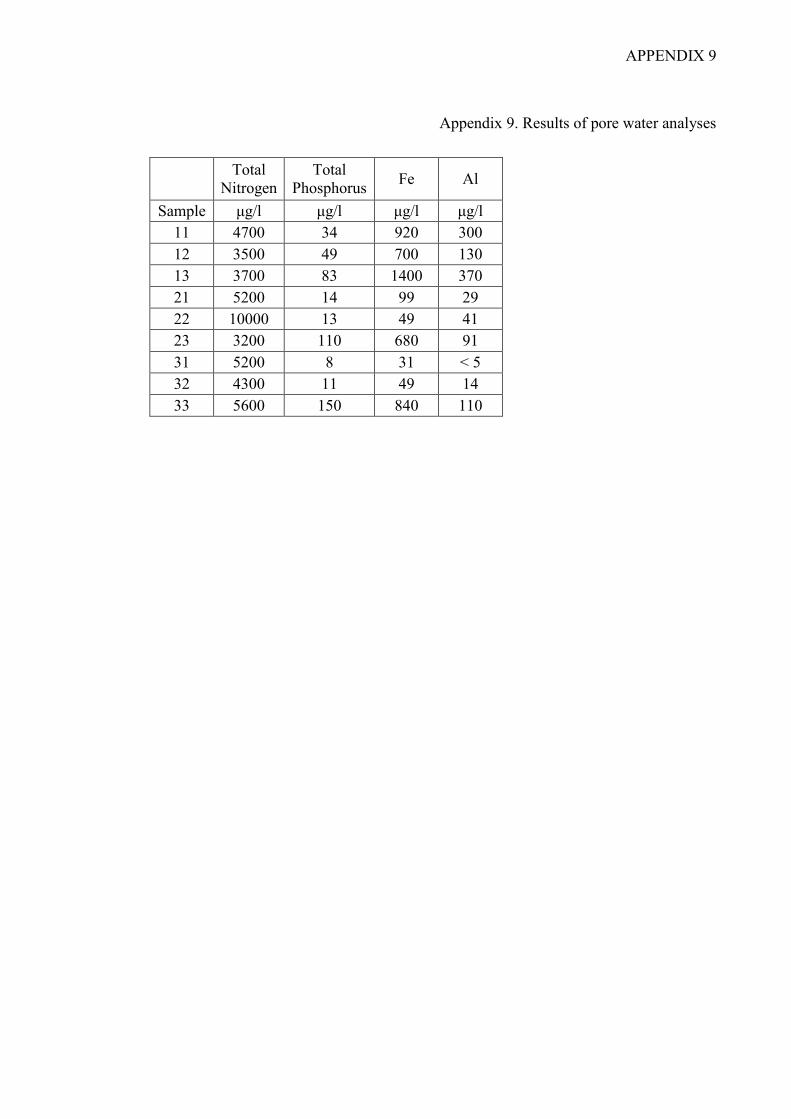
APPENDIX 9
Appendix 9. Results of pore water analyses
Total
Nitrogen
Total
Phosphorus Fe Al
Sample μg/l μg/l μg/l μg/l
11 4700 34 920 300
12 3500 49 700 130
13 3700 83 1400 370
21 5200 14 99 29
22 10000 13 49 41
23 3200 110 680 91
31 5200 8 31 < 5
32 4300 11 49 14
33 5600 150 840 110
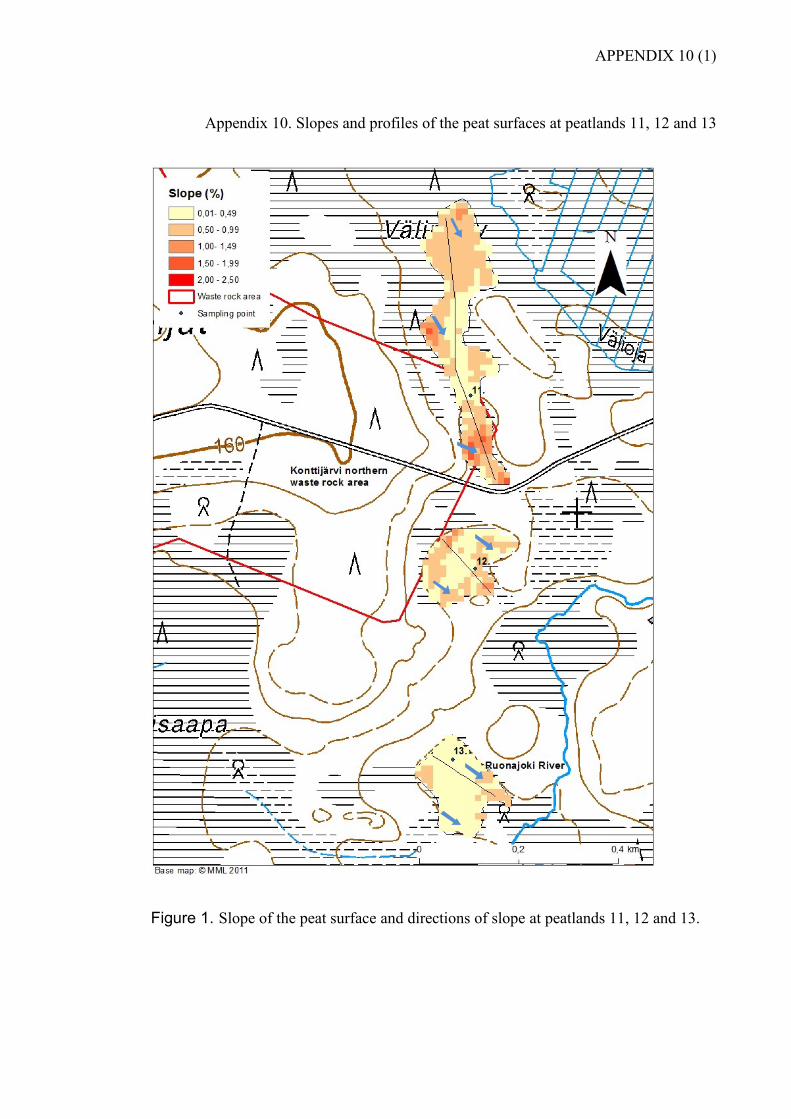
APPENDIX 10 (1)
Appendix 10. Slopes and profiles of the peat surfaces at peatlands 11, 12 and 13
Figure 1. Slope of the peat surface and directions of slope at peatlands 11, 12 and 13.
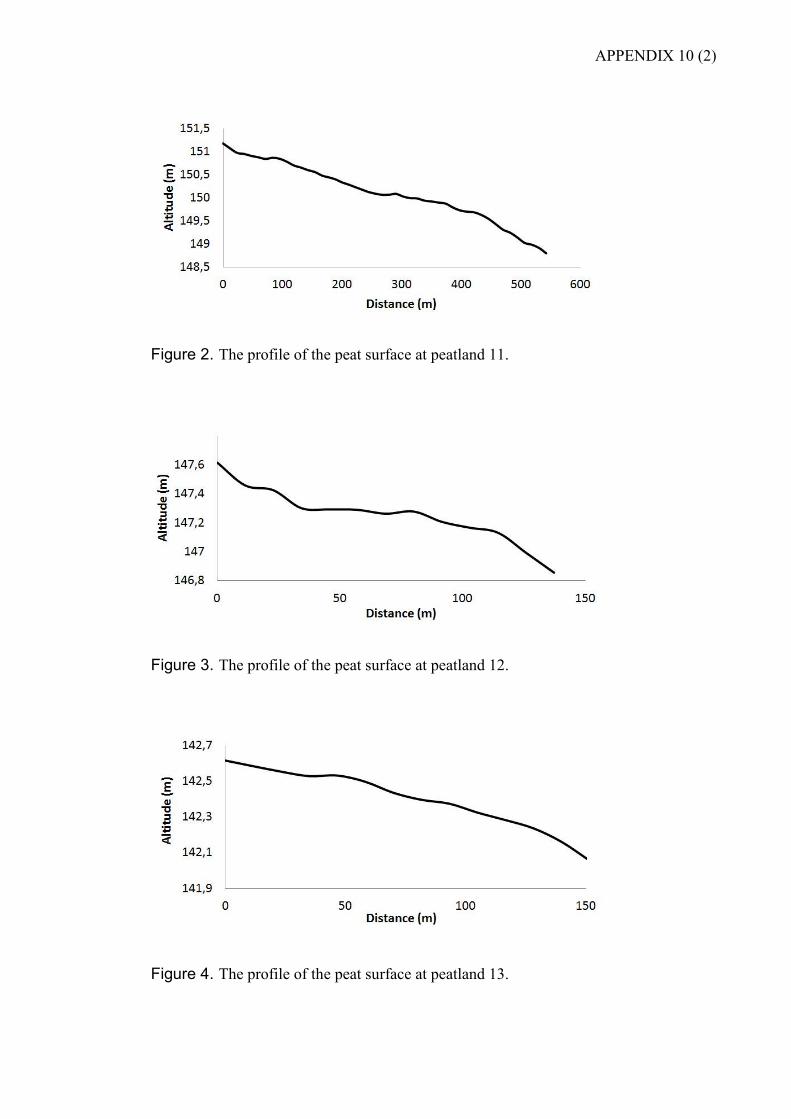
APPENDIX 10 (2)
Figure 2. The profile of the peat surface at peatland 11.
Figure 3. The profile of the peat surface at peatland 12.
Figure 4. The profile of the peat surface at peatland 13.
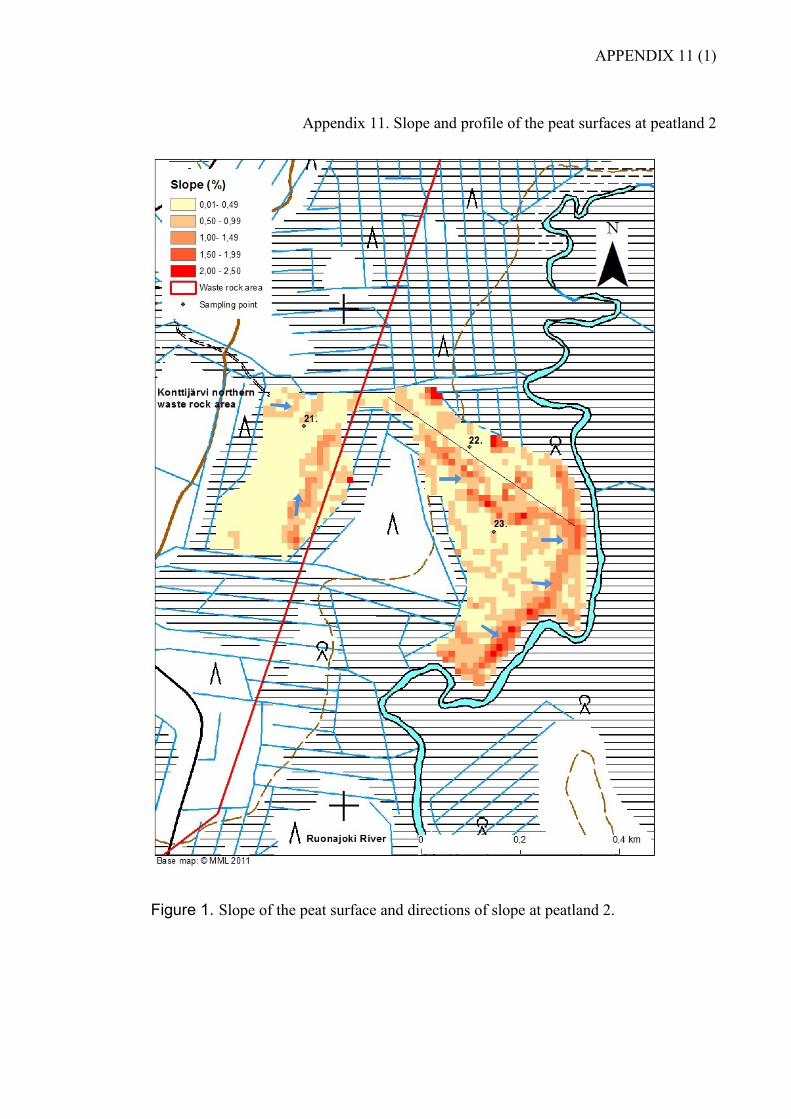
APPENDIX 11 (1)
Appendix 11. Slope and profile of the peat surfaces at peatland 2
Figure 1. Slope of the peat surface and directions of slope at peatland 2.
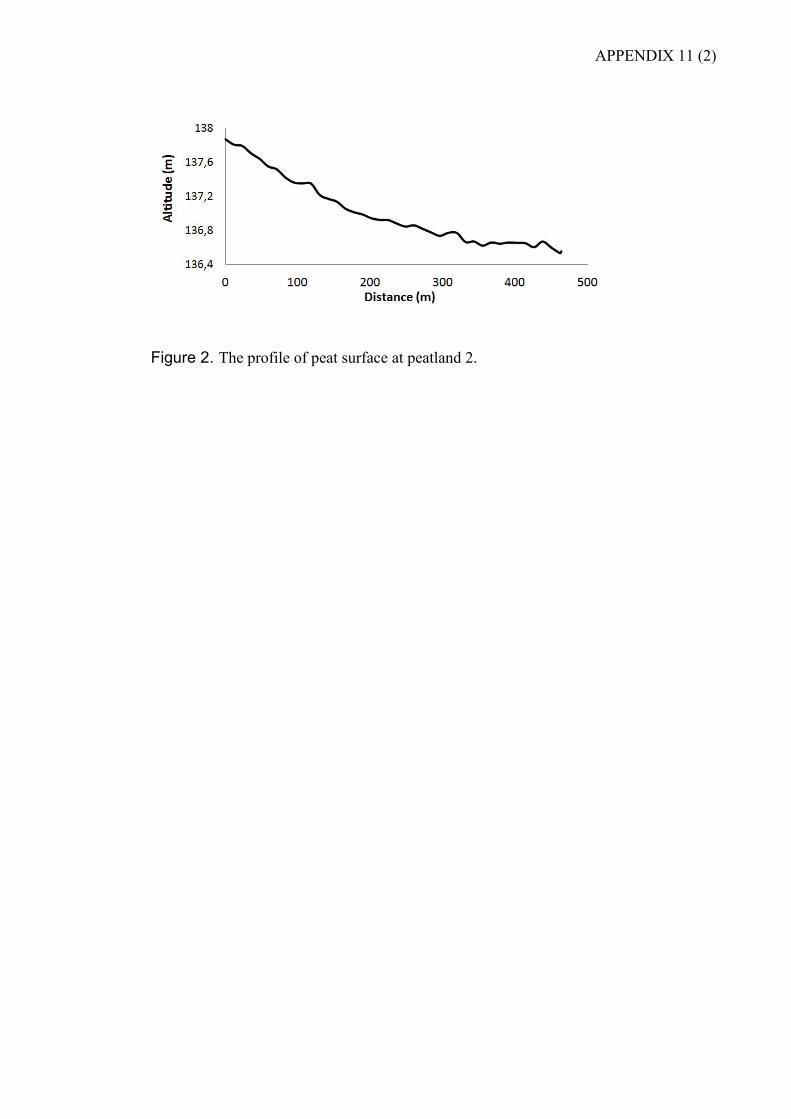
APPENDIX 11 (2)
Figure 2. The profile of peat surface at peatland 2.
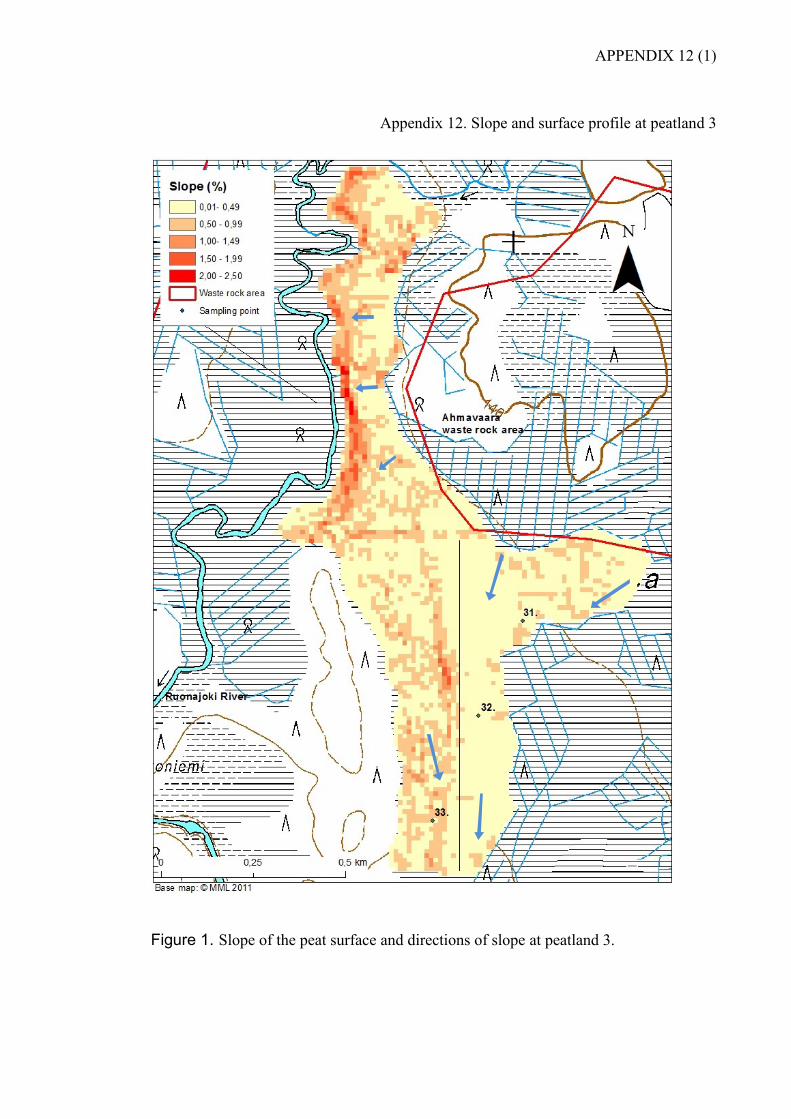
APPENDIX 12 (1)
Appendix 12. Slope and surface profile at peatland 3
Figure 1. Slope of the peat surface and directions of slope at peatland 3.
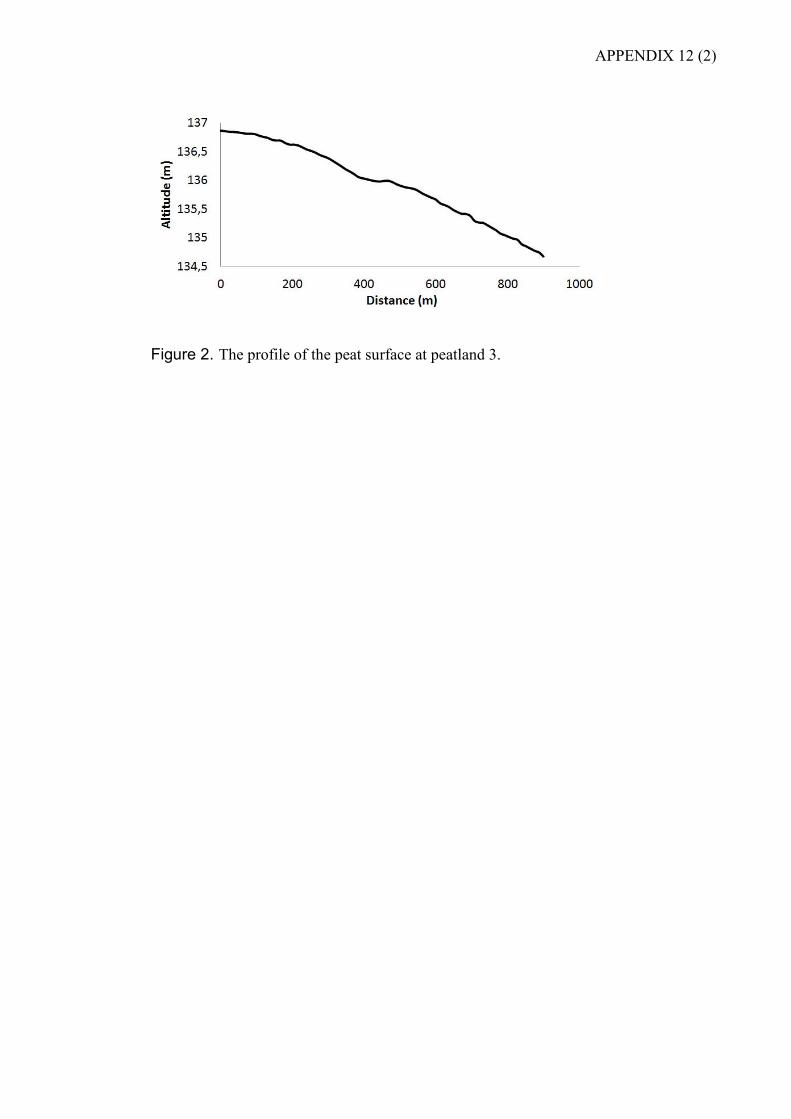
APPENDIX 12 (2)
Figure 2. The profile of the peat surface at peatland 3.


![MASTER’S THESIS - University of Oulujultika.oulu.fi/files/nbnfioulu-201712053278.pdf · 2.6% globally, suggesting that the market is approaching saturation [1]. The cellular growth](https://img.pdfslide.us/doc/110x75/5ecdd304160d724f271b9491/masteras-thesis-university-of-26-globally-suggesting-that-the-market-is-approaching.jpg)