Embed Size (px)
Citation preview
Faculty of Mechanical Engineering
MODELING OF VIBRATION TRANSMISSION ANDPREDICTION OF STRUCTURE-BORNE NOISE IN BUILDINGS
CHEAH YEE MUN
Master of Science in Mechanical Engineering
2016

MODELING OF VIBRATION TRANSMISSION ANDPREDICTION OF STRUCTURE-BORNE NOISE IN BUILDINGS
CHEAH YEE MUN
A thesis submittedin fulfillment of the requirements for the degree of Master of Science
in Mechanical Engineering
Faculty of Mechanical Engineering
UNIVERSITI TEKNIKAL MALAYSIA MELAKA
2016
DECLARATION
I declare that this thesis titled, ’Modeling of vibration transmission and prediction of
structure-borne noise in buildings’ is the result of my own research except as cited in the
references. The Thesis has not been accepted for any degree and is not currently submitted
in candidate of any other degree.
Signature : .........................................
Name : .........................................
Date : .........................................
i

APPROVAL
I hereby declare that I have read this thesis and in my opinion this thesis is sufficient in terms
of scope and quality for the award of Master of Science in Mechanical Engineering
Signature : .........................................
Supervisor Name : .........................................
Date : .........................................
ii

DEDICATION
”Be kind whenever possible. It is always possible.”
Dalai Lama
iii
ABSTRACT
Vibration originating from mechanical services are often the source of structure-borne noise
in buildings. The transmitted vibration waves from the service equipment can propagate
through the building structures and can eventually radiate sound which causes an audible
low frequency noise causing disturbance inside the building. Models and discussions on of
the vibration transmitted through the building structures are still lacking, particularly on how
it is radiated as sound. This project proposes the development of firstly, a generic analytical
model of a 2D portal frame structure consisting of column and beam elements. The results
of the velocity of the structures are validated with those from Finite Element (FE) model.
Bending waves in the building structure are presented through the operation deflection shapes
diagram. Secondly, the 2D FE model is extended to a 3D FE model to include plate elements
to represent walls, floors and roofs in a building. Using the hybrid FE/SEA analysis in VA
One software, sound pressure level (SPL) in the building environment can be predicted using
the injected power data of the motor obtained from the reception plate experiment. With the
induction motor speed of 50 Hz, the overall SPL are 44 dB and 42 dB for the upper and
lower cavities of the building respectively. These levels depend on the input power injected
by the motor which is also directly affected by the mechanical faults in the motor i.e. mass
unbalance and structural looseness. It is demonstrated that the SPL varies due to the faults in
the motor. The result shows that the model can be applied as a preliminary predictive guide
on the building design to minimize noise and vibration generated by service equipment.
iv
ABSTRAK
Getaran yang terhasil daripada perkhidmatan mekanikal merupakan sumber utama pence-
maran bunyi dalam bangunan. Gelombang getaran yang berpunca dari peralatan perkhid-
matan boleh mengaktifkan getaran pada struktur bangunan dan akhirnya memancarkan
bunyi yang menyebabkan gangguan bunyi frekuensi rendah di dalam bangunan. Model
dan perbincangan mengenai bagaimana getaran yang dihantar melalui struktur bangunan
masih kurang , terutamanya bagaimana ia terpancar sebagai bunyi. Pertama, projek ini
mencadangkan pembangunan model generik analitikal struktur kerangka portal 2D yang
terdiri daripada unsur lajur dan tiang. Model analitikal disahkan dengan model unsur ter-
hingga (FE). Lenturan gelombang dalam struktur bangunan dibentangkan melalui gambar
rajah bentuk operasi pesongan. Kedua, model 2D FE diteruskan kepada model 3D FE un-
tuk merangkumi unsur-unsur plat bagi mewakili dinding, lantai dan bumbung di bangunan.
Melalui penggunaan analisis hibrid FE/SEA dalam perisian VA One, tahap tekanan bunyi
(SPL) dalam persekitaran bangunan itu boleh diramal dengan menggunakan data kuasa
motor yang diperoleh daripada eksperimen plat penerima. Kelajuan motor yang digunakan
adalah sebanyak 50 Hz, SPL keseluruhan adalah 44 dB dan 42 dB untuk kaviti atas dan
bawah bangunan tersebut. Aras tekanan bunyi ini bergantung kepada kuasa input motor
yang juga melibatkan kerosakan mekanikal dalam motor iaitu jisim yang tidak seimbang
dan kelonggaran struktur. Ia menunjukkan bahawa SPL berbeza disebabkan oleh kerosakan
dalam motor. Hasil kajian menunjukkan bahawa model ini adalah mencukupi untuk mem-
beri panduan awal dalam reka bentuk bangunan untuk mengurangkan pencemaran bunyi
dan getaran yang dihasilkan oleh peralatan perkhidmatan bangunan.
v

ACKNOWLEDGEMENTS
First and foremost, I would like to give sincere tribute to my supervisor, Dr. Azma Putra. I
have been fortunate to have an advisor who gave me the freedom to explore. At the same
time he has provided me detailed guidance and encouragement throughout the research. I
appreciate the countless amount of times he spent having to solve, reflect and advise me in
regards to the problems which surfaced during this research.
I am also grateful for the support by Prof. David Thompson (ISVR, University of
Southampton). His expert advice and constructive suggestion during the planning and
development of this research work are greatly acknowledged.
Furthermore, I would like to thank my colleagues in the ’Vibro-Acoustic Research
Group’, for giving suggestions, sharing knowledge and providing ideas which gave valuable
input to enrich my work. My appreciation goes to the staff of Department of Mechanical
Engineering, UTeM for their kindness and patience.
Most importantly, none of this would have been possible without the love and for-
bearance of my family. A special thank you to my fiance, Aroon Seelan, for believing in
me and sharing my wish to reach the goal of completing this master. I would also like to
express my heart-felt gratitude to my extended family who have encouraged me throughout
this endeavor.
Finally, I appreciate the financial support from the Ministry of Education (MoE) through the
Fundamental Research Grant Scheme, FRGS/1/2014/TK01/FKM03/F00210.
vi
TABLE OF CONTENTS
PAGE
DECLARATION i
APPROVAL ii
DEDICATION iii
ABSTRACT iv
ABSTRAK v
ACKNOWLEDGEMENT vi
LIST OF TABLES x
LIST OF FIGURES xi
LIST OF ABBREVIATIONS xvi
LIST OF PHYSICAL CONSTANT xvii
LIST OF SYMBOLS xviii
LIST OF PUBLICATIONS xx
CHAPTER xx
1 INTRODUCTION 11.1 Background 11.2 Problem statement 21.3 Objective 31.4 Methodology 41.5 Scope of study 41.6 Thesis outline 5
2 LITERATURE STUDY 72.1 Introduction 72.2 Past findings on noise generation and transmission 7
2.2.1 Vibration transmission through building structures 92.2.1.1 Analytical methods 92.2.1.2 Numerical methods 11
2.2.2 Characterization of structure-borne source 13
vii
2.3 Governing equation 152.3.1 Fundamental of structural waves 152.3.2 Longitudinal wave motion in columns 162.3.3 Bending waves in beams 192.3.4 Input power of multiple contact points 222.3.5 Statistical Energy Analysis 25
2.4 Measurement parameters 272.4.1 Vibration parameters 272.4.2 Acoustics parameters 28
2.5 Summary 29
3 METHODOLOGY 303.1 Introduction 303.2 Development of analytical model for a two-dimensional (2D) portal frame
model 323.2.1 Simple portal frame model 32
3.2.1.1 Ground-borne force 353.2.1.2 Force acting at the mid-span of the beam 36
3.2.2 Operating deflection shapes (ODS) 413.2.3 Two-floors portal frame model 433.2.4 Influence of bending in columns 473.2.5 Soil dynamics 50
3.3 Development of numerical model for a three-dimensional (3D) portal framemodel 56
3.4 Development of a numerical model for sound pressure level prediction 583.4.1 FE subsystems 583.4.2 SEA subsystems 593.4.3 Hybrid FE/SEA Model 60
3.5 Experimental work 623.5.1 Portal frame experiment 623.5.2 Measurement of structural response 653.5.3 Reception plate experiment 673.5.4 General equation of structure-borne power 683.5.5 Preparation of reception plate method 683.5.6 Reception plate mobility 683.5.7 Spatial velocity of the plate response 69
3.6 Summary 71
4 ANALYTICAL RESULT AND ANALYSIS 724.1 Structural response of a two-dimensional (2D) five-floors model 724.2 Influence of parameters on structural response 78
4.2.1 Floor density 784.2.2 Damping loss factor 80
4.3 Comparison of the 3D FE model to 2D analytical model 83
viii
4.4 Summary 86
5 EXPERIMENTAL RESULT AND ANALYSIS 875.1 Introduction 875.2 Portal frame experiment result 875.3 Reception plate experiment result 915.4 Prediction of sound pressure level 935.5 Influence of machine faults 965.6 Summary 98
6 CONCLUSION AND RECOMMENDATION 996.1 Conclusion 99
6.1.1 Modeling of analytical 2D portal frame model 996.1.2 Prediction of sound pressure level using VA One 100
6.2 Thesis contribution 1006.3 Recommendation 101
REFERENCES 102
APPENDICES 109
A MATLAB CODES 109A.1 Function 109
A.1.1 Column element 109A.1.2 Beam element 109A.1.3 Hysteretic spring element 110
A.2 2D analytical portal frame model 111A.2.1 One-floor 111A.2.2 Two-floors 115A.2.3 Three-floors 121A.2.4 Five-floors 128
B INSTRUMENTATION 144B.1 Softwares interface 144
B.1.1 Abaqus interface 144B.1.2 VAone interface 144B.1.3 Data Physics signal analyzer interface 144
ix

LIST OF TABLES
TABLE TITLE PAGE
3.1 Material properties for analytical model 34
3.2 Material properties for the scaled experimental model 62
3.3 Scale model building instrumentation 65
3.4 Reception plate experiment instrumentation 69
x

LIST OF FIGURES
FIGURE TITLE PAGE
1.1 Typical paths of noise and vibration propagation from air-conditioning sys-
tems (Schaffer, 1991) 2
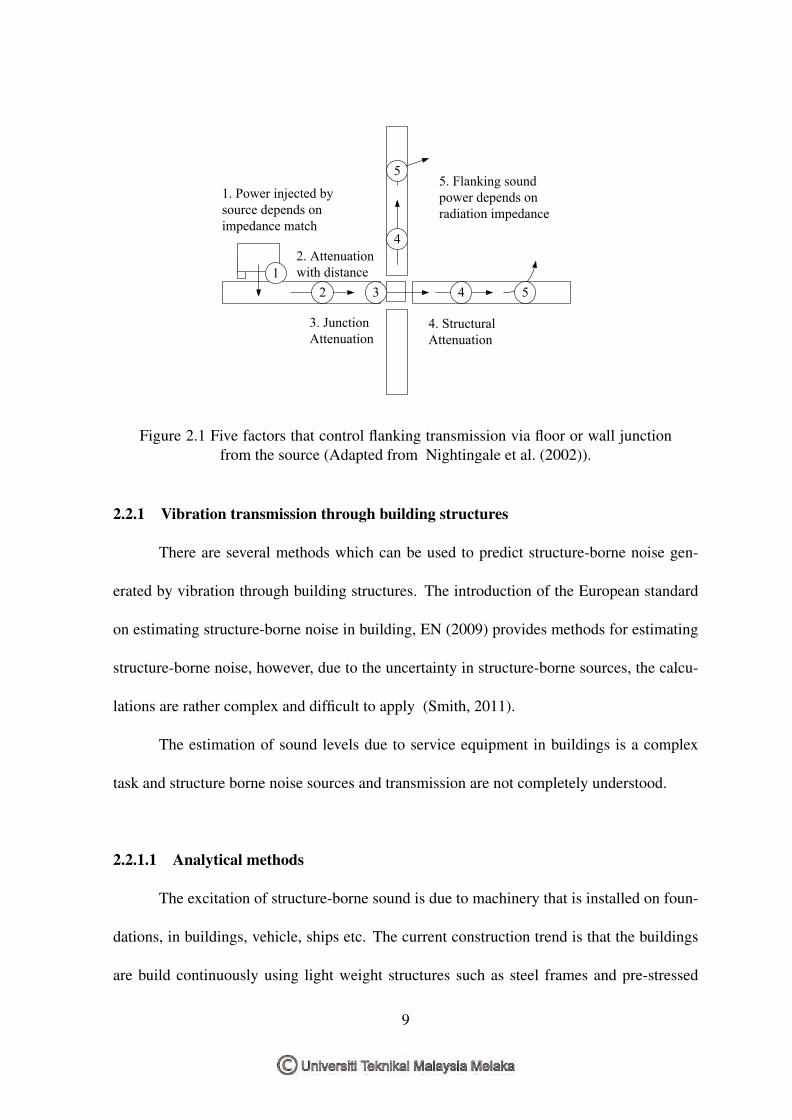
2.1 Five factors that control flanking transmission via floor or wall junction from
the source (Adapted from Nightingale et al. (2002)). 9
2.2 (a) Quasi-static transmission of flexible foundation modes on the superstruc-
ture and (b) Flexible modes of the superstructure with clamped foundation
(Adapted from Fiala et al. (2007)). 12
2.3 Aerial view of the Rana Plaza following the disaster 13
2.4 Rescue crews at the site of the Sampoong Super Store collapse 14
2.5 Elements in a concrete frame structure (Adapted from
www.understandconstruction.com) 16
2.6 Longitudinal waves travel in column element 19
2.7 Bending waves propagating in beam element 20
2.8 A vibrating source with (a) free velocity and (b) blocked force 23
2.9 A source connected to a receiver 24
2.10 Diagram illustrating power flow between two subsystems
(Adapted from Vigran (2008)) 26
3.1 The flowchart diagram of study methodology 31
3.2 Example of a simple frame 32
3.3 Dimension of the element in the building (a) beam and (b) column 34
xi
3.4 Vibration velocity level, Lν at the mid-span point due to ground-borne force
of amplitude 10 N. 36
3.5 Simply supported beam with force acting at the mid-span 36
3.6 Static equilibrium at node 2 38
3.7 Injection force slight away from the mid-span of the floor. 39
3.8 Vibration velocity level, Lν at the mid-span point due to injected force
slightly away from the mid-span of the floor. 40
3.9 ODS predicted using analytical portal frame model and FE model (a)-(b) 8.9
Hz, (c)-(d) 35.2 Hz and (e)-(f) 77.1 Hz 42
3.10 Example of a simple frame 43
3.11 Comparison of vibration velocity level Lν at each floor at the mid-span point
for two-floors simple portal frame from FE model and from analytical model. 45
3.12 ODS predicted for two-floors building (a) 8.9 Hz, (b) 34.1 Hz, (c) 35.7 Hz,
(d) 68.6 Hz, (e) 79.5 Hz, (f) 94.8 Hz (g) 117.5 Hz and (h) 138.6 Hz 46
3.13 Influence of bending in columns in portal frame 47
3.14 Influence of bending in columns for vibration velocity level Lν at each floor
at the mid-span point for two-floors simple portal frame using analytical ap-
proach 48
3.15 ODS predicted for two-floors building: (a), (c) and (e) no bending in column
and (b), (d), and (f) under the influence of bending 49
3.16 Example of a portal frame building with two-floors and dynamic soil charac-
teristic 51
3.17 Column attached to a hysteretic damping spring element 52
3.18 Comparison of vibration velocity level Lν at each floor at the mid-span for
two-floors simple portal frame from FE model and from analytical model
with soil dynamics of ksp = 120 MN/m2 53
xii

3.19 Comparison of vibration velocity level Lν at each floor at the mid-span
for two-floors simple portal frame on different types of soil using analyti-
cal model (−−without soil dynamic, −−Loose Sand, 15 MN/m2,−−Sitly
Medium Dense Sand, 30 MN/m2,−−Medium Dense Sand, 60 MN/m2 and
−−Dense Sand, 120 MN/m2) 54
3.20 ODS of the two-floors portal frame on different types of soil (−−without
soil dynamic, −−Loose Sand, 15 MN/m2,−−Sitly Medium Dense Sand,
30 MN/m2, −−Medium Dense Sand, 60 MN/m2 and −−Dense Sand, 120
MN/m2) for second eigenfrequency between 14.6 to 20.6 Hz 55
3.21 Isometric view of a two floor 3D FE model. 57
3.22 SEA plates added to the FE model to complete a Hybrid FE/SEA model 61
3.23 SEA acoustic cavities added to the Hybrid FE/SEA model 61
3.24 Flowchart of study experimental work 63
3.25 Scaled model building (a) portal frame and (b) dimensions of the model. 64
3.26 Experiment setup for mobility measurement using instrumental hammer 66
3.27 Flowchart diagram of reception plate experiment 67
3.28 Experiment setup for mobility measurement on reception plate 69
3.29 Experiment setup for spatial velocity measurement on the reception plate 70
4.1 Example of a portal frame to simulate a building with five-floors 73
4.2 Vibration velocity level Lν at each floor at the mid-span point 74
4.3 ODS predicted for five-floors building (a) 9 Hz, (b) 14.8 Hz, (c) 35.6 Hz, (d)
43.7 Hz, (e) 79.1 Hz, (f) 89.2 Hz, (g) 136 Hz and (h) 151 Hz 75
4.4 Ratio between the velocity level Lν at each floor at the mid-span point with
the vibration velocity level Lν at the top floor where the force is injected. 76
4.5 Ratio between the velocity level Lν at each floor at the column point with the
vibration velocity level Lν at the top floor where the force is injected. 77
4.6 Vibration velocity level at the mid-span position at 3rd floor using different
floor’s density values 79
4.7 Vibration velocity level at the mid-span position at 3rd floor using different
damping loss factor values 81
xiii
4.8 Vibration velocity level at the mid-span position at 3rd floor using different
damping loss factor for the floors 81
4.9 Vibration velocity level at the mid-span position at 3rd floor using different
damping loss factor for the columns 82
4.10 Comparison of vibration velocity level Lν at each floor at the mid-span point
for two-floor simple portal frame from 3D FE model and from 2D analytical
model. 84
4.11 ODS predicted for two-floors building using 3D FE model at (a) first peak
and (b) second peak at the first eigenfrequency. 85
5.1 Comparison of vibration velocity level Lν at each floor simple portal frame
from −−analytical model,−FE model, and −experiment 88
5.2 Coherence of the measurement taken at each floor (a) first (b) second and (c)
third floor 89
5.3 The measured spatial average mean-squared velocity of the reception plate
(one-third octave band in red) 91
5.4 Damping loss factor of the reception plate 92
5.5 Structure-borne power of the induction motor by reception plate method 93
5.6 The predicted sound pressure level in each cavity due to the injection power
from the top floor 94
5.7 The overall pressure level of the Hybrid FE/SEA model due to the injection
power from the top floor 95
5.8 Rotating unbalance mass is added to the rotating shaft of the motor 97
5.9 Structure-borne power of the induction motor at different condition by re-
ception plate method 97
5.10 The predicted sound pressure level in the upper cavity due to the injection
power from motor at different condition 98
B.1 A three-floors 3D FE model using Abaqus (a) portal frame and (b) operation
deflection of the building at 52 Hz 145
xiv

B.2 A three-floors Hybrid FE/SEA model using VA One (a) portal frame model
with cavities (b) power input of the induction motor using data obtained from
reception plate experiment 146
B.3 Instrumentation interface setting for measurement of structural response 147
xv

LIST OF ABBREVIATIONS
ANSI American National Standard Institutes
BE Boundary Element
FE Finite Element
HVAC Heating, Ventilation and Air Conditioning
MATLAB Matrix Laboratory
NC Noise Criteria
ODS Operating Deflection Shape
RC Reinforced Concrete
SEA Statistical Energy Analysis
SDOF Single Degree Of Freedom
xvi

LIST OF PHYSICAL CONSTANT
Speed of sound c = 343 ms−1
Velocity amplitude reference level νref = 1x10⁻⁹ ms−1
Sound power reference level Wref = 1x10⁻¹² W
xvii
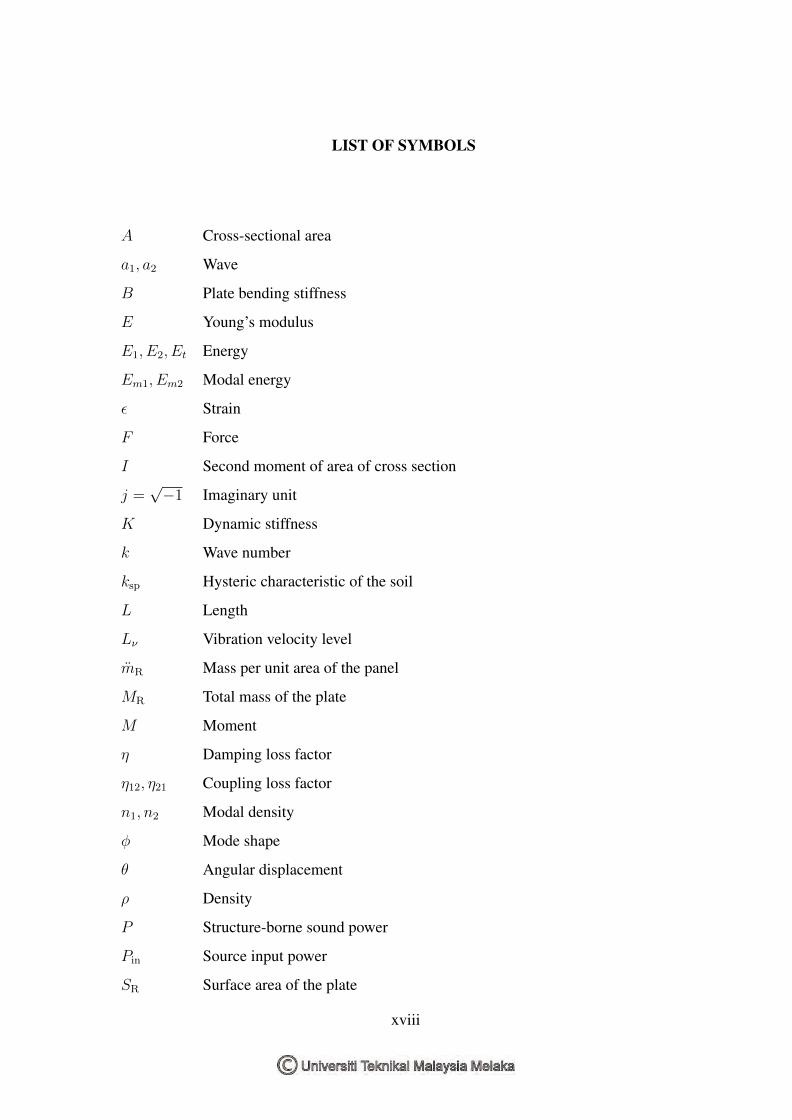
LIST OF SYMBOLS
A Cross-sectional area
a1, a2 Wave
B Plate bending stiffness
E Young’s modulus
E1, E2, Et Energy
Em1, Em2 Modal energy
ε Strain
F Force
I Second moment of area of cross section
j =√−1 Imaginary unit
K Dynamic stiffness
k Wave number
ksp Hysteric characteristic of the soil
L Length
Lν Vibration velocity level
mR Mass per unit area of the panel
MR Total mass of the plate
M Moment
η Damping loss factor
η12, η21 Coupling loss factor
n1, n2 Modal density
φ Mode shape
θ Angular displacement
ρ Density
P Structure-borne sound power
Pin Source input power
SR Surface area of the plate
xviii
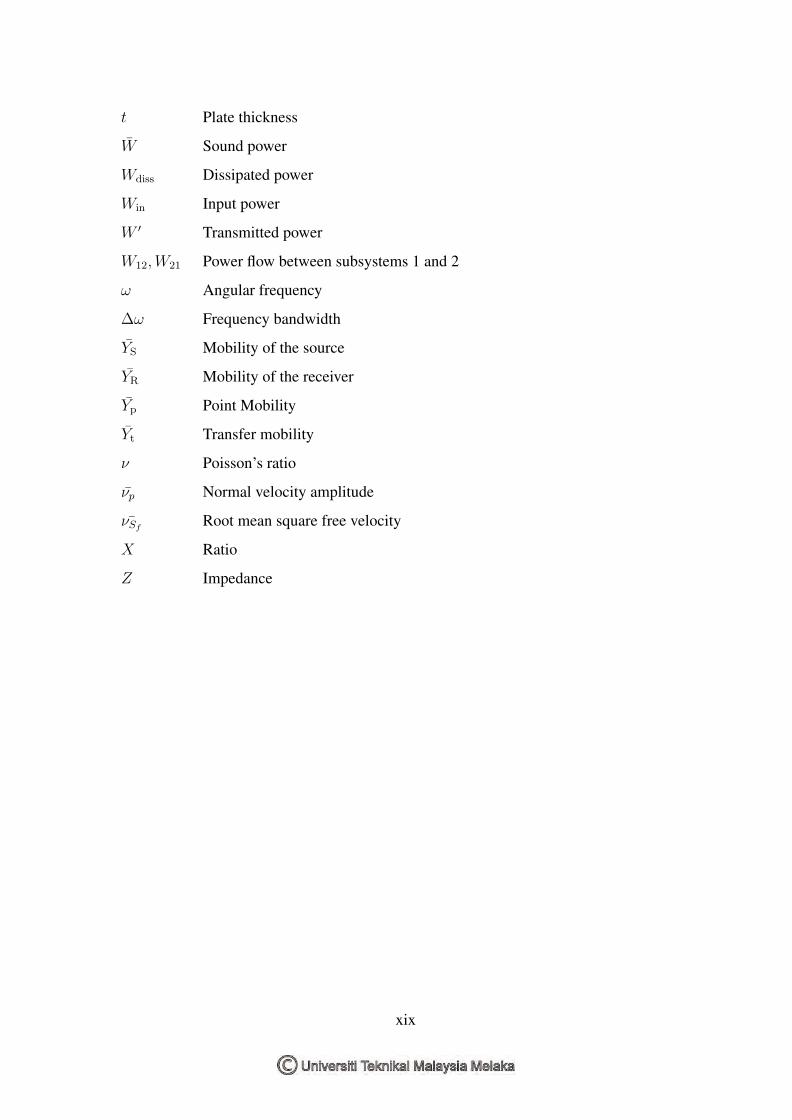
t Plate thickness
W Sound power
Wdiss Dissipated power
Win Input power
W ′ Transmitted power
W12,W21 Power flow between subsystems 1 and 2
ω Angular frequency
∆ω Frequency bandwidth
YS Mobility of the source
YR Mobility of the receiver
Yp Point Mobility
Yt Transfer mobility
ν Poisson’s ratio
νp Normal velocity amplitude
¯νSfRoot mean square free velocity
X Ratio
Z Impedance
xix
LIST OF PUBLICATIONS
Journal Articles
Putra, A., Cheah, Y.M., Muhammad, N., Rivai, A. and Wai, C.M., (2014). The ef-
fect of perforation on the dynamics of a flexible panel. Advances in Acoustics and
Vibration, 2014.
Cheah, Y.M., Putra, A., Lim, K.H., Ramlan, R., and Muhammad, N., (2016). Identify-
ing structure-borne noise transmission in building. International Review of Mechanical
Engineering, 2016.
Proceedings
Cheah, Y.M., Putra, A., Muhammad, N. and Ramlan, R., (2015). Fundamental model
of structure-borne vibration transmission in buildings using the portal frame approach.
Proceedings of Mechanical Engineering Research Day 2015, MERD’15, 2015, pp.93-
94.
Cheah, Y.M., Putra, A., Ramlan, R. and Muhammad, N., (2016). Identification of
noise in room due to HVAC system. Proceedings of Mechanical Engineering Research
Day 2016, MERD’16, 2016, pp. 208-209.
xx

CHAPTER 1
INTRODUCTION
1.1 Background
As a number of building service equipments, such as pumps, ventilators and air condi-
tioners, emergency generators, cooling towers and mechanical parking towers are installed in
buildings, inevitably, the operation induced structure-borne vibration. This can be a common
noise and vibration problem in the building. Long-term exposure to the ambient noise, can
lead to noise-induced stress related health effects such as depression, sorrow, social isolation
and aggression (Passchier-Vermeer and Passchier, 2000). For these reasons, noise control is
essential.
Occupants of the interior space are subjected to noise due to direct transmission
through the structure junction and the radiated sound from the surfaces of the room. The
background noise criteria are based on two factors, the first is the perceived loudness of the
noise relative to that of normal activities and second is the sound quality of the background
noise (Schaffer, 1991). The recent ANSI S12.2 (2008) room noise criteria standard con-
tains both a survey and an engineering method to specify room noise criteria (Schomer,
2009). The standard employs A-weighted sound level and extended Noise Criteria (NC),
respectively. It is based on human hearing (subjective responses) and it is sensitive to the
standard deviation of random noise or low frequency dominating in the 16 to 125 Hz octave
band such as the sound that can be produced by Heating, Ventilation and Air Conditioning
(HVAC) systems or other equipment. According to ANSI S12.2 (2008), the background

noise level of an unoccupied private office and conference rooms should not exceed a sound
level of 35 dB(A). If the ambient noise level exceeds 35 dB(A), it will decrease intelligibility
of the speech, for example, complaints of annoyance and stress can result.
The majority of noise sources come from vibrating equipment installed in the build-
ing. The transmitted vibration from service equipment activates the building structures to
vibrate and eventually radiate sound which causes audible low frequency noise disturbance
inside the building.The vibration waves follow different paths until they reach a room inside
the building as illustrated in Figure 1.1. The illustration can be seen to mostly concern the
airborne path rather than the structure-borne path (Schaffer, 1991). However, in practice,
the structure-borne path can also come from the connection of the duct to the wall and from
the roof.
Figure 1.1 Typical paths of noise and vibration propagation from air-conditioningsystems (Schaffer, 1991)
2
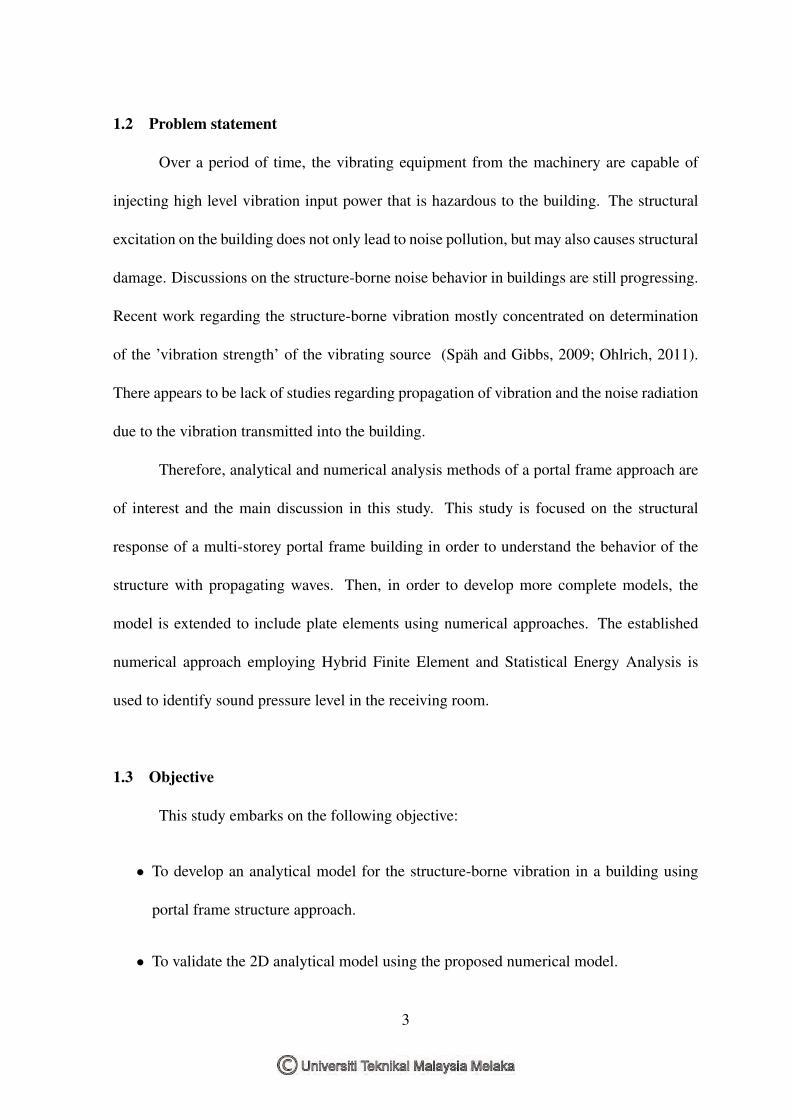
1.2 Problem statement
Over a period of time, the vibrating equipment from the machinery are capable of
injecting high level vibration input power that is hazardous to the building. The structural
excitation on the building does not only lead to noise pollution, but may also causes structural
damage. Discussions on the structure-borne noise behavior in buildings are still progressing.
Recent work regarding the structure-borne vibration mostly concentrated on determination
of the ’vibration strength’ of the vibrating source (Spah and Gibbs, 2009; Ohlrich, 2011).
There appears to be lack of studies regarding propagation of vibration and the noise radiation
due to the vibration transmitted into the building.
Therefore, analytical and numerical analysis methods of a portal frame approach are
of interest and the main discussion in this study. This study is focused on the structural
response of a multi-storey portal frame building in order to understand the behavior of the
structure with propagating waves. Then, in order to develop more complete models, the
model is extended to include plate elements using numerical approaches. The established
numerical approach employing Hybrid Finite Element and Statistical Energy Analysis is
used to identify sound pressure level in the receiving room.
1.3 Objective
This study embarks on the following objective:
• To develop an analytical model for the structure-borne vibration in a building using
portal frame structure approach.
• To validate the 2D analytical model using the proposed numerical model.
3
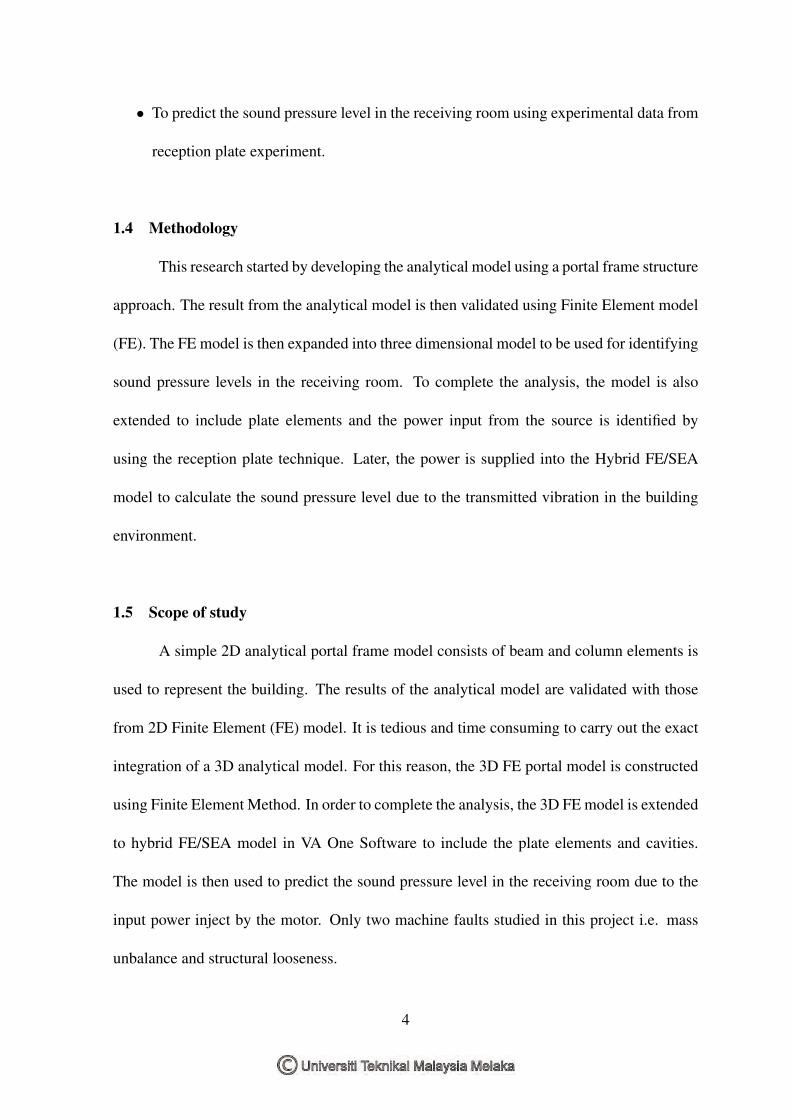
• To predict the sound pressure level in the receiving room using experimental data from
reception plate experiment.
1.4 Methodology
This research started by developing the analytical model using a portal frame structure
approach. The result from the analytical model is then validated using Finite Element model
(FE). The FE model is then expanded into three dimensional model to be used for identifying
sound pressure levels in the receiving room. To complete the analysis, the model is also
extended to include plate elements and the power input from the source is identified by
using the reception plate technique. Later, the power is supplied into the Hybrid FE/SEA
model to calculate the sound pressure level due to the transmitted vibration in the building
environment.
1.5 Scope of study
A simple 2D analytical portal frame model consists of beam and column elements is
used to represent the building. The results of the analytical model are validated with those
from 2D Finite Element (FE) model. It is tedious and time consuming to carry out the exact
integration of a 3D analytical model. For this reason, the 3D FE portal model is constructed
using Finite Element Method. In order to complete the analysis, the 3D FE model is extended
to hybrid FE/SEA model in VA One Software to include the plate elements and cavities.
The model is then used to predict the sound pressure level in the receiving room due to the
input power inject by the motor. Only two machine faults studied in this project i.e. mass
unbalance and structural looseness.
4
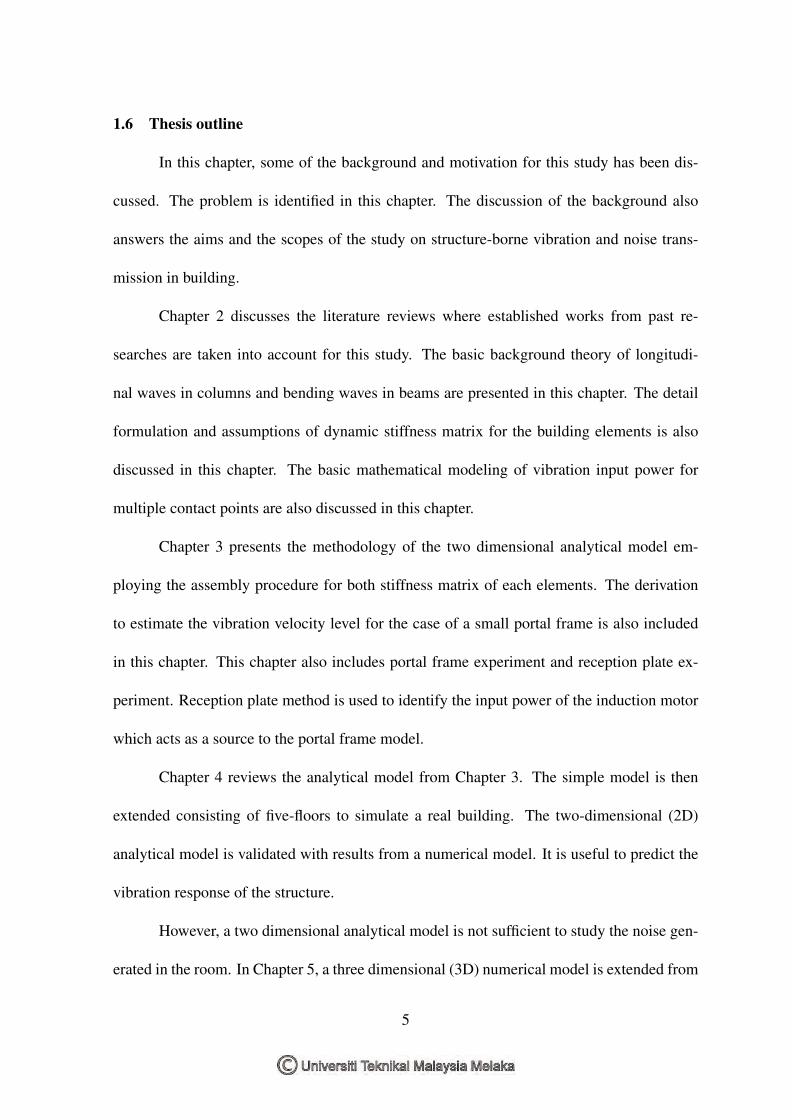
1.6 Thesis outline
In this chapter, some of the background and motivation for this study has been dis-
cussed. The problem is identified in this chapter. The discussion of the background also
answers the aims and the scopes of the study on structure-borne vibration and noise trans-
mission in building.
Chapter 2 discusses the literature reviews where established works from past re-
searches are taken into account for this study. The basic background theory of longitudi-
nal waves in columns and bending waves in beams are presented in this chapter. The detail
formulation and assumptions of dynamic stiffness matrix for the building elements is also
discussed in this chapter. The basic mathematical modeling of vibration input power for
multiple contact points are also discussed in this chapter.
Chapter 3 presents the methodology of the two dimensional analytical model em-
ploying the assembly procedure for both stiffness matrix of each elements. The derivation
to estimate the vibration velocity level for the case of a small portal frame is also included
in this chapter. This chapter also includes portal frame experiment and reception plate ex-
periment. Reception plate method is used to identify the input power of the induction motor
which acts as a source to the portal frame model.
Chapter 4 reviews the analytical model from Chapter 3. The simple model is then
extended consisting of five-floors to simulate a real building. The two-dimensional (2D)
analytical model is validated with results from a numerical model. It is useful to predict the
vibration response of the structure.
However, a two dimensional analytical model is not sufficient to study the noise gen-
erated in the room. In Chapter 5, a three dimensional (3D) numerical model is extended from
5

the two-dimensional numerical model in Chapter 4 for a better understanding of the struc-
tural behaviour. The sound pressure level in the receiving room is predicted using a Hybrid
FE/SEA approach.
Chapter 6 summarizes the findings of this study and proposes future work and recom-
mendation for further study.
6
CHAPTER 2
LITERATURE STUDY
2.1 Introduction
In this chapter, established research work done for structural-borne vibration and
noise transmission in building is reviewed. A brief principle to the theory of dynamic stiff-
ness matrix approach for columns and beams is also included in this chapter. Euler-Bernoulli
theory is applied to determine the bending waves in a beam element, while assuming only
longitudinal waves occur in column element.
2.2 Past findings on noise generation and transmission
Building service equipment are often the major sources of interior noise. Operation
of the equipment can induce mechanical vibration that propagates into the receiving room
through building structure at the contact points between the equipment to the structure. The
vibration can also create a secondary radiation of noise from the walls and floors in the room.
The effects of transmitted vibration include feel-able movement of the building floors, shak-
ing of items on shelves, and rumbling sounds. The level of the vibration generated from the
machine depends on a number of parameters related to the operation of the machine. Ma-
chine deterioration due to poor maintenance and faults can also contribute to the vibration
level. The significant factors of the system are the characteristics of the machine, the vi-
bration propagation in the building, the building foundation response and the room acoustic
response.
Heavy monolithic construction was first investigated to predict sound transmission
through complete building system (Quirt, 2009). The principle of statistical energy analy-
sis (SEA) is well suited for heavy monolithic construction, with structural elements such as
concrete floors and masonry walls. The building elements such as floors or walls are treated
as homogeneous and isotropic, where these elements are characterized at reverberant levels
and most energy losses are due to adjoining elements (Craik, 1996). However, if the pro-
posed system is anisotropic and highly damped, in result, the vibration levels vary across the
surface of the structural assembly, which limits the applicability of simple SEA models.
On the other hand, for lightweight framed construction, study of sound transmission
in Canada has focused on typical North American wood-framed building. Nightingale et al.
(2002) proposed that the power flow via each flanking path is defined by five transmission
factors whose combined effect is characterized by a path transfer function specific to the type
of the excitation and the construction detail. Figure 2.1 shows the factors controlling the
transmission of the structure-borne sound from the source to the room beside. Unlike heavy
monolithic construction, the structure-borne source in lightweight construction is much more
localized. Hence, in Nightingale et al. (2002) work, he suggests that direction of transmission
relative to the framing members becomes an additional parameter needed for an accurate
prediction.
For this project, the most common type of building structures in Malaysia will be
discussed. Reinforced concrete (RC) frame structures are the predominant structural system
in Malaysia. RC is designed to provide resistance to gravity and lateral loads through bending
in beams and columns.
8
2 3 4 5
4
55. Flanking sound power depends on radiation impedance
4. Structural Attenuation
3. Junction Attenuation
2. Attenuation with distance
1. Power injected by source depends on impedance match
1
Figure 2.1 Five factors that control flanking transmission via floor or wall junctionfrom the source (Adapted from Nightingale et al. (2002)).
2.2.1 Vibration transmission through building structures
There are several methods which can be used to predict structure-borne noise gen-
erated by vibration through building structures. The introduction of the European standard
on estimating structure-borne noise in building, EN (2009) provides methods for estimating
structure-borne noise, however, due to the uncertainty in structure-borne sources, the calcu-
lations are rather complex and difficult to apply (Smith, 2011).
The estimation of sound levels due to service equipment in buildings is a complex
task and structure borne noise sources and transmission are not completely understood.
2.2.1.1 Analytical methods
The excitation of structure-borne sound is due to machinery that is installed on foun-
dations, in buildings, vehicle, ships etc. The current construction trend is that the buildings
are build continuously using light weight structures such as steel frames and pre-stressed
9
concrete. This results in structures with inherently low damping in comparison to older
buildings which are built with bricks. This phenomena also enables larger span floors with
lower first resonances (Grootenhuis, 1990). Hence, these modern construction methods tend
to result in buildings which are more susceptible to vibration within the frequency range of
concern, typically between 5 and 200 Hz (Talbot and Hunt, 2000).
In recent years, many studies of transmission of structure-borne sound in buildings
focus on buildings above railway tunnels. Ljunggren (1991) conducted the research on the
transmission of structure-borne sound in buildings in the special case where the sound origi-
nates from underground railway traffic. In his study, it was demonstrated that a major part of
the sound is transmitted upwards in the building in the form of quasi-longitudinal waves. The
model is presented based on Ketten-Leiter theory, where the load bearing walls/columns and
the floor are modelled as an infinite cascade of longitudinal rods alternating with impedance
elements. Ljunggren’s method was applied in Hassan (2001)’s recent work, a finite ground
impedance is taken into account as well as wave reflection from the rood. As this study
focused on low frequencies, from comparison between result from the approximate and the
complete models, it is found that the agreement between the two models is in general fairly
good for buildings with columns, but not for bearing walls.
Cryer (1994) used the dynamic stiffness method to model a two dimensional building
to study vibration transmission in building. The model demonstrates the dynamic behaviour
of the portal frame using analytic solutions of an elastic bar and Euler beam. The model does
include the longitudinal and transverse behaviour of the elements such as floor and columns.
In Hunt (1997)’s study, dynamic stiffness matrix is used for predicting the vibration response
of a larger structure. The dynamic modeling is obtained by assembling columns and beams
10

into repeating units. The method is extended to structures that are infinitely long, thereby
reducing computational times. The numerical value of damping is found not to be a critical
factor on account of radiation to infinity through the structure and into the piled foundation.
2.2.1.2 Numerical methods
Lightweight constructions are progressing faster than the conventional heavy struc-
ture buildings. Reliable prediction tools for noise transmission in lightweight buildings are
in needs, hence analytical solutions have been established for a number of simple structures
(Cremer et al., 2005). Galbrun (2010) conducted a study on modeling of vibration trans-
mission through plate/beam structures typical of lightweight buildings. SEA was used as
the framework of analysis for prediction, but the theories examined were independent from
SEA. The result obtained indicated that simple point models are only applicable to single
plate and beam system and to the parallel opposite plates connected along their center to a
beam. Such application is limited to frequencies below 2 kHz. In Craik et al. (1991)’s stud-
ies, it is shown that SEA is unreliable for low frequencies investigation as there are only few
resonant modes. It was found that it is the modes in the receiving subsystem that affect the
power flow for transmission between plates. Finite element models do not suffer from the
same limitation as SEA models.
Studies on transmission of structure-borne sound in buildings due to ground-borne
noise have been conducted by Andersen and Jones (2006) and Fiala et al. (2007). A coupled
finite element (FE) and boundary element (BE) scheme were applied in their studies. Fiala
et al. (2007) proposed a numerical model of the structural and acoustic response of a building
due to incoming wave field generated by high-speed surface railway traffic. The research
11
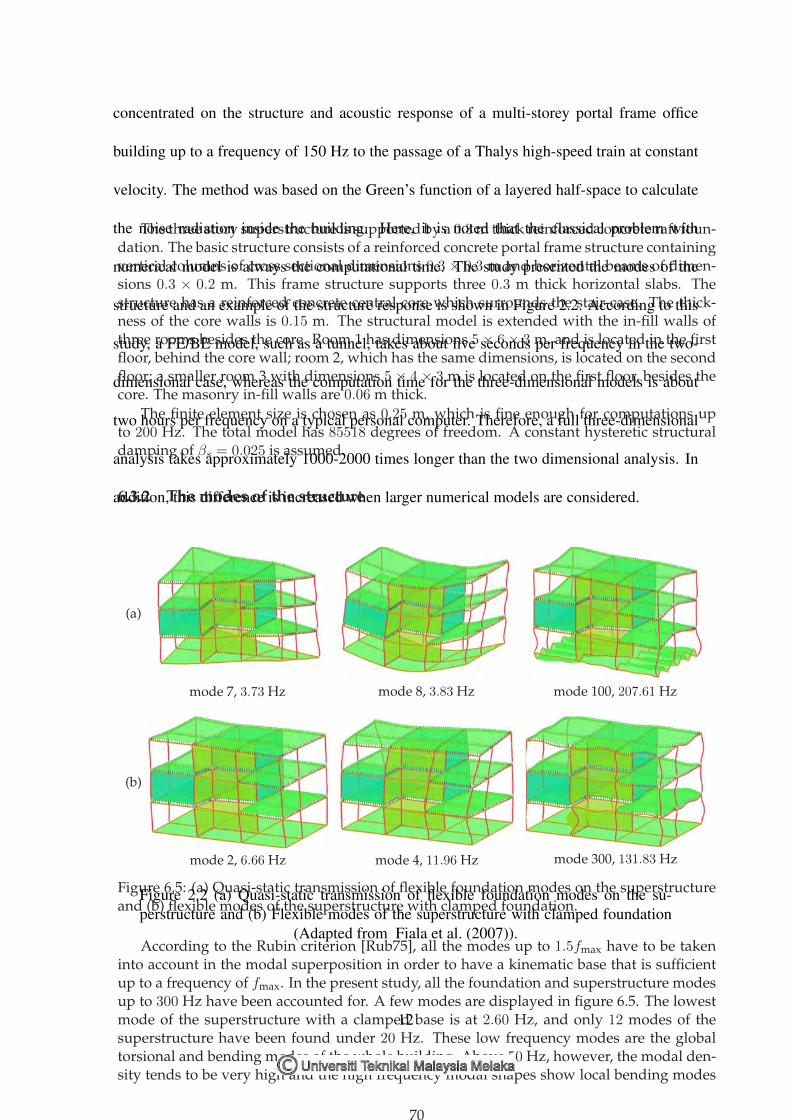
concentrated on the structure and acoustic response of a multi-storey portal frame office
building up to a frequency of 150 Hz to the passage of a Thalys high-speed train at constant
velocity. The method was based on the Green’s function of a layered half-space to calculate
the noise radiation inside the building. Here, it is noted that the classical problem with
numerical model is always the computational time. The study presented the modes of the
structure and an example of the structure response is shown in Figure 2.2. According to this
study, a FE/BE model, such as a tunnel, takes about five seconds per frequency in the two-
dimensional case, whereas the computation time for the three-dimensional models is about
two hours per frequency on a typical personal computer. Therefore, a full three-dimensional
analysis takes approximately 1000-2000 times longer than the two dimensional analysis. In
addition, this difference is increased when larger numerical models are considered.
The three story superstructure is supported by a 0.3 m thick reinforced concrete raft foun-dation. The basic structure consists of a reinforced concrete portal frame structure containingvertical columns of cross sectional dimensions 0.3 × 0.3 m and horizontal beams of dimen-sions 0.3 × 0.2 m. This frame structure supports three 0.3 m thick horizontal slabs. Thestructure has a reinforced concrete central core which surrounds the stair-case. The thick-ness of the core walls is 0.15 m. The structural model is extended with the in-fill walls ofthree rooms besides the core. Room 1 has dimensions 5× 6× 3 m, and is located in the firstfloor, behind the core wall; room 2, which has the same dimensions, is located on the secondfloor; a smaller room 3 with dimensions 5 × 4 × 3 m is located on the first floor, besides thecore. The masonry in-fill walls are 0.06 m thick.
The finite element size is chosen as 0.25 m, which is fine enough for computations upto 200 Hz. The total model has 85518 degrees of freedom. A constant hysteretic structuraldamping of βs = 0.025 is assumed.
6.3.2 The modes of the structure
(a)
mode 7, 3.73 Hz mode 8, 3.83 Hz mode 100, 207.61 Hz
(b)
mode 2, 6.66 Hz mode 4, 11.96 Hz mode 300, 131.83 Hz
Figure 6.5: (a) Quasi-static transmission of flexible foundation modes on the superstructureand (b) flexible modes of the superstructure with clamped foundation.
According to the Rubin criterion [Rub75], all the modes up to 1.5fmax have to be takeninto account in the modal superposition in order to have a kinematic base that is sufficientup to a frequency of fmax. In the present study, all the foundation and superstructure modesup to 300 Hz have been accounted for. A few modes are displayed in figure 6.5. The lowestmode of the superstructure with a clamped base is at 2.60 Hz, and only 12 modes of thesuperstructure have been found under 20 Hz. These low frequency modes are the globaltorsional and bending modes of the whole building. Above 50 Hz, however, the modal den-sity tends to be very high and the high frequency modal shapes show local bending modes
70
Figure 2.2 (a) Quasi-static transmission of flexible foundation modes on the su-perstructure and (b) Flexible modes of the superstructure with clamped foundation
(Adapted from Fiala et al. (2007)).
12
2.2.2 Characterization of structure-borne source
The transmitted vibration waves from machinery do not only lead to noise pollution,
but may also be hazardous to the building structure. Structural collapses can come without
any early warning sign and are difficult to predict. Recent international cases includes the
Sampoong Super Store collapse in Seoul, Republic of Korea (Gardner et al., 2002) and Rana
Plaza collapse in the Greater Dhaka Area, the capital of Bangladesh (Yardley, 2013). The
most important causes of Sampoong Super Store collapse were the reduced slab depth and
the excessive loads applied to the building due to the change of use of the space. Similiarly,
the main reason of the collapse of Rana Plaza is that the building was poorly constructed. The
building was initially built for commercial use and later additional three floors were added
to the building to house garment factories. Large power generators placed on these upper
floors produced vibration, which aggravated the building structures. Finally, even though
symptoms of structural distress were evident in several locations before the collapse of the
building, the people in positions of knowledge and authority took no action resulting in the
death of hundreds of people.
In order to prevent sudden structural damage, as well as to predict noise transmission,
information of the structure-borne source strength is important. Recent work regarding the
structure-borne noise is mostly concentrated on the characterization of the structure-borne
sound source. The structure-borne sound source is introduced as a ’black box’ and its effect
on the connected structure is represented by its properties at the contact points (Cremer et al.,
2005). The properties can be described in terms of source activity and a mobility matrix of
the connection points (Moorhouse, 2007). The activity can be in the form of the velocity of
the free (uncoupled) source (Cremer et al., 2005; Fulford and Gibbs, 1999) and the blocked
13
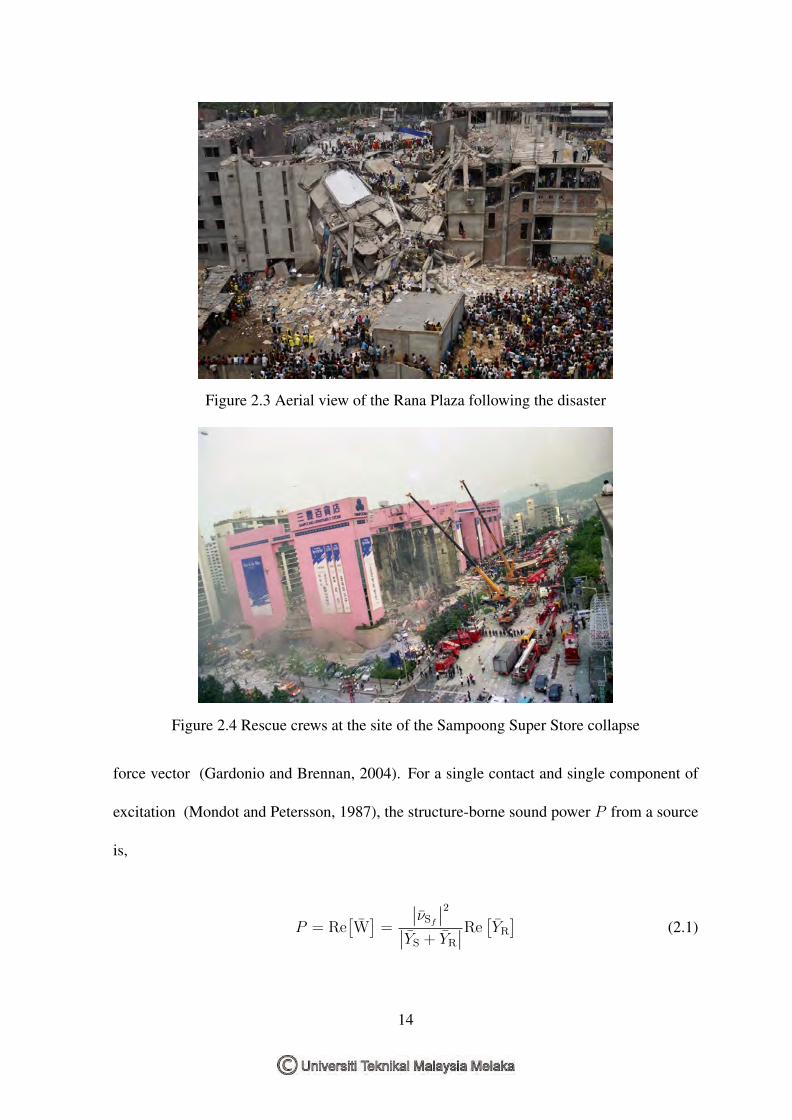
Figure 2.3 Aerial view of the Rana Plaza following the disaster
Figure 2.4 Rescue crews at the site of the Sampoong Super Store collapse
force vector (Gardonio and Brennan, 2004). For a single contact and single component of
excitation (Mondot and Petersson, 1987), the structure-borne sound power P from a source
is,
P = Re[W]
=
∣∣νSf ∣∣2∣∣YS + YR∣∣Re
[YR]
(2.1)
14
where νSf is the root mean square of free velocity of the source, and YS and YR are the com-
plex source and receiver mobility, respectively. Spah and Gibbs (2009) proposed a method
for characterization of structure-borne sources based on the concept of the reception plate
where the total structure-borne sound power from the machine under test is assumed equal
to the power dissipated by a plate attached to the machine. The reception plate method is
proposed as a laboratory test. Alber et al. (2011) also employed the reception plate method
for prediction of structure-borne sound due to vibrations in taps and valves.
Bonhoff and Petersson (2009); Mathiowetz and Bonhoff (2013) focused on develop-
ing mathematical models to determine the power injected by the structure-borne source to
the receiving structure. However, these works only focus on determination of the ’vibration
strength’ of the mechanical sources. There appears to be a lack of studies regarding propaga-
tion of vibration and the noise radiation in the space due to the vibration transmitted into the
building. It is essential to understand how vibration waves travel in the building structure. In
the interest of understanding the behavior of the building, analytical analysis will be the first
step to investigate the phenomena.
2.3 Governing equation
2.3.1 Fundamental of structural waves
Concrete frame structures are one of the most common types of modern buildings.
This type of building consists of a frame or skeleton of concrete. Horizontal members of the
frame are known as beams and vertical members are known as columns. The column is the
primary load-carrying element of the building and humans walk on flat panels of concrete
referred to as slabs (floors). Figure 2.5 shows the elements of a frame structure. The structure
15

Beams
ColumnFloors
Walls
Figure 2.5 Elements in a concrete frame structure(Adapted from www.understandconstruction.com)
is a connected frame of members, each of which are firmly connected to each other (moment
connection) in order to resist the various loads that act on a building (Allen and Iano, 2013).
The concrete frame rests on foundations, which transfer the forces from the building to the
ground.
2.3.2 Longitudinal wave motion in columns
One of the two most important elements in a framework is column. Longitudinal
waves are waves in which the direction of the particle displacement coincides with the di-
rection of wave propagation (Cremer et al., 2005). Pure longitudinal waves can occur only
in solids whose dimensions in all directions are much greater than wavelength. However,
for most cases of practical structures, at least one of the dimensions is small compared with
a wavelength. Hence, the waves that travel along the column cannot be a pure longitudinal
16
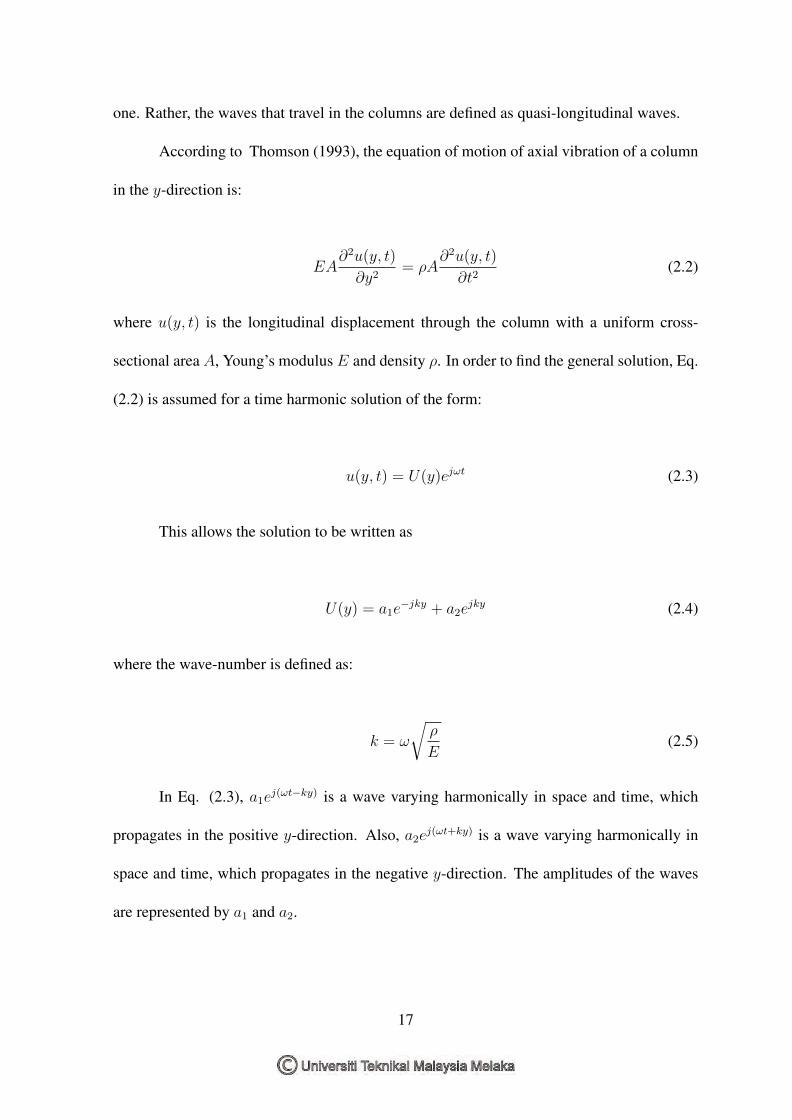
one. Rather, the waves that travel in the columns are defined as quasi-longitudinal waves.
According to Thomson (1993), the equation of motion of axial vibration of a column
in the y-direction is:
EA∂2u(y, t)
∂y2= ρA
∂2u(y, t)
∂t2(2.2)
where u(y, t) is the longitudinal displacement through the column with a uniform cross-
sectional area A, Young’s modulus E and density ρ. In order to find the general solution, Eq.
(2.2) is assumed for a time harmonic solution of the form:
u(y, t) = U(y)ejωt (2.3)
This allows the solution to be written as
U(y) = a1e−jky + a2e
jky (2.4)
where the wave-number is defined as:
k = ω
√ρ
E(2.5)
In Eq. (2.3), a1ej(ωt−ky) is a wave varying harmonically in space and time, which
propagates in the positive y-direction. Also, a2ej(ωt+ky) is a wave varying harmonically in
space and time, which propagates in the negative y-direction. The amplitudes of the waves
are represented by a1 and a2.
17

Figure 2.6 illustrates the direction of the displacement and forces. The displacements
at the boundaries of the element are expressed as:
u1u2
=
1 1
e−jkLy ejkLy
a1a2
(2.6)
where Ly is the length of the column in the direction of y. Also, if the element is subjected
to axial loads F1 and F2, the applied forces are expressed in terms of displacement by:
F (y) = EA∂u
∂y(2.7)
then the vector of forces is expressed as:
F1
F2
= EA
jk −jk
−jke−jkLy jkejkLy
a1a2
(2.8)
and the dynamic stiffness is defined by:
Ku = F (2.9)
From Eq. (2.6) and (2.8), the dynamic stiffness matrix is equal to:
K = EA
jk −jk
−jke−jkLy jkejkLy
1 1
e−jkLy ejkLy
−1
(2.10)
18
2F
1F
x
y
1u0=y
Ly =
2u
Figure 2.6 Longitudinal waves travel in column element
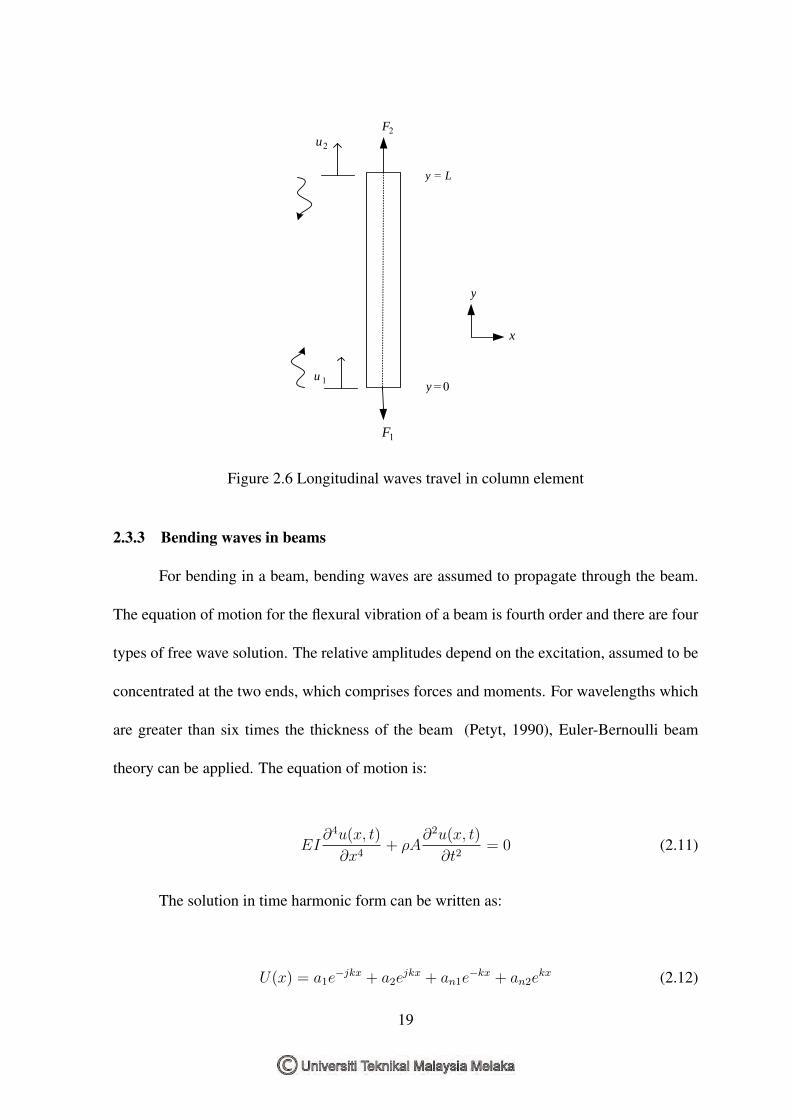
2.3.3 Bending waves in beams
For bending in a beam, bending waves are assumed to propagate through the beam.
The equation of motion for the flexural vibration of a beam is fourth order and there are four
types of free wave solution. The relative amplitudes depend on the excitation, assumed to be
concentrated at the two ends, which comprises forces and moments. For wavelengths which
are greater than six times the thickness of the beam (Petyt, 1990), Euler-Bernoulli beam
theory can be applied. The equation of motion is:
EI∂4u(x, t)
∂x4+ ρA
∂2u(x, t)
∂t2= 0 (2.11)
The solution in time harmonic form can be written as:
U(x) = a1e−jkx + a2e
jkx + an1e−kx + an2e
kx (2.12)
19

where the wave-number is defined as:
k =√ω
(ρA
EI
) 14
(2.13)
As can be seen in Eq. (2.12), a1 and a2 are the amplitudes of waves propagating in
the positive and negative x-direction, where an1 and an2 are the wave amplitudes of the near-
field in the region x>0. The direction of the displacements, forces and waves can be seen in
Figure 2.7.
1F 2F2u1u
0=x Lx =
x
y
Figure 2.7 Bending waves propagating in beam element
A beam element requires two degrees of freedom at each end, translational displace-
ment and rotational displacement. The latter is defined as:
θ(x, t) =∂u(x, t)
∂x(2.14)
20
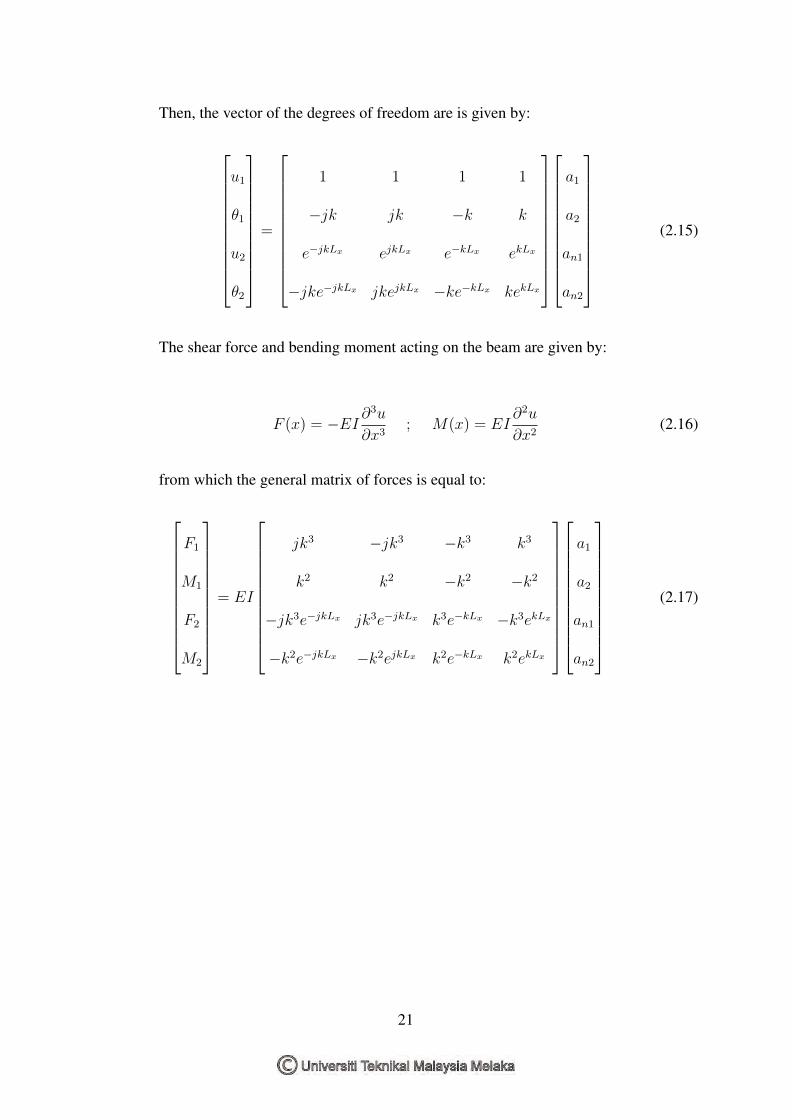
Then, the vector of the degrees of freedom are is given by:
u1
θ1
u2
θ2
=
1 1 1 1
−jk jk −k k
e−jkLx ejkLx e−kLx ekLx
−jke−jkLx jkejkLx −ke−kLx kekLx
a1
a2
an1
an2
(2.15)
The shear force and bending moment acting on the beam are given by:
F (x) = −EI ∂3u
∂x3; M(x) = EI
∂2u
∂x2(2.16)
from which the general matrix of forces is equal to:
F1
M1
F2
M2
= EI
jk3 −jk3 −k3 k3
k2 k2 −k2 −k2
−jk3e−jkLx jk3e−jkLx k3e−kLx −k3ekLx
−k2e−jkLx −k2ejkLx k2e−kLx k2ekLx
a1
a2
an1
an2
(2.17)
21

Hence, the dynamic stiffness matrix of a beam is the solution of:
K = EI
jk3 −jk3 −k3 k3
k2 k2 −k2 −k2
−jk3e−jkLx jk3e−jkLx k3e−kLx −k3ekLx
−k2e−jkLx −k2ejkLx k2e−kLx k2ekLx
×
1 1 1 1
−jk jk −k k
e−jkLx ejkLx e−kLx ekLx
−jke−jkLx jkejkLx −ke−kLx kekLx
−1 (2.18)
where I is the second moment of cross sectional area and Lx is the length of the beam in
the direction of x. Many publication results include the calculation of dynamic stiffness
matrix for the Euler-Bernoulli beam element. Such calculations are provided by Bishop and
Johnson (2011), Gorzynski and Thornton (1974) and Warburton (1976) who surveyed the
exact FE method. Unlike Timoshenko beam theory, Euler-Bernoulli beam theory does not
taken into account the effects of transverse shear strain. It is suitable where beam thickness
is less than 1/6 of the wavelength. For these reasons, Euler-Bernoulli beam theory is applied
in this study.
2.3.4 Input power of multiple contact points
Prediction and measurement on the structure-borne sound source has been studied
from past researches especially lightweight building elements (Gibbs, 2013) where a plate is
used as the receiver. It is a straight-forward prediction which concentrates on the calculation
22

for receiver structure. The structure-borne sound source can be modeled into a single and
multiple contact point force. Mobility is defined as the ratio of the resulting velocity ν to the
driving force F at a given point (Gardonio and Brennan, 2004)
Y =ν
F(2.19)
and the impedance is the reciprocal of mobility i.e. the ratio of the force F acting on the
system to the resulting velocity ν given as
Z =F
ν(2.20)
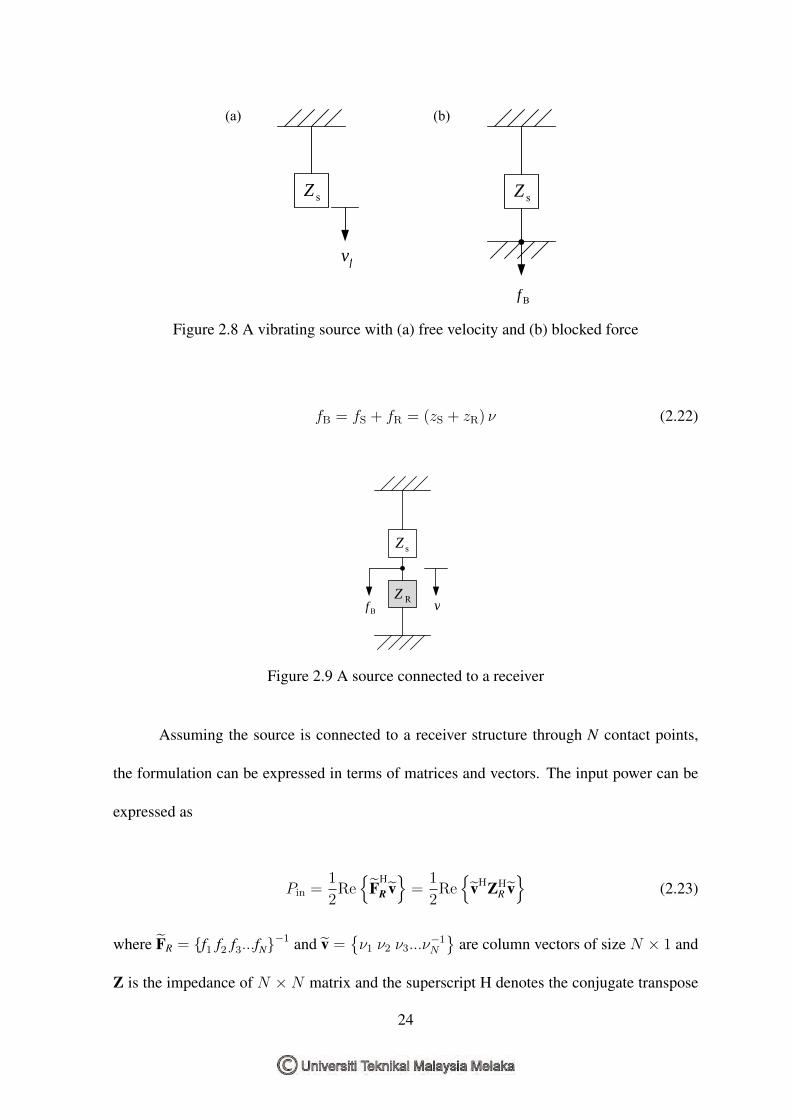
Considering a vibrating source has impedance zS which is free suspended and vibrates
with velocity νf . The velocity of the source in this case is known as ’free velocity’. Assuming
the source is attached on a rigid surface as seen in Figure 2.8, the source is restrained to move
at the contact point and it is now injecting force onto the surface. The force in this case is
now called as ’blocked force’ which is also defined as
fB = zS.νf (2.21)
Considering the source is rigidly connected to a receiver structure as shown in Figure
2.9, where both the source and structure are assumed moving at the same velocity ν. The
blocked force at the contact point is now the sum of the forces from the source fS and the
force which is applied on the receiver fR (Brennan and Ferguson, 2004). The blocked force
can thus be expressed as
23
sZ
fv
sZ
Bf
(a) (b)
Figure 2.8 A vibrating source with (a) free velocity and (b) blocked force
fB = fS + fR = (zS + zR) ν (2.22)
sZ
vRZ
Bf
Figure 2.9 A source connected to a receiver
Assuming the source is connected to a receiver structure through N contact points,
the formulation can be expressed in terms of matrices and vectors. The input power can be
expressed as
Pin =1
2Re{
FH
R v}
=1
2Re{
vHZHR v}
(2.23)
where FR = {f1 f2 f3...fN}−1 and v ={ν1 ν2 ν3...ν
−1N
}are column vectors of size N × 1 and
Z is the impedance of N ×N matrix and the superscript H denotes the conjugate transpose
24
while the curly sign indicates the vector.
Using Eq. (2.22) and substituting it into Eq. (2.23), this gives
Pin =1
2Re{
vHf |YS + YR|−H YR|YS + YR|−1vf}
(2.24)
The input power is defined in decibels as sound power level. The scale and the reference
value used in this work are listed below:
Lw = 10log10
(W
Wref
),Wref = 1× 10⁻¹²W (2.25)
2.3.5 Statistical Energy Analysis
Statistical Energy Analysis (SEA) has been widely used to calculate the energy flow
between the connected resonant systems. It is used to predict the average values over a
frequency band of interest. The local models of subsystems are described statistically and
the average response of the subsystems is predicted. It has an advantage where it is suitable
for modeling vibro-acoustic systems when detailed information about the system properties
are not available.
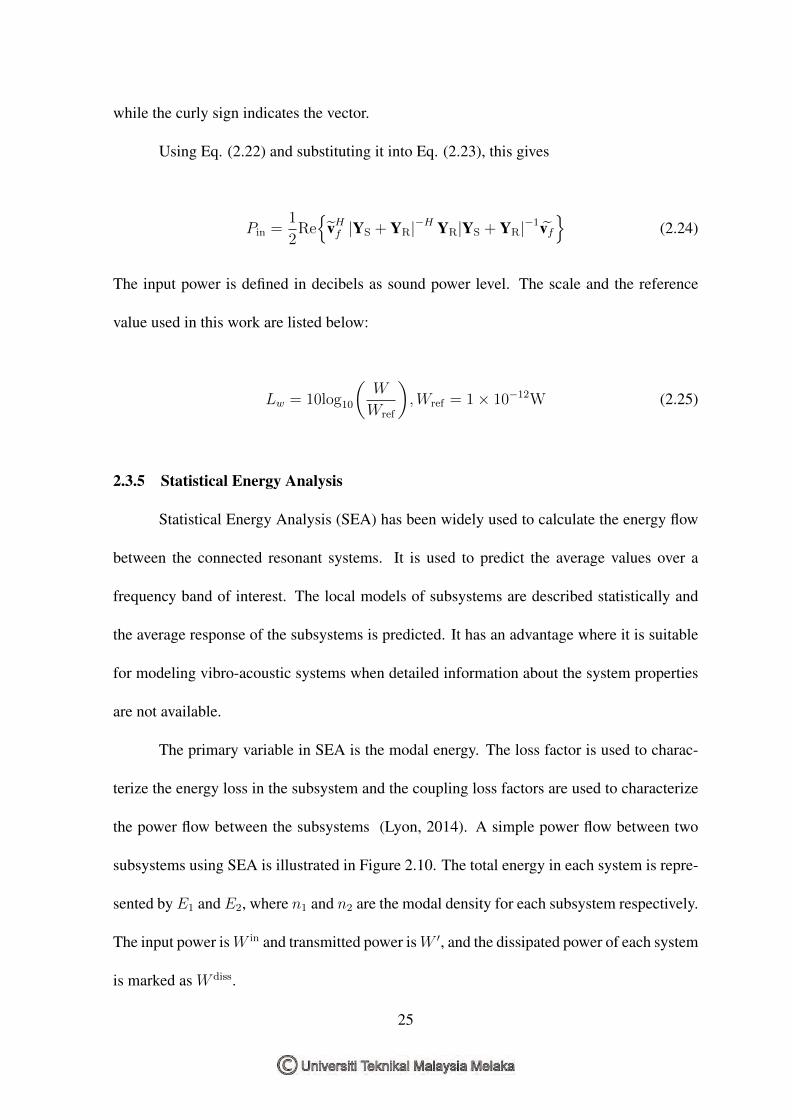
The primary variable in SEA is the modal energy. The loss factor is used to charac-
terize the energy loss in the subsystem and the coupling loss factors are used to characterize
the power flow between the subsystems (Lyon, 2014). A simple power flow between two
subsystems using SEA is illustrated in Figure 2.10. The total energy in each system is repre-
sented by E1 and E2, where n1 and n2 are the modal density for each subsystem respectively.
The input power isW in and transmitted power isW ′, and the dissipated power of each system
is marked as W diss.
25